solvency and financial condition report - hannover re · connection with the world trade center...
TRANSCRIPT
Hannover Rück SE
2018
Solvency and Financial Condition Report

1 Hannover Rück | Solvency and Financial Condition Report
Contents
Executive Summary ........................................................................................................................ 5
A. Business and Performance .................................................................................................... 12
A.1 Business ......................................................................................................................... 12
A.1.1 Business model ........................................................................................................ 12
A.1.2 Income and key transactions .................................................................................... 13
A.1.3 Headquarters, supervisors and auditors ................................................................... 13
A.1.4 Group structure ........................................................................................................ 15
A.1.5 Material related undertakings ................................................................................... 16
A.2 Underwriting Performance ............................................................................................... 17
A.3 Investment Performance ................................................................................................. 21
A.4 Performance of other activities ........................................................................................ 24
A.4.1 Other income and expenses..................................................................................... 24
A.4.2 Significant leasing agreements ................................................................................. 25
A.5 Any other information ...................................................................................................... 25
B. System of Governance ........................................................................................................... 26
B.1 General information on the System of Governance ......................................................... 26
B.1.1 Governance structure ............................................................................................... 26
B.1.2 Remuneration policy ................................................................................................ 30
B.1.3 Related party transactions ........................................................................................ 31
B.2 Fit and proper requirements ............................................................................................ 31
B.2.1 Requirements ........................................................................................................... 31
B.2.2 Description of requirements...................................................................................... 32
B.2.3 Evaluation process ................................................................................................... 33
B.3 Risk Management System including the Own Risk and Solvency Assessment ............... 34
B.3.1 Risk management system including risk management function ................................ 34
B.3.2 Own Risk and Solvency Assessment (ORSA) .......................................................... 39
B.4 Internal Control System ................................................................................................... 40
B.4.1 Elements of the internal control system .................................................................... 40
B.4.2 Compliance function ................................................................................................. 40
B.5 Internal Audit Function .................................................................................................... 42
B.6 Actuarial Function ........................................................................................................... 43
B.7 Outsourcing ..................................................................................................................... 45

2 Hannover Rück | Solvency and Financial Condition Report
B.8 Any other information ...................................................................................................... 45
B.8.1 Evaluating the appropriateness of the system of governance ................................... 45
B.8.2 Other information ..................................................................................................... 45
C. Risk Profile ......................................................................................................................... 46
C.1 Underwriting risk ............................................................................................................. 46
C.1.1 Underwriting risk Property and Casualty................................................................... 46
C.1.2 Reserve risk ............................................................................................................. 49
C.1.3 Risk mitigation techniques Property & Casualty ....................................................... 49
C.1.4 Underwriting risk Life and Health .............................................................................. 51
C.2 Market risk ...................................................................................................................... 53
C.3 Credit risk ........................................................................................................................ 57
C.4 Liquidity risk .................................................................................................................... 58
C.5 Operational risk ............................................................................................................... 58
C.6 Other material risks ......................................................................................................... 60
C.6.1 Emerging risks ......................................................................................................... 60
C.6.2 Strategic risks .......................................................................................................... 61
C.6.3 Reputational risks ..................................................................................................... 62
C.6.4 Contagion risks ........................................................................................................ 62
C.7 Any other information ...................................................................................................... 62
D. Valuation for Solvency Purposes ........................................................................................ 63
D.1 Assets ............................................................................................................................. 67
D.1.1 Intangible assets R0030 ........................................................................................... 67
D.1.2 Deferred tax assets R0040 ....................................................................................... 67
D.1.3 Property, plant & equipment held for own use R0060 ............................................... 68
D.1.4 Property (other than for own use) R0080.................................................................. 69
D.1.5 Participations and related undertakings R0090 ........................................................ 69
D.1.6 Equities R0100 ......................................................................................................... 70
D.1.7 Bonds R0130 ........................................................................................................... 71
D.1.8 Collective Investments Undertakings R0180 ............................................................ 75
D.1.9 Derivatives R0190 .................................................................................................... 76
D.1.10 Deposits other than cash equivalents R0200 ........................................................... 77
D.1.11 Other investments R0210 ......................................................................................... 78
D.1.12 Loans and mortgages R0230 ................................................................................... 78
D.1.13 Reinsurance recoverables R0270 ............................................................................ 79

3 Hannover Rück | Solvency and Financial Condition Report
D.1.14 Deposits to cedants R0350 ...................................................................................... 80
D.1.15 Insurance and intermediaries receivables R0360 ..................................................... 81
D.1.16 Reinsurance receivables R0370 ............................................................................... 82
D.1.17 Receivables (trade, not insurance) R0380 ................................................................ 82
D.1.18 Cash and cash equivalents R0410 ........................................................................... 83
D.1.19 Any other assets, not elsewhere shown R0420 ........................................................ 83
D.2 Technical Provisions ....................................................................................................... 84
D.2.1 Technical Provisions Property & Casualty ................................................................ 86
D.2.2 Technical Provisions Life & Health ........................................................................... 90
D.3 Other Liabilities ............................................................................................................... 95
D.3.1 Contingent liabilities R0740 ...................................................................................... 95
D.3.2 Provisions other than technical provisions R0750 .................................................... 96
D.3.3 Pension benefit obligations R0760 ........................................................................... 96
D.3.4 Deposits from reinsurers R0770 ............................................................................... 97
D.3.5 Deferred tax liabilities R0780 .................................................................................... 98
D.3.6 Derivatives R0790 .................................................................................................... 99
D.3.7 Financial liabilities other than debts owed to credit institutions R0810 ...................... 99
D.3.8 Insurance & intermediaries payable R0820 ............................................................ 100
D.3.9 Reinsurance payables R0830 ................................................................................ 101
D.3.10 Payables (trade, not insurance) R0840 .................................................................. 101
D.3.11 Subordinated liabilities R0850 ................................................................................ 102
D.3.12 Any other liabilities, not elsewhere shown R0880 ................................................... 102
D.4 Alternative methods for valuation .................................................................................. 103
D.4.1 Gross Rental Method ............................................................................................. 103
D.4.2 Projected Unit Credit Method ................................................................................. 103
D.4.3 Market value determination for assets which are not listed on a stock exchange ... 104
D.5 Any other information .................................................................................................... 105
E. Capital Management ............................................................................................................ 107
E.1 Own Funds .................................................................................................................... 107
E.1.1 Management of own funds ..................................................................................... 107
E.1.2 Tiering .................................................................................................................... 107
E.1.3 Basic own funds ..................................................................................................... 107
E.1.4 Transferability ........................................................................................................ 110
E.2 Solvency Capital Requirement and Minimum Capital Requirement ............................... 110
4 Hannover Rück | Solvency and Financial Condition Report
E.2.1 Solvency Capital Requirement per Risk Category .................................................. 110
E.2.2 Minimum Capital Requirement ............................................................................... 112
E.3 Use of the duration-based equity risk sub-module in the calculation of the Solvency Capital
Requirement ............................................................................................................................ 112
E.4 Differences between the standard formula and any internal model used ....................... 113
E.4.1 The internal model ................................................................................................. 113
E.4.2 Calculation techniques for the purposes of integrating results into the standard
formula… ............................................................................................................................. 115
E.4.3 Comparison between the internal model and the standard formula ........................ 116
E.5 Non-compliance with the Minimum Capital Requirement and non-compliance with the
Solvency Capital Requirement ................................................................................................. 117
E.6 Any other information .................................................................................................... 117
Abbreviations and glossary ......................................................................................................... 118
Quantitative Reporting Templates ............................................................................................... 120
5 Hannover Rück | Solvency and Financial Condition Report
Executive Summary
Key figures
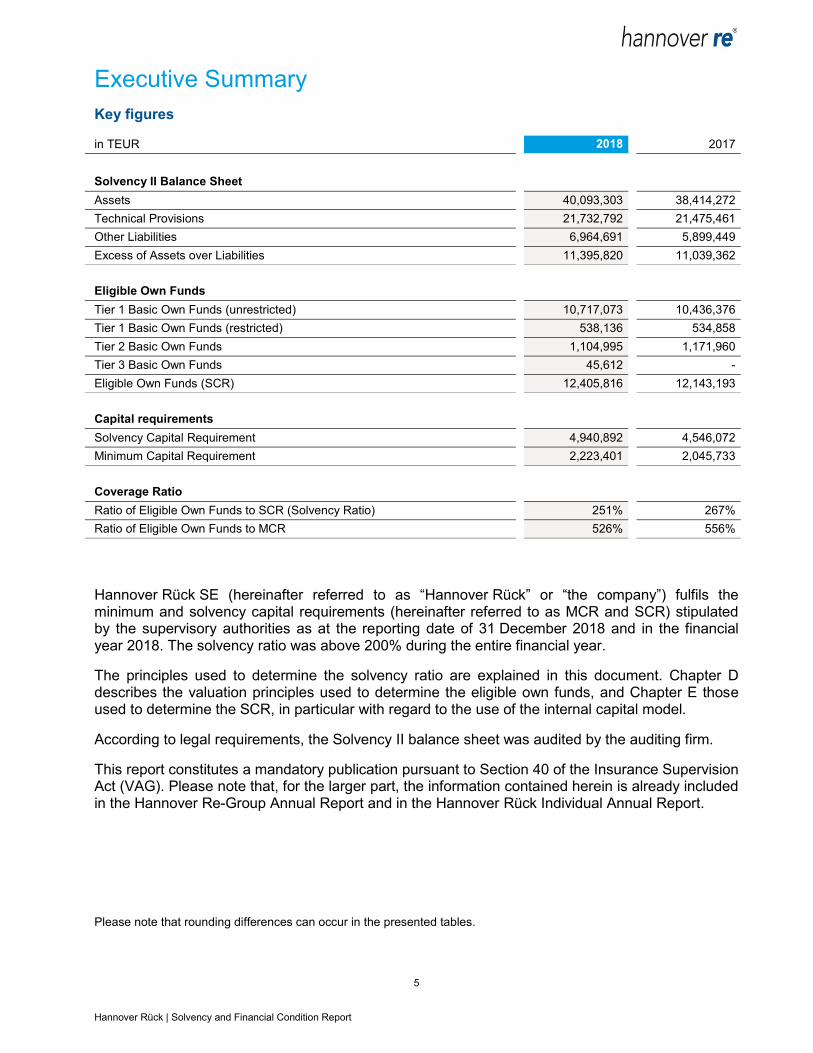
in TEUR 2018 2017
Solvency II Balance Sheet
Assets 40,093,303 38,414,272
Technical Provisions 21,732,792 21,475,461
Other Liabilities 6,964,691 5,899,449
Excess of Assets over Liabilities 11,395,820 11,039,362
Eligible Own Funds
Tier 1 Basic Own Funds (unrestricted) 10,717,073 10,436,376
Tier 1 Basic Own Funds (restricted) 538,136 534,858
Tier 2 Basic Own Funds 1,104,995 1,171,960
Tier 3 Basic Own Funds 45,612 -
Eligible Own Funds (SCR) 12,405,816 12,143,193
Capital requirements
Solvency Capital Requirement 4,940,892 4,546,072
Minimum Capital Requirement 2,223,401 2,045,733
Coverage Ratio
Ratio of Eligible Own Funds to SCR (Solvency Ratio) 251% 267%
Ratio of Eligible Own Funds to MCR 526% 556%
Hannover Rück SE (hereinafter referred to as “Hannover Rück” or “the company”) fulfils the minimum and solvency capital requirements (hereinafter referred to as MCR and SCR) stipulated by the supervisory authorities as at the reporting date of 31 December 2018 and in the financial year 2018. The solvency ratio was above 200% during the entire financial year.
The principles used to determine the solvency ratio are explained in this document. Chapter D describes the valuation principles used to determine the eligible own funds, and Chapter E those used to determine the SCR, in particular with regard to the use of the internal capital model.
According to legal requirements, the Solvency II balance sheet was audited by the auditing firm.
This report constitutes a mandatory publication pursuant to Section 40 of the Insurance Supervision Act (VAG). Please note that, for the larger part, the information contained herein is already included in the Hannover Re-Group Annual Report and in the Hannover Rück Individual Annual Report.
Please note that rounding differences can occur in the presented tables.
6 Hannover Rück | Solvency and Financial Condition Report
A. Business and Performance
Hannover Rück transacts all lines of Property & Casualty and Life & Health reinsurance. Its global presence and activities across all lines of reinsurance business allows the company to achieve an efficient risk diversification. Since 1 January 1997 Hannover Rück SE has written active reinsurance for the Group – with few exceptions – solely in foreign markets. Responsibility within the Hannover Re Group for German business rests with the subsidiary E+S Rückversicherung AG. (hereinafter “E+S Rück”).
The 2018 financial year passed off satisfactorily for Hannover Rück. The gross premium in total business grew by TEUR 1,347,864 to TEUR 14,640,753. The level of retained premium decreased from 78.4% to 71.8%. Net premium earned increased, climbing by 2% to TEUR 10,412,941 (2017: TEUR 10,208,864).
The technical income of TEUR 10,616,717 (TEUR 10,394,706) was offset by technical expenses of TEUR 10,616,913 (TEUR 10,407,363). The underwriting result (HGB, before changes in the equalisation reserve) improved in the reporting period from TEUR -12,657 to TEUR -196.
The profit on ordinary activities decreased to TEUR 869,708 (TEUR 967,999). The year under review closed with a profit for the year of TEUR 665,355 (TEUR 843,400).
Measured in terms of the total technical result in the 2018 financial year, the most significant lines are life reinsurance (TEUR 246,635), marine, aviation and transport insurance (TEUR 95,069), motor vehicle liability insurance (TEUR -74,114), other motor insurance (TEUR -78.096) as well as general liability insurance at TEUR -217,102.
General liability insurance witnessed a decline in net premium earned which is caused by reduced net premiums in Advanced Solutions business as well as lower premium income from US casualty business. The considerable rise in claims incurred is due to the establishment of sharply higher reserves. While in the marine, aviation and transport insurance claims incurred in the aviation sector had developed very favourably in 2017, especially due to the release of reserves set aside in connection with the World Trade Center loss event, the necessary allocations to the reserves to be constituted in 2018 were lower. These effects led to an increase in claims incurred compared to the previous year and therefore to a declining result. Motor vehicle liability insurance registered growth as a result of new Advanced Solution contracts again. The decrease in claims incurred relates principally to a one-off effect in 2017, namely the lowering of the discount rate for compensation payments resulting from personal injury claims in the United Kingdom ("Ogden rate"). The other motor insurance line is also notable for new treaties in the area of Advanced Solutions. Increased reserves are largely the reason for the negative technical result.
Principally, we are satisfied with the development of our Health reinsurance line.
The technical income for the Life reinsurance line has grown significantly compared to the previous period. The main driver for this significant increase were the US tax reform in 2018, where we had to restructure a substantial part of our US business within the Group. For Hannover Rück this restructuring had a one-off, clearly positive effect on earnings in the year under review and therefore a very positive impact on the result.
We are widely satisfied with our capital investments during the period under review. Although it has been another challenging year with continuously low interest rate levels and a global economic situation which is more and more affected by numerous uncertainties and risks, we managed to excel in achieving our goals. This is especially remarkable given the rather noticeable changes in our asset allocation in course of financing measures in our Life reinsurance, US tax reform,
7 Hannover Rück | Solvency and Financial Condition Report
issuance of a Senior bond as well as our change in investment strategy. Most crucial factor was the very pleasing income from our fixed income portfolio while real estate and private equity investments performed very well too. Thus, we could very well compensate for the lapse of dividend income due to last year’s liquidation of our portfolio containing non-strategic stock-market-listed equities and equity funds. Hence, also the decline of our net investment income is predominantly a result of last year’s extraordinarily high result from realisations.
We adjusted the allocation of our investments to the individual classes of securities in the reporting period in that we expanded our portfolio of instruments with inflation-linked coupons and redemption amounts. By taking this step we are counteracting inflation risks, particularly in property and casualty business. Through reduction of certain positions in the area of high-yield bonds we also smoothed the risk profile of our investments and generated liquidity for future opportunities in the capital and reinsurance markets. Furthermore, we raised the quality level of our portfolio of collateralised securities. We slightly increased our level of property holdings in the course of the strategic development of this investment category. In the US market we took advantage of market opportunities to sell one of our real estate objects. All other investment categories saw only limited adjustments as part of a regular portfolio maintenance programme.
Overall, our capital investment portfolio significantly increased during the year under review. Besides the positive operating cash flow, this also reflects that the issuance of a Senior bond in the second quarter and currency effects could overcompensate for valuation effects on our fixed income portfolio due to rise in interest rates und spreads.
Details on the Business and Performance and be found in section A.
B. System of Governance
Hannover Rück has an effective system of governance, which provides for sound and prudent management. Written guidelines are in place for all significant business events. The key functions pursuant to Section 26 and Sections 29-31 of the Insurance Supervision Act (VAG) have been set up, entrusted with the tasks described and equipped with appropriate resources.
In the reporting year, a clear focus of the work of the compliance function was the implementation of sanction audit processes and the new regulation on data protection due to the General Data Protection Regulation that became effective in May 2018. In addition, new processes have been implemented to fulfill the requirements of the Insurance Distribution Directive, IDD.
The Executive Board has established a committee which supports the assessment of the system of governance. Based on the assessment conducted by the committee, the Executive Board has reached the conclusion that the system of governance of Hannover Rück is appropriate considering the scope and complexity of its business activities and the inherent risks.
Hannover Rück has established an outsourcing management process that covers all process steps of an outsourcing and involves all relevant stakeholder groups. Currently, there is only one important outsourcing to Ampega Asset Management GmbH (name change in January 2019, before: Talanx Asset Management GmbH), covering the asset and investment management.
The individual elements of the system of governance of Hannover Rück are explained in section B.

8 Hannover Rück | Solvency and Financial Condition Report
C. Risk Profil
In the context of its business operations Hannover Rück enters into a broad variety of risks. These risks are deliberately accepted, steered and monitored. They specifically concern underwriting risks pertaining to Property & Casualty and Life & Health, as well as capital market risks, liquidity risks and counterparty default risks. Operational, strategic and reputational risks also arise in the course of business operations. We describe the sources of these risks and how we deal with them in Section C. We also explain how we handle potential future risks (emerging risks).
Risk landscape of Hannover Rück
Hannover Rück received approval from the regulatory authorities to calculate its solvency requirements using an internal capital model. Hannover Rück was also granted approval by the BaFin in 2018 to use static volatility adjustments to value its liabilities starting due date 31 December 2018.
The solvency capital requirements (SCR) as of 31 December 2018 are shown in the following table. The SCR as per 31 December 2018 include the impact from the static volatility adjustments. The impact is low and displayed separately in section D.2.

9 Hannover Rück | Solvency and Financial Condition Report
Solvency Capital Requirement (SCR) – Risk categories
in TEUR
Solvency Capital Requirement 2018 2017
Underwriting risk - Property & Casualty 3,633,720 3,287,834
Underwriting risk - Life & Health 2,206,374 2,351,852
Market risk 3,649,419 3,276,803
Counterparty default risk 308,132 280,534
Operational risk 562,623 621,177
Diversification −3,530,805 −3,550,660
Total risk (pre-tax) 6,829,463 6,267,540
Deferred tax 1,888,571 1,721,468
Total risk (post-tax) 4,940,892 4,546,072
The required capital is calculated based on the approved internal model. At the present time our most significant risks are the default and spread risks within the market risks, the reserving and catastrophe risks within the underwriting risks of property and casualty reinsurance and the risk of changes in mortality within the underwriting risks of life and health reinsurance. With regard to mortality risks, as a general principle annuity portfolios are adversely impacted by improvements in mortality while death benefit portfolios are adversely affected by deteriorations in mortality.
Overall, the required capital increased in the course of the year. This was mainly driven by the larger business volumes, which led to an increase in market risks and underwriting risks in property and casualty reinsurance. In addition, the weakening of the euro against the US dollar contributed to a rise in foreign-currency volumes and an increase in risks in euro.
Along with the larger volumes, elevated default and spread risks – as are also evident in the generally higher credit spread levels – are a major reason for the increase in market risks. The underwriting risks in property and casualty reinsurance increased primarily as a consequence of higher underwriting capacities for natural perils and model adjustments made to specific large loss models. The underwriting risks in life and health reinsurance decreased due to a reduced exposure to longevity and mortality risks. This contrasts with a higher exposure to morbidity risks resulting from expansion of the business. The increase in counterparty default risks can mainly be attribute to a higher volume of receivables due from ceding companies and retrocessionaires as well as elevated volatility of the modelled losses along with generally increased credit spreads. The decrease in operational risks can be attributed above all to an updated expert assessment regarding the impact of individual scenarios, partially offset by a larger business volume.
Hannover Re Group is prepared for United Kingdom’s withdrawal from the EU. A working group has been set up to address readiness measures. In order to continue the activities of the materially affected Hannover Re Life UK Branch, an application under the so-called temporary permissions regime (TPR) has been filed and already approved by the financial regulator. Argenta Holdings Limited is a wholly owned subsidiary of Hannover Re that operates on a stand-alone basis in the UK and is already authorized as a member of Lloyd’s. For our reinsurance business in the UK which we write through companies in Hannover, Ireland and Bermuda we do not anticipate any significant changes as a result of Brexit.
In order to avert the increased burden of taxation due to changes in tax legislation adopted by the US administration we have already undertaken some restructuring activities within the Group. US life reinsurance business previously written through Hannover Re Ireland was transferred to a Bermuda-based subsidiary. The latter is subject to US taxation, thereby avoiding a substantial tax loss.

10 Hannover Rück | Solvency and Financial Condition Report
The main monitoring and control mechanisms are presented in section C.
D. Valuation for Solvency Purposes
For the purposes of calculating the eligible own funds, Hannover Rück values the assets and liabilities pursuant to the provisions of Sections 74 et seq. of the Insurance Supervision Act (VAG), i.e. in accordance with Solvency II.
Hannover Rück was granted approval by the BaFin in 2018 to use volatility adjustments to value the Best Estimate Liability (BEL) beginning with 31 December 2018.
The valuation for Solvency purposes is set in principle at the fair value (market value). Insofar as IFRS values appropriately reflect the fair value of individual assets or liabilities, they are applied.
Chapter D.2 sets out the valuation approaches for calculating the Technical Provisions. Technical provisions pursuant to Solvency II differentiate significantly from the definition of provisions pursuant to the German Commercial Code (HGB), both in terms of structure and in relation to the calculation rules. A comparison of German Commercial Code (HGB) and Solvency II Technical Provisions is shown as well as a comparison of current Technical Provisions under Solvency II and those calculated last year.
The application of the volatility adjustment to affiliated insurance and reinsurance companies results in higher market values of the shares held. Furthermore, as part of the capital investment strategy, vehicles investing in infrastructure were financially strengthened.
Section D explains the details of the valuation for solvency purposes.
E. Capital Management
Hannover Rück endeavours at all times to maintain a Solvency Ratio of at least 180%, and thus exceeds the requirements of 100% stipulated by the supervisory authority. In addition, a threshold value of 200% has been defined. If the Solvency Ratio falls below this threshold value Hannover Rück will adopt capital measures aimed at either strengthening the company's equity or reducing the risk capital, or both.
The Solvency Ratio is continuously monitored. Any changes are taken into account as part of planning, and potential changes in the Solvency Ratio, which can be caused by larger transactions, are examined in advance. During the financial year 2018, there was no breach of the threshold value of 200%. Further information on the calculation of the Solvency Ratio can be found in Section E.
Own funds in the Solvency II balance sheet consist of basic own funds, which comprise the excess of assets over liabilities and subordinated loans. Ancillary own funds were not in use by Hannover Rück as at 31 December 2018.
The available economic capital increased by TEUR 262,622 to TEUR 12,405,816 as at 31 December 2018. The increase is driven almost entirely by the development of the equalisation reserve, which results from the surplus of assets over liabilities less hybrid capital and the foreseeable dividend. The increase in own funds was therefore almost exclusively in the Tier 1 category. In total, 90 per cent of all available capital is assigned to the highest quality level (tier 1).
11 Hannover Rück | Solvency and Financial Condition Report
Hannover Rück uses an approved full internal model for the purposes of calculating the Solvency Capital Requirement (SCR). The individual risk categories are aligned with the risk modules of the standard formula. The internal model is applied in a broad range of management and decision-making processes. The future development of Solvency- and Minimum Capital Requirements are forecast at regular intervals as part of the planning process.
Section E explains the details of capital management.
12 Hannover Rück | Solvency and Financial Condition Report
A. Business and Performance
A.1 Business
A.1.1 Business model
With a gross premium volume of more than TEUR 19,176,358, the Hannover Re Group is the fourth-largest reinsurer in the world. Hannover Rück SE is a European Company, Societas Europaea (SE), based in Hannover, Germany. We transact reinsurance in our Property & Casualty and Life & Health business groups.
The strategy pursued in both property & casualty and life & health reinsurance supports our Group’s paramount mission, namely creating value through reinsurance. Our entire business operations are geared to our goal of being the best option for our business partners when they come to choose their reinsurance provider. It is for this reason that our clients and their concerns form the focus of our activities.
We generate competitive advantages to the benefit of our clients and shareholders by conducting our reinsurance business with lower administrative expenses than our rivals. In this way we deliver above-average profitability while at the same time being able to offer our customers reinsurance protection on competitive terms.
We also strive for the broadest possible diversification and hence an efficient risk balance. This is achieved by accepting reinsurance risks with mostly little or no correlation in our Property & Casualty and Life & Health business groups across all lines of business as well as by maintaining a global presence. In conjunction with our capital management, this is the key to our comparatively low cost of capital.
Guided by a clearly defined risk appetite, our risk management steers the company so as to be able to act on business opportunities while securing our financial strength on a lasting basis.
Our subsidiary E+S Rückversicherung AG (E+S Rück), as the “dedicated reinsurer for the German market”, offers a range of products and services tailored to the specific features of the German market. Of special importance here are the mutual insurers with whom we maintain a strategic partnership that is underscored through their participation in E+S Rück.
In the Property & Casualty reinsurance business group we consider ourselves to be a reliable, flexible and innovative market player that ranks among the best in any given market. Cost leadership, effective cycle management and superior risk management are the key elements of our competitive positioning.
In the Life & Health reinsurance business group we are recognized – as customer surveys confirm – as one of the top players and a leading provider of innovative solutions. We achieve this standing by opening up new markets for our company and by identifying trends in order to anticipate the future needs of our customers.
Through its global presence and activities Hannover Rück is directly or via affiliates affected by various foreign fiscal developments.
13 Hannover Rück | Solvency and Financial Condition Report
A.1.2 Income and key transactions
In this and the following sections of Chapter A, the values indicated were determined in accordance with the German Commercial Code (HGB), as required by Art. 293 (2) DVO. Please note that the accounting rules under HGB differ significantly from those under Solvency II.
The 2018 financial year was a pleasing one for Hannover Rück. The gross premium of Hannover Rück in total business grew by 10.1% to TEUR 14,640,753. The level of retained premium retreated from 78.4% to 71.8%. Net premium earned increased by 2.0% to TEUR 10,412,941.
The underwriting result (before changes in the equalization reserve) improved in the year under review from TEUR -12,658 to TEUR -196. Following a withdrawal of TEUR 165,944 in the previous year, an amount of TEUR 25,270 was withdrawn from the equalisation reserve and similar provisions in the year under review.
After a thoroughly moderate major loss experience in the first half of 2018, the volume of losses incurred in the third and especially the fourth quarter was significantly higher. The burden of large losses consequently came in slightly above the large loss budget that we had set aside. The total net expenditure on major losses incurred by Hannover Rück was TEUR 536,628.
Ordinary investment income including deposit interest was clearly higher than in the previous year at TEUR 1,234,058, principally due to increased distributions from our investment holding companies as well as stronger ordinary income from fixed-income securities. Despite the continued low level of interest rates, the latter showed a pleasing rise to TEUR 458,586 based on the substantial asset volume. Net gains of TEUR 140,887 were realised on disposals. The sharp decline can be attributed for the most part to the liquidation of our portfolio of non-strategic listed equities in the previous year. Write-downs of TEUR 88.363 were taken on investments, primarily on bearer debt securities held as current assets. The write-downs contrasted with write-ups of TEUR 1,208 that were made on assets written down in previous periods in order to reflect increased fair values.
All in all, the net investment result climbed to TEUR 1,231,680. The balance of other income and charges changed from TEUR -196,261 million to TEUR -182,581.
The profit on ordinary activities decreased to TEUR 869,708. The year under review closed with a profit for the year of TEUR 665.355.
A.1.3 Headquarters, supervisors and auditors
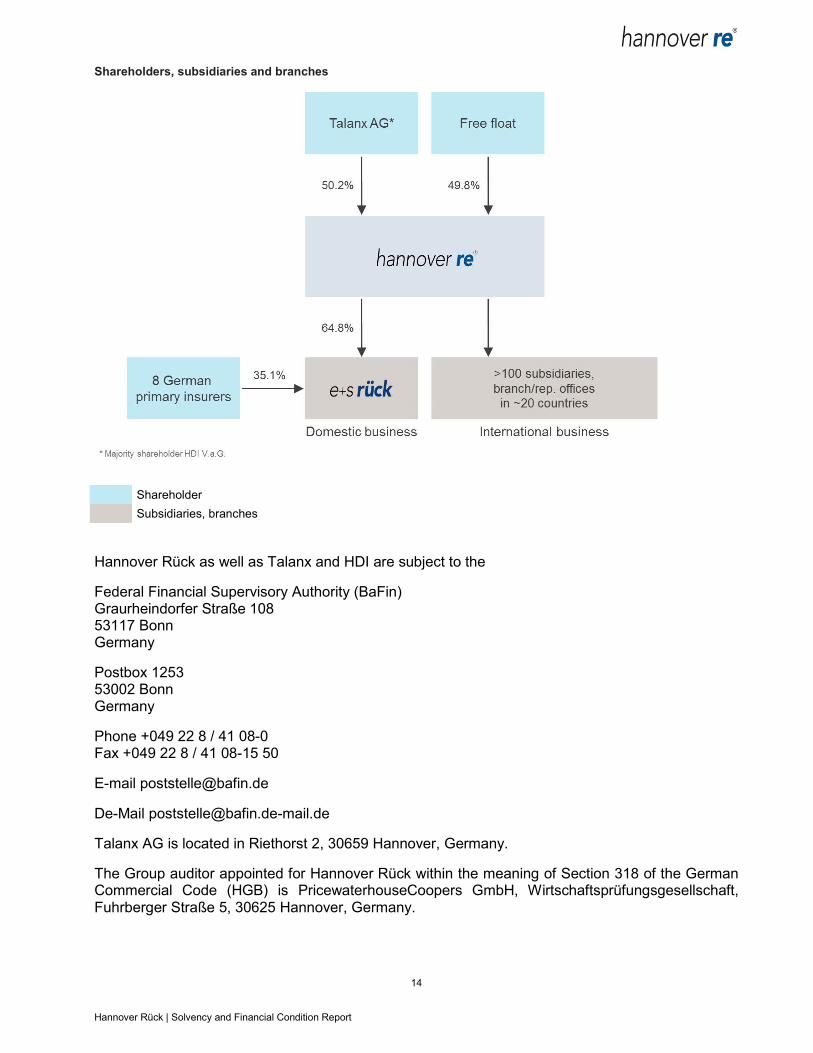
Hannover Rück is a European stock corporation, Societas Europaea (SE), with its headquarters located in Karl-Wiechert-Allee 50, 30625 Hannover, Germany and has been entered in the Commercial Register of the District Court of Hannover under the number HR Hannover B 6778. A rounded 50.2% of Hannover Rück shares are held by Talanx AG, Hannover, which in turn is majority-owned – with an interest of 79.0% – by HDI Haftpflichtverband der Deutschen Industrie V.a.G. (HDI), Hannover.
14 Hannover Rück | Solvency and Financial Condition Report
Shareholders, subsidiaries and branches
Shareholder
Subsidiaries, branches
Hannover Rück as well as Talanx and HDI are subject to the
Federal Financial Supervisory Authority (BaFin) Graurheindorfer Straße 108 53117 Bonn Germany
Postbox 1253 53002 Bonn Germany
Phone +049 22 8 / 41 08-0 Fax +049 22 8 / 41 08-15 50
E-mail [email protected]
De-Mail [email protected]
Talanx AG is located in Riethorst 2, 30659 Hannover, Germany.
The Group auditor appointed for Hannover Rück within the meaning of Section 318 of the German Commercial Code (HGB) is PricewaterhouseCoopers GmbH, Wirtschaftsprüfungsgesellschaft, Fuhrberger Straße 5, 30625 Hannover, Germany.
15 Hannover Rück | Solvency and Financial Condition Report
A.1.4 Group structure
This report refers to Hannover Rück SE on a stand-alone basis. As Hannover Rück SE also operates as the parent company of a group, we also provide information in this section about the group structure.
Hannover Rück and its subsidiaries (collectively referred to as the “Hannover Re Group” or “Hannover Re”) transact all lines of Property & Casualty and Life & Health reinsurance. We are present on all continents.
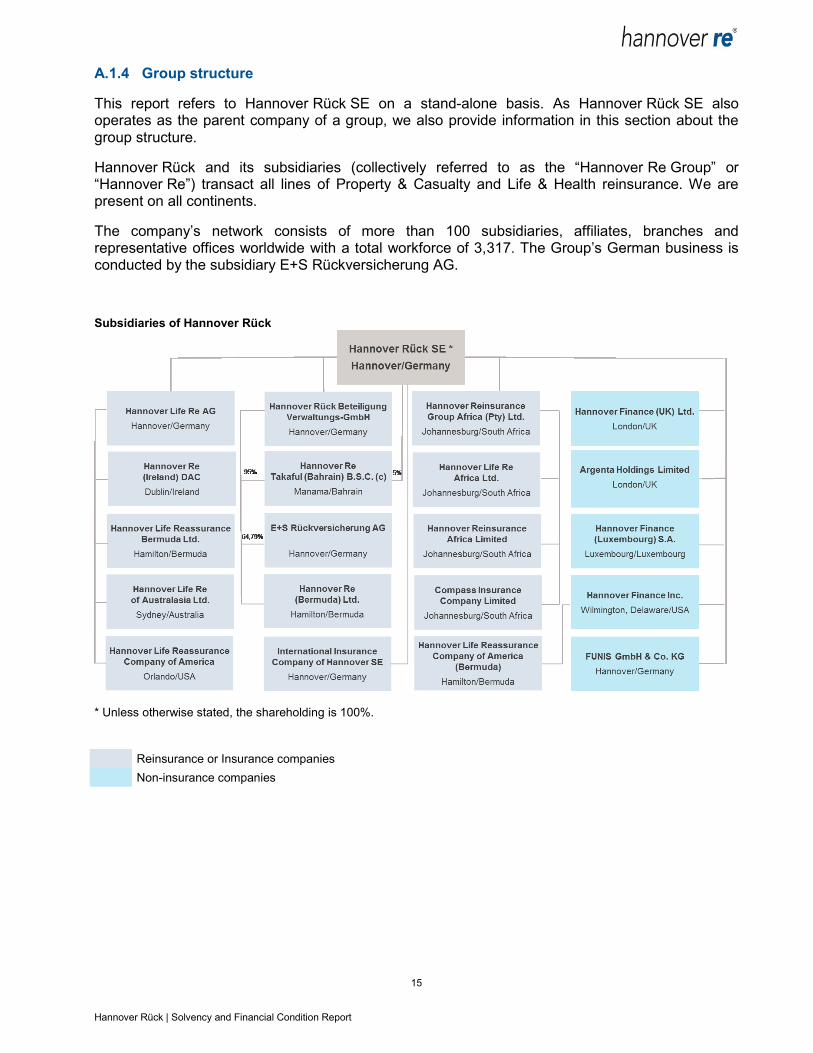
The company’s network consists of more than 100 subsidiaries, affiliates, branches and representative offices worldwide with a total workforce of 3,317. The Group’s German business is conducted by the subsidiary E+S Rückversicherung AG.
Subsidiaries of Hannover Rück
* Unless otherwise stated, the shareholding is 100%.
Reinsurance or Insurance companies
Non-insurance companies
16 Hannover Rück | Solvency and Financial Condition Report
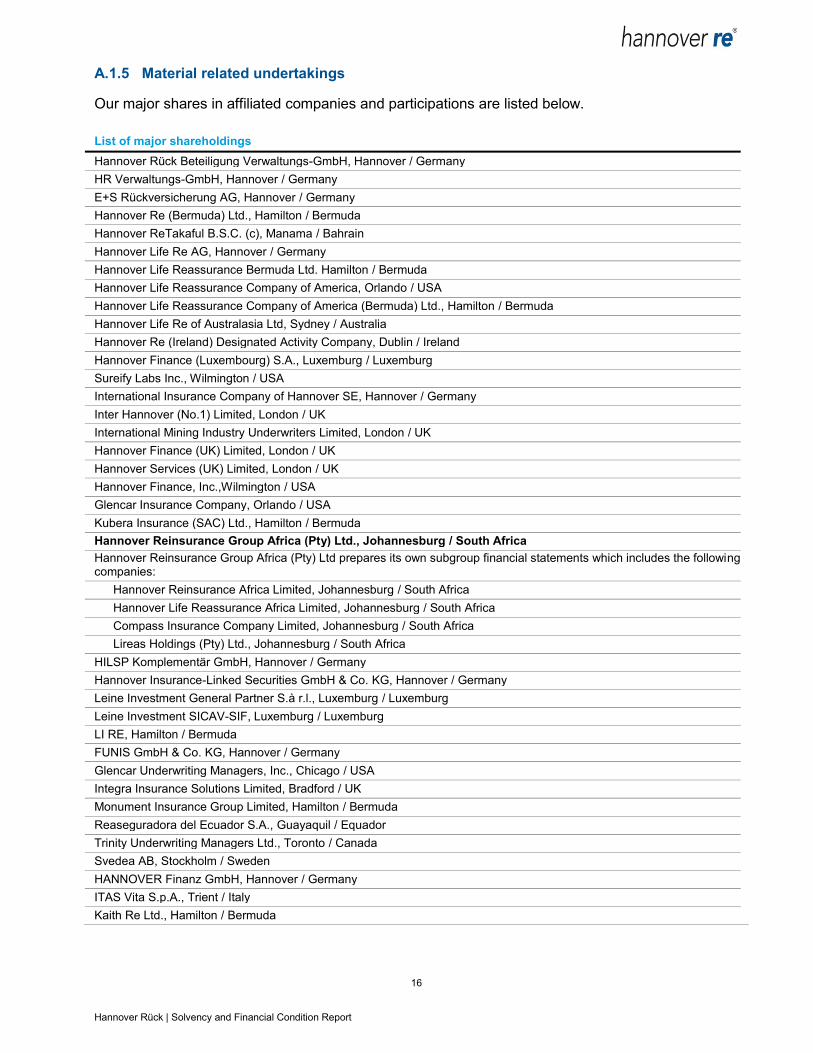
A.1.5 Material related undertakings
Our major shares in affiliated companies and participations are listed below.
List of major shareholdings
Hannover Rück Beteiligung Verwaltungs-GmbH, Hannover / Germany
HR Verwaltungs-GmbH, Hannover / Germany
E+S Rückversicherung AG, Hannover / Germany
Hannover Re (Bermuda) Ltd., Hamilton / Bermuda
Hannover ReTakaful B.S.C. (c), Manama / Bahrain
Hannover Life Re AG, Hannover / Germany
Hannover Life Reassurance Bermuda Ltd. Hamilton / Bermuda
Hannover Life Reassurance Company of America, Orlando / USA
Hannover Life Reassurance Company of America (Bermuda) Ltd., Hamilton / Bermuda
Hannover Life Re of Australasia Ltd, Sydney / Australia
Hannover Re (Ireland) Designated Activity Company, Dublin / Ireland
Hannover Finance (Luxembourg) S.A., Luxemburg / Luxemburg
Sureify Labs Inc., Wilmington / USA
International Insurance Company of Hannover SE, Hannover / Germany
Inter Hannover (No.1) Limited, London / UK
International Mining Industry Underwriters Limited, London / UK
Hannover Finance (UK) Limited, London / UK
Hannover Services (UK) Limited, London / UK
Hannover Finance, Inc.,Wilmington / USA
Glencar Insurance Company, Orlando / USA
Kubera Insurance (SAC) Ltd., Hamilton / Bermuda
Hannover Reinsurance Group Africa (Pty) Ltd., Johannesburg / South Africa
Hannover Reinsurance Group Africa (Pty) Ltd prepares its own subgroup financial statements which includes the following companies:
Hannover Reinsurance Africa Limited, Johannesburg / South Africa
Hannover Life Reassurance Africa Limited, Johannesburg / South Africa
Compass Insurance Company Limited, Johannesburg / South Africa
Lireas Holdings (Pty) Ltd., Johannesburg / South Africa
HILSP Komplementär GmbH, Hannover / Germany
Hannover Insurance-Linked Securities GmbH & Co. KG, Hannover / Germany
Leine Investment General Partner S.à r.l., Luxemburg / Luxemburg
Leine Investment SICAV-SIF, Luxemburg / Luxemburg
LI RE, Hamilton / Bermuda
FUNIS GmbH & Co. KG, Hannover / Germany
Glencar Underwriting Managers, Inc., Chicago / USA
Integra Insurance Solutions Limited, Bradford / UK
Monument Insurance Group Limited, Hamilton / Bermuda
Reaseguradora del Ecuador S.A., Guayaquil / Equador
Trinity Underwriting Managers Ltd., Toronto / Canada
Svedea AB, Stockholm / Sweden
HANNOVER Finanz GmbH, Hannover / Germany
ITAS Vita S.p.A., Trient / Italy
Kaith Re Ltd., Hamilton / Bermuda

17 Hannover Rück | Solvency and Financial Condition Report
U FOR LIFE SDN. BHD., Petaling Jaya / Malaysia
WeHaCo Unternehmensbeteiligungs-GmbH, Hannover / Germany
HAPEP II Komplementär GmbH, Hannover / Germany
Hannover America Private Equity Partners II GmbH & Co. KG, Hannover / Germany
HAPEP II Holding GmbH, Hannover / Germany
Hannover Re Euro PE Holdings GmbH & Co. KG, Hannover / Germany
Hannover Re Global Alternatives GmbH & Co KG, Hannover / Germany
HR US Infra Debt LP, George Town / Cayman islands
PAG Real Estate Asia Select Fund Limited, George Town / Cayman islands
Oval Office Grundstücks GmbH, Hannover / Germany
Hannover Re Euro RE Holdings GmbH, Hannover / Germany
HR GLL Central Europe GmbH & Co. KG, München / Germany
Hannover Re Real Estate Holdings, Inc., Orlando / USA
Hannover Re Real Estate Holdings, Inc. prepares its own subgroup financial statements which includes the following companies:
GLL HRE CORE Properties, L.P., Wilmington / USA
HR US Infra Equity LP, Wilmington / USA
Argenta Holdings Limited, London / UK
Argenta Holdings Limited prepares its own subgroup financial statements which includes the following companies:
Argenta Private Capital Limited, London / UK
Argenta Syndicate Management Limited, London / UK
Argenta Tax & Corporate Services Limited, London / UK
Argenta Underwriting Asia Pte. Ltd., Singapore / Singapur
Argenta Underwriting Labuan Ltd, Labuan / Malaysia
Argenta Underwriting No.1 Limited, London / UK
Argenta Underwriting No.2 Limited, London / UK
Argenta Underwriting No.3 Limited, London / UK
Argenta Underwriting No.4 Limited, London / UK
Argenta Underwriting No.7 Limited, London / UK
Argenta Underwriting No.8 Limited, London / UK
Argenta Underwriting No.9 Limited, London / UK
Argenta Underwriting No.10 Limited, London / UK
Argenta Underwriting No.11 Limited, London / UK
Argenta Underwriting No.13 Limited, London / UK
Argenta Underwriting No.14 Limited, London / UK
Argenta Underwriting No.15 Limited, London / UK
Residual Services Limited, London / UK
A.2 Underwriting Performance
With technical income of TEUR 10,616,717 (2017: TEUR 10,394,706) and technical expenses of TEUR 10,616,913 (TEUR 10,407,363), Hannover Rück booked a virtually breakeven total technical result in accordance with the German Commercial Code (HGB) of TEUR -196 in the 2018 financial year after TEUR -12,657 in the previous year.
Broken down into lines of business pursuant to Annex I of the Implementing Regulation (DVO), the split of the technical result (net) as at 31 December 2018 is as follows:

18 Hannover Rück | Solvency and Financial Condition Report
Technical result (net) – Breakdown by lines of business
in TEUR
31 December 2018 single line of business 31 December 2018 total
31 December 2017 single line of business 31 December 2017 total
Measured in terms of the total technical result in the 2018 financial year, the most significant lines are life reinsurance (TEUR 246,635), marine, aviation and transport insurance (TEUR 95,069), motor vehicle liability insurance (TEUR -74,114), other motor insurance (TEUR -78.096) as well as general liability insurance at TEUR -217,102. In addition, we report on the line of fire and other damage to property insurance.
Net premium earned in the general liability insurance line declined from TEUR 947,145 in the previous year to TEUR 898,814 in the year under review. This development can be attributed above all to reduced net premiums in Advanced Solutions business as well as lower premium income from US casualty business. On the other hand, stronger business was booked with entities belonging to the Talanx Group. The considerable rise in claims incurred is due to the establishment of sharply higher reserves. The technical result of TEUR -217,102 consequently decreased sharply in comparison with 2017 (TEUR 320,084).
Net premiums in marine, aviation and transport insurance contracted year-on-year (TEUR 375,524 after TEUR 384,675). While claims incurred in the aviation sector had developed very favourably in 2017, especially due to the release of reserves set aside in connection with the World Trade Center loss event in 2001, the necessary allocations to the reserves to be constituted in 2018 were lower. Overall, these effects led to an increase in claims incurred year-on-year and a technical result of TEUR 95,069 after TEUR 142,319 in 2017.
In 2018 net premium earned of TEUR 914,368 (2017: TEUR 833,076) was generated in the motor vehicle liability insurance line. The higher premium volume compared to 2017 can be attributed first and foremost to additional new business written in the area of Advanced Solutions. The decrease in claims incurred relates principally to a one-off effect in 2017, namely the lowering of the discount rate for compensation payments resulting from personal injury claims in the United Kingdom

19 Hannover Rück | Solvency and Financial Condition Report
("Ogden rate"). As a consequence of this move, severe personal injuries caused by a motor vehicle accident can lead to higher payments.
The fire and other damage to property line developed as follows: particularly due to additional premium growth in the area of Advanced Solutions as well as expansion of the business written in Central and South America, net premium earned climbed from TEUR 2,173,796 to TEUR 2,376,477. The drop in claims incurred is driven above all by more positive loss experiences in Advanced Solutions business, a lower burden of large losses and reduced reserve allocations. On this basis, a technical result of TEUR 4,915 (TEUR -276,938) was generated.
The other motor insurance line is notable for new treaties in the area of Advanced Solutions, which caused net premium earned to rise by TEUR 196,099 to TEUR 613,972. Increased reserves as well as declining loss experiences in Group business pushed claims incurred higher to TEUR 470,951 and are largely the reason for the negative technical result of TEUR -78,096.
The areas of legal expenses insurance, assistance and miscellaneous financial loss are shown under "Other lines".
The segment Health reinsurance developed overall in line with expectations. The slight increase in the technical income to TEUR 2,782 (TEUR -14,678) is the result of numerous smaller positive business developments within our international portfolio.
In the period under review, the technical income in the life reinsurance segment rose to TEUR 246,635 (TEUR 45,139). The main drivers for this significant increase were the US tax re-form in 2018, where we had to restructure a substantial part of our US business within the Group. This also affected underlying retrocessions, including to Hannover Rück. For Hannover Rück this restructuring had a one-off, clearly positive effect on earnings in the year under review and therefore had an impact on the result. In addition, there was a lower strain on earnings due to lower new business financing in Australia compared with the previous year.
The category „other lines of business“ contains assistance insurance, legal expense insurance and miscellaneous financial loss.
20 Hannover Rück | Solvency and Financial Condition Report
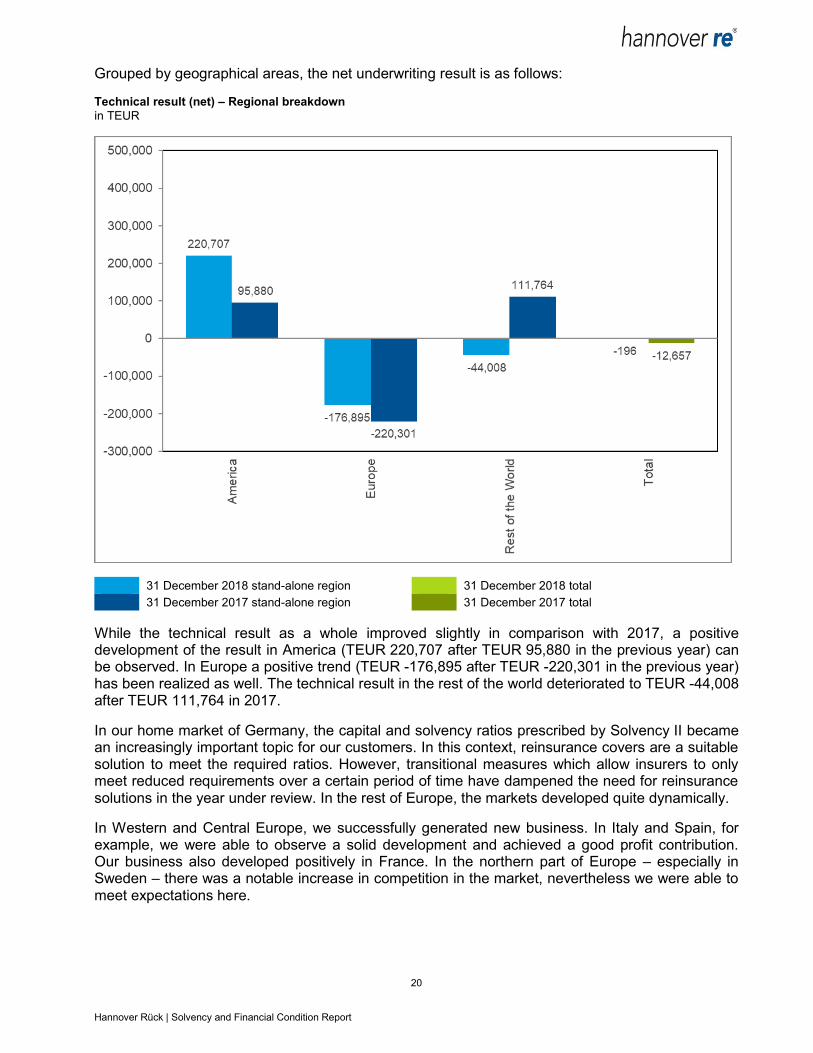
Grouped by geographical areas, the net underwriting result is as follows:
Technical result (net) – Regional breakdown
in TEUR
31 December 2018 stand-alone region 31 December 2018 total
31 December 2017 stand-alone region 31 December 2017 total
While the technical result as a whole improved slightly in comparison with 2017, a positive development of the result in America (TEUR 220,707 after TEUR 95,880 in the previous year) can be observed. In Europe a positive trend (TEUR -176,895 after TEUR -220,301 in the previous year) has been realized as well. The technical result in the rest of the world deteriorated to TEUR -44,008 after TEUR 111,764 in 2017.
In our home market of Germany, the capital and solvency ratios prescribed by Solvency II became an increasingly important topic for our customers. In this context, reinsurance covers are a suitable solution to meet the required ratios. However, transitional measures which allow insurers to only meet reduced requirements over a certain period of time have dampened the need for reinsurance solutions in the year under review. In the rest of Europe, the markets developed quite dynamically.
In Western and Central Europe, we successfully generated new business. In Italy and Spain, for example, we were able to observe a solid development and achieved a good profit contribution. Our business also developed positively in France. In the northern part of Europe – especially in Sweden – there was a notable increase in competition in the market, nevertheless we were able to meet expectations here.

21 Hannover Rück | Solvency and Financial Condition Report
In Asia, the Health reinsurance business developed quite well. China was the most dynamically developing market in the period under review. In particular, we were able to expand the Critical Illness business strongly. In the other Asian markets, the business developed overall as expected.
A.3 Investment Performance
As an insurance company, we naturally focus primarily on value retention when managing our capital investments and attach great importance to the stability of the resulting returns. For this reason, we align our investment portfolio with the principles of a balanced risk / return ratio and a broad level of diversification. With an overall low-risk mix, our investments reflect both the currency and maturity profile of our liabilities. Our portfolio contains a high level of fixed interest securities, so that credit and spread risks account for the main contribution to market risk.
We are largely satisfied with the development of our investments during the year under review, even though in light of the fact that the year under review was once again a challenging one featuring continued low interest rates and global economic development characterised by diverse uncertainty and risks.
At TEUR 1,234,058 (TEUR 1,002,904), ordinary income, including interests from funds withheld was pleasingly above the previous year’s level, which can be largely attributed to higher dividends from our participation holding companies, as well as increased income from fixed income securities. Despite the continuation in very low interest rates, ordinary income from this asset class satisfactorily increased to TEUR 458,586 (TEUR 419,021) mainly due to the high investment volume. Net gains from the disposal of investments were realised in the amount of TEUR 140,887 (TEUR 247,936). The significant decrease is attributable to the liquidation of our portfolio of non-strategic, listed equities last year. Write-downs of TEUR 88,363 (TEUR 20,711) were made on investments. These were mainly attributable to bearer bonds from current assets. These write-downs stood in contrast to increased market value write-ups of TEUR 1,208 (TEUR 13,672) on investments written off in previous periods. Overall, our net investment result increased to TEUR 1,231,680 (TEUR 1,197,553).
The following overview displays how the investment result achieved by Hannover Rück pursuant to the German Commercial Code (HGB) is broken down into its individual asset classes according to Solvency II, and which part contains income and expenses respectively.
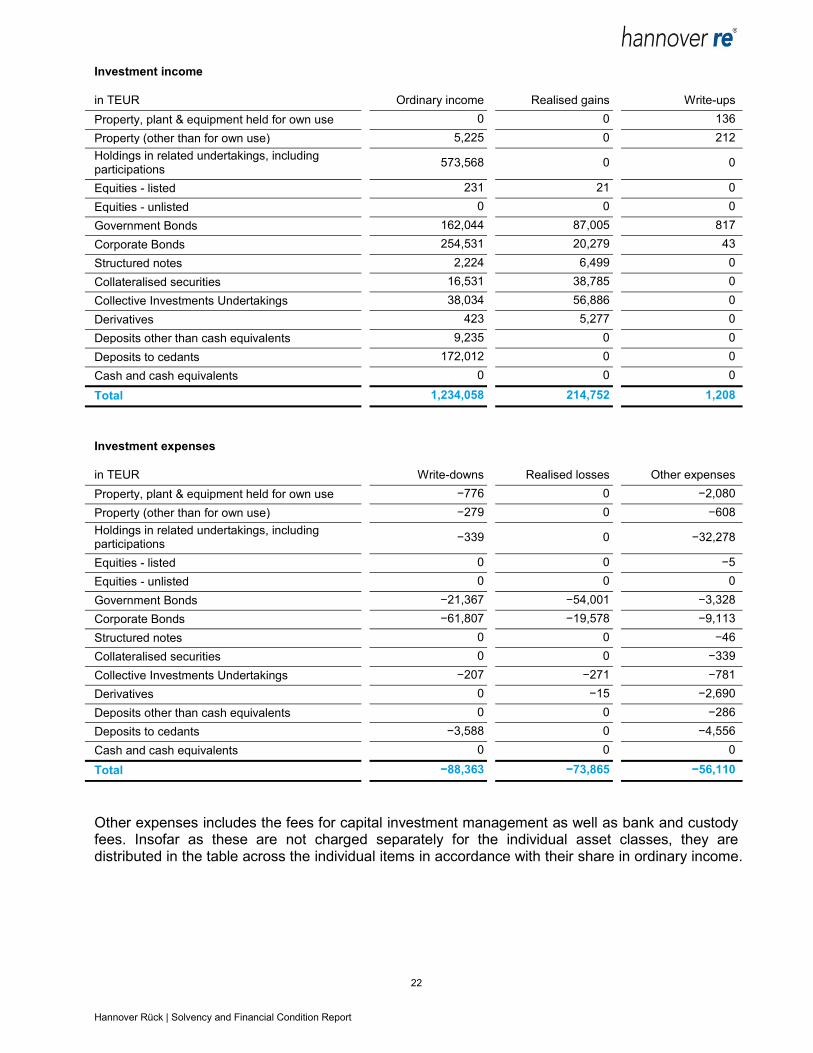
22 Hannover Rück | Solvency and Financial Condition Report
Investment income
in TEUR Ordinary income Realised gains Write-ups
Property, plant & equipment held for own use 0 0 136
Property (other than for own use) 5,225 0 212
Holdings in related undertakings, including participations
573,568 0 0
Equities - listed 231 21 0
Equities - unlisted 0 0 0
Government Bonds 162,044 87,005 817
Corporate Bonds 254,531 20,279 43
Structured notes 2,224 6,499 0
Collateralised securities 16,531 38,785 0
Collective Investments Undertakings 38,034 56,886 0
Derivatives 423 5,277 0
Deposits other than cash equivalents 9,235 0 0
Deposits to cedants 172,012 0 0
Cash and cash equivalents 0 0 0
Total 1,234,058 214,752 1,208
Investment expenses
in TEUR Write-downs Realised losses Other expenses
Property, plant & equipment held for own use −776 0 −2,080
Property (other than for own use) −279 0 −608
Holdings in related undertakings, including participations
−339 0 −32,278
Equities - listed 0 0 −5
Equities - unlisted 0 0 0
Government Bonds −21,367 −54,001 −3,328
Corporate Bonds −61,807 −19,578 −9,113
Structured notes 0 0 −46
Collateralised securities 0 0 −339
Collective Investments Undertakings −207 −271 −781
Derivatives 0 −15 −2,690
Deposits other than cash equivalents 0 0 −286
Deposits to cedants −3,588 0 −4,556
Cash and cash equivalents 0 0 0
Total −88,363 −73,865 −56,110
Other expenses includes the fees for capital investment management as well as bank and custody fees. Insofar as these are not charged separately for the individual asset classes, they are distributed in the table across the individual items in accordance with their share in ordinary income.

23 Hannover Rück | Solvency and Financial Condition Report
Investment performance
2018 2017
in TEUR Total
investment income
Total investment
expenses
Investment perfor-mance
Total investment
income
Total investment
expenses
Investment perfor-mance
Property, plant & equipment held for own use
136 −2,856 −2,720 2,989 −2,524 465
Property (other than for own use)
5,437 −887 4,550 1,095 −738 356
Holdings in related undertakings, including participations
573,568 −32,617 540,951 22,496 −3,074 19,422
Equities - listed 252 −5 247 103,947 −6,453 97,494
Equities - unlisted 0 0 0 346,790 −23,624 323,166
Government Bonds 249,866 −78,696 171,170 157,171 −28,220 128,951
Corporate Bonds 274,853 −90,498 184,355 311,941 −27,825 284,116
Structured notes 8,723 −46 8,677 2,502 −78 2,424
Collateralised securities 55,316 −339 54,977 53,801 −448 53,353
Collective Investments Undertakings
94,920 −1,259 93,661 119,071 −3,079 115,992
Derivatives 5,700 −2,705 2,995 204 −2,701 −2,497
Deposits other than cash equivalents
9,235 −286 8,949 6,725 −257 6,469
Deposits to cedants 172,012 −8,144 163,868 174,203 −6,381 167,822
Cash and cash equivalents 0 0 0 0 0 0
Total 1,450,018 −218,338 1,231,680 1,302,934 −105,401 1,197,533
Hannover Rück does not record any profits or losses directly in shareholders´equity in accordance with the German Commercial Code (HGB).
In the item “Collateralised securities” in the Solvency II balance sheet of Hannover Rück securitisations are recorded in the form of Collateralised Loan Obligations (CLO). The resulting income and expenses along with their composition can be taken from the above table. CLOs are assets-backed financial instruments, which consist of a portfolio of fixed income securities divided into several tranches. In principle, high rates of interest are to be viewed as the compensation for increasing probabilities of default, according to which the individual tranches are differentiated from one another. When investing in CLOs, every effort is made within a multilevel risk management system to ensure a sufficient level of investment diversification. In this regard, the capital investment guidelines established by Hannover Rück stipulate percentile maximum volumes for investments in CLOs and, in addition, lower maximum thresholds for the sub-category “CLO Equity Tranches”.
The volume of CLO positions held by Hannover Rück as of the balance sheet date can be found in the following table.
Collateralised Loan Obligations
in TEUR Market value
Collateralised Loan Obligations 465.348
Total 465.348
24 Hannover Rück | Solvency and Financial Condition Report
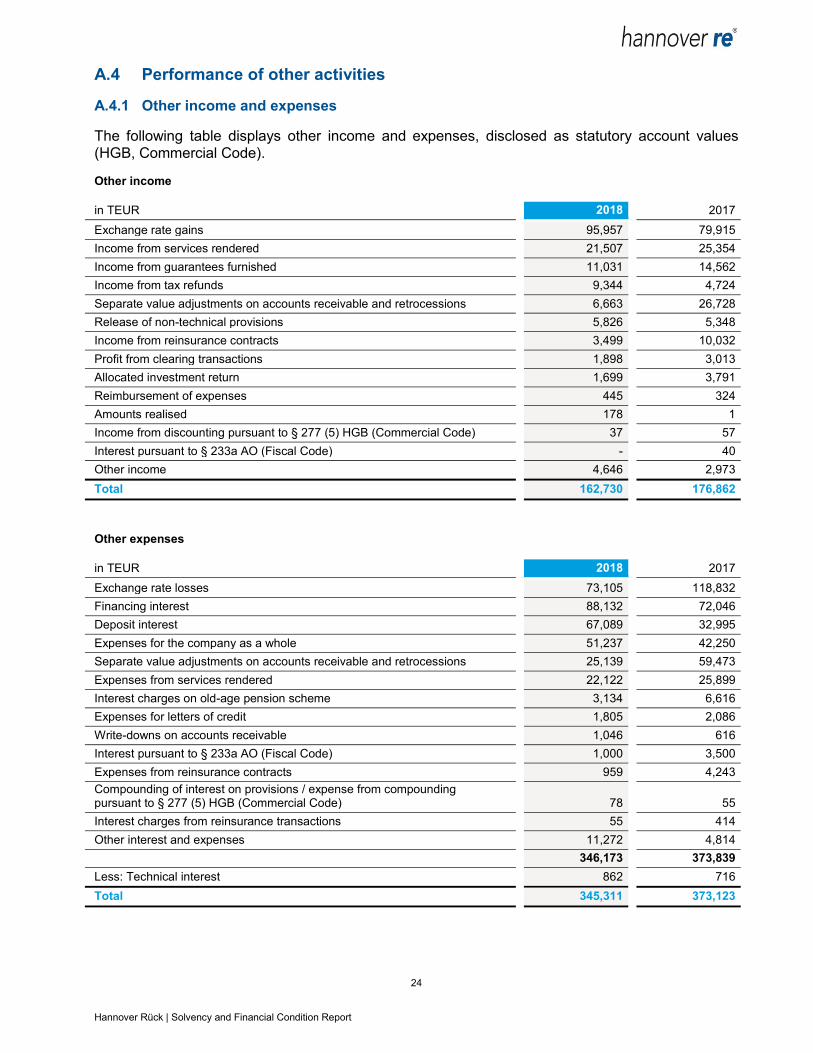
A.4 Performance of other activities
A.4.1 Other income and expenses
The following table displays other income and expenses, disclosed as statutory account values (HGB, Commercial Code).
Other income
in TEUR 2018 2017
Exchange rate gains 95,957 79,915
Income from services rendered 21,507 25,354
Income from guarantees furnished 11,031 14,562
Income from tax refunds 9,344 4,724
Separate value adjustments on accounts receivable and retrocessions 6,663 26,728
Release of non-technical provisions 5,826 5,348
Income from reinsurance contracts 3,499 10,032
Profit from clearing transactions 1,898 3,013
Allocated investment return 1,699 3,791
Reimbursement of expenses 445 324
Amounts realised 178 1
Income from discounting pursuant to § 277 (5) HGB (Commercial Code) 37 57
Interest pursuant to § 233a AO (Fiscal Code) - 40
Other income 4,646 2,973
Total 162,730 176,862
Other expenses
in TEUR 2018 2017
Exchange rate losses 73,105 118,832
Financing interest 88,132 72,046
Deposit interest 67,089 32,995
Expenses for the company as a whole 51,237 42,250
Separate value adjustments on accounts receivable and retrocessions 25,139 59,473
Expenses from services rendered 22,122 25,899
Interest charges on old-age pension scheme 3,134 6,616
Expenses for letters of credit 1,805 2,086
Write-downs on accounts receivable 1,046 616
Interest pursuant to § 233a AO (Fiscal Code) 1,000 3,500
Expenses from reinsurance contracts 959 4,243
Compounding of interest on provisions / expense from compounding pursuant to § 277 (5) HGB (Commercial Code) 78 55
Interest charges from reinsurance transactions 55 414
Other interest and expenses 11,272 4,814
346,173 373,839
Less: Technical interest 862 716
Total 345,311 373,123
25 Hannover Rück | Solvency and Financial Condition Report
A.4.2 Significant leasing agreements
There are no significant operating or financing-leasing agreements.
A.5 Any other information
There is no other information to be reported.

26 Hannover Rück | Solvency and Financial Condition Report
B. System of Governance
B.1 General information on the System of Governance
The Hannover Rück has an effective system of governance in place which provides for sound and prudent management. The main elements of the System of Governance are described in the following sections.
B.1.1 Governance structure
B.1.1.1 Our Administrative, Management or Supervisory body
Our administrative, management or supervisory body consists of the Executive Board and the Supervisory Board.
Executive Board
The Executive Board consists of no less than two persons. Furthermore it is up to the Supervisory Board to determine the number of members of the Executive Board. The members of the Executive Board are appointed by the Supervisory Board for a term of five years. Re-appointments for five years maximum are permissible.
The following overview shows the allocation of the areas of responsibility to the members of the Executive Board.
Members of the Executive Board
Chairman Chief
Financial Officer
Property & Casualty Reinsurance Life & Health Reinsurance
Ulrich Wallin Roland Vogel Dr. Michael
Pickel Sven Althoff
Jürgen Gräber (until
9. November 2018)
Claude Chèvre Dr. Klaus
Miller
Innovation Management Compliance Controlling Human Resources Management Internal Auditing Risk Manage-ment & Actuarial Corporate Development Corporate Communi-cations
Finance and Accounting Information Technology Investment and Collateral Management Facility Management
Group Legal Services Run-Off Solutions Target Markets in Property & Casualty Reinsurance: North America, Continental Europe
Specialty Lines Worldwide: Marine, Aviation, Credit, Surety and Political Risks, UK, Ireland, London Market and Direct Business Facultative Reinsurance
Coordination of Property & Casualty Business Group Global Reinsurance: Worldwide Treaty Reinsurance, Catastrophy XL, Structured Reinsurance and Insurance-Linked Securities Quotations Retrocessions
Life & Health Reinsurance: Africa, Asia, Australia / New Zealand, Latin America, Western and Southern Europe, Longevity Solutions
Life & Health Reinsurance: UK, Ireland, North America, Northern, Eastern and Central Europe

27 Hannover Rück | Solvency and Financial Condition Report
The four (Solvency II) key functions are allocated to the Chairman of the Executive Board. For further information on key functions (Solvency II) please refer to chapters B.3-B.6.
Supervisory Board
The Supervisory Board consists of nine members appointed by the General Meeting. Of these nine members, three shall be appointed on recommendation by the employees. The General Meeting is bound by these recommendations for the appointment of the employees’ representatives. Other than that, the General Meeting is not bound to proposed candidates. In the event that legal provisions concerning involvement of employees in a European Association (SE Beteiligungsgesetz – SEBG, Employees Involvement Act) provide for a different appointment procedure for representatives of the employees to the Supervisory Board, the employees’ representatives are appointed according to the agreed appointment procedure.
Every member of the Supervisory Board can resign from his membership by adhering to a notice period of one month even without an important reason by written notice to the Company, represented by the Management Board and the Chairman of the Supervisory Board (if notice is given by the Chairman himself, to his deputy). The Chairman of the Supervisory Board may choose to forgo adherence to this notice period.
Appointment for a successor of a member who has resigned prior to termination of his term is for the remaining period of the term of the resigned member.
As of 31 December the Supervisory Board consists of the following members:
Members of the Supervisory Board and membership in committees
Members of the Supervisory Board
Standing Committee
Finance and Audit Committee
Nomination Committee
Staff representative
Herbert K. Haas, Chairman
X X X
Torsten Leue, Deputy Chairman (since 7 May 2018)
X X X
Dr. Klaus Sturany (until 7 May 2018)
X
Wolf-Dieter Baumgartl (until 7 May 2018)
X X X
Benita Bierstedt (form 1 June 2018 to 6 July 2018)
X
Frauke Heitmüller X
Dr. Ursula Lipowski (since 7 May 2018)
X
Otto Müller (until 31 May 2018 and since 12 July 2018)
X
Dr. Andrea Pollak X
Dr. Immo Querner
Dr. Erhard Schipporeit X
Maike Sielaff
X
28 Hannover Rück | Solvency and Financial Condition Report
The Supervisory Board may form committees from among its members and authorise them to pass resolutions, as far as permitted by law.
The Supervisory Board considered at length during the 2018 financial year the position and development of the company and its major subsidiaries. It advised the Executive Board on the direction of the company and monitored the management of business on the basis of written and verbal reports from the Executive Board. The Supervisory Board of Hannover Rück SE held four regular meetings and two extraordinary meetings in order to adopt the necessary resolutions after appropriate discussion. In addition, the Supervisory Board adopted two resolutions in the reporting period by a written procedure. All nine Supervisory Board members took part in each of the Supervisory Board meetings held in 2018. Two representatives of the Federal Financial Supervisory Authority attended one meeting on a routine basis. In addition, we were informed by the Executive Board in writing and orally on the basis of the quarterly statements about the course of business as well as the position of the company and the Group. The quarterly reports with the components of the financial statements and key figures for the Hannover Re Group constituted an important source of information for the Supervisory Board.
As in every year, the Supervisory Board was regularly updated on the work of the Supervisory Board committees and given a description of the major pending legal proceedings.
Of the committees formed by the Supervisory Board within the meaning of § 107 (3) German Stock Corporation Act, the Finance and Audit Committee met on four occasions, the Standing Committee met three times and the Nomination Committee met two times. The Chairman of the Supervisory Board updated the full Supervisory Board on the major deliberations of the committee meetings at its next meeting and provided an opportunity for further questions.
There were changes in the composition of the Supervisory Board, its committees and the Executive Board in the year under review. On the Supervisory Board Mr. Baumgartl and Dr. Sturany informed the Chairman of the Supervisory Board that they would be resigning their Supervisory Board mandates with effect from the end of the Annual General Meeting of Hannover Rück on 7 May 2018. Mr. Baumgartl also sat on the Standing Committee, the Finance and Audit Committee and the Nomination Committee. Dr. Sturany belonged to the Standing Committee. Dr. Lipowsky and Mr. Leue were elected to the Supervisory Board in the scheduled by-election held at the Annual General Meeting on 7 May 2018 with effect from the end of the Annual General Meeting. At the extraordinary Supervisory Board meeting held after the Annual General Meeting Dr. Erhard Schipporeit resigned his mandate as a member of the Finance and Audit Committee. Dr. Lipowsky and Mr. Leue were subsequently elected to the Finance and Audit Committee. Mr. Leue and Dr. Schipporeit were elected to the Standing Committee. In addition, Mr. Leue was elected to the Nomination Committee. As a member of the Supervisory Board and employee representative on the company’s Supervisory Board, Mr. Otto Müller stepped down from the Supervisory Board effective 31 May 2018 at the end of his active employment relationship with the company. Ms. Benita Bierstedt succeeded Mr. Müller on the Supervisory Board as the appointed personal substitute member with effect from 1 June 2018. Ms. Bierstedt then resigned her mandate as a Supervisory Board member and employee representative on the company’s Supervisory Board for personal reasons effective 6 July 2018. In the by-election that was then held for the vacant seat as an employee representative, Mr. Müller was re-elected to the Supervisory Board as an external employee representative with effect from 12 July 2018.
29 Hannover Rück | Solvency and Financial Condition Report
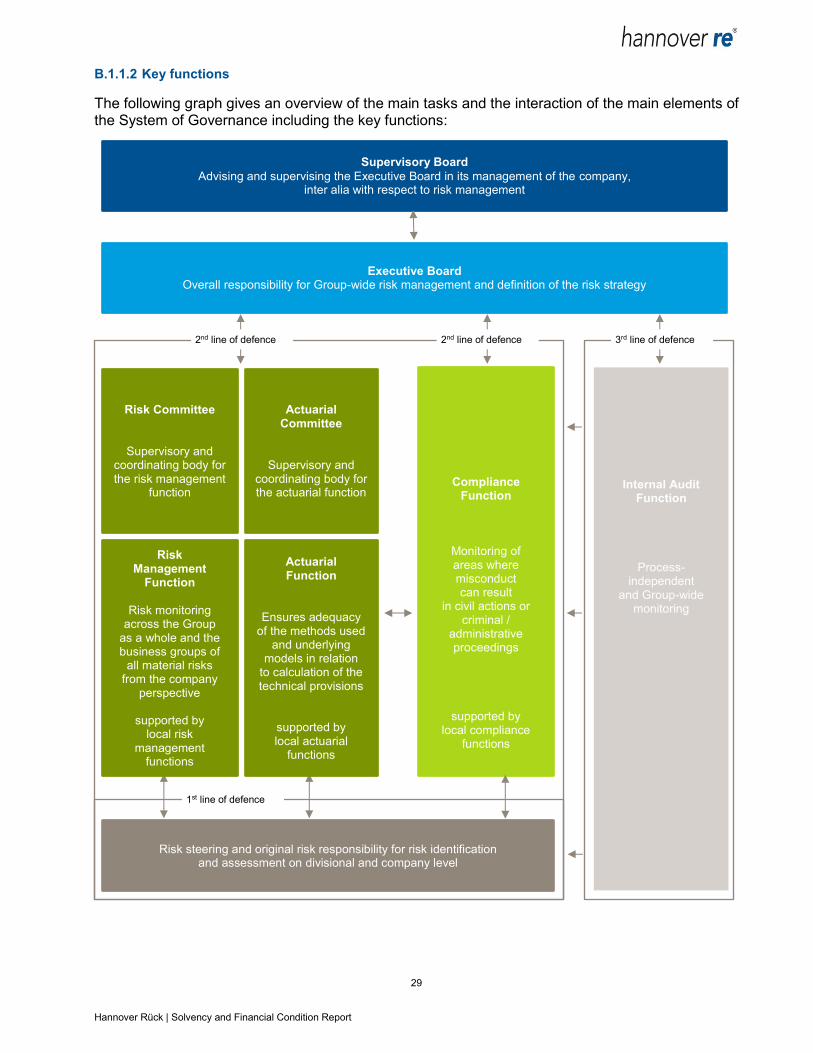
B.1.1.2 Key functions
The following graph gives an overview of the main tasks and the interaction of the main elements of the System of Governance including the key functions:
2nd line of defence
Supervisory Board
Advising and supervising the Executive Board in its management of the company, inter alia with respect to risk management
Executive Board Overall responsibility for Group-wide risk management and definition of the risk strategy
Compliance Function
Monitoring of areas where misconduct can result
in civil actions or criminal /
administrative proceedings
supported by local compliance
functions
2nd line of defence
Risk steering and original risk responsibility for risk identification and assessment on divisional and company level
1st line of defence
Risk Management
Function
Risk monitoring
across the Group as a whole and the business groups of
all material risks from the company
perspective
supported by local risk
management functions
Actuarial Function
Ensures adequacy of the methods used
and underlying models in relation
to calculation of the technical provisions
supported by local actuarial
functions
Risk Committee
Supervisory and coordinating body for the risk management
function
Actuarial Committee
Supervisory and coordinating body for the actuarial function
Internal Audit Function
Process-independent
and Group-wide monitoring
3rd line of defence

30 Hannover Rück | Solvency and Financial Condition Report
The organisation and collective effort of individual functions are decisive for our internal risk management and control system. In our system the central functions are closely interlinked with one another and the roles, tasks and reporting lines are both clearly defined and documented in the context of the so-called three lines of defence. The first line of defence consists of risk control and the original responsibility for risk at divisional and / or company level. The risk management function ensures the second line of defence – risk monitoring. It also receives support from the actuarial function and the compliance function. The third line of defence consists of process-independent monitoring executed by the internal audit function.
All key functions are equipped with appropriate resources and skills. The reporting lines to one another and to the Board Member responsible for the division respectively to the Executive Board have been clearly defined.
B.1.2 Remuneration policy
B.1.2.1 Remuneration of the executive board
The amount and structure of the remuneration of the Executive Board are geared to the size and activities of the company, its economic and financial position, its success and future prospects as well as the customariness of the remuneration, making reference to the benchmark environment (horizontal) and the remuneration structure otherwise applicable at the company (vertical). The remuneration is also guided by the tasks of the specific member of the Executive Board, his or her individual performance and the performance of the full Executive Board.
With an eye to these objectives, the remuneration system has two components: fixed salary / non-cash compensation and variable remuneration. The variable remuneration is designed to take account of both positive and negative developments. Overall, the remuneration is to be measured in such a way that it reflects the company’s sustainable development and is fair and competitive by market standards. In the event of 100% goal attainment the remuneration model provides for a split into roughly 40% fixed remuneration and roughly 60% variable remuneration.
The profit- and performance-based remuneration (variable remuneration) is contingent on certain defined results and the attainment of certain set targets. The set targets vary according to the function of the Board member in question. The variable remuneration consists of a profit bonus and a performance bonus. The variable remuneration is defined at the Supervisory Board meeting that approves the consolidated financial statement for the financial year just ended.
The total remuneration received by the Executive Board of Hannover Rück SE amounts to TEUR 6,850.
B.1.2.2 Remuneration of the supervisory board
The remuneration of the Supervisory Board is determined by the Annual General Meeting of Hannover Rück SE and regulated by the Statute.
The total remuneration received by the Supervisory Board of Hannover Rück amounts to TEUR 788.

31 Hannover Rück | Solvency and Financial Condition Report
B.1.2.3 Remuneration of staff and senior executives
The remuneration scheme for senior executives below the Executive Board (management levels 2 and 3) consists of a fixed annual salary and a system of variable remuneration. This is comprised of a short-term variable remuneration component, the annual cash bonus, and a long-term share-based remuneration component, the Share Award Plan.
Members of staff on the levels of Chief Manager, Senior Manager and Manager are also able to participate in a variable remuneration system through the Group Performance Bonus (GPB). The Group Performance Bonus (GPB) is a remuneration model that is linked to the success of the company.
B.1.3 Related party transactions
Talanx AG holds an unchanged majority interest of 50.2% in Hannover Rück SE. For its part, HDI Haftpflichtverband der Deutschen Industrie Versicherungsverein auf Gegenseitigkeit (HDI), Hannover, holds a stake of 79.0% in Talanx AG and therefore indirectly holds 39.7% (rounded) of the voting rights in Hannover Rück SE.
The business relationship between Hannover Rück and its subsidiary E+S Rück is based on a cooperation agreement. A retrocession by Hannover Rück to E+S Rück exists in property and casualty reinsurance. The exclusive responsibilities of E+S Rück for German business and of Hannover Rück for international markets have been preserved.
Within the contractually agreed framework Ampega Asset Management GmbH (name change in January 2019, formerly: Talanx Asset Management GmbH) performs investment and asset management services for Hannover Rück. Assets in special funds are managed by Ampega Investment GmbH. Ampega Real Estate GmbH (name change in January 2019, formerly: Talanx Immobilien Management GmbH) performs services for Hannover Rück under a number of management contracts.
The members of the governing bodies did not receive any advances or loans in the year under review. Nor were there any other material reportable circumstances or contractual relationships as defined by IAS 24 between companies of the Hannover Rück and the members of the governing bodies in the year under review.
B.2 Fit and proper requirements
B.2.1 Requirements
With a decision dated 17 November 2014, the Executive Board of Hannover Rück followed the specifications stipulated by the framework directive of the HDI V.a.G. pertaining to the fulfilment of the Fit & Proper requirements, on the proviso of their continued implementation in the affected group companies and business units, and with the further condition that the framework directive is only applicable to the extent that it is relevant for Hannover Rück as a reinsurance company. On 16 October 2015, the framework directive of Hannover Rück pertaining to the fulfilment of the Fit & Proper requirements in the Hannover Re Group was decreed by the Executive Board.
32 Hannover Rück | Solvency and Financial Condition Report
B.2.2 Description of requirements
The professional qualification (fitness) of individuals with key functions refers to a professional qualification suitable for the respective position as well as skills and experience, which are necessary for a robust and cautious management approach, and for the fulfilment of the position. The appropriateness is assessed according to the principle of proportionality, and takes into account the company-individual risks along with the type and scope of business operations. Specialist fitness requirements stemming from established supervisory practices are to be complied with by those individuals who actually head up the company, and the members of the Supervisory Board. Collective fitness requirements have been established for mutual controlling and monitoring. The requirements placed on the professional qualification of those holding key functions are closely linked with the special features of the respective governance tasks.
Individuals with key functions must, as part of personal reliability (propriety), act responsibly and with integrity, and carry out activities both dutifully and with the necessary level of care. Conflicts of interest must be avoided and the individual must not have demonstrated a lack of responsibility in the form of criminal actions prior to their nomination / appointment. There is no requirement for personal reliability to be positively established. It will be assumed, whenever there are no observable facts indicating the contrary. Unreliability is only to be assumed if personal circumstances according to general life experience give reason to believe that this could undermine the thorough and proper exercising of the function.
For Hannover Rück, the circle of individuals entrusted with key tasks consists of persons who
actually head up the company (Executive Board members) including the authorised representatives of an EU / EEA branch,
hold other key functions (members of the Supervisory Board, owners of one of the key functions including compliance, internal audit, risk management, actuarial function).
With regard to their various roles, these individuals are required to provide evidence of their professional qualifications in different areas as follows:
Educational background
Practical knowledge
Management experience
Language skills
Required specialist knowledge in relation to the relevant key function
Collective requirements
The professional and personal requirements for members of the Supervisory Board are comprised in a guideline document since 2017.
In the event that key functions are outsourced, general requirements for this are defined within a group policy. The onus remains on the side of the outsourcing company to ensure that the individuals deployed by the service provider who are responsible for the key function have suitable professional qualifications and are personally reliable. In accordance with supervisory regulations, the outsourcing company has to appoint an outsourcing officer for this purpose, who, where appropriate, is subject to registration with the regulatory body accordingly as the person responsible for the relevant key function within the company. The overseeing outsourcing official is hereby responsible for the proper fulfilment of the duties associated with the outsourcing of the key function.
No key functions were outsourced in 2018.
33 Hannover Rück | Solvency and Financial Condition Report
B.2.3 Evaluation process
The requirements and reporting processes with respect to the supervisory authority correspond to the current standard processes based on the BaFin information sheets on professional competence and reliability.
Pursuant to the framework directive on the fulfilment of the Fit & Proper requirements, at the preliminary stage of recruiting new members of staff who will actually head up the company or hold other key roles, a detailed curriculum vitae will be submitted and a requirements profile set, which detail and describe the necessary qualifications. The framework directive pertaining to the fulfilment of Fit & Proper requirements contains a checklist in the attachment, which is to be used in the assessment of the Fit & Proper requirements of these individuals. The requirements profile contains evidence of the following minimum requirements:
Description of the position with key functions:
Performance catalogue (job description)
Authority to make decisions
Level of staff responsibility
Professional qualification (general):
Level of education (commercial or vocational training)
University degree or professional standard (such as, for example, for auditors or actuaries)
Knowledge and understanding of business strategy
Knowledge of the system of governance
Foreign language skills, minimum of English language and other foreign languages where possible
Professional qualification (depending on the particular position):
Industry experience
Knowledge and understanding of the business model
Ability to interpret accounting and actuarial data
Knowledge and understanding of the regulatory frameworks affecting the company
Expertise in personnel management, staff selection, succession planning
The required specific knowledge for owners of one of the key functions including compliance, internal audit, risk management, and actuarial mathematics is included in the referred role description.
The procedure for assessing the transfer of tasks stipulates that, at the preliminary stage of recruiting new members of staff, a detailed curriculum vitae must be submitted and a requirements profile must be set, which contains the verification of predefined minimum requirements. The continual safeguarding of compliance with the relevant requirements is undertaken every five years in the form of an assessment of the requirements profile, undertaken by the responsible organisational unit.
34 Hannover Rück | Solvency and Financial Condition Report
As part of the event-driven assessment, any significant changes in the underlying parameters trigger an assessment of the compliance with the catalogue of requirements. This involves a differentiation of the characteristics deemed necessary in the person and in the position.
The assessment and control procedures are summarised in an overview, which contains the assessment cycle of the requirements profile and the responsibility for the assessment and duty to inform held by those individuals who actually head up the company, and those individuals who have other key functions.
B.3 Risk Management System including the Own Risk and Solvency Assessment
B.3.1 Risk management system including risk management function
B.3.1.1 Strategy implementation
Our current corporate strategy encompasses ten guiding principles that safeguard the realisation of our vision of creating value through reinsurance across the various divisions. The following principles of the corporate strategy constitute the key strategic points of departure for our Group-wide risk management:
We manage risks actively.
We maintain an adequate level of capitalisation.
We are committed to sustainability, integrity and compliance.
Our risk strategy is derived from the corporate strategy.
The risk strategy, the risk register and the central system of limits and thresholds are reviewed at least once a year. In this way we ensure that our risk management system is kept up-to-date.
We manage our total enterprise risk such that we can expect to generate positive Group net income with a probability of 90% p.a. and the likelihood of the complete loss of our economic capital and shareholders’ equity does not exceed 0.03% p.a. Our solvency ratio is subject to a limit of 180% and a threshold of 200%. Countermeasures would be triggered if the solvency ratio was to fall below this threshold. These indicators are monitored using our internal capital model and the Executive Board is informed quarterly about adherence to these key parameters as part of regular reporting. The necessary equity resources are determined according to the requirements of our economic capital model, solvency regulations, the expectations of rating agencies with respect to our target rating and the expectations of our clients. Above and beyond that, we maintain a capital cushion in order to be able to act on new business opportunities at any time.
B.3.1.2 Risk capital
In the interests of our shareholders, clients and employees we strive to ensure that our risks remain commensurate with our capital resources. Our quantitative risk management provides a uniform framework for the evaluation and steering of all risks affecting the company as well as of our capital position. In this context, the internal capital model is our central tool. The internal capital model of Hannover Rück is a stochastic enterprise model. It covers all subsidiaries and business groups of Hannover Rück. The central variable in risk and enterprise management is the economic capital,
35 Hannover Rück | Solvency and Financial Condition Report
which is calculated according to market-consistent measurement principles and also constitutes the basis for calculating the own funds under Solvency II.
Hannover Rück calculates the required risk capital as the Value at Risk (VaR) of the economic change in value over a period of one year with a confidence level of 99.97%. This reflects the goal of not exceeding a one-year ruin probability of 0.03%. The internal target capitalisation of the Hannover Rück is therefore significantly higher than the minimum confidence level of 99.5% required under Solvency II. In respect of the capitalization under Solvency II, Hannover Rück has determined a minimum solvency ratio with a limit of 180% and a threshold of 200%.
We hold additional capital above all to meet the requirements of the rating agencies for our target rating and to be able to act flexibly on business opportunities. We strive for a rating from the rating agencies most relevant to our industry that facilitates and secures our access to all reinsurance business worldwide. Hannover Rück is analysed by the rating agencies Standard & Poor’s (S & P) and A. M. Best as part of an interactive rating process. The current financial strength ratings are assessed as “AA-” (Very Strong, stable outlook) by Standard & Poor’s and “A+” (Superior, stable outlook) by A. M. Best. Standard & Poor’s evaluates Hannover Rück’s risk management as “Very Strong”, the best possible rating. Hannover Rück’s internal capital model was also subjected to expert appraisal (by Standard & Poor’s). Based on this review, Standard & Poor’s factors the results of the Hannover Rück internal capital model into the determination of the target capital for the rating.
B.3.1.3 Internal model governance
The governance of the internal model is defined in a number of documents and policies. In particular, governance rules, roles and responsibilities include standards for changes to the internal model and model validation as well as standards for internal and external data and expert settings used in the internal model. The rules have been set-up in compliance with the requirements of Solvency II.
The risk management function provides quarterly reports on internal model results and changes to the Executive Board and the Risk Committee. The reporting supports the tracking of changes to the risk profile and the solvency ratio. Apart from this reporting, internal model results are embedded in most internal steering processes such as capital cost allocation and new product evaluation.
The annual validation ensures that the internal model meets all defined quality standards of the policies. The Solvency II directive requires that the validation is performed as an independent process. Therefore, Hannover Rück has set-up a validation process which assigns validation to departments different from the departments responsible for model operation, calibration and maintenance. The validation report includes numerous stress tests and sensitivity analyses.
There have not been any significant changes in the model governance during the reporting period. However, a change to the model change policy has been filed to the regulator for approval. These changes will take effect in 2019, in particular, the thresholds for major model changes which require regulatory approval will be lowered.
36 Hannover Rück | Solvency and Financial Condition Report
B.3.1.4 Organisation of risk management and the tasks of the risk management function
For the fundamental organisational structure please refer to Section B.1.1.2.
The risk management function consists of three primary components: the Risk Committee, the Chief Risk Officer and the risk monitoring function.
Risk Committee
The tasks of the Risk Committee – the body charged with the monitoring and coordination of risk management – are derived from the rules of procedure regarding the Risk Committee. The scope of decision-making for the Risk Committee lies within the boundaries of risk appetite set by the Executive Board. Changes, and any instances of increase in risk appetite, require the approval of the Executive Board. Further tasks include quality assurance of the ORSA process and monitoring of the implementation of risk-related measures. The Risk Committee also receives the model change reports according to the model change policy.
Chief Risk Officer
The Chief Risk Officer is also the head of the risk monitoring function and member of the Risk Committee. The Chief Risk Officer coordinates the ORSA process and ensures the framework conditions of an effective risk management system.
Risk monitoring function
The risk monitoring function coordinates and bears responsibility for comprehensive monitoring (systematic identification, evaluation, monitoring and reporting) of all significant asset- and liability-related risks and the regular execution of the ORSA process. Furthermore, the risk monitoring function develops methods, standards and processes for the assessment and monitoring of risk.
The risk monitoring function fulfils its tasks objectively and independently for Hannover Rück. There have been no material changes in the risk management system during the reporting period.
B.3.1.5 Key elements of our risk management system
Our risk strategy, the Risk and Capital Management Guideline and the system of limits and thresholds for material risks of Hannover Rück describe the central elements of our risk management system. The risk management system is subject to a constant cycle of planning, action, control and improvement. Systematic risk identification, analysis, measurement, steering and monitoring as well as risk reporting are especially crucial to the effectiveness of the system as a whole.
The Risk and Capital Management Guideline describes, among other things, the major tasks, rights and responsibilities, the framework conditions and the risk control process. The rules, which are derived from the corporate strategy and the risk strategy, additionally take account of the regulatory requirements for risk management as well as international standards and developments relating to appropriate enterprise management.
Group-wide risk communication and an open risk culture are important to our risk management. Regular global meetings attended by the actuarial units and risk management functions serve as a central anchor point for strategic considerations in relation to risk communication. Beyond that, the
37 Hannover Rück | Solvency and Financial Condition Report
requirements by the risk management are stated in guidelines and policies, which are communicated Group-wide.
Risk-bearing capacity concept
The establishment of the risk-bearing capacity involves determining the total available risk coverage potential and calculating how much of this is to be used for covering all material risks. This is done in conformity with the parameters of the risk strategy and the risk appetite defined by the Executive Board. The quantitatively measurable individual risks and the risk position as a whole are evaluated using our risk model. A central system of limits and thresholds is in place to monitor material risks. This system incorporates – along with other risk-related key figures – in particular the indicators derived and calculated from the risk-bearing capacity. Adherence to the overall risk appetite is verified on an ongoing basis using the results of the risk model.
Risk identification
A key source of information for monitoring risks is the risk identification carried out on a rotating basis. All identified risks are documented in the central register containing all material risks. Risk identification takes the form of, for example, structured assessments, interviews or scenario analyses. External insights such as recognised industry know-how from relevant bodies or working groups are incorporated into the process. Risk identification is important for ensuring that our risk management consistently remains up-to-date.
Risk analysis and assessment
In principle, every risk that is identified and considered material is assessed quantitatively. Only risk types for which quantitative risk measurement is currently impossible or difficult are assessed qualitatively (e.g. strategic, reputational or emerging risks). Qualitative assessment takes the form of inter alia expert evaluations. Quantitative assessment of material risks and the overall risk position is performed by Group Risk Management using the Hannover Rück risk model. The model makes allowance as far as possible for risk accumulations and concentrations.
Risk steering
The steering of all material risks is the task of the operational business units on the divisional and company level. In this context, the identified and analysed risks are either consciously accepted, avoided or minimised. The risk / reward ratio and the required capital are factored into the division’s decision. Risk steering is assisted by, among other things, the parameters of the central and local underwriting guidelines and by defined limits and thresholds.
Risk monitoring
The monitoring of all identified material risks is a core task of Group Risk Management. This includes, inter alia, monitoring execution of the risk strategy as well as adherence to the defined limits and thresholds and to risk-related methods and processes. A further major task of risk monitoring is the ascertainment of whether risk steering measures were carried out and whether the planned effect of the measures is sufficient.
Risk communication and risk culture
Risk management is firmly integrated into our operational processes. It is assisted by transparent risk communication and the open handling of risks as part of our risk culture. Risk communication takes the form, for example, of internal and external risk reports, information on current risk complexes in the intranet and training opportunities for staff. The regular sharing of information
38 Hannover Rück | Solvency and Financial Condition Report
between risk-steering and risk-monitoring units is also fundamental to the proper functioning of risk management.
Risk reporting
Our risk reporting provides systematic and timely information about all material risks and their potential implications. The central risk reporting system consists primarily of regular risk reports, e.g. on the overall risk situation, adherence to the parameters defined in the risk strategy or on the capacity utilization of natural catastrophe scenarios. Complementary to the regular risk reporting, immediate internal reporting on material risks that emerge at short notice takes place as necessary.
Process-integrated / -independent monitoring and quality assurance
Irrespective of internally assigned competencies, the Executive Board is responsible for the orderly organisation of the company’s business. This also encompasses monitoring of the internal risk steering and control system. Furthermore, the Executive Board is the owner of the economic capital model and is responsible for the approval of major model changes. Process-independent monitoring and quality assurance of risk management is carried out by the internal audit function and external instances (regulators, independent auditors and rating agencies). Most notably, the independent auditors review the trigger mechanism and the internal monitoring system. The entire system is rounded off with process-integrated procedures and rules, such as those of the internal control system.
B.3.1.6 Risk landscape
In the context of its business operations Hannover Rück enters into a broad variety of risks. These risks are deliberately accepted, steered and monitored in order to be able to act on the associated opportunities. The parameters and decisions of the Executive Board with respect to the risk appetite of Hannover Rück, which are based on the calculations of risk-bearing capacity, are fundamental to the acceptance of risks. Through our business operations on all continents and the diversification between our Property & Casualty and Life & Health reinsurance business groups we are able to effectively allocate our capital in light of opportunity and risk considerations. Along with our principal business operations as a reinsurer of property & casualty and life & health business, we also transact primary insurance in selected niche markets as a complement to our core reinsurance business. With this approach we are well positioned for further profitable growth. In this context crucial importance attaches to our risk management in order to ensure that, among other things, risks to the reinsurance portfolio remain calculable and also exceptional major losses do not have an unduly adverse impact on the result.
The risk landscape of Hannover Rück encompasses:
underwriting risks in property & casualty and life & health reinsurance which originate from our business activities and manifest themselves inter alia in fluctuations in loss estimates as well as in unexpected catastrophes and changes in biometric factors such as mortality,
market risks which arise in connection with our investments and also as a consequence of the valuation of sometimes long-term payment obligations associated with the technical account,
counterparty default risks resulting from our diverse business relationships and payment obligations inter alia with clients and retrocessionaires,
operational risks which may derive, for example, from deficient processes or systems as well as
reputational, liquidity, strategic and emerging risks.
39 Hannover Rück | Solvency and Financial Condition Report
At the present time our most significant single risks are the credit and spread risks within the market risks, the reserving and catastrophe risks within the underwriting risks of property and casualty reinsurance and the risk of changes in mortality within the underwriting risks of life and health reinsurance. With regard to mortality risks, as a general principle annuity portfolios are impacted by improvements in mortality while death benefit portfolios are adversely affected by deteriorations in mortality. The specific risk characteristics and the principal monitoring and steering mechanisms are described in the following sections.
B.3.2 Own Risk and Solvency Assessment (ORSA)
The ORSA report, which is generated annually in the first half of the year after the completion of the financial year in question, primarily consists of an analysis of current and future risks, which could threaten the continued existence of Hannover Rück. Here, the internal model is used – especially for calculation of the solvency requirements in comparison to allocated risk capital – and its results are displayed. Capital resources are presented, stress tests are executed and a risk and profit forecast is generated including scenario analysis. The interplay between risk and capital management is highlighted here. Finally, it explains the inclusion of the Executive Board into the ORSA process and its use as one of the controlling instruments at the company’s disposal.
The ORSA report is coordinated by the risk management company division and is subject to both assessment and approval by the Executive Board. In addition, the report is submitted to the Supervisory Board and the BaFin.
The ORSA cycle mirrors our circuit of planning, action, monitoring und finally enhancement and comprises the elements listed in section B.3.1.5.
Risk reporting
We produce regular reports which demonstrate the company’s risk position. To be mentioned are for example the internal and external risk reports, internal model result reports including solvency calculation, actuarial report and the report on mid-term outlook.
All these reports are the basis for the solvency and risk assessments described in the ORSA report. Therein all employees contributing to the above procedures are involved as data and information suppliers and consulted for quality assurance.
The Executive Board observes the ORSA results for a full accomplishment of defined business targets, changes in the business process take place, if needed. This establishes a surveillance circuit for business enhancements and risk mitigation.
Furthermore, thereby the overall administrative, management or supervisory body (AMSB) can report to BaFin in detail using the ORSA report.
In the event of a necessary ad hoc ORSA, potentially because of a material change in risk profile, Hannover Re has defined specific procedural plans and responsibilities.

40 Hannover Rück | Solvency and Financial Condition Report
B.4 Internal Control System
B.4.1 Elements of the internal control system
We organise our business activities in such a way that they are always in conformity with all legal requirements. The internal control system (ICS) is an important subsystem that serves, among other things, to secure and protect existing assets, prevent and reveal errors and irregularities and comply with laws and regulations. The core elements of Hannover Rück’s ICS are documented in a Framework Guideline that establishes a common understanding of the differentiated execution of the necessary controls. In the final analysis, it is designed to systematically steer and monitor the implementation of our corporate strategy.
The Framework Guideline defines concepts, stipulates responsibilities and provides a guide for the description of controls. In addition, it forms the basis for the accomplishment of internal objectives and the fulfilment of external requirements imposed on Hannover Rück. The ICS consists of systematically structured organisational and technical measures and controls within the enterprise. This includes, among other things, the principle of dual control, separation of functions, documentation of the controls within processes and technical plausibility checks and access privileges in the IT systems.
The proper functioning of the ICS necessitates the involvement of management, executive staff and employees on all levels. The financial reporting of the parent company and the Group must satisfy international and national financial reporting standards as well as regulatory requirements. This is safeguarded in the area of accounting and financial reporting by processes with integrated controls which ensure the completeness and accuracy of the annual and consolidated financial statements. A structure made up of differentiated criteria, control points and materiality thresholds assures our ability to identify and minimise the risk of material errors in the annual and consolidated financial statements at an early stage.
B.4.2 Compliance function
Implementation of the Compliance function
Hannover Rück has opted for a decentralised approach towards the implementation of the Compliance function, i.e. the tasks of the Compliance function will not only be fulfilled by one department, but by various departments. The Compliance function is therefore located in several departments.
The head of Hannover Re Group’s Group Legal Services (GLS) is the holder of the key Compliance function at the same time.
The Executive Board of Hannover Rück has established the Compliance division within GLS for the fulfilment of some of the tasks of the Compliance function. The Compliance Officer is authorised to task further members of staff from GLS for the purpose of fulfilling compliance function as necessary.
Hannover Rück has specified its compliance policy in writing in a manual bearing the title “Corporate Compliance of Hannover Re and E+S Rück – Organisation, functions and responsibilites”. This manual is regularly assessed for its topicality and, if necessary, updated – at least once a year – and on an event-driven basis by the members of staff within the Compliance function when new developments occur.
41 Hannover Rück | Solvency and Financial Condition Report
There were no significant changes to the Compliance policy during the reporting period.
Hannover Rück has deemed the following topics to be of particular relevance for Compliance, and has determined these to be key areas of Compliance:
Fulfilment of statutory requirements
Compliance with foreign trade legislation and sanction provisions
Compliance with company law (including the German Corporate Governance Code)
Compliance with capital market legal provisions (in particular with obligations pursuant to the Market Abuse Directive [Marktmissbrauchsverordnung], the German Securities Trading Act [WpHG] and the German Securities Acquisition and Takeover Act [WpÜG]), laws relating to insider-trading, director dealings and ad hoc reporting
Compliance with antitrust and competition provisions
Compliance with the code of conduct
Combating corruption/embezzlement/fraud
Compliance with data protection norms
Compliance with the regulations stipulated by employment law
Compliance with tax laws
Execution of orderly financial reporting
The fulfilment of all statutory reporting requirements is ensured by assigning them to the responsible organisational units.
Tasks
The Compliance function ensures compliance with the relevant external provisions by Hannover Rück.
These key areas of Compliance as mentioned above are monitored by the Compliance function at Hannover Rück. Therefore, different departments work together in order to fulfil this function. E.g. employment law remains the responsibility of the Human Resources department, tax law falls under the jurisdiction of the Tax department of Hannover Rück.
The handling of particularly Compliance-relevant topics by the departments, who collectively form the Compliance function, comprises at the least the following activities:
Identification and evaluation of risks, which are associated with the non-compliance of statutory requirements (risk control)
Evaluation of the possible consequences for the company's activity as a result of changes in legal operating conditions (risk relating to changes in the law/early warning)
Consultation with regard to compliance with the legal provisions which apply to company activity
Assessment of the appropriateness of implemented measures in relation to compliance with statutory requirements (monitoring function)
The Compliance function has a regular risk review (at least once a year) carried out by the other departments dealing with particularly compliance-relevant issues, outlining which non-compliance risks have been identified and what measures are being deployed in these departments to minimise these risks. This ensures that all issues being handled within the Compliance function are monitored and dealt with.

42 Hannover Rück | Solvency and Financial Condition Report
The appointed Compliance Officer for Hannover Rück bears particular responsibility for the following tasks:
The Compliance Officer monitors changes made to legal provisions and standards made by legislators, as well as case law. He assesses the new developments for their relevance and communicates pertinent innovations and changes to the respective departments and the Executive Board. The Compliance function also holds regular training sessions for members of staff, in particular with regard to legislative reforms, announcements by the insurance supervisory authority or other changes.
By way of continuous monitoring, the Compliance Officer and the members of staff of the Compliance function contribute to ensuring compliance by the executive bodies (Executive Board and Supervisory Board) and the members of staff of Hannover Rück with legal and regulatory operating conditions.
The Compliance Officer advises members of the Executive Board and members of staff of Hannover Rück upon request regarding Compliance topics.
Every year, the Compliance Officer generates a Compliance plan for the following year. The Compliance Officer also created a Compliance plan together with the members of staff of the Compliance function for the year 2018. This plan determines where the key areas of Compliance activity should be in the subsequent year.
The Compliance Officer and the members of staff of the Compliance function assess Compliance reports submitted by the company branches, and generate the Hannover Rück Compliance Report for the previous calendar year until the balance committee meeting of the Supervisory Board. The report contains information on Compliance-relevant topics such as, for example, specific details regarding significant breaches of Compliance which have surfaced, as well as proposed and implemented measures relating to their elimination, current assessments pertaining to Compliance risks, proposed measures aimed at limiting Compliance risks etc.
Reporting lines
As the holder of the key Compliance function, the Compliance Officer reports directly to the members of the Executive Board responsible for the Legal and Compliance Department.
Reports are provided on relevant Compliance incidents and are completed in written, verbal or electronic form, although verbal reports are, as a rule, subsequently backed up in writing.
Depending on the seriousness of the incident, the reporting can be performed within a regular annual report or on an ad hoc basis.
B.5 Internal Audit Function
Implementation of the Internal Audit Function
The company’s internal audit function is executed by the department of Group Auditing (GA). GA renders independent, objective auditing services including evaluations and recommendations, which play a key role in safeguarding the external and internal compliance of processes, the internal control system and other areas of the company, as well as identifying potential areas for improvement and thus generating added value. In addition to its auditing role, GA operates as an
43 Hannover Rück | Solvency and Financial Condition Report
internal advisor generating valuable input as part of network collaboration with other units and functions within the company.
The Executive Board ensures that GA is not subject to instruction regarding audit planning, audit execution, reporting and the assessment of audit results. For the purposes of safeguarding independence, the Head of GA, who is simultaneously the key function holder for the company's internal audit function pursuant to Sections 30 and 47 (1) of the Insurance Supervision Act (VAG), reports directly to the Chairman of the Executive Board in all professional and disciplinary matters. Members of the internal audit staff are exclusively employed in GA and only execute tasks which are in line with the GA internal audit policy. This policy was released by the Executive Board and specifies the authorities of the internal audit function.
The GA team unites people of different educational backgrounds as well as different university and vocational degrees in order to cover the wide range of audit tasks. The employees hold a comprehensive professional experience, gained internally (especially from underwriting) as well as externally (in particular from external auditing and consulting). If a specific need for additional resources or skills arises, GA can involve internal peers or external capacities.
Tasks
GA supports the Executive Board in the attainment of company targets by assessing all business areas, processes and systems within the company in a targeted, independent and objective way, through the use of a systematic, risk-oriented approach as part of audit planning and execution, while also contributing to the company's further development. Auditing results are reported directly to the Executive Board. The assessment of individual findings and the overall assessment of the audit results is undertaken exclusively by GA. The underlying classification scheme defined by GA ensures an objectification of the estimations made.
Reporting lines
The internal audit function reports its auditing results and recommendations to the Executive Board continuously in the form of written audit reports, and / or immediately in the event of serious deficiencies, as well as once a year in the form of the GA annual report. The implementation of agreed recommendations and measures in the audits is monitored by GA up until the determined deadlines.
B.6 Actuarial Function
Implementation of the Actuarial Function
The Actuarial Function (AF) is organised decentralised, as the given tasks are undertaken by several organisational units. Utilisation of the expertise and processes, which are directly linked to the core tasks of the respective organisational unit, ensures adequate actuarial knowledge in all tasks of the AF.
The responsible owner of the AF coordinates all tasks related to the AF. He is assigned to the risk management department of the company, but operates objectively and independently in respect of fulfilling the requirements in undertaking the AF notwithstanding. In the exercise of his function, the responsible owner of the AF receives support from several units of the risk management department and from other departments of the company.

44 Hannover Rück | Solvency and Financial Condition Report
Furthermore, it is the common understanding between the two key functions of AF and the Risk Management Function (RMF) that a broad exchange of information and a competent support of each other’s function is useful to fulfil their individual tasks in an effective and efficient way.
With respect to an opinion on the underwriting policy, the AF is supported by those departments assigned to the risk management, which are concerned with premium risk and with the measurement of underwriting risk, respectively. For the evaluation of the retrocession and the accompanying risks, there is a close collaboration between respective departments within the risk management. In addition those departments which coordinate the retrocession program of the company are involved.
Tasks
The tasks of the AF are inter alia:
Coordination and validation of the calculation of the Solvency II technical provisions (TP)
Ensure the appropriateness of the applied methods, the underlying models and assumptions used for the calculation of the TP for solvency as well as for accounting purposes used as a basis for the appropriate recognition of the inherent risks of these methods,
models and assumptions in the internal model
Evaluation of the uncertainty associated with the estimations made in the calculation of the TP
Regular review and assessment of the underlying data in terms of sufficiency and quality
Regular comparison of best estimates against experience
Reconciliation of TP between local accounting principles and Solvency II
External validation and quality checks by actuarial consulting companies in addition to the internal validation of the TP
Recommendations on improving processes and models used for the calculation of the TP, including data collection, if deficiencies have been observed, and monitoring of their implementation
In the context of the contribution to the RMF inter alia Support of the internal model, especially with respect to underwriting risks
(delivery/validation of models, data, parameters) Monitoring of the reserve level within the scope of the system of limits and thresholds Analysis of large transactions and new types of business
Preparation of the AF report containing inter alia the following topics Tasks of the AF Activities of the AF in the reporting period Methods, results and sensitivity analyses in respect of TP Opinion on the underwriting policy, and Opinion on the retrocession policy
Reporting Lines
In addition to the annual AF report, the responsible owner of the AF reports regularly directly to the Executive Board and to the Actuarial Committee, which is the responsible committee for the information exchange with the AF. If necessary, the AF reports to the Board or the Actuarial Committee on an ad hoc basis or upon requests and vice versa any requests of these two bodies were directed to the responsible owner of the AF. These direct reporting lines ensure the independence of the AF from the other key functions and the operational management.
45 Hannover Rück | Solvency and Financial Condition Report
The Actuarial Committee consists of the CEO, CFO, and the Board member who is responsible for the coordination of Property and Casualty reinsurance, the head of the AF and the head of the AF for Life & Health reinsurance business.
B.7 Outsourcing
Hannover Rück has an outsourcing policy in place which is approved by the Executive Board. The outsourcing policy describes all statutory, regulatory and internal requirements imposed on the outsourcing of (re-)insurance activities and functions. Here, the entire outsourcing management process is described, which consists of the following five process steps:
Planning and classification
Risk analysis and due diligence
Contract management and notification
Steering and monitoring
Renewal and termination
All relevant stakeholder groups are involved in the outsourcing management process. Intra-Group outsourcings are also integrated into the outsourcing management process.
Among others, Hannover Rück has currently outsourced the asset and investment management, this on an intra-Group basis to Ampega Asset Management GmbH (name change in January 2019, before: Talanx Asset Management GmbH), located in Cologne (Germany). This matter concerns the only so-called important outsourcing.
B.8 Any other information
B.8.1 Evaluating the appropriateness of the system of governance
On an annual basis, the Executive Board receives an opinion from the System of Governance Assessment Committee regarding the past financial year. This opinion presented by the committee dated 11 March 2019 was assessed and approved by the Executive Board.
The committee is made up of the Heads of key functions, the Head of Corporate Development and the Head of Human Resources, and convenes at least once a year. Guests are invited on an event-driven basis. The basis for the assessment of the system of governance includes, among other things, the annual reports submitted by the key functions.
Based on the assessment conducted by the committee, the Executive Board has reached the conclusion that the system of governance of Hannover Rück is appropriate considering the scope and complexity of its business activities and the inherent risks.
B.8.2 Other information
Other information that has a significant influence on the system of governance is not available.

46 Hannover Rück | Solvency and Financial Condition Report
C. Risk Profile
In the context of its business operations Hannover Rück enters into a broad variety of risks. These risks are deliberately accepted, steered and monitored in order to be able to act on the associated opportunities. The parameters and decisions of the Executive Board with respect to the risk appetite of the Hannover Re Group, which are based on the calculations of risk-bearing capacity, are fundamental to the acceptance of risks.
In the course of the mid-term planning we monitor the business’s development over a time horizon of five years. Besides the basic scenario we also behold alternative scenarios in respect of macro-economic developments and evolution of (re)insurance markets. Under the assumptions within the mid-term business plan, the risk profile remains stable and the capitalisation of Hannover Rück remains comfortable. It is worthwhile to notice that the forecast of the capital demand is based on various assumptions for the future economic and business environment and is therefore to be handled carefully.
Large transactions are assessed in regards of the influence on the risk profile, the capitalisation and the defined limits for different risk categories. Therewith we secure that the risks develop in line with our risk appetite.
Retrocession has a particular significance within risk appetite and risk reduction. Business which does not remain in deductibles is retroceded to third parties in order to protect the capital of Hannover Rück. This ensures that Hannover Rück can benefit from any price increases following a market-changing event. The process of strategic placement for Hannover Rück, its branches and its subsidiaries is determined by the respective Board member and overseen by the Board as a whole.
New reinsurance and investment products are analysed under a dedicated process, namely the New Products Process (NPP). In addition to analysing the risk profile, integration into all internal processes, such as accounting and risk monitoring, is also defined. In 2018, two NPPs were completed and the products were approved by the Board.
Hannover Rück is the legal entity heading Hannover Re Group. It holds a number of participations which are included into management applications in a look-through manner, i.e. based on the underlying risk and return profile. Look-through means that the underlying risks are analysed instead of purely looking at the risk of a change in the participation values as e.g. per Solvency II standard formula. This look-through perspective corresponds to a modelling approach of Hannover Rück as the entire Hannover Re-Group after, i.e. excluding minorities. This means that the perception of the key risk indicators shown in following sections (Look-through) differs from that of the exposures or volume sizes (no Look-through for participations) in chapter D, but corresponds with the internal model approved by the supervisory authority.
In the following, we present the current risk situation per risk category.
C.1 Underwriting risk
C.1.1 Underwriting risk Property and Casualty
Risk management in property and casualty reinsurance has defined various overall guidelines for efficient risk steering. These include, among other things, the use of retrocessions to reduce volatility and conserve capital. It is also crucially important to consistently maximise the available
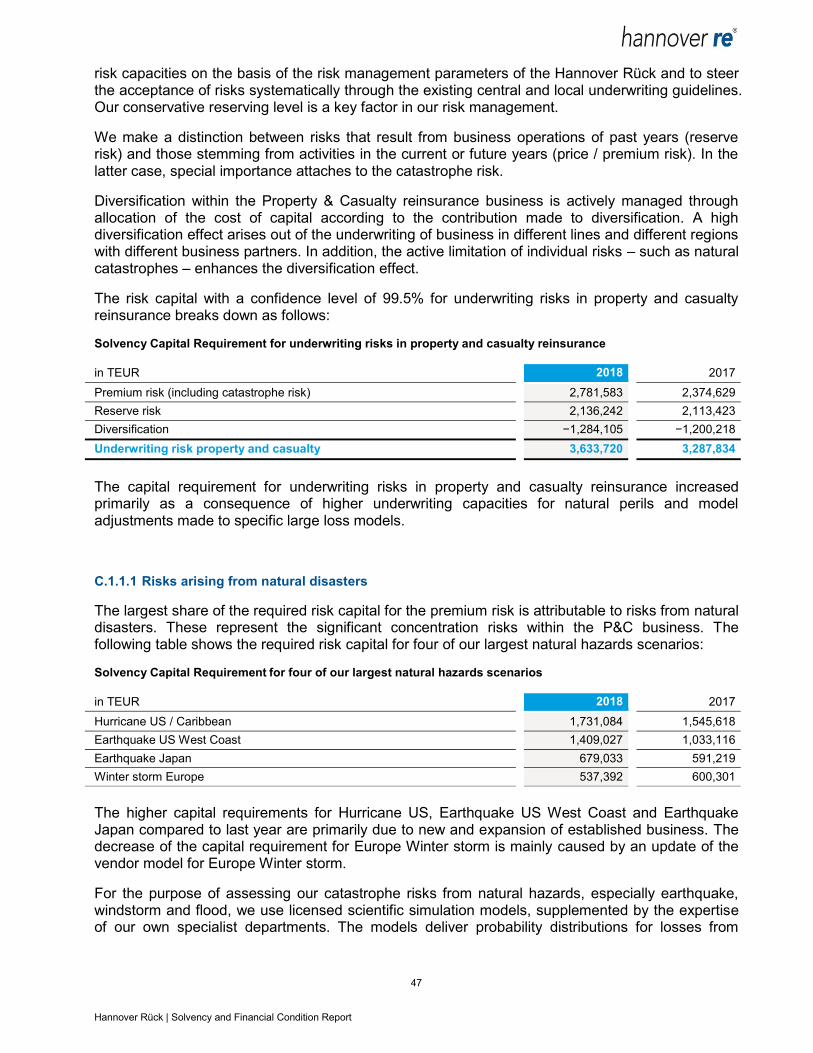
47 Hannover Rück | Solvency and Financial Condition Report
risk capacities on the basis of the risk management parameters of the Hannover Rück and to steer the acceptance of risks systematically through the existing central and local underwriting guidelines. Our conservative reserving level is a key factor in our risk management.
We make a distinction between risks that result from business operations of past years (reserve risk) and those stemming from activities in the current or future years (price / premium risk). In the latter case, special importance attaches to the catastrophe risk.
Diversification within the Property & Casualty reinsurance business is actively managed through allocation of the cost of capital according to the contribution made to diversification. A high diversification effect arises out of the underwriting of business in different lines and different regions with different business partners. In addition, the active limitation of individual risks – such as natural catastrophes – enhances the diversification effect.
The risk capital with a confidence level of 99.5% for underwriting risks in property and casualty reinsurance breaks down as follows:
Solvency Capital Requirement for underwriting risks in property and casualty reinsurance
in TEUR 2018 2017
Premium risk (including catastrophe risk) 2,781,583 2,374,629
Reserve risk 2,136,242 2,113,423
Diversification −1,284,105 −1,200,218
Underwriting risk property and casualty 3,633,720 3,287,834
The capital requirement for underwriting risks in property and casualty reinsurance increased primarily as a consequence of higher underwriting capacities for natural perils and model adjustments made to specific large loss models.
C.1.1.1 Risks arising from natural disasters
The largest share of the required risk capital for the premium risk is attributable to risks from natural disasters. These represent the significant concentration risks within the P&C business. The following table shows the required risk capital for four of our largest natural hazards scenarios:
Solvency Capital Requirement for four of our largest natural hazards scenarios
in TEUR 2018 2017
Hurricane US / Caribbean 1,731,084 1,545,618
Earthquake US West Coast 1,409,027 1,033,116
Earthquake Japan 679,033 591,219
Winter storm Europe 537,392 600,301
The higher capital requirements for Hurricane US, Earthquake US West Coast and Earthquake Japan compared to last year are primarily due to new and expansion of established business. The decrease of the capital requirement for Europe Winter storm is mainly caused by an update of the vendor model for Europe Winter storm.
For the purpose of assessing our catastrophe risks from natural hazards, especially earthquake, windstorm and flood, we use licensed scientific simulation models, supplemented by the expertise of our own specialist departments. The models deliver probability distributions for losses from
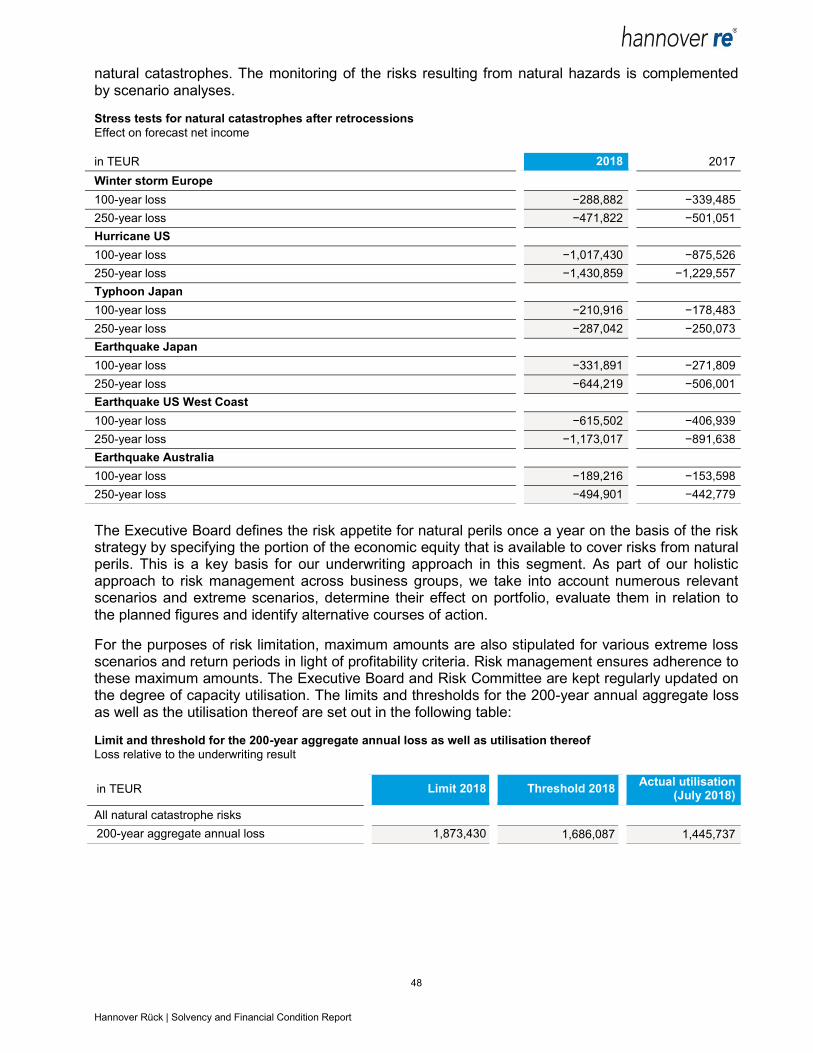
48 Hannover Rück | Solvency and Financial Condition Report
natural catastrophes. The monitoring of the risks resulting from natural hazards is complemented by scenario analyses.
Stress tests for natural catastrophes after retrocessions
Effect on forecast net income
in TEUR 2018 2017
Winter storm Europe
100-year loss −288,882 −339,485
250-year loss −471,822 −501,051
Hurricane US
100-year loss −1,017,430 −875,526
250-year loss −1,430,859 −1,229,557
Typhoon Japan
100-year loss −210,916 −178,483
250-year loss −287,042 −250,073
Earthquake Japan
100-year loss −331,891 −271,809
250-year loss −644,219 −506,001
Earthquake US West Coast
100-year loss −615,502 −406,939
250-year loss −1,173,017 −891,638
Earthquake Australia
100-year loss −189,216 −153,598
250-year loss −494,901 −442,779
The Executive Board defines the risk appetite for natural perils once a year on the basis of the risk strategy by specifying the portion of the economic equity that is available to cover risks from natural perils. This is a key basis for our underwriting approach in this segment. As part of our holistic approach to risk management across business groups, we take into account numerous relevant scenarios and extreme scenarios, determine their effect on portfolio, evaluate them in relation to the planned figures and identify alternative courses of action.
For the purposes of risk limitation, maximum amounts are also stipulated for various extreme loss scenarios and return periods in light of profitability criteria. Risk management ensures adherence to these maximum amounts. The Executive Board and Risk Committee are kept regularly updated on the degree of capacity utilisation. The limits and thresholds for the 200-year annual aggregate loss as well as the utilisation thereof are set out in the following table:
Limit and threshold for the 200-year aggregate annual loss as well as utilisation thereof
Loss relative to the underwriting result
in TEUR Limit 2018 Threshold 2018 Actual utilisation
(July 2018)
All natural catastrophe risks
200-year aggregate annual loss 1,873,430 1,686,087 1,445,737

49 Hannover Rück | Solvency and Financial Condition Report
C.1.2 Reserve risk
The reserve risk, i.e. the risk of under-reserving and the resulting strain on the underwriting result, is a high priority in our risk management. We attach importance to maintaining a conservative reserving level. In order to counter the risk of under-reserving we calculate our loss reserves based on our own actuarial estimations and establish, where necessary, additional reserves supplementary to those posted by our cedants as well as the segment reserve for losses that have already occurred but have not yet been reported to us. Liability claims have a major influence on the segment reserve. The segment reserve is calculated on a differentiated basis according to lines of business and regions.
The statistical run-off triangles are another monitoring tool used by our company. They show changes in the reserve over time as a consequence of paid claims and changes in the recalculation of the reserves at each reporting date. Their adequacy is monitored using actuarial methods.
Our own actuarial calculations regarding the adequacy of the reserves are also subject to annual quality assurance reviews conducted by external firms of actuaries and auditors.
In order to partially hedge inflation risks Hannover Rück holds securities in its portfolio with inflation-linked coupons and redemption amounts. An inflation risk exists particularly inasmuch as the liabilities (e.g. loss reserves) could develop differently than assumed at the time when the reserve was constituted because of inflation. The specified bonds protect these parts of the loss reserves against inflation risks.
C.1.3 Risk mitigation techniques Property & Casualty
C.1.3.1 Strategic aims and key figures
The strategic aims in relation to the placement of retrocessions are determined by the placing unit and the relevant member of the Executive Board. The Executive Board oversees the placement of the retrocessions as a whole, in particular the limits, premiums and contractual terms.
C.1.3.2 Description of Hannover Rück main types of cover against natural perils
In the event of a claim, Hannover Re Group shall receive relief from its various protections. Further details on the individual forms of reinsurance covers are described in the text below. The following mentioned natural protections also protect the Hannover Rück SE.
Whole Account Protection 2018
The Whole Account Protections cover all property, motor hull and engineering business of the Hannover Re Group, i.e. business recorded in Hannover and through subsidiaries or other branch offices. The protections are placed on a gross claim basis.
Large Loss Aggregate XL 2018
The Large Loss Aggregate XL is an aggregate protection and covers the whole Property & Casualty book of the Hannover Re Group.
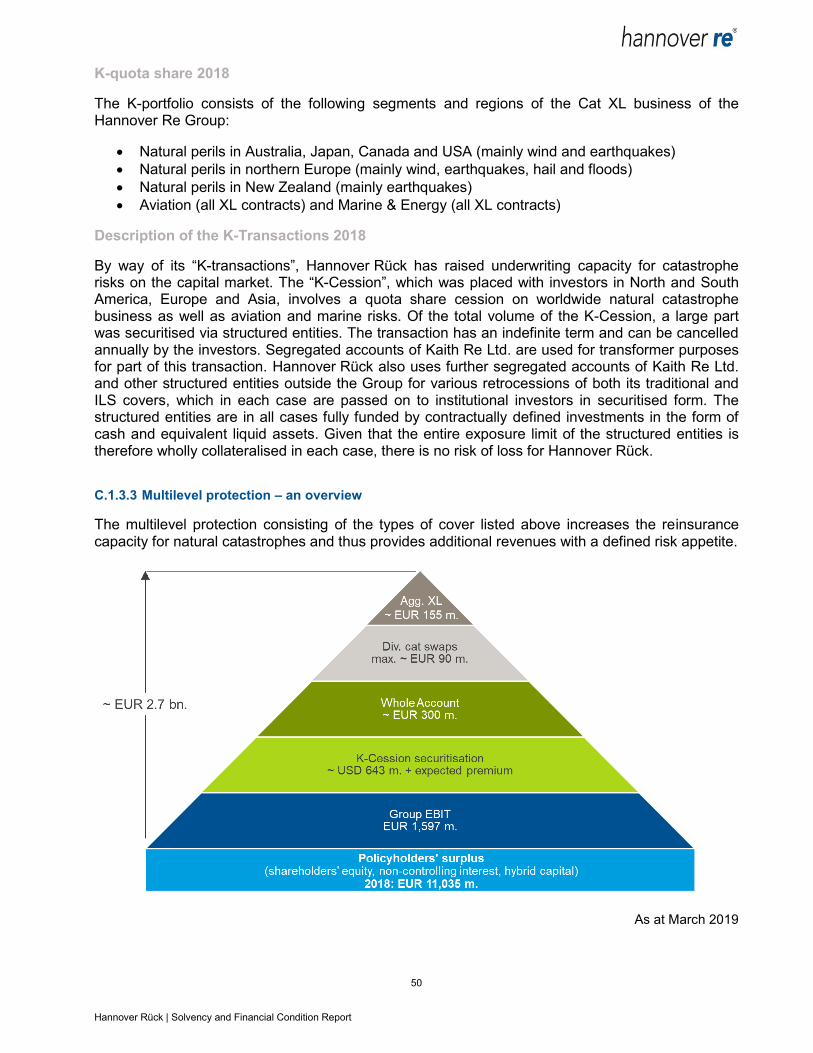
50 Hannover Rück | Solvency and Financial Condition Report
K-quota share 2018
The K-portfolio consists of the following segments and regions of the Cat XL business of the Hannover Re Group:
Natural perils in Australia, Japan, Canada and USA (mainly wind and earthquakes)
Natural perils in northern Europe (mainly wind, earthquakes, hail and floods)
Natural perils in New Zealand (mainly earthquakes)
Aviation (all XL contracts) and Marine & Energy (all XL contracts)
Description of the K-Transactions 2018
By way of its “K-transactions”, Hannover Rück has raised underwriting capacity for catastrophe risks on the capital market. The “K-Cession”, which was placed with investors in North and South America, Europe and Asia, involves a quota share cession on worldwide natural catastrophe business as well as aviation and marine risks. Of the total volume of the K-Cession, a large part was securitised via structured entities. The transaction has an indefinite term and can be cancelled annually by the investors. Segregated accounts of Kaith Re Ltd. are used for transformer purposes for part of this transaction. Hannover Rück also uses further segregated accounts of Kaith Re Ltd. and other structured entities outside the Group for various retrocessions of both its traditional and ILS covers, which in each case are passed on to institutional investors in securitised form. The structured entities are in all cases fully funded by contractually defined investments in the form of cash and equivalent liquid assets. Given that the entire exposure limit of the structured entities is therefore wholly collateralised in each case, there is no risk of loss for Hannover Rück.
C.1.3.3 Multilevel protection – an overview
The multilevel protection consisting of the types of cover listed above increases the reinsurance capacity for natural catastrophes and thus provides additional revenues with a defined risk appetite.
As at March 2019
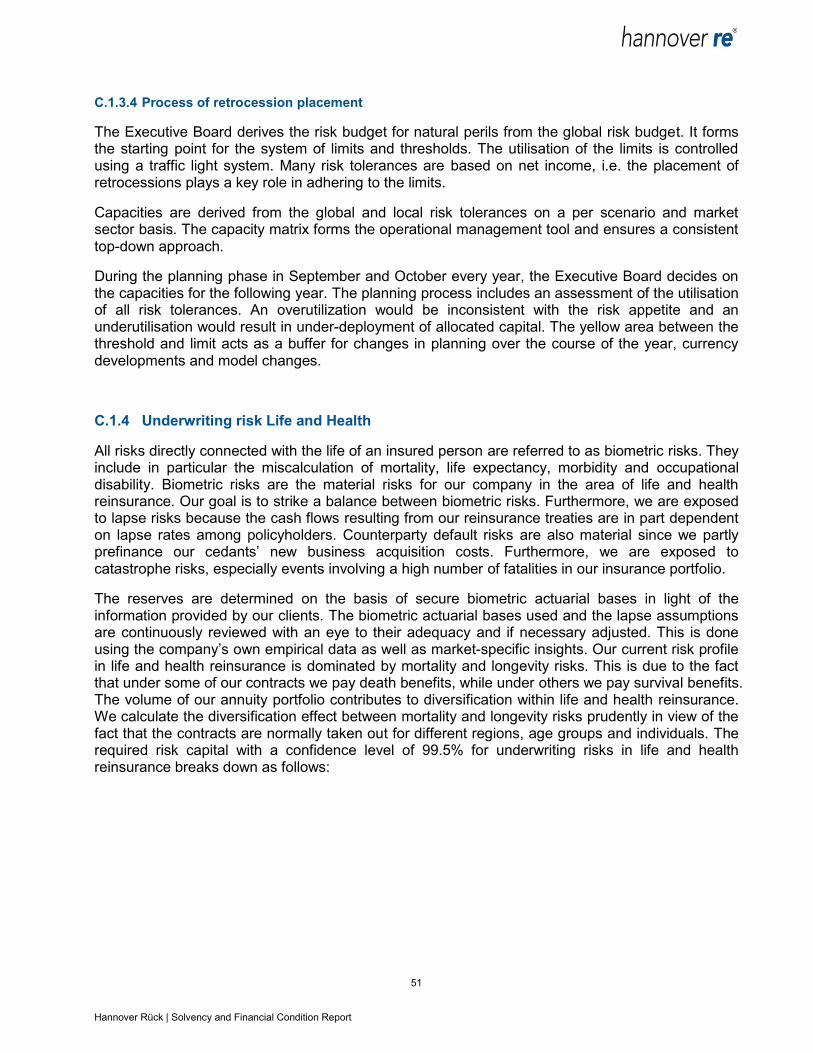
51 Hannover Rück | Solvency and Financial Condition Report
C.1.3.4 Process of retrocession placement
The Executive Board derives the risk budget for natural perils from the global risk budget. It forms the starting point for the system of limits and thresholds. The utilisation of the limits is controlled using a traffic light system. Many risk tolerances are based on net income, i.e. the placement of retrocessions plays a key role in adhering to the limits.
Capacities are derived from the global and local risk tolerances on a per scenario and market sector basis. The capacity matrix forms the operational management tool and ensures a consistent top-down approach.
During the planning phase in September and October every year, the Executive Board decides on the capacities for the following year. The planning process includes an assessment of the utilisation of all risk tolerances. An overutilization would be inconsistent with the risk appetite and an underutilisation would result in under-deployment of allocated capital. The yellow area between the threshold and limit acts as a buffer for changes in planning over the course of the year, currency developments and model changes.
C.1.4 Underwriting risk Life and Health
All risks directly connected with the life of an insured person are referred to as biometric risks. They include in particular the miscalculation of mortality, life expectancy, morbidity and occupational disability. Biometric risks are the material risks for our company in the area of life and health reinsurance. Our goal is to strike a balance between biometric risks. Furthermore, we are exposed to lapse risks because the cash flows resulting from our reinsurance treaties are in part dependent on lapse rates among policyholders. Counterparty default risks are also material since we partly prefinance our cedants’ new business acquisition costs. Furthermore, we are exposed to catastrophe risks, especially events involving a high number of fatalities in our insurance portfolio.
The reserves are determined on the basis of secure biometric actuarial bases in light of the information provided by our clients. The biometric actuarial bases used and the lapse assumptions are continuously reviewed with an eye to their adequacy and if necessary adjusted. This is done using the company’s own empirical data as well as market-specific insights. Our current risk profile in life and health reinsurance is dominated by mortality and longevity risks. This is due to the fact that under some of our contracts we pay death benefits, while under others we pay survival benefits. The volume of our annuity portfolio contributes to diversification within life and health reinsurance. We calculate the diversification effect between mortality and longevity risks prudently in view of the fact that the contracts are normally taken out for different regions, age groups and individuals. The required risk capital with a confidence level of 99.5% for underwriting risks in life and health reinsurance breaks down as follows:
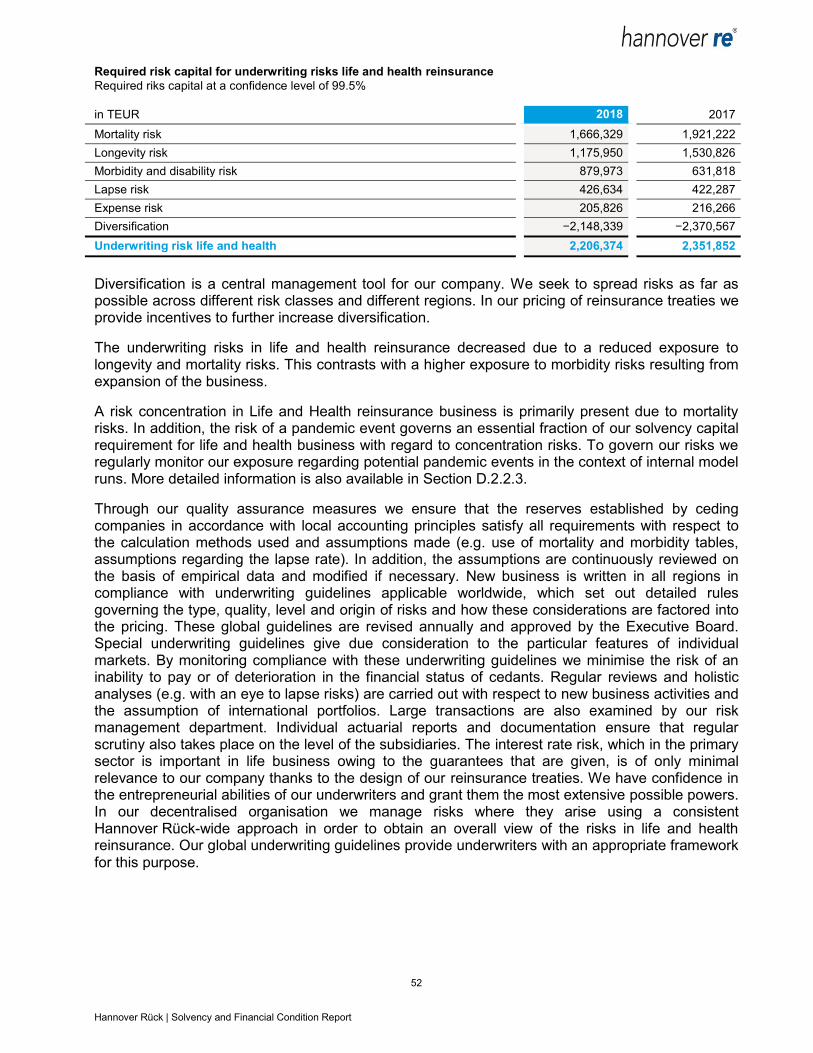
52 Hannover Rück | Solvency and Financial Condition Report
Required risk capital for underwriting risks life and health reinsurance
Required riks capital at a confidence level of 99.5%
in TEUR 2018 2017
Mortality risk 1,666,329 1,921,222
Longevity risk 1,175,950 1,530,826
Morbidity and disability risk 879,973 631,818
Lapse risk 426,634 422,287
Expense risk 205,826 216,266
Diversification −2,148,339 −2,370,567
Underwriting risk life and health 2,206,374 2,351,852
Diversification is a central management tool for our company. We seek to spread risks as far as possible across different risk classes and different regions. In our pricing of reinsurance treaties we provide incentives to further increase diversification.
The underwriting risks in life and health reinsurance decreased due to a reduced exposure to longevity and mortality risks. This contrasts with a higher exposure to morbidity risks resulting from expansion of the business.
A risk concentration in Life and Health reinsurance business is primarily present due to mortality risks. In addition, the risk of a pandemic event governs an essential fraction of our solvency capital requirement for life and health business with regard to concentration risks. To govern our risks we regularly monitor our exposure regarding potential pandemic events in the context of internal model runs. More detailed information is also available in Section D.2.2.3.
Through our quality assurance measures we ensure that the reserves established by ceding companies in accordance with local accounting principles satisfy all requirements with respect to the calculation methods used and assumptions made (e.g. use of mortality and morbidity tables, assumptions regarding the lapse rate). In addition, the assumptions are continuously reviewed on the basis of empirical data and modified if necessary. New business is written in all regions in compliance with underwriting guidelines applicable worldwide, which set out detailed rules governing the type, quality, level and origin of risks and how these considerations are factored into the pricing. These global guidelines are revised annually and approved by the Executive Board. Special underwriting guidelines give due consideration to the particular features of individual markets. By monitoring compliance with these underwriting guidelines we minimise the risk of an inability to pay or of deterioration in the financial status of cedants. Regular reviews and holistic analyses (e.g. with an eye to lapse risks) are carried out with respect to new business activities and the assumption of international portfolios. Large transactions are also examined by our risk management department. Individual actuarial reports and documentation ensure that regular scrutiny also takes place on the level of the subsidiaries. The interest rate risk, which in the primary sector is important in life business owing to the guarantees that are given, is of only minimal relevance to our company thanks to the design of our reinsurance treaties. We have confidence in the entrepreneurial abilities of our underwriters and grant them the most extensive possible powers. In our decentralised organisation we manage risks where they arise using a consistent Hannover Rück-wide approach in order to obtain an overall view of the risks in life and health reinsurance. Our global underwriting guidelines provide underwriters with an appropriate framework for this purpose.

53 Hannover Rück | Solvency and Financial Condition Report
C.1.4.1 Risk mitigation techniques Life & Health
In the Life & Health business group, retrocessions for the purposes of risk reduction are only used on an extremely limited basis.
An index-based pandemic cover was structured in 2013 as a swap and, since then, has been placed with different investors in various tranches. The overall capacity placed is flexibly collateralised, such that the level of collateralisation can be increased depending on the current WHO pandemic alert phases.
Some large longevity deals are retroceded proportionally and on regular premiums basis, in order to reduce the volatility of the longevity portfolio with regards to particular large contracts. Two sided collateral provisions ensure future liabilities are collateralized if receivables from or to the retrocessionaires resulting from expected business development are projected to exceed an agreed threshold.
The existing pool retrocessions for high sum assured individual policies mainly originate from times when a lower retention per life applied for Hannover Rück. For risk reduction reasons, they are no longer necessary and have been placed in run off.
Some non-European branches use inter-company retrocession for capital relief reasons under local regulatory capital requirements.
All other existing retrocessions are not placed for reasons of active risk reduction, but rather to maintain existing customer relationships and gain access to attractive fronting business or are placed with affiliates in order to reduce HGB strain from large financing transactions.
The effectiveness of the retrocessions is closely linked to the default risk of the retrocessionaires. The monitoring of the default risk of retrocessionaires is performed across all business segments of Hannover Re in a standardized way, using standard systems and methods which are described in section C.3.
C.2 Market risk
Faced with a challenging capital market climate, particularly high importance attaches to preserving the value of assets and the stability of the return. Hannover Rück’s portfolio is guided by the principles of a balanced risk / return profile and broad diversification. Based on a risk-averse asset mix, the investments reflect both the currencies and durations of our liabilities. Market price risks include equity risks, interest rate risks, foreign exchange risks, real estate risks, default and spread risks. Our portfolio currently consists in large part of fixed-income securities, and hence default and spread risks account for the bulk of the market risk. We minimise interest rate and foreign exchange risks through the matching of payments from fixed-income securities with the projected future payment obligations from our insurance contracts to a significant extent. Market risks derive from the investments managed by Hannover Rück itself and from investment risks of ceding companies that we assume in connection with insurance contracts. The following table shows the risk capital with a confidence level of 99.5% for the market risks from investments under own and third-party management.
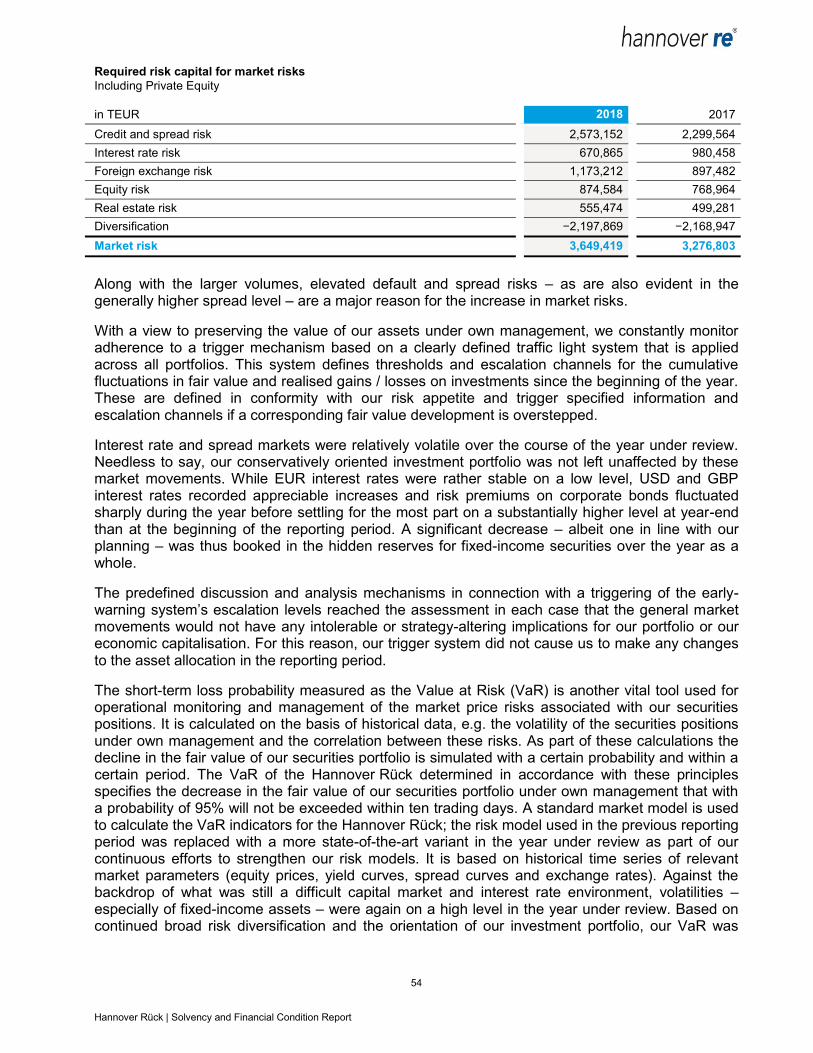
54 Hannover Rück | Solvency and Financial Condition Report
Required risk capital for market risks
Including Private Equity
in TEUR 2018 2017
Credit and spread risk 2,573,152 2,299,564
Interest rate risk 670,865 980,458
Foreign exchange risk 1,173,212 897,482
Equity risk 874,584 768,964
Real estate risk 555,474 499,281
Diversification −2,197,869 −2,168,947
Market risk 3,649,419 3,276,803
Along with the larger volumes, elevated default and spread risks – as are also evident in the generally higher spread level – are a major reason for the increase in market risks.
With a view to preserving the value of our assets under own management, we constantly monitor adherence to a trigger mechanism based on a clearly defined traffic light system that is applied across all portfolios. This system defines thresholds and escalation channels for the cumulative fluctuations in fair value and realised gains / losses on investments since the beginning of the year. These are defined in conformity with our risk appetite and trigger specified information and escalation channels if a corresponding fair value development is overstepped.
Interest rate and spread markets were relatively volatile over the course of the year under review. Needless to say, our conservatively oriented investment portfolio was not left unaffected by these market movements. While EUR interest rates were rather stable on a low level, USD and GBP interest rates recorded appreciable increases and risk premiums on corporate bonds fluctuated sharply during the year before settling for the most part on a substantially higher level at year-end than at the beginning of the reporting period. A significant decrease – albeit one in line with our planning – was thus booked in the hidden reserves for fixed-income securities over the year as a whole.
The predefined discussion and analysis mechanisms in connection with a triggering of the early-warning system’s escalation levels reached the assessment in each case that the general market movements would not have any intolerable or strategy-altering implications for our portfolio or our economic capitalisation. For this reason, our trigger system did not cause us to make any changes to the asset allocation in the reporting period.
The short-term loss probability measured as the Value at Risk (VaR) is another vital tool used for operational monitoring and management of the market price risks associated with our securities positions. It is calculated on the basis of historical data, e.g. the volatility of the securities positions under own management and the correlation between these risks. As part of these calculations the decline in the fair value of our securities portfolio is simulated with a certain probability and within a certain period. The VaR of the Hannover Rück determined in accordance with these principles specifies the decrease in the fair value of our securities portfolio under own management that with a probability of 95% will not be exceeded within ten trading days. A standard market model is used to calculate the VaR indicators for the Hannover Rück; the risk model used in the previous reporting period was replaced with a more state-of-the-art variant in the year under review as part of our continuous efforts to strengthen our risk models. It is based on historical time series of relevant market parameters (equity prices, yield curves, spread curves and exchange rates). Against the backdrop of what was still a difficult capital market and interest rate environment, volatilities – especially of fixed-income assets – were again on a high level in the year under review. Based on continued broad risk diversification and the orientation of our investment portfolio, our VaR was
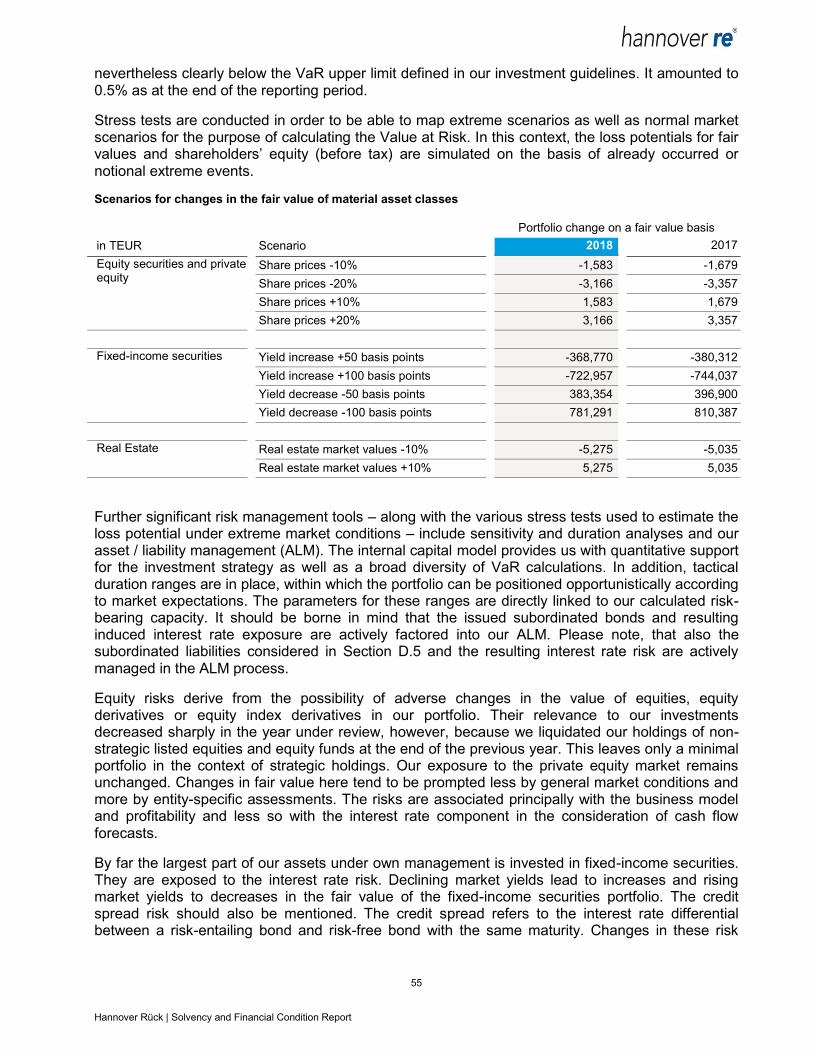
55 Hannover Rück | Solvency and Financial Condition Report
nevertheless clearly below the VaR upper limit defined in our investment guidelines. It amounted to 0.5% as at the end of the reporting period.
Stress tests are conducted in order to be able to map extreme scenarios as well as normal market scenarios for the purpose of calculating the Value at Risk. In this context, the loss potentials for fair values and shareholders’ equity (before tax) are simulated on the basis of already occurred or notional extreme events.
Scenarios for changes in the fair value of material asset classes
Portfolio change on a fair value basis
in TEUR Scenario 2018 2017
Equity securities and private equity
Share prices -10% -1,583 -1,679
Share prices -20% -3,166 -3,357
Share prices +10% 1,583 1,679
Share prices +20% 3,166 3,357
Fixed-income securities Yield increase +50 basis points -368,770 -380,312
Yield increase +100 basis points -722,957 -744,037
Yield decrease -50 basis points 383,354 396,900
Yield decrease -100 basis points 781,291 810,387
Real Estate Real estate market values -10% -5,275 -5,035
Real estate market values +10% 5,275 5,035
Further significant risk management tools – along with the various stress tests used to estimate the loss potential under extreme market conditions – include sensitivity and duration analyses and our asset / liability management (ALM). The internal capital model provides us with quantitative support for the investment strategy as well as a broad diversity of VaR calculations. In addition, tactical duration ranges are in place, within which the portfolio can be positioned opportunistically according to market expectations. The parameters for these ranges are directly linked to our calculated risk-bearing capacity. It should be borne in mind that the issued subordinated bonds and resulting induced interest rate exposure are actively factored into our ALM. Please note, that also the subordinated liabilities considered in Section D.5 and the resulting interest rate risk are actively managed in the ALM process.
Equity risks derive from the possibility of adverse changes in the value of equities, equity derivatives or equity index derivatives in our portfolio. Their relevance to our investments decreased sharply in the year under review, however, because we liquidated our holdings of non-strategic listed equities and equity funds at the end of the previous year. This leaves only a minimal portfolio in the context of strategic holdings. Our exposure to the private equity market remains unchanged. Changes in fair value here tend to be prompted less by general market conditions and more by entity-specific assessments. The risks are associated principally with the business model and profitability and less so with the interest rate component in the consideration of cash flow forecasts.
By far the largest part of our assets under own management is invested in fixed-income securities. They are exposed to the interest rate risk. Declining market yields lead to increases and rising market yields to decreases in the fair value of the fixed-income securities portfolio. The credit spread risk should also be mentioned. The credit spread refers to the interest rate differential between a risk-entailing bond and risk-free bond with the same maturity. Changes in these risk
56 Hannover Rück | Solvency and Financial Condition Report
premiums, which are observable on the market, result – analogously to changes in pure market yields – in changes in the fair values of the corresponding securities. We minimise interest rate risks by matching the durations of payments from fixed-income securities as closely as possible with the projected future payment obligations under our insurance contracts.
Foreign exchange risks are especially relevant if there is a currency imbalance between the technical liabilities and the assets. Through matching of currency distributions on the assets and liabilities side, we reduce this risk on the basis of the individual balance sheets within the Group. The short-term Value at Risk therefore does not include quantification of the foreign exchange risks. We regularly compare the liabilities per currency with the covering assets and optimise the currency coverage by regrouping assets. In so doing, we make allowance for collateral conditions such as different accounting requirements. Remaining currency surpluses are systematically quantified and monitored within the scope of economic modelling.
Real estate risks result from the possibility of adverse changes in the value of real estate held either directly or through fund units. They may be caused by a deterioration in particular qualities of a property or by a general downslide in market values. Real estate risks continued to grow in importance for our portfolio owing to our ongoing involvement in this sector. We spread these risks through broadly diversified investments in high-quality markets worldwide; each investment is preceded by detailed analyses of the property, manager and market concerned.
We use derivative financial instruments to a limited extent, only. The primary purpose of such financial instruments is to hedge against potentially adverse developments on capital markets. A portion of our cash flows from the insurance business as well as foreign exchange risks arising because currency matching cannot be efficiently achieved are hedged to some extent using forward exchange transactions. Hannover Rück holds further derivative financial instruments to hedge interest rate risks from loans taken out to finance real estate. In addition, Hannover Rück holds hedges in the form of equity swaps to hedge price risks in connection with the stock appreciation rights granted under the share award plan. These are intended to neutralise changes in the fair values of the awarded stock appreciation rights. Contracts are concluded with reliable counterparties and for the most part collateralised on a daily basis so as to avoid credit risks associated with the use of such transactions. The remaining exposures are controlled according to the restrictive parameters set out in our investment guidelines.
Derivatives connected with the technical account play a minor role in Hannover Rück’s portfolio.
Our investments entail credit risks that arise out of the risk of a failure to pay (interest and / or capital repayment) or a change in the credit status (rating downgrade) of issuers of securities. We attach equally vital importance to exceptionally broad diversification as we do to credit assessment conducted on the basis of the quality criteria set out in the investment guidelines. We measure credit risks in the first place using the standard market credit risk components, especially the probability of default and the potential amount of loss – making allowance for any collateral and the ranking of the individual instruments depending on their effect in each case.
We then assess the credit risk first on the level of individual securities (issues) and in subsequent steps on a combined basis on the issuer level. In order to limit the risk of counterparty default we set various limits on the issuer and issue level as well as in the form of dedicated rating quotas. A comprehensive system of risk reporting ensures timely reporting to the functions entrusted with risk management.
Generally, Hannover Rück aligns its investment portfolio with the principles of a balanced risk / return ratio along with a broad level of diversification. Accordingly, we subsequently counteract the risk concentrations that nevertheless arise on individual asset classes with the broadest possible
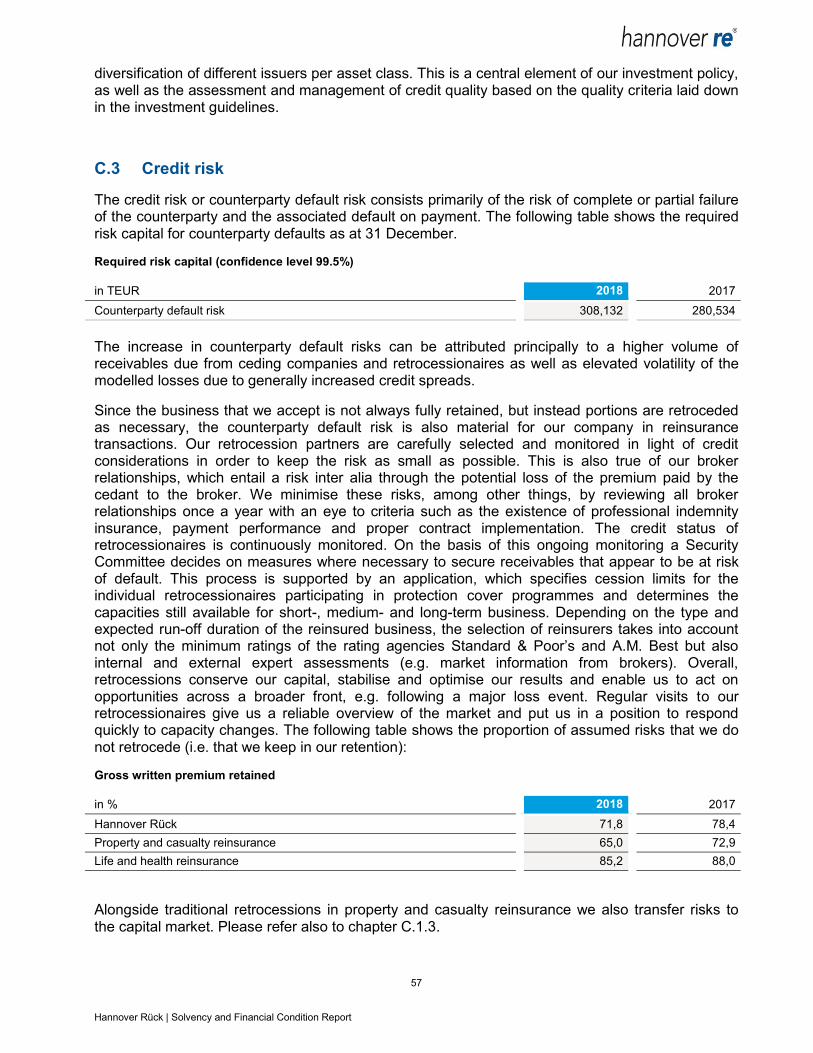
57 Hannover Rück | Solvency and Financial Condition Report
diversification of different issuers per asset class. This is a central element of our investment policy, as well as the assessment and management of credit quality based on the quality criteria laid down in the investment guidelines.
C.3 Credit risk
The credit risk or counterparty default risk consists primarily of the risk of complete or partial failure of the counterparty and the associated default on payment. The following table shows the required risk capital for counterparty defaults as at 31 December.
Required risk capital (confidence level 99.5%)
in TEUR 2018 2017
Counterparty default risk 308,132 280,534
The increase in counterparty default risks can be attributed principally to a higher volume of receivables due from ceding companies and retrocessionaires as well as elevated volatility of the modelled losses due to generally increased credit spreads.
Since the business that we accept is not always fully retained, but instead portions are retroceded as necessary, the counterparty default risk is also material for our company in reinsurance transactions. Our retrocession partners are carefully selected and monitored in light of credit considerations in order to keep the risk as small as possible. This is also true of our broker relationships, which entail a risk inter alia through the potential loss of the premium paid by the cedant to the broker. We minimise these risks, among other things, by reviewing all broker relationships once a year with an eye to criteria such as the existence of professional indemnity insurance, payment performance and proper contract implementation. The credit status of retrocessionaires is continuously monitored. On the basis of this ongoing monitoring a Security Committee decides on measures where necessary to secure receivables that appear to be at risk of default. This process is supported by an application, which specifies cession limits for the individual retrocessionaires participating in protection cover programmes and determines the capacities still available for short-, medium- and long-term business. Depending on the type and expected run-off duration of the reinsured business, the selection of reinsurers takes into account not only the minimum ratings of the rating agencies Standard & Poor’s and A.M. Best but also internal and external expert assessments (e.g. market information from brokers). Overall, retrocessions conserve our capital, stabilise and optimise our results and enable us to act on opportunities across a broader front, e.g. following a major loss event. Regular visits to our retrocessionaires give us a reliable overview of the market and put us in a position to respond quickly to capacity changes. The following table shows the proportion of assumed risks that we do not retrocede (i.e. that we keep in our retention):
Gross written premium retained
in % 2018 2017
Hannover Rück 71,8 78,4
Property and casualty reinsurance 65,0 72,9
Life and health reinsurance 85,2 88,0
Alongside traditional retrocessions in property and casualty reinsurance we also transfer risks to the capital market. Please refer also to chapter C.1.3.
58 Hannover Rück | Solvency and Financial Condition Report
Counterparty default risks are also relevant in life and health reinsurance, among other things because we finance acquisition costs for our ceding companies. Our clients, retrocessionaires and broker relationships as well as our investments are therefore carefully evaluated and limited in light of credit considerations and are constantly monitored and controlled within the scope of our system of limits and thresholds.
Finally, short-term deposits with banks are exposed to bad debt risk.
For very few of the risk-remote structured transactions Hannover Rück provides a specific parental guarantee to the client. These parental guarantees ensure payment of obligations under the specified structured transaction by Hannover Rück in the event that the assuming subsidiary is unable to meet such financial obligations. As each of these parental guarantees refers to exactly one specified transaction and is worded such that any potential payment can only materialize once at one legal entity of Hannover Rück, either at the subsidiary under the transaction itself, or at Hannover Rück under the parental guarantee, the existence of a parental guarantee has no impact on the underwriting.
C.4 Liquidity risk
Liquidity risk refers to the risk of being unable to meet financial obligations when they become due. Liquidity risk consists of the refinancing risk (necessary cash could not be obtained or could only be obtained at increased costs) and the market liquidity risk (financial market transactions could only be completed at a poorer price than expected due to a lack of market liquidity). Core elements of the liquidity management of our investments are, in the first place, management of the maturity structure of our investments on the basis of the planned payment profiles arising out of our technical liabilities and, secondly, regular liquidity planning as well as the asset structure of the investments. Above and beyond the foreseeable payments, unexpected and exceptionally large payments may pose a threat to liquidity. In reinsurance business, however, significant events (major losses) are normally paid out after a lead time that can be reliably planned. As part of our liquidity management we have nevertheless defined asset holdings that have proven to be highly liquid – even in times of financial stress such as the 2008 financial crisis. In addition, we manage the liquidity of the portfolio by checking on each trading day the liquidity of the instruments contained therein. These measures serve to effectively reduce the liquidity risk.
The “total amount of the expected profit included in future premiums” required by Art. 295 (5) of the Delegated Regulation 2015/35 amounts to TEUR 1.703.325 as at 31 December. This value is also available at the Quantitative Reporting Template S.23.01.01, item R0790. We do not use this figure for our liquidity management. However, it has to be stated in this section according to regulatory requirements.
C.5 Operational risk
Operational risks refer to the risk of losses occurring because of the inadequacy or failure of internal processes or as a result of events triggered by employee-related, system-induced or external factors. In contrast to underwriting risks (e.g. the reserve risk), which we enter into in a deliberate and controlled manner in the context of our business activities, operational risks are an indivisible part of our business activities. The focus is therefore on risk avoidance minimisation.
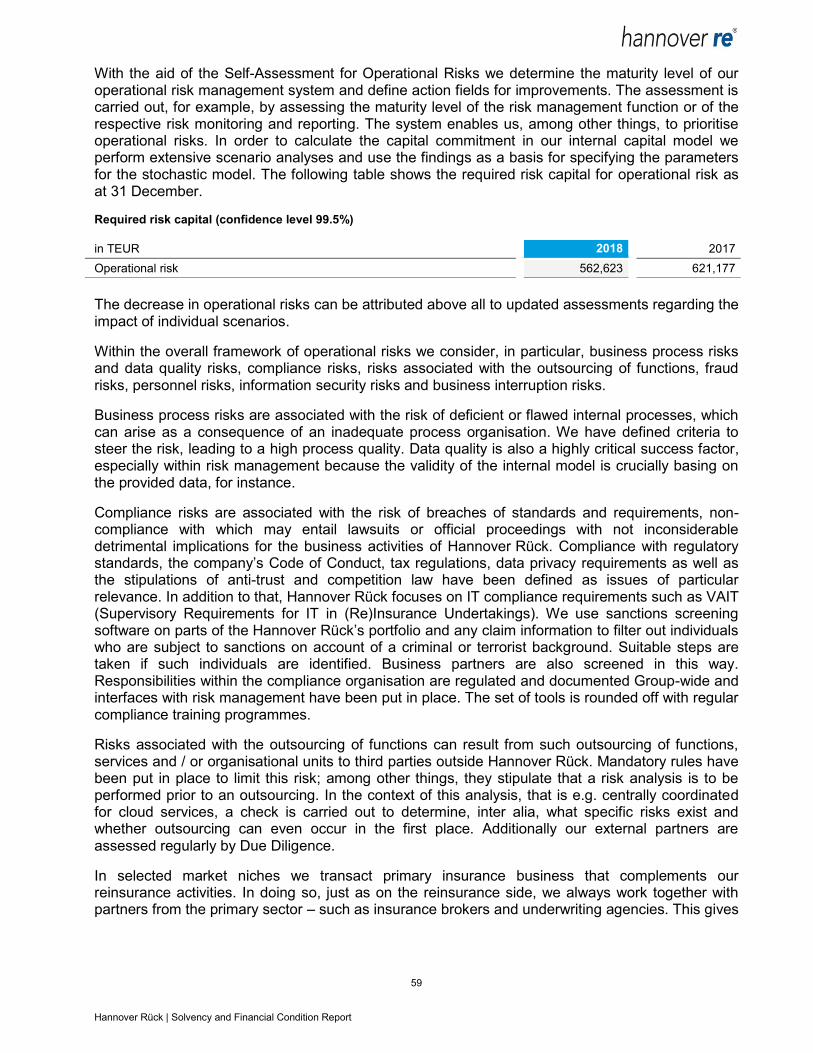
59 Hannover Rück | Solvency and Financial Condition Report
With the aid of the Self-Assessment for Operational Risks we determine the maturity level of our operational risk management system and define action fields for improvements. The assessment is carried out, for example, by assessing the maturity level of the risk management function or of the respective risk monitoring and reporting. The system enables us, among other things, to prioritise operational risks. In order to calculate the capital commitment in our internal capital model we perform extensive scenario analyses and use the findings as a basis for specifying the parameters for the stochastic model. The following table shows the required risk capital for operational risk as at 31 December.
Required risk capital (confidence level 99.5%)
in TEUR 2018 2017
Operational risk 562,623 621,177
The decrease in operational risks can be attributed above all to updated assessments regarding the impact of individual scenarios.
Within the overall framework of operational risks we consider, in particular, business process risks and data quality risks, compliance risks, risks associated with the outsourcing of functions, fraud risks, personnel risks, information security risks and business interruption risks.
Business process risks are associated with the risk of deficient or flawed internal processes, which can arise as a consequence of an inadequate process organisation. We have defined criteria to steer the risk, leading to a high process quality. Data quality is also a highly critical success factor, especially within risk management because the validity of the internal model is crucially basing on the provided data, for instance.
Compliance risks are associated with the risk of breaches of standards and requirements, non-compliance with which may entail lawsuits or official proceedings with not inconsiderable detrimental implications for the business activities of Hannover Rück. Compliance with regulatory standards, the company’s Code of Conduct, tax regulations, data privacy requirements as well as the stipulations of anti-trust and competition law have been defined as issues of particular relevance. In addition to that, Hannover Rück focuses on IT compliance requirements such as VAIT (Supervisory Requirements for IT in (Re)Insurance Undertakings). We use sanctions screening software on parts of the Hannover Rück’s portfolio and any claim information to filter out individuals who are subject to sanctions on account of a criminal or terrorist background. Suitable steps are taken if such individuals are identified. Business partners are also screened in this way. Responsibilities within the compliance organisation are regulated and documented Group-wide and interfaces with risk management have been put in place. The set of tools is rounded off with regular compliance training programmes.
Risks associated with the outsourcing of functions can result from such outsourcing of functions, services and / or organisational units to third parties outside Hannover Rück. Mandatory rules have been put in place to limit this risk; among other things, they stipulate that a risk analysis is to be performed prior to an outsourcing. In the context of this analysis, that is e.g. centrally coordinated for cloud services, a check is carried out to determine, inter alia, what specific risks exist and whether outsourcing can even occur in the first place. Additionally our external partners are assessed regularly by Due Diligence.
In selected market niches we transact primary insurance business that complements our reinsurance activities. In doing so, just as on the reinsurance side, we always work together with partners from the primary sector – such as insurance brokers and underwriting agencies. This gives
60 Hannover Rück | Solvency and Financial Condition Report
rise to risks associated with such distribution channels, although these are minimised through the careful selection of agencies, mandatory underwriting guidelines and regular checks.
The proper functioning and competitiveness of Hannover Rück can be attributed in large measure to the expertise and dedication of our staff. In order to minimise personnel risks, we pay special attention to the skills, experience and motivation of our employees and foster these qualities through outstanding personnel development and leadership activities. Regular employee surveys and the monitoring of turnover rates ensure that such risks are identified at an early stage and scope to take the necessary actions is created.
Fraud risks refer to the risk of intentional violations of laws or regulations by members of staff (internal fraud) and / or by externals (external fraud), in order to gain a personal advantage. This risk is reduced by the internal control system as well as by the audits conducted by Group Auditing on a Group-wide and line-independent basis.
Information security risks arise, inter alia, out of the risk of the inadequate integrity, confidentiality, availability or authenticity of systems and information. By way of example, losses and damage resulting from the unauthorised passing on of confidential information, the malicious overloading of important IT systems or from computer viruses are material to Hannover Rück. Given the broad spectrum of such IT-related risks, which do not only encompass information security but rather the complete sphere of operational risks (so called IT risks), a diverse range of steering and monitoring measures and organisational standards, including for example the requirement to conclude confidentiality agreements with service providers, have been put in place for the entire company. In addition, our employees are made more conscious of such security risks through practically oriented tools provided online in the intranet, by way of training opportunities and through a staff information campaign.
When it comes to reducing business interruption risks, the paramount objective is the quickest possible return to normal operations after a crisis, for example through implementation of existing contingency plans. Guided by internationally accepted standards, we have defined the key framework conditions and – among other measures – we have assembled a crisis team to serve as a temporary steering body in the event of an emergency. The system is complemented by regular exercises and tests, which e.g. confirm our IT recovery ability. A leaflet is available setting out the correct behaviour in the event of a business interruption; this condenses in compact form the key information that all employees need to know, such as the information channels to use in a crisis situation.
Regular quarterly risk reporting to the Risk Committee and the Executive Board takes place with regard to all operational risks. Risks are also evaluated as part of the reporting.
C.6 Other material risks
Of material importance to our company in the category of other risks are primarily emerging risks, strategic risks and reputational risks. Furthermore we are monitoring the contagion risk of Hannover Rück being part of the Hannover Re Group and therefore of the Talanx Group.
C.6.1 Emerging risks
The hallmark of emerging risks is that the content of such risks cannot as yet be reliably assessed – especially on the underwriting side with respect to our portfolio. Such risks evolve gradually from
61 Hannover Rück | Solvency and Financial Condition Report
weak signals to unmistakable tendencies. It is therefore vital to detect these risks at an early stage and then determine their relevance. For the purpose of early detection we have developed an efficient process that spans divisions and lines of business and we have ensured its linkage to risk management. Operational implementation is handled by an expert working group assembled specially for this task. The analyses performed by this working group are used Group-wide in order to pinpoint any necessary measures (e.g. the implementation of contractual exclusions or the development of new reinsurance products). By way of example, risks associated with possible climate change are analysed by this working group. Global warming would affect not only natural perils, but also human health, the world economy, the agricultural sector and much more besides. These problematic issues may also have implications for our treaty portfolio – in the form of not just risks but also opportunities, such as increased demand for reinsurance products. Further examples of emerging risks include pandemics (transnational and transcontinental spreading of a disease), supply chain risks and autonomous machines. In 2018, specific attention has been given to climate change risk, artificial intelligence and mircoplastics.
C.6.2 Strategic risks
Strategic risks derive from a possible imbalance between the corporate strategy of Hannover Rück and the constantly changing general business environment. Such an imbalance might be caused, for example, by incorrect strategic policy decisions, a failure to consistently implement the defined strategies and business plans or an incorrect allocation of resources. We therefore regularly review our corporate strategy in a multi-step procedure and adjust our processes and the resulting guidelines as and when required. We have defined performance criteria and indicators for operational implementation of the strategic principles and objectives; these are authoritative when it comes to determining fulfilment of the various targets. With the “Strategy Cockpit” the Executive Board and responsible managers have at their disposal a strategy tool that assists them with the planning, elaboration and management of strategic objectives and measures and safeguards their overall perspective on the company and its strategic risks. The process for the management of strategic risks continues to be assessed annually as part of the monitoring of business process risks.
The terms of the United Kingdom’s withdrawal from the European Union have still not been determined. The possibility of the UK leaving the EU without an agreement continues to exist. The Hannover Re Group is prepared for this and all other scenarios and a Group-wide working group has been set up to address readiness measures. The Hannover Re Life UK Branch will be materially affected. In order to be able to continue its activities even after a “hard” Brexit, an application to operate under the so-called temporary permissions regime (TPR) has been filed and already approved by the financial regulator. Increased administrative expenses and higher capital costs cannot be ruled out over the medium term. Argenta Holdings Limited is a wholly owned subsidiary of Hannover Rück that operates on a standalone basis in the United Kingdom and is already authorised as a member of Lloyd’s. We also write reinsurance business in the United Kingdom through companies in Hannover, Ireland and Bermuda. In this regard we do not anticipate any significant changes as a result of Brexit. All in all, our current analyses indicate that the implications of Brexit are manageable for Hannover Rück.
The changes in tax legislation adopted by the US administration at the end of 2017 entered into force on 1 January 2018. They provide for new tax regulations that have far-reaching implications for subsidiaries operating in the United States. On the one hand, the reform cuts the corporate tax rate from 35% to 21%. On the other hand, the legislative package includes the introduction of the so-called “Base Erosion and Anti-Abuse Tax” (BEAT). In this connection, premiums for ceded insurance risks within the corporate group are also included in the taxable base and will in future be

62 Hannover Rück | Solvency and Financial Condition Report
taxed at a rate of 5% to 12.5% (rising over the next nine years). We have undertaken some restructuring activities within the Group in order to avert this increased burden of taxation. Most notably, US life reinsurance business previously written through Hannover Re Ireland was transferred to a Bermuda-based subsidiary. The latter is subject to US taxation, thereby avoiding a substantial tax loss; the solvency ratio decreased, however, due to a higher risk margin for the Hannover Re Group.
C.6.3 Reputational risks
Reputational risks refer to the risk that the trust put in our company by clients, shareholders, employees or the public at large may be damaged. This risk has the potential to jeopardise the business foundation of Hannover Rück. A good corporate reputation is therefore an indispensable prerequisite for our core business as a reinsurer. Reputational risks may arise out of all business activities conducted by Hannover Rück. Reputational damage may be caused, inter alia, by a data mishap that becomes public knowledge or financial difficulties on account of an underwriting risk. In addition to the risk identification methods already described, we use a number of different techniques for risk minimisation, such as our defined communication channels (e.g. Crisis Communication Guideline), a professional approach to corporate communications, tried and tested processes for specific crisis scenarios as well as our established Code of Conduct.
The Code of Conduct , in particular, and the system of governance described in chapter B are the basis for minimizing any sources of reputational risk.
C.6.4 Contagion risks
Contagion risk refers to the risks originated by interactions between individual entities owned by Hannover Rück, or in respect of the ultimate parent of Hannover Re, the HDI Group. More precisely, contagion risk is the propagation of the effect of a failure or financial distress of an institution in a sequential manner to other institutions, markets or systems, or to other parts of a financial group or financial conglomerate.
Hannover Rück manages this risk by a strict look-through approach in its management systems.
C.7 Any other information
There is no other information to be reported.

63 Hannover Rück | Solvency and Financial Condition Report
D. Valuation for Solvency Purposes
General valuation principles
The valuation of assets and liabilities pursuant to Solvency II is based on economic and market-consistent principles, and takes account of inherent risks.
In line with this concept the assets and liabilities are valued as follows:
Assets should be valued according to the amount with which they could be exchanged between knowledgeable willing parties in an arm’s length transaction.
Liabilities should be valued according to the amount with which they could be exchanged between knowledgeable willing parties in an arm’s length transaction.
The time value of money should be reflected, i.e. cash flows have to be discounted. The discount rate should take the long-term asset management strategy into account, i.e. whether the company acts as held-to-maturity investor or not.
When valuing liabilities, no value adjustments are made in order to account for the creditworthiness of the respective insurance or reinsurance company.
The valuation of assets and liabilities is based on the assumption that the company will continue its business activity (“going concern principle”).
Individual assets and liabilities are valued separately.
Concepts of materiality shall apply. Absent or erroneous information pertaining to items shall be deemed significant if it could influence the individual or aggregated business decisions of the recipients.
Simplifications may be applied when the method is deemed appropriate for the type, scope and complexity of the inherent risk.
The underlying principle used for determining the market values of assets and liabilities, with the exception of technical provisions, is the valuation principle pursuant to International Accounting Standards, as was adopted by the EU Commission pursuant to the Directive (EC) No. 1606/2002. For example, the guideline for determining fair values pursuant to IFRS 13 serves as a source of orientation.
The value of technical provisions corresponds to the current amount an insurance or reinsurance company would have to pay if they were to transfer their insurance and reinsurance obligations immediately to another insurance or reinsurance company. Technical provisions must be calculated in a prudent, reliable and objective manner, and must display market consistency. The value of underwriting provisions shall be largely equal to the sum of a “best estimate” and a risk margin:
The best estimate liability (BEL) is the present value of all future cash flows.
The calculation of the risk margin is done using a Cost of Capital approach.
Only a small part of the cash flows from underwriting payables can be recreated by financial market products.
Any valuation methods used must always work in sync with Article 75, respectively Articles 77 to 82 and Article 86 of the Directive 2009/138/EC.

64 Hannover Rück | Solvency and Financial Condition Report
As per 31 December 2018, Hannover Rück makes use of the static volatility adjustment for the first time. The impact of the application of the volatility adjustment is displayed in section D.2.
Assessing active markets
In the course of valuing assets, it is necessary to assess as to whether a market is either active or not. Only when a market is active may the current value be taken directly from these markets or derived from comparable assets traded there, in order to determine the market value of assets. If a market cannot be categorised as active, the market value is to be determined using valuation models. Whether or not a market can be viewed as an active market hinges on a discretionary decision regarding the type of financial instruments and local markets. At Hannover Rück this is, however, based on the following, predetermined parameters.
Business transactions occur with sufficient frequency and corresponding volume, so that price information is continuously available
The products which are traded on the market are homogeneous
Contractually willing buyers / sellers can, as a rule, be found at any time
Prices are freely accessible to the public
An active market is deemed not to exist when, due to the complete and long-term decline in buyers and/or sellers, market liquidity is no longer established. Should transactions be verified as resulting exclusively from forced deals, compulsory liquidations or distressed sales, this is just as much an indicator for an inactive market as are high bid / ask spreads.
In the event that an inactive market has been verified, we use valuation models for the calculation of market values. Please refer to section D.4.
Solvency II balance sheet
We show our Solvency II balance sheet as of 31 December 2018 on the following two pages. The individual items are explained in the following subsections.
In the headings of the subsections of “D.1 Assets” and “D.3 Other Liabilities”, we use the item designations from EIOPA for improved readability and clear assignment of the sub-chapters to the corresponding items in the Solvency II balance sheet.

65 Hannover Rück | Solvency and Financial Condition Report
in TEUR Item 2018 2017
Assets
Intangible assets R0030
Deferred tax assets R0040 187,067 238,065
Pension benefit surplus R0050
Property, plant & equipment held for own use R0060 54,740 54,754
Investments (other than assets held for index-linked and unit-linked contracts) R0070 31,995,392 29,317,717
Property (other than for own use) R0080 17,132 14,306
Holdings in related undertakings, including participations R0090 9,894,599 9,007,860
Equities R0100 5,193 5,461
Equities - listed R0110 5,193 5,461
Bonds R0130 19,980,549 17,719,926
Government Bonds R0140 10,693,573 8,975,222
Corporate Bonds R0150 8,675,226 8,085,516
Structured notes R0160 143,128 196,022
Collateralised securities R0170 468,622 463,166
Collective Investments Undertakings R0180 1,746,523 1,885,209
Derivatives R0190 45,853 25,146
Deposits other than cash equivalents R0200 305,542 659,810
Other investments R0210
Assets held for index-linked and unit-linked contracts R0220
Loans and mortgages R0230 701,360
Other loans and mortgages R0260 701,360
Reinsurance recoverables from: R0270 3,497,229 2,783,975
Non-life and health similar to non-life R0280 3,026,701 2,328,703
Non-life excluding health R0290 2,820,873 2,136,213
Health similar to non-life R0300 205,828 192,490
Life and health similar to life, excluding health and index-linked and unit-linked R0310 470,528 455,273
Health similar to life R0320 359,428 338,054
Life excluding health and index-linked and unit-linked R0330 111,100 117,219
Life index-linked and unit-linked R0340
Deposits to cedants R0350 402,513 2,042,574
Insurance and intermediaries receivables R0360 2,840,556 2,408,920
Reinsurance receivables R0370 81,013 146,977
Receivables (trade, not insurance) R0380 563,885 376,464
Own shares (held directly) R0390
Amounts due in respect of own fund items or initial fund called up but not yet paid in R0400
Cash and cash equivalents R0410 388,560 267,997
Any other assets, not elsewhere shown R0420 82,349 75,467
Total assets R0500 40,093,303 38,414,272
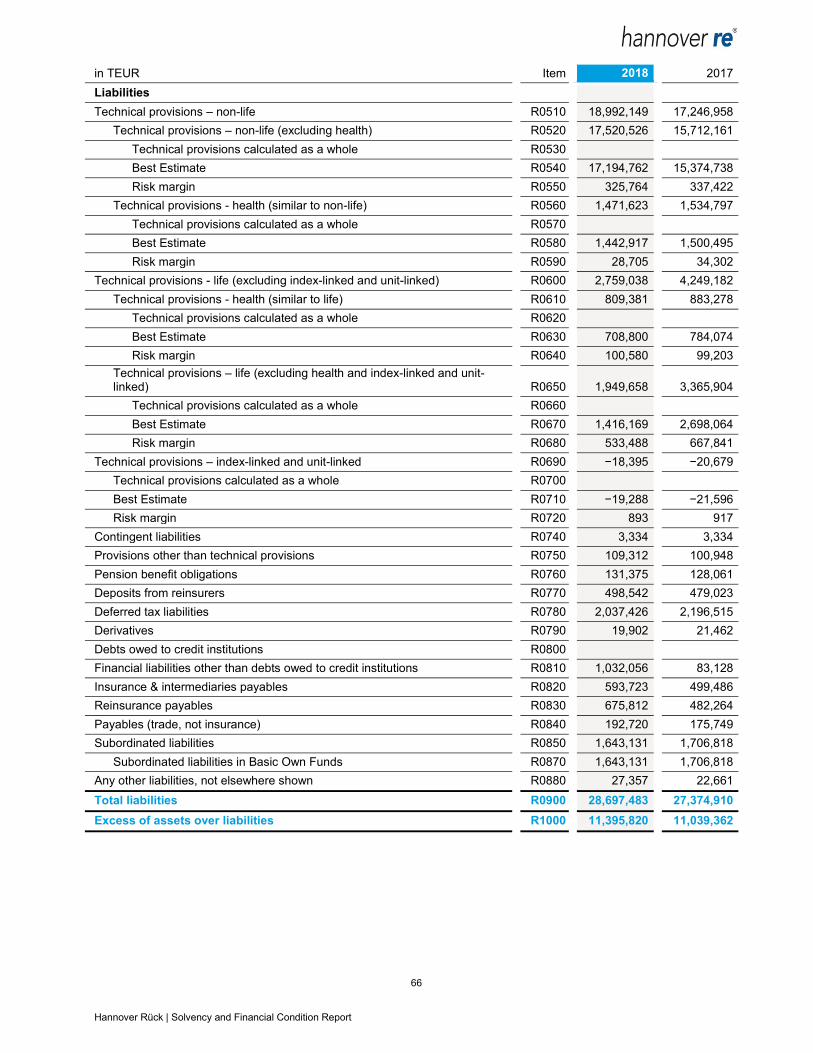
66 Hannover Rück | Solvency and Financial Condition Report
in TEUR Item 2018 2017
Liabilities
Technical provisions – non-life R0510 18,992,149 17,246,958
Technical provisions – non-life (excluding health) R0520 17,520,526 15,712,161
Technical provisions calculated as a whole R0530
Best Estimate R0540 17,194,762 15,374,738
Risk margin R0550 325,764 337,422
Technical provisions - health (similar to non-life) R0560 1,471,623 1,534,797
Technical provisions calculated as a whole R0570
Best Estimate R0580 1,442,917 1,500,495
Risk margin R0590 28,705 34,302
Technical provisions - life (excluding index-linked and unit-linked) R0600 2,759,038 4,249,182
Technical provisions - health (similar to life) R0610 809,381 883,278
Technical provisions calculated as a whole R0620
Best Estimate R0630 708,800 784,074
Risk margin R0640 100,580 99,203
Technical provisions – life (excluding health and index-linked and unit-linked) R0650 1,949,658 3,365,904
Technical provisions calculated as a whole R0660
Best Estimate R0670 1,416,169 2,698,064
Risk margin R0680 533,488 667,841
Technical provisions – index-linked and unit-linked R0690 −18,395 −20,679
Technical provisions calculated as a whole R0700
Best Estimate R0710 −19,288 −21,596
Risk margin R0720 893 917
Contingent liabilities R0740 3,334 3,334
Provisions other than technical provisions R0750 109,312 100,948
Pension benefit obligations R0760 131,375 128,061
Deposits from reinsurers R0770 498,542 479,023
Deferred tax liabilities R0780 2,037,426 2,196,515
Derivatives R0790 19,902 21,462
Debts owed to credit institutions R0800
Financial liabilities other than debts owed to credit institutions R0810 1,032,056 83,128
Insurance & intermediaries payables R0820 593,723 499,486
Reinsurance payables R0830 675,812 482,264
Payables (trade, not insurance) R0840 192,720 175,749
Subordinated liabilities R0850 1,643,131 1,706,818
Subordinated liabilities in Basic Own Funds R0870 1,643,131 1,706,818
Any other liabilities, not elsewhere shown R0880 27,357 22,661
Total liabilities R0900 28,697,483 27,374,910
Excess of assets over liabilities R1000 11,395,820 11,039,362

67 Hannover Rück | Solvency and Financial Condition Report
D.1 Assets
D.1.1 Intangible assets R0030
Differences in valuation
Values as of 31.12.2018 in TEUR Solvency II HGB
Intangible assets - 65,655
Intangible assets are stated at zero in accordance with Art. 12 No. 2 of the Delegated Regulation under Solvency II. The exceptional circumstances listed under Art. 12 No. 2 of the Delegated Regulation do not apply, due to the fact that intangible assets can neither be disposed of individually nor traded on an active market for similar or identical intangible assets.
In accordance with the German Commercial Code (HGB) a differentiation must be made as to whether it concerns purchased or internally generated intangible assets. While mandatory capitalisation applies for purchased intangible assets, a right to capitalisation exists pursuant to Art. 248 (2) clause 1 of the German Commercial Code (HGB) for internally generated items classified under fixed assets, which is not, however, used by the company.
The commercial valuation of intangible assets is executed in line with the regulations stipulated in Sections 341 et seq. of the German Commercial Code (HGB). They are valued at acquisition cost less scheduled depreciation in line with the average useful life.
The valuation base in the commercial annual accounts stands at TEUR 65,655. This predominantly concerns the future capitalised income value of the Life portfolio of a branch, as well as software. These may not be capitalised in the Solvency II balance sheet for the above-stated reasons.
Comparison to prior year
in TEUR Solvency II 2018 Solvency II 2017
Intangible assets - -
In the financial year 2018 this balance sheet item did not change.
In comparison to the previous year, assumptions regarding the calculation of this balance sheet item were the same.
D.1.2 Deferred tax assets R0040
Differences in valuation
Values as of 31.12.2018 in TEUR Solvency II HGB
Deferred tax assets 187,067 -
In the Solvency II balance sheet, a deferred tax asset totalling TEUR 187,067 is stated as well as a deferred tax liability in the amount of TEUR 2,037,426. Consequently, a liability surplus has been created, the calculation of which is explained in more detail under the item “Deferred tax liabilities R0780”.
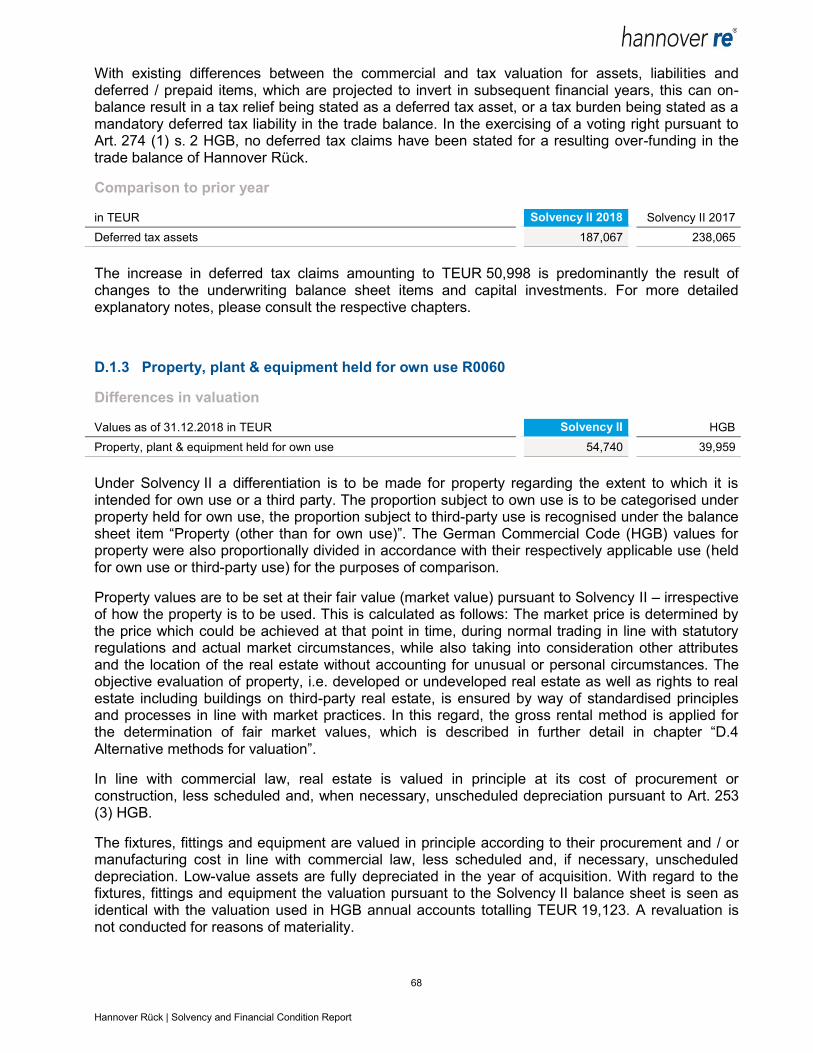
68 Hannover Rück | Solvency and Financial Condition Report
With existing differences between the commercial and tax valuation for assets, liabilities and deferred / prepaid items, which are projected to invert in subsequent financial years, this can on-balance result in a tax relief being stated as a deferred tax asset, or a tax burden being stated as a mandatory deferred tax liability in the trade balance. In the exercising of a voting right pursuant to Art. 274 (1) s. 2 HGB, no deferred tax claims have been stated for a resulting over-funding in the trade balance of Hannover Rück.
Comparison to prior year
in TEUR Solvency II 2018 Solvency II 2017
Deferred tax assets 187,067 238,065
The increase in deferred tax claims amounting to TEUR 50,998 is predominantly the result of changes to the underwriting balance sheet items and capital investments. For more detailed explanatory notes, please consult the respective chapters.
D.1.3 Property, plant & equipment held for own use R0060
Differences in valuation
Values as of 31.12.2018 in TEUR Solvency II HGB
Property, plant & equipment held for own use 54,740 39,959
Under Solvency II a differentiation is to be made for property regarding the extent to which it is intended for own use or a third party. The proportion subject to own use is to be categorised under property held for own use, the proportion subject to third-party use is recognised under the balance sheet item “Property (other than for own use)”. The German Commercial Code (HGB) values for property were also proportionally divided in accordance with their respectively applicable use (held for own use or third-party use) for the purposes of comparison.
Property values are to be set at their fair value (market value) pursuant to Solvency II – irrespective of how the property is to be used. This is calculated as follows: The market price is determined by the price which could be achieved at that point in time, during normal trading in line with statutory regulations and actual market circumstances, while also taking into consideration other attributes and the location of the real estate without accounting for unusual or personal circumstances. The objective evaluation of property, i.e. developed or undeveloped real estate as well as rights to real estate including buildings on third-party real estate, is ensured by way of standardised principles and processes in line with market practices. In this regard, the gross rental method is applied for the determination of fair market values, which is described in further detail in chapter “D.4 Alternative methods for valuation”.
In line with commercial law, real estate is valued in principle at its cost of procurement or construction, less scheduled and, when necessary, unscheduled depreciation pursuant to Art. 253 (3) HGB.
The fixtures, fittings and equipment are valued in principle according to their procurement and / or manufacturing cost in line with commercial law, less scheduled and, if necessary, unscheduled depreciation. Low-value assets are fully depreciated in the year of acquisition. With regard to the fixtures, fittings and equipment the valuation pursuant to the Solvency II balance sheet is seen as identical with the valuation used in HGB annual accounts totalling TEUR 19,123. A revaluation is not conducted for reasons of materiality.

69 Hannover Rück | Solvency and Financial Condition Report
The difference between the valuation found in the Solvency II balance sheet and the HGB annual accounts totalling TEUR 14,781 is almost completely attributable to the valuation of shares in the business facilities located in Hannover.
Comparison to prior year
in TEUR Solvency II 2018 Solvency II 2017
Property, plant & equipment held for own use 54,740 54,754
The underlying assumptions for the balance sheet item did not change in the reporting period.
D.1.4 Property (other than for own use) R0080
Differences in valuation
Values as of 31.12.2018 in TEUR Solvency II HGB
Property (other than for own use) 17,132 11,047
The valuation is made in principle in accordance with the description found in “Property, plant & equipment held for own use R0060”.
The difference between the Solvency II value and the value presented in the HGB annual accounts as at the balance sheet date amounts to TEUR 6,085 and it is exclusively attributable to the difference between the valuation methods under HGB and Solvency II. While under HGB, amortised acquisition costs are applied less scheduled depreciation, under Solvency II market values are used. Thus, the entire difference concerns hidden reserves.
Comparison to prior year
in TEUR Solvency II 2018 Solvency II 2017
Property (other than for own use) 17,132 14,306
The increase in the item value in the year under review is mainly due to the recognition of higher market values as the result of updated valuation reports.
D.1.5 Participations and related undertakings R0090
Differences in valuation
Values as of 31.12.2018 in TEUR Solvency II HGB
Holdings in related undertakings, including participations 9,894,599 7,317,664
Participations are stated at market values under Solvency II. There are no stock market prices available for the valuation of affiliated companies of Hannover Re. The market values of affiliated companies or participating interests are determined on the basis of Solcency II balance sheets or with the proportional Fair Value as defined in Art. 13 DVO. Liabilities are deducted from assets in order to determine the balance sheet equity surplus per affiliated company. All equity surpluses of affiliated companies, including participating interests, are shown in the balance sheet item. For reasons of materiality, some investments are stated at their IFRS investment value. In the reporting
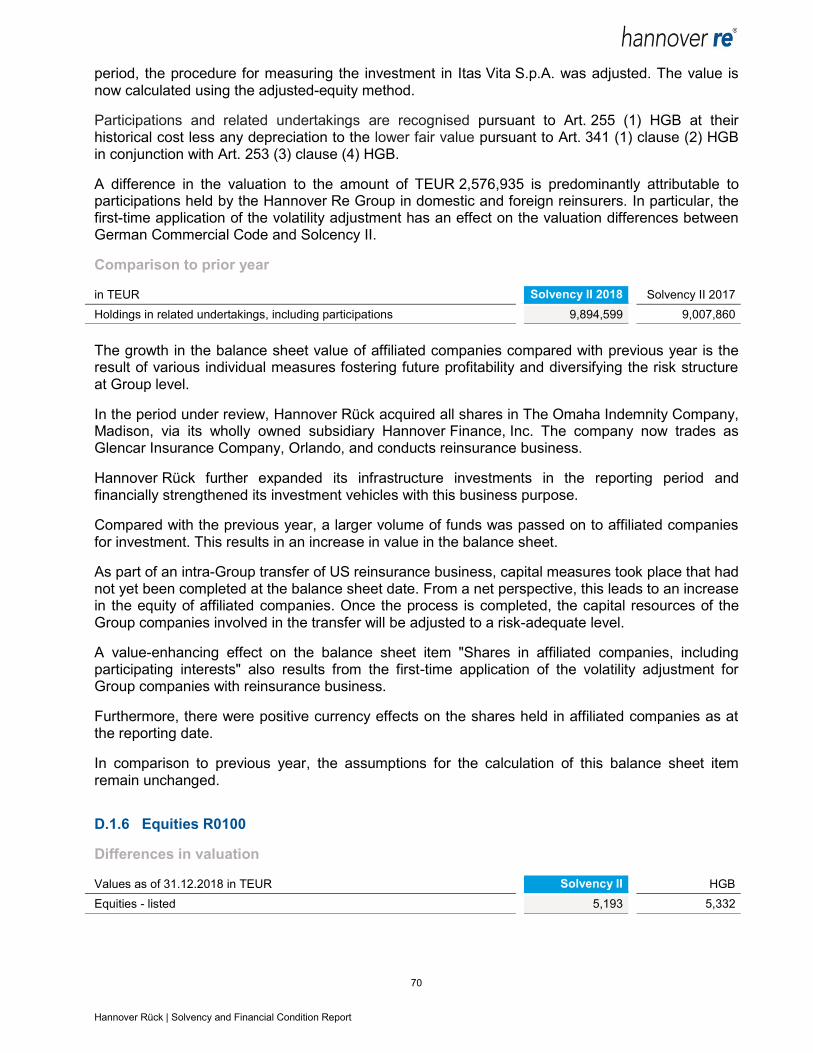
70 Hannover Rück | Solvency and Financial Condition Report
period, the procedure for measuring the investment in Itas Vita S.p.A. was adjusted. The value is now calculated using the adjusted-equity method.
Participations and related undertakings are recognised pursuant to Art. 255 (1) HGB at their historical cost less any depreciation to the lower fair value pursuant to Art. 341 (1) clause (2) HGB in conjunction with Art. 253 (3) clause (4) HGB.
A difference in the valuation to the amount of TEUR 2,576,935 is predominantly attributable to participations held by the Hannover Re Group in domestic and foreign reinsurers. In particular, the first-time application of the volatility adjustment has an effect on the valuation differences between German Commercial Code and Solcency II.
Comparison to prior year
in TEUR Solvency II 2018 Solvency II 2017
Holdings in related undertakings, including participations 9,894,599 9,007,860
The growth in the balance sheet value of affiliated companies compared with previous year is the result of various individual measures fostering future profitability and diversifying the risk structure at Group level.
In the period under review, Hannover Rück acquired all shares in The Omaha Indemnity Company, Madison, via its wholly owned subsidiary Hannover Finance, Inc. The company now trades as Glencar Insurance Company, Orlando, and conducts reinsurance business.
Hannover Rück further expanded its infrastructure investments in the reporting period and financially strengthened its investment vehicles with this business purpose.
Compared with the previous year, a larger volume of funds was passed on to affiliated companies for investment. This results in an increase in value in the balance sheet.
As part of an intra-Group transfer of US reinsurance business, capital measures took place that had not yet been completed at the balance sheet date. From a net perspective, this leads to an increase in the equity of affiliated companies. Once the process is completed, the capital resources of the Group companies involved in the transfer will be adjusted to a risk-adequate level.
A value-enhancing effect on the balance sheet item "Shares in affiliated companies, including participating interests" also results from the first-time application of the volatility adjustment for Group companies with reinsurance business.
Furthermore, there were positive currency effects on the shares held in affiliated companies as at the reporting date.
In comparison to previous year, the assumptions for the calculation of this balance sheet item remain unchanged.
D.1.6 Equities R0100
Differences in valuation
Values as of 31.12.2018 in TEUR Solvency II HGB
Equities - listed 5,193 5,332
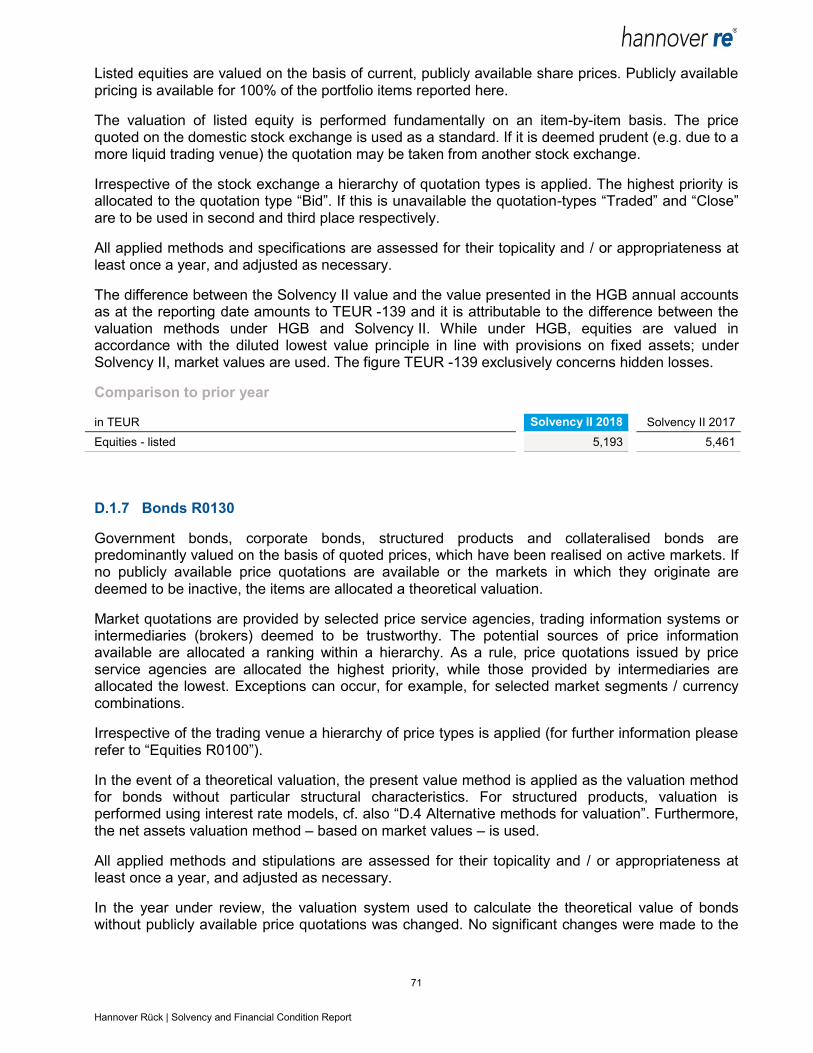
71 Hannover Rück | Solvency and Financial Condition Report
Listed equities are valued on the basis of current, publicly available share prices. Publicly available pricing is available for 100% of the portfolio items reported here.
The valuation of listed equity is performed fundamentally on an item-by-item basis. The price quoted on the domestic stock exchange is used as a standard. If it is deemed prudent (e.g. due to a more liquid trading venue) the quotation may be taken from another stock exchange.
Irrespective of the stock exchange a hierarchy of quotation types is applied. The highest priority is allocated to the quotation type “Bid”. If this is unavailable the quotation-types “Traded” and “Close” are to be used in second and third place respectively.
All applied methods and specifications are assessed for their topicality and / or appropriateness at least once a year, and adjusted as necessary.
The difference between the Solvency II value and the value presented in the HGB annual accounts as at the reporting date amounts to TEUR -139 and it is attributable to the difference between the valuation methods under HGB and Solvency II. While under HGB, equities are valued in accordance with the diluted lowest value principle in line with provisions on fixed assets; under Solvency II, market values are used. The figure TEUR -139 exclusively concerns hidden losses.
Comparison to prior year
in TEUR Solvency II 2018 Solvency II 2017
Equities - listed 5,193 5,461
D.1.7 Bonds R0130
Government bonds, corporate bonds, structured products and collateralised bonds are predominantly valued on the basis of quoted prices, which have been realised on active markets. If no publicly available price quotations are available or the markets in which they originate are deemed to be inactive, the items are allocated a theoretical valuation.
Market quotations are provided by selected price service agencies, trading information systems or intermediaries (brokers) deemed to be trustworthy. The potential sources of price information available are allocated a ranking within a hierarchy. As a rule, price quotations issued by price service agencies are allocated the highest priority, while those provided by intermediaries are allocated the lowest. Exceptions can occur, for example, for selected market segments / currency combinations.
Irrespective of the trading venue a hierarchy of price types is applied (for further information please refer to “Equities R0100”).
In the event of a theoretical valuation, the present value method is applied as the valuation method for bonds without particular structural characteristics. For structured products, valuation is performed using interest rate models, cf. also “D.4 Alternative methods for valuation”. Furthermore, the net assets valuation method – based on market values – is used.
All applied methods and stipulations are assessed for their topicality and / or appropriateness at least once a year, and adjusted as necessary.
In the year under review, the valuation system used to calculate the theoretical value of bonds without publicly available price quotations was changed. No significant changes were made to the
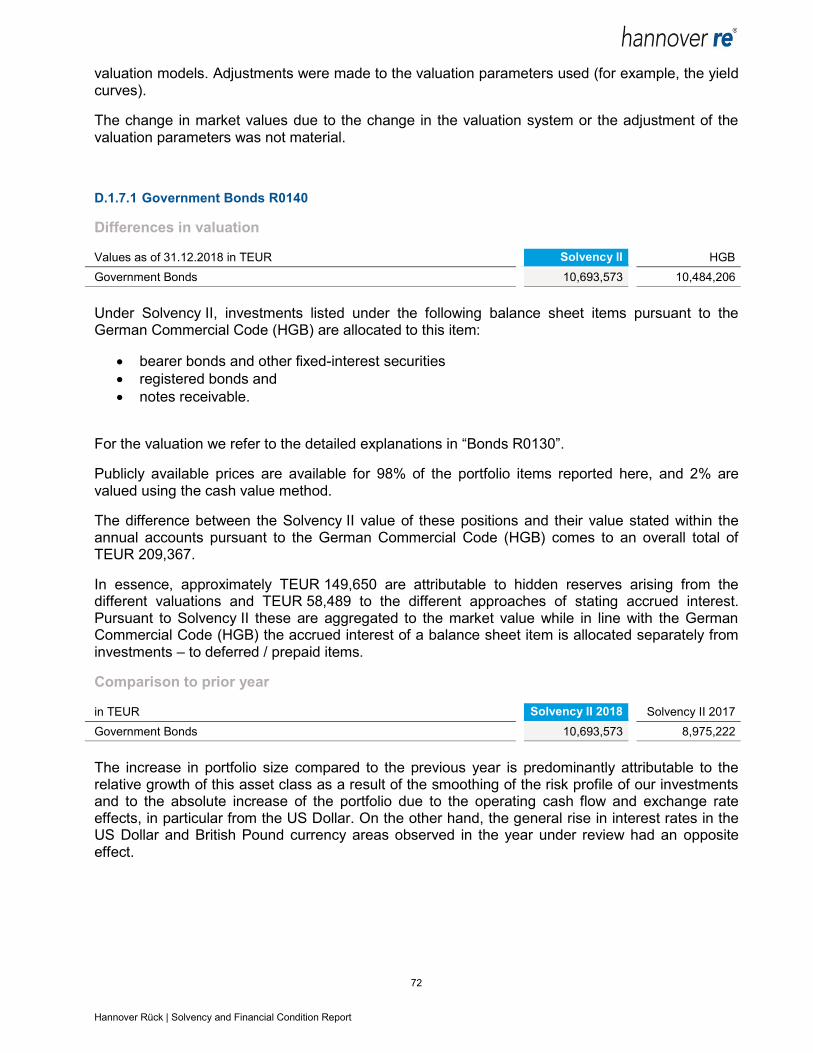
72 Hannover Rück | Solvency and Financial Condition Report
valuation models. Adjustments were made to the valuation parameters used (for example, the yield curves).
The change in market values due to the change in the valuation system or the adjustment of the valuation parameters was not material.
D.1.7.1 Government Bonds R0140
Differences in valuation
Values as of 31.12.2018 in TEUR Solvency II HGB
Government Bonds 10,693,573 10,484,206
Under Solvency II, investments listed under the following balance sheet items pursuant to the German Commercial Code (HGB) are allocated to this item:
bearer bonds and other fixed-interest securities
registered bonds and
notes receivable.
For the valuation we refer to the detailed explanations in “Bonds R0130”.
Publicly available prices are available for 98% of the portfolio items reported here, and 2% are valued using the cash value method.
The difference between the Solvency II value of these positions and their value stated within the annual accounts pursuant to the German Commercial Code (HGB) comes to an overall total of TEUR 209,367.
In essence, approximately TEUR 149,650 are attributable to hidden reserves arising from the different valuations and TEUR 58,489 to the different approaches of stating accrued interest. Pursuant to Solvency II these are aggregated to the market value while in line with the German Commercial Code (HGB) the accrued interest of a balance sheet item is allocated separately from investments – to deferred / prepaid items.
Comparison to prior year
in TEUR Solvency II 2018 Solvency II 2017
Government Bonds 10,693,573 8,975,222
The increase in portfolio size compared to the previous year is predominantly attributable to the relative growth of this asset class as a result of the smoothing of the risk profile of our investments and to the absolute increase of the portfolio due to the operating cash flow and exchange rate effects, in particular from the US Dollar. On the other hand, the general rise in interest rates in the US Dollar and British Pound currency areas observed in the year under review had an opposite effect.
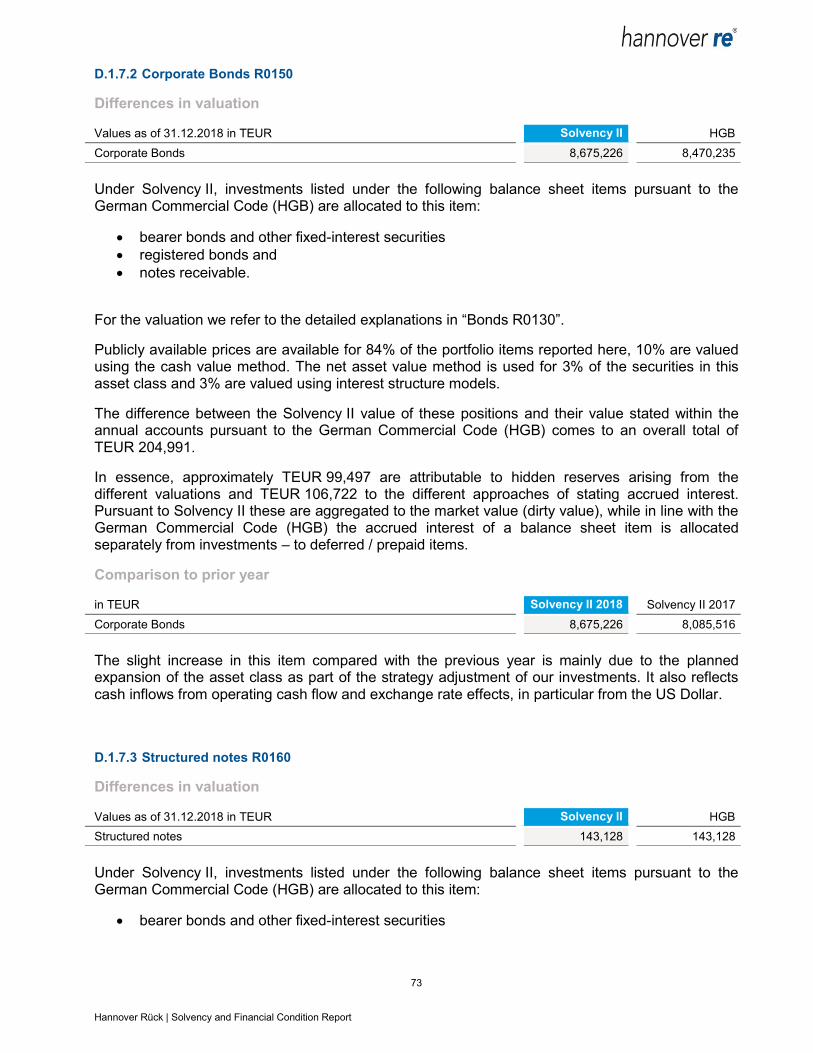
73 Hannover Rück | Solvency and Financial Condition Report
D.1.7.2 Corporate Bonds R0150
Differences in valuation
Values as of 31.12.2018 in TEUR Solvency II HGB
Corporate Bonds 8,675,226 8,470,235
Under Solvency II, investments listed under the following balance sheet items pursuant to the German Commercial Code (HGB) are allocated to this item:
bearer bonds and other fixed-interest securities
registered bonds and
notes receivable.
For the valuation we refer to the detailed explanations in “Bonds R0130”.
Publicly available prices are available for 84% of the portfolio items reported here, 10% are valued using the cash value method. The net asset value method is used for 3% of the securities in this asset class and 3% are valued using interest structure models.
The difference between the Solvency II value of these positions and their value stated within the annual accounts pursuant to the German Commercial Code (HGB) comes to an overall total of TEUR 204,991.
In essence, approximately TEUR 99,497 are attributable to hidden reserves arising from the different valuations and TEUR 106,722 to the different approaches of stating accrued interest. Pursuant to Solvency II these are aggregated to the market value (dirty value), while in line with the German Commercial Code (HGB) the accrued interest of a balance sheet item is allocated separately from investments – to deferred / prepaid items.
Comparison to prior year
in TEUR Solvency II 2018 Solvency II 2017
Corporate Bonds 8,675,226 8,085,516
The slight increase in this item compared with the previous year is mainly due to the planned expansion of the asset class as part of the strategy adjustment of our investments. It also reflects cash inflows from operating cash flow and exchange rate effects, in particular from the US Dollar.
D.1.7.3 Structured notes R0160
Differences in valuation
Values as of 31.12.2018 in TEUR Solvency II HGB
Structured notes 143,128 143,128
Under Solvency II, investments listed under the following balance sheet items pursuant to the German Commercial Code (HGB) are allocated to this item:
bearer bonds and other fixed-interest securities
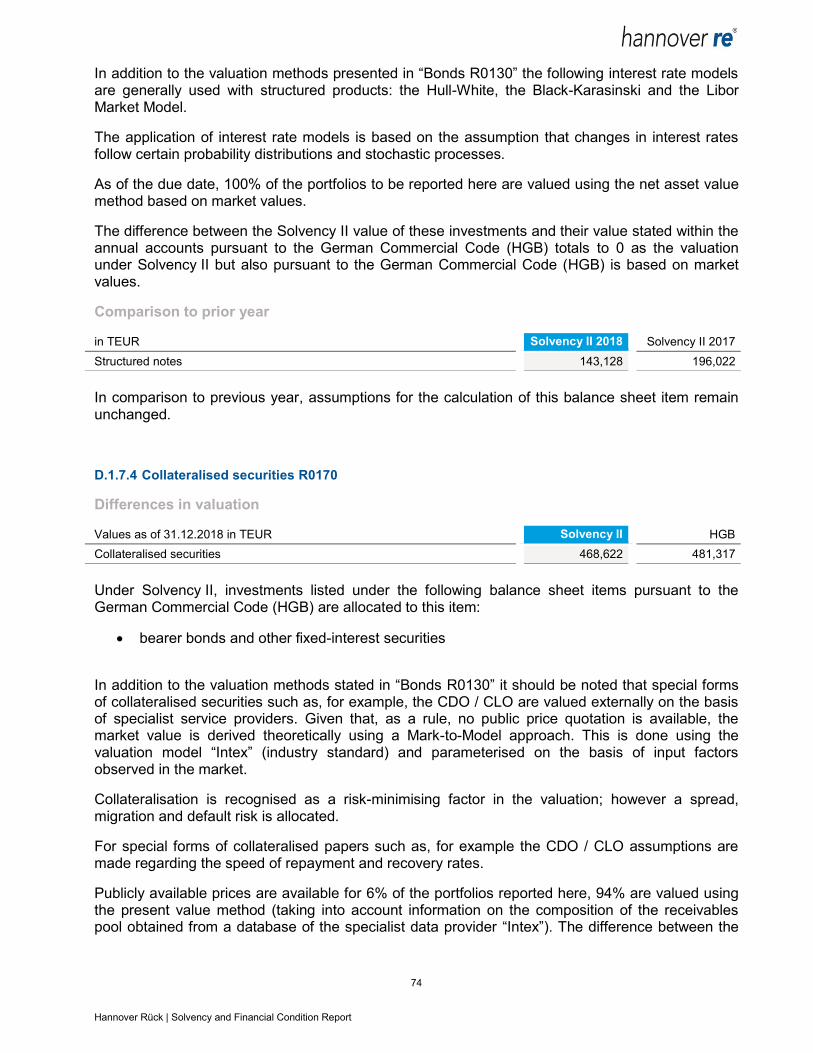
74 Hannover Rück | Solvency and Financial Condition Report
In addition to the valuation methods presented in “Bonds R0130” the following interest rate models are generally used with structured products: the Hull-White, the Black-Karasinski and the Libor Market Model.
The application of interest rate models is based on the assumption that changes in interest rates follow certain probability distributions and stochastic processes.
As of the due date, 100% of the portfolios to be reported here are valued using the net asset value method based on market values.
The difference between the Solvency II value of these investments and their value stated within the annual accounts pursuant to the German Commercial Code (HGB) totals to 0 as the valuation under Solvency II but also pursuant to the German Commercial Code (HGB) is based on market values.
Comparison to prior year
in TEUR Solvency II 2018 Solvency II 2017
Structured notes 143,128 196,022
In comparison to previous year, assumptions for the calculation of this balance sheet item remain unchanged.
D.1.7.4 Collateralised securities R0170
Differences in valuation
Values as of 31.12.2018 in TEUR Solvency II HGB
Collateralised securities 468,622 481,317
Under Solvency II, investments listed under the following balance sheet items pursuant to the German Commercial Code (HGB) are allocated to this item:
bearer bonds and other fixed-interest securities
In addition to the valuation methods stated in “Bonds R0130” it should be noted that special forms of collateralised securities such as, for example, the CDO / CLO are valued externally on the basis of specialist service providers. Given that, as a rule, no public price quotation is available, the market value is derived theoretically using a Mark-to-Model approach. This is done using the valuation model “Intex” (industry standard) and parameterised on the basis of input factors observed in the market.
Collateralisation is recognised as a risk-minimising factor in the valuation; however a spread, migration and default risk is allocated.
For special forms of collateralised papers such as, for example the CDO / CLO assumptions are made regarding the speed of repayment and recovery rates.
Publicly available prices are available for 6% of the portfolios reported here, 94% are valued using the present value method (taking into account information on the composition of the receivables pool obtained from a database of the specialist data provider “Intex”). The difference between the
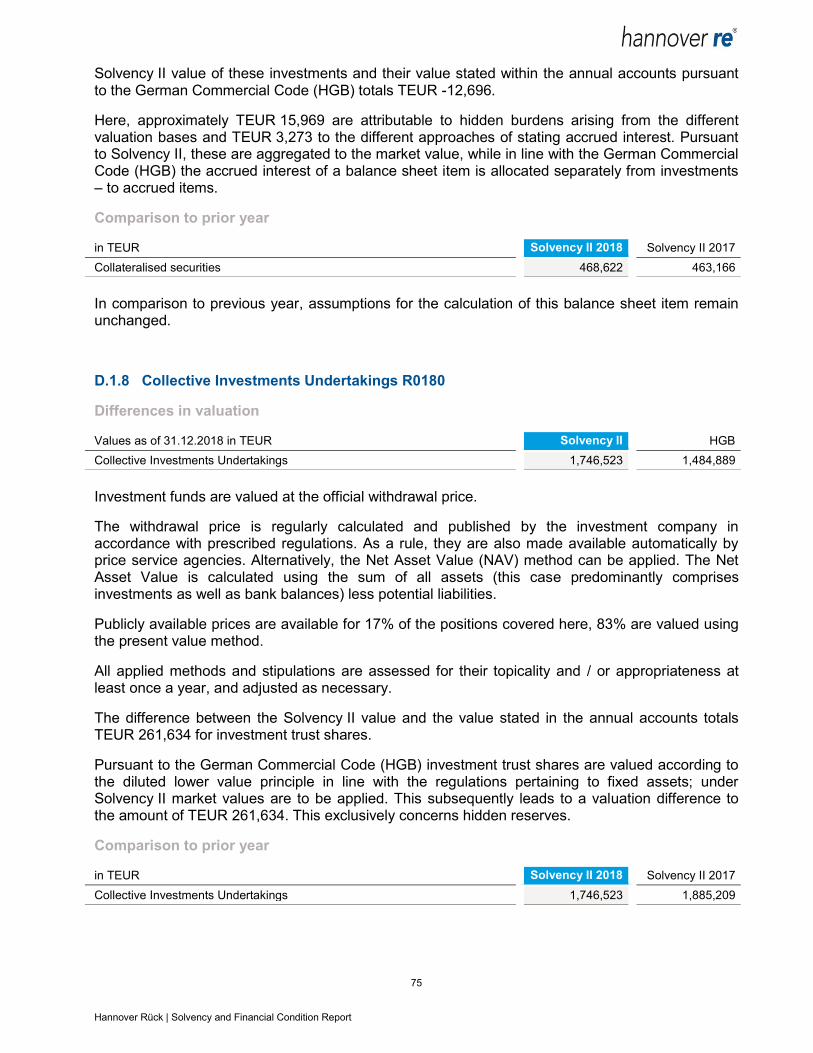
75 Hannover Rück | Solvency and Financial Condition Report
Solvency II value of these investments and their value stated within the annual accounts pursuant to the German Commercial Code (HGB) totals TEUR -12,696.
Here, approximately TEUR 15,969 are attributable to hidden burdens arising from the different valuation bases and TEUR 3,273 to the different approaches of stating accrued interest. Pursuant to Solvency II, these are aggregated to the market value, while in line with the German Commercial Code (HGB) the accrued interest of a balance sheet item is allocated separately from investments – to accrued items.
Comparison to prior year
in TEUR Solvency II 2018 Solvency II 2017
Collateralised securities 468,622 463,166
In comparison to previous year, assumptions for the calculation of this balance sheet item remain unchanged.
D.1.8 Collective Investments Undertakings R0180
Differences in valuation
Values as of 31.12.2018 in TEUR Solvency II HGB
Collective Investments Undertakings 1,746,523 1,484,889
Investment funds are valued at the official withdrawal price.
The withdrawal price is regularly calculated and published by the investment company in accordance with prescribed regulations. As a rule, they are also made available automatically by price service agencies. Alternatively, the Net Asset Value (NAV) method can be applied. The Net Asset Value is calculated using the sum of all assets (this case predominantly comprises investments as well as bank balances) less potential liabilities.
Publicly available prices are available for 17% of the positions covered here, 83% are valued using the present value method.
All applied methods and stipulations are assessed for their topicality and / or appropriateness at least once a year, and adjusted as necessary.
The difference between the Solvency II value and the value stated in the annual accounts totals TEUR 261,634 for investment trust shares.
Pursuant to the German Commercial Code (HGB) investment trust shares are valued according to the diluted lower value principle in line with the regulations pertaining to fixed assets; under Solvency II market values are to be applied. This subsequently leads to a valuation difference to the amount of TEUR 261,634. This exclusively concerns hidden reserves.
Comparison to prior year
in TEUR Solvency II 2018 Solvency II 2017
Collective Investments Undertakings 1,746,523 1,885,209
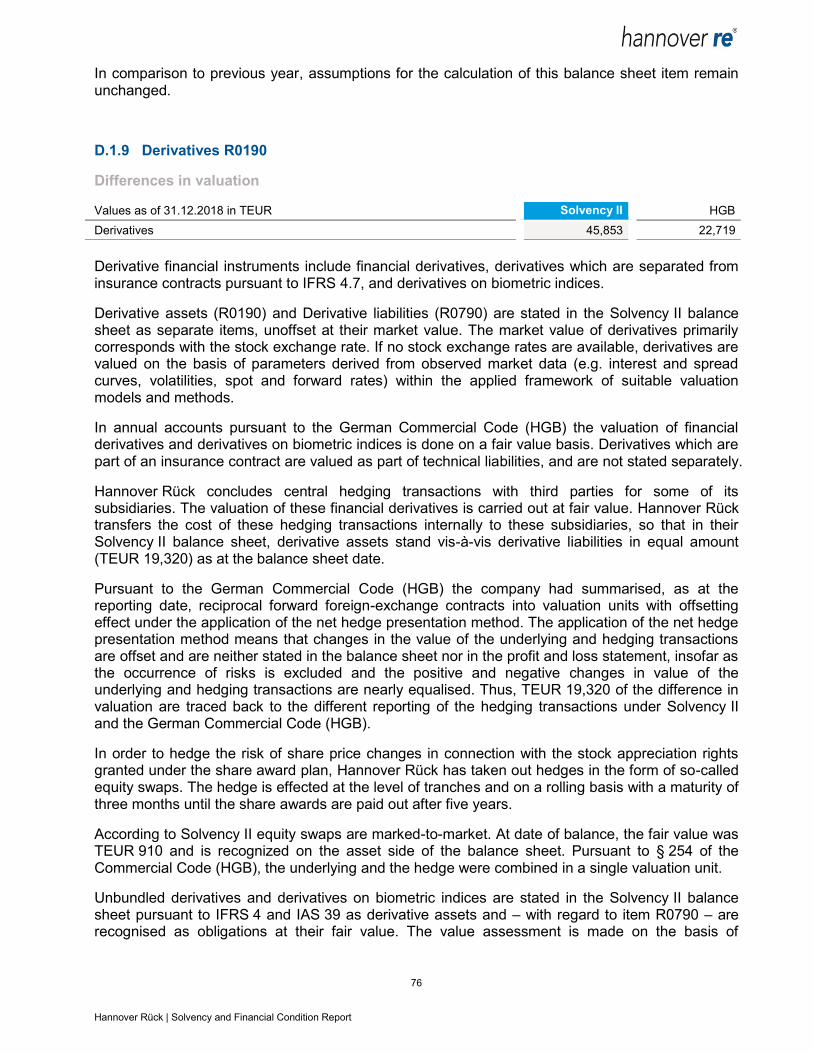
76 Hannover Rück | Solvency and Financial Condition Report
In comparison to previous year, assumptions for the calculation of this balance sheet item remain unchanged.
D.1.9 Derivatives R0190
Differences in valuation
Values as of 31.12.2018 in TEUR Solvency II HGB
Derivatives 45,853 22,719
Derivative financial instruments include financial derivatives, derivatives which are separated from insurance contracts pursuant to IFRS 4.7, and derivatives on biometric indices.
Derivative assets (R0190) and Derivative liabilities (R0790) are stated in the Solvency II balance sheet as separate items, unoffset at their market value. The market value of derivatives primarily corresponds with the stock exchange rate. If no stock exchange rates are available, derivatives are valued on the basis of parameters derived from observed market data (e.g. interest and spread curves, volatilities, spot and forward rates) within the applied framework of suitable valuation models and methods.
In annual accounts pursuant to the German Commercial Code (HGB) the valuation of financial derivatives and derivatives on biometric indices is done on a fair value basis. Derivatives which are part of an insurance contract are valued as part of technical liabilities, and are not stated separately.
Hannover Rück concludes central hedging transactions with third parties for some of its subsidiaries. The valuation of these financial derivatives is carried out at fair value. Hannover Rück transfers the cost of these hedging transactions internally to these subsidiaries, so that in their Solvency II balance sheet, derivative assets stand vis-à-vis derivative liabilities in equal amount (TEUR 19,320) as at the balance sheet date.
Pursuant to the German Commercial Code (HGB) the company had summarised, as at the reporting date, reciprocal forward foreign-exchange contracts into valuation units with offsetting effect under the application of the net hedge presentation method. The application of the net hedge presentation method means that changes in the value of the underlying and hedging transactions are offset and are neither stated in the balance sheet nor in the profit and loss statement, insofar as the occurrence of risks is excluded and the positive and negative changes in value of the underlying and hedging transactions are nearly equalised. Thus, TEUR 19,320 of the difference in valuation are traced back to the different reporting of the hedging transactions under Solvency II and the German Commercial Code (HGB).
In order to hedge the risk of share price changes in connection with the stock appreciation rights granted under the share award plan, Hannover Rück has taken out hedges in the form of so-called equity swaps. The hedge is effected at the level of tranches and on a rolling basis with a maturity of three months until the share awards are paid out after five years.
According to Solvency II equity swaps are marked-to-market. At date of balance, the fair value was TEUR 910 and is recognized on the asset side of the balance sheet. Pursuant to § 254 of the Commercial Code (HGB), the underlying and the hedge were combined in a single valuation unit.
Unbundled derivatives and derivatives on biometric indices are stated in the Solvency II balance sheet pursuant to IFRS 4 and IAS 39 as derivative assets and – with regard to item R0790 – are recognised as obligations at their fair value. The value assessment is made on the basis of
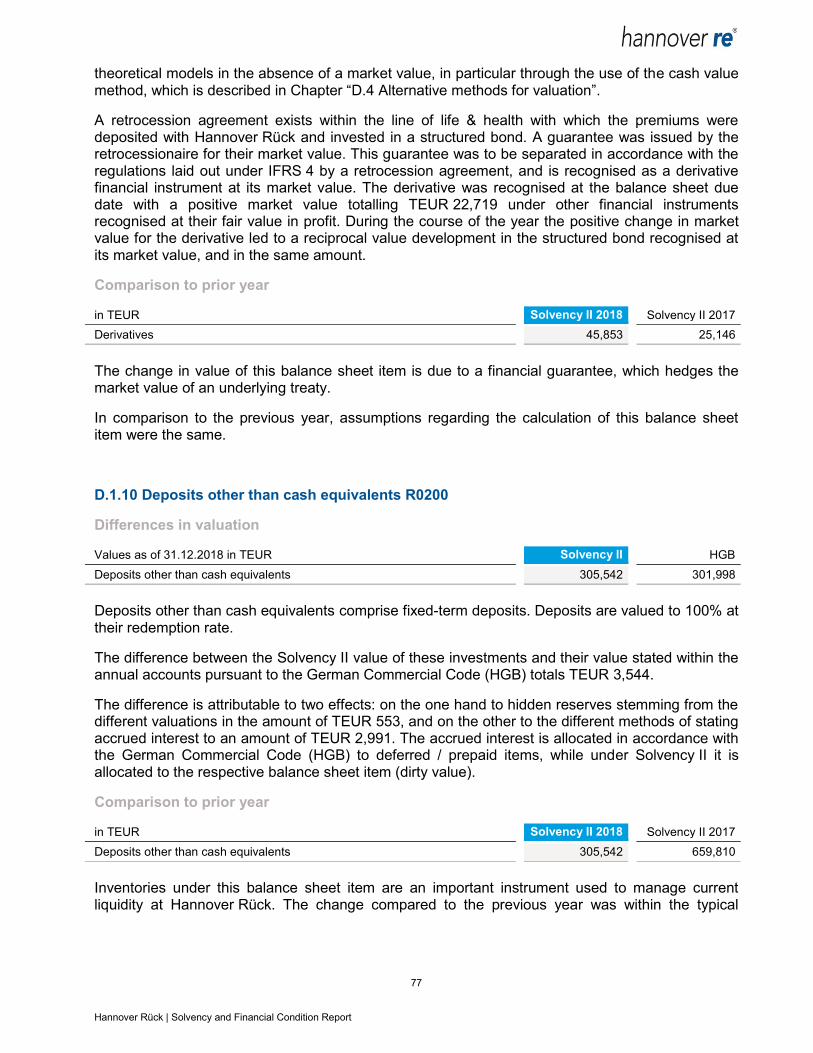
77 Hannover Rück | Solvency and Financial Condition Report
theoretical models in the absence of a market value, in particular through the use of the cash value method, which is described in Chapter “D.4 Alternative methods for valuation”.
A retrocession agreement exists within the line of life & health with which the premiums were deposited with Hannover Rück and invested in a structured bond. A guarantee was issued by the retrocessionaire for their market value. This guarantee was to be separated in accordance with the regulations laid out under IFRS 4 by a retrocession agreement, and is recognised as a derivative financial instrument at its market value. The derivative was recognised at the balance sheet due date with a positive market value totalling TEUR 22,719 under other financial instruments recognised at their fair value in profit. During the course of the year the positive change in market value for the derivative led to a reciprocal value development in the structured bond recognised at its market value, and in the same amount.
Comparison to prior year
in TEUR Solvency II 2018 Solvency II 2017
Derivatives 45,853 25,146
The change in value of this balance sheet item is due to a financial guarantee, which hedges the market value of an underlying treaty.
In comparison to the previous year, assumptions regarding the calculation of this balance sheet item were the same.
D.1.10 Deposits other than cash equivalents R0200
Differences in valuation
Values as of 31.12.2018 in TEUR Solvency II HGB
Deposits other than cash equivalents 305,542 301,998
Deposits other than cash equivalents comprise fixed-term deposits. Deposits are valued to 100% at their redemption rate.
The difference between the Solvency II value of these investments and their value stated within the annual accounts pursuant to the German Commercial Code (HGB) totals TEUR 3,544.
The difference is attributable to two effects: on the one hand to hidden reserves stemming from the different valuations in the amount of TEUR 553, and on the other to the different methods of stating accrued interest to an amount of TEUR 2,991. The accrued interest is allocated in accordance with the German Commercial Code (HGB) to deferred / prepaid items, while under Solvency II it is allocated to the respective balance sheet item (dirty value).
Comparison to prior year
in TEUR Solvency II 2018 Solvency II 2017
Deposits other than cash equivalents 305,542 659,810
Inventories under this balance sheet item are an important instrument used to manage current liquidity at Hannover Rück. The change compared to the previous year was within the typical
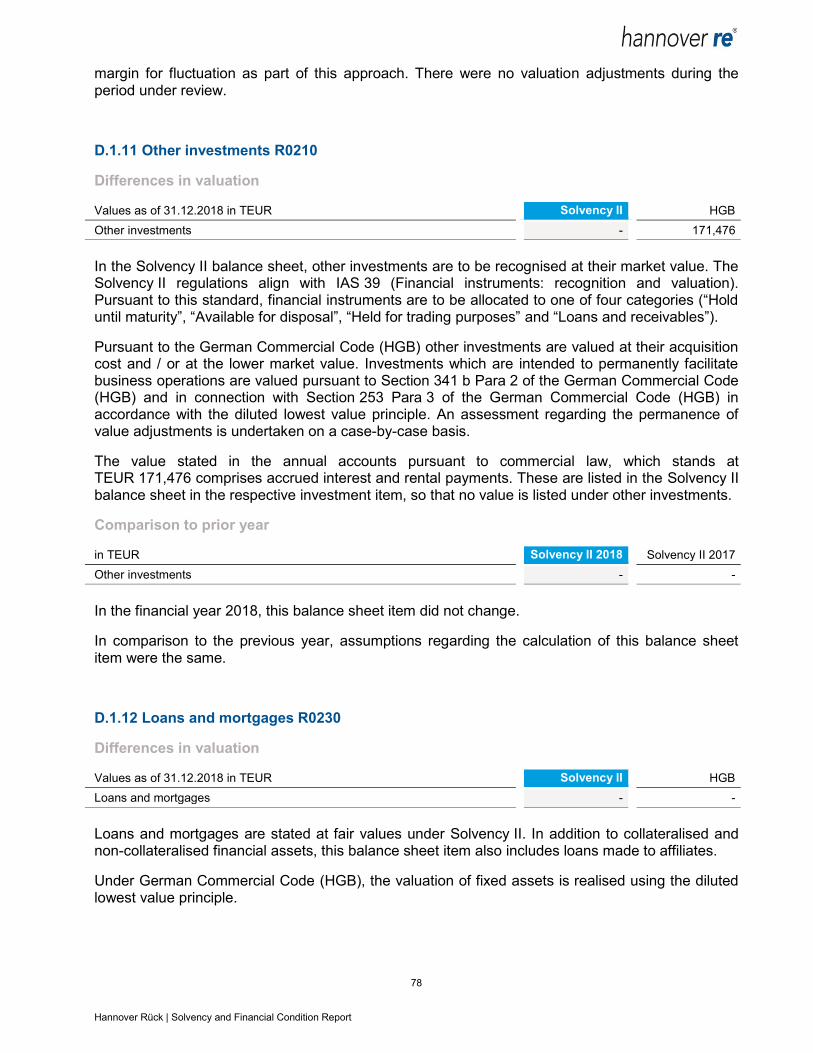
78 Hannover Rück | Solvency and Financial Condition Report
margin for fluctuation as part of this approach. There were no valuation adjustments during the period under review.
D.1.11 Other investments R0210
Differences in valuation
Values as of 31.12.2018 in TEUR Solvency II HGB
Other investments - 171,476
In the Solvency II balance sheet, other investments are to be recognised at their market value. The Solvency II regulations align with IAS 39 (Financial instruments: recognition and valuation). Pursuant to this standard, financial instruments are to be allocated to one of four categories (“Hold until maturity”, “Available for disposal”, “Held for trading purposes” and “Loans and receivables”).
Pursuant to the German Commercial Code (HGB) other investments are valued at their acquisition cost and / or at the lower market value. Investments which are intended to permanently facilitate business operations are valued pursuant to Section 341 b Para 2 of the German Commercial Code (HGB) and in connection with Section 253 Para 3 of the German Commercial Code (HGB) in accordance with the diluted lowest value principle. An assessment regarding the permanence of value adjustments is undertaken on a case-by-case basis.
The value stated in the annual accounts pursuant to commercial law, which stands at TEUR 171,476 comprises accrued interest and rental payments. These are listed in the Solvency II balance sheet in the respective investment item, so that no value is listed under other investments.
Comparison to prior year
in TEUR Solvency II 2018 Solvency II 2017
Other investments - -
In the financial year 2018, this balance sheet item did not change.
In comparison to the previous year, assumptions regarding the calculation of this balance sheet item were the same.
D.1.12 Loans and mortgages R0230
Differences in valuation
Values as of 31.12.2018 in TEUR Solvency II HGB
Loans and mortgages - -
Loans and mortgages are stated at fair values under Solvency II. In addition to collateralised and non-collateralised financial assets, this balance sheet item also includes loans made to affiliates.
Under German Commercial Code (HGB), the valuation of fixed assets is realised using the diluted lowest value principle.
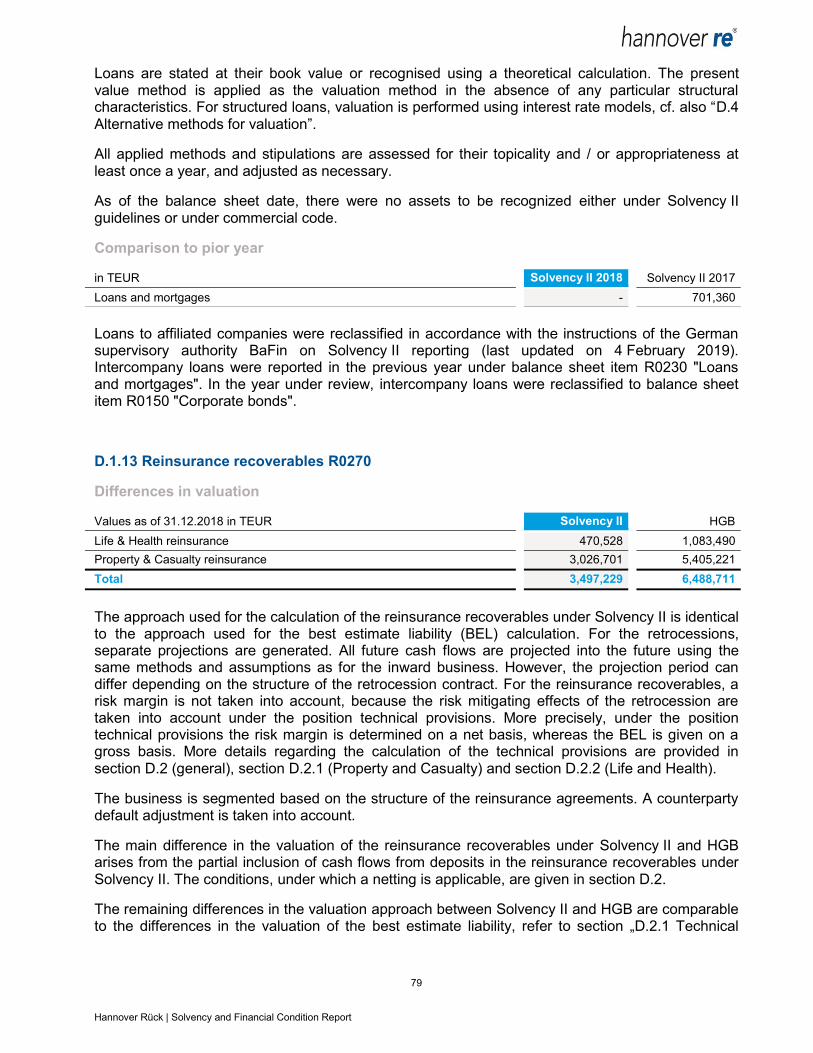
79 Hannover Rück | Solvency and Financial Condition Report
Loans are stated at their book value or recognised using a theoretical calculation. The present value method is applied as the valuation method in the absence of any particular structural characteristics. For structured loans, valuation is performed using interest rate models, cf. also “D.4 Alternative methods for valuation”.
All applied methods and stipulations are assessed for their topicality and / or appropriateness at least once a year, and adjusted as necessary.
As of the balance sheet date, there were no assets to be recognized either under Solvency II guidelines or under commercial code.
Comparison to pior year
in TEUR Solvency II 2018 Solvency II 2017
Loans and mortgages - 701,360
Loans to affiliated companies were reclassified in accordance with the instructions of the German supervisory authority BaFin on Solvency II reporting (last updated on 4 February 2019). Intercompany loans were reported in the previous year under balance sheet item R0230 "Loans and mortgages". In the year under review, intercompany loans were reclassified to balance sheet item R0150 "Corporate bonds".
D.1.13 Reinsurance recoverables R0270
Differences in valuation
Values as of 31.12.2018 in TEUR Solvency II HGB
Life & Health reinsurance 470,528 1,083,490
Property & Casualty reinsurance 3,026,701 5,405,221
Total 3,497,229 6,488,711
The approach used for the calculation of the reinsurance recoverables under Solvency II is identical to the approach used for the best estimate liability (BEL) calculation. For the retrocessions, separate projections are generated. All future cash flows are projected into the future using the same methods and assumptions as for the inward business. However, the projection period can differ depending on the structure of the retrocession contract. For the reinsurance recoverables, a risk margin is not taken into account, because the risk mitigating effects of the retrocession are taken into account under the position technical provisions. More precisely, under the position technical provisions the risk margin is determined on a net basis, whereas the BEL is given on a gross basis. More details regarding the calculation of the technical provisions are provided in section D.2 (general), section D.2.1 (Property and Casualty) and section D.2.2 (Life and Health).
The business is segmented based on the structure of the reinsurance agreements. A counterparty default adjustment is taken into account.
The main difference in the valuation of the reinsurance recoverables under Solvency II and HGB arises from the partial inclusion of cash flows from deposits in the reinsurance recoverables under Solvency II. The conditions, under which a netting is applicable, are given in section D.2.
The remaining differences in the valuation approach between Solvency II and HGB are comparable to the differences in the valuation of the best estimate liability, refer to section „D.2.1 Technical

80 Hannover Rück | Solvency and Financial Condition Report
Provisions Property & Casualty“ subsection “Comparison to HGB-provisions” and section „D.2.2.4 Comparison of the Technical Provision with the HGB Liability“ for the Life and Health segment.
Comparison to prior year
in TEUR Solvency II 2018 Solvency II 2017
Life & Health reinsurance 470,528 455,273
Property & Casualty reinsurance 3,026,701 2,328,703
Total 3,497,229 2,783,975
For Property & Casualty reinsurance, the development of reinsurance recoverables under Solvency II follows corresponding IFRS movements.
For Life & Health reinsurance, the reinsurance recoverables are nearly unchanged in comparison to the previous reporting period.
D.1.14 Deposits to cedants R0350
Differences in valuatioin
Values as of 31.12.2018 in TEUR Solvency II HGB
Deposits to cedants 402,513 8,130,718
The economic value of the deposits of the asset side is determined as the balance sheet item “Deposits to cedants”. The deposits are netted against the best estimate liability (BEL), if
the contractual relationship includes an offset clause in case of insolvency of the cedant or
the amount of the deposit is subject to a significant risk of loss from capital market fluctuations.
Only the remaining portion of the deposits (for which at least one of the two criteria is not entirely fulfilled), is shown on the asset side of the balance sheet. For netted deposits, the cash flows of the deposits (increase, reduction and interest on deposit, respectively) are projected into the future and are therefore an integral part of the calculation of the best estimate liability.
Thus, the difference between Solvency II and HGB is caused by the partial offsetting of the deposits against the BEL as well as by the different valuation principles for the deposits.
According to the interpretation decision from BaFin dated 1 January 2019, an offsetting of deposits against the BEL is not allowed for future reporting periods. We are currently working on this topic to fulfill the BaFin requirement according to the current planning for year-end 2019. This decision has no impact on the own funds.
Comparison to prior year
in TEUR Solvency II 2018 Solvency II 2017
Deposits to cedants 402,513 2,042,574
In comparison to the previous reporting period, the netting approach of deposits against the BEL remains unchanged. The strong decrease is caused by the restructuring of retrocession of US

81 Hannover Rück | Solvency and Financial Condition Report
business as a consequence of the US tax reform. It is no longer retroceded to Hannover Rück (and Hannover Re (Ireland) DAC, Dublin), but to Hannover Life Reassurance Company of America (Bermuda) Ltd. Further changes in the amount of deposits to cedants are due to market value adjustments.
D.1.15 Insurance and intermediaries receivables R0360
Differences in valuation
Values as of 31.12.2018 in TEUR Solvency II HGB
Insurance and intermediaries receivables 2,840,556 2,720,600
EIOPA differentiates between receivables as follows:
Receivables from insurance companies and intermediaries: Amounts due from insurance policyholders, other insurance companies or insurance-related companies, which have not been accounted for in the cash flow of technical provisions, in particular payments which are overdue
Receivables from reinsurers: Amounts due from reinsurers or reinsurance-related companies, which are not considered in the technical provisions
Pursuant to Solvency II receivables from insurance companies and intermediaries are to be valued at the expected present value of future cash flows, i.e. they are to be discounted using the applicable rate of interest pursuant to Solvency II. Furthermore, the counter-party default risk is to be taken into consideration in the valuation. Both are omitted for reasons of simplification.
Receivables from insurers and intermediaries are recognised at their nominal amounts in line with the German Commercial Code (HGB).
Pursuant to the German Commercial Code and / or the Insurance Accounting Decree (RechVersV) no differentiation is made between active reinsurance and retrocession for accounts receivable / payable. The German Commercial Code (HGB) values of this item therefore also comprise the receivables from reinsurers.
The differences in valuation of items R0360 and R0370 are therefore analysed together and amount to TEUR 200,969. They result from the fact that – regarding a group company – a part of the receivable, that is due only in the future, is considered here.
Comparison to prior year
in TEUR Solvency II 2018 Solvency II 2017
Insurance and intermediaries receivables 2,840,556 2,408,920
Compared to the previous period, the assumptions regarding the calculation of this item did not change.
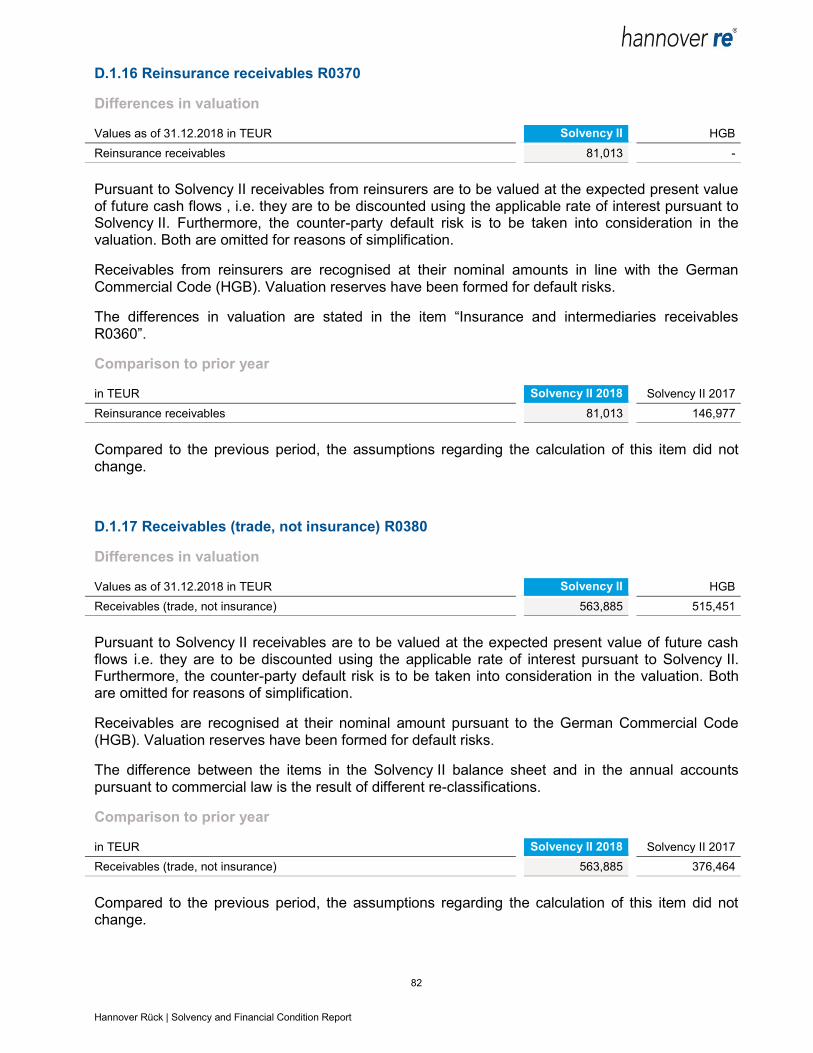
82 Hannover Rück | Solvency and Financial Condition Report
D.1.16 Reinsurance receivables R0370
Differences in valuation
Values as of 31.12.2018 in TEUR Solvency II HGB
Reinsurance receivables 81,013 -
Pursuant to Solvency II receivables from reinsurers are to be valued at the expected present value of future cash flows , i.e. they are to be discounted using the applicable rate of interest pursuant to Solvency II. Furthermore, the counter-party default risk is to be taken into consideration in the valuation. Both are omitted for reasons of simplification.
Receivables from reinsurers are recognised at their nominal amounts in line with the German Commercial Code (HGB). Valuation reserves have been formed for default risks.
The differences in valuation are stated in the item “Insurance and intermediaries receivables R0360”.
Comparison to prior year
in TEUR Solvency II 2018 Solvency II 2017
Reinsurance receivables 81,013 146,977
Compared to the previous period, the assumptions regarding the calculation of this item did not change.
D.1.17 Receivables (trade, not insurance) R0380
Differences in valuation
Values as of 31.12.2018 in TEUR Solvency II HGB
Receivables (trade, not insurance) 563,885 515,451
Pursuant to Solvency II receivables are to be valued at the expected present value of future cash flows i.e. they are to be discounted using the applicable rate of interest pursuant to Solvency II. Furthermore, the counter-party default risk is to be taken into consideration in the valuation. Both are omitted for reasons of simplification.
Receivables are recognised at their nominal amount pursuant to the German Commercial Code (HGB). Valuation reserves have been formed for default risks.
The difference between the items in the Solvency II balance sheet and in the annual accounts pursuant to commercial law is the result of different re-classifications.
Comparison to prior year
in TEUR Solvency II 2018 Solvency II 2017
Receivables (trade, not insurance) 563,885 376,464
Compared to the previous period, the assumptions regarding the calculation of this item did not change.
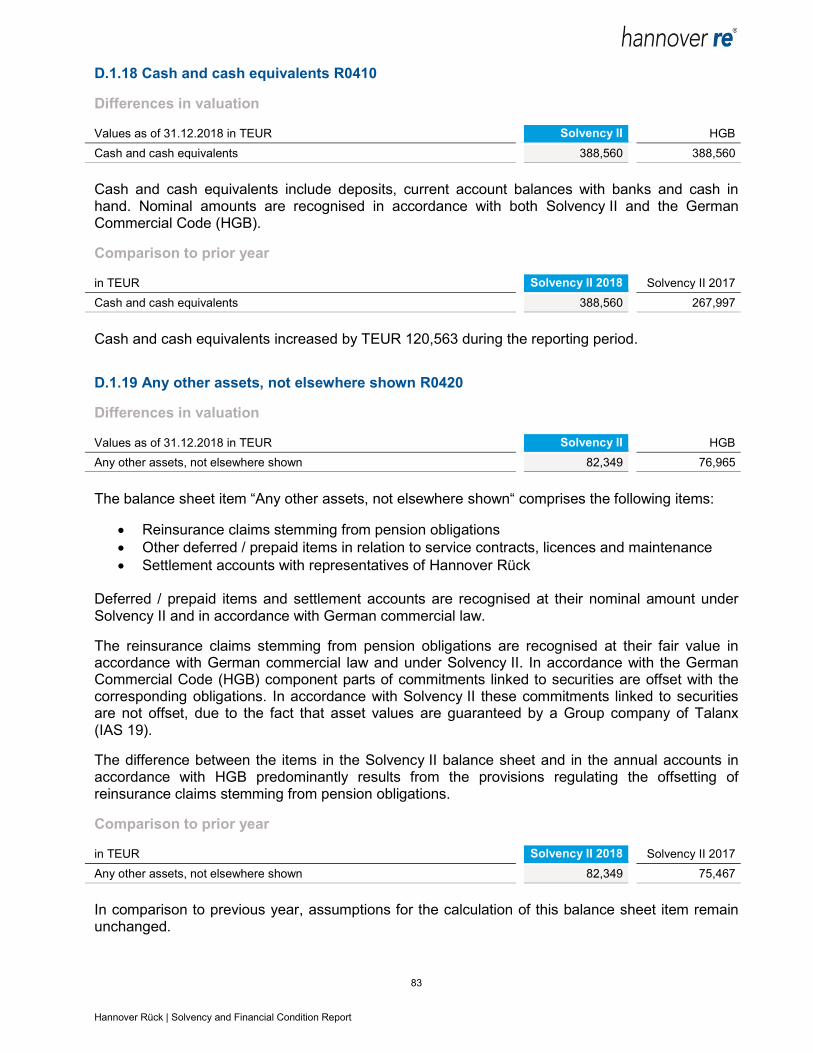
83 Hannover Rück | Solvency and Financial Condition Report
D.1.18 Cash and cash equivalents R0410
Differences in valuation
Values as of 31.12.2018 in TEUR Solvency II HGB
Cash and cash equivalents 388,560 388,560
Cash and cash equivalents include deposits, current account balances with banks and cash in hand. Nominal amounts are recognised in accordance with both Solvency II and the German Commercial Code (HGB).
Comparison to prior year
in TEUR Solvency II 2018 Solvency II 2017
Cash and cash equivalents 388,560 267,997
Cash and cash equivalents increased by TEUR 120,563 during the reporting period.
D.1.19 Any other assets, not elsewhere shown R0420
Differences in valuation
Values as of 31.12.2018 in TEUR Solvency II HGB
Any other assets, not elsewhere shown 82,349 76,965
The balance sheet item “Any other assets, not elsewhere shown“ comprises the following items:
Reinsurance claims stemming from pension obligations
Other deferred / prepaid items in relation to service contracts, licences and maintenance
Settlement accounts with representatives of Hannover Rück
Deferred / prepaid items and settlement accounts are recognised at their nominal amount under Solvency II and in accordance with German commercial law.
The reinsurance claims stemming from pension obligations are recognised at their fair value in accordance with German commercial law and under Solvency II. In accordance with the German Commercial Code (HGB) component parts of commitments linked to securities are offset with the corresponding obligations. In accordance with Solvency II these commitments linked to securities are not offset, due to the fact that asset values are guaranteed by a Group company of Talanx (IAS 19).
The difference between the items in the Solvency II balance sheet and in the annual accounts in accordance with HGB predominantly results from the provisions regulating the offsetting of reinsurance claims stemming from pension obligations.
Comparison to prior year
in TEUR Solvency II 2018 Solvency II 2017
Any other assets, not elsewhere shown 82,349 75,467
In comparison to previous year, assumptions for the calculation of this balance sheet item remain unchanged.
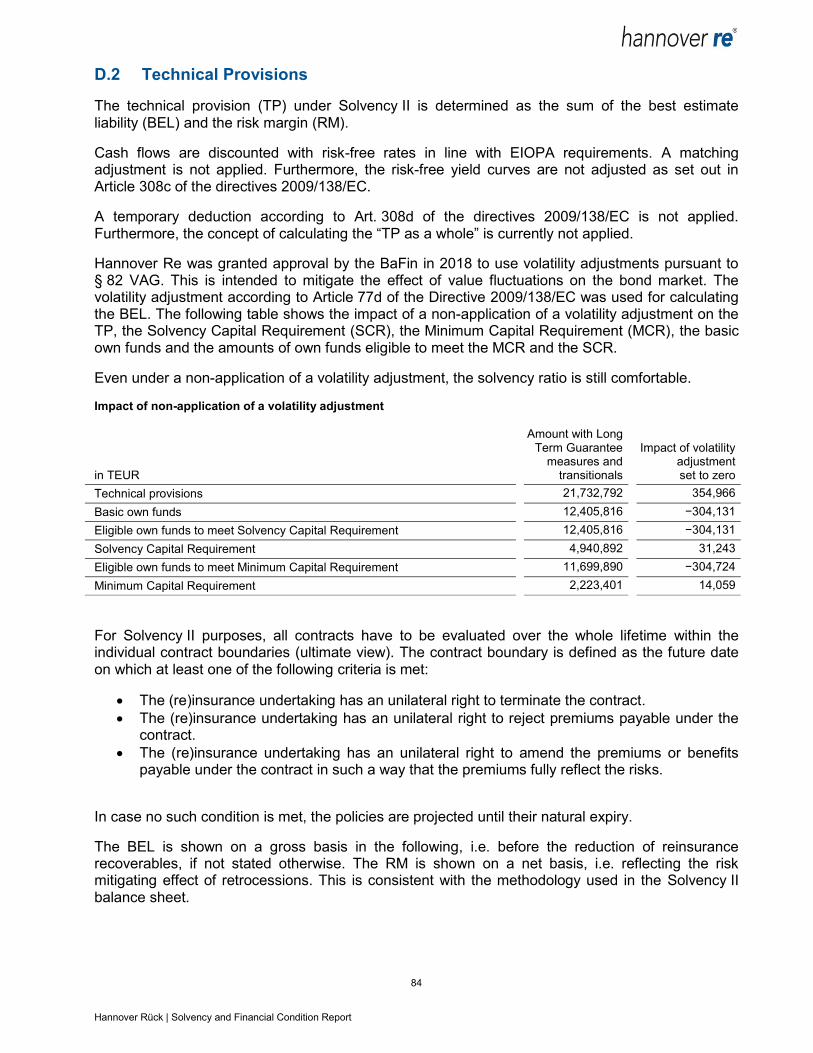
84 Hannover Rück | Solvency and Financial Condition Report
D.2 Technical Provisions
The technical provision (TP) under Solvency II is determined as the sum of the best estimate liability (BEL) and the risk margin (RM).
Cash flows are discounted with risk-free rates in line with EIOPA requirements. A matching adjustment is not applied. Furthermore, the risk-free yield curves are not adjusted as set out in Article 308c of the directives 2009/138/EC.
A temporary deduction according to Art. 308d of the directives 2009/138/EC is not applied. Furthermore, the concept of calculating the “TP as a whole” is currently not applied.
Hannover Re was granted approval by the BaFin in 2018 to use volatility adjustments pursuant to § 82 VAG. This is intended to mitigate the effect of value fluctuations on the bond market. The volatility adjustment according to Article 77d of the Directive 2009/138/EC was used for calculating the BEL. The following table shows the impact of a non-application of a volatility adjustment on the TP, the Solvency Capital Requirement (SCR), the Minimum Capital Requirement (MCR), the basic own funds and the amounts of own funds eligible to meet the MCR and the SCR.
Even under a non-application of a volatility adjustment, the solvency ratio is still comfortable.
Impact of non-application of a volatility adjustment
in TEUR
Amount with Long Term Guarantee
measures and transitionals
Impact of volatility adjustment set to zero
Technical provisions 21,732,792 354,966
Basic own funds 12,405,816 −304,131
Eligible own funds to meet Solvency Capital Requirement 12,405,816 −304,131
Solvency Capital Requirement 4,940,892 31,243
Eligible own funds to meet Minimum Capital Requirement 11,699,890 −304,724
Minimum Capital Requirement 2,223,401 14,059
For Solvency II purposes, all contracts have to be evaluated over the whole lifetime within the individual contract boundaries (ultimate view). The contract boundary is defined as the future date on which at least one of the following criteria is met:
The (re)insurance undertaking has an unilateral right to terminate the contract.
The (re)insurance undertaking has an unilateral right to reject premiums payable under the contract.
The (re)insurance undertaking has an unilateral right to amend the premiums or benefits payable under the contract in such a way that the premiums fully reflect the risks.
In case no such condition is met, the policies are projected until their natural expiry.
The BEL is shown on a gross basis in the following, i.e. before the reduction of reinsurance recoverables, if not stated otherwise. The RM is shown on a net basis, i.e. reflecting the risk mitigating effect of retrocessions. This is consistent with the methodology used in the Solvency II balance sheet.

85 Hannover Rück | Solvency and Financial Condition Report
Best Estimate Liability (BEL)
The calculation of the BEL is based on the projection of future cash in- and outflows including premiums, claims, and expenses. Best estimate assumptions are used in the calculation of the BEL. The expenses consist of direct administration expenses and costs of on-going operations.
As described in Section “Deposits to cedants R0350”, cash flows in connection with funds withheld (increase, decrease or interest on funds withheld) of the underlying business are usually netted against the liability cash flows. Exceptions from this rule are funds held with significant inherent capital market risk and funds withheld with insufficient offset possibilities (with the respective liabilities). The respective amounts are shown separately on the asset side of the balance sheet, if applicable. The netting of the deposits has no impact on the own funds.
For the Property & Casualty business, the TP does not include any financial options and guarantees (FOGs). For the Life & Health business, there is an immaterial amount of FOGs for US business. The latter is included in the BEL.
The projections are done separately for assumed and retroceded business using the same bases, methods and assumptions.
Risk Margin (RM)
According to Art. 37 (1) DVO, a uniform Cost of Capital approach is used for calculating the risk margin.
The Cost of Capital (CoC) factor is 6%. The required capital is the SCR under Solvency II according to Hannover Rück’s internal model. The allocation of the SCR to the lines of business reflects the contribution to the SCR (Art. 37). The allocated SCR contributions are projected to future periods using appropriate risk drivers for each line of business.
Diversification between the Property & Casualty and Life & Health reinsurance business group within Hannover Rück is taken into account.
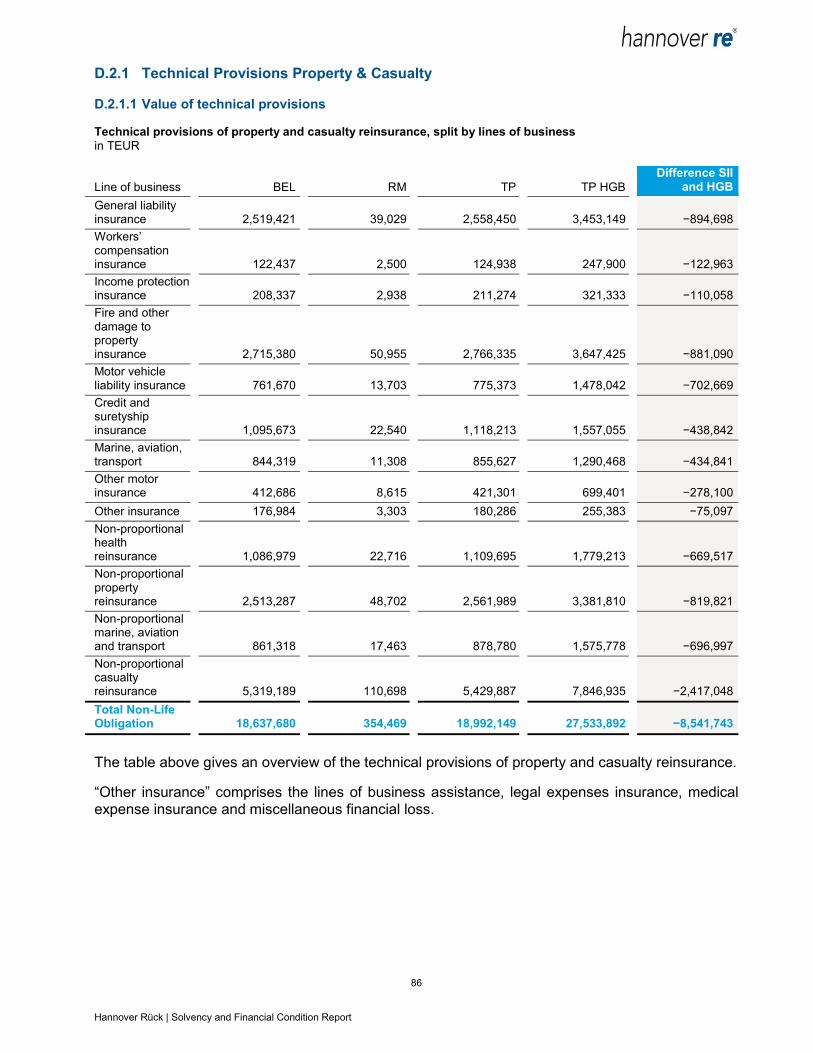
86 Hannover Rück | Solvency and Financial Condition Report
D.2.1 Technical Provisions Property & Casualty
D.2.1.1 Value of technical provisions
Technical provisions of property and casualty reinsurance, split by lines of business
in TEUR
Line of business BEL RM TP TP HGB
Difference SII and HGB
General liability insurance 2,519,421 39,029 2,558,450 3,453,149 −894,698
Workers’ compensation insurance 122,437 2,500 124,938 247,900 −122,963
Income protection insurance 208,337 2,938 211,274 321,333 −110,058
Fire and other damage to property insurance 2,715,380 50,955 2,766,335 3,647,425 −881,090
Motor vehicle liability insurance 761,670 13,703 775,373 1,478,042 −702,669
Credit and suretyship insurance 1,095,673 22,540 1,118,213 1,557,055 −438,842
Marine, aviation, transport 844,319 11,308 855,627 1,290,468 −434,841
Other motor insurance 412,686 8,615 421,301 699,401 −278,100
Other insurance 176,984 3,303 180,286 255,383 −75,097
Non-proportional health reinsurance 1,086,979 22,716 1,109,695 1,779,213 −669,517
Non-proportional property reinsurance 2,513,287 48,702 2,561,989 3,381,810 −819,821
Non-proportional marine, aviation and transport 861,318 17,463 878,780 1,575,778 −696,997
Non-proportional casualty reinsurance 5,319,189 110,698 5,429,887 7,846,935 −2,417,048
Total Non-Life Obligation 18,637,680 354,469 18,992,149 27,533,892 −8,541,743
The table above gives an overview of the technical provisions of property and casualty reinsurance.
“Other insurance” comprises the lines of business assistance, legal expenses insurance, medical expense insurance and miscellaneous financial loss.

87 Hannover Rück | Solvency and Financial Condition Report
D.2.1.2 Valuation of Technical Provisions
Bases
For the calculation of the BEL under Solvency II the business of the company is split into homogeneous risk groups such that the nature, scale and complexity of the business is adequately taken into account.
In general, there are no deviations regarding the valuation methods between the different lines of business, therefore the valuation methods described in the following paragraphs are valid for all segments of property and casualty reinsurance.
Methods
The evaluation of the BEL is based on the estimation of future cash flows, including all expected (future) cash in- and outflows related to existing obligations taking into account the time value of money. The BEL is calculated separately with respect to the best estimate premium provisions and the best estimate claims provisions.
The best estimate premium provision relates to claim events occurring after the valuation date and hence considers all loss, premium and cost cash flows relating to unearned incepted business taking into account the respective discount effect.
The best estimate claims provision relates to claim events occurring before the valuation date and hence considers all loss, premium and cost cash flows relating to earned business taking into account the respective discount effect.
The Solvency II calculations to determine all relevant cash flows for premium and claims provision reflect a best estimate projection. The calculation of BEL is based on gross data. Therefore, cash flows for premiums, claims and costs are modelled separately.
For the calculation, a whole-contract-view (with respect to the contractual agreements) is taken into account, i.e. all cash in- and outflows are projected to the economic ultimate within the contract boundaries.
The BEL comprises the sum of the discounted cash flows and is aggregated to the minimum lines of business according to Solvency II requirements.
Proportional non-life reinsurance obligations are mapped on the following lines of business under Solvency II:
Medical expense insurance
Income protection insurance
Workers’ compensation insurance
Motor vehicle liability insurance
Other motor insurance
Marine, aviation, transport
Fire and other damage to property insurance
General liability insurance
Credit and suretyship insurance
Legal expenses insurance
Assistance
Miscellaneous financial loss
88 Hannover Rück | Solvency and Financial Condition Report
Non-Proportional non-life reinsurance obligations are allocated on
Non-proportional health reinsurance
Non-proportional casualty reinsurance
Non-proportional marine, aviation and transport
Non-proportional property reinsurance Assumptions
For the calculation of the BEL, development pattern and estimated ultimates are applied on the segments which are used for IFRS reserving. The pattern and the ultimates are determined on run-off triangles using state-of-the-art actuarial methods. The triangles are generated using up-to-date and trustworthy data. With respect to currencies the cash flows are calculated on a minimum granularity level according to the internal model. The cash flows are discounted using the risk-free interest rates provided by EIOPA and converted to the reporting currency using the exchange rate on the valuation date.
Overall, the described valuation bases, methods and assumptions ensure that the calculation of the BEL is proportionate to the nature, scale and complexity of the underlying risks.
Reinsurance Recoverables
In general, the projection of reinsurance recoverables is undertaken analogously to the principles applied for the calculation of technical (gross) provisions of property and casualty reinsurance.
Reinsurance recoverables are adjusted with regard to the expected loss upon default of the counterparty. This adjustment is determined separately and is based on the valuation of the probability of a default per counterparty over the whole lifetime – whether be it through insolvency or legal dispute – as well as the resulting change in cash flows due to loss per default at the respective time under consideration.
According to the German Commercial Code (HGB) the demandable amounts from reinsurance contracts are calculated on the basis of reinsurance contracts. Valuation reserves have been formed for default risks.
The differences in the valuation apply analogously to the differences in the valuation of the best estimate liability, please refer to chapter “D.2.1.4 Comparison with other provisions”.
D.2.1.3 Level of Uncertainty
The economic valuation of the P&C reserves comprises a certain level of uncertainty. This consists of the uncertainty of the timing of future cash flows, ultimate loss size and retrocessionaire default and is constantly monitored by several assessments.
Besides internal quality assurance and validation work, the actuarial calculations regarding the adequacy of the reserves are also subject to annual quality assurance reviews conducted by external firms of actuaries and auditors.
In the course of the segmentation of the business and the process of assumption setting it is ensured that the economic value of the technical provisions is calculated in a prudent, reliable and objective manner following the indications of Section 75 of the insurance supervision law (VAG).
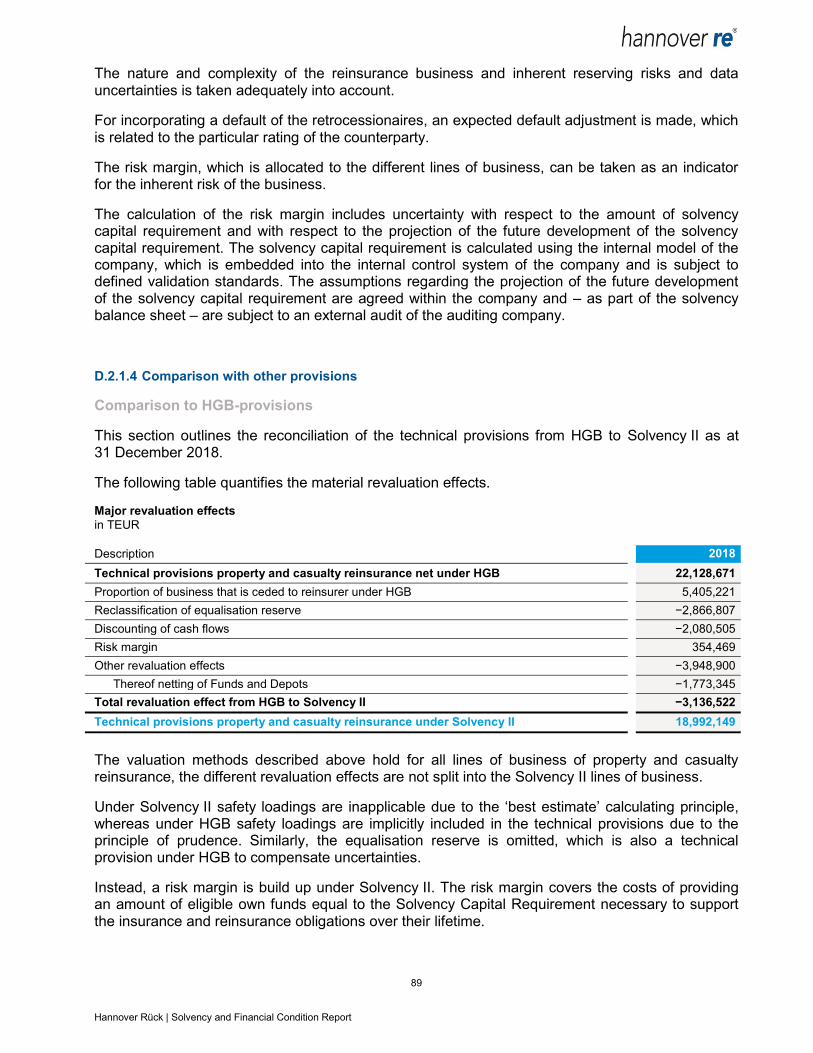
89 Hannover Rück | Solvency and Financial Condition Report
The nature and complexity of the reinsurance business and inherent reserving risks and data uncertainties is taken adequately into account.
For incorporating a default of the retrocessionaires, an expected default adjustment is made, which is related to the particular rating of the counterparty.
The risk margin, which is allocated to the different lines of business, can be taken as an indicator for the inherent risk of the business.
The calculation of the risk margin includes uncertainty with respect to the amount of solvency capital requirement and with respect to the projection of the future development of the solvency capital requirement. The solvency capital requirement is calculated using the internal model of the company, which is embedded into the internal control system of the company and is subject to defined validation standards. The assumptions regarding the projection of the future development of the solvency capital requirement are agreed within the company and – as part of the solvency balance sheet – are subject to an external audit of the auditing company.
D.2.1.4 Comparison with other provisions
Comparison to HGB-provisions
This section outlines the reconciliation of the technical provisions from HGB to Solvency II as at 31 December 2018.
The following table quantifies the material revaluation effects.
Major revaluation effects
in TEUR
Description 2018
Technical provisions property and casualty reinsurance net under HGB 22,128,671
Proportion of business that is ceded to reinsurer under HGB 5,405,221
Reclassification of equalisation reserve −2,866,807
Discounting of cash flows −2,080,505
Risk margin 354,469
Other revaluation effects −3,948,900
Thereof netting of Funds and Depots −1,773,345
Total revaluation effect from HGB to Solvency II −3,136,522
Technical provisions property and casualty reinsurance under Solvency II 18,992,149
The valuation methods described above hold for all lines of business of property and casualty reinsurance, the different revaluation effects are not split into the Solvency II lines of business.
Under Solvency II safety loadings are inapplicable due to the ‘best estimate’ calculating principle, whereas under HGB safety loadings are implicitly included in the technical provisions due to the principle of prudence. Similarly, the equalisation reserve is omitted, which is also a technical provision under HGB to compensate uncertainties.
Instead, a risk margin is build up under Solvency II. The risk margin covers the costs of providing an amount of eligible own funds equal to the Solvency Capital Requirement necessary to support the insurance and reinsurance obligations over their lifetime.

90 Hannover Rück | Solvency and Financial Condition Report
The calculation of the technical provisions under HGB follows the realisation principle, which only allows a profit to be reported when a profitable transaction has been legally or at least economically realised. A deferral as with, for example, unearned premiums under HGB is not applicable under Solvency II.
Solvency II technical provisions are calculated as a probability weighted average, whereas under HGB generally only annuity reserves are discounted.
Comparison to BEL of last year
Comparison to prior year
in TEUR 2018 2017
BEL gross 18,637,680 16,875,233
BEL net 15,610,979 14,546,530
RM 354,469 371,725
Contrary to the previous year the table above shows the BEL net after adjustment for the counterparty default risk.
Compared to yearend 2017 the BEL significantly increased for the lines of business fire and other damage to property insurance and non-proportional property reinsurance. One reason for this development is the high impact from major losses. Further reasons are the significant increase of business volume in these lines of business, exchange rate effects as well as an analysis and more detailed consideration of estimations in respect of cash flows.
The BEL also increased in the lines of business general liability insurance, credit and suretyship insurance, other motor insurance and non-proportional casualty reinsurance. The main reasons are exchange rate effects and an increase in volume of new business.
D.2.2 Technical Provisions Life & Health
D.2.2.1 Quantitative Information on Technical Provisions Life & Health
In this section the quantitative information with respect to BEL, RM, TP as well as the statutory liability is provided.
Details with respect to the basis of valuation, the valuation methods and the main assumptions underlying the calculation of the TP are given in Section „D.2.2.2 Valuation of the technical provisions“.
Material differences between the TP and the statutory liability are explained in Section D.2.2.4.
The following companies comprise the life & health business of Hannover Rück:
Hannover Rück: Home Office and Branches of the Hannover Rück (direct written business)
Hannover Life Reassurance Company of America, Orlando
Hannover Life Re of Australasia Ltd, Sydney
Hannover Life Reassurance Africa Ltd, Johannesburg.
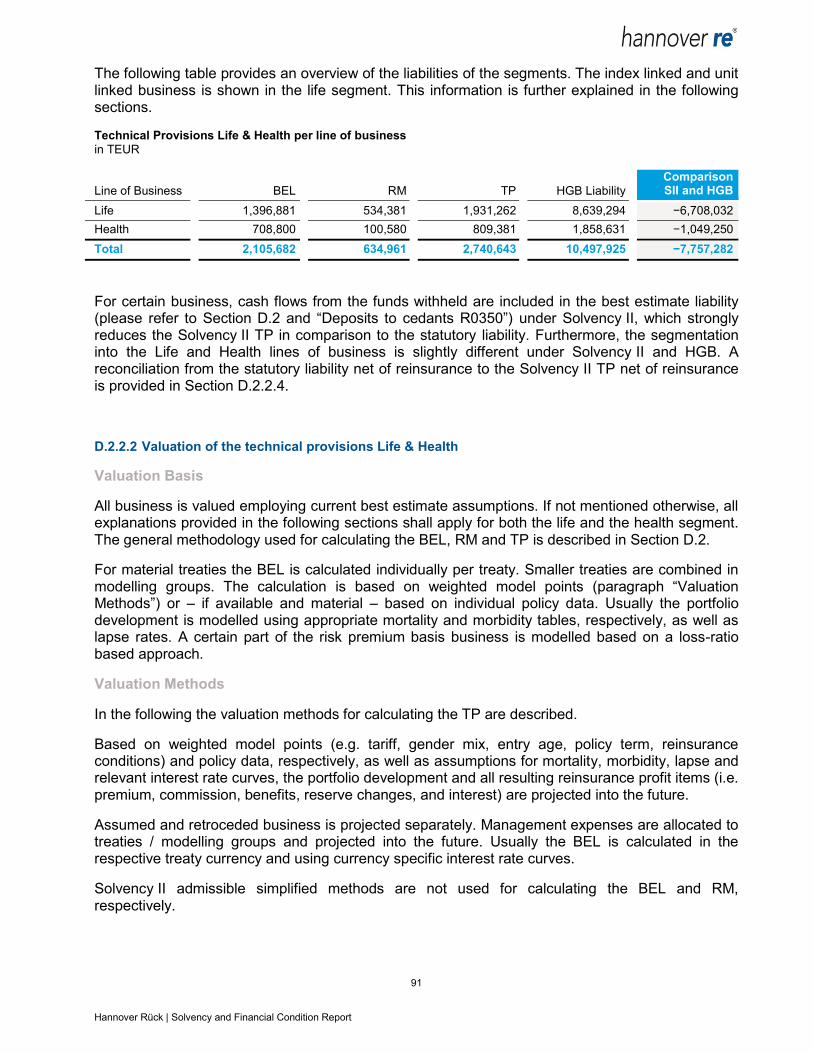
91 Hannover Rück | Solvency and Financial Condition Report
The following table provides an overview of the liabilities of the segments. The index linked and unit linked business is shown in the life segment. This information is further explained in the following sections.
Technical Provisions Life & Health per line of business
in TEUR
Line of Business BEL RM TP HGB Liability
Comparison SII and HGB
Life 1,396,881 534,381 1,931,262 8,639,294 −6,708,032
Health 708,800 100,580 809,381 1,858,631 −1,049,250
Total 2,105,682 634,961 2,740,643 10,497,925 −7,757,282
For certain business, cash flows from the funds withheld are included in the best estimate liability (please refer to Section D.2 and “Deposits to cedants R0350”) under Solvency II, which strongly reduces the Solvency II TP in comparison to the statutory liability. Furthermore, the segmentation into the Life and Health lines of business is slightly different under Solvency II and HGB. A reconciliation from the statutory liability net of reinsurance to the Solvency II TP net of reinsurance is provided in Section D.2.2.4.
D.2.2.2 Valuation of the technical provisions Life & Health
Valuation Basis
All business is valued employing current best estimate assumptions. If not mentioned otherwise, all explanations provided in the following sections shall apply for both the life and the health segment. The general methodology used for calculating the BEL, RM and TP is described in Section D.2.
For material treaties the BEL is calculated individually per treaty. Smaller treaties are combined in modelling groups. The calculation is based on weighted model points (paragraph “Valuation Methods”) or – if available and material – based on individual policy data. Usually the portfolio development is modelled using appropriate mortality and morbidity tables, respectively, as well as lapse rates. A certain part of the risk premium basis business is modelled based on a loss-ratio based approach.
Valuation Methods
In the following the valuation methods for calculating the TP are described.
Based on weighted model points (e.g. tariff, gender mix, entry age, policy term, reinsurance conditions) and policy data, respectively, as well as assumptions for mortality, morbidity, lapse and relevant interest rate curves, the portfolio development and all resulting reinsurance profit items (i.e. premium, commission, benefits, reserve changes, and interest) are projected into the future.
Assumed and retroceded business is projected separately. Management expenses are allocated to treaties / modelling groups and projected into the future. Usually the BEL is calculated in the respective treaty currency and using currency specific interest rate curves.
Solvency II admissible simplified methods are not used for calculating the BEL and RM, respectively.
92 Hannover Rück | Solvency and Financial Condition Report
Material Assumptions for the Life and health business (excluding Longevity Business)
Business is written all over the world with a wide range of different policy types, tariffs and mortality / morbidity tables.
For treaties projected individually, the calculation of the BEL is initially based on weighted model points (or even on policy data). The assumptions are monitored when the accounts from the cedants are booked and adjusted, if necessary. The base mortality / morbidity table is usually the table used in pricing. Also here adjustments are made in case that the actual figures materially differ from the expectation, or if other relevant information becomes available.
For the majority of the business in the US and UK market, specific mortality and morbidity assumptions are derived from the Company's base standard tables and updated regularly.
Lapse rates are set from the original pricing basis of the treaty and adjusted for actual experience where credible data exists and for changes of the internal view of longterm lapse rates.
The reinsurance conditions of the treaty are reflected in the calculation of the BEL.
With exception of mortality business in the US and UK market, no allowance for future mortality improvement is made.
For smaller treaties modelled in groups, more general assumptions are made. Base mortality / morbidity tables are chosen in order to be appropriate for the respective market covered by the modelling group calculation. Reinsurance conditions are representative for the respective modelling group. The assumptions are monitored based on the booked results per modelling group in the past and adjusted if necessary.
For a small portion of the individually modelled business as well as of the business modelled in groups, expected claims are based on claims ratios. I.e. instead of using explicit mortality / morbidity and lapse rates the claims are estimated via a certain proportion of the premium.
Generally, future management actions are only taken into account for the SCR calculation of certain American and Australian business. Therefore they affect only the RM via the SCR (determined with the internal model), but not the best estimate projections. There are some exceptions for our US business, most importantly, the US Mortality Solutions business. A detailed management action plan (“FMA Plan”) has been implemented to address issues with a US mortality portfolio acquired in 2009. The expected cash flows from in-force management are reflected in the 2018 TP.
Material Assumptions for the Longevity Business
The calculation of the BEL is based on policy data. Best estimate base mortality assumptions are set on a treaty level. Best estimate mortality improvement assumptions are set either by treaty or by country.
The assumptions are monitored when the accounts from the cedants are booked and adjusted, if necessary, or if other information indicates a need for change. Furthermore, detailed mortality studies are carried out to allow for a comparison between expectation and experience and to adjust if necessary.
93 Hannover Rück | Solvency and Financial Condition Report
Assumptions Changes in Comparison to the Previous Reporting Period
In the following material assumption changes in comparison to the previous reporting period are explained.
The assumptions for mortality and disability business of the Hong Kong branch were analysed and adjusted. As part of our inforce management measures we initiated rate adjustments for certain US mortality business. These adjustments led to a higher level of recaptures than expected at year-end 2017. In addition, the mortality and morbidity rates for certain mortality and critical illness business in the UK market were updated. All effects mentioned in this paragraph caused an increase in BEL.
Reinsurance Recoverables
For all retrocessions to third party reinsurers where the recoverable represents an asset to Hannover Rück, a default adjustment according to their average rating was included.
In total the reinsurance recoverables are positive (TEUR 470,528), i.e. it is to be seen as an asset for Hannover Rück and reduces the net Solvency II reserves.
The respective statutory reinsurance recoverables amounts to TEUR 1,083,490. One reason for the difference between Solvency II and statutory is the inclusion of cash flows from deposits in the reinsurance recoverables under Solvency II (please refer to Section D.2 and “Deposits from reinsurers R0770”). Further revaluation steps between HGB and Solvency II are provided in Section D.2.2.4.The remaining difference is caused by future payments to the retrocessionaires (from financing business or profitable ceded business).
D.2.2.3 Risk Assessment
The main area of uncertainty around the level of the TP relates to a potential deviation of actual experience from the underlying assumptions and the sensitivity of cash flows to changes in those assumptions. The Risk Margin can serve as an indicator of such uncertainty.
The most material uncertainty comes in the form of the longevity and mortality business. Longevity and mortality risks are the key driver to the overall level of uncertainty. This also becomes evident from the capital requirements under Solvency II presented in Section E.2.
For the mortality business small changes in the mortality rates can have significant effects on the claim payments. However, for a significant share of the portfolio, this risk is largely mitigated by profit commission arrangements or by limits regarding the retention of the cedant such that changes in mortality rates would change the underlying cash flow pattern but would have a limited impact on the associated BEL. The mortality rates are well grounded from available data. For longer tailed products, in particular in the US and UK market, mortality improvement and expert setting can also play an important role. Significant mortality risk is stemming from US mortality business. The actual mortality experience for the portfolio in question proved to be better than expected in 2018. We are monitoring the further development of the underlying mortality on an ongoing basis.
Significant mortality risk is stemming from US mortality business. The actual mortality experience for the portfolio in question proved to be better than expected in 2018. We are monitoring the further development of the underlying mortality on an ongoing basis.
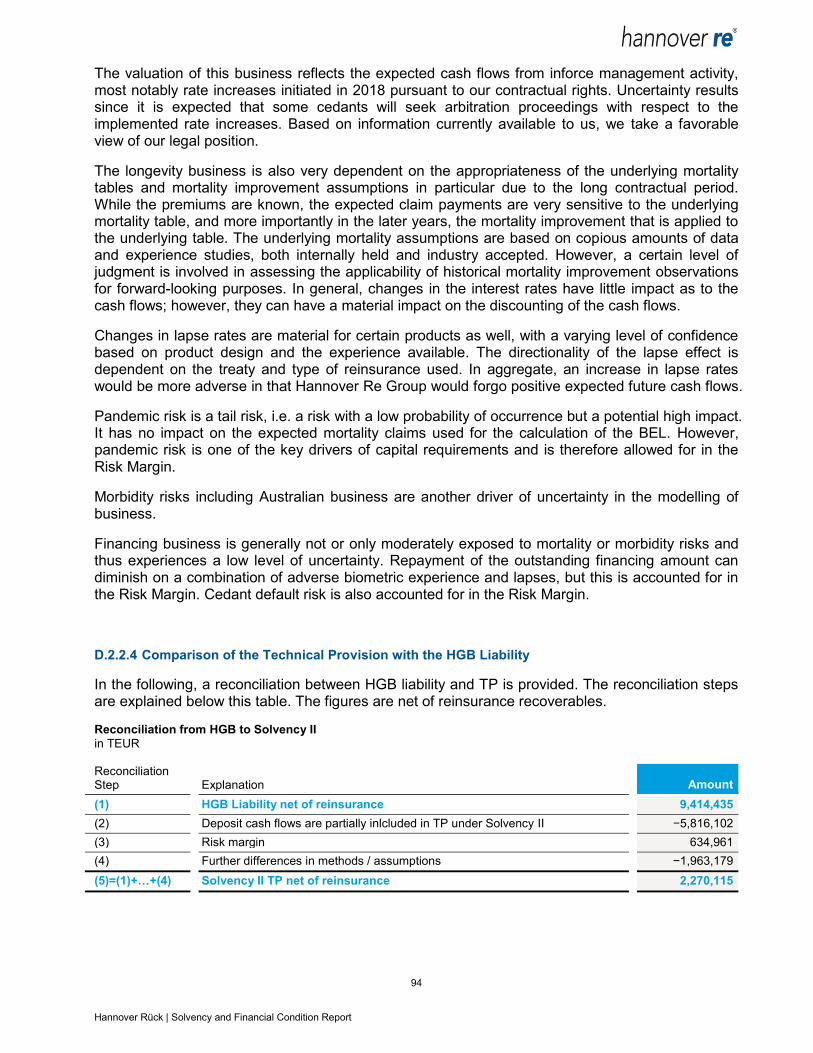
94 Hannover Rück | Solvency and Financial Condition Report
The valuation of this business reflects the expected cash flows from inforce management activity, most notably rate increases initiated in 2018 pursuant to our contractual rights. Uncertainty results since it is expected that some cedants will seek arbitration proceedings with respect to the implemented rate increases. Based on information currently available to us, we take a favorable view of our legal position.
The longevity business is also very dependent on the appropriateness of the underlying mortality tables and mortality improvement assumptions in particular due to the long contractual period. While the premiums are known, the expected claim payments are very sensitive to the underlying mortality table, and more importantly in the later years, the mortality improvement that is applied to the underlying table. The underlying mortality assumptions are based on copious amounts of data and experience studies, both internally held and industry accepted. However, a certain level of judgment is involved in assessing the applicability of historical mortality improvement observations for forward-looking purposes. In general, changes in the interest rates have little impact as to the cash flows; however, they can have a material impact on the discounting of the cash flows.
Changes in lapse rates are material for certain products as well, with a varying level of confidence based on product design and the experience available. The directionality of the lapse effect is dependent on the treaty and type of reinsurance used. In aggregate, an increase in lapse rates would be more adverse in that Hannover Re Group would forgo positive expected future cash flows.
Pandemic risk is a tail risk, i.e. a risk with a low probability of occurrence but a potential high impact. It has no impact on the expected mortality claims used for the calculation of the BEL. However, pandemic risk is one of the key drivers of capital requirements and is therefore allowed for in the Risk Margin.
Morbidity risks including Australian business are another driver of uncertainty in the modelling of business.
Financing business is generally not or only moderately exposed to mortality or morbidity risks and thus experiences a low level of uncertainty. Repayment of the outstanding financing amount can diminish on a combination of adverse biometric experience and lapses, but this is accounted for in the Risk Margin. Cedant default risk is also accounted for in the Risk Margin.
D.2.2.4 Comparison of the Technical Provision with the HGB Liability
In the following, a reconciliation between HGB liability and TP is provided. The reconciliation steps are explained below this table. The figures are net of reinsurance recoverables.
Reconciliation from HGB to Solvency II
in TEUR Reconciliation Step Explanation Amount
(1) HGB Liability net of reinsurance 9,414,435
(2) Deposit cash flows are partially inlcluded in TP under Solvency II −5,816,102
(3) Risk margin 634,961
(4) Further differences in methods / assumptions −1,963,179
(5)=(1)+…+(4) Solvency II TP net of reinsurance 2,270,115

95 Hannover Rück | Solvency and Financial Condition Report
(1) Hereunder HGB deposits are deducted which are netted for Solvency II purposes.
In the following, the sources of the differences in methods and assumptions are described.
(4a) The calculation of the BEL includes all future cash flows. For profitable business, this means including future profits. In contrast, the HGB liability does not allow for future profits according to the realization principle in connection with the prudence principle.
(4b) For cash financing business, the repayment of the initial commission is included in the BEL, but not allowed to take into account for statutory valuation purposes.
(4c) The BEL reflects current best estimate assumptions (e.g., regarding mortality and lapse), whereas the statutory assumptions are based on the prudence principle.
(4d) The BEL (and the RM) are discounted with current risk free interest rates, whereas the statutory liabilities are calculated using valuation interest rates.
(4e) For some treaties the Solvency II contract boundaries (CB) differ from the contract boundaries under statutory.
D.3 Other Liabilities
D.3.1 Contingent liabilities R0740
Difference in valuation
Values as of 31.12.2018 in TEUR Solvency II HGB
Contingent liabilities 3,334 -
A contingent liability is a possible obligation arising from past events and whose existence will be confirmed only by the occurrence or non-occurrence of one or more uncertain future events. Obligations are to be reported as contingent liabilities if the probability of occurrence is less than 50% (IAS 37).
Contingent liabilities in Solvency II balance sheet are recognised according to criteria set out in Art. 11 of Delegated Regulation (EU) 2015/35. Accordingly, material contingent liabilities are to be reported if the information could influence the decision-making or judgement of the intended user of that information.
Pursuant to Section 251 and Section 268 Para 7 of the German Commercial Code (HGB), contingent liabilities have to be reported in the notes of the balance sheet.
Due to a low probability of occurrence, the underlying issue is not recorded in the notes of the balance sheet of the German Commercial Code (HGB). Under Solvency II legislation, an expectancy value is recognized. This results in a difference of TEUR 3,334.
Comparison to prior year
in TEUR Solvency II 2018 Solvency II 2017
Contingent liabilities 3,334 3,334
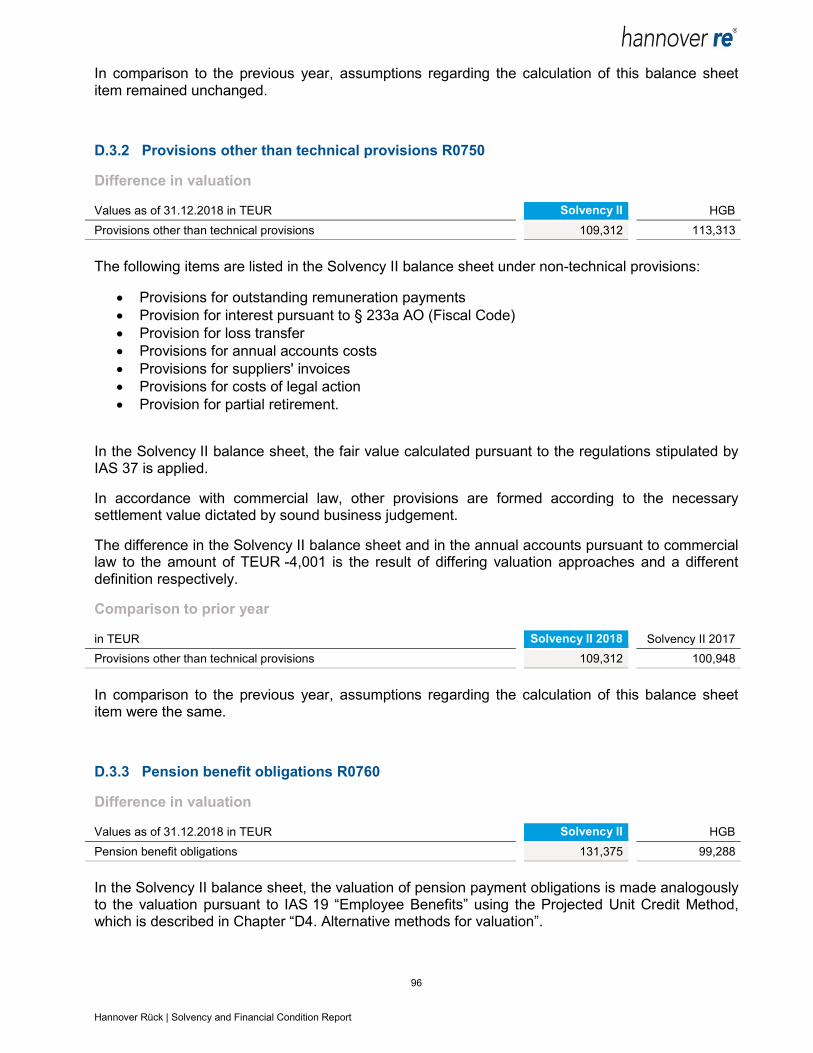
96 Hannover Rück | Solvency and Financial Condition Report
In comparison to the previous year, assumptions regarding the calculation of this balance sheet item remained unchanged.
D.3.2 Provisions other than technical provisions R0750
Difference in valuation
Values as of 31.12.2018 in TEUR Solvency II HGB
Provisions other than technical provisions 109,312 113,313
The following items are listed in the Solvency II balance sheet under non-technical provisions:
Provisions for outstanding remuneration payments
Provision for interest pursuant to § 233a AO (Fiscal Code)
Provision for loss transfer
Provisions for annual accounts costs
Provisions for suppliers' invoices
Provisions for costs of legal action
Provision for partial retirement.
In the Solvency II balance sheet, the fair value calculated pursuant to the regulations stipulated by IAS 37 is applied.
In accordance with commercial law, other provisions are formed according to the necessary settlement value dictated by sound business judgement.
The difference in the Solvency II balance sheet and in the annual accounts pursuant to commercial law to the amount of TEUR -4,001 is the result of differing valuation approaches and a different definition respectively.
Comparison to prior year
in TEUR Solvency II 2018 Solvency II 2017
Provisions other than technical provisions 109,312 100,948
In comparison to the previous year, assumptions regarding the calculation of this balance sheet item were the same.
D.3.3 Pension benefit obligations R0760
Difference in valuation
Values as of 31.12.2018 in TEUR Solvency II HGB
Pension benefit obligations 131,375 99,288
In the Solvency II balance sheet, the valuation of pension payment obligations is made analogously to the valuation pursuant to IAS 19 “Employee Benefits” using the Projected Unit Credit Method, which is described in Chapter “D4. Alternative methods for valuation”.

97 Hannover Rück | Solvency and Financial Condition Report
The commitments to employees in Germany predominantly comprise benefit obligations financed by Hannover Rück. A large proportion of obligations are based on defined benefit obligations.
The provisions for pensions in Germany and abroad were calculated on the basis of uniform standards according to prevailing economic circumstances.
Pursuant to the German Commercial Code (HGB) pension payment obligations are set in principle according to the necessary settlement value based on sound business judgement. They are discounted using the average interest rate of the previous ten years and with an assumed residual maturity of 15 years, as published by the German Central Bank (Deutsche Bundesbank) pursuant to the Regulation on the Discounting of Provisions (RückAbzinsVO). This interest rate currently stands at 3.21%. The pension payment obligations are calculated using the Projected Unit Credit Method. The salary trend, pension trend and performance adjustment due to profit participation by reinsurers are taken into account. Probabilities of fluctuation are calculated separately depending on age and gender. The calculations are based on Klaus Heubeck's 2018 G mortality tables.
With employee-financed pension commitments, the amount of which is defined exclusively by the fair value of the receivables reinsurance cover (financed by employer) a valuation is made pursuant to Section 253 Para 1 Sentence 3 of the German Commercial Code (HGB). For these commitments, the settlement value corresponds to the fair value of the actuarial reserve plus profit participation.
The difference between the valuation bases found in the Solvency II balance sheet and in the annual accounts according to commercial law totalling TEUR 32,087 is particularly attributable to the different interest rates applied for discounting. Pursuant to Solvency II a lower rate of interest is applied, which subsequently leads to a higher valuation for pension payment obligations.
Comparison to prior year
in TEUR Solvency II 2018 Solvency II 2017
Pension benefit obligations 131,375 128,061
In comparison to the previous year, assumptions regarding the calculation of this balance sheet item remained unchanged.
D.3.4 Deposits from reinsurers R0770
Difference in valuation
Values as of 31.12.2018 in TEUR Solvency II HGB
Deposits from reinsurers 498,542 2,246,672
The deposits from reinsurers are determined analogously to the deposits to cedents. The respective methodology is described in section “Deposits to Cedents R0350”.
Under Solvency II the cash flows from parts of the deposits from reinsurers are included in the calculation of the reinsurance recoverables. Using the same netting approach under HGB, the remaining difference between Solvency II and HGB deposits is stemming from the Life and Health segment and is described in section D.2.2.
According to the interpretation decision from BaFin dated 1 January 2019, an offsetting of deposits against the best estimate liability (BEL) is not allowed for future reporting periods. We are currently

98 Hannover Rück | Solvency and Financial Condition Report
working on this topic to fulfill the BaFin requirement according to the current planning for year-end 2019. This decision has no impact on the own funds.
Comparison to prior year
in TEUR Solvency II 2018 Solvency II 2017
Deposits from reinsurers 498,542 479,023
In comparison to the previous reporting period, the netting approach of deposits against the reinsurance recoverables remains unchanged. The changes in the amount of deposits from reinsurers under Solvency II are mainly due to changes in exchange rates and in the underlying business.
D.3.5 Deferred tax liabilities R0780
Difference in valuation
Values as of 31.12.2018 in TEUR Solvency II HGB
Deferred tax liabilities 2,037,426 -
The calculation of deferred taxes under Solvency II is carried out in accordance with Art. 15 of the Delegated Regulation. Deferred taxes are recognized and measured for all assets and liabilities, including technical provisions.
In the Solvency II balance sheet, a deferred tax asset totalling TEUR 187,067 is stated as well as a deferred tax liability to the amount of TEUR 2,037,426. This subsequently leads to a liability surplus, of which the calculation in principle is executed in two steps.
The first step involves the calculation of deferred taxes on the basis of valuation differences between the IFRS balance sheet and the tax balance sheet, within the scope of generating the IFRS balance sheet for the consolidated financial statement of the Hannover Re Group. Here, deferred tax assets or liabilities are recognised pursuant to IAS 12 (Income taxes) as well as on an intra-year basis pursuant to IAS 34 (Interim financial reporting). Deferred tax assets or liabilities are generated, insofar as asset or liability items in the IFRS balance sheet are to be recognised at lower or higher amounts than those in the tax balance sheet, and that these differences will invert in future (temporary differences). Temporary differences principally result from valuation differences between a tax balance sheet generated in line with national standards, and both the IFRS balance sheet and consolidation procedures.
Deferred tax assets are also calculated based on tax loss carry forwards and tax credits. Insofar as the deferred taxes relate to items, which are recognised directly in shareholders’ equity, the resulting deferred taxes are also directly recognised in shareholders’ equity. Value adjustments are made in relation to deferred tax assets as soon as the realisation of the deferred tax assets appears to be no longer probable in future. Deferred taxes are valued using the ratified rates of tax in the respective country, which apply and / or have been decreed as at the reporting due date.
The second step involves the calculation of deferred taxes on the basis of valuation differences between the Solvency II balance sheet and the IFRS balance sheet. According to Guideline 9 of the EIOPA guidelines, no discounting is applied in the valuation of deferred taxes in the Solvency II balance sheet.
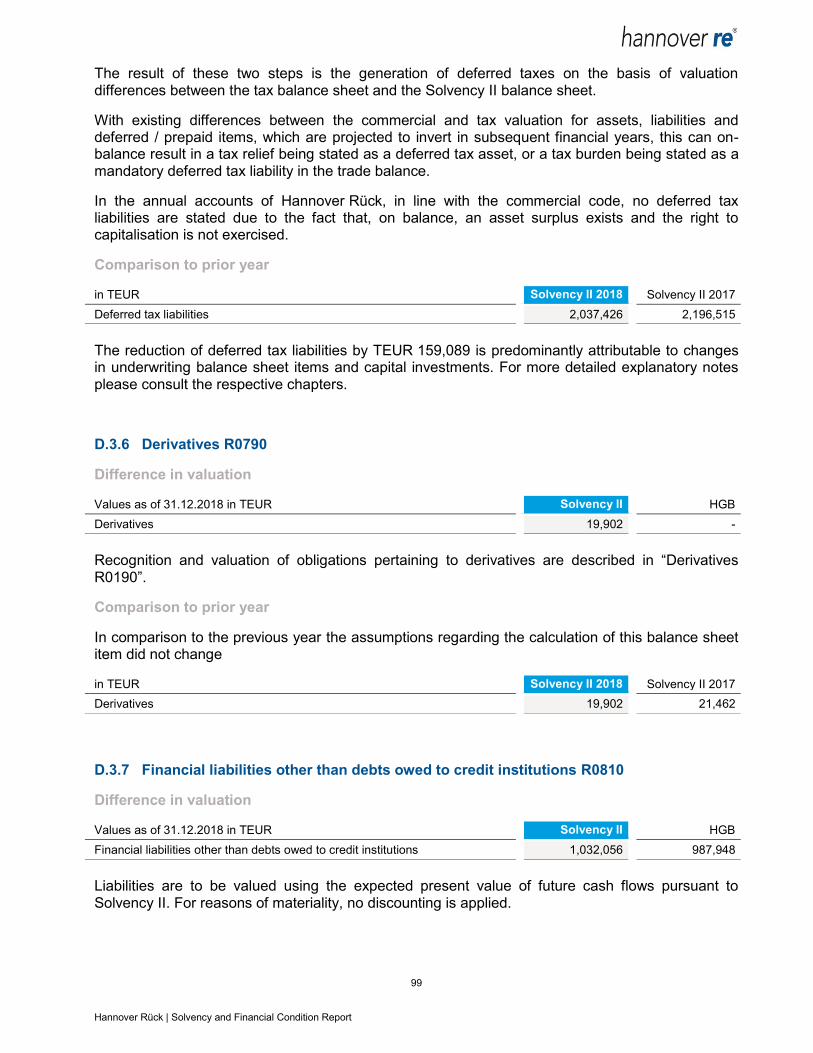
99 Hannover Rück | Solvency and Financial Condition Report
The result of these two steps is the generation of deferred taxes on the basis of valuation differences between the tax balance sheet and the Solvency II balance sheet.
With existing differences between the commercial and tax valuation for assets, liabilities and deferred / prepaid items, which are projected to invert in subsequent financial years, this can on-balance result in a tax relief being stated as a deferred tax asset, or a tax burden being stated as a mandatory deferred tax liability in the trade balance.
In the annual accounts of Hannover Rück, in line with the commercial code, no deferred tax liabilities are stated due to the fact that, on balance, an asset surplus exists and the right to capitalisation is not exercised.
Comparison to prior year
in TEUR Solvency II 2018 Solvency II 2017
Deferred tax liabilities 2,037,426 2,196,515
The reduction of deferred tax liabilities by TEUR 159,089 is predominantly attributable to changes in underwriting balance sheet items and capital investments. For more detailed explanatory notes please consult the respective chapters.
D.3.6 Derivatives R0790
Difference in valuation
Values as of 31.12.2018 in TEUR Solvency II HGB
Derivatives 19,902 -
Recognition and valuation of obligations pertaining to derivatives are described in “Derivatives R0190”.
Comparison to prior year
In comparison to the previous year the assumptions regarding the calculation of this balance sheet item did not change
in TEUR Solvency II 2018 Solvency II 2017
Derivatives 19,902 21,462
D.3.7 Financial liabilities other than debts owed to credit institutions R0810
Difference in valuation
Values as of 31.12.2018 in TEUR Solvency II HGB
Financial liabilities other than debts owed to credit institutions 1,032,056 987,948
Liabilities are to be valued using the expected present value of future cash flows pursuant to Solvency II. For reasons of materiality, no discounting is applied.
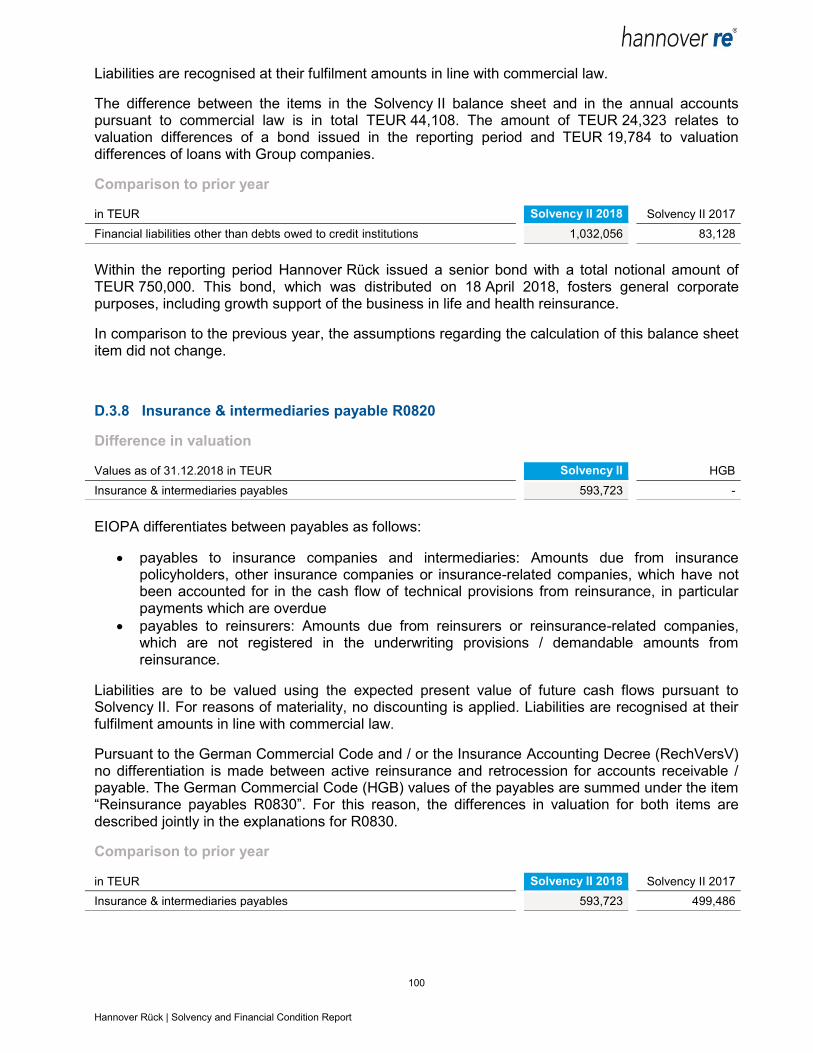
100 Hannover Rück | Solvency and Financial Condition Report
Liabilities are recognised at their fulfilment amounts in line with commercial law.
The difference between the items in the Solvency II balance sheet and in the annual accounts pursuant to commercial law is in total TEUR 44,108. The amount of TEUR 24,323 relates to valuation differences of a bond issued in the reporting period and TEUR 19,784 to valuation differences of loans with Group companies.
Comparison to prior year
in TEUR Solvency II 2018 Solvency II 2017
Financial liabilities other than debts owed to credit institutions 1,032,056 83,128
Within the reporting period Hannover Rück issued a senior bond with a total notional amount of TEUR 750,000. This bond, which was distributed on 18 April 2018, fosters general corporate purposes, including growth support of the business in life and health reinsurance.
In comparison to the previous year, the assumptions regarding the calculation of this balance sheet item did not change.
D.3.8 Insurance & intermediaries payable R0820
Difference in valuation
Values as of 31.12.2018 in TEUR Solvency II HGB
Insurance & intermediaries payables 593,723 -
EIOPA differentiates between payables as follows:
payables to insurance companies and intermediaries: Amounts due from insurance policyholders, other insurance companies or insurance-related companies, which have not been accounted for in the cash flow of technical provisions from reinsurance, in particular payments which are overdue
payables to reinsurers: Amounts due from reinsurers or reinsurance-related companies, which are not registered in the underwriting provisions / demandable amounts from reinsurance.
Liabilities are to be valued using the expected present value of future cash flows pursuant to Solvency II. For reasons of materiality, no discounting is applied. Liabilities are recognised at their fulfilment amounts in line with commercial law.
Pursuant to the German Commercial Code and / or the Insurance Accounting Decree (RechVersV) no differentiation is made between active reinsurance and retrocession for accounts receivable / payable. The German Commercial Code (HGB) values of the payables are summed under the item “Reinsurance payables R0830”. For this reason, the differences in valuation for both items are described jointly in the explanations for R0830.
Comparison to prior year
in TEUR Solvency II 2018 Solvency II 2017
Insurance & intermediaries payables 593,723 499,486
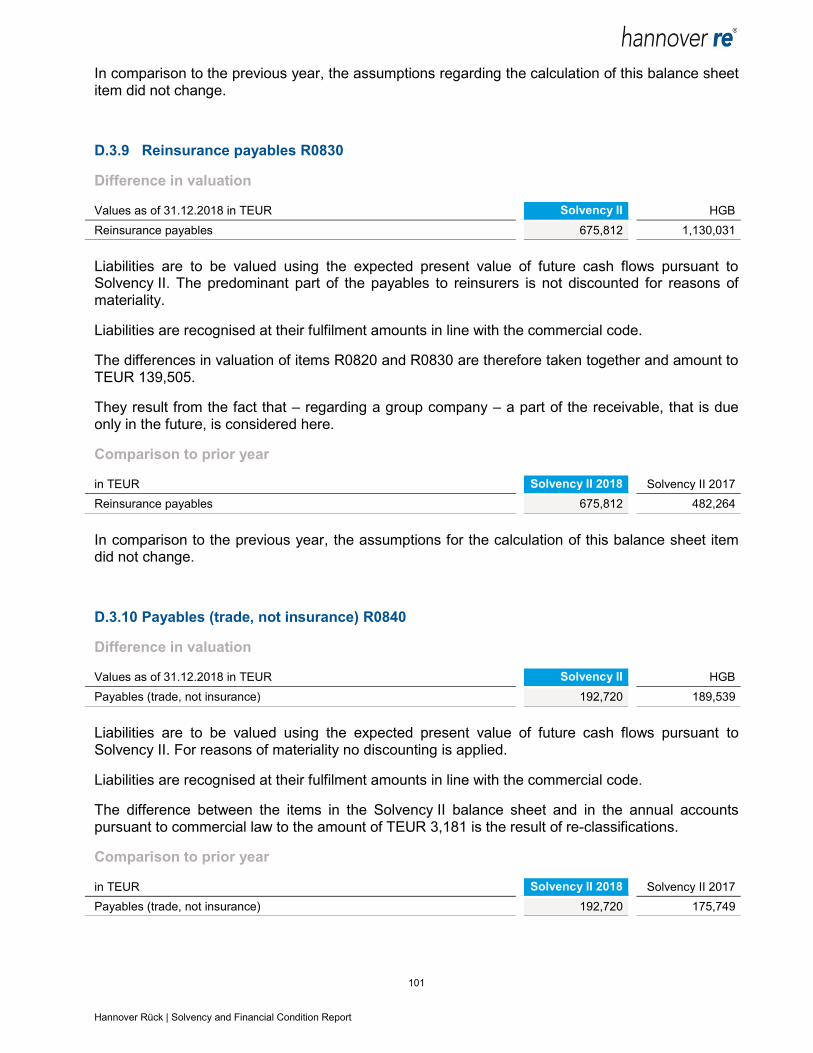
101 Hannover Rück | Solvency and Financial Condition Report
In comparison to the previous year, the assumptions regarding the calculation of this balance sheet item did not change.
D.3.9 Reinsurance payables R0830
Difference in valuation
Values as of 31.12.2018 in TEUR Solvency II HGB
Reinsurance payables 675,812 1,130,031
Liabilities are to be valued using the expected present value of future cash flows pursuant to Solvency II. The predominant part of the payables to reinsurers is not discounted for reasons of materiality.
Liabilities are recognised at their fulfilment amounts in line with the commercial code.
The differences in valuation of items R0820 and R0830 are therefore taken together and amount to TEUR 139,505.
They result from the fact that – regarding a group company – a part of the receivable, that is due only in the future, is considered here.
Comparison to prior year
in TEUR Solvency II 2018 Solvency II 2017
Reinsurance payables 675,812 482,264
In comparison to the previous year, the assumptions for the calculation of this balance sheet item did not change.
D.3.10 Payables (trade, not insurance) R0840
Difference in valuation
Values as of 31.12.2018 in TEUR Solvency II HGB
Payables (trade, not insurance) 192,720 189,539
Liabilities are to be valued using the expected present value of future cash flows pursuant to Solvency II. For reasons of materiality no discounting is applied.
Liabilities are recognised at their fulfilment amounts in line with the commercial code.
The difference between the items in the Solvency II balance sheet and in the annual accounts pursuant to commercial law to the amount of TEUR 3,181 is the result of re-classifications.
Comparison to prior year
in TEUR Solvency II 2018 Solvency II 2017
Payables (trade, not insurance) 192,720 175,749
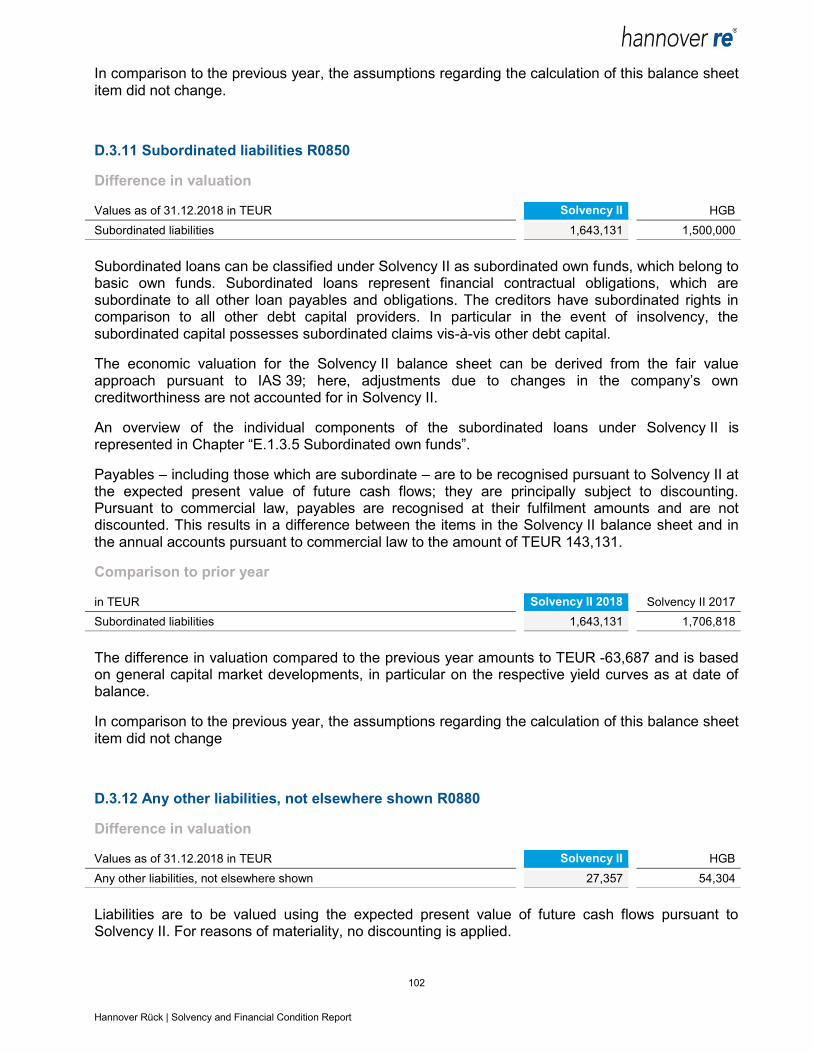
102 Hannover Rück | Solvency and Financial Condition Report
In comparison to the previous year, the assumptions regarding the calculation of this balance sheet item did not change.
D.3.11 Subordinated liabilities R0850
Difference in valuation
Values as of 31.12.2018 in TEUR Solvency II HGB
Subordinated liabilities 1,643,131 1,500,000
Subordinated loans can be classified under Solvency II as subordinated own funds, which belong to basic own funds. Subordinated loans represent financial contractual obligations, which are subordinate to all other loan payables and obligations. The creditors have subordinated rights in comparison to all other debt capital providers. In particular in the event of insolvency, the subordinated capital possesses subordinated claims vis-à-vis other debt capital.
The economic valuation for the Solvency II balance sheet can be derived from the fair value approach pursuant to IAS 39; here, adjustments due to changes in the company’s own creditworthiness are not accounted for in Solvency II.
An overview of the individual components of the subordinated loans under Solvency II is represented in Chapter “E.1.3.5 Subordinated own funds”.
Payables – including those which are subordinate – are to be recognised pursuant to Solvency II at the expected present value of future cash flows; they are principally subject to discounting. Pursuant to commercial law, payables are recognised at their fulfilment amounts and are not discounted. This results in a difference between the items in the Solvency II balance sheet and in the annual accounts pursuant to commercial law to the amount of TEUR 143,131.
Comparison to prior year
in TEUR Solvency II 2018 Solvency II 2017
Subordinated liabilities 1,643,131 1,706,818
The difference in valuation compared to the previous year amounts to TEUR -63,687 and is based on general capital market developments, in particular on the respective yield curves as at date of balance.
In comparison to the previous year, the assumptions regarding the calculation of this balance sheet item did not change
D.3.12 Any other liabilities, not elsewhere shown R0880
Difference in valuation
Values as of 31.12.2018 in TEUR Solvency II HGB
Any other liabilities, not elsewhere shown 27,357 54,304
Liabilities are to be valued using the expected present value of future cash flows pursuant to Solvency II. For reasons of materiality, no discounting is applied.
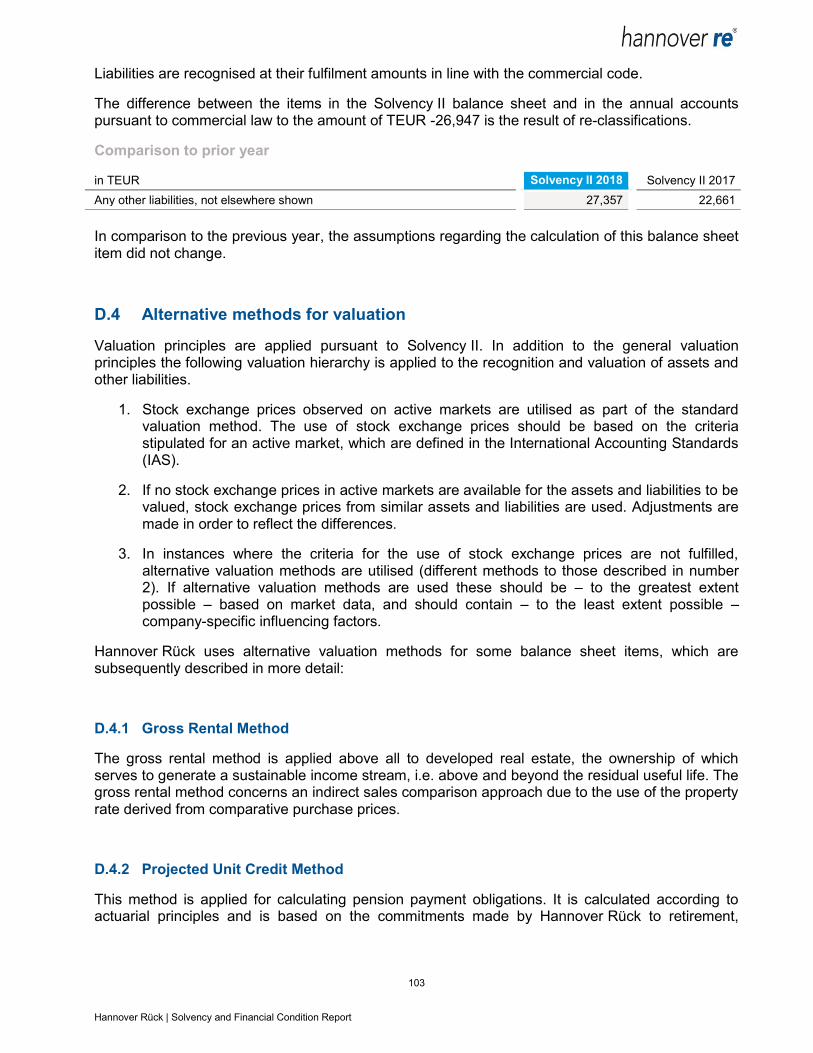
103 Hannover Rück | Solvency and Financial Condition Report
Liabilities are recognised at their fulfilment amounts in line with the commercial code.
The difference between the items in the Solvency II balance sheet and in the annual accounts pursuant to commercial law to the amount of TEUR -26,947 is the result of re-classifications.
Comparison to prior year
in TEUR Solvency II 2018 Solvency II 2017
Any other liabilities, not elsewhere shown 27,357 22,661
In comparison to the previous year, the assumptions regarding the calculation of this balance sheet item did not change.
D.4 Alternative methods for valuation
Valuation principles are applied pursuant to Solvency II. In addition to the general valuation principles the following valuation hierarchy is applied to the recognition and valuation of assets and other liabilities.
1. Stock exchange prices observed on active markets are utilised as part of the standard valuation method. The use of stock exchange prices should be based on the criteria stipulated for an active market, which are defined in the International Accounting Standards (IAS).
2. If no stock exchange prices in active markets are available for the assets and liabilities to be valued, stock exchange prices from similar assets and liabilities are used. Adjustments are made in order to reflect the differences.
3. In instances where the criteria for the use of stock exchange prices are not fulfilled, alternative valuation methods are utilised (different methods to those described in number 2). If alternative valuation methods are used these should be – to the greatest extent possible – based on market data, and should contain – to the least extent possible – company-specific influencing factors.
Hannover Rück uses alternative valuation methods for some balance sheet items, which are subsequently described in more detail:
D.4.1 Gross Rental Method
The gross rental method is applied above all to developed real estate, the ownership of which serves to generate a sustainable income stream, i.e. above and beyond the residual useful life. The gross rental method concerns an indirect sales comparison approach due to the use of the property rate derived from comparative purchase prices.
D.4.2 Projected Unit Credit Method
This method is applied for calculating pension payment obligations. It is calculated according to actuarial principles and is based on the commitments made by Hannover Rück to retirement,
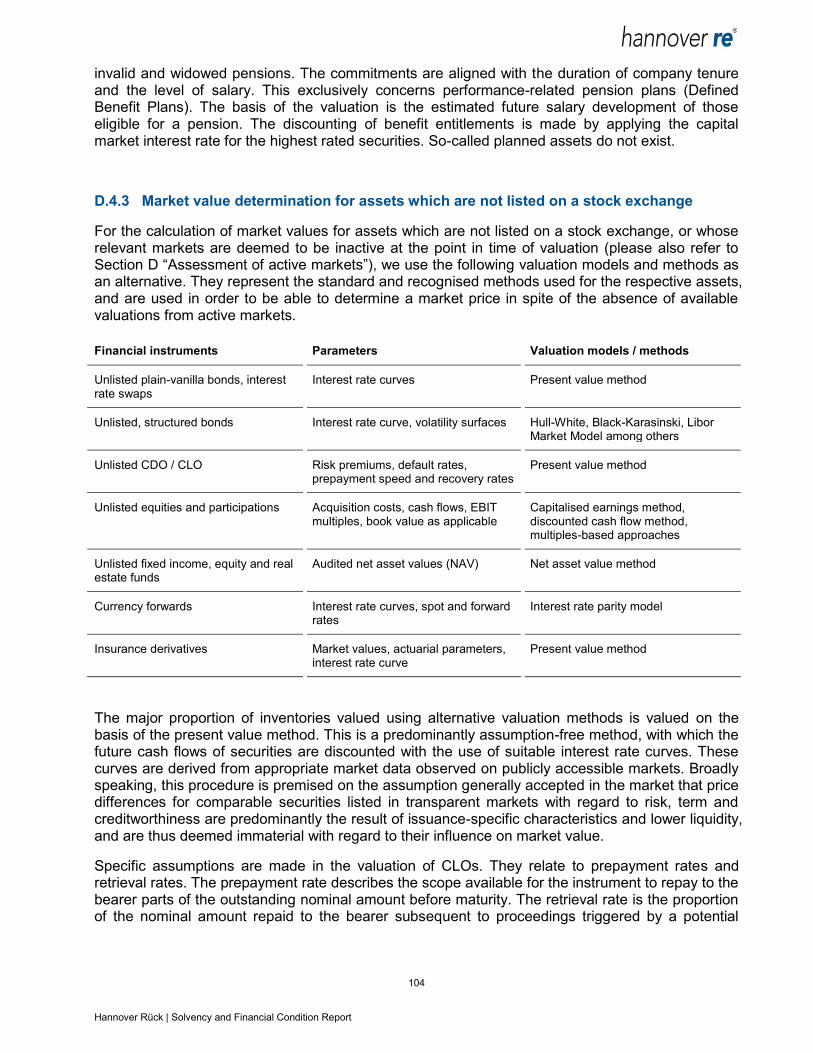
104 Hannover Rück | Solvency and Financial Condition Report
invalid and widowed pensions. The commitments are aligned with the duration of company tenure and the level of salary. This exclusively concerns performance-related pension plans (Defined Benefit Plans). The basis of the valuation is the estimated future salary development of those eligible for a pension. The discounting of benefit entitlements is made by applying the capital market interest rate for the highest rated securities. So-called planned assets do not exist.
D.4.3 Market value determination for assets which are not listed on a stock exchange
For the calculation of market values for assets which are not listed on a stock exchange, or whose relevant markets are deemed to be inactive at the point in time of valuation (please also refer to Section D “Assessment of active markets”), we use the following valuation models and methods as an alternative. They represent the standard and recognised methods used for the respective assets, and are used in order to be able to determine a market price in spite of the absence of available valuations from active markets.
Financial instruments Parameters Valuation models / methods
Unlisted plain-vanilla bonds, interest rate swaps
Interest rate curves Present value method
Unlisted, structured bonds Interest rate curve, volatility surfaces Hull-White, Black-Karasinski, Libor Market Model among others
Unlisted CDO / CLO Risk premiums, default rates, prepayment speed and recovery rates
Present value method
Unlisted equities and participations Acquisition costs, cash flows, EBIT multiples, book value as applicable
Capitalised earnings method, discounted cash flow method, multiples-based approaches
Unlisted fixed income, equity and real estate funds
Audited net asset values (NAV) Net asset value method
Currency forwards Interest rate curves, spot and forward rates
Interest rate parity model
Insurance derivatives Market values, actuarial parameters, interest rate curve
Present value method
The major proportion of inventories valued using alternative valuation methods is valued on the basis of the present value method. This is a predominantly assumption-free method, with which the future cash flows of securities are discounted with the use of suitable interest rate curves. These curves are derived from appropriate market data observed on publicly accessible markets. Broadly speaking, this procedure is premised on the assumption generally accepted in the market that price differences for comparable securities listed in transparent markets with regard to risk, term and creditworthiness are predominantly the result of issuance-specific characteristics and lower liquidity, and are thus deemed immaterial with regard to their influence on market value.
Specific assumptions are made in the valuation of CLOs. They relate to prepayment rates and retrieval rates. The prepayment rate describes the scope available for the instrument to repay to the bearer parts of the outstanding nominal amount before maturity. The retrieval rate is the proportion of the nominal amount repaid to the bearer subsequent to proceedings triggered by a potential
105 Hannover Rück | Solvency and Financial Condition Report
default. Both parameters are estimated with an industry-standard fixed value. They do, however, have a comparably limited influence on the valuation. The significant valuation parameters here are either directly observable market data, or are derived there from.
If particular structures are embedded into the security such as, for example, termination rights, further valuation models are also utilised such as, for example, the Hull-White Model or the Libor Market Model. The models calculate, for example, the probability of termination rights being exercised with the help of swaption volatilities. No noteworthy assumptions are utilised here either.
The use of models includes different model risks, which can lead to a degree of valuation uncertainty:
Modelling risk (appropriateness and suitability of the model)
Data quality risk (incomplete or obsolete data for the model calibration or parameterisation)
Risk pertaining to the validity of assumptions and estimations.
Risks in the model implementation
Through a process of regular validation in which a systematic, quantitative and qualitative assessment of the appropriateness of valuation models and methods is undertaken, model risks can be limited. Furthermore, the model results (for items which are predominantly valued using alternative valuation methods) are continuously subject to plausibility checks as part of daily quality assurance processes.
In the year under review, the valuation system used to calculate the theoretical value of bonds without publicly available price quotations was changed. No significant changes were made to the valuation models. Adjustments were made to the valuation parameters used (for example, the yield curves).
The change in market values due to the change in the valuation system or the adjustment of the valuation parameters was not material.
D.5 Any other information
Other information which has a significant influence on the valuation for solvency purposes are contingent liabilities and other financial obligations with a residual term longer than five years.
Hannover Rück placed two subordinated bonds in the European capital market via its subsidiary Hannover Finance (Luxembourg) S.A. The bonds from the years 2010 and 2012 each have a nominal volume of TEUR 500,000. The bonds benefit of a guarantee on a subordinated basis of Hannover Rück.
Hannover Rück uses pledges for the purposes of collateralising its underwriting obligations against cedants in the form of letters of credit (LoC), which have been issued by various banks. The overall volume amounts to TEUR 1,839,755. The letters of credit concluded by Hannover Rück protect both Hannover Rück directly and also its subsidiaries.
Hannover Rück is obligated under certain circumstances to defend and uphold the rights and obligations of its subsidiaries against third parties, due to novation clauses in reinsurance contracts. The subsidiaries have formed reserves totalling TEUR 953,340. During the financial year, the issuance of letters of comfort was waived.

106 Hannover Rück | Solvency and Financial Condition Report
Hannover Rück has submitted guarantees for affiliate companies against third parties totalling TUSD 5,650,800. Additionally guarantees are submitted totalling TGBP 10,000. The term of guarantees is determined by the secured obligations held by affiliate companies. Hannover Rück receives guarantee commissions for this. Furthermore, financial obligations against affiliate companies exist amounting to TUSD 300,000 in total and payment obligations against subsidiaries in South Africa resulting from written primary insurance and reinsurance business.
Hannover Rück receives collateral from its retrocessionaires for the safeguarding of receivables from retroceded business. The provision of collateral by the retrocessionaires takes places in the form of letters of credit (LoCs) and deposits among other forms. For the majority of our retrocessionaires we also function as reinsurer, meaning that in most cases recoverables can potentially be set off against our own liabilities.
Hannover Rück has residual payment obligations totalling TEUR 742,328 for special investments and shares in affiliate companies.

107 Hannover Rück | Solvency and Financial Condition Report
E. Capital Management
This section presents the main elements of Hannover Rück's capital management.
E.1 Own Funds
E.1.1 Management of own funds
Hannover Rück aims to achieve a capitalisation of at least 180% under Solvency II. In addition, a threshold of 200% is defined. Own funds are managed in such a way that the minimum capitalisation in the planning is not undercut. This is achieved through coordinated planning and management of all own funds components, dividend payments and the risk profile.
The capital management process contains a classification of all own funds components with regard to the Solvency II tiering specifications and an assessment of the availability of the different own funds components.
In general, it is our objective that our hybrid capital instruments correspond with tier 2 category requirements. The timing of each issue takes into account the current market conditions and our medium-term growth objectives. In case of a required replacement of a subordinated bond, the detailed replacement planning process normally begins a year before the regular call date.
Hannover Rück’s economic capital model is used for the evaluation of both the quantitatively measurable individual risks and also the overall risk position. The assumptions and calculation methods for the determination of the risk-bearing capacity of the company are recorded in the documentation of the risk model and in regular reports.
E.1.2 Tiering
The classification of own funds with regard to their ability to cover losses represents a central component of regulatory capital requirements pursuant to Solvency II. The individual components of the own funds will be classified into one of three quality classes (“tiers”).
Own fund items classified under tier 1 possess the highest degree of quality, due to the fact that they are permanently available. They equalise verifiably unexpected losses, both during ongoing business operations and in the event of a company liquidation. Tier 2 refers to basic own funds items and ancillary own funds items which possess the ability to equalise losses incurred in the event of a company liquidation. Own fund items, which are not categorised under tier 1 or tier 2, are categorised under tier 3. Tier 3 capital comprises deferred tax assets in accordance with Art. 76 of Delegate Regulation 2015/35. Deferred tax assets and liabilities against territorial authorities are offset and, in the case of a net receivable, reported as an own funds item. In the year under review, Hannover Re reported deferred net tax assets against Canada, the People's Republic of China and the Republic of India.
E.1.3 Basic own funds
The following table displays the composition of basic own funds held by Hannover Rück as of 31. December 2018.
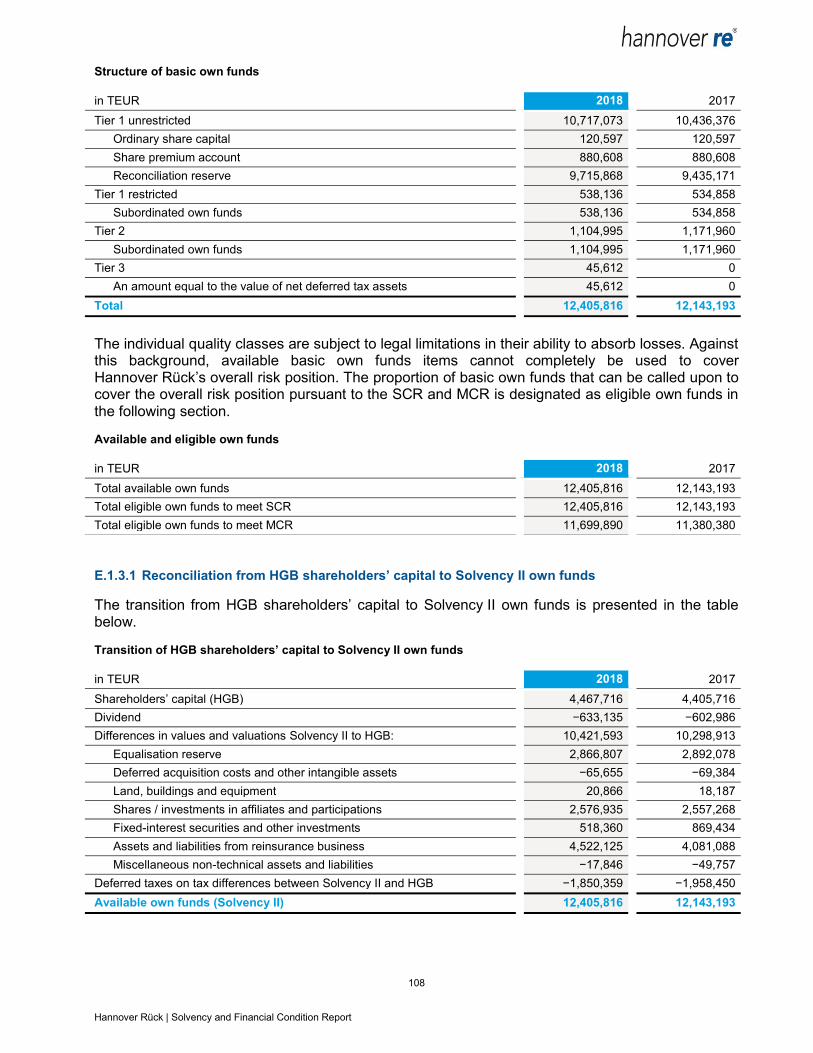
108 Hannover Rück | Solvency and Financial Condition Report
Structure of basic own funds
in TEUR 2018 2017
Tier 1 unrestricted 10,717,073 10,436,376
Ordinary share capital 120,597 120,597
Share premium account 880,608 880,608
Reconciliation reserve 9,715,868 9,435,171
Tier 1 restricted 538,136 534,858
Subordinated own funds 538,136 534,858
Tier 2 1,104,995 1,171,960
Subordinated own funds 1,104,995 1,171,960
Tier 3 45,612 0
An amount equal to the value of net deferred tax assets 45,612 0
Total 12,405,816 12,143,193
The individual quality classes are subject to legal limitations in their ability to absorb losses. Against this background, available basic own funds items cannot completely be used to cover Hannover Rück’s overall risk position. The proportion of basic own funds that can be called upon to cover the overall risk position pursuant to the SCR and MCR is designated as eligible own funds in the following section.
Available and eligible own funds
in TEUR 2018 2017
Total available own funds 12,405,816 12,143,193
Total eligible own funds to meet SCR 12,405,816 12,143,193
Total eligible own funds to meet MCR 11,699,890 11,380,380
E.1.3.1 Reconciliation from HGB shareholders’ capital to Solvency II own funds
The transition from HGB shareholders’ capital to Solvency II own funds is presented in the table below.
Transition of HGB shareholders’ capital to Solvency II own funds
in TEUR 2018 2017
Shareholders’ capital (HGB) 4,467,716 4,405,716
Dividend −633,135 −602,986
Differences in values and valuations Solvency II to HGB: 10,421,593 10,298,913
Equalisation reserve 2,866,807 2,892,078
Deferred acquisition costs and other intangible assets −65,655 −69,384
Land, buildings and equipment 20,866 18,187
Shares / investments in affiliates and participations 2,576,935 2,557,268
Fixed-interest securities and other investments 518,360 869,434
Assets and liabilities from reinsurance business 4,522,125 4,081,088
Miscellaneous non-technical assets and liabilities −17,846 −49,757
Deferred taxes on tax differences between Solvency II and HGB −1,850,359 −1,958,450
Available own funds (Solvency II) 12,405,816 12,143,193

109 Hannover Rück | Solvency and Financial Condition Report
E.1.3.2 Ordinary share capital
Ordinary capital of Hannover Rück stands at TEUR 120,597 at date of balance. The shares have been paid up in full. The share capital is divided into 120,597,134 no-par value registered shares which carry both voting and dividend rights. Every share grants the same right to vote and same dividend entitlement. As at the balance sheet date no treasury shares were held by the company.
During the reporting period, no new shares were issued.
The share capital paid in and the corresponding share premium in the capital reserve form the own funds bearing the highest degree of quality, which can be relied upon to equalise losses in the course of business operations.
E.1.3.3 Share premium account
The share premium in relation to the share capital of Hannover Rück stands at TEUR 880,608 at date of balance.
The capital reserve is a separate item to which premiums, the amount between the value attained at the point in time of issuance and the value recorded in the share capital, are transferred in accordance with national statutory provisions.
E.1.3.4 Reconciliation reserve
The reconciliation reserve pursuant to Solvency II represents an item of basic own funds attributable (in unlimited capacity) to category tier 1. It primarily comprises the excess of assets over liabilities, adjusted by the ordinary capital, the share premium and shareholder dividend payouts.
At the balance sheet date, the reconciliation reserve was TEUR 9,715,868. The reconciliation increased by TEUR 280,698 during the reporting period.
The reconciliation reserve represents reserves (in particular retained earnings) less value adjustments (e.g. ring-fenced funds); it does, moreover, harmonise the differences between the accounting valuation pursuant to the German Commercial Code (HGB) and the valuation pursuant to the Directive 2009/138/EC.
E.1.3.5 Subordinated own funds
Hannover Rück held a subordinated debt and two subordinated loans in its portfolio at the balance sheet date, which fulfil the criteria stipulated under Solvency II pertaining to subordinated liabilities, and which thus can be categorised under basic own funds.
During the reporting period, no new subordinated own funds were issued.
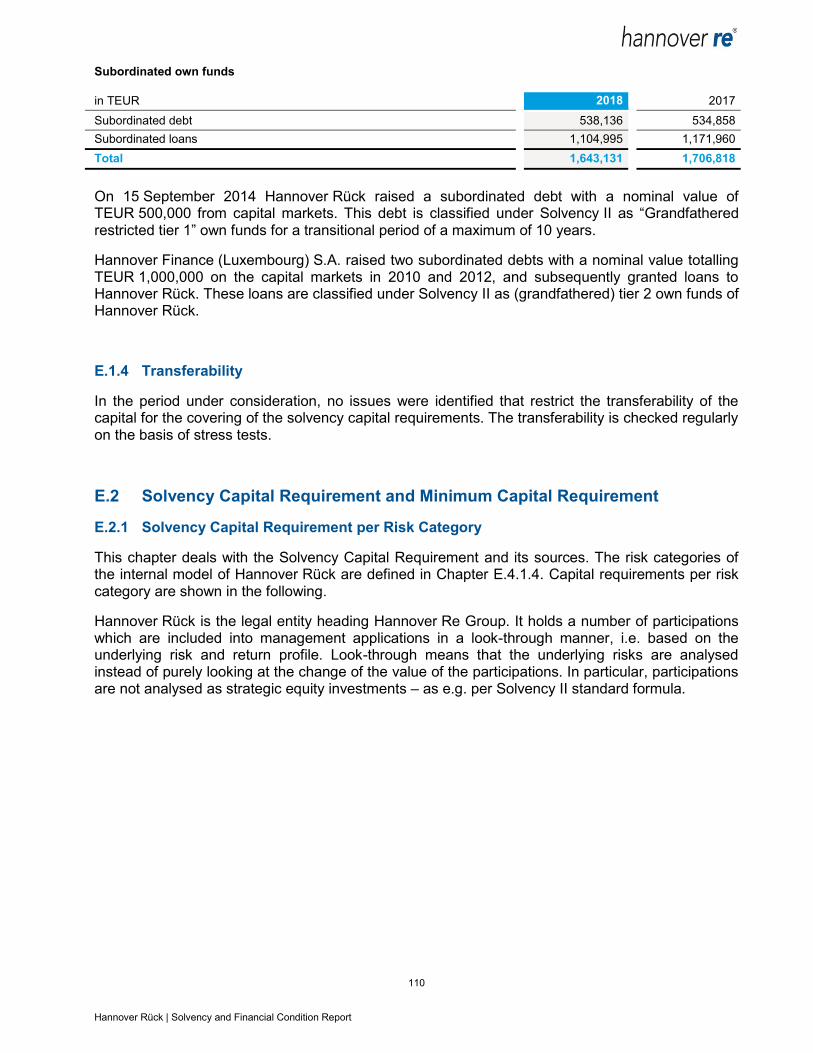
110 Hannover Rück | Solvency and Financial Condition Report
Subordinated own funds
in TEUR 2018 2017
Subordinated debt 538,136 534,858
Subordinated loans 1,104,995 1,171,960
Total 1,643,131 1,706,818
On 15 September 2014 Hannover Rück raised a subordinated debt with a nominal value of TEUR 500,000 from capital markets. This debt is classified under Solvency II as “Grandfathered restricted tier 1” own funds for a transitional period of a maximum of 10 years.
Hannover Finance (Luxembourg) S.A. raised two subordinated debts with a nominal value totalling TEUR 1,000,000 on the capital markets in 2010 and 2012, and subsequently granted loans to Hannover Rück. These loans are classified under Solvency II as (grandfathered) tier 2 own funds of Hannover Rück.
E.1.4 Transferability
In the period under consideration, no issues were identified that restrict the transferability of the capital for the covering of the solvency capital requirements. The transferability is checked regularly on the basis of stress tests.
E.2 Solvency Capital Requirement and Minimum Capital Requirement
E.2.1 Solvency Capital Requirement per Risk Category
This chapter deals with the Solvency Capital Requirement and its sources. The risk categories of the internal model of Hannover Rück are defined in Chapter E.4.1.4. Capital requirements per risk category are shown in the following.
Hannover Rück is the legal entity heading Hannover Re Group. It holds a number of participations which are included into management applications in a look-through manner, i.e. based on the underlying risk and return profile. Look-through means that the underlying risks are analysed instead of purely looking at the change of the value of the participations. In particular, participations are not analysed as strategic equity investments – as e.g. per Solvency II standard formula.
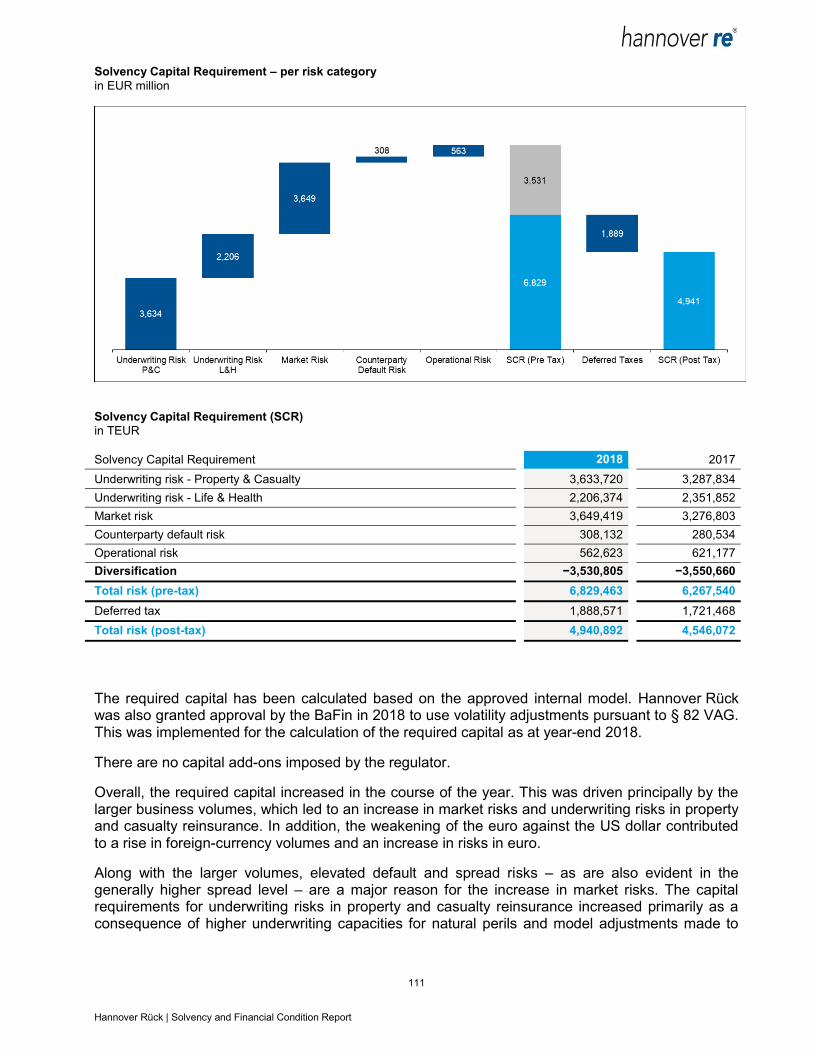
111 Hannover Rück | Solvency and Financial Condition Report
Solvency Capital Requirement – per risk category
in EUR million
Solvency Capital Requirement (SCR)
in TEUR
Solvency Capital Requirement 2018 2017
Underwriting risk - Property & Casualty 3,633,720 3,287,834
Underwriting risk - Life & Health 2,206,374 2,351,852
Market risk 3,649,419 3,276,803
Counterparty default risk 308,132 280,534
Operational risk 562,623 621,177
Diversification −3,530,805 −3,550,660
Total risk (pre-tax) 6,829,463 6,267,540
Deferred tax 1,888,571 1,721,468
Total risk (post-tax) 4,940,892 4,546,072
The required capital has been calculated based on the approved internal model. Hannover Rück was also granted approval by the BaFin in 2018 to use volatility adjustments pursuant to § 82 VAG. This was implemented for the calculation of the required capital as at year-end 2018.
There are no capital add-ons imposed by the regulator.
Overall, the required capital increased in the course of the year. This was driven principally by the larger business volumes, which led to an increase in market risks and underwriting risks in property and casualty reinsurance. In addition, the weakening of the euro against the US dollar contributed to a rise in foreign-currency volumes and an increase in risks in euro.
Along with the larger volumes, elevated default and spread risks – as are also evident in the generally higher spread level – are a major reason for the increase in market risks. The capital requirements for underwriting risks in property and casualty reinsurance increased primarily as a consequence of higher underwriting capacities for natural perils and model adjustments made to

112 Hannover Rück | Solvency and Financial Condition Report
specific large loss models. The underwriting risks in life and health reinsurance decreased due to a reduced exposure to longevity and mortality risks. This contrasts with a higher exposure to morbidity risks resulting from expansion of the business. The increase in counterparty default risks can be attributed principally to a higher volume of receivables due from ceding companies and retrocessionaires as well as elevated volatility of the modelled losses due to generally increased credit spreads. The decrease in operational risks can be attributed above all to an updated expert assessment regarding the impact of individual scenarios.
The loss-absorbing effect of taxes remained stable. The slight decline in the diversification effect reflects the increase in certain key risks, namely the market risk and the underwriting risk in property and casualty reinsurance.
The following table displays the Solvency Capital Requirement and the ratio of eligible own funds to SCR taking into account tiering restrictions.
Ratio of eligible own funds to Solvency Capital Requirement
in TEUR 2018 2017
Eligible own funds 12,405,816 12,143,193
SCR 4,940,892 4,546,072
Ratio of eligible own funds to SCR 251% 267%
E.2.2 Minimum Capital Requirement
The following table displays the Minimum Capital Requirement and the ratio of eligible own funds to MCR taking into account tiering restrictions.
Ratio of eligible own funds to Minimum Capital Requirement
in TEUR 2018 2017
Eligible own funds 11,699,890 11,380,380
MCR 2,223,401 2,045,733
Ratio of eligible own funds to MCR 526% 556%
The MCR increases due to the higher SCR (reasons are given above). The reason is the upper cap of the MCR to 45% of SCR.
E.3 Use of the duration-based equity risk sub-module in the calculation of the Solvency Capital Requirement
Germany did make no use of the option to allow the utilisation of a duration-based equity risk sub-module.
Consequently, Hannover Rück does not use a duration-based equity risk sub-module in the calculation of the Solvency Capital Requirement.
113 Hannover Rück | Solvency and Financial Condition Report
E.4 Differences between the standard formula and any internal model used
E.4.1 The internal model
Hannover Rück received approval from the regulatory authorities to calculate its solvency requirements using a partial internal capital model with effect from the entry into force of Solvency II on 1 January 2016. The capital requirements for underwriting risk P&C and L&H, market risk and counterparty default risk are determined according to the internal model, the capital requirements for operational risks were calculated according to the Solvency II standard formula. In March 2018, Hannover Rück additionally received permission from the Federal Financial Supervisory Authority (BaFin) to calculate the operational risk using the internal model retroactively from year-end reporting 2017 onwards and thus has a full internal model.
This section provides further information regarding the internal capital model.
E.4.1.1 Introduction
The quantitative risk management of Hannover Rück provides a standardised framework for the assessment and management of all risks facing our undertaking and capital position. In this context, the internal model is our key instrument. It is a stochastic enterprise model, covering all subsidiaries and business areas of Hannover Rück.
The central key figure in risk and company management is the economic capital, which is evaluated according to market-consistent valuation principles and the basis for calculation of the Solvency II capital.
The internal model of Hannover Rück reflects all risks influencing the development of the economic capital. These risks are classified into underwriting, market, counterparty default and operational risks. For each of these risk categories, we have determined a series of risk factors for which we define a probability distribution. Risk factors are, as for instance, economic indicators, like interest rates, exchange rates and inflation rates, as well as insurance-specific indicators such as the mortality rates in a specific age group of our insurance portfolio in a certain country, or the number of natural disasters in a certain region and the insured loss per disaster.
We use publicly accessible and historical data to specify the probability distributions of risk factors. In addition, we use industry specific and internal (re-)insurance data of Hannover Rück. The judgement of internal and external experts supplements this process. The suitability of probability distributions is subject to regular review by our specialist departments and verified in conjunction with the regular company-wide application of the capital model and allocation of costs of capital. Hannover Rück calculates the required capital using the Value at Risk (VaR) reflecting the changes in economic value over a period of one year with a confidence level of 99.97%. This is equivalent to the target to limit the ruin probability over a horizon of one year to 0.03%. The internal target capitalisation of Hannover Rück is significantly larger than that to a confidence level of 99.5% as required by Solvency II.
The internal capital model uses state of the art techniques of insurance and financial mathematics. In case of underwriting risks, we draw on a comprehensive history of internal data to estimate probability distributions, e.g., for reserving risk. In the context of natural catastrophe risks, we use external models that we adjusted in the course of detailed internal reviews to represent our risk profile adequately. For Life and Health reinsurance we determine long-term cash flows for different scenarios. The determination of scenarios and probability distributions is based on internal data for
114 Hannover Rück | Solvency and Financial Condition Report
all mentioned risks. The internal data base is enriched with parameters set by experts. These parameters are of importance in particular in the area of extreme events that have not been observed by now.
The aggregation of single risks takes into account dependencies between risk factors. Dependencies arise, e.g., during financial crises, which affect several market segments at the same time. Furthermore, market phenomena such as pricing cycles can cause dependencies over time. We generally assume that extreme events do not occur all simultaneously. The absence of complete dependency is denoted as diversification. Hannover Rück’s business model is based i.a. on establishing a preferably well-balanced portfolio such that a significant diversification effect is achieved and the capital can be used efficiently. Diversification effects exist between reinsurance contracts, divisions, business segments and risks. Given the costs of capital of our business segments, divisions and on their contribution to the diversification effect, we determine the costs of capital that have to be achieved per single business units.
E.4.1.2 Basic principles
A key purpose of the capital model of Hannover Rück relates to the calculation of the required and available capital for Hannover Rück. The principles outlined below are the manifestation of Hannover Rück’s risk capacity and how it is consistently measured within a quantitative framework.
Target variable: Our main target variable for the calculation of risk based capital is the deviation of the net asset value (or own funds) from its expected value.
Time horizon: For calculating the required capital a one year time horizon is considered.
Risk measure: We use two statistics to measure and allocate risk capital, namely the Value-at-Risk (VaR) and the Expected Shortfall (ES).
Ongoing business operations: We operate on the premise of existing business and a going-concern assumption.
New business assumptions: We consider one year of new business. This assumption holds for all lines of business.
Stochastic simulation: The capital model of Hannover Rück is based on stochastic simulations, i.e. we generate discrete approximations for the probability distribution of our target variables.
Consolidation method: The capital model of Hannover Rück comprises all business units by using the consolidation method. Deduction and aggregation as defined under Solvency II as an alternative method is not applied.
The capital model uses a stochastic simulation model for the purposes of implementing these principles, which combines random variables using the company-specific dependency structure.
E.4.1.3 Main applications
Hannover Rück considers its internal capital model a key component of its enterprise risk management system to analyse its overall risk position, to quantify risks and to determine the economic capital required to meet those risks.

115 Hannover Rück | Solvency and Financial Condition Report
Main applications are:
Assessment of the overall required capital
Capital consumption by each risk category
Capital allocation for pricing and performance measurement
Risk budgeting, limit allocation and monitoring
Assessment of risk mitigation strategies
Strategic asset allocation
Assessment of new business
E.4.1.4 Scope of the model
Hannover Rück’s risk landscape comprises the main risk categories underwriting risks (life and non-life), market risks, counterparty default risks, operational risks and other risks (see chapter “C. Risk Profile”).
The risk categories addressed by the internal model of Hannover Rück using a quantitative model are the categories underwriting risk life, underwriting risk non-life, market risk, counterparty default risk and operational risk. These risks and their interactions are accounted for in the presentation of target variables through the application of stochastic simulation models. Concentration risk is taken into account in the calculations of required capital for each risk category.
Hannover Rück is the legal entity heading Hannover Re Group. It holds a number of participations, which are included into management applications in a look-through manner, i.e. based on the underlying risk and return profile. Regarding the structure of Hannover Re Group see chapter “A.1.4 Group structure”.
E.4.2 Calculation techniques for the purposes of integrating results into the standard formula
With the approval of the internal model for operational risk, Hannover Rück uses a full internal model. In consequence, there are no results of standard formula modules which have to be integrated in the internal model.
E.4.2.1 Type and suitability of data
Hannover Rück has a comprehensive internal control system in place to ensure quality and timeliness of data. The specific data used in the internal model is documented in the data requirements for the different modules and interfaces. All data used in the internal model is subject to the data standards for the internal model. This set-up is appropriate to provide for timely data that is free of material errors.
Hannover Rück utilises the relevant historical company data, in order to calibrate the model –
above all for the underwriting risk. Generally speaking, company data relating to insurance performance within non-life is available for more than 30 years. This is deemed sufficiently historical information. However, due to the particular characteristics of early underwriting years, e.g. low premium volume, changing business segmentation or non-representative market segments, only portions of this data are used as part of the internal model calibration.
116 Hannover Rück | Solvency and Financial Condition Report
Internal company data, above all for the model validation, is used for underwriting risk pertaining to life and health insurance, due to the fact that only a limited number of significant (and thus rare) deviations are available that are suitable for the calibration of extreme events.
Long-term market data is used for the calibration of the market and counterparty risk model.
The operational risk model is based on information retrieved from a self-assessment process with experts from all relevant units and departments. Wherever possible available data and additional information are used. Given the limited history of operational risk events as well as the low frequency and high severity character of some operational risks, Hannover Re is convinced that input parameters for the SCR calculation cannot be solely derived by quantitative methods.
In general, Hannover Rück relies on data that is used in other business applications, too, as often as appropriate to ensure consistent use of information within the company. Examples are the technical provisions which are calculated as part of the Solvency II balance sheet process and data items used in the accounting process under IFRS, thereby providing an anchor to other established reporting processes. Thus, many data items are subject to multiple quality checks and internal as well as external review.
E.4.3 Comparison between the internal model and the standard formula
The standard formula is designed to fit a typical European (or EEA) primary insurer. As a consequence, mainly European data has been used to calibrate the standard formula.
There are many aspects which make Hannover Rück quite different from a typical European primary insurer, in particular, its access to global diversification across regions, markets, cedents and all lines of business. The difference in diversification is the driving force of differences between the standard formula and the internal model for life, health and non-life underwriting risk. It also has some influence on counterparty and market risk.
The standard formula offers a detailed module for the quantification of EU natural catastrophe risk. Due to its focus it does offer a very broad, premium-based approximation for non-EU and non-proportional natural catastrophe risk, only. Hannover Rück assumes more than 70% of its natural catastrophe risk outside the EU and thus has a detailed internal model for such risks.
The standard formula is designed for a single primary insurer and thus has no module to recognise diversification between different primary insurers. The latter is an important feature of Hannover Rück’s internal model and founded on Hannover Rück’s internal data analysis.
The standard formula allows for appropriate recognition of some but not all reinsurance structures. For example multi-line covers are not fully effective. The internal model is able to recognise all retrocession structures currently implemented by Hannover Rück.
Technically, the internal model is a stochastic approach while the standard formula is a factor-based (deterministic) approach. The concept for underlying risk factors is in many areas similar, e.g. for market and counterparty risk, but in general more detailed in Hannover Rück’s internal model. Hannover Rück’s internal model allows for bottom-up, non-linear dependency structures within and between market, underwriting, operational and counterparty risk.
117 Hannover Rück | Solvency and Financial Condition Report
E.5 Non-compliance with the Minimum Capital Requirement and non-compliance with the Solvency Capital Requirement
Both solvency and minimum capital requirements were complied with at all times during the period under consideration.
E.6 Any other information
Other information that has a significant influence on capital management is not available.
118 Hannover Rück | Solvency and Financial Condition Report
Abbreviations and glossary
Advanced Solutions: Structured and tailor-made reinsurance solutions to assist our clients with
their capital management, provide solvency relief or protection against strain of frequency losses.
AF: Actuarial function
BaFin: Bundesanstalt für Finanzdienstleistungsaufsicht, Federal Financial Supervisory Authority
BEL: Best Estimate Liability
CDO: Collateralised Debt Obligation
CLO: Collateralised Loan Obligation
CEO: Chief Executive Officer
CFO: Chief Financial Officer
EBIT: Earnings before interest and taxes
EEA: European Economic Area
EIOPA: European Insurance and Occupational Pensions Authority
E+S Rück: E+S Rückversicherung AG, Hannover
GA: Group Auditing, internal audit of the Hannvor Re Group
Hannover Rück: Hannover Rück SE, Hannover, Germany
HDI: HDI Haftpflichtverband der Deutschen Industrie V.a.G., Hannover, Germany
HGB: Handelsgesetzbuch, German Commercial Code
Home Office: The expression „Home Office“ comprises Hannover Rück and E+S Rück.
IAS: International Accounting Standard
ICS: Internal Control System
IFRS: International Financial Reporting Standards
L&H: Life and Health
MCR: Minimum Capital Requirement
ORSA: Own Risk and Solvency Assessment
P&C: Property and Casualty
RechVersV: Verordnung über die Rechnungslegung von Versicherungsunternehmen (Versiche-
rungsunternehmens-Rechnungslegungsverordnung), Insurance accounting regulation
RM: Risk margin
RMF: Risk Management Function
119 Hannover Rück | Solvency and Financial Condition Report
SCR: Solvency Capital Requirement
SII: Solvency II
Talanx: Talanx AG, Hannover
TP: Technical provisions
VAG: Gesetz über die Beaufsichtigung der Versicherungsunternehmen (Versicherungsaufsichts-
gesetz), Insurance Supervision Act
VaR: Value-at-Risk
WpHG: Gesetz über den Wertpapierhandel (Wertpapierhandelsgesetz), German Securities Trading
Act
WpÜG: Wertpapiererwerbs- und Übernahmegesetz, German Securities Acquisition and Takeover
Act
120 Hannover Rück | Solvency and Financial Condition Report
Quantitative Reporting Templates
All values are shown in TEUR if not otherwise stated.
Values below TEUR 0.5 are displayed as “0”. Empty cells represent the fact that Hannover Rück has no value to state.
Hannover Rück was granted approval by the BaFin in 2018 to use volatility adjustments pursuant to § 82 VAG. Thus the template “S.22.01.21 Impact of long term guarantees and transitional measures” does apply for the first time in the year under review.
Additional disclosure according to Art. 192 (2) of the Delegated Regulation 2015/35
Hannover Rück has collateral arrangements with a total value well below 60% of total assets. The threshold of 60% is defined in Art. 192 (2) of the Delegated Regulation 2015/35. This information is relevant to calculate the counterparty default risk with respect to Hannover Rück in the Solvency II standard formula.

121 Hannover Rück | Solvency and Financial Condition Report
S.02.01.02: Balance sheet
S.02.01.02: Balance sheet, page 1 Solvency II
Assets C0010
Intangible assets R0030
Deferred tax assets R0040 187,067
Pension benefit surplus R0050
Property, plant & equipment held for own use R0060 54,740
Investments (other than assets held for index-linked and unit-linked contracts) R0070 31,995,392
Property (other than for own use) R0080 17,132
Holdings in related undertakings, including participations R0090 9,894,599
Equities R0100 5,193
Equities - listed R0110 5,193
Equities - unlisted R0120 0
Bonds R0130 19,980,549
Government Bonds R0140 10,693,573
Corporate Bonds R0150 8,675,226
Structured notes R0160 143,128
Collateralised securities R0170 468,622
Collective Investments Undertakings R0180 1,746,523
Derivatives R0190 45,853
Deposits other than cash equivalents R0200 305,542
Other investments R0210
Assets held for index-linked and unit-linked contracts R0220
Loans and mortgages R0230
Loans on policies R0240
Loans and mortgages to individuals R0250
Other loans and mortgages R0260
Reinsurance recoverables from: R0270 3,497,229
Non-life and health similar to non-life R0280 3,026,701
Non-life excluding health R0290 2,820,873
Health similar to non-life R0300 205,828
Life and health similar to life, excluding health and index-linked and unit-linked R0310 470,528
Health similar to life R0320 359,428
Life excluding health and index-linked and unit-linked R0330 111,100
Life index-linked and unit-linked R0340
Deposits to cedants R0350 402,513
Insurance and intermediaries receivables R0360 2,840,556
Reinsurance receivables R0370 81,013
Receivables (trade, not insurance) R0380 563,885
Own shares (held directly) R0390
Amounts due in respect of own fund items or initial fund called up but not yet paid in R0400
Cash and cash equivalents R0410 388,560
Any other assets, not elsewhere shown R0420 82,349
Total assets R0500 40,093,303

122 Hannover Rück | Solvency and Financial Condition Report
S.02.01.02: Balance sheet, page 2 Solvency II
Liabilities C0010
Technical provisions – non-life R0510 18,992,149
Technical provisions – non-life (excluding health) R0520 17,520,526
Technical provisions calculated as a whole R0530
Best Estimate R0540 17,194,762
Risk margin R0550 325,764
Technical provisions - health (similar to non-life) R0560 1,471,623
Technical provisions calculated as a whole R0570
Best Estimate R0580 1,442,917
Risk margin R0590 28,705
Technical provisions - life (excluding index-linked and unit-linked) R0600 2,759,038
Technical provisions - health (similar to life) R0610 809,381
Technical provisions calculated as a whole R0620
Best Estimate R0630 708,800
Risk margin R0640 100,580
Technical provisions – life (excluding health and index-linked and unit-linked) R0650 1,949,658
Technical provisions calculated as a whole R0660
Best Estimate R0670 1,416,169
Risk margin R0680 533,488
Technical provisions – index-linked and unit-linked R0690 −18,395
Technical provisions calculated as a whole R0700
Best Estimate R0710 −19,288
Risk margin R0720 893
Contingent liabilities R0740 3,334
Provisions other than technical provisions R0750 109,312
Pension benefit obligations R0760 131,375
Deposits from reinsurers R0770 498,542
Deferred tax liabilities R0780 2,037,426
Derivatives R0790 19,902
Debts owed to credit institutions R0800
Financial liabilities other than debts owed to credit institutions R0810 1,032,056
Insurance & intermediaries payables R0820 593,723
Reinsurance payables R0830 675,812
Payables (trade, not insurance) R0840 192,720
Subordinated liabilities R0850 1,643,131
Subordinated liabilities not in Basic Own Funds R0860
Subordinated liabilities in Basic Own Funds R0870 1,643,131
Any other liabilities, not elsewhere shown R0880 27,357
Total liabilities R0900 28,697,483
Excess of assets over liabilities R1000 11,395,820
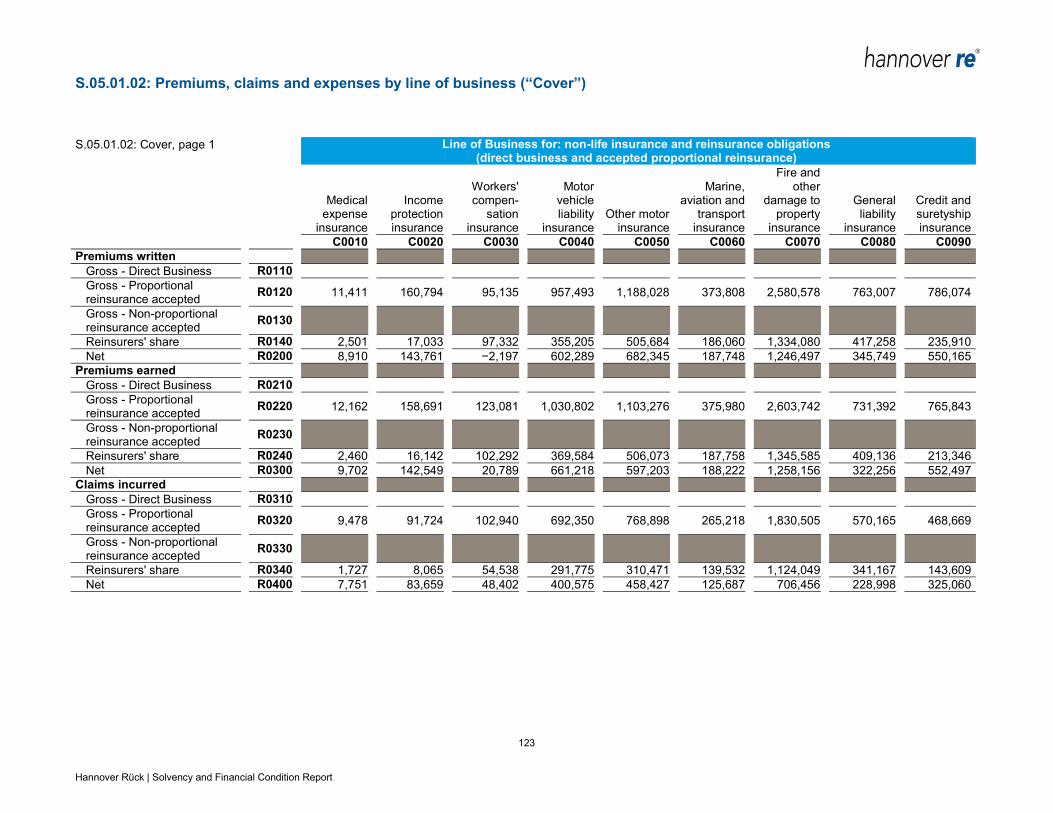
123 Hannover Rück | Solvency and Financial Condition Report
S.05.01.02: Premiums, claims and expenses by line of business (“Cover”)
S.05.01.02: Cover, page 1 Line of Business for: non-life insurance and reinsurance obligations (direct business and accepted proportional reinsurance)
Medical expense
insurance
Income protection insurance
Workers' compen-
sation insurance
Motor vehicle liability
insurance Other motor
insurance
Marine, aviation and
transport insurance
Fire and other
damage to property
insurance
General liability
insurance
Credit and suretyship insurance
C0010 C0020 C0030 C0040 C0050 C0060 C0070 C0080 C0090
Premiums written
Gross - Direct Business R0110
Gross - Proportional reinsurance accepted
R0120 11,411 160,794 95,135 957,493 1,188,028 373,808 2,580,578 763,007 786,074
Gross - Non-proportional reinsurance accepted
R0130
Reinsurers' share R0140 2,501 17,033 97,332 355,205 505,684 186,060 1,334,080 417,258 235,910
Net R0200 8,910 143,761 −2,197 602,289 682,345 187,748 1,246,497 345,749 550,165
Premiums earned
Gross - Direct Business R0210
Gross - Proportional reinsurance accepted
R0220 12,162 158,691 123,081 1,030,802 1,103,276 375,980 2,603,742 731,392 765,843
Gross - Non-proportional reinsurance accepted
R0230
Reinsurers' share R0240 2,460 16,142 102,292 369,584 506,073 187,758 1,345,585 409,136 213,346
Net R0300 9,702 142,549 20,789 661,218 597,203 188,222 1,258,156 322,256 552,497
Claims incurred
Gross - Direct Business R0310
Gross - Proportional reinsurance accepted
R0320 9,478 91,724 102,940 692,350 768,898 265,218 1,830,505 570,165 468,669
Gross - Non-proportional reinsurance accepted
R0330
Reinsurers' share R0340 1,727 8,065 54,538 291,775 310,471 139,532 1,124,049 341,167 143,609
Net R0400 7,751 83,659 48,402 400,575 458,427 125,687 706,456 228,998 325,060

124 Hannover Rück | Solvency and Financial Condition Report
S.05.01.02: Cover, page 2 Line of Business for: non-life insurance and reinsurance obligations (direct business and accepted proportional reinsurance)
Medical expense
insurance
Income protection insurance
Workers' compen-
sation insurance
Motor vehicle liability
insurance Other motor
insurance
Marine, aviation and
transport insurance
Fire and other
damage to property
insurance
General liability
insurance
Credit and suretyship insurance
C0010 C0020 C0030 C0040 C0050 C0060 C0070 C0080 C0090
Changes in other technical provisions
Gross - Direct Business R0410
Gross - Proportional reinsurance accepted
R0420 5,391 13 −180 −17
Gross - Non-proportional reinsurance accepted
R0430
Reinsurers' share R0440 0 2 −27 −3
Net R0500 5,391 11 −153 −15
Expenses incurred R0550 4,286 54,515 −1,477 204,892 216,297 66,793 507,051 143,833 214,269
Other expenses R1200
Total expenses R1300
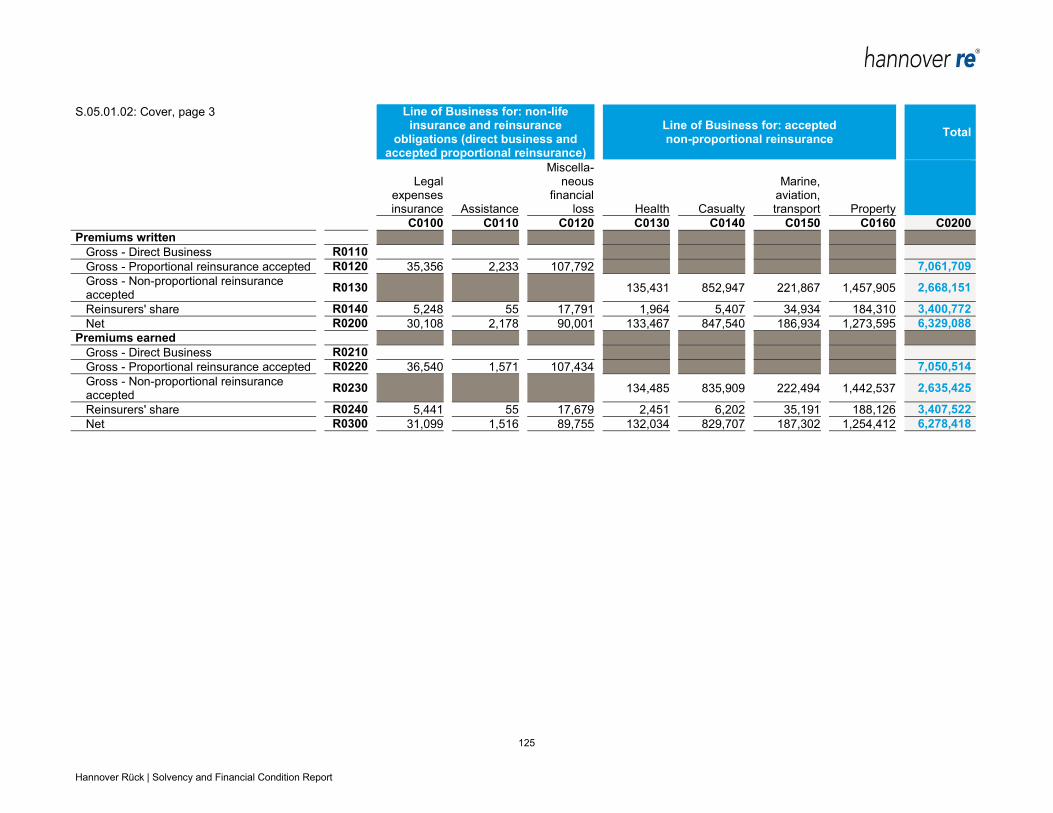
125 Hannover Rück | Solvency and Financial Condition Report
S.05.01.02: Cover, page 3 Line of Business for: non-life insurance and reinsurance
obligations (direct business and accepted proportional reinsurance)
Line of Business for: accepted non-proportional reinsurance
Total
Legal
expenses insurance Assistance
Miscella-neous
financial loss Health Casualty
Marine, aviation, transport Property
C0100 C0110 C0120 C0130 C0140 C0150 C0160 C0200
Premiums written
Gross - Direct Business R0110
Gross - Proportional reinsurance accepted R0120 35,356 2,233 107,792 7,061,709
Gross - Non-proportional reinsurance accepted
R0130 135,431 852,947 221,867 1,457,905 2,668,151
Reinsurers' share R0140 5,248 55 17,791 1,964 5,407 34,934 184,310 3,400,772
Net R0200 30,108 2,178 90,001 133,467 847,540 186,934 1,273,595 6,329,088
Premiums earned
Gross - Direct Business R0210
Gross - Proportional reinsurance accepted R0220 36,540 1,571 107,434 7,050,514
Gross - Non-proportional reinsurance accepted
R0230 134,485 835,909 222,494 1,442,537 2,635,425
Reinsurers' share R0240 5,441 55 17,679 2,451 6,202 35,191 188,126 3,407,522
Net R0300 31,099 1,516 89,755 132,034 829,707 187,302 1,254,412 6,278,418
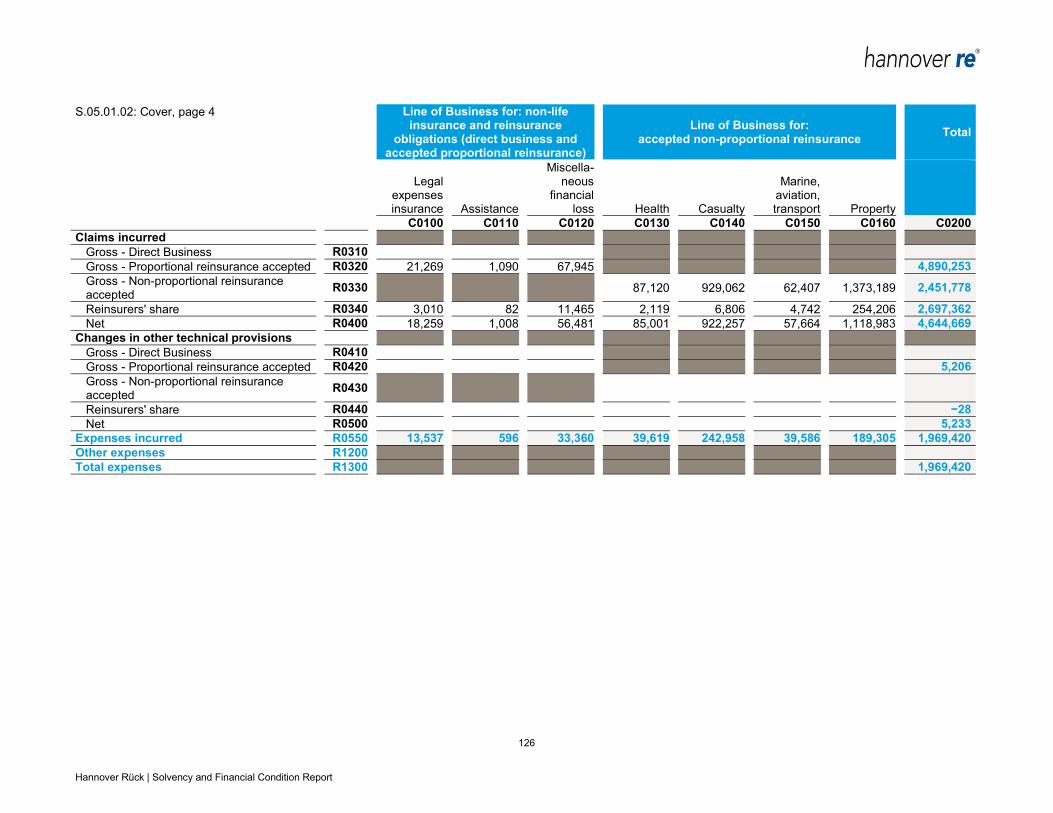
126 Hannover Rück | Solvency and Financial Condition Report
S.05.01.02: Cover, page 4 Line of Business for: non-life insurance and reinsurance
obligations (direct business and accepted proportional reinsurance)
Line of Business for: accepted non-proportional reinsurance
Total
Legal
expenses insurance Assistance
Miscella-neous
financial loss Health Casualty
Marine, aviation, transport Property
C0100 C0110 C0120 C0130 C0140 C0150 C0160 C0200
Claims incurred
Gross - Direct Business R0310
Gross - Proportional reinsurance accepted R0320 21,269 1,090 67,945 4,890,253
Gross - Non-proportional reinsurance accepted
R0330 87,120 929,062 62,407 1,373,189 2,451,778
Reinsurers' share R0340 3,010 82 11,465 2,119 6,806 4,742 254,206 2,697,362
Net R0400 18,259 1,008 56,481 85,001 922,257 57,664 1,118,983 4,644,669
Changes in other technical provisions
Gross - Direct Business R0410
Gross - Proportional reinsurance accepted R0420 5,206
Gross - Non-proportional reinsurance accepted
R0430
Reinsurers' share R0440 −28
Net R0500 5,233
Expenses incurred R0550 13,537 596 33,360 39,619 242,958 39,586 189,305 1,969,420
Other expenses R1200
Total expenses R1300 1,969,420
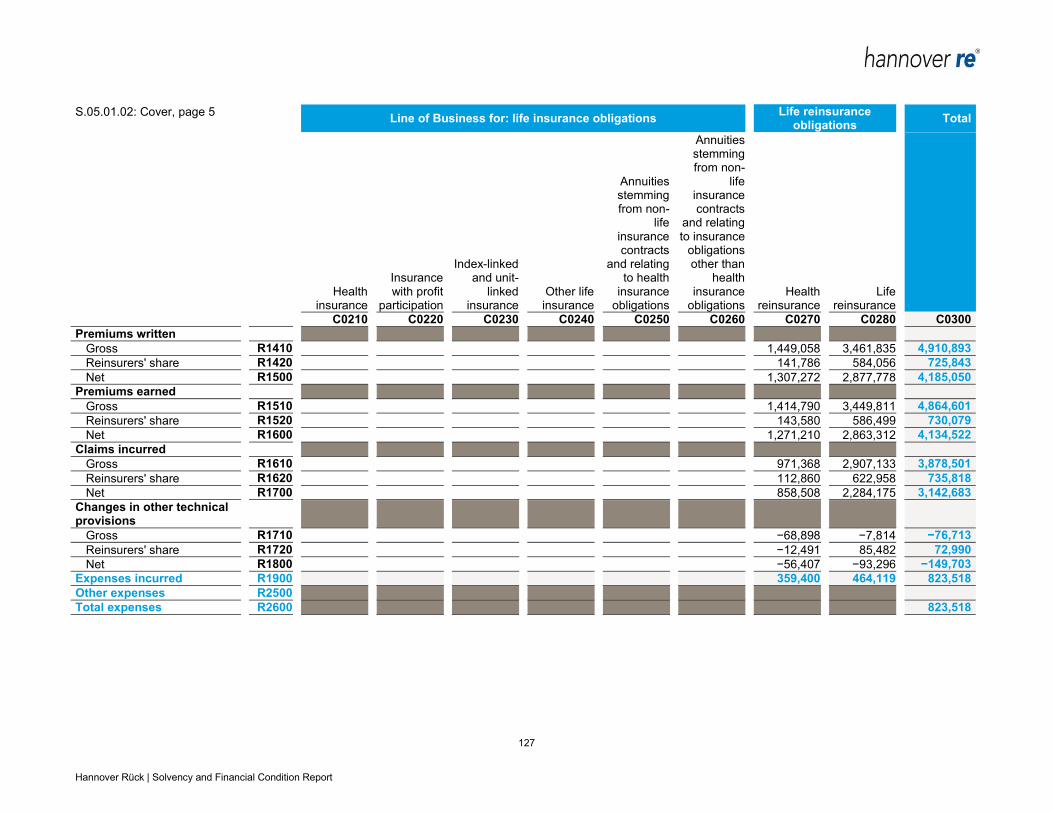
127 Hannover Rück | Solvency and Financial Condition Report
S.05.01.02: Cover, page 5 Line of Business for: life insurance obligations
Life reinsurance obligations
Total
Health insurance
Insurance with profit
participation
Index-linked and unit-
linked insurance
Other life insurance
Annuities stemming from non-
life insurance contracts
and relating to health
insurance obligations
Annuities stemming from non-
life insurance contracts
and relating to insurance
obligations other than
health insurance
obligations Health
reinsurance Life
reinsurance
C0210 C0220 C0230 C0240 C0250 C0260 C0270 C0280 C0300
Premiums written
Gross R1410 1,449,058 3,461,835 4,910,893
Reinsurers' share R1420 141,786 584,056 725,843
Net R1500 1,307,272 2,877,778 4,185,050
Premiums earned
Gross R1510 1,414,790 3,449,811 4,864,601
Reinsurers' share R1520 143,580 586,499 730,079
Net R1600 1,271,210 2,863,312 4,134,522
Claims incurred
Gross R1610 971,368 2,907,133 3,878,501
Reinsurers' share R1620 112,860 622,958 735,818
Net R1700 858,508 2,284,175 3,142,683
Changes in other technical provisions
Gross R1710 −68,898 −7,814 −76,713
Reinsurers' share R1720 −12,491 85,482 72,990
Net R1800 −56,407 −93,296 −149,703
Expenses incurred R1900 359,400 464,119 823,518
Other expenses R2500
Total expenses R2600 823,518
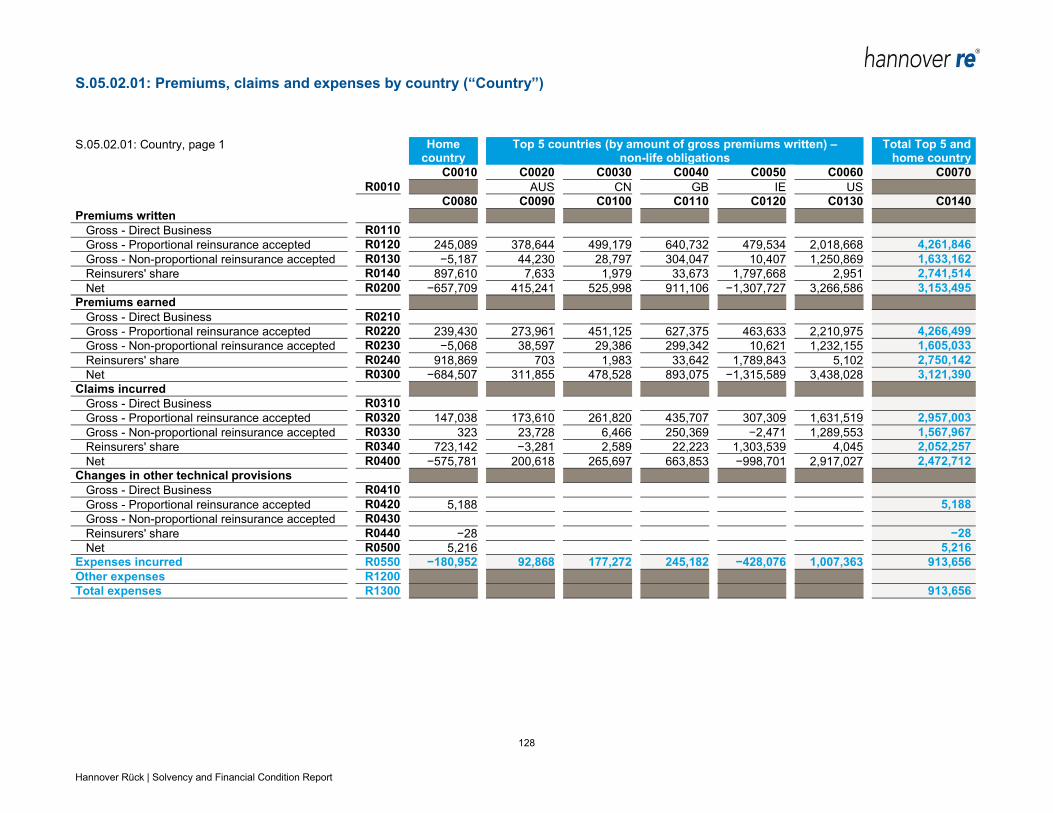
128 Hannover Rück | Solvency and Financial Condition Report
S.05.02.01: Premiums, claims and expenses by country (“Country”)
S.05.02.01: Country, page 1 Home country
Top 5 countries (by amount of gross premiums written) – non-life obligations
Total Top 5 and home country
C0010 C0020 C0030 C0040 C0050 C0060 C0070
R0010 AUS CN GB IE US
C0080 C0090 C0100 C0110 C0120 C0130 C0140
Premiums written
Gross - Direct Business R0110
Gross - Proportional reinsurance accepted R0120 245,089 378,644 499,179 640,732 479,534 2,018,668 4,261,846
Gross - Non-proportional reinsurance accepted R0130 −5,187 44,230 28,797 304,047 10,407 1,250,869 1,633,162
Reinsurers' share R0140 897,610 7,633 1,979 33,673 1,797,668 2,951 2,741,514
Net R0200 −657,709 415,241 525,998 911,106 −1,307,727 3,266,586 3,153,495
Premiums earned
Gross - Direct Business R0210
Gross - Proportional reinsurance accepted R0220 239,430 273,961 451,125 627,375 463,633 2,210,975 4,266,499
Gross - Non-proportional reinsurance accepted R0230 −5,068 38,597 29,386 299,342 10,621 1,232,155 1,605,033
Reinsurers' share R0240 918,869 703 1,983 33,642 1,789,843 5,102 2,750,142
Net R0300 −684,507 311,855 478,528 893,075 −1,315,589 3,438,028 3,121,390
Claims incurred
Gross - Direct Business R0310
Gross - Proportional reinsurance accepted R0320 147,038 173,610 261,820 435,707 307,309 1,631,519 2,957,003
Gross - Non-proportional reinsurance accepted R0330 323 23,728 6,466 250,369 −2,471 1,289,553 1,567,967
Reinsurers' share R0340 723,142 −3,281 2,589 22,223 1,303,539 4,045 2,052,257
Net R0400 −575,781 200,618 265,697 663,853 −998,701 2,917,027 2,472,712
Changes in other technical provisions
Gross - Direct Business R0410
Gross - Proportional reinsurance accepted R0420 5,188 5,188
Gross - Non-proportional reinsurance accepted R0430
Reinsurers' share R0440 −28 −28
Net R0500 5,216 5,216
Expenses incurred R0550 −180,952 92,868 177,272 245,182 −428,076 1,007,363 913,656
Other expenses R1200
Total expenses R1300 913,656
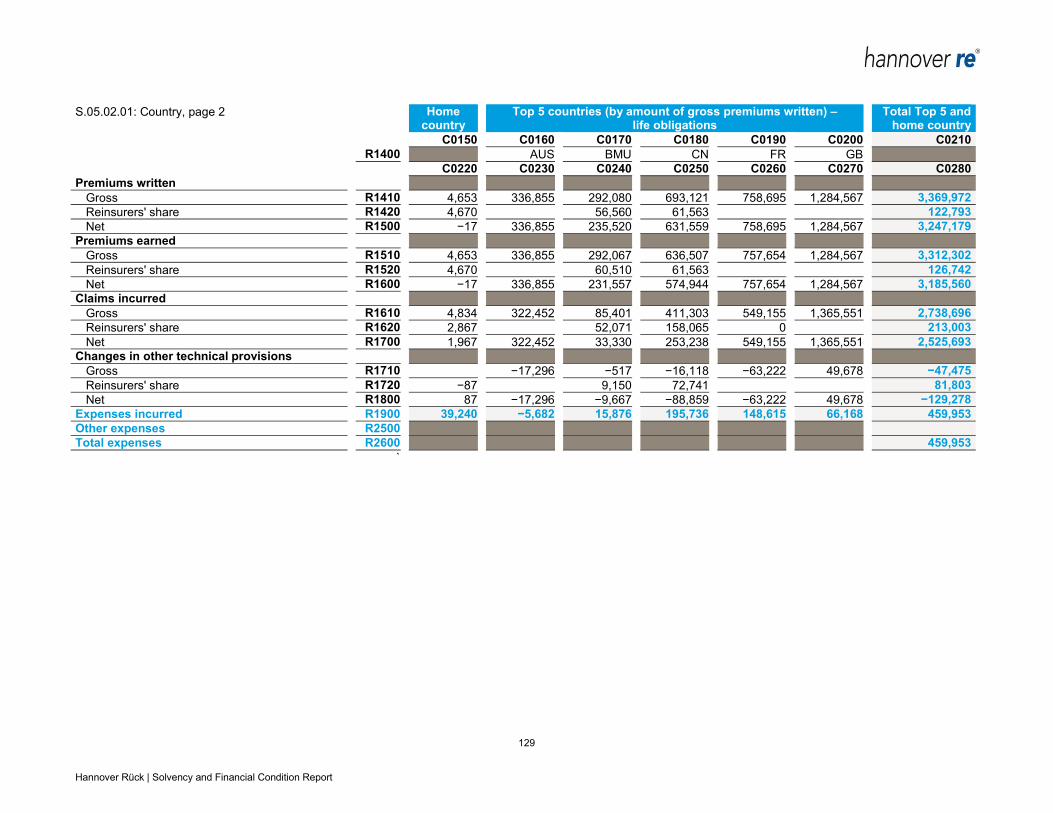
129 Hannover Rück | Solvency and Financial Condition Report
S.05.02.01: Country, page 2 Home country
Top 5 countries (by amount of gross premiums written) – life obligations
Total Top 5 and home country
C0150 C0160 C0170 C0180 C0190 C0200 C0210
R1400 AUS BMU CN FR GB
C0220 C0230 C0240 C0250 C0260 C0270 C0280
Premiums written
Gross R1410 4,653 336,855 292,080 693,121 758,695 1,284,567 3,369,972
Reinsurers' share R1420 4,670 56,560 61,563 122,793
Net R1500 −17 336,855 235,520 631,559 758,695 1,284,567 3,247,179
Premiums earned
Gross R1510 4,653 336,855 292,067 636,507 757,654 1,284,567 3,312,302
Reinsurers' share R1520 4,670 60,510 61,563 126,742
Net R1600 −17 336,855 231,557 574,944 757,654 1,284,567 3,185,560
Claims incurred
Gross R1610 4,834 322,452 85,401 411,303 549,155 1,365,551 2,738,696
Reinsurers' share R1620 2,867 52,071 158,065 0 213,003
Net R1700 1,967 322,452 33,330 253,238 549,155 1,365,551 2,525,693
Changes in other technical provisions
Gross R1710 −17,296 −517 −16,118 −63,222 49,678 −47,475
Reinsurers' share R1720 −87 9,150 72,741 81,803
Net R1800 87 −17,296 −9,667 −88,859 −63,222 49,678 −129,278
Expenses incurred R1900 39,240 −5,682 15,876 195,736 148,615 66,168 459,953
Other expenses R2500
Total expenses R2600 459,953
`
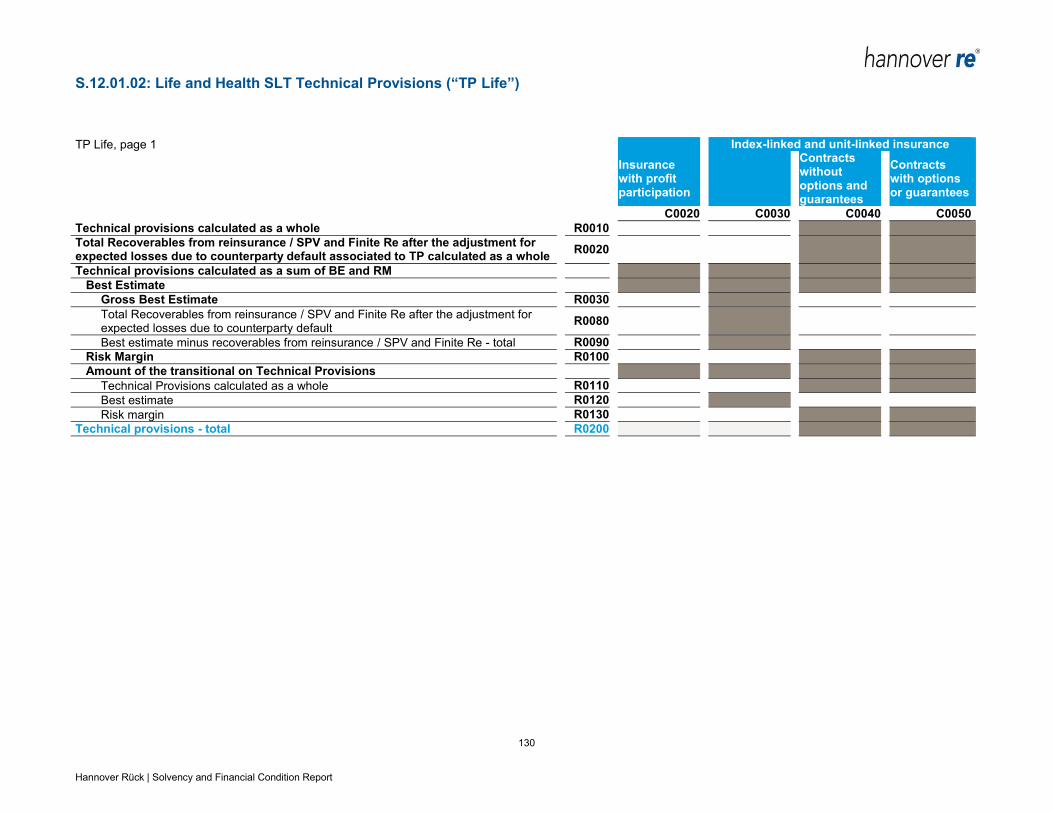
130 Hannover Rück | Solvency and Financial Condition Report
S.12.01.02: Life and Health SLT Technical Provisions (“TP Life”)
TP Life, page 1 Index-linked and unit-linked insurance
Insurance with profit participation
Contracts without options and guarantees
Contracts with options or guarantees
C0020 C0030 C0040 C0050
Technical provisions calculated as a whole R0010
Total Recoverables from reinsurance / SPV and Finite Re after the adjustment for expected losses due to counterparty default associated to TP calculated as a whole
R0020
Technical provisions calculated as a sum of BE and RM
Best Estimate
Gross Best Estimate R0030
Total Recoverables from reinsurance / SPV and Finite Re after the adjustment for expected losses due to counterparty default
R0080
Best estimate minus recoverables from reinsurance / SPV and Finite Re - total R0090
Risk Margin R0100
Amount of the transitional on Technical Provisions
Technical Provisions calculated as a whole R0110
Best estimate R0120
Risk margin R0130
Technical provisions - total R0200
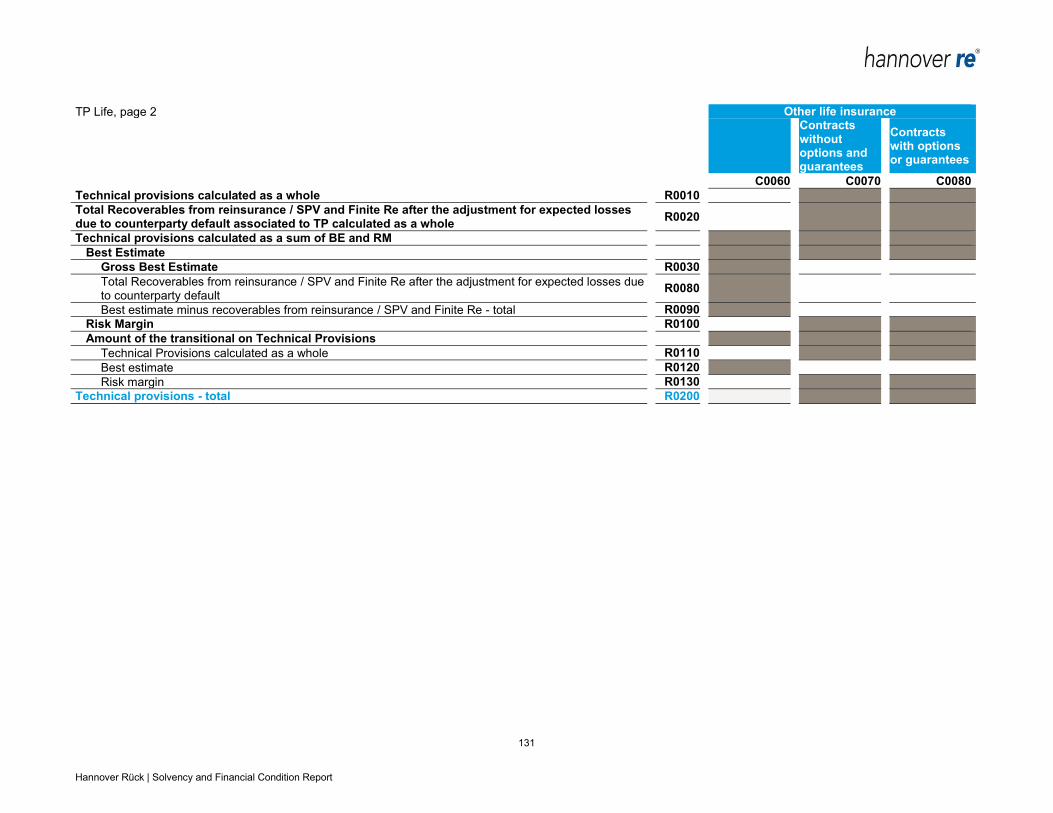
131 Hannover Rück | Solvency and Financial Condition Report
TP Life, page 2 Other life insurance
Contracts without options and guarantees
Contracts with options or guarantees
C0060 C0070 C0080
Technical provisions calculated as a whole R0010
Total Recoverables from reinsurance / SPV and Finite Re after the adjustment for expected losses due to counterparty default associated to TP calculated as a whole
R0020
Technical provisions calculated as a sum of BE and RM
Best Estimate
Gross Best Estimate R0030
Total Recoverables from reinsurance / SPV and Finite Re after the adjustment for expected losses due to counterparty default
R0080
Best estimate minus recoverables from reinsurance / SPV and Finite Re - total R0090
Risk Margin R0100
Amount of the transitional on Technical Provisions
Technical Provisions calculated as a whole R0110
Best estimate R0120
Risk margin R0130
Technical provisions - total R0200
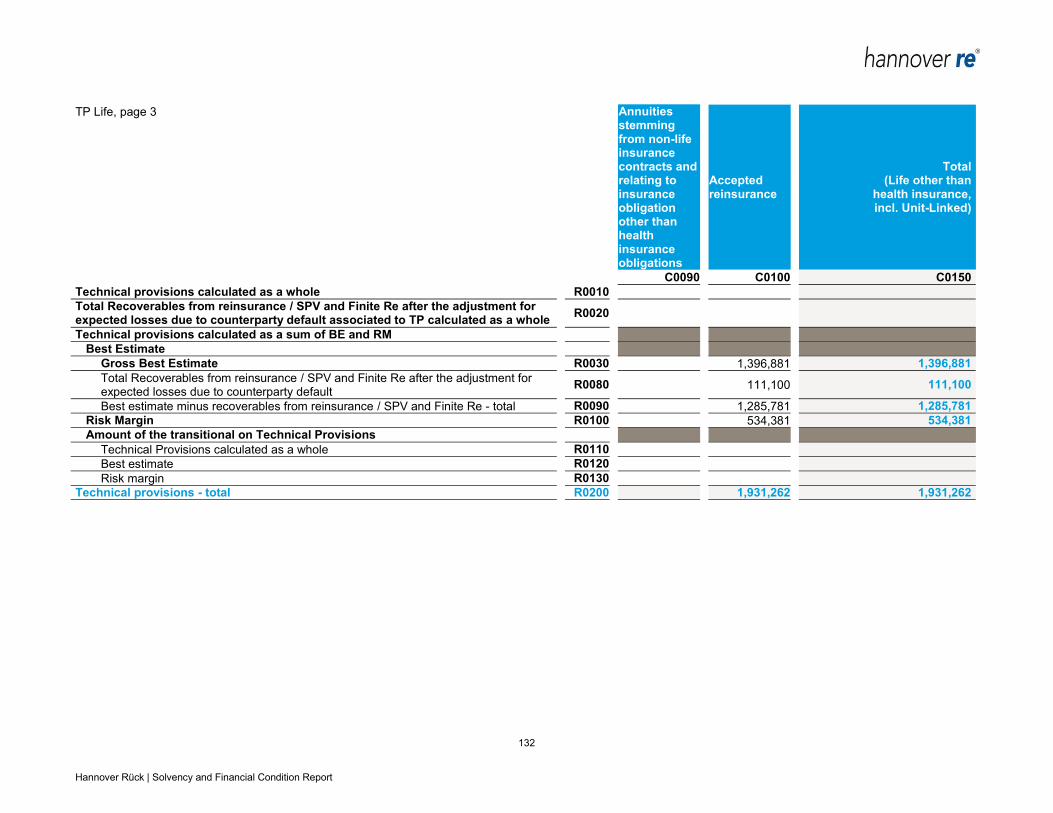
132 Hannover Rück | Solvency and Financial Condition Report
TP Life, page 3 Annuities stemming from non-life insurance contracts and relating to insurance obligation other than health insurance obligations
Accepted reinsurance
Total (Life other than
health insurance, incl. Unit-Linked)
C0090 C0100 C0150
Technical provisions calculated as a whole R0010
Total Recoverables from reinsurance / SPV and Finite Re after the adjustment for expected losses due to counterparty default associated to TP calculated as a whole
R0020
Technical provisions calculated as a sum of BE and RM
Best Estimate
Gross Best Estimate R0030 1,396,881 1,396,881
Total Recoverables from reinsurance / SPV and Finite Re after the adjustment for expected losses due to counterparty default
R0080 111,100 111,100
Best estimate minus recoverables from reinsurance / SPV and Finite Re - total R0090 1,285,781 1,285,781
Risk Margin R0100 534,381 534,381
Amount of the transitional on Technical Provisions
Technical Provisions calculated as a whole R0110
Best estimate R0120
Risk margin R0130
Technical provisions - total R0200 1,931,262 1,931,262

133 Hannover Rück | Solvency and Financial Condition Report
TP Life, page 4 Health insurance (direct business)
Contracts without options and guarantees
Contracts with options or guarantees
C0160 C0170 C0180
Technical provisions calculated as a whole R0010
Total Recoverables from reinsurance / SPV and Finite Re after the adjustment for expected losses due to counterparty default associated to TP calculated as a whole
R0020
Technical provisions calculated as a sum of BE and RM
Best Estimate
Gross Best Estimate R0030
Total Recoverables from reinsurance / SPV and Finite Re after the adjustment for expected losses due to counterparty default
R0080
Best estimate minus recoverables from reinsurance / SPV and Finite Re - total R0090
Risk Margin R0100
Amount of the transitional on Technical Provisions
Technical Provisions calculated as a whole R0110
Best estimate R0120
Risk margin R0130
Technical provisions - total R0200
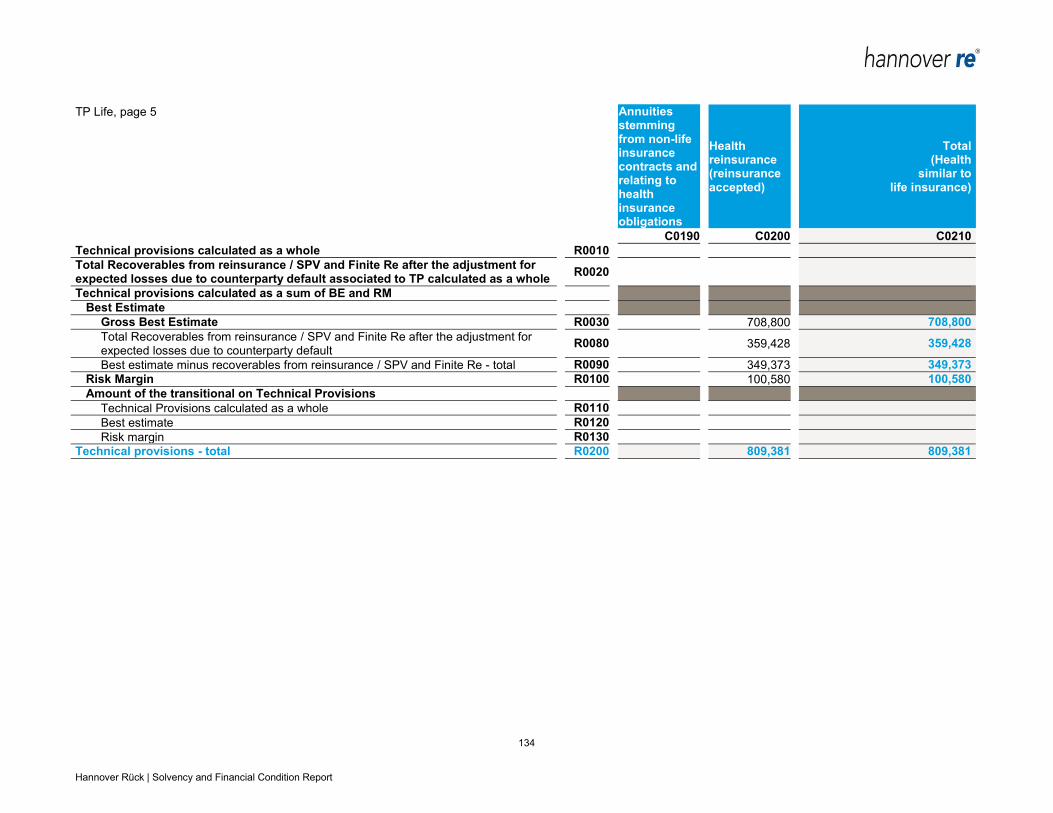
134 Hannover Rück | Solvency and Financial Condition Report
TP Life, page 5 Annuities stemming from non-life insurance contracts and relating to health insurance obligations
Health reinsurance (reinsurance accepted)
Total (Health
similar to life insurance)
C0190 C0200 C0210
Technical provisions calculated as a whole R0010
Total Recoverables from reinsurance / SPV and Finite Re after the adjustment for expected losses due to counterparty default associated to TP calculated as a whole
R0020
Technical provisions calculated as a sum of BE and RM
Best Estimate
Gross Best Estimate R0030 708,800 708,800
Total Recoverables from reinsurance / SPV and Finite Re after the adjustment for expected losses due to counterparty default
R0080 359,428 359,428
Best estimate minus recoverables from reinsurance / SPV and Finite Re - total R0090 349,373 349,373
Risk Margin R0100 100,580 100,580
Amount of the transitional on Technical Provisions
Technical Provisions calculated as a whole R0110
Best estimate R0120
Risk margin R0130
Technical provisions - total R0200 809,381 809,381
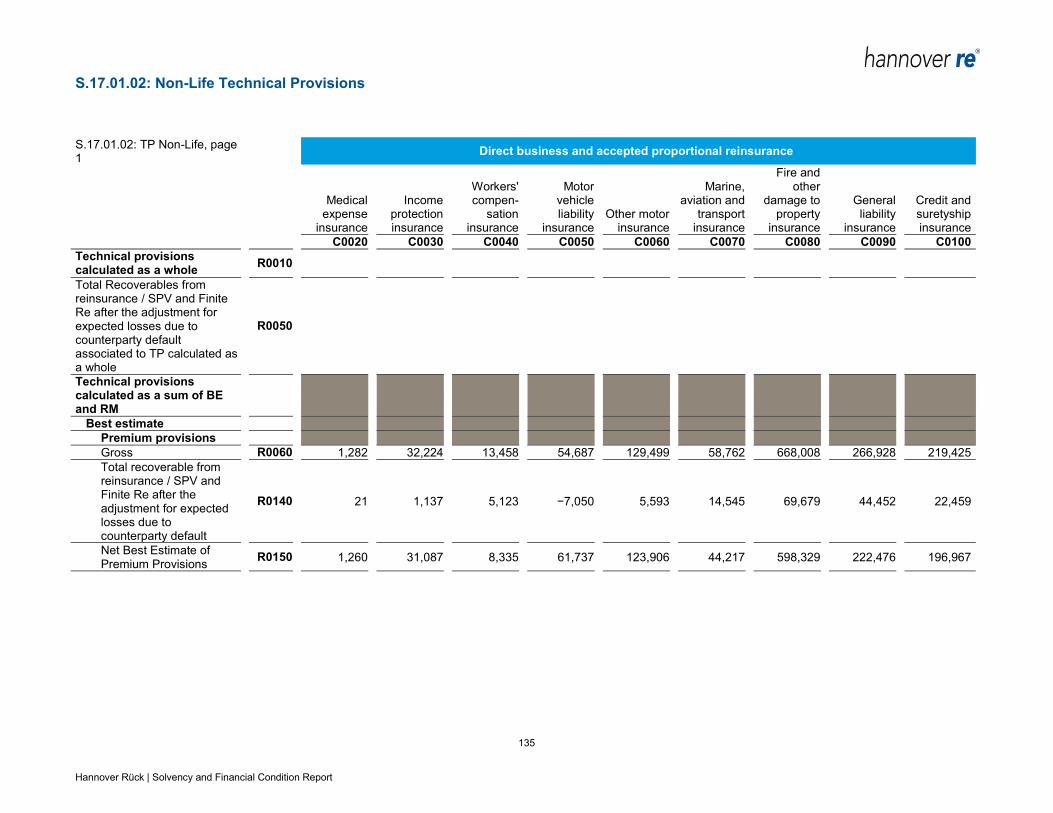
135 Hannover Rück | Solvency and Financial Condition Report
S.17.01.02: Non-Life Technical Provisions
S.17.01.02: TP Non-Life, page 1
Direct business and accepted proportional reinsurance
Medical expense
insurance
Income protection insurance
Workers' compen-
sation insurance
Motor vehicle liability
insurance Other motor
insurance
Marine, aviation and
transport insurance
Fire and other
damage to property
insurance
General liability
insurance
Credit and suretyship insurance
C0020 C0030 C0040 C0050 C0060 C0070 C0080 C0090 C0100
Technical provisions calculated as a whole
R0010
Total Recoverables from reinsurance / SPV and Finite Re after the adjustment for expected losses due to counterparty default associated to TP calculated as a whole
R0050
Technical provisions calculated as a sum of BE and RM
Best estimate
Premium provisions
Gross R0060 1,282 32,224 13,458 54,687 129,499 58,762 668,008 266,928 219,425
Total recoverable from reinsurance / SPV and Finite Re after the adjustment for expected losses due to counterparty default
R0140 21 1,137 5,123 −7,050 5,593 14,545 69,679 44,452 22,459
Net Best Estimate of Premium Provisions
R0150 1,260 31,087 8,335 61,737 123,906 44,217 598,329 222,476 196,967

136 Hannover Rück | Solvency and Financial Condition Report
S.17.01.02: TP Non-Life, page 2
Direct business and accepted proportional reinsurance
Medical expense
insurance
Income protection insurance
Workers' compen-
sation insurance
Motor vehicle liability
insurance Other motor
insurance
Marine, aviation and
transport insurance
Fire and other
damage to property
insurance
General liability
insurance
Credit and suretyship insurance
C0020 C0030 C0040 C0050 C0060 C0070 C0080 C0090 C0100
Claims provisions
Gross R0160 23,882 176,113 108,979 706,983 283,187 785,557 2,047,372 2,252,492 876,248
Total recoverable from reinsurance / SPV and Finite Re after the adjustment for expected losses due to counterparty default
R0240 524 11,427 177,063 261,238 25,773 354,416 632,741 710,559 146,787
Net Best Estimate of Claims Provisions
R0250 23,358 164,686 −68,084 445,745 257,414 431,141 1,414,631 1,541,934 729,461
Total Best estimate - gross R0260 25,164 208,337 122,437 761,670 412,686 844,319 2,715,380 2,519,421 1,095,673
Total Best estimate - net R0270 24,618 195,773 −59,748 507,482 381,320 475,358 2,012,961 1,764,410 926,427
Risk margin R0280 551 2,938 2,500 13,703 8,615 11,308 50,955 39,029 22,540
Amount of the transitional on Technical Provisions
Technical Provisions calculated as a whole
R0290
Best estimate R0300
Risk margin R0310

137 Hannover Rück | Solvency and Financial Condition Report
S.17.01.02: TP Non-Life, page 3
Direct business and accepted proportional reinsurance
Medical expense
insurance
Income protection insurance
Workers' compen-
sation insurance
Motor vehicle liability
insurance Other motor
insurance
Marine, aviation and
transport insurance
Fire and other
damage to property
insurance
General liability
insurance
Credit and suretyship insurance
C0020 C0030 C0040 C0050 C0060 C0070 C0080 C0090 C0100
Technical provisions - total
Technical provisions - total R0320 25,715 211,274 124,938 775,373 421,301 855,627 2,766,335 2,558,450 1,118,213
Recoverable from reinsurance contract / SPV and Finite Re after the adjustment for expected losses due to counterparty default - total
R0330 546 12,564 182,186 254,188 31,366 368,961 702,419 755,011 169,246
Technical provisions minus recoverables from reinsurance / SPV and Finite Re - total
R0340 25,170 198,711 −57,248 521,185 389,935 486,667 2,063,916 1,803,439 948,967

138 Hannover Rück | Solvency and Financial Condition Report
S.17.01.02: TP Non-Life, page 4 Direct business and accepted proportional reinsurance
Accepted non-proportional reinsurance
Legal expenses insurance Assistance
Miscella-neous
financial loss
Non-propor-tional health
reinsu-rance
Non-propor-tional
casualty reinsu-rance
Non-pro-portional marine,
aviation and transport
reinsu-rance
Non-propor-tional
property reinsu-rance
Total Non-Life
obligation
C0110 C0120 C0130 C0140 C0150 C0160 C0170 C0180
Technical provisions calculated as a whole
R0010
Total Recoverables from reinsurance / SPV and Finite Re after the adjustment for expected losses due to counterparty default associated to TP as a whole
R0050
Technical provisions calculated as a sum of BE and RM
Best estimate
Premium provisions
Gross R0060 1,680 569 29,842 29,373 311,519 26,102 163,030 2,006,389
Total recoverable from reinsurance / SPV and Finite Re after the adjustment for expected losses due to counterparty default
R0140 255 5 3,011 4 2,966 975 5,524 168,698
Net Best Estimate of Premium Provisions
R0150 1,425 564 26,831 29,370 308,552 25,127 157,506 1,837,691

139 Hannover Rück | Solvency and Financial Condition Report
S.17.01.02: TP Non-Life, page 5 Direct business and accepted proportional reinsurance
Accepted non-proportional reinsurance
Legal expenses insurance Assistance
Miscella-neous
financial loss
Non-propor-tional health
reinsu-rance
Non-propor-tional
casualty reinsu-rance
Non-pro-portional marine,
aviation and transport
reinsu-rance
Non-propor-tional
property reinsu-rance
Total Non-Life
obligation
C0110 C0120 C0130 C0140 C0150 C0160 C0170 C0180
Claims provisions
Gross R0160 11,125 859 107,746 1,057,606 5,007,671 835,215 2,350,257 16,631,291
Total recoverable from reinsurance / SPV and Finite Re after the adjustment for expected losses due to counterparty default
R0240 1,670 −268 15,437 10,529 27,209 65,628 417,270 2,858,003
Net Best Estimate of Claims Provisions R0250 9,455 1,126 92,309 1,047,077 4,980,461 769,588 1,932,987 13,773,288
Total Best Estimate - gross R0260 12,804 1,428 137,587 1,086,979 5,319,189 861,318 2,513,287 18,637,680
Total Best Estimate - net R0270 10,880 1,690 119,139 1,076,447 5,289,013 794,715 2,090,493 15,610,979
Risk margin R0280 249 31 2,471 22,716 110,698 17,463 48,702 354,469
Amount of the transitional on Technical Provisions
Technical Provisions calculated as a whole
R0290
Best Estimate R0300
Risk margin R0310
Technical provisions - total
Technical provisions - total R0320 13,054 1,458 140,059 1,109,695 5,429,887 878,780 2,561,989 18,992,149
Recoverable from reinsurance contract / SPV and Finite Re after the adjustment for expected losses due to counterparty default - total
R0330 1,924 −262 18,448 10,533 30,176 66,603 422,794 3,026,701
Technical provisions minus recoverables from reinsurance / SPV and Finite Re - total
R0340 11,129 1,721 121,611 1,099,163 5,399,711 812,177 2,139,195 15,965,448

140 Hannover Rück | Solvency and Financial Condition Report
S.19.01.21: Non-life insurance claims
Accident year / Underwriting year Z0020 1/2
Gross Claims Paid (non-cumulative)
(absolute amount)
S.19.01.21: Schadendreiecke, Seite 1
Development year
Year 0 1 2 3 4 5 6 7 8 9 10&+
C0010 C0020 C0030 C0040 C0050 C0060 C0070 C0080 C0090 C0100 C0110
Prior R0100 26,121,302
N-9 R0160 322,970 692,206 −2,458,692 139,377 12,163 194,115 91,800 68,157 35,017 38,858
N-8 R0170 538,691 −136,395 646,474 228,607 130,021 181,284 142,494 100,245 146,808
N-7 R0180 686,393 1,210,728 706,254 403,035 140,690 154,708 145,550 88,725
N-6 R0190 919,293 1,149,478 629,057 208,612 146,964 182,296 139,571
N-5 R0200 824,112 1,087,120 546,143 237,326 175,241 151,158
N-4 R0210 784,085 1,160,658 531,097 237,487 185,534
N-3 R0220 1,101,922 1,134,553 592,694 295,698
N-2 R0230 1,165,582 1,270,084 697,150
N-1 R0240 1,357,523 1,888,745
N R0250 1,715,169
S.19.01.21: Schadendreiecke, Seite 1
In current year Sum of years (cumu-lative)
C0170 C0180
Prior R0100 26,121,302 26,121,302
N-9 R0160 38,858 −864,031
N-8 R0170 146,808 1,978,228
N-7 R0180 88,725 3,536,084
N-6 R0190 139,571 3,375,271
N-5 R0200 151,158 3,021,100
N-4 R0210 185,534 2,898,861
N-3 R0220 295,698 3,124,868
N-2 R0230 697,150 3,132,816
N-1 R0240 1,888,745 3,246,268
N R0250 1,715,169 1,715,169
Total R0260 31,468,718 51,285,937

141 Hannover Rück | Solvency and Financial Condition Report
Gross undiscounted Best Estimate Claims Provision
(absoulte amount)
S.19.01.21: Schadendreiecke, Seite 2
Development year
Year 0 1 2 3 4 5 6 7 8 9 10&+
C0200 C0210 C0220 C0230 C0240 C0250 C0260 C0270 C0280 C0290 C0300
Prior R0100 6,236,210
N-9 R0160 808,950 663,975 562,642
N-8 R0170 1,105,782 827,110 721,268
N-7 R0180 1,270,476 1,098,385 917,364
N-6 R0190 1,454,577 1,266,068 1,083,230
N-5 R0200 1,679,443 1,396,006 1,349,604
N-4 R0210 2,011,907 1,729,705 1,401,095
N-3 R0220 2,663,401 2,170,023 1,724,761
N-2 R0230 2,251,562 2,778,635 2,159,506
N-1 R0240 2,072,318 3,199,327
N R0250 3,099,033
S.19.01.21: Schadendreiecke, Seite 2
Year end (discounted
data)
C0360
Prior R0100 2,131,245
N-9 R0160 489,782
N-8 R0170 628,906
N-7 R0180 811,690
N-6 R0190 956,085
N-5 R0200 1,053,689
N-4 R0210 1,251,161
N-3 R0220 1,545,101
N-2 R0230 1,949,812
N-1 R0240 2,931,814
N R0250 2,882,006
Total R0260 16,631,291
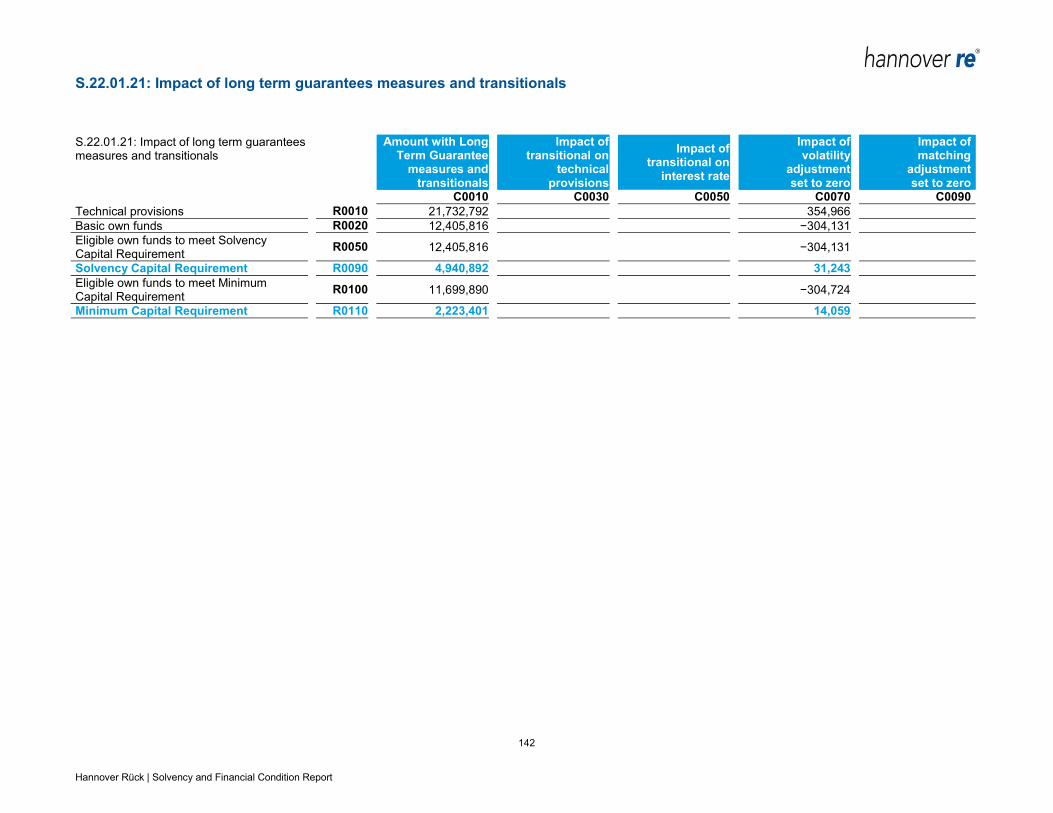
142 Hannover Rück | Solvency and Financial Condition Report
S.22.01.21: Impact of long term guarantees measures and transitionals
S.22.01.21: Impact of long term guarantees measures and transitionals
Amount with Long Term Guarantee
measures and transitionals
Impact of transitional on
technical provisions
Impact of transitional on
interest rate
Impact of volatility
adjustment set to zero
Impact of matching
adjustment set to zero
C0010 C0030 C0050 C0070 C0090
Technical provisions R0010 21,732,792 354,966
Basic own funds R0020 12,405,816 −304,131
Eligible own funds to meet Solvency Capital Requirement
R0050 12,405,816 −304,131
Solvency Capital Requirement R0090 4,940,892 31,243
Eligible own funds to meet Minimum Capital Requirement
R0100 11,699,890 −304,724
Minimum Capital Requirement R0110 2,223,401 14,059
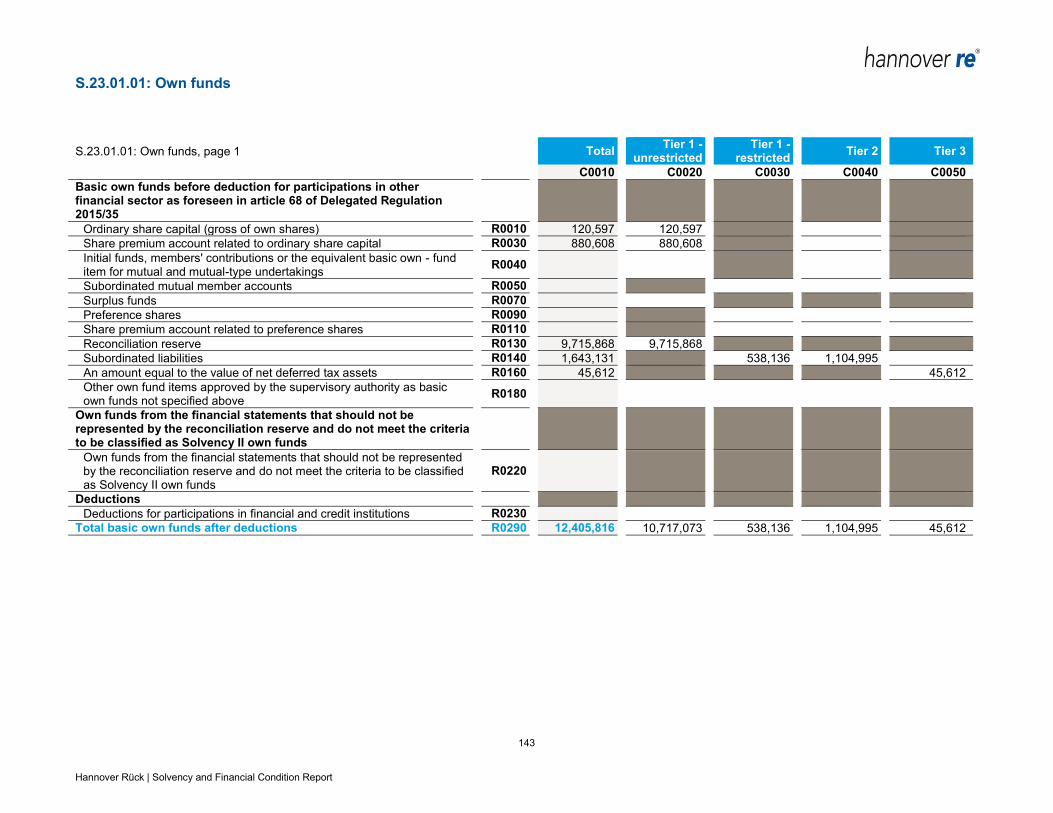
143 Hannover Rück | Solvency and Financial Condition Report
S.23.01.01: Own funds
S.23.01.01: Own funds, page 1 Total Tier 1 -
unrestricted Tier 1 -
restricted Tier 2 Tier 3
C0010 C0020 C0030 C0040 C0050
Basic own funds before deduction for participations in other financial sector as foreseen in article 68 of Delegated Regulation 2015/35
Ordinary share capital (gross of own shares) R0010 120,597 120,597
Share premium account related to ordinary share capital R0030 880,608 880,608
Initial funds, members' contributions or the equivalent basic own - fund item for mutual and mutual-type undertakings
R0040
Subordinated mutual member accounts R0050
Surplus funds R0070
Preference shares R0090
Share premium account related to preference shares R0110
Reconciliation reserve R0130 9,715,868 9,715,868
Subordinated liabilities R0140 1,643,131 538,136 1,104,995
An amount equal to the value of net deferred tax assets R0160 45,612 45,612
Other own fund items approved by the supervisory authority as basic own funds not specified above
R0180
Own funds from the financial statements that should not be represented by the reconciliation reserve and do not meet the criteria to be classified as Solvency II own funds
Own funds from the financial statements that should not be represented by the reconciliation reserve and do not meet the criteria to be classified as Solvency II own funds
R0220
Deductions
Deductions for participations in financial and credit institutions R0230
Total basic own funds after deductions R0290 12,405,816 10,717,073 538,136 1,104,995 45,612
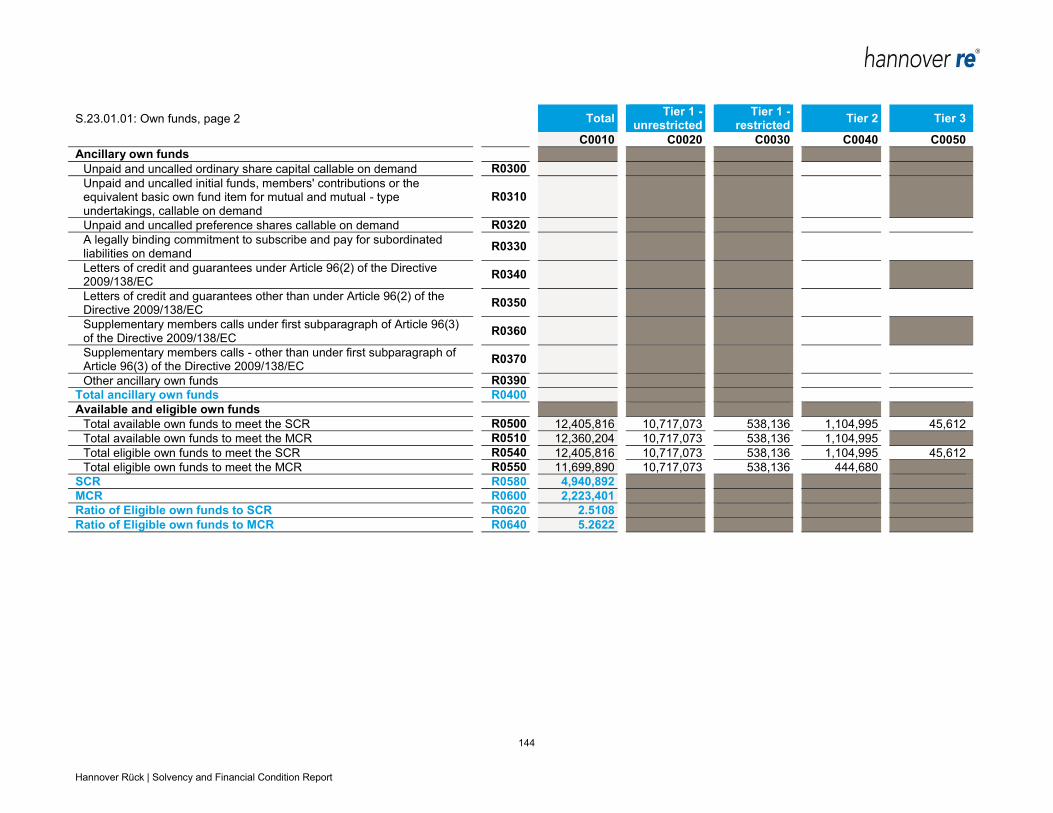
144 Hannover Rück | Solvency and Financial Condition Report
S.23.01.01: Own funds, page 2 Total Tier 1 -
unrestricted Tier 1 -
restricted Tier 2 Tier 3
C0010 C0020 C0030 C0040 C0050
Ancillary own funds
Unpaid and uncalled ordinary share capital callable on demand R0300
Unpaid and uncalled initial funds, members' contributions or the equivalent basic own fund item for mutual and mutual - type undertakings, callable on demand
R0310
Unpaid and uncalled preference shares callable on demand R0320
A legally binding commitment to subscribe and pay for subordinated liabilities on demand
R0330
Letters of credit and guarantees under Article 96(2) of the Directive 2009/138/EC
R0340
Letters of credit and guarantees other than under Article 96(2) of the Directive 2009/138/EC
R0350
Supplementary members calls under first subparagraph of Article 96(3) of the Directive 2009/138/EC
R0360
Supplementary members calls - other than under first subparagraph of Article 96(3) of the Directive 2009/138/EC
R0370
Other ancillary own funds R0390
Total ancillary own funds R0400
Available and eligible own funds
Total available own funds to meet the SCR R0500 12,405,816 10,717,073 538,136 1,104,995 45,612
Total available own funds to meet the MCR R0510 12,360,204 10,717,073 538,136 1,104,995
Total eligible own funds to meet the SCR R0540 12,405,816 10,717,073 538,136 1,104,995 45,612
Total eligible own funds to meet the MCR R0550 11,699,890 10,717,073 538,136 444,680
SCR R0580 4,940,892
MCR R0600 2,223,401
Ratio of Eligible own funds to SCR R0620 2.5108
Ratio of Eligible own funds to MCR R0640 5.2622
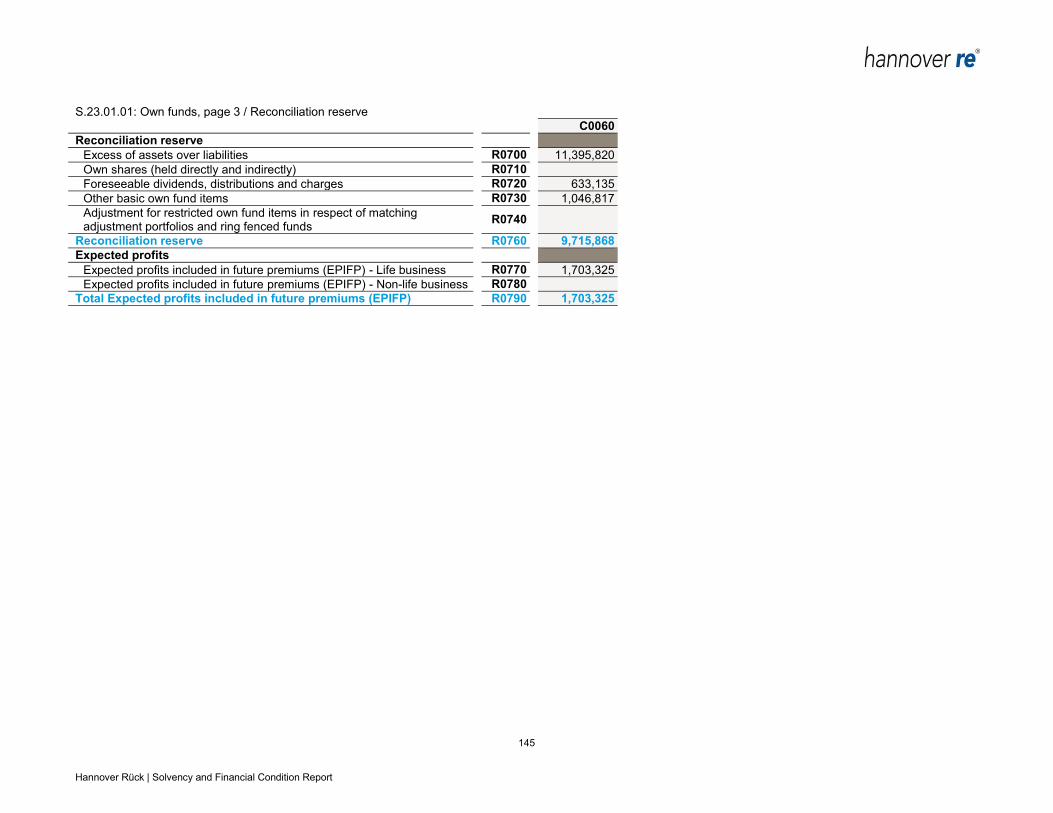
145 Hannover Rück | Solvency and Financial Condition Report
S.23.01.01: Own funds, page 3 / Reconciliation reserve
C0060
Reconciliation reserve
Excess of assets over liabilities R0700 11,395,820
Own shares (held directly and indirectly) R0710
Foreseeable dividends, distributions and charges R0720 633,135
Other basic own fund items R0730 1,046,817
Adjustment for restricted own fund items in respect of matching adjustment portfolios and ring fenced funds
R0740
Reconciliation reserve R0760 9,715,868
Expected profits
Expected profits included in future premiums (EPIFP) - Life business R0770 1,703,325
Expected profits included in future premiums (EPIFP) - Non-life business R0780
Total Expected profits included in future premiums (EPIFP) R0790 1,703,325

146 Hannover Rück | Solvency and Financial Condition Report
S.25.03.21: Solvency Capital Requirement – for undertakings on Full Internal Model
Unique number of component
Components description Calculation of the Solvency Capital
Requirement
C0010 C0020 C0030
101 Market risk according to IM 3,649,419
102 Counterparty default risk according to IM 308,132
103 Life underwriting risk according to IM 2,206,374
104 Non-life underwriting risk according to IM 3,633,720
105 Operational risk according to IM 562,623
107 LAC TP according to IM
108 LAC DT according to IM −1,888,571
Calculation of Solvency Capital Requirement C0100
Total undiversified components R0110 8,471,697
Diversification R0060 −3,530,805
Capital requirement for business operated in accordance with Art. 4 of Directive 2003/41/EC (transitional)
R0160
Solvency capital requirement excluding capital add-on R0200 4,940,892
Capital add-ons already set R0210
Solvency capital requirement R0220 4,940,892
Other information on SCR
Amount / estimate of the overall loss-absorbing capacity of technical provisions
R0300
Amount / estimate of the overall loss-absorbing capacity ot deferred taxes R0310 −1,888,571
Total amount of Notional Solvency Capital Requirements for remaining part R0410
Total amount of Notional Solvency Capital Requirements for ring fenced funds
R0420
Total amount of Notional Solvency Capital Requirement for matching adjustment portfolios
R0430
Diversification effects due to RFF nSCR aggregation for article 304 R0440

147 Hannover Rück | Solvency and Financial Condition Report
S.28.01.01: Minimum Capital Requirement - Only life or only non-life insurance or reinsurance activity
Linear formula component for non-life insurance and reinsurance obligations
C0010
MCRNL Result R0010 3,184,200
S.28.01.01: MCR, page 1 Net (of reinsurance /
SPV) best estimate and TP
calculated as a whole
Net (of reinsurance)
written premiums in the last 12
months
C0020 C0030
Medical expense insurance and proportional reinsurance R0020 24,618 8,904
Income protection insurance and proportional reinsurance R0030 195,773 144,403
Workers' compensation insurance and proportional reinsurance R0040 −8,536
Motor vehicle liability insurance and proportional reinsurance R0050 507,482 591,064
Other motor insurance and proportional reinsurance R0060 381,320 684,448
Marine, aviation and transport insurance and proportional reinsurance
R0070 475,358 187,018
Fire and other damage to property insurance and proportional reinsurance
R0080 2,012,961 1,220,175
General liability insurance and proportional reinsurance R0090 1,764,410 348,942
Credit and suretyship insurance and proportional reinsurance R0100 926,427 550,073
Legal expenses insurance and proportional reinsurance R0110 10,880 30,098
Assistance and proportional reinsurance R0120 1,690 2,410
Miscellaneous financial loss insurance and proportional reinsurance
R0130 119,139 91,750
Non-proportional health reinsurance R0140 1,076,447 135,406
Non-proportional casualty reinsurance R0150 5,289,013 867,040
Non-proportional marine, aviation and transport reinsurance R0160 794,715 188,269
Non-proportional property reinsurance R0170 2,090,493 1,318,122

148 Hannover Rück | Solvency and Financial Condition Report
Linear formula component for life insurance and reinsurance obligations
C0040
MCRL Result R0200 645,459
Total capital at risk for all life (re)insurance obligations
S.28.01.01: MCR, page 2 Net (of reinsurance /
SPV) best estimate and TP
calculated as a whole
Net (of reinsurance /
SPV) total capital at risk
C0050 C0060
Obligations with profit participation - guaranteed benefits R0210
Obligations with profit participation - future discretionary benefits R0220
Index-linked and unit-linked insurance obligations R0230
Other life (re)insurance and health (re)insurance obligations R0240 1,654,442
Total capital at risk for all life (re)insurance obligations R0250 872,451,622
Overall MCR calculation
C0070
Linear MCR R0300 3,829,659
SCR R0310 4,940,892
MCR cap R0320 2,223,401
MCR floor R0330 1,235,223
Combined MCR R0340 2,223,401
Absolute floor of the MCR R0350 3,600
Minimum Capital Requirement R0400 2,223,401
Published by Hannover Rück SE
Karl-Wiechert-Allee 50 30625 Hannover Germany www.hannover-re.com