solvency and financial condition report 2016 and financial condition report... · c.4 liquidity...
TRANSCRIPT

SOLVENCY AND FINANCIAL CONDITION REPORT 2016 - 1 -
SOLVENCY & FINANCIAL CONDITION REPORT
KBC Group Re 2016

SOLVENCY AND FINANCIAL CONDITION REPORT 2016 - 2 -
Table of Contents
Summary ............................................................................................................................ 3 A. Business & performance .............................................................................................. 4
A.1 Business ..................................................................................................................... 4 A.2 Underwriting performance ........................................................................................... 6 A.3 Investment performance .............................................................................................. 7 A.4 Performance of other activities .................................................................................... 8 A.5 Any other information .................................................................................................. 8
B. System of governance ................................................................................................. 9 B.1 General information on the system of governance ...................................................... 9 B.2 Fit and proper requirement ........................................................................................ 10 B.3 Risk management system including the own risk and solvency assessment ............. 10 B.4. Internal control system ............................................................................................. 12 B.5 Internal audit function ................................................................................................ 13 B.6 Actuarial function ....................................................................................................... 15 B.7 Outsourcing ............................................................................................................... 15 B.8 Any other information ................................................................................................ 16
C. Risk profile ................................................................................................................. 17 C.1 Underwriting risk ....................................................................................................... 18 C.2 Market risk ................................................................................................................ 19 C.3 Credit risk .................................................................................................................. 22 C.4 Liquidity risk .............................................................................................................. 23 C.5 Operational risk ......................................................................................................... 24 C.6 Other material risks ................................................................................................... 25 C.7 Any other information ................................................................................................ 25
D. Valuation for solvency purposes ................................................................................ 26 D.1 Assets ....................................................................................................................... 27 D.2 Technical provisions .................................................................................................. 28 D.3 Other liabilities .......................................................................................................... 31 D.4 Alternative methods for valuation .............................................................................. 31 D.5 Any other information ................................................................................................ 31
E. Capital Management .................................................................................................. 32 E.1 Own funds ................................................................................................................. 32 E.2 Solvency Capital Requirement & Minimum Capital Requirement ............................... 33 E.3 Use of the duration-based equity risk sub-module in the calculation of SCR ............. 34 E.4 Differences between the standard formula and any internal model used ................... 34 E.5 Non-compliance with the MCR and non-compliance with the SCR ............................ 34 E.6 Any other information ................................................................................................ 34
ANNEXES ......................................................................................................................... 35 S.02.01.02 – Balance sheet (x 1.000 EUR) ..................................................................... 35 S.05.01.02 – Premiums, claims and expenses by line of business (non-life insurance and reinsurance obligations) (x 1.000 EUR) ........................................................................... 36 S.05.02.01 – Premiums, claims and expenses by country (non-life obligations) (x1.000 EUR) ........................................................................................................................................ 37 S.17.01.02 Non-Life Technical Provisions (x1.000 EUR) ................................................. 38 S.22.01.22 – Impact of long term guarantees and transitional measures (X1.000 EUR) .. 39 S.23.01.22 – Own funds (X1.000 EUR) ........................................................................... 40 S.25.01.22 – Solvency capital requirement (for groups on Standard Formula) (X1.000 EUR) ........................................................................................................................................ 41 S.28.01.01 Minimum Capital Requirement - Only life or only non-life insurance or reinsurance activity (X1.000 EUR) ...................................................................................................... 42
SOLVENCY AND FINANCIAL CONDITION REPORT 2016 - 3 -
Summary
The SFCR is the annual Solvency and Financial Condition Report that all insurance undertakings and groups have to disclose to the public. The report provides qualitative and quantitative information on Business and Performance, System of Governance, Risk Profile, Valuation for Solvency purposes and Capital Management of the undertaking.
The report has a harmonized structure that is defined by Annex XX to the Solvency II Delegated Acts Regulation and includes templates defined by Implementing Regulation containing quantitative information (Quantitative Reporting Templates (QRTs)).
All amounts in this report are presented in millions of euros unless otherwise stated.
Since this is the first time publication of this report in its current structure no comparison is made with previous versions and reference to 2015 figures is not systematic since Solvency II valuated data were not completely available at that time.
Highlights
KBC Group Re is the reinsurance subsidiary of KBC Group, specializing in protecting the group's bank and insurance entities.
KBC Group Re has a medium risk profile in line with the Risk Appetite Statement.
KBC Group Re is strongly capitalized both in terms of level and quality of capital. The Solvency II ratio per 31/12/2016 amounts to 619% (including volatility adjustment).
The LuxGaap result for 2016 amounted to 81 million EUR in 2016 mainly due to a diminution of the equalization provision. Earned premiums went up 61% totalling 22,3 million EUR. Combined ratio for 2016 amounted to 94,5%.
A continued implementation of the KBC Group ‘Three Lines of Defence’ model is operated.
Remarks
The information provided in this document has not been subject to an external audit. Disclosures have however been checked for consistency with other existing reports and were subjected to the screening of authorized management representatives to ensure quality.
The 2016 Solvency & Financial Condition Report was distributed to the Board of Directors to ensure the appropriate approval of the management body as requested under Solvency II.
The Solvency and Financial Condition Report is available in English on the website of KBC Group Re and is updated on a yearly basis. Next update is scheduled for May 2018.

SOLVENCY AND FINANCIAL CONDITION REPORT 2016 - 4 -
A. Business & performance
A.1 Business
Area of operation
KBC Group Re SA is the Luxembourg reinsurance subsidiary belonging to the KBC Group. The company was incorporated on 20 March 1989.
The company specializes in protecting the group's bank and insurance entities.
Shareholders
KBC Group Re is wholly owned by KBC Insurance NV, which is in turn wholly owned (directly and indirectly) by KBC Group NV. KBC Group NV is a listed company.
Long-term credit ratings (24 October 2016)
Standard & Poor’s
KBC Group Re SA A-
Management
Day-to-day management
Chairman of the Board of Directors
Ivo Bauwens
Hans Verstraete
Address
KBC Group Re SA
4 rue du Fort Wallis
L-2714 Luxembourg
Supervisory authorities
KBC Group Re SA KBC Group NV
Commissariat aux Assurances
7, boulevard Joseph II,
L-1840 Luxembourg
Nationale Bank van België
De Berlaimontlaan 14
1000 Brussel

SOLVENCY AND FINANCIAL CONDITION REPORT 2016 - 5 -
The strategy of the company is embedded in the strategy of the KBC Group. For more detailed information, please see the KBC Group annual report for 2016.
KBC Group is an integrated bank-insurance group whose core markets are Belgium, the Czech Republic, Slovakia, Hungary, Bulgaria and Ireland, for a total of more than 10 million clients. Its network is organized around 1 456 bank branches (2016 figure), insurance sales via own agents and other channels, as well as various electronic channels. The group employed some 36 000 FTEs (2016 figure).
KBC Group is structured around three business units, which focus on local activities and contribute to sustainable earnings and growth. The units are Belgium, the Czech Republic and International Markets.
KBC Group Re is the reinsurance subsidiary of KBC Group, specializing in protecting the group's bank and insurance entities. The underwriting activities of KBC Group Re consist in the 2 following segments:
1. The reinsurance of KBC insurance risks
2. The reinsurance of KBC operational risks
The KBC Insurance risks segment comprises acceptances that are made for optimization of the group’s insurance retention and increasing capital flexibility within the KBC Insurance Group by deploying currently redundant capital of the company. For implementing this optimization, KBC Group Re has been chosen as centralizing placement vehicle for major reinsurance programs on property and liability. KBC Group Re also participates in the other reinsurance placements of KBC direct insurance entities that are open to the external reinsurance market.
The KBC Operational risks segment includes classical operational risks for a bank-insurer which are typically placed on facultative “program” basis as covers for professional liability, fraud, cybersecurity and the various property belonging to KBC Group. It comprises also some specialty covers as safe deposit covers for clients of the bank or other para-banking insurance covers for bank clients (e.g. insurances linked to bank cards). KBC Group Re supports the placement of those KBC programs by filling the gap between the deductibles/risk retentions of the individual KBC companies (original insureds) and the group deductible, by retaining - on behalf of KBC - the result volatile priority layers where capacity in the market is hardly available, and by facilitating access to the international price-worthy (re-)insurance capacity.
The income statement (LuxGaap) of KBC Group Re is the following:
External auditor
PwC Luxembourg
2 Rue Gerhard Mercator
L-2182 Luxembourg
Number of FTEs
As at 31 December 2016 the company employed 9,05 persons (Full time equivalent)

SOLVENCY AND FINANCIAL CONDITION REPORT 2016 - 6 -
Table 1 Income statement, using LuxGAAP rules
The LuxGaap result of KBC Group Re amounted to 81 million EUR in 2016 (+213%) mainly due to a diminution of the equalization provision with 99,6 million EUR (before tax). More details on the underwriting and investment performance are given in the following two sections.
A.2 Underwriting performance
Earned premiums totalled 22,3 million EUR in 2016, showing an increase of 61% from 13,9 million EUR in 2015. This is principally due to a reinforcement of the role of KBC Group Re as centralizing placement vehicle for reinsurance optimization within the KBC Group.
Table 2 Non-life ratios
Volatility in earnings and ratios is unavoidable for KBC Group Re, which is in line with the mission of being the internal reinsurer of the KBC Group and due to the small size of the portfolio.
The net claims ratio rose from -33,8% to 81,5% due to important storm and liability claims registered on the reinsurance programs of KBC Insurance. The year 2015 additionally showed an
(X 1.000 EUR) 2016 2015Change
in amount
Change
in %
Net earned premiums Non-Life 22 308 13 864 8 444 61%
Gross Earned premiums 34 689 23 637 11 052 47%
Ceded reinsurance premiums -12 381 -9 773 -2 608 27%
Net claims incurred -18 187 4 686 -22 873 -488%
Gross claims incurred -16 403 -5 860 -10 543 180%
Reinsurers' share in claims incurred -1 784 10 547 -12 330 -117%
Net operating expenses -2 905 -3 410 505 -15%
Net acquisition costs -977 -1 475 498 -34%
Administrative expenses -1 928 -1 935 7 0%
Investments Incomes 13 674 39 585 -25 911 -65%
Interest income 13 140 14 578 -1 438 -10%
Dividend income 0 4 439 -4 439 -100%
Net realized result from investments 679 21 709 -21 030 -97%
Other investments related incomes/costs -145 -1 142 997 -87%
Net other income -30 287 -317 -110%
Change in the equalization provision 99 591 -25 409 125 000 -492%
Taxes -33 496 -3 763 -29 733 790%
Result after tax 80 955 25 840 55 114 213%
2016 2015
Net claims ratio 81,5% -33,8%
Net expense ratio 13,0% 24,6%
Combined ratio 94,5% -9,2%

SOLVENCY AND FINANCIAL CONDITION REPORT 2016 - 7 -
atypical negative claims ratio due to the cancellation – following a favorable evolution - of prudential reserves that were made for some past large claims.
The expense ratio went down from 24,6% to 13,0% due to lower acquisition costs on the 2016 business (increase of the non-proportional reinsurance) and non-recurrent adjustments to commissions of some previous years contracts (reduction of profit commission).
As a result, the combined ratio increased from -9,2% to 94,5%, a rise attributable mainly to the higher claims ratio.
More information about the underwriting performance can be found in the Quantitative Reporting Templates (QRT):
S.05.01.02 – Premiums, claims and expenses by line of business
S.05.02.01 – Premiums, claims and expenses by country
A.3 Investment performance
At 13,7 million EUR at year-end 2016, total net investments income was down by 25,9 million EUR (-65%) as a result of:
- Lower interest incomes due to a declining portfolio volume (in comparison with the portfolio of beginning 2015) and to a decrease in the return on the bonds portfolio caused by lower reinvestment yields
- The full divestment of the equity portfolio in 2015, which explains the high decrease of dividend income and realized results from investments
Other investments related incomes/costs reduced significantly due to:
- Lower custodian and asset management fees. - Lower withholding taxes
In the LuxGaap financial statements, investments in bonds are measured at amortized cost, minus impairments when it is expected that the impairment in value is permanent in nature. Table 3 shows the amount of unrealized gains and losses.
Table 3 Unrealized gains/losses on the bonds portfolio
Portfolio volume was quite stable in comparison with previous year.
KBC Group Re does not have any investments in securitisation.
(X 1.000 EUR) 31/12/2016 31/12/2015Change
in amount
Change
in %
Market value 577 733 579 122 -1 389 0%
Book value 539 571 538 789 782 0%
Unrealized gains/losses 38 162 40 333 -2 171 -5%
SOLVENCY AND FINANCIAL CONDITION REPORT 2016 - 8 -
A.4 Performance of other activities
No other activities are material.
A.5 Any other information
No other information to report.
SOLVENCY AND FINANCIAL CONDITION REPORT 2016 - 9 -
B. System of governance
B.1 General information on the system of governance
Management structure of KBC Group Re
In accordance with the Articles of Association, the Company is managed by a Board of Directors. The Board of Directors is responsible for developing and approving the strategy and general policy for the company, including a risk, compliance and audit framework, and monitoring their implementation. The Board is also responsible for the appointment of the Managing Director.
The Managing Director’s responsibilities include implementing and monitoring (together with the Board) the strategic plans, appointing all staff members, being the primary contact point between staff members and the Board, providing strong leadership to, and effective management of, the Company and otherwise carrying out the day to day management of the Company. This Managing Director does also assume the responsibilities and role of ‘Dirigeant agréé’ as defined in the Luxembourg regulation ‘Loi modifiée du 6 décembre 1991 sur le secteur des assurances’.
The Board also acts as Audit, Risk and Compliance Committee (see infra).
The Board is composed of at least 3 members (currently 4) appointed by the General Meeting. Directors of KBC Group Re are not remunerated. The Managing Director is the sole Executive Director.
Audit Risk and Compliance Committee
Within KBC Group Re, the Audit, Risk and Compliance Committee is not set up as a separate committee and the Board directly exercises its responsibilities regarding those topics within the audit, risk and compliance domains, i.e. the integrity of the financial reporting, the effectiveness of the internal control measures and risk management processes, and the implementation of the compliance rules.
Following persons, or their representative, participate as permanent guests during these Audit Risk and Compliance Committee meetings:
- The Internal auditor; - The Chief Risk Officer (CRO) of the Business Unit Belgium of KBC; - The Compliance Officer.
The external auditors are invited at least once a year.
Reporting of the control functions
The local risk function, compliance function and actuarial function, and the group audit function report on their findings to the Board of Directors when acting as Audit Risk and Compliance Committee.
Group Risk, Group Compliance and the Actuarial Function Holder Group will, at the level of the KBC Insurance Group and KBC Group, report on their findings to:
- The Executive Committee of KBC Insurance NV and KBC Group NV.

SOLVENCY AND FINANCIAL CONDITION REPORT 2016 - 10 -
- The Audit Committee, the Risk & Compliance Committee and the Board of Directors of KBC Insurance NV and KBC Group NV.
B.2 Fit and proper requirement
Fit and proper requirements for the members of the Board of Directors are part of the company’s Corporate Governance Charter which indicates the conditions of appointment of new board members, as well as the training requirements. Appointment conditions aim at a balanced composition of the Board, ensuring that the board members have adequate insurance and reinsurance expertise, general corporate management expertise and broader societal experience.
For the persons having a key function, propriety and fitness checks are part of the human resources management policy. This policy includes the request of showing the criminal record. Fitness checks are part of the recruitment process: formal qualification is checked as well as previous experience. Human resources procedures also include training requirements aiming at maintaining the qualification of employees.
B.3 Risk management system including the own risk and solvency assessment
Risk management framework
Risk management is a key component of the strategic management within KBC Group. It refers to the coordinated set of activities to manage the risks that can affect KBC Group in its ability to achieve its objectives.
The KBC Risk Management Framework describes how risk management is performed on a continuous basis throughout the whole of KBC Group. As such, it is the single point of entry for all documentation on the risk management process within KBC Group.
The KBC Risk Management Framework is based upon the Risk Strategy which specifies the objectives, mandate and ambition level of KBC Group with regard to risk management, as decided by the Board of Directors of KBC Group.
Risk management within KBC Group is organized on a risk-type basis. This is reflected in risk-type specific Risk Management Frameworks, each elaborating the specific measures, methods, tools … that are most suited for the particular risk type. Where relevant, the risk-type specific frameworks differentiate between minimum standards for Banking, Insurance and Asset Management (the 3 main sectors of activities of KBC as integrated bank-insurance group). Generic elements applicable to all risk types are described in the overarching risk management framework. Next to the risk type specific frameworks, an integrated risk management framework describes the integrated cross-silo approach.
The overarching risk management framework also introduces a number of fundamental risk concepts and tools, such as:
- A common risk map, i.e. an overall picture of all the predominant risk types and subtypes which are used within the KBC risk universe, indicating how these are interrelated.
- Risk measurement standards. - Stress testing standards.

SOLVENCY AND FINANCIAL CONDITION REPORT 2016 - 11 -
The KBC Risk Management Framework defines minimum standards that all entities within the group must adhere to. Group frameworks must therefore be endorsed by local entities, including KBC Group Re. At the same time the implementation of each framework can be adjusted on the basis of local conditions.
As the risk management landscape is in constant evolution due to changes in internal as well as external contextual elements, the components of the KBC Risk Management Framework are reviewed on a regular basis to ensure their ongoing effectiveness.
The risk management process consists of following steps:
- Risk identification - Risk measurement - Setting and cascading risk appetite - Risk analysis, reporting and follow-up
As the risk management process is a continuous effort, these process-steps are not strictly sequential and interact with one another.
Risk governance
Main components of the risk governance model for KBC Group Re are:
- The Board of Directors which decides on and supervises the risk appetite and risk strategy each year.
- The ‘three lines of defence’ model that is further described in the next section. - The ‘Investment Committee’ that assists the Board of Directors in the domain of
investments and balance sheet management.
Own risk and solvency assessment
The KBC Insurance Group and its insurance and reinsurance subsidiaries undertake on a regular basis an Own Risk and Solvency Assessment (ORSA) to monitor and ensure that business is managed in a sound and prudent way.
KBC’s ORSA policy describes the general KBC approach with respect to the ORSA-process and its outcome. It defines and describes the components, principles and characteristics of the ORSA-process within the KBC Insurance Group. KBC Group Re has locally endorsed the Group ORSA Policy, completed by a local addendum specifying the local legal, regulatory and organizational features of the company.
The ORSA is an integral part of the business strategy and is taken into account on an ongoing basis in the strategic decisions within the KBC Insurance Group. KBC Insurance Group has decided to perform the ORSA assessments at the level of the KBC Insurance Group and at the level of the individual material subsidiaries pertaining to the Insurance Group.
The main processes underlying the regular ORSA are executed on an annual basis and are closely linked to the Strategic Planning Process (Alignment of Planning Cycles or APC) which also follows an annual cycle. The APC streamlines the processes of financial planning, strategy review, risk appetite setting and internal solvency and capital adequacy assessment. Taking into account the fact that KBC’s insurance business is sufficiently mature, this annual periodicity is deemed adequate.
The figure below shows the 5 phases of the APC process:

SOLVENCY AND FINANCIAL CONDITION REPORT 2016 - 12 -
The monitoring and follow-up of the risk appetite and limits is implemented formally via the integrated risk reporting.
Based on the outcome of the above processes and assessments a conclusion is included in the ORSA report that will indicate to what extent the available capital is sufficient to cover the capital requirements. It links this conclusion to the:
- Evolution of amount and composition of available regulatory capital over a 3-year horizon and under different economic circumstances.
- Evolution of required regulatory capital over the 3-year planning horizon, taking into account expected changes to the risk profile of the entity/group.
- The impact of scenario analyses and sensitivities on required and available regulatory capital.
KBC Group Re relies on the Solvency II standard formula to assess its overall solvency needs. On an annual basis an assessment is performed to check whether the standard formula is appropriate in relation to the risk profile of the company.
The annual ORSA process assesses the situation and the data per 31 December and is submitted to the Supervisory authority before 30th June of the following year. KBC does not differentiate between the internal and the supervisory ORSA report. Each ORSA report is complemented with an ORSA record which contains all documents that have been used in the different steps of the ORSA.
B.4. Internal control system
Three lines of defence concept
In order to promote clear accountability for risk taking, oversight and independent assurance, a “Three lines of defence” concept is implemented at the KBC Group. All the relevant internal stakeholders (and their roles & responsibilities) related to risk management are positioned within this model. The three lines of defence are defined as follows:
- Business line management, as the first line of defence, is responsible for identifying and managing the risks inherent in the products, activities, processes and systems for which it is accountable. Business line management is also responsible for determining its risk appetite.
- The second line of defence (of which the Risk Function is part) includes all independent Support & Oversight Functions. The Risk function:
o Is responsible for identifying, measuring, monitoring and reporting risk on a group-wide basis, independently from the first line of defence.
o Sets the standards via the KBC Risk Management Framework and supports the business in its implementation.
o Challenges the business on their risk identification, measurement and response. o Creates oversight over the Group’s control environment and risk exposure.
- The third line of defence is provided by internal and external audit, assuring an independent review and challenge of the Group’s risk management processes.

SOLVENCY AND FINANCIAL CONDITION REPORT 2016 - 13 -
This “Three lines of defence” model ultimately reinforces the resilience of KBC's risk and control environment and safeguards the sustainability of the business model.
Compliance function
The compliance function is part of the 2nd line of defence.
The compliance charter details the scope, responsibilities and governance of the compliance function. The Compliance Officer ensures that the charter is approved by the Board of Directors when acting as Audit Risk and Compliance Committee. The Compliance Charter was updated and approved in April 2016.
Function holders
For KBC Group Re, the compliance function is locally grouped with the Risk Management function due to the size of the entity and the nature of its risks. The Local CRO is the key function holder for both functions.
B.5 Internal audit function
The internal audit function of KBC Group Re is exercised by KBC Group Corporate Audit. The responsibilities of Internal Audit are:
- To provide independent assurance to the Board of Directors and management on the effectiveness and efficiency of the processes of risk management, internal control and corporate governance that are in place.
- To support the Board of Directors and management in taking up their responsibilities in these processes.

SOLVENCY AND FINANCIAL CONDITION REPORT 2016 - 14 -
- To report any serious issues or risks which it becomes aware of and to undertake any required investigations into high-risk situations.
- To make clear and actionable recommendations which address weaknesses noted during its work and to follow up on the implementation status of these recommendations.
- To carry out any assignment or projects entrusted to it by the Board of Directors or the management.
To safeguard its independence and objectivity:
- Internal Audit reports and is accountable to the Board of Directors (acting as Audit Risk and Compliance Committee).
- The internal audit activity remains free from interference by any part of the organisation, including matters of audit selection, procedures, frequency, timing or report content.
- The appointment and dismissal of the head of Internal Audit belongs to the authority of the Audit Committee of KBC Group.
- Internal auditors are, during the exercise of their professional duties, authorised to have direct communication with any member of staff, as well as to access all premises and any records, files or data that are relevant to the performance of an assignment, subject to compliance with local regulations. All members of staff are requested to assist Internal Audit in fulfilling its roles and responsibilities.
- Internal Audit has the authority to perform assignments at its own initiative, subject to proper reporting to the Board of Directors.
- Internal Audit has the authority to inform directly, and at its own initiative, the Chairman of the Board of Directors, the Managing Director, the Statutory Auditors or the local Supervisory Authorities.
- Internal auditors must always be objective and impartial and seek to avoid any conflict of interest.
- Internal auditors are not directly involved in the operational organisation of an entity, nor in deciding, developing, introducing or implementing risk management and internal control measures.
- Internally recruited auditors respect a “cooling-off” period. - Whenever practicable and without jeopardising competence and expertise, internal audit
staff will periodically rotate within the internal audit function to boost independence.
Internal Audit periodically examines and evaluates the most risky areas of its scope and an audit plan is approved at least once a year by the Board of Directors when acting as Audit Risk and Compliance Committee.
The approach followed in performing the audit assignments is described in all resulting audit reports so that their readers can consider the findings against the approach followed. A risk-based approach is used as the primary auditing method. The level of assurance, which may be gained from Internal Audit’s work, is relative to the nature and extent of work carried out. It is therefore essential that the auditor involved, when giving a reasoned opinion, documents the nature and the extent of the work undertaken.
The implementation of the audit recommendations is the responsibility of line management that will communicate the status of this follow-up regularly to Internal Audit, for monitoring purposes.
The independence and objectivity of Internal Audit is assured by the Internal Audit Charter approved by the Board of Directors. The Charter also describes the functioning and organization of the Internal Audit function.

SOLVENCY AND FINANCIAL CONDITION REPORT 2016 - 15 -
B.6 Actuarial function
The Actuarial function is one of the key control functions that is defined in the Solvency II regulatory framework. Basically, the task of this function is to ensure that the company’s Board of Directors is fully informed in an independent manner. It does this by:
- Advising on the calculation of the technical provisions (a.o. appropriateness of methodologies, appropriateness and quality of data used, experience analysis)
- Expressing an opinion on the overall underwriting policy - Expressing an opinion on the adequacy of reinsurance arrangements - Contributing to the effective implementation of the Risk Management system - Reporting and giving recommendations.
Within the KBC Insurance Group, the Actuarial Function is implemented as follows: - The Actuarial Function operates under the ultimate accountability of the Board of
Directors. - An ‘Actuarial Function Holder’ is appointed for every local entity and also on KBC
Insurance Group level. The Actuarial Function Holder is to be registered on the pay-roll of the entity he/she is representing. Her/his duties cannot be outsourced to a party external to the entity.
- The Actuarial Function Holder coordinates the activities of the Actuarial Function. In general, ‘a function’ is the administrative capacity to undertake particular governance tasks and is – as such - not limited to one specific person or one organizational unit but can be assigned to several persons or departments subject to an adequate segregation of duties.
- The Actuarial Function has as basic task to ensure the independent ‘second pair of eyes’, needed for the Actuarial Function Holder to fulfil all of the assigned obligations. The Actuarial Function gives input to the Actuarial Function Holder a.o. in forming opinions, proposing recommendations and assisting in writing the Actuarial Function Report.
B.7 Outsourcing
Outsourcing principles
KBC Group Re outsources some of its activities.
In order to manage the risks relating to outsourcing, KBC Group Re has drafted an Outsourcing policy. This policy is applicable on intragroup and external outsourcing, and ensures that the company remains fully responsible of the outsourced activities and that the risks relating to these activities are well managed. The policy sets out:
- the definition of outsourcing as applied within KBC Group - the restrictions, roles and responsibilities relating to outsourcing - a high level process description, including the monitoring requirements - principles and necessary clauses for the outsourcing agreements
Intragroup outsourcing
As already stated in the previous sections, part of the control activities are exercised on group level with a view to centralization, independence, consistency and synergy. This includes parts of the Solvency II requirements: Solvency capital requirements calculation, elements of the Best

SOLVENCY AND FINANCIAL CONDITION REPORT 2016 - 16 -
Estimate of technical provisions (e.g. Risk Margin), automated compilation of part of pillar 3 quantitative reports, …
The Internal audit function is fully outsourced to KBC Group.
Asset management is outsourced to KBC Asset Management NV.
External outsourcing
KBC Group Re outsources parts of its ICT to a certified Luxembourg ‘Professionnel du Secteur Financier’.
B.8 Any other information
No other information to report.

SOLVENCY AND FINANCIAL CONDITION REPORT 2016 - 17 -
C. Risk profile
KBC Group Re is exposed to a number of typical industry-specific risks such as movements in interest rates and exchange rates, insurance risks, credit risks, operational risks, etc.
The Risk Appetite Statement of KBC Group Re reflects the view of the Board of Directors and management on risk taking in general and in particular on the acceptable level and composition of risks in coherence with the desired return. For the most material risks, this leads to the following risk appetite and risk profile:
Figure 1 2017 Risk profile and Risk appetite of KBC Group Re
The latest assessment of the risk profile shows that, overall as well as for every risk type separately, the company remains within its risk appetite.
SOLVENCY AND FINANCIAL CONDITION REPORT 2016 - 18 -
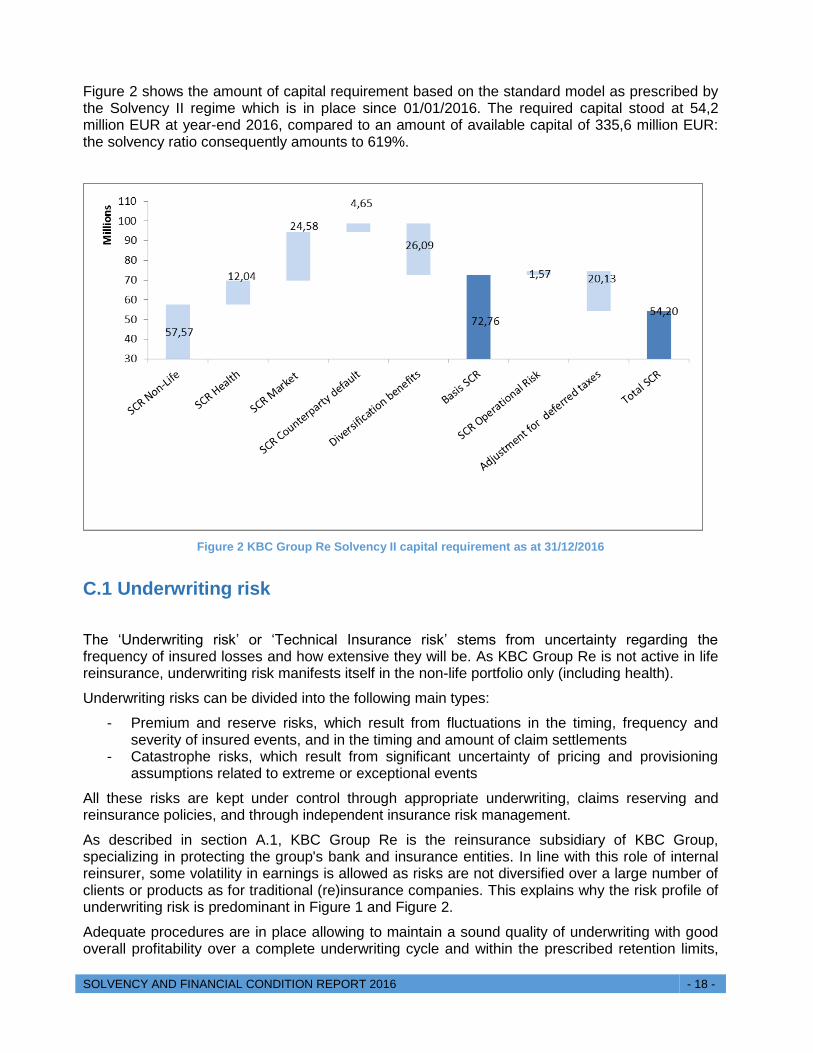
Figure 2 shows the amount of capital requirement based on the standard model as prescribed by the Solvency II regime which is in place since 01/01/2016. The required capital stood at 54,2 million EUR at year-end 2016, compared to an amount of available capital of 335,6 million EUR: the solvency ratio consequently amounts to 619%.
Figure 2 KBC Group Re Solvency II capital requirement as at 31/12/2016
C.1 Underwriting risk
The ‘Underwriting risk’ or ‘Technical Insurance risk’ stems from uncertainty regarding the frequency of insured losses and how extensive they will be. As KBC Group Re is not active in life reinsurance, underwriting risk manifests itself in the non-life portfolio only (including health).
Underwriting risks can be divided into the following main types:
- Premium and reserve risks, which result from fluctuations in the timing, frequency and severity of insured events, and in the timing and amount of claim settlements
- Catastrophe risks, which result from significant uncertainty of pricing and provisioning assumptions related to extreme or exceptional events
All these risks are kept under control through appropriate underwriting, claims reserving and reinsurance policies, and through independent insurance risk management.
As described in section A.1, KBC Group Re is the reinsurance subsidiary of KBC Group, specializing in protecting the group's bank and insurance entities. In line with this role of internal reinsurer, some volatility in earnings is allowed as risks are not diversified over a large number of clients or products as for traditional (re)insurance companies. This explains why the risk profile of underwriting risk is predominant in Figure 1 and Figure 2.
Adequate procedures are in place allowing to maintain a sound quality of underwriting with good overall profitability over a complete underwriting cycle and within the prescribed retention limits,

SOLVENCY AND FINANCIAL CONDITION REPORT 2016 - 19 -
ensuring adherence to the group and local risk appetite. KBC Group Re on top of that holds a large solvency buffer to ensure its solidity.
As seen in Figure 2, SCR for underwriting together represent 69,6 million EUR accounting for 70% of the undiversified basic Solvency II pillar 1 capital requirement. Table 4 highlights a predominance of ‘catastrophe’ risks in line with the company’s role within the KBC Group.
Table 4 SCR Underwriting Risk of KBC Group Re (31/12/2016)
C.2 Market risk
Market risk is the risk of potential losses resulting from fluctuations in the level and in the volatility of market prices of assets, liabilities and financial instruments.
The various types of market risk which are discussed in this section are:
- Interest rate risk - Spread risk - Currency risk - Concentration risk
Exposure of KBC Group Re to ‘Equity risk’ and ‘Property risk’ is highly immaterial.
As seen in Figure 2, SCR for market risk represents 24,6 million EUR accounting for 25% of the undiversified basic Solvency II pillar 1 capital requirement. Table 5 shows the predominance of interest rate risks in line with the prudent asset allocation strategy of KBC Group Re (no equity or derivative and moderate exposure to corporate risks).
Table 5 SCR Market Risk of KBC Group Re (31/12/2016)
mln EUR 31/12/2016
SCR Non Life 57,6
Premium and reserve risk 23,2
Catastrophe 47,2
Diversification benefit -12,8
SCR Health 12,0
Premium and reserve risk 0,8
Catastrophe 11,8
Diversification benefit -0,6
Total SCR Underwriting risks before diversification 69,6
mln EUR 31/12/2016
Interest rate risk 19,4
Spread risk 13,4
Currency risk 0,6
Concentration risk 6,0
Total SCR market risk before diversification 39,5
Diversification benefits 14,9
Total SCR after diversification 24,6

SOLVENCY AND FINANCIAL CONDITION REPORT 2016 - 20 -
Interest rate risk
Interest rate risk is the risk that the value of assets, liabilities and financial instruments will change due to fluctuations in interest rates.
The main technique used to measure and monitor interest rate risk is the 10 BPV (basis point value) method, which measures the extent to which the value of the portfolio would change if interest rates were to go up by ten basis points across the entire curve. Other techniques such as duration approach and stress testing are also used.
The required capital for interest risk is determined by calculating the impact on the available capital due to changes in the yield curve, and is the maximum loss resulting from (i) an upward shock or (ii) a downward shock according to the prescribed methodology. Due to its high capital buffer and to the low duration of its liabilities, it is the ‘upward’ shock that applies for KBC Group Re.
Spread risk
Spread risk is the risk that the value of assets, liabilities and financial instruments will change due to changes in the level or in the volatility of credit spreads over the risk-free interest rates.
This risk is managed via a strategic asset allocation that ensures a well-diversified high-quality investment grade portfolio. Where relevant, credit ratings provided by the external rating agencies are used to select assets and set and monitor limits. A predominant part of the portfolio relates to sovereign exposures as shown in Table 6.
Table 6 Asset Mix KBC Group Re
As shown in Table 7, a limited part of the corporate bonds portfolio is not externally rated. These however relate to high quality issuers.
mln EUR amount in % amount in %
Cash 5,5 0,9% 15,0 2,5%
of which term deposits 0,0 0,0% 0,0 0,0%
of which cash at bank 5,5 0,9% 15,0 2,5%
Government Bonds 402,0 67,5% 371,3 61,6%
Corporate Bonds 187,9 31,6% 216,2 35,9%
Total 595,3 100,0% 602,6 100,0%
ASSET MIX
31/12/2015 31/12/2016

SOLVENCY AND FINANCIAL CONDITION REPORT 2016 - 21 -
Table 7 Rating distribution of the Corporate bonds portfolio
Table 8 highlights that the country distribution of the sovereign bonds portfolio remained relatively stable.
Table 8 Country distribution of the Sovereign bonds portfolio
Within the standard formula of the Solvency II regime, required capital for spread risk is equal to the sum of capital requirement for bonds, structured products and credit derivatives. Of those only the capital requirement for bonds is relevant for KBC Group Re in the absence of structured products or derivatives in the portfolio. The capital requirement depends on (i) the market value, (ii) the modified duration and (iii) the credit quality category.
Rating
Market value - mln EUR amount in % amount in %
AAA 42,5 22,6% 18,9 8,8%
AA 25,0 13,3% 51,3 23,7%
A 74,2 39,5% 98,2 45,4%
BBB 31,1 16,5% 31,0 14,3%
BB 8,3 4,4% 2,1 1,0%
Non rated 6,8 3,6% 14,7 6,8%
Total 187,9 100% 216,2 100%
CORPORATE BONDS - RATING DISTRIBUTION
31/12/2015 31/12/2016
Geographic distribution
Market value - mln EUR amount in % amount in %
Europe 393,3 97,8% 344,2 92,7%
Supranational 68,2 17,0% 63,2 17,0%
Italy 41,0 10,2% 39,7 10,7%
Spain 36,5 9,1% 36,0 9,7%
Luxemburg 34,7 8,6% 35,8 9,6%
Poland 30,4 7,6% 29,9 8,1%
Belgium 28,4 7,1% 23,5 6,3%
France 33,9 8,4% 23,2 6,2%
Ireland 14,2 3,5% 22,5 6,0%
Latvia 19,1 4,7% 19,9 5,4%
Lithuania 17,2 4,3% 14,6 3,9%
Netherlands 11,7 2,9% 11,4 3,1%
Finland 10,8 2,7% 10,4 2,8%
Other Euro-zone 37,0 9,2% 7,3 2,0%
Other European countries 10,2 2,5% 6,9 1,9%
US 0,0 0,0% 0,0 0,0%
Rest of the world 8,7 2,2% 27,2 7,3%
Total 402,0 100% 371,3 100%
SOVEREIGN BOND - COUNTRY DISTRIBUTION
31/12/201631/12/2015

SOLVENCY AND FINANCIAL CONDITION REPORT 2016 - 22 -
Currency risk
Currency risk is the risk that the value of assets, liabilities and financial instruments will change due to changes in the level or in the volatility of currency exchange rates.
Table 9 below provides a view on the exposures.
Table 9 Exposure to currency risk (31/12/2016)
Currency risk is currently not hedged as materiality is low. A risk budget is determined and followed up.
Concentration risk
Concentration risk is the risk of an accumulation of exposures with the same counterparty.
To mitigate concentration risk, limits per (non-sovereign) issuer are foreseen in the investment strategy.
C.3 Credit risk
Credit risk or counterparty default risk reflects in the Solvency II standard formula possible losses due to unexpected default or deterioration in the credit standing of the counterparties and debtors. Assets that are in scope of spread risk are, by definition, not in scope of counterparty default risk, and vice versa.
For KBC Group Re, this affects the following types of exposures or assets:
- Reinsurance - Cash and deposits - Deposits with ceding undertakings - Receivables
In the Solvency II standard formula a distinction is made between two types of exposures:
- Type 1: Exposures that are low diversified but usually have a rating - Type 2: Exposures that are generally diversified with unrated counterparties
The total requirement for counterparty risk is an aggregation of the capital requirement for type 1 exposure and the capital requirement for type 2 exposure by taking a 75% correlation.
As seen in Figure 2, SCR for counterparty default risk represents 4,7 million EUR accounting for 5% of the undiversified basic Solvency II pillar 1 capital requirement. Further details can be found in Table 10.
31 December 2016 (X 1.000 EUR) CZK PLN USD HUF BGN
Net Assets 45 43
Net Liabilities 453 52 10
Net exposure 453 52 45 43 10

SOLVENCY AND FINANCIAL CONDITION REPORT 2016 - 23 -
Table 10 SCR Counterparty Risk (31/12/2016)
To mitigate the risk in respect of reinsurance, minimum target Financial Strength Ratings are required when entering into a reinsurance contract. More stringent requirements apply for long-tail business (like liability).
On top of that, from a KBC Group perspective, entities are limited in taking credit concentration risk in their portfolios by the Portfolio Limit System (PLS). Limits are monitored per asset class, where ceded reinsurance is one class (note that this system also mitigates credit risk in respect of investments). This particular type of credit risk is measured by means of a nominal approach (the maximum loss under reinsurance contracts) and expected loss, among other techniques. Name concentration limits apply, using internal or external ratings.
C.4 Liquidity risk
Liquidity risk is the risk that an organisation will be unable to meet its payment obligations as they come due, without incurring unacceptable losses. Liquidity risk is not quantified in the Solvency Capital Requirement under the Solvency II regime.
Currently, the liquidity risk is managed through monitoring of the Investment Policy. This policy ensures that the investment portfolio consists mainly of highly liquid positions. Recourse to ‘repos’ transactions is also allowed up to 25 million EUR. Liquidity risk is on top of that mitigated by the possibility figuring in retrocession contracts to request cash claim from reinsurers once contractually determined thresholds have been exceeded.
Table 11 illustrates that 68% of the total assets is considered as having a high liquidity value (the remaining being mostly composed of corporate bonds whose liquidity is important as well taking into account the fact that most bonds are investment grade). The ratio of liquid assets went down due to the increase of corporate bonds in the portfolio, and decrease of covered bonds amongst those corporate investments.
mln EUR 31/12/2016
Type 1 1,8
Type 2 3,2
Diversification benefit -0,3
SCR Counterparty risk 4,7

SOLVENCY AND FINANCIAL CONDITION REPORT 2016 - 24 -
Table 11 Liquidity of the assets of KBC Group Re
Table 12 shows the maturity profile of assets and liabilities. Assets are in all cases much larger then liabilities, which demonstrates that the company is not exposed to cash shortfall risk even in case of severe deterioration of the liabilities. This is due to the highly comfortable capital situation of KBC Group Re (large amount of surplus in comparison to liabilities).
Table 12 Assets and liabilities gap (31/12/2016)
C.5 Operational risk
Operational risk is the risk of loss resulting from inadequate or failed internal processes and systems, human error or sudden external events, whether man-made or natural. Operational risks include non-financial risks such as information and compliance risks, but exclude business, strategic and reputational risks. As seen in Figure 2, the SCR operational risk represents 1,6 million EUR accounting for 1,6% of the undiversified basic Solvency II pillar 1 capital requirement.
A single, global framework for managing operational risk applies across the entire group, defined by the Group risk function. In accordance with this framework, operational risk is measured via inter alia:
- Evaluation of the status of internal control for each processes - Evaluation of the individual risk profile for each specific risk within each process - Evaluation of the control effectiveness for the controls mitigating those specific risks - Estimation of the potential impact of the effective operational loss events
Operational risk is mitigated by:
- Controls (group-wide and locally defined) - Risk transfer via insurance

SOLVENCY AND FINANCIAL CONDITION REPORT 2016 - 25 -
C.6 Other material risks
Business & strategic risk
Business risk is the risk arising from changes in external factors (the macroeconomic environment, regulations, client behaviour, competitive landscape, socio-demographic environment, etc.) that impact the demand for and/or profitability of products and services.
Strategic risk is the risk, due to not taking a strategic decision, taking a strategic decision that does not have the intended effect or not adequately implementing strategic decisions.
Business and strategic risks are assessed as part of the strategic planning process via a risk scan that identifies the top financial and non-financial risks. Besides the risk scan, business and strategic risks are continually monitored by means of risk signals being reported to management.
Reputational risk
Reputational risk is the risk arising from the negative perception on the part of clients, counterparties, shareholders, investors, debt-holders, market analysts, other relevant parties or regulators that can adversely affect a financial institution’s ability to maintain existing, or establish new business relationships and to have continued access to sources of funding.
Reputational risk is mostly a secondary or derivative risk since it is usually connected to and will materialise together with another risk. KBC Group refined the Reputational Risk Management Framework in 2016, in line with the KBC Risk Management Framework. The pro-active and re-active management of reputational risk is the responsibility of the business. Under the pillar 2 approach to capital, the impact of reputational risk on the current business is covered in the first place by the capital charge for primary risks.
C.7 Any other information
Sensitivity analyses and stress testing
Risk sensitivity and stress testing exercises are set up to uncover risks that otherwise stay unidentified and also allow observing how risk measurements would evolve under stressed conditions. These sensitivity exercises are performed on a regular basis.
Stress testing is an important risk management tool that adds value both to strategic processes and to day-to-day risk management (risk identification, risk appetite and limit setting, etc.). As such, stress testing is an integral part of the risk management framework, and an important building block of ORSA (the Own Risk and Solvency Assessment).
Stress tests can be initiated by the regulators (EIOPA, group regulator or local regulator), or be performed internally (within the insurance group or locally).

SOLVENCY AND FINANCIAL CONDITION REPORT 2016 - 26 -
D. Valuation for solvency purposes
This chapter contains information regarding the valuation of the balance sheet items. A detailed situation as per end 2016 can be found in Table 13. A more detailed composition of the Solvency II values can be found in the QRT S.02.01.02 regarding the “Balance Sheet”.
For each material class of assets or liabilities:
- The bases, methods and main assumptions used for valuation for solvency purposes are described
- A quantitative and qualitative explanation of any material difference between the valuation for solvency purposes and the valuation in the financial statements is given.
Table 13 Valuation of assets and liabilities in the financial statements and within Solvency II
31/12/2016 (X 1.000 EUR)LuxGaap
Value
Solvency II
ValueDelta
Intangible assets 71 0 -71
Investments 549 259 587 556 38 297
Equities 1 1 0
Bonds 549 258 587 555 38 297
Deposits to cedants 16 188 16 188 0
Technical provisions - part of reinsurance 12 963 4 794 -8 169
Receivables 5 508 5 508 0
Cash 15 017 15 016 0
Tangible assets 86 86 0
Other assets 5 559 5 559 0
TOTAL ASSETS 604 649 634 707 30 057
Technical provisions 431 060 67 626 -363 434
TP representing liabilities 74 857 52 266 -22 591
Risk Margin 15 361 15 361
Equalization Provision 356 203 0 -356 203
Other provisions 39 060 39 060 0
Deposits from reinsurers 2 978 2 978 0
Payables 1 914 1 914 0
Deferred taxes 0 106 557 106 557
Other liabilities 0 0 0
TOTAL LIABILITIES 475 012 218 136 -256 876
Excess of Assets over liabilities 129 637 416 571 286 934

SOLVENCY AND FINANCIAL CONDITION REPORT 2016 - 27 -
D.1 Assets
D.1.1 FAIR VALUE MEASUREMENT
In line with the Delegated regulation, valuation of financial assets for solvency purposes is based on ‘fair value’. The following three hierarchical levels are used to determine the fair value:
Level 1: Fair value based on quoted prices in active markets
The fair value hierarchy gives the highest priority to ‘level 1 inputs’. This means that, when there is an active market, quoted prices have to be used to measure the financial assets or liabilities at fair value. Level 1 inputs are prices that are readily and regularly available from an exchange, dealer, broker, industry group, pricing service or regulatory agency. They represent actual and regularly occurring market transactions on an arm’s length basis. No valuation technique (model) is in this case involved.
Level 2: Fair value based on observable market data
Observable inputs are also referred to as ‘level 2 inputs’ and reflect the assumptions market participants would use in pricing the asset or liability based on market data obtained from independent sources. Observable inputs reflect an active market. Examples of observable inputs are the risk-free rate, exchange rates, stock prices and implied volatility. Valuation techniques based on observable inputs include discounted cash flow analysis, reference to the current or recent fair value of a similar instrument, or third-party pricing, provided that the third-party price is in line with alternative observable market data.
Level 3: Fair value not based on observable market data
Unobservable inputs are also referred to as ‘level 3 inputs’ and reflect the reporting entity’s own assumptions about the assumptions that market participants would use in pricing the asset or liability including assumptions regarding the risks involved. Unobservable inputs reflect a market that is not active. For example, proxies and correlation factors can be considered to be unobservable in the market.
D.1.2 MAIN ASSETS CATEGORY
Intangible assets
Intangible assets cannot be sold separately and are not recognized in the Solvency II framework: valuation for solvency purposes is set to nil.
In the LuxGaap financial statements, those assets (mostly software licenses) are valued at acquisition costs, and depreciated on a straight-line basis over their estimated useful lives.
Investments
Investments of KBC Group Re are mostly composed of bonds (99,99%).
Valuation for solvency purposes is based on ‘fair value’ as defined in section D.1.1.
In the LuxGaap financial statements, investments in bonds are measured at amortised cost, minus impairments when it is expected that the impairment in value is permanent in nature
Technical provisions – part of reinsurance
See section D.2.

SOLVENCY AND FINANCIAL CONDITION REPORT 2016 - 28 -
Deposits to cedants
Deposits to cedants are valued at their nominal value, both in LuxGaap and for solvency purposes. Value adjustments are made when the realisable value is uncertain.
Receivables
Receivables are valued at their nominal value, both in LuxGaap and for solvency purposes. Value adjustments are made when the realisable value is uncertain.
Cash
Cash is valued at fair value, both in LuxGaap and in Solvency II.
D.2 Technical provisions
KBC Group Re is exclusively active in non-life reinsurance (this includes health which is underwritten according to non-life principles). Technical Provisions of pure non-life and health policies are measured in a common process with identical methods and main assumptions. As such, both can be considered as a single business activity.
D.2.1 TECHNICAL PROVISIONS – VALUATION FOR SOLVENCY PURPOSES
In general, the technical provisions on the Solvency II economical balance sheet have to be calculated as the sum of a Best Estimate and a risk margin:
- The Best Estimate corresponds to the probability-weighted average of future cash flows, taking into account the time value of money, using the relevant risk-free interest rate term structure.
- The risk margin is calculated by determining the cost of providing an amount of eligible own funds equal to the Solvency Capital Requirement necessary to support the (re)insurance obligations over their lifetime. The cost of capital is defined by the regulator and is set at 6%.
When calculating the Best Estimate, a projection of the estimated future cash flows is consequently made. Those cash flows are subsequently discounted using the risk free interest rate term structure, prescribed by the regulator.
The calculation of the Best Estimate requires the contracts to be split up in homogeneous risk groups. These are groups with similar characteristics and dynamics, for which the same assumptions are then used when projecting the cash flows in the future. The company therefore makes a distinction between ‘short-tail’ and ‘long-tail’ lines of business.
Solvency II requires calculations to be performed separately for ‘premium provisions’ and ‘provisions for claims outstanding’. Both types of provisions are calculated according to different (standard) actuarial techniques.
Part of the reinsurers in both types of provisions is determined as the difference between the gross and the net of reinsurance provisions, less an adjustment for expected (mean) reinsurers’ default.
Premium provision

SOLVENCY AND FINANCIAL CONDITION REPORT 2016 - 29 -
The premium provision relates to claim events occurring after the valuation date and during the remaining in-force period (coverage period) of existing policies held by the undertaking.
The calculation of the gross Best Estimate of the premium provisions relates to:
- All expected future premiums for existing policies - All future claim payments for existing policies, arising from future events past the valuation
date. - All expenses related to the above: allocated or unallocated claims expenses, ongoing
administration of these policies, future acquisition costs, overhead expenses, …
The premium provision is calculated on the assumption that the portfolio of policies in the risk group is stable enough, such that claims experience from the past can be used to make predictions of claims that will occur in the future. Also the assumptions regarding the timing of future cash flows are based upon past claims experience.
Provisions for claims outstanding
The provisions for claims outstanding relate to claim events that have already occurred but are not settled yet, regardless of whether the claims arising from these events have been reported or not.
Different techniques are used, depending on the claim size: attritional claims are valued using actuarial techniques while large claims are valued on an individual claim level. An estimate is also made for those claims that have already occurred but have not yet been reported at valuation date. The Best Estimate for claims outstanding also includes provisions for claim handling costs, both internal and external.
Impact of volatility adjustment
KBC Group Re applies the volatility adjustment for discounting cash flows to determine the Best Estimate. Table 14 shows the moderate impact of this volatility adjustment.
Table 14 Impact of the volatility adjustment (31/12/2016)
Level of uncertainty
In line with the Solvency II requirements, the uncertainty on the Technical Provisions is assessed. Within the KBC Group this is done via a ‘Measurement risk assessment’ process.
31/12/2016 (X 1.000 EUR)
Amount with
Volatility
adjustment
Impact of
volatility
adjustment set
to zero
Technical provisions 62 832 212
Basic own funds 335 616 -155
Eligible own funds to meet
Solvency Capital Requirement335 616 -155
Solvency Capital Requirement 54 199 0
Eligible own funds to meet
Minimum Capital Requirement335 616 -155
Minimum Capital Requirement 13 550 0

SOLVENCY AND FINANCIAL CONDITION REPORT 2016 - 30 -
Due to its role of internal reinsurer of KBC Group, gross results of KBC Group Re are very volatile and single large claims dominate the technical provisions. For KBC Group Re, the ‘Measurement risk assessment’ consequently reveals that uncertainty around the final amount of Technical provisions is high. The Best Estimate calculation process is to an important extent based on expert judgement for the large claims and a large amount of uncertainty cannot be avoided.
KBC Group Re compensates this phenomenon with a sound capital and reinsurance policy.
D.2.2 TECHNICAL PROVISIONS – LUXGAAP VALUATION
In LuxGaap a distinction is made between the following types of provisions:
- Provision for unearned premiums - Provision for claims outstanding - Equalization provision
Those provisions are not discounted.
Provision for unearned premiums
The provision for unearned premiums comprises the amount representing the part of premiums written which is to be allocated to subsequent financial years. It is computed separately for each contract.
This applies to gross premiums and premiums ceded to reinsurers.
Provision for claims outstanding
The provision for claims is established on the basis of reports and individual estimates received from the ceding companies, where necessary supplemented with other information available. The amount of provision ceded to reinsurers is then calculated based on contractual agreements.
For ‘claims incurred but not reported’ at balance sheet date, an IBNR (Incurred But not Reported) provision is set aside. This IBNR provision is calculated using actuarial techniques.
A provision for the internal costs of settling claims is calculated at a percentage that is based on past experience.
Equalization provision
In accordance with the rules applicable for reinsurance companies in Luxembourg, an equalization provision must be established by KBC Group Re. Based on the grand ducal regulation relating to the supervision of reinsurance companies, the annual allocation to this provision equals the sum of the technical results and a share of the financial result until the provision reaches a ceiling. This ceiling is determined by applying to the net reinsurance premiums a multiple based on actuarial methods and approved by the local supervisor (multiples depend on the risk bucket).
In the event of a loss in a subsequent accounting period, a share of the equalization provision must be reintegrated into the result of the year in order to compensate for the loss.
This provision is not recognized under the Solvency II regime and set to nil. This complies with the fair value valuation principle.

SOLVENCY AND FINANCIAL CONDITION REPORT 2016 - 31 -
D.3 Other liabilities
Other liabilities mainly relate to tax provisions and deferred taxes:
- Current tax provisions: the estimated amount of taxes payable until valuation date serves as valuation amount both for solvency purposes and in the LuxGaap financial statements.
- Deferred taxes result from the netting of deferred tax liabilities over deferred tax assets. Those deferred taxes are not recognized in the LuxGaap statements and arise from:
o Carry forwards of unused tax losses (deferred tax asset) o Temporary differences between the SII value of assets and liabilities and their
value as recognized for tax purposes o
Net deferred tax liability amounts as per 31/12/2016 to 106,6 million EUR, mainly due to a difference in the valuation of technical provisions (non-recognition of the equalization provision in Solvency II).
D.4 Alternative methods for valuation
Not applicable for KBC Group Re.
D.5 Any other information
Other material information about valuation does not apply.

SOLVENCY AND FINANCIAL CONDITION REPORT 2016 - 32 -
E. Capital Management
The solvency of KBC Group Re is calculated on the basis of the Solvency II regime.
The minimum solvency ratio required by the regulator amounts to 100% of the Solvency Capital Requirement (SCR). Within KBC Group, the capital management process aims at reaching an optimal balance between regulatory requirements, rating agencies views, market expectations and management ambitions. It is a key management process relating to all decisions on the level and composition of the capital, both at group level and locally.
An important process in this context is the Alignment of Planning Cycles (APC). As explained in Chapter B, this yearly process aims to create an integrated three-year plan in which the strategy, finance, treasury and risk perspectives are collectively taken into account. In this process, the risk appetite of the group is set and cascaded by setting risk limits at entity level. The APC is not only about planning: it is also about closely monitoring the execution of the plan in all its aspects.
Next to APC, an Own Risk and Solvency Assessment (ORSA) is conducted on a regular basis, in accordance with Solvency II requirements. The aim of the ORSA is to monitor and ensure that business is managed in a sound and prudent way and that the company is adequately capitalised in view of its risk profile and the quality of its risk management and control environment.
E.1 Own funds
Solvency II regulations require the (re)insurance companies to classify own-fund items in accordance with quality criteria into three tiers. Classification depends upon whether they are basic own fund or ancillary own-fund items, and the extent to which they possess the following characteristics:
- the item is available, or can be called up on demand, to fully absorb losses on a going-concern basis, as well as in the case of winding-up (permanent availability)
- in the case of winding-up, the total amount of the item is available to absorb losses and the repayment of the item is refused to its holder until all other obligations, including insurance and reinsurance obligations towards policy holders and beneficiaries of insurance and reinsurance contracts, have been met (subordination).
Tier 1 capital consists of basic own funds that present both the permanent availability and subordination characteristics
Tier 2 capital consists of ancillary own funds and of basic own funds that present only the subordination characteristics
Tier 3 capital consists of any basic or ancillary own funds that are not classified as tier 1 and tier 2.
Table 15 details the capital position of KBC Group Re, which is exclusively composed of Tier 1 items.

SOLVENCY AND FINANCIAL CONDITION REPORT 2016 - 33 -
Table 15 Capital position of KBC Group Re
An extensive explanation of the reconciliation from the LuxGaap equity to the Solvency II eligible own funds is presented in Chapter D.
By the end of 2016, Tier 1 Own funds amounted 335,6 million EUR, eligible to cover both the Minimum Capital Requirement and Solvency Capital Requirement. The decrease compared to year-end 2015 is due to a reduction of the equalization provision in the LuxGaap financial statements that gave rise to a large dividend pay-out.
More information about the “Own funds” can be found in the QRT S.23.01.22.
E.2 Solvency Capital Requirement & Minimum Capital Requirement
The Solvency Capital Requirement and Minimum Capital requirement are calculated based on the standard model. No (partial or full) internal model is used. KBC Group Re does not use simplifications or undertaking specific parameters when applying the standard formula.
A detailed split of Solvency Capital Requirement by risk modules can be found in Figure 2 in Chapter C, where individual risk profiles are also extensively discussed.
KBC Group Re met the solvency requirements. As can be seen in Table 16, the solvency ratio stood at 619% at 31/12/2016.
Table 16 Solvency ratios of KBC Group Re (31/12/2016)
More information can be found in the Quantitative Reporting Template (QRT) S.25.01.22.
(X 1.000 EUR) 31/12/2016 31/12/2015
Own funds - Tier 1 335 616 393 251
LuxGaap shareholders equity 129 637 71 702
Dividend payout (-) -80 955 -25 840
Deduction intangible fixed assets -71 -83
Valuation difference investments 38 297 40 333
Valuation difference technical liabilities 355 265 452 275
of which equalization provision 356 203 455 794
Deferred taxes -106 557 -145 136
(X 1.000 EUR) 31/12/2016
Own funds - Tier 1 67 779
Solvency capital requirement (SCR) 54 199
Ratio of Eligible own funds to SCR 619%
Minimum capital requirement (MCR) 13 550
Ratio of Eligible own funds to MCR 2477%

SOLVENCY AND FINANCIAL CONDITION REPORT 2016 - 34 -
E.3 Use of the duration-based equity risk sub-module in the calculation of SCR
Not applicable for KBC Group Re.
E.4 Differences between the standard formula and any internal model used
Not applicable for KBC Group Re.
E.5 Non-compliance with the MCR and non-compliance with the SCR
KBC Group Re is compliant with the Minimal Capital Requirement as well as with the Solvency Capital Requirement.
E.6 Any other information
No other information to report.

SOLVENCY AND FINANCIAL CONDITION REPORT 2016 - 35 -
ANNEXES
S.02.01.02 – Balance sheet (x 1.000 EUR)
Solvency II
value
Solvency II
value
Assets C0010 Liabilities C0010
Goodwill R0010 Technical provisions – non-life R0510 67626,188
Deferred acquisition costs R0020 Technical provisions – non-life (excluding health) R0520 64227,501
Intangible assets R0030 0 Technical provisions calculated as a whole R0530 0
Deferred tax assets R0040 0 Best Estimate R0540 50710,951
Pension benefit surplus R0050 0 Risk margin R0550 13516,55
Property, plant & equipment held for own use R0060 85,617 Technical provisions - health (similar to non-life) R0560 3398,687
Investments (other than assets held for index-linked and unit-linked contracts) R0070 587555,822 Technical provisions calculated as a whole R0570 0
Property (other than for own use) R0080 0 Best Estimate R0580 1554,682
Holdings in related undertakings, including participations R0090 0 Risk margin R0590 1844,005
EquitiesR0100 0,799
Technical provisions - life (excluding index-linked and unit-linked)R0600 0
Equities - listed R0110 0 Technical provisions - health (similar to life) R0610 0
Equities - unlisted R0120 0,799 Technical provisions calculated as a whole R0620 0
Bonds R0130 587555,023 Best Estimate R0630 0
Government Bonds R0140 371348,498 Risk margin R0640 0
Corporate BondsR0150 216206,525
Technical provisions – life (excluding health and index-linked
and unit-linked)R0650 0
Structured notes R0160 0 Technical provisions calculated as a whole R0660 0
Collateralised securities R0170 0 Best Estimate R0670 0
Collective Investments Undertakings R0180 0 Risk margin R0680 0
Derivatives R0190 0 Technical provisions – index-linked and unit-linked R0690 0
Deposits other than cash equivalents R0200 0 Technical provisions calculated as a whole R0700 0
Other investments R0210 0 Best Estimate R0710 0
Assets held for index-linked and unit-linked contracts R0220 0 Risk margin R0720 0
Loans and mortgages R0230 0 Other technical provisions R0730
Loans on policies R0240 0 Contingent liabilities R0740 0
Loans and mortgages to individuals R0250 0 Provisions other than technical provisions R0750 39059,722
Other loans and mortgages R0260 0 Pension benefit obligations R0760 0
Reinsurance recoverables from: R0270 4794,356 Deposits from reinsurers R0770 2978,194
Non-life and health similar to non-life R0280 4794,356 Deferred tax liabilities R0780 106557,482
Non-life excluding health R0290 4794,356 Derivatives R0790 0
Health similar to non-life R0300 0 Debts owed to credit institutions R0800 0
Life and health similar to life, excluding health and index-linked and unit-linked R0310 0 Financial liabilities other than debts owed to credit institutions R0810 0
Health similar to life R0320 0 Insurance & intermediaries payables R0820 32,094
Life excluding health and index-linked and unit-linked R0330 0 Reinsurance payables R0830 1837,258
Life index-linked and unit-linked R0340 0 Payables (trade, not insurance) R0840 44,694
Deposits to cedants R0350 16187,735 Subordinated liabilities R0850 0
Insurance and intermediaries receivables R0360 4527,264 Subordinated liabilities not in Basic Own Funds R0860 0
Reinsurance receivables R0370 980,417 Subordinated liabilities in Basic Own Funds R0870 0
Receivables (trade, not insurance) R0380 0 Any other liabilities, not elsewhere shown R0880 0
Own shares (held directly) R0390 0 Total liabilities R0900 218135,632
Amounts due in respect of own fund items or initial fund called up but not yet paid in R0400 0 Excess of assets over liabilities R1000 416570,931
Cash and cash equivalents R0410 15016,409
Any other assets, not elsewhere shown R0420 5558,943
Total assets R0500 634706,563

SOLVENCY AND FINANCIAL CONDITION REPORT 2016 - 36 -
S.05.01.02 – Premiums, claims and expenses by line of business (non-life insurance and reinsurance obligations) (x 1.000 EUR)
Med
ical
exp
ense
insu
rance
Inco
me
pro
tect
ion
insu
rance
Work
ers'
com
pen
sati
on
insu
rance
Moto
r
veh
icle
liab
ilit
y
insu
rance
Oth
er m
oto
r
insu
rance
Mar
ine,
avia
tion a
nd
tran
sport
insu
rance
Fir
e an
d
oth
er d
amag
e
to p
rop
erty
insu
rance
Gen
eral
liab
ilit
y
insu
rance
Cre
dit
and
sure
tysh
ip
insu
rance
Leg
al
exp
ense
s
insu
rance
Ass
ista
nce
Mis
cellan
eous
finan
cial
loss
Hea
lth
Cas
ual
ty
Mar
ine,
avia
tion,
tran
sport
Pro
per
ty
C0010
C0020
C0030
C0040
C0050
C0060
C0070
C0080
C0090
C0100
C0110
C0120
C0130
C0140
C0150
C0160
C0200
Pre
miu
ms
wri
tten
Gro
ss -
Dir
ect
Busi
nes
sR
0110
Gro
ss -
Pro
port
ional
rei
nsu
rance
acc
epte
d
R0120
020,3
6531
00
0147,9
5733
4056,8
18450,7
007
-86,2
3885
035,7
4007
4387,5
858
17013
Gro
ss -
Non-p
rop
ort
ional
rei
nsu
rance
acc
epte
d
R0130
180,1
06
4527,8
7172,3
602
12881,4
817762
Rei
nsu
rers
' shar
eR
0140
00
00
00
1245,0
4664
2206,8
496
00
01231,5
4725
02012,2
05685,7
97
12381
Net
R0200
020,3
6531
00
0147,9
5733
2811,7
6336
6243,8
51
-86,2
3885
035,7
4007
3156,0
3855
180,1
06
2515,6
7172,3
602
7195,6
86
22393
Pre
miu
ms
earn
ed
Gro
ss -
Dir
ect
Busi
nes
sR
0210
Gro
ss -
Pro
port
ional
rei
nsu
rance
acc
epte
d
R0220
020,3
6531
00
0147,9
5733
3970,3
5265
8451,6
133
-86,2
3885
035,7
4007
4387,5
858
16927
Gro
ss -
Non-p
rop
ort
ional
rei
nsu
rance
acc
epte
d
R0230
180,1
06
4527,8
7172,3
602
12881,4
817762
Rei
nsu
rers
' shar
eR
0240
00
00
00
1245,0
4664
2206,8
496
00
01231,5
4725
02012,2
05685,7
97
12381
Net
R0300
020,3
6531
00
0147,9
5733
2725,3
0601
6244,7
636
-86,2
3885
035,7
4007
3156,0
3855
180,1
06
2515,6
7172,3
602
7195,6
86
22308
Cla
ims
incu
rred
Gro
ss -
Dir
ect
Busi
nes
sR
0310
Gro
ss -
Pro
port
ional
rei
nsu
rance
acc
epte
d
R0320
0-3
,9112954
-91,8
920362
9,2
E-0
5-0
,144381
34,6
3241783
841,1
76766
-7609,9
81
-1085,3
12
0-3
8,0
3072
-338,1
93909
-8292
Gro
ss -
Non-p
rop
ort
ional
rei
nsu
rance
acc
epte
d
R0330
60,5
84
8758,7
129,3
156
15745,9
824695
Rei
nsu
rers
' shar
eR
0340
0-0
,3654787
0273,6
0-0
,06844391
355,1
17883
-2225,1
19
-295,7
162
0-1
8,2
6637
-172,6
92412
-0,8
847
191,9
96
-4,1
30018
112,9
178
-1784
Net
R0400
0-3
,5458167
-91,8
920362
-273,6
-0,1
44381
34,7
0086174
486,0
58883
-5384,8
62
-789,5
961
0-1
9,7
6435
-165,5
01497
61,4
687
8566,7
1133,4
456
15633,0
618187
Ch
an
ges
in o
ther
tech
nic
al
pro
visi
on
s
Gro
ss -
Dir
ect
Busi
nes
sR
0410
Gro
ss -
Pro
port
ional
rei
nsu
rance
acc
epte
dR
0420
Gro
ss -
Non-
pro
port
ional
rei
nsu
rance
acc
epte
dR
0430
Rei
nsu
rers
'shar
eR
0440
Net
R0500
Expen
ses
incu
rred
R0550
02,9
896714
00
054,0
3562018
781,8
23434
842,8
0006
-219,8
212
02,0
511923
236,0
607537
-8,4
292
398,2
41
-7,4
27825
822,7
694
2905,1
Oth
er
expen
ses
R1200
Tota
l expen
ses
R1300
2905,1
Lin
e of
Busi
nes
s fo
r: n
on
-lif
e i
nsu
ran
ce a
nd r
ein
sura
nce
obli
gati
on
s (d
irect
bu
sin
ess
an
d a
ccepte
d p
roport
ion
al
rein
sura
nce
)L
ine
of
Busi
nes
s fo
r:
acc
epte
d n
on
-pro
port
ion
al
rein
sura
nce
Tota
l

SOLVENCY AND FINANCIAL CONDITION REPORT 2016 - 37 -
S.05.02.01 – Premiums, claims and expenses by country (non-life obligations) (x1.000 EUR)
Home
CountryTotal Top 5 and home country
C0010 C0070
R0010 BE BG CZ IE GB
C0080 C0140
Premiums written
Gross - Direct Business R0110
Gross - Proportional reinsurance accepted R0120 0 14467 35 594 824 799 16718
Gross - Non-proportional reinsurance accepted R0130 0 11620 1566 3171 0 0 16357
Reinsurers' share R0140 0 8592 884 1916 0 0 11392
Net R0200 0 17495 716 1849 824 799 21683
Premiums earned
Gross - Direct Business R0210
Gross - Proportional reinsurance accepted R0220 1 14467 35 594 737 799 16633
Gross - Non-proportional reinsurance accepted R0230 0 11620 1566 3171 0 0 16357
Reinsurers' share R0240 0 8592 884 1916 0 0 11392
Net R0300 1 17495 716 1849 737 799 21598
Claims incurred
Gross - Direct Business R0310
Gross - Proportional reinsurance accepted R0320 87 -8914 0 107 332 158 -8229
Gross - Non-proportional reinsurance accepted R0330 -28 21385 554 2888 -2 0 24796
Reinsurers' share R0340 582 -3865 -244 1710 18 21 -1778
Net R0400 -524 16336 798 1285 313 138 18345
Changes in other technical provisions
Gross - Direct Business R0410
Gross - Proportional reinsurance accepted R0420
Gross - Non- proportional reinsurance accepted R0430
Reinsurers' share R0440
Net R0500
Expenses incurred R0550 -56 1396 223 603 355 134 2655
Other expenses R1200
Total expenses R1300 2655
Top 5 countries (by amount of gross premiums written)
- non-life obligations

SOLVENCY AND FINANCIAL CONDITION REPORT 2016 - 38 -
S.17.01.02 Non-Life Technical Provisions (x1.000 EUR)
Medic
al
ex
pen
se
insu
ran
ce
Inco
me
pro
tect
ion
insu
ran
ce
Wo
rkers
'
com
pen
sati
on
insu
ran
ce
Mo
tor
veh
icle
lia
bil
ity
insu
ran
ce
Oth
er
moto
r
insu
ran
ce
Ma
rin
e,
avi
ati
on
an
d
tra
nsp
ort
insu
ran
ce
Fir
e a
nd o
ther
da
ma
ge t
o
pro
pert
y
insu
ran
ce
Gen
era
l
lia
bil
ity
insu
ran
ce
Cre
dit
an
d
sure
tysh
ip
insu
ran
ce
Leg
al
ex
pen
ses
insu
ran
ce
Ass
ista
nce
Mis
cell
an
e
ou
s
fin
an
cia
l
loss
No
n-
pro
po
rtio
n
al
hea
lth
rein
sura
nc
e
No
n-
pro
po
rtio
n
al
casu
alt
y
rein
sura
nc
e
No
n-
pro
po
rtio
n
al
mari
ne,
avi
ati
on
an
d
No
n-
pro
po
rtio
n
al
pro
pert
y
rein
sura
nc
e
C0
020
C0
030
C0
040
C0
050
C0
060
C0
070
C0
080
C0
090
C0
100
C0
110
C0
120
C0
130
C0
140
C0
150
C0
160
C0
170
C0
180
Tech
nic
al
pro
visi
on
s ca
lcu
late
d a
s a
wh
ole
R0
010
To
tal R
eco
ver
able
s fr
om
rei
nsu
ran
ce/S
PV
an
d F
init
e R
e af
ter
the
adju
stm
ent
for
exp
ecte
d lo
sses
due
to c
ou
nte
rpar
ty d
efau
lt a
sso
ciat
ed t
o T
P c
alcu
late
d a
s a
wh
ole
R0
050
Tech
nic
al
pro
visi
on
s ca
lcu
late
d a
s a
su
m o
f B
E a
nd R
M
Best
est
imate
Pre
miu
m p
rovis
ion
s
Gro
ssR
00
60
-4,0
32
00
-43,9
25
-839,6
02
-2558,0
36
0-6
,923
-1375,3
07
-57,6
79
-1408,2
8-6
7,5
93
-3824,9
15
-10186,2
92
To
tal re
cov
erab
le f
rom
rei
nsu
ran
ce/S
PV
an
d F
init
e R
e af
ter
the
adju
stm
ent
for
exp
ecte
d lo
sses
due
to c
ou
nte
rpar
ty d
efau
ltR
01
40
-297,9
72
-847,4
11
0-4
53,9
62
-1005,7
17
-2680,0
18
-5285,0
79
Net
Bes
t E
stim
ate
of
Pre
miu
m P
rovis
ion
sR
01
50
0-4
,032
00
0-4
3,9
25
-541,6
3-1
710,6
25
00
-6,9
23
-921,3
45
-57,6
79
-402,5
63
-67,5
93
-1144,8
97
-4901,2
12
Cla
ims
pro
visi
on
s
Gro
ssR
01
60
71,9
85
564,7
91,2
52
034,1
55
1090,5
89
16847,8
3-2
39,3
28
31,9
38
3033,6
74
979,6
18
16200,9
64
131,1
02
23703,3
58
62451,9
25
To
tal re
cov
erab
le f
rom
rei
nsu
ran
ce/S
PV
an
d F
init
e R
e af
ter
the
adju
stm
ent
for
exp
ecte
d lo
sses
due
to c
ou
nte
rpar
ty d
efau
ltR
02
40
25,7
02
4328,2
47
-206,3
93
361,6
442,9
78
5127,3
02
10079,4
35
Net
Bes
t E
stim
ate
of
Cla
ims
Pro
vis
ion
sR
02
50
071,9
85
564,7
91,2
52
034,1
55
1064,8
87
12519,5
83
-32,9
35
031,9
38
2672,0
74
979,6
18
15757,9
86
131,1
02
18576,0
56
52372,4
91
Tota
l B
est
est
imate
- g
ross
R0
260
067,9
53
564,7
91,2
52
0-9
,77
250,9
87
14289,7
94
-239,3
28
025,0
15
1658,3
67
921,9
39
14792,6
84
63,5
09
19878,4
43
52265,6
33
Tota
l B
est
est
imate
- n
et
R0
270
067,9
53
564,7
91,2
52
0-9
,77
523,2
57
10808,9
58
-32,9
35
025,0
15
1750,7
29
921,9
39
15355,4
23
63,5
09
17431,1
59
47471,2
79
Ris
k m
arg
inR
02
80
0624,1
02
27,2
92
0,0
49
0679,8
56
6005,5
37
1168,8
64
0,2
44
03,2
56
356,0
46
1192,6
11
1681,8
71
333,9
96
3286,8
315360,5
56
Am
ou
nt
of
the t
ran
siti
on
al
on
Tech
nic
al
Pro
visi
on
s
Tec
hn
ical
Pro
vis
ion
s ca
lcu
late
d a
s a
wh
ole
R0
290
Bes
t es
tim
ate
R0
300
Ris
k m
argi
nR
03
10
Tech
nic
al
pro
visi
on
s -
tota
l
Tec
hn
ical
pro
vis
ion
s -
tota
lR
03
20
0692,0
55
592,0
82
1,3
01
0670,0
86
6256,5
24
15458,6
58
-239,0
84
028,2
71
2014,4
13
2114,5
516474,5
55
397,5
05
23165,2
73
67626,1
89
Rec
ov
erab
le f
rom
rei
nsu
ran
ce c
on
trac
t/SP
V a
nd
Fin
ite
Re
afte
r th
e ad
just
men
t fo
r
exp
ecte
d lo
sses
due
to c
ou
nte
rpar
ty d
efau
lt -
to
tal
R0
330
00
00
00
-272,2
73480,8
36
-206,3
93
00
-92,3
62
0-5
62,7
39
02447,2
84
4794,3
56
Tec
hn
ical
pro
vis
ion
s m
inu
s re
cov
erab
les
from
rei
nsu
ran
ce/S
PV
an
d F
init
e R
e -
tota
lR
03
40
0692,0
55
592,0
82
1,3
01
0670,0
86
6528,7
94
11977,8
22
-32,6
91
028,2
71
2106,7
75
2114,5
517037,2
94
397,5
05
20717,9
89
62831,8
35
Dir
ect
bu
sin
ess
an
d a
ccepte
d p
ropo
rtio
na
l re
insu
ran
ceA
ccepte
d n
on
-pro
po
rtio
na
l re
insu
ran
ce
Tota
l N
on
-
Lif
e
obli
ga
tio
n

SOLVENCY AND FINANCIAL CONDITION REPORT 2016 - 39 -
S.22.01.22 – Impact of long term guarantees and transitional measures (X1.000 EUR)
Amount with
Long Term
Guarantee
measures and
transitionals
Impact of
transitional on
technical
provisions
Impact of
transitional on
interest rate
Impact of
volatility
adjustment set
to zero
Impact of
matching
adjustment set
to zero
C0010 C0030 C0050 C0070 C0090
Technical provisions R0010 62832 212
Basic own funds R0020 335616 -155
Eligible own funds to meet Solvency
Capital RequirementR0050 335616 -155
Solvency Capital Requirement R0090 54199 0
Eligible own funds to meet Minimum
Capital RequirementR0100 335616 -155
Minimum Capital Requirement R0110 13550 0

SOLVENCY AND FINANCIAL CONDITION REPORT 2016 - 40 -
S.23.01.22 – Own funds (X1.000 EUR)
TotalTier 1 -
unrestricted
Tier 1 -
restricted Tier 2 Tier 3
C0010 C0020 C0030 C0040 C0050
Basic own funds before deduction for participations in other financial sector as foreseen
in article 68 of Delegated Regulation 2015/35
Ordinary share capital (gross of own shares) R0010 41692,987 41692,987 0
Share premium account related to ordinary share capital R0030 0 0 0
Iinitial funds, members' contributions or the equivalent basic own - fund item for mutual and
mutual-type undertakings R0040 0 0 0
Subordinated mutual member accounts R0050 0 0 0 0
Surplus funds R0070 6989,548 6989,548
Preference shares R0090 0 0 0 0
Share premium account related to preference shares R0110 0 0 0 0
Reconciliation reserve R0130 286933,854 286933,854
Subordinated liabilities R0140 0 0 0 0
An amount equal to the value of net deferred tax assets R0160 0 0
Other own fund items approved by the supervisory authority as basic own funds not specified
above R0180 0 0 0 0 0
Own funds from the financial statements that should not be represented by the
reconciliation reserve and do not meet the criteria to be classified as Solvency II own
funds
Own funds from the financial statements that should not be represented by the reconciliation
reserve and do not meet the criteria to be classified as Solvency II own fundsR0220 0
Deductions
Deductions for participations in financial and credit institutions R0230 0 0 0 0
Total basic own funds after deductions R0290 335616,389 335616,389 0 0 0Ancillary own funds
Unpaid and uncalled ordinary share capital callable on demand R0300 0 0
Unpaid and uncalled initial funds, members' contributions or the equivalent basic own fund item
for mutual and mutual - type undertakings, callable on demandR0310 0 0
Unpaid and uncalled preference shares callable on demand R0320 0 0 0
A legally binding commitment to subscribe and pay for subordinated liabilities on demand R0330 0 0 0
Letters of credit and guarantees under Article 96(2) of the Directive 2009/138/EC R0340 0 0
Letters of credit and guarantees other than under Article 96(2) of the Directive 2009/138/EC R0350 0 0 0
Supplementary members calls under first subparagraph of Article 96(3) of the Directive
2009/138/ECR0360 0 0
Supplementary members calls - other than under first subparagraph of Article 96(3) of the
Directive 2009/138/ECR0370 0 0 0
Other ancillary own funds R0390 0 0 0
TotalTier 1 -
unrestricted
Tier 1 -
restricted Tier 2 Tier 3
C0010 C0020 C0030 C0040 C0050
Total ancillary own funds R0400 0 0 0
Available and eligible own funds
Total available own funds to meet the SCR R0500 335616,389 335616,389 0 0 0
Total available own funds to meet the MCR R0510 335616,389 335616,389 0 0
Total eligible own funds to meet the SCR R0540 335616,389 335616,389 0 0 0
Total eligible own funds to meet the MCR R0550 335616,389 335616,389 0 0
SCR R0580 54198,69914
MCR R0600 13549,675
Ratio of Eligible own funds to SCR R0620 619,2333%
Ratio of Eligible own funds to MCR R0640 2476,9331%
C0060
Reconciliation reserve
Excess of assets over liabilities R0700 416570,931
Own shares (held directly and indirectly) R0710 0
Foreseeable dividends, distributions and charges R0720 80954,542
Other basic own fund items R0730 48682,535
Adjustment for restricted own fund items in respect of matching adjustment portfolios and ring
fenced fundsR0740 0
Reconciliation reserve R0760 286933,854
Expected profits
Expected profits included in future premiums (EPIFP) - Life business R0770 0
Expected profits included in future premiums (EPIFP) - Non- life business R0780 4901,212
Total Expected profits included in future premiums (EPIFP) R0790 4901,212

SOLVENCY AND FINANCIAL CONDITION REPORT 2016 - 41 -
S.25.01.22 – Solvency capital requirement (for groups on Standard Formula) (X1.000 EUR)
Gross solvency
capital
requirement
USP Simplifications
C0110 C0090 C0100
Market risk R0010 24580,653
Counterparty default risk R0020 4654,793
Life underwriting risk R0030 0
Health underwriting risk R0040 12040,623
Non-life underwriting risk R0050 57568,97
Diversification R0060 -26086,761
Intangible asset risk R0070 0
Basic Solvency Capital Requirement R0100 72758,278
Calculation of Solvency Capital Requirement C0100
Operational risk R0130 1567,969
Loss-absorbing capacity of technical provisions R0140 0
Loss-absorbing capacity of deferred taxes R0150 -20127,548
Capital requirement for business operated in accordance with Art. 4
of Directive 2003/41/ECR0160 0
Solvency capital requirement excluding capital add-on R0200 54198,699
Capital add-on already set R0210 0
Solvency capital requirement R0220 54198,699
Other information on SCR
Capital requirement for duration-based equity risk sub-module R0400 0
Total amount of Notional Solvency Capital Requirement for
remaining partR0410 54198,699
Total amount of Notional Solvency Capital Requirements for ring
fenced fundsR0420 0
Total amount of Notional Solvency Capital Requirement for matching
adjustment portfoliosR0430 0
Diversification effects due to RFF nSCR aggregation for article 304 R0440 0

SOLVENCY AND FINANCIAL CONDITION REPORT 2016 - 42 -
S.28.01.01 Minimum Capital Requirement - Only life or only non-life insurance or reinsurance activity (X1.000 EUR)
Linear formula component for non-life insurance and reinsurance obligations
C0010
MCRNL Result R0010 10883,3
Net (of
reinsurance/SPV
) best estimate
and TP
calculated as a
whole
Net (of
reinsurance)
written
premiums in the
last 12 months
C0020 C0030
Medical expense insurance and proportional reinsurance R0020 0 0
Income protection insurance and proportional reinsurance R0030 67,953 20,365
Workers' compensation insurance and proportional reinsurance R0040 564,79 0
Motor vehicle liability insurance and proportional reinsurance R0050 1,252 0
Other motor insurance and proportional reinsurance R0060 0 0
Marine, aviation and transport insurance and proportional reinsurance R0070 0 147,957
Fire and other damage to property insurance and proportional reinsurance R0080 523,257 2811,763
General liability insurance and proportional reinsurance R0090 10808,958 6243,851
Credit and suretyship insurance and proportional reinsurance R0100 0 0
Legal expenses insurance and proportional reinsurance R0110 0 0
Assistance and proportional reinsurance R0120 25,015 35,74
Miscellaneous financial loss insurance and proportional reinsurance R0130 1750,729 3156,039
Non-proportional health reinsurance R0140 921,939 180,106
Non-proportional casualty reinsurance R0150 15355,422 2515,67
Non-proportional marine, aviation and transport reinsurance R0160 63,509 172,36
Non-proportional property reinsurance R0170 17431,158 7195,686
Linear formula component for life insurance and reinsurance obligations
C0040
MCRL Result R0200 0
Net (of
reinsurance/SPV
) best estimate
and TP
calculated as a
whole
Net (of
reinsurance/SPV
) total capital at
risk
C0050 C0060
Obligations with profit participation - guaranteed benefits R0210
Obligations with profit participation - future discretionary benefits R0220
Index-linked and unit-linked insurance obligations R0230
Other life (re)insurance and health (re)insurance obligations R0240
Total capital at risk for all life (re)insurance obligations R0250
Overall MCR calculation
C0070
Linear MCR R0300 10883,3
SCR R0310 54198,7
MCR cap R0320 24389,4
MCR floor R0330 13549,7
Combined MCR R0340 13549,7
Absolute floor of the MCR R0350 1200
C0070
Minimum Capital Requirement R0400 13549,7