solutions for global energy and water needs · solutions for global energy and water needs. 2011...
TRANSCRIPT

Annual Report 2011
Solutions for global energy and water needs

2011
2010
2009
2008
2007
3 577.9
3 183.7
3 350.4
3 713.5
3 537.0
2011
2010
2009
2008
2007
364.1
406.4
368.0
475.1
393.5
Financial highlights 2011
Key figures
Data per share
Salesin millions of CHF
Operating incomein millions of CHF
Substantial increases in order intake and sales and healthy profitability
Sulzer increased order intake and sales substantially in 2011. Acquisition-related costs and non-recurring items impacted the company’s return on sales. Return on capital employed remained at a clearly value-generating level.
millions of CHF 2011 2010Change in
+/– % +/– %1)
Order intake 3 566.1 3 288.7 8.4 13.7
Order backlog 1 864.0 1 799.8 3.6
Sales 3 577.9 3 183.7 12.4 17.2
Operating income before depreciation/amortization EBITDA 482.8 511.0 –5.5
Operating income EBIT 364.1 406.4 –10.4
Return on sales ROS 10.2% 12.8%
Return on capital employed ROCE 18.8% 28.1%
Net income attributable to shareholders of Sulzer Ltd 279.8 300.4 –6.9
Capital expenditure 113.2 118.1 –4.1
Equity attributable to shareholders of Sulzer Ltd 2 097.8 1 895.0 10.7
Free cash flow 82.3 149.5 –44.9
Net liquidity –336.9 552.8 –
Employees (number of full-time equivalents) as of December 31 17 002 13 740 23.7
CHF 2011 2010Change in
+/– %
Closing price of the registered share as of December 31 100.40 142.50 –29.5
Net income attributable to a shareholder of Sulzer Ltd EPS 8.25 8.92 –7.5
Equity attributable to a shareholder of Sulzer Ltd 62.06 56.20 10.4
Dividend 3.002) 3.00 –1) Adjusted for currency effects as well as acquisitions and divestitures.2) Proposal to the Annual General Meeting.

2011
Sulzer Pumps 49% Sulzer Metco 19% Sulzer Chemtech 19% Sulzer Turbo Services 13%
2011
Europe 36% North America 23% Central and South America 9% Asia, Middle East, Australia 28% Africa 4%
120
150
90
60
30
0
180
1/2009 1/20111/2010 1/2012
+67%(three-year performance 2009–2011)
By division
Sales by division Sales by region
Share price development
Order intake Sales
millions of CHF 2011 2010Change in
+/– % +/– %1) 2011 2010Change in
+/– % +/– %1)
Divisions 3 558.5 3 278.5 8.5 13.9 3 570.1 3 173.3 12.5 17.4
– Sulzer Pumps 1 705.6 1 613.7 5.7 10.4 1 747.8 1 576.1 10.9 14.7
– Sulzer Metco 673.6 643.1 4.7 15.3 667.3 623.5 7.0 17.8
– Sulzer Chemtech 701.7 621.3 12.9 21.2 667.0 574.6 16.1 23.7
– Sulzer Turbo Services 477.6 400.4 19.3 14.3 488.0 399.1 22.3 18.1
Others 7.6 10.2 – – 7.8 10.4 – –
Total 3 566.1 3 288.7 8.4 13.7 3 577.9 3 183.7 12.4 17.21) Adjusted for currency effects as well as acquisitions and divestitures.
Operating income Return on sales
millions of CHF 2011 2010Change in
+/– % 2011 2010
Divisions 353.2 346.5 1.9 9.9% 10.9%
– Sulzer Pumps 168.2 189.0 –11.0 9.6% 12.0%
– Sulzer Metco 68.7 57.1 20.3 10.3% 9.2%
– Sulzer Chemtech 63.1 58.5 7.9 9.5% 10.2%
– Sulzer Turbo Services 53.2 41.9 27.0 10.9% 10.5%
Others 10.9 59.9 – – –
Total 364.1 406.4 –10.4 10.2% 12.8%

Who we are and how we are doing
Sulzer is a global partner with reliable and sustainable solutions for performance-critical applications.
We specialize in industrial machinery and equipment, surface technology, and rotating equipment maintenance. Combining engineering and application expertise, our innovative solutions add value and strengthen the competitive position of our customers.
Sulzer is a leading provider in its key markets: oil and gas, hydrocarbon processing, power generation, water, automotive, and aviation. We serve clients worldwide through a network of over 170 locations.
Our key markets
Oil and gas
Water Automotive Aviation
Power generationHydrocarbon processing
See page 4 for more market information

1Sulzer | Annual Report 2011
Business review
Governance
Financial sectionIntroduction
Highlights in 2011
Sales
CHF 3 578m(2010: CHF 3 184m)
Net income 1)
CHF 280m(2010: CHF 300m)
Operating income
CHF 364m(2010: CHF 406m)
Dividend
CHF 3.00 (proposed)
(2010: CHF 3.00)
• Sulzer has become a leading player in the water industry due to the acquisition of Cardo Flow Solutions.
• Order intake and sales increased substantially, driven by growth in the oil and gas, the automotive, and other general industrial markets as well as acquisitions.
• Sulzer achieved healthy levels of profitability and return on capital employed.
• A bond of CHF 500 million was successfully issued.
• The balance sheet remained solid and will allow further external growth.
• Based on a solid financial performance, the Board of Directors is proposing an unchanged dividend of CHF 3.00 per share.
ContentsIntroduction
The company at a glance 02The markets we serve 04Letter to the shareholders 06Focus: solutions for global energy and water needs 10
Business review
Financial review 18Divisional reviews 22– Sulzer Pumps 22– Sulzer Metco 26– Sulzer Chemtech 30– Sulzer Turbo Services 34Sustainable development 38– Sustainability 40– Innovation and technology 42– Employees 44– Corporate culture and
the Sulzer brand 45
Corporate governance
Corporate structure and shareholders 47Capital structure 47Board of Directors 48Executive Committee 54Shareholder participation rights 54Takeover and defense measures 55Auditors 55Information policy 55Risk management 58
Compensation report 60
Financial statements
Consolidated financial statements 67Five-year summaries 118Financial statements of Sulzer Ltd 121Investor information 133
1) Attributable to shareholders of Sulzer Ltd.

Sulzer Pumps Sulzer Metco
2 Sulzer | Annual Report 2011
The company at a glance
Market leaders with innovative and sustainable solutions
The Sulzer divisions are leading players in selected industries. Combining engineering and application expertise, their solutions add value and strengthen the competitive position of Sulzer’s customers.
See page 22 See page 26
Surface technologyPump technology and solutions
Profile
Market leadership
We offer pumping solutions and related equipment and services.Customers benefit from intensive research and development in fluid dynamics, process-oriented products, and reliable services. Our global manufacturing and service network ensures high customer proximity.
We enhance surfaces with coating solutions and equipment.Customers benefit from a uniquely broad range of surface technologies, coating solutions, equipment, materials, and services, as well as specialized machining services and components. Our innovative solutions improve performance and increase efficiency and reliability.
Operating incomeReturn on sales CHF 168m 9.6%
(2010: CHF 189m) (2010: 12.0%)
CHF 69m 10.3%(2010: CHF 57m) (2010: 9.2%)
Order intakeCHF 1 706m(2010: CHF 1 614m)
CHF 674m(2010: CHF 643m)
SalesCHF 1 748m(2010: CHF 1 576m)
49% of total salesCHF 667m(2010: CHF 624m)
19%
• Oil and gas (upstream and downstream)• Water (production and transport, wastewater) • Power generation
• Coating materials (thermal spray) • Coating systems (thermal spray) • Coating services
of total sales

Sulzer Turbo ServicesSulzer Chemtech
3Sulzer | Annual Report 2011
Business review
Governance
Financial sectionIntroduction
See page 30 See page 34
Separation, mixing, and service solutions Service solutions for rotating equipment
We offer products and services for separation, reaction, and mixing technology.Customers benefit from advanced solutions in the fields of process technology, separation equipment, as well as two-component mixing and dispensing systems. Our global footprint ensures local knowledge and competence.
CHF 63m 9.5%(2010: CHF 59m) (2010: 10.2%)
CHF 53m 10.9%(2010: CHF 42m) (2010: 10.5%)
CHF 702m(2010: CHF 621m)
CHF 478m(2010: CHF 400m)
We offer repair and maintenance services for turbomachinery, generators, and motors.Customers benefit from reliable and efficient repair and maintenance services for gas and steam turbines, compressors, motors, and generators of any brand. Our global network ensures high-quality local service.
of total salesCHF 667m(2010: CHF 575m)
19%CHF 488m(2010: CHF 399m)
13%
• Separation solutions• Tower field services• Two-component mixing and dispensing systems
• Industrial gas and steam turbines • Turbo compressors • Generators and motors
of total sales

Oil and gas(upstream)
Hydrocarbonprocessing
Power generation
Water Automotive Aviation Other industrial markets
Share of sales 2011 14% 25% 18% 8% 6% 4% 25%
Sulzer Pumps
Sulzer Metco
Sulzer Chemtech
Sulzer Turbo Services
2011
Europe 36% North America 23% Central and
South America 9% Asia, Middle East,
Australia 28% Africa 4%
Major production and service locations
4 Sulzer | Annual Report 2011
The markets we serve
Greater than 10% of divisional sales.
Less than 10% of divisional sales.
Market segments
Sulzer’s production and service network
Sales by region
High customer proximity through a global network
Sulzer builds on the advantages of a truly global network with over 170 production and service locations. Local presence is crucial to understand the customers’ challenges and to serve them quickly and reliably.

5Sulzer | Annual Report 2011
Business review
Governance
Financial sectionIntroductionHow we serve our markets
Market segment
Oil and gas (upstream)
Hydrocarbon processing
Power generation
Water
Automotive
Aviation
Other industrial markets
Our scope
• Pumps for the production of oil, the transport of oil and liquefied natural gas, and subsea applications
• Components for the separation of well-head products into oil, water, and gas (offshore and onshore)
• Surface solutions to protect drill bits, valves, and pump components• Service of mechanical and electromechanical rotating equipment
• Pumps for further downstream processing of oil and gas in refineries and petrochemical plants
• Technologies to separate oil and gas into their individual components and aid their further processing
• Repair and maintenance services for gas and steam turbines, compressors, motors, and generators
• Pumps for fossil-fired and nuclear power plants as well as renewable power generation
• Advanced solutions for carbon capture and storage• Coating solutions for gas and steam turbines• Repair and maintenance services for turbines and generators
• Pumps and related equipment (such as lifters, mixers, aerators, compressors, control and monitoring equipment, as well as services) for water transport and usage as well as wastewater treatment and desalination
• Coating solutions for drive components and engine parts, such as synchronizer rings, brake disks, valve seats and springs, and cylinder bores
• Mixing and dispensing system for two-component adhesives in automobile manufacturing, repair, and maintenance
• Coating solutions for performance-critical airplane components, such as engine fans, compressors, combustion and turbine components, as well as landing gears
• Performance-critical solutions for a number of other industries, including pulp and paper, metal, tooling, electronics, mining, construction, marine, rail, health care, and food
Our customers
Oil and gas majors, national oil companies, and contractors. Also local customers
Oil and gas majors, national oil companies, and contractors as well as refineries. Also local customers
Utility providers, contractors, and local customers
Municipalities, contractors, and private water companies
Original equipment manufacturers (OEMs) and their direct suppliers. Also small and midsize repair and coating shops
Original equipment manufacturers (OEMs) of aero engines and their direct suppliers
Business-to-business clients in the relevant industry
www.sulzer.com/markets

6 Sulzer | Annual Report 2011
Letter to the shareholders
Dividend
CHF 3.00 (proposed)
(2010: CHF 3.00)
Net income 1)
CHF 280m(2010: CHF 300m)
Strategic step into the water market
Jürgen Dormann, Chairman of the Board
Sulzer is now a leading player in the water industry due to the acquisition of Cardo Flow Solutions. The company continued to focus on operational excellence, innovation, health and safety, emerging markets, and the service business.
Sulzer increased order intake and sales substantially in 2011. Our balance sheet remains solid and will allow further external growth.
1) Attributable to shareholders of Sulzer Ltd.

7Sulzer | Annual Report 2011
Business review
Governance
Financial sectionIntroductionDear ShareholderSulzer is now a leading player in the water industry due to its strategic acquisition of Cardo Flow Solutions. Cardo’s leading offering of pumps and related equipment for wastewater applications combined with our existing products for the water industry has expanded our portfolio, which covers the entire water cycle. With this strategic step, we are now in a strong position to provide solutions for the long-term challenge of increasing water scarcity. Our extensive portfolio of performance-critical and energy-efficient solutions for power generation enables us to respond to the long-term trend of growing energy demand.
In 2011, Sulzer increased order intake and sales substantially. Excluding the negative currency translation effects, both key figures exceeded CHF 4 billion. The higher non-recurring contribution from the sale of the real estate business in 2010 and acquisition-related expenses in 2011 are the main reasons for the decrease in profitability from the previous year. Return on capital employed remained at a clearly value-generating level. Based on a net income attributable to shareholders of CHF 280 million and earnings per share of CHF 8.25, the Board of Directors will propose an unchanged dividend of CHF 3.00 per share.
In order to continuously create sustainable shareholder value, we have kept our focus on operational excellence, innovation, and health and safety. We also further expanded our presence in emerging markets and added new locations to our service network.
For 2012, order intake and sales are expected to increase moderately, and profitability is forecast to remain healthy. By the year 2015, Sulzer aspires to achieve a divisional return on sales of 11–13% and a divisional return on capital employed of more than 20%. Sales of the divisions are expected to grow organically by 6–8% on an average yearly basis between 2012 and 2015.
Solutions for global energy and water needsSulzer is well positioned to provide performance-critical solutions for the long-term trends of growing energy demand and increasing water scarcity. Throughout this report, we present a number of examples of how our experts are developing solutions to meet the increasing power demand efficiently for everyone and to ensure the supply of clean water, which enables life and prosperity.
Economic growth fuels the demand for energy, particularly in the emerging markets. We offer performance-critical and energy-efficient solutions for our customers in the power generation industry, such as pumps and carbon capture
Our visionSulzer’s vision is to be a recognized leader in innovative, sustainable, engineered, and customer-focused solutions for performance-critical applications in the oil and gas, hydrocarbon processing, power generation, water, automotive, aviation, and other selected industries.
Our missionSulzer aims to be:• a multi-industry company with a strong brand.• a provider of solutions that combine products, services, engineering,
and customer-application expertise.• close to the customer by being primarily direct-sales driven.• an engineering, innovation, and technology driven firm.• an attractive employer where employees can excel.• a company that creates value for its shareholders.
Our values• Customer partnership
We exceed the expectations of our customers with innovative and competitive solutions.
• Operational excellenceWe perform on the basis of structured work processes and LEAN principles.
• Committed peopleWe are committed to high standards and show respect for people.
Sulzer has become a leading player in the water industry
technologies for power plants, coating solutions for gas and steam turbines, and maintenance and repair services for turbines and generators.
Sulzer is now a leading player in the water industry due to the acquisition of Cardo Flow Solutions. Our solutions cover the entire water cycle—from water production and transport to wastewater treatment. With the acquisition, water has become a key market for Sulzer, accounting for about 13% of sales (on a full-year basis).
Creating long-term value for shareholdersSulzer’s five key focus areas continued to guide our efforts to create long-term value for our shareholders.
Operational excellence: The number of LEAN workshops increased significantly from the prior year. The entire organization is focused on continuously improving processes and creating value for customers through reduced lead times and improved on-time delivery.
Health and safety: We continued to reduce the frequency and severity of accidents in 2011 compared with the prior year. In order to make Sulzer an even safer place to work, pilot events of the corporate-wide safe behavior program were launched. The program will be rolled out within the entire company during 2012, offering intensive safety trainings to thousands of employees.
We provide solutions for the long-term trends of growing energy demand and water scarcity

8 Sulzer | Annual Report 2011
Letter to the shareholders
Our core focus areas Key performance indicator
Future actions
Innovation: Faster and increased innovation remains a crucial driver for growth. In 2011, spending for research and development was increased, and new, innovative solutions were brought to market. Sulzer is now invested in a major clean-technology venture fund; participation in this fund has opened access to thousands of promising start-up companies with high innovation potential. We will also expand our global research and development footprint in China.
Emerging markets: The emerging and developing markets have remained crucial to Sulzer, generating 41% of sales. In Brazil, we strengthened our tower field service activities through the acquisition of a local
service provider. New locations were opened in China, Columbia, and Russia. In addition, a pump company that serves the water industry in the Middle East, Africa, and Europe was acquired.
Services: We added new service locations in Brazil, Canada, China, Columbia, and Russia to further expand our service network and to be closer to our customers. The service business contributed 41% to sales in 2011.
Higher order intake and salesIn 2011, Sulzer increased order intake and sales substantially by 14% and 17% respectively on an adjusted basis. Excluding the negative currency translation effects,
448Number of LEAN workshops(2010: 99)
3.7 (–16%)Accident frequency rate(2010: 4.4)
107 (+32%)Number of innovation projects in the market-launch phase(2010: 81)
41%Share of sales in emerging and developing markets (2010: 42%)
41%Share of sales in services(2010: 43%)
• Roll out LEAN training for line managers globally to further embed LEAN thinking in the corporate culture
• Introduce LEAN e-learning tool on a corporate-wide basis
• Roll out safe behavior program globally• Continuously implement corporate-wide
environmental, safety, and health standards worldwide
• Expand the global research and development footprint in China
• Leverage knowledge and start-up companies from clean-technology venture fund
• Strengthen the talent program for engineers
• Organically expand Sulzer’s presence and capacities in the emerging markets
• Continuously assess potential acquisitions in the emerging markets
• Increase and leverage staff diversity to better serve the diverse customer base
Operational excellenceSulzer strives for operational excellence and continually improves business processes based on LEAN principles.
Health and safety Health and safety of employees is a top priority for Sulzer.
InnovationDeveloping innovative solutions with high customer value is essential to Sulzer’s sustainable success and organic growth.
Emerging and developing markets Sulzer continually fosters its worldwide service and production network in the emerging markets to serve customers locally.
ServicesSulzer continually fosters its product-related and independent service offerings, which are more resistant to economic cycles.
1
2
3
4
5 • Leverage the acquired service businesses as platforms for further growth
• Continuously expand the service network and assess of potential acquisitions of service providers

9Sulzer | Annual Report 2011
Business review
Governance
Financial sectionIntroductionboth key figures exceeded CHF 4 billion. On a nominal basis, order intake and sales increased to over CHF 3.5 billion. Growth was driven by larger orders in the oil and gas upstream market, the automotive industry, and other general industrial markets. The aviation industry remained strong. The hydrocarbon processing industry showed some growth driven by the chemical processing industry—where some larger orders were booked—while the refining business remained at a low level. In the course of the second half of the year, the power generation market stabilized, although nuclear projects suffered delays due to the incident in Japan. Strong growth was recorded in Europe and North America, and the emerging markets also continued to grow. The customer ordering behavior, which was affected by high uncertainty in the financial markets, improved again toward year-end. The acquisition of Cardo Flow Solutions was closed at the end of July and added about CHF 180 million to sales.
Profitability impacted by non-recurring itemsThe higher non-recurring contribution from the sale of the real estate business in 2010 and acquisition-related expenses in 2011 are the main reasons for the decrease in profitability compared with the previous year. Overall, the company’s global presence is a natural hedge against material impacts of the strong Swiss franc on profitability. Return on capital employed remained at a clearly value-generating level. Net income attributable to shareholders amounted to CHF 280 million, resulting in basic earnings per share of CHF 8.25.
Considering this year’s net income and the solid financial situation of the company, the Board of Directors will propose an unchanged dividend of CHF 3.00 per share at the Annual General Meeting on April 5, 2012. The Sulzer share price has increased by 67% over the last three years. However, with the high level of uncertainty and volatility in the financial markets, the Sulzer share price in 2011 declined, following the overall market trend.
Ad interim CEO and new Board MembersJürgen Brandt was appointed ad interim CEO as of November 1, 2011. The former CEO Ton Büchner left the company on October 31, 2011.
Jill Lee and Marco Musetti were elected as new Members of the Board at the 2011 Annual General Meeting, replacing Hans Hubert Lienhard and Tim Summers. After ten years of service, Daniel Sauter has decided not to stand for reelection at the Annual General Meeting on April 5, 2012. The Sulzer Board of Directors would like to thank him for his important contributions and wishes him all the best for the future.
Outlook 2012 and midrange targetsThe impact of ongoing uncertainties in the financial markets cannot currently be fully assessed and bears a certain downside risk. Based on present knowledge, activities in the oil and gas industry are expected to remain stable at a high level based on the current favorable market conditions in this segment. Activities in the hydrocarbon processing industry are forecast to remain at the current levels. In the power generation market, Sulzer anticipates further stabilization with some growth potential. The activity levels in the water market are expected to grow, mainly driven by emerging markets. The automotive, the aviation, and other general industries are likely to remain stable at the current high levels. Sulzer’s balance sheet has remained solid after the acquisition of Cardo Flow Solutions and will allow further external growth.
Despite the ongoing uncertainties in the financial markets and their potential negative effect on the economy, Sulzer expects order intake and sales to increase moderately in 2012, and profitability is forecast to remain healthy. The newly acquired Cardo Flow Solutions business will contribute with a first full year to order intake, sales, and operating income, whereas only five months were consolidated in 2011.
By the year 2015, Sulzer aspires to achieve a divisional return on sales of 11–13% and a divisional return on capital employed of more than 20%. Sales of the divisions are expected to grow organically by 6–8% on an average yearly basis between 2012 and 2015.
I thank you, our shareholders, for your continued support. I would also like to thank our employees for their commitment and our customers for their trustful partnership.
Yours sincerely,
Jürgen Dormann,Chairman of the Board
Sulzer clearly created financial value for its shareholders
Sulzer’s balance sheet has remained solid after the acquisition and will allow further external growth

10 Sulzer | Annual Report 2011
Focus
The world depends on energy and water, as they enable life and prosperity. Sulzer provides innovative and sustainable solutions for the long-term trends of growing energy demand and increasing water scarcity. We help provide energy and water for everyone.
For more information visit
www.sulzer.com/focus
Solutions for global energy and water needs

Introduction
11Sulzer | Annual Report 2011
Clean waterInnovative solutions for wastewater treatment
See page 12
Invisible powerSustainable solutions to meet the increasing demand for power
See page 14
Forward momentumCoating solutions for energy-efficient transport
See page 16

12 Sulzer | Annual Report 2011
Solutions for global energy and water needs
For more information visit
www.sulzer.com/focus/wastewater
Clean waterWater is the basis for life on our planet. Sulzer solutions play a crucial role in the treatment of wastewater in order to return clean water into the natural cycle. We offer an extensive portfolio of wastewater pumps and related equipment, such as lifters and mixers, for the wastewater industry. Customers benefit from long-term reliability, minimal maintenance costs, and maximum equipment life cycles.

Introduction
13Sulzer | Annual Report 2011

14 Sulzer | Annual Report 2011
Solutions for global energy and water needs
For more information visit
www.sulzer.com/focus/power
Economic growth fuels the demand for energy, particularly in the emerging markets. Sulzer solutions help to efficiently meet the increasing need for power for everyone. We offer an extensive range of solutions for the power generation industry, such as pumps for power plants, coatings for gas and steam turbines, and repair and maintenance services for turbines and generators.
Invisible power

Introduction
15Sulzer | Annual Report 2011

16 Sulzer | Annual Report 2011
Solutions for global energy and water needs
For more information visit
www.sulzer.com/focus/transport
Today’s way of life requires fast and efficient transport. Sulzer solutions help make transport more energy efficient and sustainable. Our transport solutions include coatings for drive components and engine parts as well as mixing and dispensing systems for car manufacturing. They improve performance and safety, while reducing fuel consumption and emissions.
Forward momentum

Introduction
17Sulzer | Annual Report 2011

18 Sulzer | Annual Report 2011
Financial review
Order intake: strong adjusted growthIn 2011, Sulzer received orders of CHF 3.6 billion. This was a significant increase of nominal 8.4% and 13.7% adjusted for currency effects as well as for acquisitions. All four divisions showed double-digit adjusted growth compared with the prior year:• Sulzer Pumps: +10.4% (+5.7% nominal)• Sulzer Metco: +15.3% (+4.7% nominal)• Sulzer Chemtech: +21.2% (+12.9% nominal)• Sulzer Turbo Services: +14.3% (+19.3% nominal)
Orders
millions of CHF 2011 2010
Order intake 3 566.1 3 288.7
Order backlog as of December 31 1 864.0 1 799.8
Due to the strong Swiss franc, the currency translation had a significant negative impact of CHF 447 million, while acquisitions contributed CHF 273 million to the order intake.
The order backlog increased by 3.6% to CHF 1 864.0 million as of December 31, 2011. Cardo Flow Solutions’ (Cardo) order backlog amounted to CHF 79.9 million.
Sales: strong growth despite currency effectsSales increased by a nominal 12.4% (adjusted 17.2%). All divisions recorded significantly higher sales based on a strong order intake development, a higher order backlog at the beginning of the year, and acquisitions. All divisions showed double-digit adjusted growth:• Sulzer Pumps: +14.7% (+10.9% nominal)• Sulzer Metco: +17.8% (+7.0% nominal)• Sulzer Chemtech: +23.7% (+16.1% nominal)• Sulzer Turbo Services: +18.1% (+22.3% nominal)
Sales were negatively influenced by the significant strengthening of the Swiss franc against all major currencies. The negative currency translation effect amounted to CHF 445 million, while acquisitions, in particular Cardo and Sulzer Dowding & Mills, contributed CHF 291 million to sales. Strong growth was reported in Europe and North America. The emerging markets also continued to grow, but at a slower pace. The share of sales in emerging markets was at 41% (2010: 42%).
The gross margin decreased from 31.4% in 2010 to 30.6% in 2011. Negative impacts from a still challenging environment, some cost overruns
Consolidated income statement (condensed)
millions of CHF 2011 2010
Sales 3 577.9 3 183.7
Cost of goods sold –2 481.5 –2 183.7
Gross profit 1 096.4 1 000.0
Selling, administrative, and development expenses –732.3 –593.6
Operating income 364.1 406.4
Financial income, net 5.3 –4.4
Income tax expenses –89.4 –97.7
Net income 280.0 304.3
Strong organic growth and a major strategic acquisition
Sulzer achieved a solid financial performance with a net income attributable to shareholders of CHF 279.8 million. Return on sales was at a healthy 10.2%. With an equity ratio of 46.2%, the capital structure remains healthy despite a major acquisition.
Double-digit adjusted growth of orders
Double-digit adjusted growth of sales

19Sulzer | Annual Report 2011
Business review
Governance
Financial sectionIntroduction
for large projects, and minor effects from the strong Swiss franc were partially compensated by operational excellence initiatives and some operational leverage.
Operating income and profitability: healthy levels, impacted by acquisitionsOperating expenses increased by CHF 138.7 million (+23.4%) to CHF 732.3 million, mainly driven by the following factors:• Acquisition and integration cost and first-time
consolidation of the Cardo entities: CHF 68 million• First full-year consolidation of Dowding & Mills
entities: CHF 18 million • Lower income from the disposal of the real estate
activities: CHF 38 million • Higher restructuring expenses: CHF 5 million
(not including Cardo integration costs)
Research and development (R&D) activities were further expanded, and expenses in R&D increased from CHF 58.5 million in 2010 to CHF 71.7 million, which corresponds to approximately 2.0% of sales (2010: 1.8%).
Operating income (EBIT) decreased by 10% from CHF 406.4 million in 2010 to CHF 364.1 million in 2011 for the following main reasons:• The higher gross profit (plus CHF 96.4 million) only
partially compensated the increase in operating expenses (plus CHF 138.7 million).
• The acquisition of Cardo had a negative impact of CHF 17.8 million on EBIT, mainly due to acquisition and integration costs (CHF 30.0 million).
• In 2011, a gain of CHF 18.2 million was recorded from the pending sales from the divested real estate activities in Switzerland compared to CHF 56.6 million in the prior year.
Return on sales (ROS) was at 10.2% (2010: 12.8%). The strong Swiss franc had only a minor effect on the profitability. Adjusted for the acquisition-related effects from Cardo and for the impacts from the sale of real estate, the ROS would be at 10.7% for 2011 and 11.0% for 2010 respectively. The ROS of the divisions were as follows:• Sulzer Pumps: 9.6% (2010: 12.0%). Adjusted for
Cardo acquisition: 11.9%• Sulzer Metco: 10.3% (2010: 9.2%), driven by higher
volumes and operational excellence initiatives• Sulzer Chemtech: 9.5% (2010: 10.2%), mainly due
to the changed business mix and negative currency effects from the comparably high level of activity in Switzerland
• Sulzer Turbo Services: 10.9% (2010: 10.5%), driven by higher volumes and sales synergies from the successful integration of Dowding & Mills
Key performance ratios
2011 2010
Return on sales (EBIT/sales) ROS 10.2% 12.8%
Return on capital employed (EBIT/capital employed) ROCE 18.8% 28.1%
EBIT before depreciation and amortization (EBITDA) was CHF 482.8 million (13.5% of sales) compared with CHF 511.0 million in 2010 (16.1% of sales). Depreciation and amortization was CHF 118.7 million in 2011, which is an increase of CHF 14.1 million mainly due to effects from the Cardo acquisition. With a return on capital employed (ROCE) of 18.8% (down from 28.1% in 2010), Sulzer clearly exceeded its value-creating threshold (pretax weighted average cost of capital) of 12.0% despite the dilutive effect of the Cardo acquisition and created financial value.
Financial income: positive despite higher interest cost from acquisition financingNet financial income was positive at CHF 5.3 million. Interest income was CHF 8.7 million (CHF 0.8 million lower than in 2010), driven by lower average cash. Interest expenses were CHF 14.8 million (2010: CHF 9.1 million). The main reason for this increase was that Sulzer incurred interest expenses for the financing of the Cardo acquisition (plus CHF 6.5 million). The interest expenses for unfunded pension plans were CHF 2.9 million (CHF 0.4 million lower than in 2010). Fair-value changes (mainly derivatives) were negative at CHF 11.9 million. This was more than compensated by currency exchange gains of CHF 23.3 million mainly due to a gain of CHF 15.8 million as a result of the optimization of the Cardo shareholding scheme.
Equity ratio
46.2%Solid balance sheet
Return on capital employed
18.8%Clearly above value-creating threshold
R&D expenses increased to 2% of sales
Sulzer clearly created financial value

20 Sulzer | Annual Report 2011
Financial review
Income tax expenses: favorable level due to special effectsTax expenses decreased by 8.5% to CHF 89.4 million in 2011, and the effective income tax rate slightly decreased to 24.2% (24.3% in 2010). The tax rate was positively affected by the gains generated from the disposal of real estate in Switzerland, which are taxed at a favorable rate. In addition, currency gains from the restructuring of the Cardo entities are non-taxable and some tax provisions no longer required of CHF 11.3 million could be released in 2011.
Net income: solid level of CHF 280.0 millionDriven by a lower operating income, net income decreased from CHF 304.3 million in 2010 to CHF 280.0 million in 2011. Net income attributable to Sulzer shareholders amounted to CHF 279.8 million (7.8% of sales) compared with CHF 300.4 million (9.4% of sales) in 2010. Basic earnings per share (EPS) decreased by 7.5% to CHF 8.25 (2010: CHF 8.92).
Balance sheet: high impact of acquisition and successful issue of bondTotal assets as per December 31, 2011, amounted to CHF 4 540.4 million, which is an increase of CHF 1 048.7 million over 2010’s figure. Net effects from acquisitions at year-end added CHF 1 194.9 million of assets to the balance sheet. Currency fluctuations had only a minor impact. Non-current assets amounted to CHF 2 203.2 million (2010: CHF 1 295.6 million). The net effects from acquisitions are the main cause of those increases and added CHF 920.2 million. Major movements were recorded in:• Goodwill: plus CHF 578.4 million. Acquisitions
(mainly Cardo) added CHF 586.6 million to goodwill. • Other intangibles assets: plus CHF 227.8 million.
Acquisitions (mainly Cardo) added CHF 248.8 million,
while amortization and currency effects reduced the other intangibles assets by CHF 21.0 million.
• Property, plant and equipment: plus CHF 87.9 million. Acquisitions added CHF 70.7 million. The remaining difference of CHF 17.2 million was a result of capital expenditure, depreciation, and currency effects.
Current assets increased to CHF 2 337.2 (2010: CHF 2 196.1 million). The net effect from acquisitions added CHF 274.7 million. Cash and cash equivalents were reduced by CHF 245.5 million to CHF 422.6 million and were used to partially finance the acquisitions. Trade receivables increased by CHF 302.0 million due to acquisitions (CHF 97.6 million) and due to higher sales volume in all divisions. The ageing structure remained stable at an acceptable risk level. Inventory increased by CHF 141.6 million due to acquisitions (CHF 63.5 million) and higher business volumes in all divisions. Other accounts receivable and prepaid expenses decreased by CHF 52.4 million mainly due to a decrease of short-term derivates (CHF 31.4 million) and receivables resulting from the real estate transaction (CHF 31.9 million).
Total liabilities (current and non-current liabilities) increased by CHF 846.1 million to CHF 2 436.6 million. Non-current liabilities increased by CHF 554.0 million. The major change resulted from the increase of long-term borrowings (CHF 487.2 million). Sulzer successfully issued a CHF-denominated 2.25% domestic bond in the amount of CHF 500 million for a term of five years (due date July 11, 2016).
Consolidated cash flow statement (condensed)
millions of CHF 2011 2010
Cash flow from operating activities 188.6 254.2
Purchase of intangible assets and property, plant and equipment –113.2 –118.1
Sale of property, plant and equipment and intangible assets 6.9 13.4
Free cash flow 82.3 149.5
Acquisitions/divestitures –815.4 –113.5
Purchase/sale of financial assets and marketable securities 4.1 26.2
Cash flow from operating and investing activities –729.0 62.2
Cash flow from financing activities 499.2 –96.0
Exchange gains/losses on cash and cash equivalents –15.7 –28.7
Net change in cash and cash equivalents –245.5 –62.5
Cash and cash equivalents as of December 31 422.6 668.1
Bond of CHF 500 million successfully issued

2011
2010
2009
2008
2007
279.8
300.4
270.4
322.9
284.1
21Sulzer | Annual Report 2011
Business review
Governance
Financial sectionIntroductionNet income1)
in millions of CHF
Acquisitions added CHF 78.4 million to the non-current liabilities, mainly for deferred income tax liabilities and defined benefit obligations. Current liabilities increased by CHF 292.1 million. Acquisitions added CHF 110.4 million to current liabilities. Another main increase resulted from the short-term borrowings (CHF 152.3 million), which were used to partially finance the acquisitions.
Equity increased by CHF 202.6 million to CHF 2 103.8 million. Due to the increase of the balance sheet total because of acquisitions, the equity ratio (equity/total assets) decreased from 54.3% in 2010 to a still healthy 46.2% in 2011, and the gearing (borrowings/equity) increased to 37% (from 7%).
Cash flow: negative impact from acquisitions and higher net working capitalChange in net cash was negative at CHF 245.5 million in 2011. The main impacts on cash flow were as follows:• Cash flow from operating activities amounted to CHF
188.6 million in 2011, a decrease of CHF 65.6 million compared with 2010.
• The increase in net working capital led to a negative cash flow of CHF 231.7 million. Most significant increases came from trade receivables (CHF 229.4 million) and inventories (CHF 78.2 million), which reflect the higher business volume and some delayed or postponed deliveries. Higher trade accounts payables (CHF 84.5 million) partially compensated these increases.
• Taxes paid decreased to CHF 93.7 million in 2011 (2010: CHF 153.5 million) due to some advanced payments in 2010 and higher statutory results in the years before.
• A total cash outflow of CHF 917.6 million resulted from investing activities. For acquisitions, a total of CHF 864.5 million (net of acquired cash) was spent, of which CHF 852.2 million for the Cardo acquisition.
• Final cash proceeds for pending sales of CHF 49.1 million were recorded for the divested real estate activities in Switzerland (sold in 2010).
• Capital expenditures (CAPEX) of CHF 113.2 million were recorded in 2011, which break down into capacity and capability expansions of CHF 63.0 million (55.6%), replacements of CHF 31.7 million (28.0%), information technology of CHF 6.3 million (5.6%), and CHF 12.2 million (10.8%) for Others.
Cash flow from financing activities was positive at CHF 499.2 million. Short- and long-term borrowings increased by CHF 619.7 million, of which CHF 500 million came from the bond issued in July to partially finance the Cardo acquisition. The dividend payment to Sulzer’s shareholders totaled CHF 102 million.
The exchange losses on cash and cash equivalents amounted to CHF 15.7 million in 2011, (2010: loss of CHF 28.7 million). The introduction of a minimum exchange rate for the Swiss franc to the Euro by the Swiss National Bank had a positive impact and reduced the company’s exposure to currency exchange fluctuations in the second half of 2011.
1) Attributable to shareholders of Sulzer Ltd.
Solid balance sheet with an equity ratio of 46.2% Outlook 2012 and midrange targets
Despite the ongoing uncertainties in the financial markets and their potential negative effect on the economy, Sulzer expects order intake and sales to increase moderately in 2012, and profitability is forecast to remain healthy. The newly acquired Cardo Flow Solutions business will contribute with a first full year to order intake, sales, and operating income, whereas only five months were consolidated in 2011.
By the year 2015, Sulzer aspires to achieve a divisional return on sales of 11–13% and a divisional return on capital employed of more than 20%. Sales of the divisions are expected to grow organically by 6–8% on an average yearly basis between 2012 and 2015.

22 Sulzer | Annual Report 2011
Sulzer Pumps
Major strategic acquisition and further expansion of global network

2011
2010
2009
2008
2007
1 747.8
1 576.1
1 856.7
1 817.0
1 733.8
2011
2010
2009
2008
2007
168.2
189.0
204.7
231.9
199.2
23Sulzer | Annual Report 2011
Business review
Governance
Financial sectionIntroduction
Salesin millions of CHF
Operating incomein millions of CHF
• Order intake and sales were increased strongly, while profitability was affected by the acquisition. Before acquisition, profitability remained stable.
• The division became a leading player in the water market through the acquisition of Cardo Flow Solutions.
• For 2012, the division expects increases in order intake, sales, and operating income. Profitability is forecast to remain at a healthy level.
1) Including the effects of the Cardo Flow Solutions acquisition.
Return on sales1)
9.6%(2010: 12.0%)
Return on capital employed1)
20.5%(2010: 55.5%)
Sulzer Pumps increased order intake and sales strongly. The division became a leading player in the water market with the acquisition of Cardo Flow Solutions.
Highlights

24 Sulzer | Annual Report 2011
Sulzer Pumps
Kim Jackson,Division President
Major strategic acquisition and further expansion of global network
Key figures
millions of CHF 2011 2010 Change in
+/–% +/–%1)
Order intake 1 705.6 1 613.7 5.7 10.4
Order backlog 1 343.5 1 336.6 0.5
Sales 1 747.8 1 576.1 10.9 14.7
Operating income before depreciation/amortization 210.2 215.2 –2.3
Operating income 168.2 189.0 –11.0
Return on sales2) 9.6% 12.0%
Return on sales before acquisition 11.9% –
Return on capital employed2) 20.5% 55.5%
Employees 8 211 5 904 39.11) Adjusted for currency effects as well as acquisitions and divestitures.2) Including the effects of the Cardo Flow Solutions acquisition.
With the acquisition of Cardo Flow Solutions, Sulzer Pumps became a leading player in the water market. In addition, we continued to expand our global production and service network with facilities in China, Columbia, Russia, and Spain.
Leading position in the water market With the major strategic acquisition of Cardo Flow Solutions, Sulzer Pumps became a leading provider of pumps and related equipment in the water market. Additionally, a pump company was acquired in Spain to reinforce the division’s presence in the attractive water markets in Europe, the Middle East, and Africa. The portfolio for water transport and desalination pumps was further expanded, and the global service network was strengthened with additional service centers in China, Columbia, and Russia.
Higher order intakeThe division strongly increased its order intake. Activities in the oil and gas industry were at a high level in the first half of the year. In the hydrocarbon processing industry, project activity remained generally at a low level. The power generation industry weakened in the course of the year. Geographically, North America, the CIS countries, and some Middle Eastern countries helped drive the order intake for the division. The acquisition of Cardo Flow Solutions contributed with orders for five months to the order intake.
Significantly increased salesThe division increased sales significantly, driven by organic growth and supported by the acquisition. The strong Swiss franc continued to have a negative translation effect on absolute figures. Acquisition-related expenses are the main reason for the decrease in profitability. Adjusted for the acquisition effect, profitability remained stable. The division continued to implement a number of LEAN initiatives and significantly decreased the frequency of accidents.
Outlook 2012In the oil and gas industry, activities are expected to remain stable at a high level. Activities in the hydrocarbon processing industry are forecast to remain at the current levels, supported by non-OECD countries. In the power generation market, further stabilization is anticipated with some growth potential. The activity levels in the water market are expected to grow, mainly driven by emerging markets. The division expects increases in order intake, sales, and operating income. Profitability is forecast to remain at a healthy level.

25Sulzer | Annual Report 2011
Business review
Governance
Financial sectionIntroduction
For more information visit
www.sulzer.com/focus/watertransport
An effective water supply network is essential to the infrastructure of every country. Customers in the water industry require reliable and efficient pumping systems for water networks in order to ensure the seamless storage and distribution of drinking water.
Sulzer Pumps offers engineering expertise and reliable solutions such as booster pumps for water transport. Those state-of-the-art products enable the delivery of vast quantities of fresh water over long distances and remarkable heights to the areas of greatest need. Sulzer Pumps delivered and installed the pump systems and electromechanical packages that reliably and efficiently run two pumping stations and a 12km-long pipeline system in South Africa. Moving up to 4 000 liters per second, these pump stations fill the dam in the rainy winter and alleviate the shortage of water supply during the dry summer for a population of several million.
Ensuring access to water

26 Sulzer | Annual Report 2011
Sulzer Metco
Higher sales and double-digit profitability

2011
2010
2009
2008
2007
667.3
623.5
556.0
743.5
753.1
2011
2010
2009
2008
2007
68.7
57.1
20.5
69.6
75.8
27Sulzer | Annual Report 2011
Business review
Governance
Financial sectionIntroduction
Salesin millions of CHF
Operating incomein millions of CHF
Highlights
• Order intake and sales were increased, and profitability improved to a double-digit level.
• Innovation remained a key focus in order to drive organic growth and strengthen the division’s leading market positions.
• For 2012, the division expects similar levels for order intake and sales, while profitability is forecast to increase slightly.
Return on capital employed
18.2%(2010: 14.6%)
Return on sales
10.3%(2010: 9.2%)
Sulzer Metco posted higher order intake and sales and strongly increased its profitability to a double-digit level. To strengthen its leading market positions, the division remained focused on operational excellence and innovation.

28 Sulzer | Annual Report 2011
Sulzer Metco
César Montenegro,Division President
Higher sales and double-digit profitability
Key figures
millions of CHF 2011 2010 Change in
+/–% +/–%1)
Order intake 673.6 643.1 4.7 15.3
Order backlog 77.4 71.3 8.6
Sales 667.3 623.5 7.0 17.8
Operating income before depreciation/amortization 91.9 81.5 12.8
Operating income 68.7 57.1 20.3
Return on sales 10.3% 9.2%
Return on capital employed 18.2% 14.6%
Employees 2 259 2 045 10.51) Adjusted for currency effects as well as acquisitions and divestitures.
We put our customers first and continuously strive for innovative solutions. With a new generation of coating equipment and a new coatings materials line, we further strengthened our leading market positions.
Market leadership through innovationIn order to strengthen its market leadership in plasma equipment and thermal-spray materials, Sulzer Metco launched a new generation of its Triplex plasma coating equipment and introduced a new line of materials dedicated to laser cladding. For further sustained organic growth, the division also added laboratory and manufacturing capabilities for the development and supply of innovative coating powders and significantly improved the functionality of high-temperature abradables-sealing systems for the aviation industry.
Main markets continued to growOrder intake was increased, driven by most of the division’s markets. Demand for the division’s innovative coating solutions was particularly strong in the automotive industry. Based on a continued upward trend in air travel, the aviation segment developed positively, although the air freight declined in the second half of 2011. Strong growth was recorded in the general industry segment, while the power generation segment grew at a slower pace. Geographically, demand was particularly high in North America and in Europe.
Double-digit profitabilityThe division increased sales and operating income clearly. The strong Swiss franc continued to have a negative translation effect on absolute figures. Profitability was strongly increased by more than one percentage point and rose to a double-digit level despite some restructuring charges. A new online sales platform was launched in the Americas and will be rolled out globally. It allows customers to place orders for coating materials and spare parts on a 24/7 basis.
Outlook 2012The positive environment in the division’s main markets is expected to continue. The automotive, the aviation, and other general industries are likely to remain stable at the current high levels. The division expects similar levels for order intake and sales, while profitability is forecast to increase slightly.
29Sulzer | Annual Report 2011
Business review
Governance
Financial sectionIntroduction
For more information visit
www.sulzer.com/focus/gasturbines
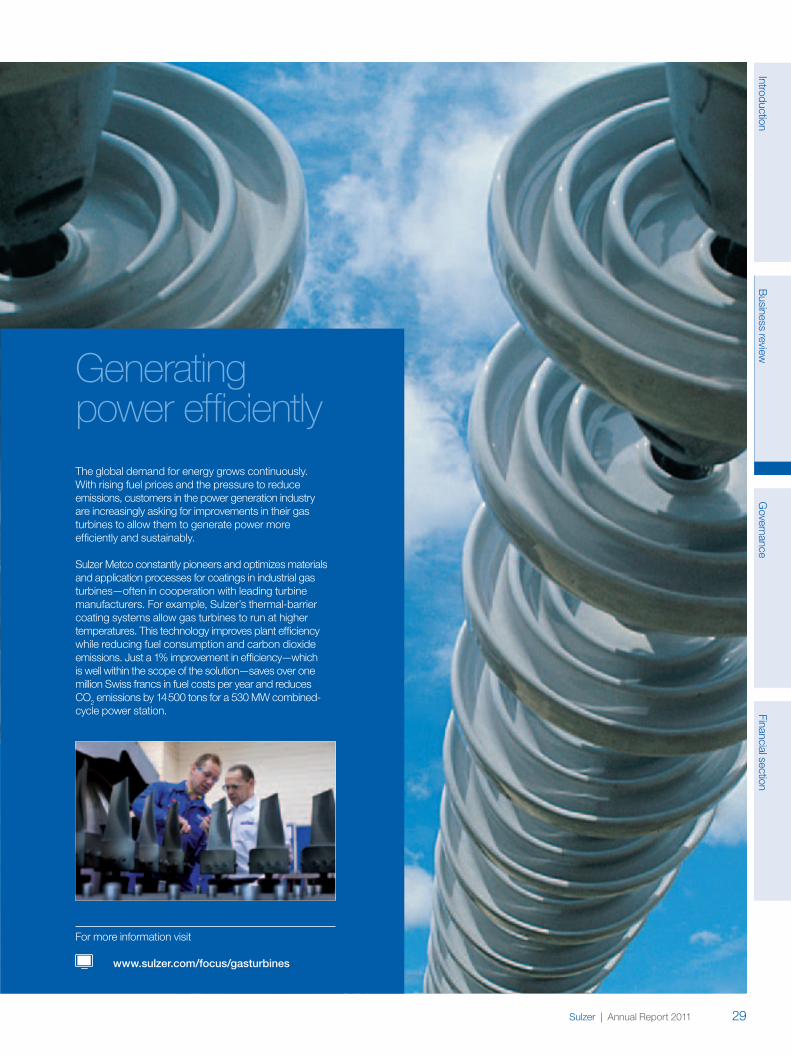
The global demand for energy grows continuously. With rising fuel prices and the pressure to reduce emissions, customers in the power generation industry are increasingly asking for improvements in their gas turbines to allow them to generate power more efficiently and sustainably.
Sulzer Metco constantly pioneers and optimizes materials and application processes for coatings in industrial gas turbines—often in cooperation with leading turbine manufacturers. For example, Sulzer’s thermal-barrier coating systems allow gas turbines to run at higher temperatures. This technology improves plant efficiency while reducing fuel consumption and carbon dioxide emissions. Just a 1% improvement in efficiency—which is well within the scope of the solution—saves over one million Swiss francs in fuel costs per year and reduces CO2 emissions by 14 500 tons for a 530 MW combined-cycle power station.
Generating power efficiently

30 Sulzer | Annual Report 2011
Sulzer Chemtech
Substantially higher orders and sales

2011
2010
2009
2008
2007
667.0
574.6
632.3
823.3
761.3
2011
2010
2009
2008
2007
63.1
58.5
54.5
140.1
116.3
31Sulzer | Annual Report 2011
Business review
Governance
Financial sectionIntroduction
Salesin millions of CHF
Operating incomein millions of CHF
Highlights
• Order intake and sales were increased substantially. Profitability was affected by the strong Swiss franc and some capacity adaptations in Europe.
• The worldwide service network was further strengthened with two acquisitions in Brazil and Canada.
• For 2012, the division expects an order intake at a similar level and higher sales. Profitability is forecast to increase to a double-digit level.
Return on capital employed
15.3%(2010: 14.4%)
Return on sales
9.5%(2010: 10.2%)
Sulzer Chemtech increased order intake and sales substantially. The global tower field service network was further strengthened with two acquisitions. Innovation remained crucial to drive organic growth.

32 Sulzer | Annual Report 2011
Sulzer Chemtech
Urs Fankhauser,Division President
Substantially higher orders and sales
Key figures
millions of CHF 2011 2010 Change in
+/–% +/–%1)
Order intake 701.7 621.3 12.9 21.2
Order backlog 310.7 274.3 13.3
Sales 667.0 574.6 16.1 23.7
Operating income before depreciation/amortization 97.8 93.2 4.9
Operating income 63.1 58.5 7.9
Return on sales 9.5% 10.2%
Return on capital employed 15.3% 14.4%
Employees 3 634 2 973 22.21) Adjusted for currency effects as well as acquisitions and divestitures.
With two acquisitions in Brazil and Canada, we continued to strengthen our global service network. The new locations ensure we are close to our customers, which is crucial in developing solutions that meet their specific needs.
Service network expanded and continued focus on innovationBy acquiring two specialized maintenance companies in Brazil and Canada, the division enhanced the competitiveness of the tower field service activities and expanded its worldwide service network. The location in Brazil will serve as a platform for further growth in this important market. Sulzer Chemtech continued to invest substantially in innovation. The division built an industrial-scale bioplastics pilot plant. It will allow customer trials, samples production, and further research and development in that promising area. The division also expanded its test center for process technology. The facility verifies that process designs offered to clients run optimally and that they can be scaled up to industry standards.
Order intake increased substantiallyThe order intake was increased significantly. The division’s largest market—the hydrocarbon processing industry—stabilized, with some larger projects for mass transfer technology applications contributing positively to the order intake. The Process Technology unit recorded a substantial increase in orders, and activity levels for Tower Field Service and Sulzer Mixpac Systems remained strong. Geographically, demand was particularly high in the Middle East and in Asia.
Strong sales growthThe division increased sales and operating income substantially. The strong Swiss franc continued to have a negative translation effect on absolute figures; it also impacted the return on sales due to the comparably high level of activity in Switzerland, particularly at Sulzer Mixpac Systems. The division continued to adapt its capacity in Europe, while further expanding its presence in Asia. The frequency and severity of accidents were further reduced.
Outlook 2012Activities in the hydrocarbon processing industry are expected to remain at the current levels. The activity levels for polymer applications and the markets of Sulzer Mixpac Systems are forecast to grow further. The division expects an order intake at a similar level and higher sales. Profitability is forecast to increase to a double-digit level.

33Sulzer | Annual Report 2011
Business review
Governance
Financial sectionIntroduction
For more information visit
www.sulzer.com/focus/hydrocarbon
Customers in the hydrocarbon processing industry separate oil into various hydrocarbon compounds, which can be used, for instance, to produce plastics. They are under considerable pressure to handle large volumes in a cost-efficient manner in order to remain competitive.
Sulzer Chemtech offers tailored solutions to increase the capacity and operational flexibility of petrochemical plants while at the same time reducing energy and water consumption. For example, Sulzer Chemtech used its cutting-edge Mellapak technology to assist a client in debottlenecking its separation towers. The column internals excel at separating liquid petrochemical feedstock. As a result of the improvements, throughput capacity increased by 70%. In addition, cooling water, steam, and energy for compressors were saved, which made the facility more profitable and sustainable.
Saving energy and water

34 Sulzer | Annual Report 2011
Sulzer Turbo Services
Strong growth, driven by acquisition and large orders

2011
2010
2009
2008
2007
488.0
399.1
291.3
313.6
279.0
2011
2010
2009
2008
2007
53.2
41.9
33.0
30.5
25.1
Highlights
35Sulzer | Annual Report 2011
Business review
Governance
Financial sectionIntroduction
Salesin millions of CHF
Operating incomein millions of CHF
• Order intake and sales grew strongly and profitability improved.
• The successful integration of the acquired electromechanical business allowed the division to benefit from a diversified portfolio and sales synergies.
• For 2012, the division expects moderate increases in order intake, sales, and profitability.
Return on capital employed
14.9%(2010: 13.6%)
Return on sales
10.9%(2010: 10.5%)
Sulzer Turbo Services strongly increased order intake and sales, and improved profitability. The division benefited from a diversified portfolio and sales synergies following the successful integration of the acquired electromechanical business.

36 Sulzer | Annual Report 2011
Sulzer Turbo Services
Peter Alexander,Division President
Strong growth, driven by acquisition and large orders
Key figures
millions of CHF 2011 2010 Change in
+/–% +/–%1)
Order intake 477.6 400.4 19.3 14.3
Order backlog 130.1 115.1 13.0
Sales 488.0 399.1 22.3 18.1
Operating income before depreciation/amortization 69.2 55.9 23.8
Operating income 53.2 41.9 27.0
Return on sales 10.9% 10.5%
Return on capital employed 14.9% 13.6%
Employees 2 654 2 587 2.61) Adjusted for currency effects as well as acquisitions and divestitures.
The integration of the acquired electromechanical business was highly successful. We are excited about the synergies and business opportunities that this acquisition brings.
Portfolio diversified and sales synergies Following the successful integration of Dowding & Mills, acquired in June 2010, Sulzer Turbo Services has diversified the product and service portfolio into new markets and has achieved significant sales synergies. The global presence was further expanded with a sales and project office in Russia. The division continued its successful strategy of further developing the business with more long-term service agreements. This approach ensures a more stable income stream over time.
Strong increase in ordersThe division strongly increased its order intake, driven by both significant organic growth and strong contributions from Sulzer Dowding & Mills. In addition, larger orders from the power generation market were recorded in the first half of the year. The demand for the division’s services in the oil and gas and the power generation industries was healthy. The hydrocarbon processing industry showed signs of improvement and other industrial markets continued to grow. Geographically, growth was particularly strong in Latin America.
High sales growth and increased profitabilitySales and operating income were increased significantly. The strong Swiss franc continued to have a negative translation effect on absolute figures. Profitability was also higher than last year. Capacity and capability were substantially increased at several locations around the world in order to meet higher market demand and achieve efficiency improvements.
Outlook 2012Demand for the division’s services in the oil and gas, power generation, and other industrial markets is expected to remain at the current high levels. The hydrocarbon processing industry is forecast to continue on a stable level. The sales synergies from the acquisition and long-term service agreements are predicted to support the positive development. The division expects moderate increases in order intake, sales, and profitability.

37Sulzer | Annual Report 2011
Business review
Governance
Financial sectionIntroduction
For more information visit
www.sulzer.com/focus/hydro
Strong growth, driven by acquisition and large orders
Hydropower plants are designed to operate with minimal maintenance. As any unscheduled outage has severe consequences, customers in the hydropower generation industry depend on reliable and tailored service solutions.
Sulzer Turbo Services offers innovative high-quality service solutions, including emergency assistance on a 24/7 basis. When an operator of a hydropower station experienced an outage of a performance-critical hydrogenerator, a service team from Sulzer Turbo Services quickly bypassed coils that had compromised insulation so the generator could run again in the peak season. During low season, the generator was rewound with technically advanced insulation systems and design modifications. Around 85% of the laminations were refurbished and only 15% had to be replaced, which resulted in substantial cost savings.
Powered by hydro

38 Sulzer | Annual Report 2011
Sustainable development
Global initiatives, implemented locally for sustained success

39Sulzer | Annual Report 2011
Business review
Governance
Financial sectionIntroduction
In brief
Sulzer continuously fosters and develops the essential drivers for its long-term success: sustainability, innovation, people, and the company’s strong corporate culture and brand.
SustainabilityEnsuring long-term success in a sustainable waySulzer is committed to sustainable economic success, sound social responsibility, and environmentally friendly solutions. In 2011, the frequency of accidents decreased by 16%. The company aspires for leadership in energy efficiency.
See page 40
Innovation and technologyTurning knowledge into a competitive advantageInnovation and continuous research and development play essential roles in Sulzer’s sustained success. The company fosters a culture of innovation, and it has established systematic processes to manage innovations and to turn them into business opportunities.
See page 42
EmployeesEngaged employees and a diverse workforce make the differenceSulzer strives to enhance employee engagement and to leverage the diversity of its global workforce. Engaged and diverse employees enable the company to outpace the competition through better solutions and superior performance.
See page 44
Corporate culture and the Sulzer brandCommitted to core valuesSulzer employees are highly committed to customer partnership. The strong Sulzer brand has been continuously fostered with the aim of enhancing the company’s positioning.
See page 45

40 Sulzer | Annual Report 2011
Sustainability
Stakeholder matrix
Sulzer assumes its corporate responsibility toward economic, social, and ecological stakeholders. The company’s sustainability strategy is based on the stakeholder matrix (see graph below) with three main pillars: sustainable economic success, sound corporate social responsibility, and energy-efficient solutions. Sulzer is a signatory member of the United Nations Global Compact and endorses its ten universal principles covering human rights, labor, the environment, and anticorruption.
The Corporate Sustainability Council is in charge of monitoring the overall sustainability performance at Sulzer, and it coordinates the company’s efforts in that matter globally. On the local level, a network of around 300 local sustainability experts spans the entire company. They implement and monitor corporate-wide sustainability initiatives and initiate numerous local sustainability activities. Regular training sessions ensure their competence and commitment.
Ensuring long-term success in a sustainable way
Sulzer is committed to sustainable economic success, sound social responsibility, and environmentally friendly solutions. In 2011, the frequency of accidents decreased by 16%. The company aspires for leadership in energy efficiency.

2011
2010
2009
2008
2007
56.1
60.2
87.3
119.4
140.4
41Sulzer | Annual Report 2011
Business review
Governance
Financial sectionIntroductionAccident severity rate, ASR
lost days per million working hoursHigh reporting standards achievedSulzer uses a dedicated database as a basis for sustainability controlling and reporting. In 2011, 88 production and service sites, which cover approximately 87% of the entire Sulzer employee base, were assessed in the database. The companies acquired in 2011 are on track for inclusion. Sulzer publishes a biennial sustainability report and annual online updates that are both externally verified. The Sulzer Sustainability Update 2010 fully complied with the GRI (Global Reporting Initiatives) application level A+. The sustainability reports, regular updates with recent figures, and additional data, such as the GRI-G3 Index, can be viewed online at www.sulzer.com/sustainability.
As a result of its long-standing sustainability efforts, the company is listed on corresponding indices, such as the DJSI (Dow Jones Sustainability Index) World and Europe and the Kempen/SNS European SRI Universe.
Sulzer continued to certify production sites according to ISO standards. By the end of 2011, 79% of all employees worked at sites that have received the ISO 9001 standard for quality management systems. Another 50 certifications were maintained on an ongoing basis to certify compliance with, e.g., automotive, aviation, and medical quality standards. For health and safety compliance, 70% of employees worked at sites that have either received the OHSAS 18001 (Occupational Health and Safety Assessment Series) or the SCC (Safety Checklist Contractors) standard. For environmental management systems, 68% of employees work at sites that have received the ISO 14001 standard.
Health and safety further improvedHealth and safety plays a pivotal role for Sulzer, and the company continued to put considerable effort into improving workplace safety for employees and contractors. In 2011, Sulzer decreased the accident frequency rate by 16% to 3.7 cases per million working hours (from 4.4 in 2010). In the same period, the accident severity rate was reduced to 56.5 lost days per million working hours (from 60.4 in 2010). The total lost day rate due to occupational and non-occupational absences was lowered to 1.7% of working hours (from 1.8% in 2010).
Sulzer puts great effort into ensuring that employees are well trained in health and safety practices. In 2011, about 5 000 employees completed health and safety e-learning programs. In addition, 40 health and safety audits were conducted throughout the year. To follow up on the significant improvement of health and safety conditions during the past years, Sulzer initiated pilot events of the corporate-wide safe behavior program.
The program will be fully rolled out in 2012, involving thousands of employees in interactive workshops. Sulzer also continued its program to minimize hazardous materials emissions and exposure. By the end of 2011, about 400 participants from more than 80 sites were trained in order to ensure compliance with Sulzer standards.
Aspiration for leadership in energy efficiencySulzer strives to operate without eroding the livelihood base of future generations, and it aims to continuously improve its ecological footprint, both with regard to the efficiency of its products and with regard to its internal operations. The company aspires to be a leader in energy efficiency within its industries. As the largest portion of energy and carbon dioxide consumption of Sulzer solutions occurs during use, Sulzer engineers continuously strive to achieve the highest levels of energy efficiency with both economic and ecological advantages.
In order to highlight the superior environmental standards of its products, Sulzer will issue additional environmental product declarations with the target of covering all relevant major product categories in 2012. These declarations provide information about the environmental and economic performance of specific products over the entire life cycle—starting at raw material extraction through manufacturing and use to end-of-life recycling or disposal. They are available under www.sulzer.com/epd.
As part of its commitment to communicating openly and transparently about its environmental performance, Sulzer has been reporting according to the Carbon Disclosure Project (CDP) guidelines since 2007. The customer Abengoa, a provider of energy from renewable resources, awarded Sulzer the Sustainable Business Award (runners-up prize in the large-business category) in 2011, recognizing Sulzer’s outstanding commitment to sustainability.
www.sulzer.com/sustainability
Sulzer fully complied with the GRI application level A+
Accidents were less frequent and less severe in 2011

42 Sulzer | Annual Report 2011
Innovation and technology
Turning knowledge into a competitive advantage
More and faster high-quality innovation is a strategic priority for Sulzer. In 2011, Sulzer invested CHF 72 million in research and development (R&D), which is a substantial increase of 22% from the previous year. The figure does not include many of the innovative solutions that have been developed in cooperation with clients. In 2011, R&D investments amounted to 2% of sales.
Nurturing a culture of innovationAs part of its commitment to the concept of open innovation, Sulzer is invested in a major clean-technology venture fund starting this year. The cooperation has opened access to thousands of promising start-up companies with high innovation potential. Sulzer has also continued its activities as part of Venture Incubator, a venture company that supports selected start-ups. Relationships with universities and institutes were also strengthened in 2011, for instance, with: ETH Zurich, Forschungszentrum Jülich, TU Berlin, Texas A&M, and SUNY Stony Brook University.
Sulzer uses a systematic process to manage its innovation activities. The goal is to increase the number of high-quality innovation projects and to ensure that the ones with the highest potential are brought quickly and successfully to market launch. The Technology Officers in the divisions are in charge of proactively managing this process. They meet regularly with the corporate Chief Technology Officer and the Head of Patents at the Innovation and Technology Council. Sulzer strives to create an environment in which new ideas are valued and promoted. In 2011, all divisions held innovation days and workshops in order to generate new ideas and foster a culture of innovation.
Common corporate-wide key performance indicators are used to steer innovation activities. These indicators include, for instance, the vitality index, which illustrates the share of sales through products that were recently introduced. Particularly innovative businesses, such as the Process Technology unit of Sulzer Chemtech and
Innovation and continuous research and development play essential roles in Sulzer’s sustained success. The company fosters a culture of innovation, and it has established systematic processes to manage innovations and to turn them into business opportunities.
Profound expertise and precision instruments are required to engineer synchronizer rings.
R&D investments increased to CHF 72 million (2% of sales)

43Sulzer | Annual Report 2011
Business review
Governance
Financial sectionIntroduction
For more information
www.sulzer.com/focus/desalination
the Friction Systems unit of Sulzer Metco, generate over 20% of sales with products that were launched within the last five years. In 2011, 62% of the innovation projects got closer to market launch. By the end of the year, 107 projects were in the market-launch phase (up from 81 at the end of 2010), and 32 patents were filed (2010: 41 patents). Serving clients with innovative solutionsWith 107 innovation projects in the market-launch phase, more innovations were brought to market launch in 2011 compared to the prior year. Sulzer Pumps further expanded its portfolio for water transport and desalination pumps. Intensive research is also being put into the offering for renewable forms of energy, such as concentrated solar power, geothermal power, and hydrostorage. Sulzer Metco launched a new generation of its Triplex plasma coating equipment that sets new standards for effectiveness, efficiency, and environmentally friendly design. Sulzer Chemtech built an industrial-scale bioplastics pilot plant for customer trials, samples production, and further research and development. Sulzer Turbo Services further developed innovative service solutions tailored to specific customer challenges.
Sulzer’s global network of test facilities is a source of competitive strength that allows the continuous improvement of product performance. In 2011, Sulzer Pumps set up a brand new subsea test pool for performance and string testing of pumps that operate on the seabed. At another location, a major upgrade will allow testing of the large injection pumps needed in new presalt oil fields. Sulzer Metco installed additional laboratory and manufacturing capabilities for the development and supply of innovative coating powders. In close cooperation with Sulzer Innotec, the division significantly improved the functionality of its test rig for abradables-sealing systems for the aviation industry. Sulzer Chemtech expanded its test center for process technology. The facility verifies that process designs offered to clients run optimally and that they can be scaled up to industry standards.
Sulzer Innotec—dedicated to innovationSulzer Innotec is the corporate research and development unit. It offers contract research and technical services to both internal and external customers. Core competencies include material and surface engineering, experimental and numerical methods for flow technology and mechanics, diagnostics, and certified testing, as well as manufacturing and repair of precision components and prototypes. In 2011, over 100 dedicated professionals developed innovative solutions with high potential for the entire company. Cooperation with the Sulzer divisions is a top priority for the unit. For instance, Sulzer Innotec cooperated with Sulzer Metco and other partners to develop novel ceramic membranes for the separation of oxygen and hydrogen.
Clean water through desalination
More than 97% of all water on earth is salty. With the tremendous population growth in the last decades, desalination technology was developed to provide a technically and economically viable alternative method to produce clean water. As desalination plants generally operate around the clock, reliability and efficiency are key success factors in that industry.
Sulzer offers a wide range of pumps for seawater desalination using technologies such as reverse osmosis (RO) or multieffect distillation (MED). In 2011, new ranges of axially and radially split multistage pumps for high-pressure RO membrane feeds were introduced. The company also extended its portfolio of configured end-suction pumps for MED applications and introduced a new range of double-suction pumps capable of handling flows up to 16 000m3 per hour. These products have longer life cycles and provide greater reliability and cost efficiency. Sulzer pumping technology can be found in the world’s largest desalination plants, which produce up to 500 000m3 of water per day in areas where fresh water is scarce and greatly needed.
Number of innovation projects in the market-launch phase
107 (+32%)(2010: 81)
More innovations in 2011 compared to the prior year

44 Sulzer | Annual Report 2011
Employees
Engaged employees and a diverse workforce make the difference
Sulzer strives to enhance employee engagement and to leverage the diversity of its global workforce. Engaged and diverse employees enable the company to outpace the competition through better solutions and superior performance.
Team spirit and a high level of commitment are crucial to Sulzer’s sustained success.
Sulzer clearly links strategy and people and ensures that targets and behavior are aligned. Leaders at Sulzer empower their teams around the world to strengthen close partnerships with customers. In 2011, the Sulzer workforce increased by 24%, mainly due to acquisitions. Smooth integration of the new employees was a key priority for Sulzer in 2011.
Engaged employees drive successEnhancing employee engagement and, ultimately, company performance is a key element of the Sulzer human resources strategy. A global employee engagement survey conducted in 2011 confirmed above-average levels of commitment to goals and team spirit. The survey also showed above-average levels of employee satisfaction with tasks, responsibilities, and the working environment, which are drivers for Sulzer’s
low single-digit voluntary attrition rate. Sulzer will implement actions based on the employee engagement survey in order to further enhance its attractiveness as an employer.
Development and training fosters employee engagement and helps to retain key talent. Over 90% of all employees benefitted from a performance appraisal in 2011. Sulzer aspires to reach full coverage of all employees in its performance appraisals and to reach similar levels for the newly acquired sites. With more than 400 LEAN workshops for around 2 500 participants, organizational excellence and LEAN principles remained a key focus of training. In addition, more than 80 managers participated in tailored leadership trainings that included projects with measurable contributions to Sulzer’s economic success. At the leadership level, Sulzer’s strong talent pipeline allowed 66% of vacant positions to be filled by internal candidates.
Better results through diversityWith 41% of sales in the emerging markets and 38% of employees located in these regions, managing and leveraging diversity is a business imperative. Sulzer values different backgrounds and perspectives and believes that diverse teams create better and more innovative solutions for a varied customer base. The worldwide employee engagement survey revealed high company commitment. Sulzer employees around the globe—independent of cultural background—are proud to be part of Sulzer, which is crucial in order to leverage the power of diversity. In 2011, the share of members from emerging markets in the Sulzer Management Group amounted to 12%, and 8% were women. All divisions set ambitious long-term goals for diversity with respect to gender, culture, and demography and launched respective initiatives.
Leadership positions filled with internal talent
66%(2010: 64%)
More than 400 LEAN workshops with around 2 500 participants

45Sulzer | Annual Report 2011
Business review
Governance
Financial sectionIntroduction
Corporate culture and the Sulzer brand
Committed to core values
Sulzer employees are highly committed to customer partnership. The strong Sulzer brand has been continuously fostered with the aim of enhancing the company’s positioning.
The Sulzer brand stands for the promise of outstanding technical competence, high quality standards, and great reliability. By embedding the core values into day-to-day activities, Sulzer employees contribute to the company’s strong corporate culture and its sustained success.
Outstanding customer partnershipCustomer partnership, operational excellence, and committed employees are the three core values on which Sulzer’s strong corporate culture is built. They are essential to Sulzer in defining what is truly important to the company, guiding employee behavior, and facilitating corporate-wide cooperation. In 2011, excellent examples of core values demonstrated in daily work were shared internally to further foster the corporate culture. The global employee engagement survey conducted in 2011 revealed that Sulzer employees are highly committed to the core value of customer partnership. Trust and cooperation are essential success factors in a business-to-business environment, as they enable the creation of tailored solutions for specific customer challenges.
Proud to work for SulzerOverall high company commitment has been confirmed by the global employee engagement survey. Employees worldwide are proud to be part of Sulzer and to work for the Sulzer brand. In 2011, brand surveys and workshops were held with the aim of fostering the company’s positioning, supporting cross-selling opportunities, and consolidating the current brand architecture. Guidelines available to all employees have been continuously updated in order to ensure consistent visual appearance and to safeguard the strong and valuable brand.
Acquired businesses are integrated rapidly into the Sulzer brand and former brands are removed over time. In cases of imitation or forgery, the patent and trademark department takes appropriate action to protect the valuable Sulzer logo and trademarks.
Sulzer employees around the world are proud to work for the Sulzer brand.
High company commitment confirmed by global employee engagement survey

46 Sulzer | Annual Report 2011
Corporate governance
In brief
Creating sustainable value with sound corporate governance
Sulzer is committed to the principles of good corporate governance. They ensure a sound balance of power and support the company in creating sustainable value for its various stakeholders.
Core principles
Board composition
Committees of the Board
Changes
The rigorous application of sound corporate governance helps to consolidate and strengthen trust in the company. Sulzer is subject to the Swiss corporation and stock exchange law and also applies the Swiss Code of Best Practice for Corporate Governance.
See page 47
The Board of Directors comprises seven members. Each member is elected individually. The term for members of the Board of Directors is one year. The Board of Directors is self-constituting, designating from among its members the Chairman of the Board and the constitution of the board committees.
See page 48
There are currently three committees of the Board of Directors:• The Audit Committee assesses the midyear and annual accounts and the activities of the internal
and external auditors, the Internal Control System (ICS), and the risk management. • The Nomination and Remuneration Committee assesses the criteria for the election and reelection
of Board members and nominations for the top two management levels. It also deals with succession planning, remuneration systems, and compensation for the members of the Board of Directors and the Executive Committee.
• The Strategy Committee advises the Board of Directors on strategic matters (such as material acquisitions, divestitures, alliances, and joint ventures) as well as strategic planning and defining of development priorities.
See pages 49–52
The following changes in the Board of Directors and the Executive Committee occurred:• Jill Lee and Marco Musetti were newly elected into the Board of Directors on April 14, 2011,
and Luciano Respini and Klaus Sturany were reelected, all for terms of one year.• After ten years of service, Daniel Sauter has decided not to stand for reelection at the Annual General
Meeting on April 5, 2012.• Hans Hubert Lienhard and Tim Summers decided not to stand for reelection at the Annual General
Meeting on April 14, 2011.• CFO Jürgen Brandt was appointed ad interim CEO as of November 1, 2011, and has been in charge of the
responsibilities of the CEO assignment on an ad interim basis. The former CEO Ton Büchner left the company on October 31, 2011.
See pages 48–49, 54

47Sulzer | Annual Report 2011
Business review
Governance
Financial sectionIntroduction
Sulzer Ltd is subject to the laws of Switzerland, in particular, Swiss corporation and stock exchange law. The company also applies the Swiss Code of Best Practice for Corporate Governance. The rigorous application of sound corporate governance helps to consolidate and strengthen trust in the company. A single share class and the separation of the functions of Chairman of the Board of Directors and CEO have been standard practice at Sulzer for many years. Since the Annual General Meeting on April 8, 2009, the Board of Directors has been made up exclusively of individuals who have never held executive positions at Sulzer.
Unless otherwise indicated, the following information refers to the situation as of December 31, 2011. Further, continually updated information on corporate governance is published at www.sulzer.com/corpgov. The information in the following section is set out in the order defined by the SIX Swiss Exchange guidelines on corporate governance information (RLCG), with subsections summarized as far as possible. Sulzer’s consolidated financial statements comply with International Financial Reporting Standards (IFRS), and in certain sections, readers are referred to the financial section in the Sulzer Annual Report 2011. The compensation report can be found on pages 60 to 66.
1 Corporate structure and shareholdersCorporate structureThe operational corporate structure is shown in the graphic on page 52 and in the segment reports in the financial section on pages 88 and 89 (note 3). Sulzer Ltd is the only Sulzer company listed on a stock exchange. It is based in Winterthur, Switzerland. Its shares are listed and traded on the SIX Swiss Exchange in Zurich (Securities No. 3838891 / ISIN CH0038388911). As of December 31, 2011, the market capitalization of all registered shares was CHF 3 439 941 948. Information on the major subsidiaries included in the consolidation can be found under note 37 on pages 113 to 116 of the financial section.
Significant shareholdersAccording to notifications of Sulzer shareholders, one shareholder held more than 3% of Sulzer Ltd’s share capital on December 31, 2011. As of August 2, 2011, Victor Vekselberg indirectly held 31.23% in Sulzer shares. The shares are directly held by Lamesa Holding S.A. and
Liwet Holding AG. The latter is part of the Renova Group, as published on the SIX disclosure platform on August 5, 2011. Threadneedle Asset Management Holdings Ltd notified Sulzer that it held 3.001% in shares (notification of September 15, 2010). Subsequently, the company reduced its shareholding to below 3% (notification of February 4, 2011). BlackRock Inc. notified Sulzer that it held 3.24% in shares (notification of June 6, 2011). Subsequently, the company reduced its shareholding to below 3% (notification of June 17, 2011). For detailed information, see the respective disclosure notifications on www.six-exchange-regulation.com/obligations/disclosure/ major_shareholders_en.html. For the positions held by Sulzer and information on shareholders, see note 22 in the financial section (page 103). There are no cross-shareholdings where the capital or voting stakes on either side exceed the threshold of 3%.
2 Capital structureShare capitalThe fully paid-up share capital of Sulzer Ltd amounts to CHF 342 623.70 and is divided into 34 262 370 registered shares with a par value of CHF 0.01 per share. Each registered share entitles the holder to one vote at the Shareholders’ Meeting. There is neither any authorized nor conditional capital, nor are there any participation or dividend certificates. The latest version of the Articles of Association can be viewed online at www.sulzer.com/regulations. Information on capital changes can be found in the financial statements of Sulzer Ltd (page 123).
Restrictions on transferability and nominee registrations Sulzer shares are freely transferable provided that, when requested by the company to do so, buyers declare that they have purchased and will hold the shares in their own name and for their own account.
Nominees shall only be entered in the share register with the right to vote, provided that they meet the following conditions: The nominee is subject to the supervision of a recognized banking and financial market regulator; the nominee has entered into a written agreement with the Board of Directors concerning its status; the share capital held by the nominee does not exceed 3% of the registered share capital entered in the commercial register; and the names, addresses, and number of shares of those individuals for whose accounts the nominee holds at
1) For the group structure of the Renova Group, refer to the SIX disclosure platform on www.six-exchange-regulation.com/obligations/disclosure/major_shareholders_en.html.

48 Sulzer | Annual Report 2011
Corporate governance
least 0.5% of the share capital have been disclosed. The Board of Directors is also entitled, beyond these limits, to enter shares of nominees with voting rights in the share register, provided that the above-mentioned conditions are met (see also paragraph 6a of the Articles of Association at www.sulzer.com/regulations).
On December 31, 2011, ten nominees holding a total of 4 414 234 shares (12.9% of total shares) had entered into agreements concerning their status. All of those shares have been entered in the share register with voting rights. There are no transfer restrictions and no privileges under the Articles of Association; no exceptions have been granted. A removal or amendment of the transfer restriction requires a shareholders’ resolution with a majority of at least two-thirds of the votes represented.
Convertible bonds and optionsNo convertible bonds or warrants are currently outstanding. Details of the options issued to members of the Board of Directors and the Executive Committee (from 2002 to and including 2008) and restricted stock units (from 2009) as well as performance share units issued to the members of the Executive Committee (in 2010) are set out in the financial section under note 32 (pages 108 to 110) and in the financial statements of Sulzer Ltd under note 109 (pages 126 to 129).
3 Board of DirectorsNone of the members of the Board of Directors has ever belonged to the management of a Sulzer company or to the Executive Committee, nor do any significant business relationships, except as noted below, exist between members of the Board of Directors and Sulzer Ltd or a subsidiary of Sulzer Ltd. Business relationships in the lower double-digit million range exist with the Voith Group (Hans Hubert Lienhard, member of the Board of Directors until April 14, 2011, is CEO of Voith). Vladimir Kuznetsov, Tim Summers (member of the Board of Directors until April 14,
2011) and Marco Musetti (member of the Board of Directors since April 14, 2011) have a close relationship with Sulzer’s largest shareholder; all three are employees of Renova Management AG. Vladimir Kuznetsov is Managing Director, Strategic Development of the Renova Group. Tim Summers is the Chairman of OC Oerlikon, a company controlled by the Renova Group. Marco Musetti is Chairman of Avelar Energy Ltd., a company of the Renova Group. Business relationships in the single-digit million range exist with companies that are directly or indirectly controlled by the Renova Group. For further information see financial section, note 33 on page 111. There are no interlocking directorships.
Elections and terms of officeThe Articles of Association stipulate that the Board of Directors of Sulzer Ltd shall comprise five to nine members. Each member is elected individually. The term for members of the Board of Directors is one year. As per the Annual General Meeting on April 14, 2011, Hans Hubert Lienhard and Tim Summers decided not to stand for reelection. Jill Lee and Marco Musetti were newly elected into the Board of Directors, and Luciano Respini and Klaus Sturany were reelected. The terms of the members of the Board of Directors elected earlier than 2010 expire in 2012 (see the table below). The Board of Directors has since been made up of seven members: one Austrian, one German, two Italians, one Russian, one Singaporean, and one Swiss. Professional expertise and international experience played a key role in the selection of the members. The CVs of the members of the Board of Directors can be viewed on pages 50–51 and online at www.sulzer.com/board. According to the organization regulations governing the Board of Directors, the term of office of a Board member ends no later than on the date of the Annual General Meeting in the year when the member reaches the age of 70. Exceptions up to but not exceeding the year in which the member reaches the age of 73 can be made by the Board of Directors, which has been the case for Jürgen Dormann. After ten years of service, Daniel Sauter has
Board of Directors
Attending meetingin 2011 of the
Name Nationality Position Age Entry Elected until Board AC NRC SC
Jürgen Dormann GermanChairman,Chairman SC 72 August 2009 2012 11 1
Vladimir V. Kuznetsov RussianMember,Chairman NRC 51
December2007 2012 10 3
Jill Lee Singaporean Member, AC1) 49 April 2011 2012 6 3
Marco Musetti Italian Member, AC1) 43 April 2011 2012 6 3
Luciano Respini Italian Member, NRC, SC 66 April 2004 2012 11 3 1
Daniel J. Sauter Swiss Member, SC1), AC2) 55 April 2002 2012 9 1 1
Klaus Sturany AustrianMember, Chairman AC, NRC 66 August 2009 2012 11 4 3
Hans Hubert Lienhard German Member, AC2) 61 April 2002 2 1
Tim Summers UK Member, SC2) 45 April 2010 5
AC = Audit Committee, NRC = Nomination and Remuneration Committee, SC = Strategy Committee.1) as of April 14, 2011.2) until April 14, 2011.

Audit Committee Nomination andRemuneration Committee
Strategy Committee
Klaus Sturany (Chairman)Jill LeeMarco Musetti
Jürgen Dormann (Chairman)Luciano RespiniDaniel J. Sauter
Board of Directors
Jürgen Dormann (Chairman)Vladimir V. KuznetsovJill LeeMarco MusettiLuciano RespiniDaniel J. SauterKlaus Sturany
Vladimir V. Kuznetsov (Chairman)Luciano RespiniKlaus Sturany
49Sulzer | Annual Report 2011
Business review
Governance
Financial sectionIntroductionThe Board of Directors and its committees
Continue on page 52
decided not to stand for reelection at the Annual General Meeting on April 5, 2012.
Internal organizationThe Board of Directors is self-constituting, designating from among its members the Chairman of the Board as well as the chairmen and members of the Board committees. Jürgen Dormann has been Chairman of the Board of Directors since August 18, 2009. There are currently three committees: the Audit Committee (AC), the Nomination and Remuneration Committee (NRC), and the Strategy Committee (SC); for its constitutions, see above.
The division of responsibilities between the Board of Directors and the CEO and the authorities and responsibilities of the Chairman of the Board of Directors and of the three committees are defined in the organization regulations and the relevant committee regulations, which are published online at www.sulzer.com/regulations.
Operating principles of the Board of Directors and its committeesAll decisions are taken by the full Board of Directors. For each application, written documentation is distributed to the members of the Board of Directors prior to the meeting. The Board of Directors and the committees meet as often as required by circumstances (the Board of Directors meets at least six times annually, the Audit Committee and the Nomination and Remuneration Committee meet at least three times annually, and the Strategy Committee meets at least twice annually). In 2011, five one-day and six shorter board meetings, which lasted about one to two hours on average, were held. The table on page 48 shows the number of meetings of the Board and the committees and further information. Board meetings are generally also attended in an advisory role by the CEO, the CFO, and the General Counsel (who is the secretary of the Board of Directors). CFO Jürgen Brandt was appointed ad interim CEO as of November 1, 2011, and has been in charge of the responsibilities of the CEO
assignment on an ad interim basis. Other members of the Executive Committee are invited to attend board meetings as required to discuss the midterm planning, the strategy, and the budget, as well as division-specific items (such as large investments and acquisitions). The Head of Planning and Acquisition provides regular status reports on ongoing merger and acquisition projects.
The committees do not take any decisions, but rather they review and discuss the matters assigned to them and submit the required proposals to the full Board of Directors for a decision. At the next full board meeting following the committee meeting, the chairmen of the committees report to the full Board of Directors on all matters discussed, including key findings, opinions, and recommendations.
Audit CommitteeThe Audit Committee (members listed on page 49) assesses the midyear and annual accounts and, in particular, the activities—including efficiency and independence—of the internal and external auditors as well as the cooperation between the two bodies, the Internal Control System (ICS), and the risk management. It also assesses compliance with the applicable standards. At least one full meeting per year is dedicated to risk management and compliance. In February, the Audit Committee receives and discusses a report addressing the exposures (results of periodic risk assessments) and compliance cases of the prior year. In September, the Audit Committee receives and discusses a report that summarizes the compliance activities and further improvements of Sulzer’s compliance approach and program. At each meeting major pending compliance cases (if any) are reported. The regulations of the Audit Committee can be viewed at www.sulzer.com/regulations. Meetings of the Audit Committee are attended by the CEO, the CFO, the General Counsel (at least partially), the Head of Internal Auditing (who is also the secretary of this committee), and the external auditor-in-charge. In 2011, the Audit Committee held four meetings. Apart from the

1
3
7
5 6
2
4
50 Sulzer | Annual Report 2011
Corporate governance
Board of Directors
The Sulzer Board of Directors consists of seven members who are elected individually for one-year terms. None of them has ever held an executive position at Sulzer. Jill Lee and Marco Musetti were newly elected into the Board of Directors in 2011.

51Sulzer | Annual Report 2011
Business review
Governance
Financial sectionIntroduction1 Jürgen Dormann (1940) GermanChairman of the Board Chairman Strategy Committee
CareerJürgen Dormann joined the Sulzer Board of Directors and was appointed Chairman of the Board and Chairman of the Strategy Committee in 2009. Before that, he guided ABB as CEO (2002 to 2004) and served as Chairman there (2001 to 2007). From 2005 to 2008, he was Vice Chairman of Sanofi-Aventis. He served as CEO of Aventis from 1999 to 2002 and as Chairman from 2002 to 2004. He held a number of positions with Hoechst and was the company’s CEO from 1994 to 1999. He was also Member of the Board of BG Group (2005 to 2010), Adecco (2004 to 2008; Chairman from 2007 to 2008), and IBM (1998 to 2002 and 2005 to 2008).
Binding interestsChairman of the Board of Metal Zug AG and V-Zug AG
Educational background• Master of Economics, University of Heidelberg, Germany
2 Vladimir V. Kuznetsov (1961) RussianChairman Nomination and Remuneration Committee
CareerVladimir Kuznetsov joined the Sulzer Board of Directors in 2007 and was appointed Chairman of the Nomination and Remuneration Committee in 2009. He was Vice President of Renova Inc. in New York, USA (2001 to 2009), and he served as Chairman of the Board of OC Oerlikon (2007 to 2011) and Venetos Management (2008 to 2010). From 1994 to 1998, he headed the Moscow subsidiary of Salomon Brothers, and from 1992 to 1994, he served as Deputy Director and Director of Goldman Sachs in Moscow, Russia. Since 2004, he has been acting as Chief Investment Officer and then as Managing Director, Strategic Development of Renova Management AG. Since 1998, he has been Director General of Financial Advisory Services in Russia.
Binding interestsBoard Member Integrated Energy Systems (a company of the Renova Group)
Educational background• Master of International Affairs, Columbia University, New York, NY, USA• PhD, Institute of World Economy and International Relations, Moscow, Russia• Graduate degree in Economics, Moscow State University, Moscow, Russia
3 Jill Lee (1963) Singaporean Member Audit Committee
CareerJill Lee joined the Sulzer Board of Directors in 2011. Recently, she served as Senior Vice President, Finance Strategy and Investments for Neptune Orient Lines in Singapore from 2010 to 2011. She has also held a number of positions with Siemens, including global Chief Diversity Officer (2008 to 2010), CFO and Senior Executive Vice President of Siemens in China (2004 to 2008), CFO and Senior Vice President of Siemens in Singapore (2000 to 2004), and CFO Asia Pacific and General Manager of the Asia Regional Headquarters of Siemens Electromechanical Components in Singapore (1997 to 2000).
Educational background• Master of Business Administration (MBA), Nanyang Business School,
Singapore• BA in Business Administration, National University of Singapore
4 Marco Musetti (1969) ItalianMember Audit Committee
CareerMarco Musetti joined the Sulzer Board of Directors in 2011. He was COO and deputy CEO of Aluminium Silicon Marketing (Sual Group) (2000 to 2007), Head of Metals and Structured Finance Desk for Banque Cantonale Vaudoise (1998 to 2000), and Deputy Head of Metals Desk for Banque Bruxelles Lambert (1992 to 1998). Since 2007, he has been serving as Chairman of the Board of Directors of Avelar Energy Ltd. Since 2008, he has been Deputy Chairman of Venetos Management AG, and since 2009, he has been serving as Member of the Supervisory Board of Renova U.S. Holdings Limited.
Binding interestsChairman of Avelar Energy Ltd. (a company of the Renova Group), Deputy Chairman of Venetos Management AG, Member of the Supervisory Board of Renova U.S. Holdings Limited
Educational background• Master of Science in Accounting and Finance, London School of Economics
and Political Science• Major degree in Economics, University of Lausanne
5 Luciano Respini (1945) ItalianMember Nomination and Remuneration Committee Member Strategy Committee
CareerLuciano Respini joined the Sulzer Board of Directors in 2004. He has held a number of positions with the Dow Chemical Company, including President of Dow Europe (1998 to 2006) and of Dow Latin America (1995 to 1997). He also served as Member of the Office of the Chief Executive of the Dow Chemical Company in the USA (2002 to 2006), and he was Vice President Performance Products (1991 to 1994) and Vice President Finance (1987 to 1990) for Dow Europe.
Educational background• Doctorate in Economics, Università Cattolica of Milan, Italy
6 Daniel J. Sauter (1957) Swiss Member Strategy Committee
CareerDaniel Sauter joined the Sulzer Board of Directors in 2002. He served as Managing Director and CEO of Xstrata (1994 to 2001), and he was Senior Partner and CFO of Glencore International (1983 to 1998).
Binding interestsChairman of the Board of Alpine Select AG, Board Member of Julius Bär Group Ltd, Sika AG, Model Holding AG, Trinsic AG
Educational background• Swiss-certified Banking Expert with federal diploma (Dipl. Bankfach-Experte)
7 Klaus Sturany (1946) Austrian Chairman Audit CommitteeMember Nomination and Remuneration Committee
Career Klaus Sturany joined the Sulzer Board of Directors and was appointed Chairman of the Audit Committee in 2009. He served as CFO of RWE (1999 to 2007) and as CFO (and subsequently CEO) for GEA (1996 to 1999). He also held the position of CFO of Uhde (now ThyssenKrupp), and from 1971 to 1990, he acted in a number of positions with Hoechst, including Head of Controlling.
Binding interests Supervisory Board Member of Bayer AG, Hannover Rückversicherung AG, Heidelberger Druckmaschinen AG, Österreichische Industrieholding AG
Educational background • PhD, Mathematics (major) and Physics, University of Innsbruck, Austriawww.sulzer.com/board for full CVs

Board of Directors
Chief Executive Officer
Jürgen Brandt (ad interim)
Chief Financial Officer
Jürgen Brandt
Sulzer Pumps
Kim Jackson
Sulzer Metco
César Montenegro
Sulzer Chemtech
Urs Fankhauser
Sulzer Turbo Services
Peter Alexander
General Counsel
Alfred Gerber
52 Sulzer | Annual Report 2011
Corporate governance
Organizational structure
external auditor-in-charge, who attended each meeting, no external experts attended meetings of the Audit Committee. Internal experts, like the General Counsel and the Heads of Corporate Controlling, Corporate IT, Corporate QESH, Corporate Risk Management, Corporate Taxes, as well as the Division Presidents of Sulzer Pumps, Sulzer Metco, and Sulzer Chemtech held presentations to the Audit Committee in 2011.
Nomination and Remuneration CommitteeThe Nomination and Remuneration Committee (list of members on page 49) assesses the criteria for the election and reelection of Board members and the nomination of candidates for the top two management levels. It also deals with succession planning, regularly assesses the remuneration systems, and recommends compensation for the members of the Board of Directors and the Executive Committee (including bonus targets for the latter) on behalf of the Board of Directors and in accordance with its specifications. It also carries out broadly based salary comparisons with international third-party companies, supported by studies of the consulting firms such as Mercer and Towers Watson, and it scrutinizes the work of internal and external consultants. The regulations of the Nomination and Remuneration Committee can be viewed at www.sulzer.com/regulations. Meetings of the Nomination and Remuneration Committee are attended by the CEO and the Head of Corporate Human Resources (who is also the secretary of this committee). In 2011, three regular and four shorter meetings were held. External experts from Towers Watson provided benchmarking services (see compensation report, pages 60 to 66). The search process for the new CEO was supported by an external consulting firm.
Strategy CommitteeThe Strategy Committee (list of members on page 49) advises the Board of Directors on strategic matters (such as material acquisitions, divestitures, alliances, and joint ventures) as well as strategic planning and defining of development priorities. The regulations of the Strategy Committee can be viewed at www.sulzer.com/regulations. In 2011—as an exception—only one meeting took place. The CEO, the CFO, the General Counsel (who is the secretary of this committee), the Head of Corporate Planning and Acquisitions as well as the President of Sulzer Pumps attended this meeting. Due to the importance, size, and particularly the required speed of the acquisition process of Cardo Flow Solutions, it was decided to hold the respective discussions at meetings of the full Board of Directors. No external experts participated.
Division of powers between the Board of Directors and the CEOThe Board of Directors has largely delegated executive management powers to the CEO, but it is still responsible for matters that cannot be delegated in accordance with Art. 716a of the Swiss Code of Obligations, such as corporate strategy, approval of midterm planning, and the annual budget, as well as key personnel decisions, including approval of the remuneration system. The same applies to acquisition and divestiture decisions involving an enterprise value exceeding CHF 15 million or CHF 20 million respectively, investments in fixed assets exceeding CHF 15 million, major corporate restructurings, approval of dispute settlements with an impact on operating income of more than CHF 20 million, approval of research and development projects exceeding CHF 10 million, as well as other matters relevant to the company, and decisions that must by law be made by the Board of Directors (including those defined in the Swiss Mergers Act). The competency

53Sulzer | Annual Report 2011
Business review
Governance
Financial sectionIntroductionregulations and the nature of the collaboration between the Board of Directors and the Executive Committee can be viewed in the organizational regulations at www.sulzer.com/regulations.
Information and control instrumentsEach member of the Board of Directors receives a copy of the monthly financial statements (January to May and July to November), plus the midyear and annual financial statements. These include information about the balance sheet, income and cash flow statements, as well as the key figures for the company and its divisions (incorporating comments on the respective business results and a three-months rolling forecast of the key figures). The CEO and CFO report at every board meeting on business developments and all matters relevant to the company; twice each year, the Board receives the forecasted annual results. The chairmen of the committees also report at these meetings on all matters discussed by their committees and on the key findings and assessments, and they submit proposals accordingly. Each year, the Board of Directors discusses and approves the budget for the following year, and every three years, it establishes a midterm plan, which is also subject to periodic review. The Chairman of the Board of Directors regularly consults the CEO and other representatives of the Executive Committee and generally participates—at least partially—in the retreat of the Executive Committee and in the meeting of the Sulzer Management Group (around 85 people) held every 12 to 18 months. In addition, the Board receives twice a year an investor relations status report.
Internal AuditingInternal Auditing reports to the CFO for administrative purposes, but reports functionally directly to the Chairman of the Audit Committee. Meetings between Internal and External Auditing take place on a regular basis to prepare for the meetings of the Audit Committee, to review the interim and final reports of the External Auditing, to plan and coordinate internal and external audits, as well as to prepare audit instructions for the attention of external auditors of the individual companies. Group companies are audited by Internal Auditing based on an audit plan that is approved by the Audit Committee; depending on the risk category such audits are carried out on a rotational basis either annually or every second, third, or fourth year. Internal Auditing carried out 42 audits in the year under review. One of the focal points was the internal control system. The results of each audit are discussed in detail with the companies and divisions concerned and key measures agreed upon. The Chairman of the Board of Directors, the members of the Audit Committee, the CEO, the CFO, the General Counsel, as well as the respective Division President and other line managers of the audited unit receive a copy of the audit report. The key measures agreed upon are also presented to and discussed with the CEO, the CFO, the General Counsel, the Division Presidents, and the Division Controllers during the monthly information meetings; during these meetings, Internal Auditing also reports on the follow-up of measures agreed earlier. In 2011, a new follow-up process for all corporate audits (internal, legal and compliance, IT, and QESH) was introduced. It ensures that the implementation of the improvement measures that have been agreed upon can
be more efficiently and effectively monitored. Each year, the Head of Internal Auditing compiles a report summarizing activities and results. This report is distributed to members of the Board of Directors and the members of the Executive Committee and presented to the Executive Committee and the Audit Committee. It is discussed in both committees and thereafter reported to the Board of Directors.
Risk management and corporate complianceSulzer puts a high priority on carrying out its businesses with integrity, in compliance with all applicable laws and internal rules, and on accepting only reasonable contractual risks. As part of Sulzer’s integrated risk management process, compliance risks are assessed on a regular basis, and the results are discussed both with the management and within the Corporate Risk Council. The Audit Committee dedicates at least one full meeting per year to risk management and compliance. An overview of the main risks and corresponding mitigation measures is provided on pages 58–59.
In 2010, Sulzer joined the UN Global Compact initiative and introduced a new Code of Business Conduct (Code), which can be viewed online at www.sulzer.com/regulations in 18 languages. Every current employee of the company and every new employee (including those of the newly acquired businesses) is required to confirm in writing that he or she has read and understood this Code and will comply with it. At Cardo Flow Solutions in Germany, this requirement is still in the process of being implemented. As of 2006, every member of the Sulzer Management Group (approximately 85 people) as well as the heads of all operating companies and all divisional and local compliance officers must, among others, reconfirm this compliance commitment in writing on an annual basis. The company, each division, and all operating companies have their own compliance officers. The group compliance officer reports to the General Counsel and steers and administers the corporate-wide compliance program (consisting of, e.g., periodic risk assessments, values (“speak-up culture” and “tone at the top and the middle”), internal rules and tools, awareness building and training, controls, and sanctions). Employees and the 109 compliance officers receive regular training so that best practice standards for compliance issues can be established and applied; in 2011, a particular focus was taken on the Asian businesses (including face-to-face compliance and risk management trainings for over hundred compliance officers and managers). Twice a year, the Audit Committee is informed about compliance-related matters (e.g., exposures encountered and cases from the prior year, activities carried out in the current year and those planned for the following year). At each meeting of the Audit Committee, new major compliance cases (if any) are reported and discussed. During 2011, new contract risk management training programs were rolled out. Each training also contains a compliance part, which again focuses on compliance with export controls, competition law, and corruption avoidance. In 2011, several thousand employees participated in e-learning programs, training sessions, and workshops. In 2011, a new process addressing the selection and assessment of third-party intermediaries (agents, consultants, representatives, and distributors) was introduced. Significant emphasis was

54 Sulzer | Annual Report 2011
Corporate governance
put on further improving the speak-up culture (including promoting the use of the compliance hotline) in 2011. This hotline provides employees with one of many options for reporting (potential) violations of the law or internal directives. Reports can be made via a free hotline or a dedicated website. Users may remain anonymous if they choose to do so. The process of investigating reported issues was further improved in the course of 2011. In the same year, new antitrust law guidelines were introduced.
The Corporate Risk Council, comprising the CFO (Chairman), the General Counsel, the Head of Internal Auditing, the Corporate Compliance Officer, the Head of Risk Management, and representatives of other group staff functions, held four meetings in 2011. The Corporate Risk Council’s tasks mainly include formulating and maintaining adequate risk management policies, systems and guidelines, initiating and coordinating risk management activities, and advising the CEO and the Executive Committee on matters relating to risk management. Each member of the Executive Committee receives a copy of the minutes of the Corporate Risk Council. In addition, if considered necessary, a verbal report is given at the Executive Committee meetings that follow the meetings of the Corporate Risk Council. Training in 2011 focused once again on the areas of contractual risks (including insurance) and compliance aspects. Several hundred employees from all divisions took part in the new contract risk management trainings. Internal management of contractual risk was also improved further in the year under review, including through a particular focus on Sulzer’s Asian activities, as well as a further tightening of the legal and compliance network throughout the company.
The General Counsel informs the Board of Directors and the Executive Committee regularly on legal matters and key changes in legislation that may affect Sulzer, as well as on important litigation. Twice a year, a report is also made to the Audit Committee about any pending or threatened litigation with worst-case exposure exceeding CHF 0.5 million. At the February meeting, a compliance report outlining the respective exposures of the businesses as well as the compliance cases of the prior year was discussed. At its September meeting, the Audit Committee was briefed on the present state of risk management within the company and on the results of the risk management process—a process to systematically identify and evaluate significant risks and initiate countermeasures. In the same meeting, an update on Sulzer’s compliance approach including the respective ongoing and planned activities was also provided. At each meeting, the major current compliance cases (if any) are reported to and discussed by the Audit Committee. The Corporate Legal Department carried out nine legal audits in 2011. These audits focused on contractual as well as compliance risks. The results of the audits are discussed with the responsible managers. Measures are agreed upon, and the corresponding reports are sent to the same group of recipients that also receives the internal audit reports. Implementation of these measures is monitored on the basis of a new follow-up process (see above under “Internal Auditing”, page 53). The Corporate Quality, Environment, Safety, and Health Department carried out 24 audits and organized 9 external insurance audits and 49 external health and safety
compliance audits in 2011. The focal points were primarily environmental protection and workplace safety. The results of each of these audits are discussed directly with the responsible managers, and an agreement is reached on any improvements required. The latest status of the company’s risks relating to quality, environment, safety, and health is reported to the Audit Committee once a year. Sulzer published an externally verified Sustainability Report in 2010 (see www.sulzer.com/sustainability). The company received the highest rating of A+ from the Global Reporting Initiative (GRI) and has been included in the Dow Jones World Sustainability Index (DJSI) since 2008. The external auditing institute SGS (Société Générale de Surveillance) also confirmed the highest GRI rating. In a report issued in September 2011, SAM assessed Sulzer’s approach regarding “Code of Conduct / Corruption / Bribery” with 95 out of 100 points. With the focus on IT security, 209 sites conducted IT self-assessments in 2011.
4 Executive CommitteeThe Executive Committee consists of the CEO, the CFO, the Division Presidents, and the General Counsel. CFO Jürgen Brandt was appointed ad interim CEO as of November 1, 2011, and has been in charge of the responsibilities of the CEO assignment on an ad interim basis. The former CEO Ton Büchner formally left the company as per October 31, 2011. Executive management powers are delegated by the Board of Directors to the CEO. The Division Presidents are charged by the CEO with defining and attaining business targets for their respective divisions in accordance with corporate goals. The appropriate powers have largely been delegated to the Division Presidents by the CEO. The organization regulation governs, among other things, the transfer of responsibilities from the Board of Directors to the CEO, and this regulation can be viewed at www.sulzer.com/regulations. The other members of the Executive Committee support the CEO in his corporate management tasks. There are no management contracts with third parties. The CVs of the members of the Executive Committee can be viewed on pages 56–57 and online at www.sulzer.com/management.
5 Compensation reportInformation on the remuneration of the Board of Directors and the Executive Committee can be found in the compensation report (pages 60 to 66). 6 Shareholder participation rightsRestrictions and representation of voting rightsOnly nominees are subject to restrictions (see “Capital structure”, page 47). No exceptions were granted during the reporting year, and no measures to remove these restrictions are planned. A shareholder may be represented at the Annual General Meeting by a legal representative, another shareholder with the right to vote, a corporate proxy, an independent proxy, or a depositary. Shares held by a shareholder may be represented by only one person.
Statutory quorumChanges to the Articles of Association may only be approved by a majority of at least two-thirds of the voting rights represented; share capital increases are carried out, however, upon an absolute majority of the votes

55Sulzer | Annual Report 2011
Business review
Governance
Financial sectionIntroductionrepresented. The dissolution or a merger of the company can only be decided upon if at least half the shares issued are represented at the Shareholders’ Meeting and two-thirds thereof vote in favor of the corresponding proposal (see also paragraph 18 of the Articles of Association).
Convocation of the Annual General Meeting and submission of agenda itemsNone of the applicable regulations deviate from the law regarding the convocation of a Shareholders’ Meeting. Shareholders representing at least 2% of the share capital may submit items for inclusion on the agenda of a Shareholders’ Meeting. Such submissions must be requested in writing at least two months prior to the meeting and must specify the agenda items and proposals of the shareholder concerned.
Entry in the share registerVoting rights may be exercised by registered shareholders whose names are entered in the share register no later than five working days prior to the Annual General Meeting.
7 Takeover and defense measuresThe Articles of Association contain no opting-out or opting-up clause. None of the contracts with members of the Board of Directors contains a change of control clause. The contracts of the members of the Executive Committee who joined the Executive Committee prior to April 2009 contain a remuneration clause provided the contract is terminated or the member’s function is changed considerably within 18 months after a change of control (see compensation report, pages 60 to 66). If there is a change of control (which, for members of the Executive Committee, also includes a replacement of the majority of the members of the Board of Directors) or a public takeover bid that is not supported by the Board of Directors, all allocated restricted stock units (RSUs) of the RSU plan are automatically vested and the performance share units (PSUs) are automatically converted into shares on a pro-rata basis without being subject to blocking restrictions. The vesting period for those RSUs granted to the members of the Board of Directors ends no later than the date on which the individual steps down from his or her respective function.
8 AuditorsPricewaterhouseCoopers AG has been the statutory auditor of Sulzer Ltd since 1992. The statutory auditor is elected at the Annual General Meeting for a one-year term of office. Christian Kessler has been acting as the external auditor-in-charge for the Sulzer mandate since the 2006 Annual General Meeting. The external auditor-in-charge is replaced every seven years. The Audit Committee is in charge of supervising and monitoring the statutory auditor, and it reports to the Board of Directors (see “Board of Directors”, page 48). The members of the Audit Committee receive summaries of audit findings and improvement proposals at least once a year. The external auditor-in-charge is invited to attend meetings of the Audit Committee. In 2011, he has attended all Audit Committee meetings. The Audit Committee or its Chairman meets separately with the Head of Internal Auditing and the
external auditor-in-charge at least once per year to assess (among other things) the independence of the internal and external auditors. The Audit Committee evaluates the work done by the auditors based on the documents, reports, and presentations provided by the auditors as well as on the materiality and objectivity of their statements. In order to do so, the committee gathers the opinions of the CFO and the Head of Internal Auditing. The fee paid to the auditor is reviewed on a regular basis and compared with the auditing fees paid by other internationally active Swiss industrial companies. Said fee is negotiated by the CFO, checked by the Audit Committee, and signed off by the Board of Directors. Further information on the auditor, in particular, the amount of the auditor’s fees and any additional fees received by the auditor for advisory services outside its statutory audit mandate, is listed in the financial section under note 34 (page 111). All advisory services provided outside the statutory audit mandate (essentially consisting of consulting services related to audit and accounting as well as legal and tax advisory services) are compliant with the applicable independence rules.
9 Information policySulzer Ltd reports on its order intake every quarter (media releases) and on its financial results every half-year, in each case also commenting on business performance and outlook. In addition, the company reports on important events on an ongoing basis (ad hoc publications). The reporting referred to in Section 5 of the Corporate Governance Report (including the respective references to the financial section) corresponds to the compensation report as laid out in Section 8 of Annex 1 of the Swiss Code of Best Practice for Corporate Governance.
Key dates in 2012January 12 Order intake 2011February 23 Annual results 2011April 5 Annual General Meeting 2012April 17 Order intake Q1 2012July 20 Midyear report 2012October 12 Order intake Q1–Q3 2012November 2 Capital Market Day
The above dates and any changes can be viewed at www.sulzer.com/events. Media releases (sent via e-mail) can be subscribed to at www.sulzer.com/newsletter. Other information is available on the Sulzer website www.sulzer.com.
Material changesReference is made in the text to any material changes occurring between the balance sheet date (December 31, 2011) and the copy deadline for the Annual Report (February 14, 2012).
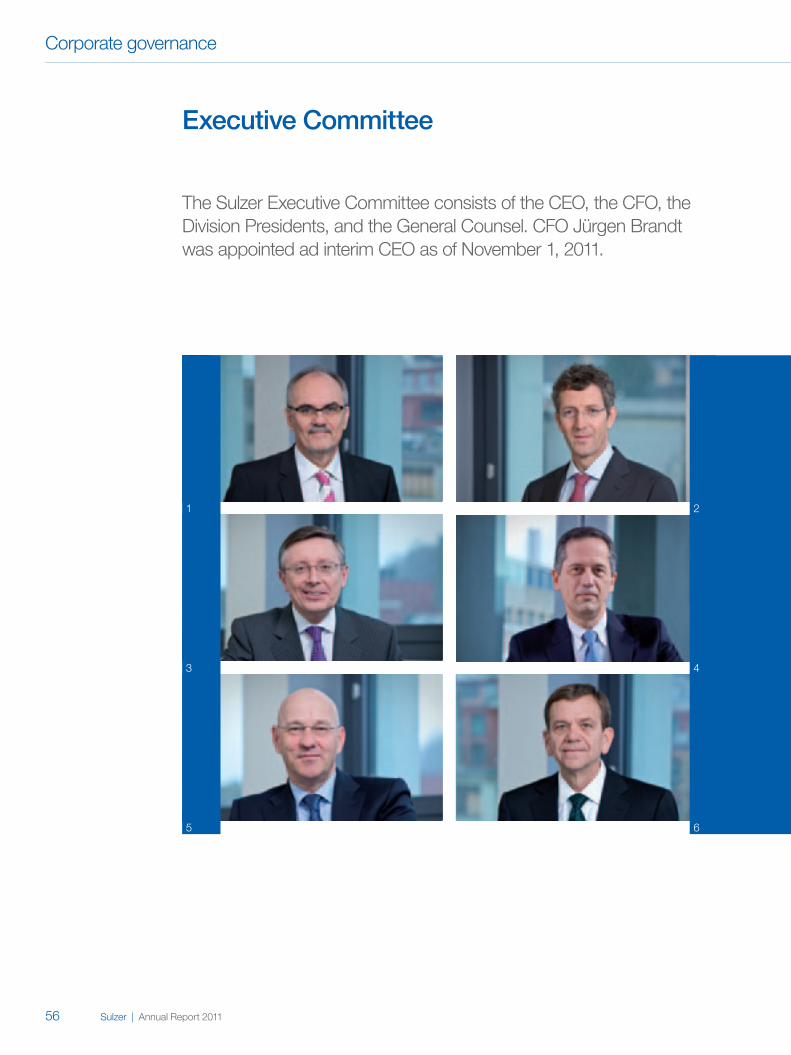
1
3
5 6
2
4
56 Sulzer | Annual Report 2011
Corporate governance
Executive Committee
The Sulzer Executive Committee consists of the CEO, the CFO, the Division Presidents, and the General Counsel. CFO Jürgen Brandt was appointed ad interim CEO as of November 1, 2011.

57Sulzer | Annual Report 2011
Business review
Governance
Financial sectionIntroduction1 Jürgen Brandt (1956) German Chief Financial OfficerAd interim Chief Executive Officer
CareerJürgen Brandt joined the Sulzer Executive Committee as CFO in 2010. He was appointed CEO on an ad interim basis as of November 1, 2011. Previously, he served as CFO for the Austrian Energy & Environment Group (2007 to 2010) and as CFO of its subunit the Von Roll Inova Group (2006 to 2007). He has held the CFO position in a number of companies, including Foster Wheeler Power Group Europe (2006) and Sylvania Lighting International (2005 to 2006). He was also Senior Vice President Finance of the Power and Environment Division (1999 to 2004) and CFO Power Boilers (1997 to 1999) of Alstom.
Educational background• BSc in Economic Engineering, University of Esslingen, Germany
2 Alfred Gerber (1959) Swiss General Counsel
CareerAlfred Gerber joined the Sulzer Executive Committee as General Counsel in 2001. Previously, he was attorney for Sulzer (1995 to 2001) and for the law firm Kohli & Partners (1991 to 1995). From 1989 to 1990, he was Clerk of the Court and Legal Secretary for the District Court in Meilen, Switzerland.
Binding interestsBoard Member Association of Swiss Companies in Germany (VSUD), Chairman of European Legal Council of the Conference Board
Educational background• LLM (Master of Laws), London, UK• Law degree, University of Zurich, Switzerland; admitted to the bar
3 Kim Jackson (1962) BritishDivision President Sulzer Pumps
CareerKim Jackson joined the Sulzer Executive Committee as Division President of Sulzer Pumps in 2007. At that time, he was serving as Head of the Asian and South Pacific Business Area of Sulzer Pumps China (2004 to 2007). From 1990 to 2003, he held a number of positions with the Hayward Tyler Group, including Group Managing Director (2000 to 2003) and Group Operations Director (1995 to 2000).
Educational background• IOD Financial Management, Institute of Directors, London, UK• BSc (Hons) in Manufacturing Engineering, University of Hertfordshire,
Hatfield, UK
4 César Montenegro (1953) Venezuelan/US-AmericanDivision President Sulzer Metco
CareerCésar Montenegro joined the Sulzer Executive Committee as Division President of Sulzer Metco in 2008. He has held a number of positions with Sulzer since 1977. From 2002 to 2008, he served as Head of Business Area North America for Sulzer Pumps. He was also Managing Director of Sulzer Mexico (1996 to 2001) and of Sulzer de Venezuela (1989 to 1996).
Educational background• Postgraduate studies in Business Engineering, University Simon Bolivar,
Caracas, Venezuela• MS in Mechanical Engineering, University Simon Bolivar,
Caracas, Venezuela
5 Urs Fankhauser (1960) Swiss Division President Sulzer Chemtech
CareerUrs Fankhauser joined the Sulzer Executive Committee as Division President of Sulzer Chemtech in 2002. He has held a number of positions with Sulzer Chemtech, including President North and South America (from 2000 to 2002), President East Asia/Pacific (1993 to 2000), and Engineering Manager in Singapore (1990 to 1993).
Binding interestsMember of the Board of Burckhardt Compression AG and Bossard AG
Educational background• Master of Business Administration (MBA), Henley Management College,
Oxfordshire, UK• Advanced Management Program (AMP), Harvard University, Boston, MA, USA• Swiss-certified Engineer with federal diploma (Dipl. Ing. FH), Burgdorf,
Switzerland
6 Peter Alexander (1958) US-AmericanDivision President Sulzer Turbo Services
CareerPeter Alexander joined the Sulzer Executive Committee as Division President of Sulzer Turbo Services in 2005. He has held a number of positions with Sulzer Turbo Services, including Head Business Development and Division President on an ad interim basis (2004 to 2005), Cofounder and Director of Operations and Engineering in Indonesia (1994 to 2004), and Engineering Manager and Project Engineer in the USA (1987 to 1994).
Educational background• BSc in Marine Engineering, Texas A&M University, College Station, TX, USA
www.sulzer.com/management for full CVs

58 Sulzer | Annual Report 2011
Corporate governance
Identifying and managing risks
Sulzer puts a high priority on carrying out its businesses with integrity and in compliance with all applicable laws and internal rules. Risks are being identified and avoided or managed with tailored and effective measures.
Risk Risk exposure Main loss controls
External and markets
Market assessment
Market developments that are assessed inappropriately could lead to missed business opportunities or losses.
• Continuous monitoring and assessment of market developments
• Systematic midrange planning based on market developments and expectations
Geopolitical shocks
A geopolitical shock event could have an impact on operations and travel. Also, it could imply currency risks and default risks of countries and banks.
• Monitoring of exposure in critical countries• Monitoring of debt situation of countries and banks• Continuous monitoring of raw material prices and
inflation indicators• Sulzer’s global presence mitigates the effect
of geopolitical shocks
Strategic
Allocation of resources
Allocation of financial resources to acquisitions, joint ventures, and mergers or other external growth opportunities may fail to generate value.
• Systematic scouting, evaluation, due diligence, and approval processes
• Corporate acquisition procedure policy
Innovation Failure in R&D and innovation activities could negatively impact the ability to operate and to grow the business.
• Midrange planning process• Innovation and Technology Council• Innovation stage-gate process
More information on page 42
Operational
Attraction and retention
Failure to attract and retain talent could lead to a lack of expertise and negatively impact the ability to operate.
• Strong Sulzer employer brand strategy• Regular talent review workshops• Development plans and education of employees• Salary benchmarks and reviews• Regular employee engagement surveys
More information on page 44
Health and safety
An unsafe working environment could lead to harm to people, reputational damage, fines, and liability claims.
• Health and safety regulations, guidelines, programs, and trainings
• OHSAS 18001 certifications• Monthly health and safety monitoring• Global network of health and safety officers• Regular health and safety audits
More information on page 40

59Sulzer | Annual Report 2011
Business review
Governance
Financial sectionIntroduction
Risk Risk exposure Main loss controls
Operational (continued)
Compliance Non-compliant or unethical behavior could lead to reputational damage, fines, and liability claims.
• Active fostering of high ethical standards • Continuous monitoring and assessment
of potential exposures • Sulzer Code of Business Conduct and a number
of supporting regulations (e.g., anti-corruption, anti-trust, trade control)
• Global network of compliance officers• Compliance trainings (incl. e-learning) and audits• Speak-up culture, compliance hotline, and sanctions
More information on page 53
Quality of products and services
Failure of high-quality products and services could lead to repeated work, reputation damage, or liability claims.
• Quality management and assurance systems tailored to specific businesses
• Third-party accreditation• Competence development programs
and trainings of employees• Testing centers
Business interruptions
Business interruption, such as a fire, could cause damage to people, property, and equipment. It could have a negative effect on the ability to operate at the affected site.
• Crisis and emergency management systems (at global and local level)
• Risk management policy and guidelines• Corporate and local crisis and emergency
management systems• Disaster recovery plans in IT
Financial
Financial markets
The unpredictability of financial markets may have a negative effect on Sulzer’s financial performance and its ability to raise or access capital.
• Continuous monitoring of financial-market developments at corporate level
• Corporate financial policy • Foreign exchange risk policy• Trading-loss limits for financial instruments
More information on page 78
Credit Credit risks arising from financial institutions and from customers could have a negative effect on Sulzer’s financial performance and ability to operate.
• Continuous monitoring of customer credit risks at corporate level
• For financial institutions, only parties with a strong credit quality are accepted (third-party rated)
• Individual risk assessment of customers with large order volumes
• Continuous monitoring of country risks
More information on page 80
Liquidity Failure in liquidity risk management may have a negative effect on Sulzer’s financial performance and its ability to operate.
• Continuous monitoring of the liquidity • Management of liquidity reserves at corporate level• Cash flow program to optimize liquidity and cash
flow management• Efficient use of available cash through cash pooling
More information on page 80

60 Sulzer | Annual Report 2011
Compensation report
Incentives for sustainable performance
Compensation policies and plans at Sulzer are based on performance orientation and the company’s strong emphasis on creating long-term shareholder value and sustainable growth.
In brief
Core principles
Compensation for the Board of Directors
Compensation for the Executive Committee
Advisory vote
Compensation policies and plans at Sulzer are based on performance orientation and have a strong emphasis on creating long-term shareholder value and sustainable growth. The compensation is reviewed by the Nomination and Remuneration Committee on an annual basis and, if necessary, adjusted by the full Board of Directors.
See page 61
The compensation paid to the Chairman of the Board of Directors and the other members of the Board of Directors is based on a compensation regulation. The compensation of the Board of Directors consists of the following components:
• Fixed cash component• Restricted stock unit (RSU) component
The total amount of compensation for the Chairman as well as the other members of the Board of Directors depends on the amount of responsibility, the complexity of the tasks, the professional and personal requirements placed on them, and the expected average time spent executing such duties.
See page 61
The compensation of the Executive Committee members is governed by internal regulations (total reward policy, bonus plan, restricted stock unit plan, and performance share plan). In order to reflect the objective of pay for performance, the total direct compensation package of the CEO and the members of the Executive Committee includes the following components:
• Fixed annual base salary (in cash)• Variable component, which consists of:
– short-term annual performance- and results-based bonus (in cash) – long-term incentives: the restricted share unit plan (RSU plan) and
since 2010 the performance share plan (PSP)
To ensure that the remuneration is competitive, Sulzer regularly participates in respective benchmarks.
See pages 62–66
Sulzer’s Board of Directors is proposing to enable shareholders to cast advisory votes on the compensation report at the next Annual General Meeting on April 5, 2012.

61Sulzer | Annual Report 2011
Business review
Governance
Financial sectionIntroduction
Annual compensation of the members of the Board of Directors1)
in CHF
Fixed component(fixed amount, cash, net of social
security contributions2))
Variable component (variable, fixed amount at grant
date, restricted stock units)
Chairman of the Board3) 420 000 250 000
Members of the Board 70 000 125 000
Audit committee – Chairman4) 30 000 –
Audit committee – Member 20 000 –
Nomination and Remuneration Committee – Chairman4) 25 000 –
Nomination and Remuneration Committee – Member 15 000 –
Strategy Committee – Chairman4) – –
Strategy Committee – Member 15 000 –1) Annualized compensation (as of April 1, 2011). For the exact amounts of the 2011 compensation refer to note 109 on pages 126 to 129
in the financial section.2) For gross amounts, refer to note 109 on pages 126 to 129 in the financial section.3) The Chairman of the Board of Directors does not receive additional remuneration for committee activities.4) Committee chairmen do not receive additional remuneration for committee membership.
The compensation report follows section 5 of the SIX Swiss Exchange Guidelines on Corporate Governance Information (RLCG). Further information relating to the remuneration of the members of the Board of Directors and the Executive Committee can be found in the financial section under note 32 (pages 108 to 110) and note 33 (page 111) as well as in the financial statements of Sulzer Ltd under note 109 (pages 126 to 129).
Board of DirectorsThe compensation paid to the Chairman of the Board of Directors and the other members of the Board of Directors is based on a compensation regulation. The compensation is reviewed by the Nomination and Remuneration Committee (NRC) on an annual basis and, if necessary, adjusted by the full Board of Directors based on a proposal by the NRC. The compensation consists of a fixed cash component and a restricted stock unit (RSU) component with a fixed grant value. The latter replaced the option component in 2009 and ensures the long-term alignment of the interests of shareholders and Board members. The compensation does not include a short-term variable (bonus) element, and no Board member receives pension benefits. No attendance fees are paid. The members of the Board of Directors are paid for their service over a 12-month period starting with their election. Whereas the cash remuneration is paid in quarterly installments (for the Chairman, monthly installments), the RSUs are granted once a year (see below). The total amount of compensation for the Chairman as well as the other members of the Board of Directors is guided by compensation benchmarks (see the box “Compensation benchmark”), and it reflects the amount of responsibility, the complexity of the tasks, the professional and personal requirements placed on them, and the expected average time spent executing such duties. However, the final compensation and the weighing of the different criteria is ultimately the result of discretionary decisions by the full Board. The same is true for the higher compensation of the Chairman, which reflects his higher
level of responsibility, the broader scope of his tasks, as well as the greater amount of time spent executing this role. Early 2011, the Board decided to return the fixed cash compensation to the levels it was before the economic downturn (as per April 1, 2011). The elements and new (annualized) values of the compensation of the members of the Board of Directors are shown in the table below.
The grant value of the RSUs is fixed (CHF 125 000 per Board member and CHF 250 000 for the Chairman of the Board). The number of RSUs is determined by dividing the fixed grant value by the volume-weighted average share price of the last ten trading days prior to the grant date, which lies between the date of the publication of the year-end results and the Annual General Meeting. One-third of the RSUs vest after the first, second, and third anniversary of the grant date respectively. Upon vesting, one vested RSU is converted into one share of the company. The vesting period for all options and RSUs granted to the members of the Board of Directors ends no later than the date on which the individual steps down from his respective function. Although the grant values of the RSUs are fixed, they are considered a variable compensation element since the development of their values follows the share price. The variable compensation of the Chairman of the Board represented 51% of the fixed component. For the other Board members, the variable component represented between 0% and 161% of the fixed component. Further details can be found in the financial section under note 109 (pages 126 to 129).
Further details on the RSU component are available in the Executive Committee subsection. Detailed information on the remuneration of the Board of Directors (including Hans Hubert Lienhard and Tim Summers, both Board members until April 14, 2011, and Jill Lee and Marco Musetti, both Board members since April 14, 2011), is given in the financial statements of Sulzer Ltd under note 109 (pages 126 to 129).
Compensation benchmark
The comparison group reflects Sulzer’s ambitious business strategy.
– ABB – Actelion – Clariant – EMC Chemie – Geberit – Georg Fischer – Holcim – Lonza – Nobel Biocare – OC Oerlikon – Rieter – Schindler – Sika – Sonova – Syngenta – Synthes

Fixed compensation
Base salary,pension fund contribution,and other
Variable compensation
Short-termincentive plan
Long-termincentive plans
Restrictedstock unit(RSU) plan
Bonusplan
Performance share plan (PSP)
62 Sulzer | Annual Report 2011
Compensation report
Overview compensation elements
Executive CommitteeThe compensation of the Executive Committee members is governed by internal regulations (total reward policy, bonus plan, restricted stock unit plan, and performance share plan). The compensation is reviewed by the Nomination and Remuneration Committee (NRC) on an annual basis and, if necessary, adjusted and approved by the full Board of Directors based on a proposal by the NRC. The full Board also approves the performance targets as well as the performance achievement levels for all Executive Committee members based on recommendations of the NRC. The members of the Executive Committee have no right to either attend or vote at meetings concerning their compensation. However, the CEO attends meetings in which the proposed compensation of members of the Executive Committee is being discussed, and he submits proposals (except concerning his own compensation).
In order to reflect the objective of pay for performance, the total direct compensation package of the CEO and the members of the Executive Committee includes a fixed annual base salary (in cash) and a variable component. The variable component consists of a short-term annual performance- and results-based bonus (in cash) as well as long-term incentives: the restricted stock unit plan (RSU plan) and the performance share plan (PSP). In 2011, the variable compensation to the CEO (January 1, 2011 –
October 31, 2011) represented 60%1) of the fixed component (base salary, pension fund contribution). For the entire Executive Committee, the variable component represented 105%1) of the fixed component. The relationship between the fixed and the variable component of compensation reflects Sulzer’s high performance orientation and the company’s strong emphasis on aligning the interests of the Executive Committee and the shareholders to create long-term shareholder value and profitable growth. Further details can be found in the financial section under note 109 (pages 126 to 129).
To ensure that the remuneration of the members of the Executive Committee is nationally as well as internationally competitive, Sulzer regularly participates in respective benchmarks, such as the 2011 study provided by Towers Watson, a leading global consultancy. It focused on Swiss-based multinational corporations with—as median—a comparable number of employees and sales volume (see the box “Compensation benchmark” on page 61 for the comparison group). Sulzer aims for remuneration between the median and the 75th percentile of the benchmark.
The elements of the compensation of the members of the Executive Committee are summarized in the table on page 63.
1) Adjusted for all payments and disclosure requirements related to the departure of Ton Büchner. These include: an additional discretionary bonus of CHF 1.7 million, a payment for unused vacation days (CHF 345 815), and the negative Performance Share Plan value (minus CHF 666 667)—which was introduced to reverse the amount that was disclosed as positive value in the Sulzer Annual Report 2010 but entirely forfeited due to Ton Büchner’s departure.

63Sulzer | Annual Report 2011
Business review
Governance
Financial sectionIntroduction
Basecompensation
Short-term incentive plan (bonus plan)
Long-term incentive plan I (restricted stock unit plan)
Long-term incentive plan II (performance share plan)
Main parameters
Position, function, experience, competency evaluation
Achievement of business, financial and individual targets
Position, function, experience Achievement of long-term net-income results, factored by share price performance and acquisition volume
Key driver Labor market Net income, return on capital employed, order intake, and annual individual targets
Share price development Aggregate net income 2010–2012, total shareholder return, acquisition volume
Links to compensation principles
Competitivecompensation
Pay for performance Sustainable value creation Sustainable value creation and growth
Form Cash Cash Restricted stock units (RSUs)
Performance share units (PSUs)
Amount Fixed Variable, capped at maximum 2.5 times the bonus on target (which is 50% of the base salary for the CEO and 30–35% for the other Executive Committee (EC) members). The maximum amount can reach 125% of the base salary for the CEO and 75–87.5% of the base salary for the other EC members1)
Fixed value for one year based on decision of the Board of Directors, converted into RSUs
Number of PSUs granted based on a) defined investment of Executive Committee (EC) members (two-thirds of 2010–2012 annual RSU grants for CEO; one-third for other EC members) and b) matching by the company (100% of amount converted for CEO; 80% for other EC members), divided by the grant price of the RSUs in 2010. The overall amounts payable under this plan are capped
Grant Monthly March of the year following the performance period
Annually at grant date (in March)
April 1, 2010 (one-time plan)
Performance period One fiscal year (2011) One fiscal year (2011) 1–3 years January 1, 2010 – March 31, 2013
Vesting – – One-third each on the first, second, and third anniversary of the grant date
All units vest on March 31, 2013. 50% are de-blocked immediately and 30% at first, and 20% at second anniversary of the vesting date
1) The Board of Directors decided to change the bonus plan as of January 1, 2012. With more ambitious objectives, the bonus on target was increased to 80% of the base salary for the CEO and 50–60% for the other members of the Executive Committee. The maximum bonus has been reduced to 2 times the bonus on target.
Compensation elements for the members of the Executive Committee

64 Sulzer | Annual Report 2011
Compensation report
Base salary (fixed, in cash) To determine the base salary—which ultimately is the result of a discretionary decision by the full Board—the market median level for the respective position, individual qualifications and experience, and the prevailing local labor market conditions, i.e., for members of the Executive Committee, Swiss labor market conditions, are taken into account. In order to review, assess, and, where needed, adjust the individual compensation, compensation benchmark studies with Swiss-based multinational companies issued by external advisors are used (see “Executive Committee”, page 62). Positions are evaluated according to the Towers Watson Global Grading System (GGS). GGS builds on company criteria such as size, complexity, and geographic scope to assess the number of levels. Positions are evaluated in a two-step process of banding and grading: Banding places jobs in the framework based on how they contribute to the overall organization. Grading assesses jobs against standard factors. For further details, see www.towerswatson.com/assets/pdf/2815/TowersWatson-GGS-CM-Factsheet-NA-2011-19979.pdf.
Bonus (variable, performance-based, in cash) The annual target bonus corresponds to a percentage of the base annual salary (50% for the CEO, 30% or 35% for the other members of the Executive Committee; see footnote 1 of the table on page 63 for the changes coming into effect as of January 1, 2012). The actual bonus paid depends on the attainment of the agreed targets. 70% of these targets are of a financial nature (such as order intake, operating income, net income, and return on capital employed) and 30% are individual targets, which can be both qualitative and quantitative. For each of those targets, a target value as well as a lower and an upper target level are set. Depending on the level of achievement, a corresponding number of points is calculated. The sum of the points determines the payout ratio, which can be between zero and two and a half times the target bonus. No bonus at all is paid if the minimum target level is not reached. Exceptions to this policy may be defined by the Board of Directors in response to a proposal by the Nomination and Remuneration Committee (NRC). For the year 2011, no such exceptions were granted. The bonuses for 2011, which are assessed by the NRC and approved by the full Board, will be paid in March 2012. Ton Büchner, who left the company on October 31, 2011, received a bonus for 2011 of CHF 473 231 (which represents 60%1) of the fixed component). He also received an additional discretionary bonus in the amount of CHF 1.7 million for his outstanding contributions during his time with Sulzer. In addition, he received payments for unused vacation days of CHF 345 815. For the entire Executive Committee, the bonus paid represented 52%1) of the fixed component. The relationship between the bonus and the variable component of compensation reflects Sulzer’s high performance orientation. Further details can be found in the financial section under note 109 (pages 126 to 129).
Restricted stock unit plan (variable, fixed grant value, share-based remuneration) Sulzer has used a restricted stock unit plan (RSU plan) as a long-term performance incentive since 2009. Following a benchmarking analysis (PricewaterhouseCoopers: Executive Compensation Benchmark 2008) and in
consultation with PricewaterhouseCoopers and Mercer, the Board of Directors decided to replace the previous long-term option plan with an RSU plan starting in 2009. Each year, members of the Sulzer Management Group receive RSUs; the grant value of the RSUs depends on the respective management grade (for a definition of the Global Grading System, see “Base salary”). In 2011, it was reviewed using the Towers Watson Benchmark 2011. All senior managers with the same global grade receive the same number of RSUs. The number of RSUs granted is calculated by dividing the defined grant value per global grade by the volume-weighted average share price over the last ten trading days before the grant date. The RSUs are not definitively allocated when issued; instead, one-third of the units granted are vested every year. In the event that the employment is terminated, all options and RSUs that are unvested on the day the working relationship expires shall lapse. With the introduction of the performance share plan (see below) all members of the Executive Committee agreed to have their RSU values—compared with those granted in 2009—reduced for the years 2010 to 2012 (by two-thirds for the CEO and by one-third for all other Executive Committee members) and have these amounts invested into the performance share plan. In 2011, the RSU plan for the CEO represented 0%1) of the fixed component. For the entire Executive Committee, the RSU plan represented 26%1) of the fixed component. The relationship between the fixed component of compensation and the RSU plan reflects Sulzer’s strong emphasis on aligning the interests of the Executive Committee and the shareholders to create long-term shareholder value. Ton Büchner is entitled to receive the RSU that vested during his contractual notice period. All RSU with later vesting dates were, however, forfeited without compensation. Further details can be found in the financial section under note 109 (pages 126 to 129).
Performance share plan (variable, performance-based; share-based remuneration) Sulzer aims to further align the interests of the members of the Executive Committee with those of the shareholders and, particularly, to motivate the members of the Executive Committee to maintain the strong operational management of the company, while at the same time using balance sheet assets to make sound investments (primarily in the form of capital expenditures and acquisitions). Therefore, the full Board of Directors decided in 2010 to introduce a long-term performance share plan (PSP) for the members of the Executive Committee. The PSP is a one-time plan with a performance period of three years (see graphic on page 65). The plan was designed by the Nomination and Remuneration Committee with support from Towers Watson. The members of the Executive Committee will be measured on very ambitious targets with regard to (i) the cumulative adjusted net income, (ii) the total shareholder return (TSR), and (iii) the acquisition volume.
(i) Cumulative adjusted net income: The sum of the net income from 2010 to 2012 attributable to shareholders, adjusted by acquisition costs, integration costs, as well as effects related to business combinations (as introduced with IFRS 3 “Business Combinations”) over the performance period (January 1, 2010 – December 31, 2012). (ii) Total shareholder return (TSR): The share price growth plus dividends over the performance period. To calculate
1) Adjusted for all payments and disclosure requirements related to the departure of Ton Büchner. These include: an additional discretionary bonus of CHF 1.7 million, a payment for unused vacation days (CHF 345 815), and the negative Performance Share Plan value (minus CHF 666 667)—which was introduced to reverse the amount that was disclosed as positive value in the Sulzer Annual Report 2010 but entirely forfeited due to Ton Büchner’s departure.
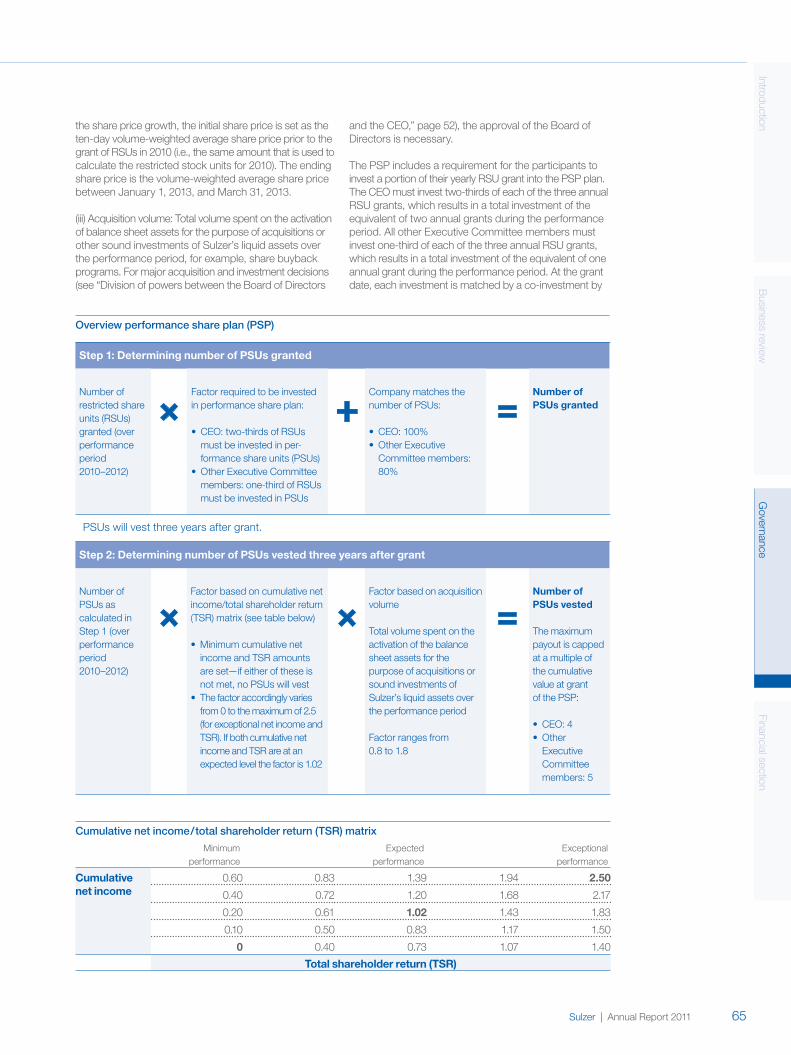
Overview performance share plan (PSP)
65Sulzer | Annual Report 2011
Business review
Governance
Financial sectionIntroductionthe share price growth, the initial share price is set as the ten-day volume-weighted average share price prior to the grant of RSUs in 2010 (i.e., the same amount that is used to calculate the restricted stock units for 2010). The ending share price is the volume-weighted average share price between January 1, 2013, and March 31, 2013.
(iii) Acquisition volume: Total volume spent on the activation of balance sheet assets for the purpose of acquisitions or other sound investments of Sulzer’s liquid assets over the performance period, for example, share buyback programs. For major acquisition and investment decisions (see “Division of powers between the Board of Directors
and the CEO,” page 52), the approval of the Board of Directors is necessary.
The PSP includes a requirement for the participants to invest a portion of their yearly RSU grant into the PSP plan. The CEO must invest two-thirds of each of the three annual RSU grants, which results in a total investment of the equivalent of two annual grants during the performance period. All other Executive Committee members must invest one-third of each of the three annual RSU grants, which results in a total investment of the equivalent of one annual grant during the performance period. At the grant date, each investment is matched by a co-investment by
Step 1: Determining number of PSUs granted
Number of restricted share units (RSUs) granted (over performance period 2010–2012)
Factor required to be invested in performance share plan:
• CEO: two-thirds of RSUs must be invested in per- formance share units (PSUs)
• Other Executive Committee members: one-third of RSUs must be invested in PSUs
Company matches the number of PSUs:
• CEO: 100%• Other Executive
Committee members: 80%
Number of PSUs granted
PSUs will vest three years after grant.
Step 2: Determining number of PSUs vested three years after grant
Number of PSUs as calculated in Step 1 (over performance period 2010–2012)
Factor based on cumulative net income/total shareholder return (TSR) matrix (see table below)
• Minimum cumulative net income and TSR amounts are set—if either of these is not met, no PSUs will vest
• The factor accordingly varies from 0 to the maximum of 2.5 (for exceptional net income and TSR). If both cumulative net income and TSR are at an expected level the factor is 1.02
Factor based on acquisition volume
Total volume spent on the activation of the balance sheet assets for the purpose of acquisitions or sound investments of Sulzer’s liquid assets over the performance period
Factor ranges from 0.8 to 1.8
Number of PSUs vested
The maximum payout is capped at a multiple of the cumulative value at grant of the PSP:
• CEO: 4• Other
Executive Committee members: 5
Cumulative net income / total shareholder return (TSR) matrix
Minimum performance
Expected performance
Exceptional performance
Cumulative net income
0.60 0.83 1.39 1.94 2.50
0.40 0.72 1.20 1.68 2.17
0.20 0.61 1.02 1.43 1.83
0.10 0.50 0.83 1.17 1.50
0 0.40 0.73 1.07 1.40
Total shareholder return (TSR)

66 Sulzer | Annual Report 2011
Compensation report
the company. The company matches 100% of the amount invested (and of the amount to be invested) of the CEO and 80% of the investments of the other Executive Committee members. The number of performance share units (PSUs) granted at the grant date is based on the number of RSUs shifted into the PSP and the company match divided by the volume-weighted average share price prior to the 2010 grant of RSUs. The PSP will result in a one-time payout by conversion of PSUs into shares on the vesting date (March 31, 2013). However, on the day when the entire award automatically vests, only 50% of the shares shall automatically be de-blocked (settlement possible in cash or shares). The remaining 50% of the shares shall be de-blocked on the first (30%) and second (20%) anniversary of the vesting date. The plan includes a significant leverage in the case of extraordinary performance over the three-year performance period. At vesting, the number of PSUs granted is multiplied by two factors (see graphic on page 65). The first factor is defined by a matrix that consists of the cumulative adjusted net income and the total shareholder return; it ranges from 0 to 2.5. The second factor is defined by the acquisition volume; it ranges from 0.8 to 1.8. Of the three PSP metrics (total shareholder return, cumulative adjusted net income, acquisition volume), the total shareholder return has the highest impact on the final vesting value, which reflects Sulzer’s strong emphasis on aligning the interests of the Executive Committee and the shareholders to create long-term shareholder value. The value vested is calculated by multiplying the final number of PSUs vested with the share price at March 31, 2013. The maximum payout is capped at four (for the CEO) to five (other members of the Executive Committee) times the total value at grant of the PSP, i.e., the total investment of the participant plus the company matching. Failure to achieve the minimum performance thresholds (i.e., the predetermined amounts of the cumulative net income and the ending share price) will result in a zero payout, meaning that the Executive Committee member will lose the entire investment (i.e., their RSU contribution) value at grant invested into the PSP including the respective company match amount. If a member of the Executive Committee terminates his employment during the performance period, all PSUs granted shall lapse. If Sulzer terminates the employment or the Executive Committee member without cause prior to the vesting date, the member shall be entitled to a monetary compensation reflecting the pro rata achievement under the PSP. For the entire Executive Committee (excluding Ton Büchner, who lost all his PSUs due to his leaving), the PSUs represented 27%1) of the fixed component in 2011.The relationship between the fixed component of compensation and the PSP reflects Sulzer’s strong emphasis on aligning the interests of the Executive Committee and the shareholders to create long-term shareholder value and profitable growth. Further details can be found in the financial section under note 109 (pages 126 to 129).
The former CEO Ton Büchner left the company as per October 31, 2011. He received the base remuneration for the first ten months, a pro rata bonus, and an additional discretionary bonus. Additionally, he is entitled to the RSUs that vest within the contractual notice period. He lost all RSUs that vest thereafter as well as all PSP units. For details, see financial section under note 109 on pages 126 to 129. Jürgen Brandt, ad interim CEO as of November 1, 2011, and CFO since November 1, 2010, has participated as CFO on a pro rata basis in the PSP as of 2011.
Apart from the additional discretionary bonus granted to Ton Büchner (see above), no severance payments to members of the Executive Committee were made during the reporting year. The employment contracts of the Executive Committee members make no provision for unusually long notice periods or contract terms. However, Executive Committee members who joined the Executive Committee prior to April 2009 were given the right to compensation if an employment contract is terminated within 18 months after a change of control or in the event of a considerable change to a member’s function. This compensation consists of the base salary plus the target bonus plus 10% of the base salary for one year. The Board of Directors has undertaken this measure in the interests of the company. Furthermore, if there is a change of control (for members of the Executive Committee, including the replacement of the majority of the members of the Board of Directors) or a public takeover bid that is not supported by the Board of Directors, all allocated options of the option plan and RSUs of the RSU plan are automatically vested.
All other information on compensation (including that of the CEO and the Executive Committee as a whole) can be found in the financial section under note 32 (pages 108 to 110) and note 33 (page 111) as well as in the financial statements of Sulzer Ltd under note 109 (pages 126 to 129).
1) Adjusted for all payments and disclosure requirements related to the departure of Ton Büchner. These include: an additional discretionary bonus of CHF 1.7 million, a payment for unused vacation days (CHF 345 815), and the negative Performance Share Plan value (minus CHF 666 667)—which was introduced to reverse the amount that was disclosed as positive value in the Sulzer Annual Report 2010 but entirely forfeited due to Ton Büchner’s departure.

Financial sectionB
usiness reviewG
overnanceIntroduction
67Sulzer | Annual Report 2011
Financial section
Consolidated financial statements
Sulzer achieved a net income attributable to shareholders of Sulzer Ltd of CHF 279.8 million. The capital structure remains solid with an equity ratio of 46.2%.
Consolidated financial statementsConsolidated income statement 68Consolidated statement of comprehensive income 68Consolidated balance sheet 69Consolidated statement of changes in equity 70Consolidated statement of cash flows 71Corporate accounting principles 72 Notes to the consolidated financial statements01 Significant changes in the scope of consolidation 8502 Major currency exchange rates 8703 Segment information 8804 Segment information by geographical region 9005 Personnel expenses 9006 Employee benefit plans 9107 Research and development expenses 9308 Other operating income and expenses 9309 Financial income and expenses 9410 Income taxes 9511 Intangible assets 9712 Property, plant and equipment 9813 Other financial assets 10014 Inventories 10015 Percentage of completion contracts 10116 Trade accounts receivable 10117 Other accounts receivable and prepaid expenses 10218 Assets held for sale 10219 Cash and cash equivalents 10220 Marketable securities 10321 Pledged assets 10322 Share capital 10323 Earnings per share 10424 Borrowings 10425 Provisions 10526 Other current and accrued liabilities 10627 Derivative financial instruments 10628 Other financial commitments 10729 Contingent liabilities 10730 Cash flow from acquisitions 10731 Capital expenditure by category (unaudited) 10832 Share participation plans 10833 Transactions with members of the Board of Directors, Executive Committee, and related parties 11134 Auditor remuneration 11135 Corporate risk management process 11136 Subsequent events after the balance sheet date 11237 Major subsidiaries 113
Auditors’ report 117
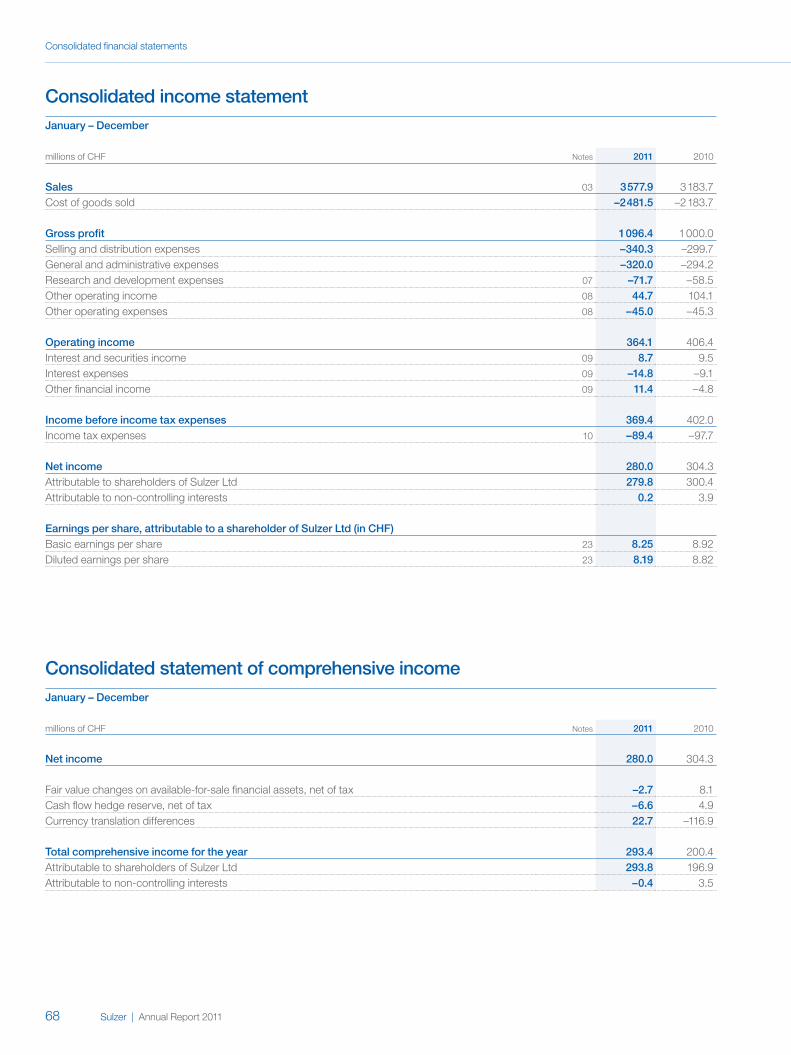
Consolidated financial statements
68 Sulzer | Annual Report 2011
Consolidated income statementJanuary – December
millions of CHF Notes 2011 2010
Sales 03 3 577.9 3 183.7Cost of goods sold –2 481.5 –2 183.7
Gross profit 1 096.4 1 000.0Selling and distribution expenses –340.3 –299.7General and administrative expenses –320.0 –294.2Research and development expenses 07 –71.7 –58.5Other operating income 08 44.7 104.1Other operating expenses 08 –45.0 –45.3
Operating income 364.1 406.4Interest and securities income 09 8.7 9.5Interest expenses 09 –14.8 –9.1Other financial income 09 11.4 –4.8
Income before income tax expenses 369.4 402.0Income tax expenses 10 –89.4 –97.7
Net income 280.0 304.3Attributable to shareholders of Sulzer Ltd 279.8 300.4Attributable to non-controlling interests 0.2 3.9
Earnings per share, attributable to a shareholder of Sulzer Ltd (in CHF)
Basic earnings per share 23 8.25 8.92Diluted earnings per share 23 8.19 8.82
Consolidated statement of comprehensive incomeJanuary – December
millions of CHF Notes 2011 2010
Net income 280.0 304.3
Fair value changes on available-for-sale financial assets, net of tax –2.7 8.1Cash flow hedge reserve, net of tax –6.6 4.9Currency translation differences 22.7 –116.9
Total comprehensive income for the year 293.4 200.4Attributable to shareholders of Sulzer Ltd 293.8 196.9Attributable to non-controlling interests –0.4 3.5

Financial sectionB
usiness reviewG
overnanceIntroduction
Consolidated financial statements
69Sulzer | Annual Report 2011
Consolidated balance sheetDecember 31
millions of CHF Notes 2011 2010
Non-current assetsIntangible assets 11 1 435.2 629.0Property, plant and equipment 12 619.5 531.6Other financial assets 13 36.2 35.9Non-current receivables 12.2 8.8Deferred income tax assets 10 100.1 90.3Total non-current assets 2 203.2 1 295.6
Current assetsInventories 14 675.4 533.8Advance payments to suppliers 83.1 80.3Trade accounts receivable 16 1 020.3 718.3Other accounts receivable and prepaid expenses 17 126.8 179.2Assets held for sale 18 0.9 3.7Marketable securities 20 8.1 12.7Cash and cash equivalents 19 422.6 668.1Total current assets 2 337.2 2 196.1
Total assets 4 540.4 3 491.7
EquityShare capital 22 0.3 0.3Reserves 2 097.5 1 894.7Equity attributable to shareholders of Sulzer Ltd 2 097.8 1 895.0Non-controlling interests 6.0 6.2Total equity 2 103.8 1 901.2
Non-current liabilitiesLong-term borrowings 24 531.4 44.2Deferred income tax liabilities 10 133.0 66.1Non-current income tax liabilities 10 12.8 22.2Non-current provisions 25 223.8 214.3Other non-current liabilities 1.1 1.3Total non-current liabilities 902.1 348.1
Current liabilitiesShort-term borrowings 24 236.2 83.8Current income tax liabilities 10 49.5 36.8Current provisions 25 171.3 155.7Trade accounts payable 386.0 285.2Customers’ advance payments 272.2 277.9Other current and accrued liabilities 26 419.3 403.0Total current liabilities 1 534.5 1 242.4Total liabilities 2 436.6 1 590.5
Total equity and liabilities 4 540.4 3 491.7

Consolidated financial statements
70 Sulzer | Annual Report 2011
Consolidated statement of changes in equityJanuary – December
Attributable to shareholders of Sulzer Ltd
millions of CHF Notes
Share capital
Retained earnings
Treasury stock
Cash flow hedge
reserve
Available-for-sale
financial assets
Currency translation
adjustment Total
Non-controlling
interestsTotal
equity
Equity as of January 1, 2010 0.3 2 017.9 –98.7 3.5 19.0 –164.5 1 777.5 11.4 1 788.9
Comprehensive income for the year:Net income 300.4 300.4 3.9 304.3Cash flow hedges, net of tax 4.9 4.9 4.9Fair value changes on available-for-sale financial assets, net of tax 8.1 8.1 8.1Currency translation differences –116.5 –116.5 –0.4 –116.9
Total comprehensive income for the year – 300.4 – 4.9 8.1 –116.5 196.9 3.5 200.4Addition/deduction of non-controlling interests – –0.5 –0.5Changes in ownership in subsidiaries without loss of control –14.7 –14.7 –3.6 –18.3Change in treasury shares 1.4 21.8 23.2 23.2Share-based payments 32 8.0 8.0 8.0Dividend –95.9 –95.9 –4.6 –100.5Equity as of December 31, 2010 22 0.3 2 217.1 –76.9 8.4 27.1 –281.0 1 895.0 6.2 1 901.2
Comprehensive income for the year:Net income 279.8 279.8 0.2 280.0Cash flow hedges, net of tax –6.6 –6.6 –6.6Fair value changes on available-for-sale financial assets, net of tax –2.7 –2.7 –2.7Currency translation differences 23.3 23.3 –0.6 22.7
Total comprehensive income for the year – 279.8 – –6.6 –2.7 23.3 293.8 –0.4 293.4Addition/deduction of non-controlling interests – 3.1 3.1Changes in ownership in subsidiaries without loss of control 1.3 1.3 0.7 2.0Change in treasury shares –12.6 12.6 – –Share-based payments 32 10.5 10.5 10.5Dividend –102.8 –102.8 –3.6 –106.4Equity as of December 31, 2011 22 0.3 2 393.3 –64.3 1.8 24.4 –257.7 2 097.8 6.0 2 103.8

Financial sectionB
usiness reviewG
overnanceIntroduction
Consolidated financial statements
71Sulzer | Annual Report 2011
Consolidated statement of cash flowsJanuary – December
millions of CHF Notes 2011 2010
Cash and cash equivalents as of January 1 668.1 730.6
Cash flow from operating activitiesNet income 280.0 304.3Interest and securities income 09 –8.7 –9.5Interest expenses 09 14.8 9.1Income tax expenses 10 89.4 97.7Depreciation/amortization 118.7 104.6Changes in inventories –78.2 –53.3Changes in advance payments to suppliers –1.5 –22.1Changes in trade accounts receivable –229.4 –51.2Changes in advance payments from customers –7.1 –12.6Changes in trade accounts payable 84.5 54.4Changes in provisions 12.0 –37.0Changes in other net current assets 24.5 33.2Other non-cash items –0.6 45.1Interest received 8.6 8.5Interest paid –6.6 –6.0Income tax paid –93.7 –153.5Income from disposals of subsidiaries and property, plant and equipment –18.1 –57.5Total cash flow from operating activities 188.6 254.2
Cash flow from investing activitiesPurchase of intangible assets 11 –1.8 –1.6Sale of intangible assets 0.1 0.4Purchase of property, plant and equipment 12 –111.4 –116.5Sale of property, plant and equipment 6.8 13.0Acquisitions 30 –864.5 –198.0Divestitures 49.1 84.5Purchase of financial assets –0.6 –Sale of financial assets 1.0 2.5Purchase of marketable securities –7.5 –13.5Sale of marketable securities 11.2 37.2Total cash flow from investing activities –917.6 –192.0
Cash flow from financing activitiesDividend –102.0 –94.6Purchase/sale of treasury stock –12.2 –1.9Dividend to non-controlling interests –3.6 –2.8Changes in non-controlling interests –2.7 –13.3Additions in long-term borrowings 506.7 1.9Repayment of long-term borrowings –1.7 –25.0Changes in short-term borrowings 114.7 39.7Total cash flow from financing activities 499.2 –96.0
Exchange gains/losses on cash and cash equivalents –15.7 –28.7
Net change in cash and cash equivalents –245.5 –62.5
Cash and cash equivalents as of December 31 19 422.6 668.1

72 Sulzer | Annual Report 2011
requirement in the statement of changes in equity; IAS 27 specification of the transition requirements for amendments arising as a result of IAS 27 (revised); IAS 34 further clarification of disclosing events in interim periods; and IFRIC 13 definition of fair value measurement of award credits. These amendments became mandatory for the corporation’s 2011 consolidated financial statements, and did not have any material impact on the consolidated financial statements.
b) Standards, amendments, and interpretations which the corporation has decided not to early adopt in 2011• IAS 19 Employee benefits was amended in June 2011. With the
amendment, the option to apply the corridor method is removed and actuarial gains and losses as well as past service costs are recognized when they occur. Furthermore, interest costs and expected return on plan assets are replaced by a net interest amount that is calculated by applying the discount rate to the net defined benefit liability (asset). The amendment will become mandatory for the corporation’s 2013 financial statements. The impact on the balance sheet is disclosed in note 06.
• IFRS 9 Financial instruments, addresses the classification, measurement, and recognition of financial assets and financial liabilities. IFRS 9 replaces the parts of IAS 39 that relate to the classification and measurement of financial instruments. IFRS 9 requires financial assets to be classified into those measured as at fair value and those measured at amortized cost. The determination is made at initial recognition. For financial liabilities, the standard retains most of the IAS 39 requirements. The main change is that, in cases where the fair value option is taken for financial liabilities, the part of a fair value change due to an entity’s own credit risk is recorded in other comprehensive income rather than the income statement, unless this creates an accounting mismatch. IFRS 9 will become mandatory for the corporation’s 2013 financial statements. IFRS 9 is not expected to have a material impact on the consolidated financial statements.
• IFRS 10 Consolidated financial statements builds on existing principles by identifying the concept of control as the determining factor in whether an entity should be included within the consolidated financial statements of the parent company. The corporation is currently assessing the full impact of IFRS 10, which will become mandatory for the corporation’s 2013 financial statements.
• IFRS 12 Disclosures of interests in other entities includes the disclosure requirements for all forms of interests in other entities, including joint arrangements, associates, special purpose vehicles, and other off-balance-sheet vehicles. IFRS 12 will become mandatory for the corporation’s 2013 financial statements. The corporation will assess the full impact of IFRS 12.
• IFRS 13 Fair value measurement, aims to improve consistency and reduce complexity by providing a precise definition of fair value and a single source of fair value measurement and disclosure requirements for use across IFRSs. The requirements do not extend the use of fair value accounting but provide guidance on how it should be applied where its use is already required or permitted by other standards within IFRSs or US GAAP. It is unlikely that IFRS 13 will have a material impact on the corporation’s financial statements.
There are no other IFRSs or IFRIC interpretations that are not yet effective that would be expected to have a material impact on the corporation.
c) Standards, amendments, and interpretations effective in 2011 but not relevantThe following standards, amendments, and interpretations are mandatory for accounting periods beginning on or after January 1,
1 General informationSulzer Ltd (the “company”) is a company domiciled in Switzerland. The address of the company’s registered office is Zürcherstrasse 14 in Winterthur, Switzerland. The consolidated financial statements as at and for the year ended December 31, 2011, comprise the company and its subsidiaries (together referred to as the “corporation” and individually as the “subsidiaries”) and the corporation’s interest in associates and jointly controlled entities. The corporation is mainly active in the machinery and equipment, the surfacing technology business, and associated services. Sulzer was founded in 1834 in Winterthur, Switzerland, and employs some 17 000 people in over 170 locations worldwide.
The company is listed on the SIX Swiss Exchange in Zurich, Switzerland (symbol: SUN).
These consolidated financial statements were authorized for issue by the Board of Directors on February 14, 2012.
2 Key accounting policies and valuation methods2.1 Basis of preparationThe consolidated financial statements have been prepared in accordance with International Financial Reporting Standards (IFRS) using the historical cost convention except for the following:• financial instruments at fair value through profit or loss are
measured at fair value (incl. derivative financial instruments),• available-for-sale financial instruments are measured at fair value,• liabilities for cash-settled share-based payments are measured
at fair value.
The accounting policies set out below have been applied consistently to all periods presented in these consolidated financial statements and have been applied consistently by subsidiaries.
The preparation of financial statements in conformity with IFRS requires the use of certain critical accounting estimates. It also requires management to exercise its judgment in the process of applying the corporation’s accounting policies. The areas involving a higher degree of judgment or complexity or areas where assumptions and estimates are significant to the consolidated financial statements are disclosed in section 4 “Critical accounting estimates and judgments.”
2.2 Change in accounting policiesa) Standards, amendments, and interpretations to published standards effective in 2011• IAS 24 (revised) Related Party Disclosures reduces or eliminates
alternatives, redundancies, and conflicts within the existing standard. The revised standard clarifies and simplifies the definition of a related party and removes the requirement for government-related entities to disclose details of all transactions with the government and other government-related entities. The revised IAS 24 did not have any material impact on the corporation’s consolidated financial statements.
• Prepayments of a minimum funding requirement (amendment to IFRIC 14). Without the amendment, entities are not permitted to recognize as an asset some voluntary prepayments for minimum funding contributions. The amendment became mandatory for the corporation’s 2011 consolidated financial statements.
• There were a number of minor amendments, which were part of the IASB’s annual improvement project published in May 2010. Such amendments were: IFRS 1 clarification of treatment of accounting policy changes in the first year and the revaluation basis as deemed cost; IFRS 3 definition of the transitional requirements for contingent considerations and the measurement of non-controlling interests; IFRS 7 clarification of the disclosures required and scopes out IFRS 3 business combinations; IAS 1 clarification of the disclosure
Corporate accounting principles

Financial sectionB
usiness reviewG
overnanceIntroduction
73Sulzer | Annual Report 2011
Corporate accounting principles
2011, but are not relevant to the corporation’s operations:• IFRIC 19 Extinguishing financial liabilities with equity instruments
addresses the accounting by an entity when the terms of a financial liability are renegotiated and result in the entity issuing equity instruments to a creditor of the entity to extinguish all or part of the financial liability. The interpretation did not have any impact on the corporation’s consolidated financial statements.
• Classification of rights issues (amendment to IAS 32). The amendment became mandatory for the corporation’s 2011 consolidated financial statements. The amendment addresses the accounting for rights issues that are denominated in a currency other than the functional currency of the issuer. Provided certain conditions are met, such rights issues are now classified as equity regardless of the currency in which the exercise price is denominated. Previously, these issues had to be accounted for as derivative liabilities. The amendment did not have any impact on the corporation’s consolidated financial statements 2011.
2.3 Consolidationa) SubsidiariesSubsidiaries are all entities (including special purpose entities) over which the corporation has the power to govern the financial and operating policies generally accompanying a shareholding (voting rights) of more than 50% or otherwise controls the company’s activities directly or indirectly, by applying the full consolidation method. Changes in the scope of consolidation take effect from the date on which control was transferred. The consolidation of equity has been carried out according to the purchase method. The accounting policies of subsidiaries have been changed to align them with the policies adopted by the corporation.
The purchase method of accounting is used to account for the acquisition of subsidiaries by the corporation. The cost of an acquisition is measured at the fair value of the assets given, equity instruments issued, and liabilities incurred or assumed at the date of exchange, plus costs directly attributable to the acquisition. Identifiable assets acquired and liabilities and contingent liabilities assumed in a business combination are measured initially at their fair values at the acquisition date, irrespective of the extent of any non-controlling interest. The excess of the cost of acquisition over the fair value of the corporation’s share of the identifiable net assets acquired is recorded as goodwill. If the cost of acquisition is less than the fair value of the net assets of the subsidiary acquired, the difference is recognized directly in the income statement.
b) Changes in ownership interests in subsidiaries without change of controlTransactions with non-controlling interests that do not result in loss of control are accounted for as equity transactions – that is, as transactions with the owners in their capacity as owners. The difference between fair value of any consideration paid and the relevant share acquired of the carrying value of net assets of the subsidiary is recorded in equity. Gains or losses on disposals to non-controlling interests are also recorded in equity.
c) Associates and jointly controlled entitiesAssociates are those entities in which the corporation has significant influence, but not control, over the financial and operating policies. Significant influence is presumed to exist when the corporation holds, directly or indirectly, between 20% and 50% of the voting rights. Joint ventures are those entities over whose activities the corporation has joint control, established by contractual agreement and requiring unanimous consent for strategic financial and operating decisions. Associates and jointly controlled entities are accounted for using the equity method and are initially recognized at cost.
d) Transactions eliminated on consolidationAll material intercompany transactions and balances and any unrealized gains or losses arising from intercompany transactions are eliminated in preparing the consolidated financial statements. A summary of the major subsidiaries or affiliated entities is shown in note 37, “Major subsidiaries.”
2.4 Segment reportingOperating segments are reported in a manner consistent with the internal reporting provided to the Chief Executive Officer. The Chief Executive Officer, who is responsible for allocating resources and assessing performance (e.g., operating income) of the operating segments, has been identified as the steering committee that makes strategic decisions. The operating segments for Sulzer are shown in note 03, “Segment information.”
Operating assets and liabilities are assets or liabilities related to the operating activities of an entity and contributing to the operating income once transferred or recorded in the income statement. Capital employed is defined to be the average net operating assets of the corporation over the period.
2.5 Foreign currency translationa) Functional and presentation currencyItems included in the financial statements of affiliated companies are measured using the currency of the primary economic environment in which the entity operates (the functional currency). The consolidated financial statements are presented in Swiss francs (CHF), which is the functional and presentation currency of Sulzer Ltd.
b) Transactions and balancesForeign currency transactions are translated into the functional currency using the exchange rates prevailing at the dates of the transactions. Foreign exchange gains and losses resulting from the settlement of such transactions and from the translation at year-end exchange rates of monetary assets and liabilities denominated in foreign currencies are recognized in the income statement, except when deferred in equity as qualifying cash flow hedges and qualifying net investment hedges.
Changes in the fair value of monetary items denominated in foreign currency classified as available-for-sale are analyzed between translation differences resulting from changes in the amortized cost of the item and other changes in the carrying amount of the item. Translation differences related to changes in the amortized costs are recognized in profit or loss and other changes in the carrying amount are recognized in equity.
Translation differences on non-monetary financial assets and liabilities are reported as part of the fair value gain or loss. Translation differences on non-monetary financial assets and liabilities such as equities held at fair value through profit or loss are recognized in profit or loss as part of the fair value gain or loss. Translation differences on non-monetary financial assets such as equities classified as available-for-sale are included in the available-for-sale reserve in equity.
c) SubsidiariesThe results and financial position of all the subsidiaries (excluding the ones with hyperinflationary economy) that have a functional currency different from the presentation currency of the corporation are translated into the presentation currency as follows:• assets and liabilities for each balance sheet presented are
translated at the closing rate at the date of that balance sheet,• income and expenses for each income statement are
translated at average exchange rates.

74 Sulzer | Annual Report 2011
Corporate accounting principles
Translation differences resulting from consolidation are taken to equity. In the event of a sale or liquidation of foreign affiliated companies, exchange differences that were recorded in equity are recognized in the income statement as part of the gain or loss on sale or liquidation.
2.6 Intangible assetsAn intangible asset is classified either as an asset with indefinite useful life when timely limitation of generating net cash inflows is not foreseeable, or as an asset with a finite useful life.
Intangible assets with an indefinite useful life are not to be amortized. The corporation performs an annual review determining whether events and circumstances still support this measurement. Reassessing the useful life indicates that an asset might be impaired.
The intangible assets with finite useful life are amortized in line with expected useful life, usually on a straight-line basis. The period of useful life is to be assessed according to business rather than legal criteria. This assessment is made at least once a year. An impairment might be required in the event of sudden or unforeseen value changes.
a) GoodwillGoodwill represents the difference between the cost of acquiring a business and the fair value of the corporation’s share in the identifiable net asset value of the acquired business at the time of acquisition. Any goodwill arising as a result of a company acquisition is included within intangible assets.
Goodwill originating from the acquisition of an associated company is included in the book value of the participation in associated companies. Goodwill is subject to an annual impairment test and valued at its original acquisition cost less accumulated impairment losses. Profits and losses arising from the sale of a business include the book value of the goodwill assigned to the business being sold.
Goodwill is allocated to the lowest cash-generating units reported to the chief operating decision maker (CEO) for the purpose of impairment testing. The allocation is made to those cash-generating units or groups of cash-generating units that are expected to benefit from the business combination in which the goodwill arose.
b) Trademarks and licensesOther intangible assets include material licenses, patents, trademarks, and similar rights acquired from third parties. Such assets are amortized over their expected useful life, generally not exceeding ten years. Minor purchases of patents, licenses, trademarks, and similar rights and any related internally generated intangibles are expensed as incurred.
c) Research and development expensesDevelopment costs for major projects are only capitalized and amortized over the period of use if required criteria are met. Other research and development expenses are charged directly to income as incurred.
d) Computer softwareAcquired computer software licenses are capitalized on the basis of the cost incurred to acquire and bring to use the specific software. These costs are amortized over their estimated useful lives (three to max. five years).
e) Customer relationshipsAs part of a business combination, acquired customer rights are recorded at fair value (cost at the time of acquisition). These costs are amortized over their estimated useful lives, generally not exceeding 15 years.
f) Other intangible assetsOther intangible assets comply with the general requirements for intangible assets but cannot be classified in another category as defined above. Such intangible assets are stated on the basis of costs incurred and are amortized over their estimated useful lives, generally not exceeding ten years.
2.7 Property, plant and equipmentProperty, plant and equipment is stated at acquisition cost less operationally required depreciation and impairments. Acquisition cost includes expenditure that is directly attributable to the acquisition of the item. Subsequent costs are included in the asset’s carrying amount or recognized as a separate asset, as appropriate, only when it is probable that the future economic benefits associated with the item will flow to the corporation and the cost of the item can be measured reliably. The carrying amount of the replaced item is derecognized. All other repairs and maintenance are charged to the income statement during the financial period in which they are incurred.
Depreciation is provided on a straight-line basis over the estimated useful life. Land is stated at cost and is not depreciated. The useful lives are as follows:
Buildings 20–50 yearsMachinery 5–15 yearsTechnical equipment 5–10 yearsVehicles maximum 4 yearsOther equipment maximum 5 years
Property, plant and equipment financed by long-term financial leases is capitalized and amortized in the same way as other assets. The applicable leasing commitments are shown as liabilities and are included under long-term borrowings. Substantial appreciations are also capitalized and amortized over the useful lives of the assets.
An asset’s carrying amount is impaired immediately to its recoverable amount if the asset’s carrying amount is greater than its estimated recoverable amount.
2.8 Impairment of non-financial assetsAssets with an indefinite useful life are not depreciated under a fixed schedule, but assessed annually for impairment. Assets depreciated under a fixed schedule are only assessed for impairment if relevant events or changes in circumstances indicate that the book value is no longer recoverable. An impairment loss is recorded equal to the excess of the carrying value over the recoverable amount. The recoverable amount is the higher of the fair value of the asset less disposal costs and its value in use. The value in use is based on the estimated cash flow over at least a five-year period and the extrapolated projections for subsequent years. The results are discounted using an appropriate long-term interest rate. For the purposes of the impairment test, assets are grouped together at the lowest level for which separate cash flows can be identified (cash-generating units).

Financial sectionB
usiness reviewG
overnanceIntroduction
75Sulzer | Annual Report 2011
Corporate accounting principles
method. Gains or losses arising from changes in the fair value of the financial assets at fair value through profit or loss are presented in the income statement line “Other financial income” in the period they arise. Dividend income from financial assets at fair value through profit or loss is recognized in the income statement as part of financial income.
Changes in the fair value of monetary securities denominated in a foreign currency and classified as available-for-sale are analyzed between translation differences resulting from changes in amortized cost and other changes in the carrying amount. The translation differences on monetary items are recorded in the income statement, the translation differences on non-monetary items are recorded in equity. Changes in the fair value of financial assets classified as available-for-sale are recorded in equity. When these assets are sold or impaired, the accumulated fair value adjustments recorded in equity are recycled and booked to the financial income.
2.10 Derivative financial instruments and hedging activitiesThe corporation uses hedge accounting mainly for so-called “cash flow hedges” and “net investment hedges.” Cash flow hedges are used to secure future cash flows which have a high probability of occurrence. The hedge instrument is recorded on the balance sheet at fair value and the effective portions are booked against “Equity” in the column “Financial instruments.” If the hedge relates to a non-financial transaction which will subsequently be recorded on the balance sheet, the adjustments cumulated under “Equity” at that time will be included in the initial book value of the asset or liability. In all other cases the cumulative changes of fair value of the hedging instrument that have been recorded in equity are included as a charge or credit to income when the forecasted transaction is recognized or when hedge accounting is discontinued as the criteria are no longer met. In general, the fair value of financial instruments traded in active markets is based on quoted market prices at the balance sheet date. Hedges of net investments in foreign operations are accounted for similarly to cash flow hedges. Any gain or loss on the hedging instrument relating to the effective portion on the hedge is recognized in equity. The gain or loss relating to the ineffective portion is recognized immediately in the income statement. Gains and losses accumulated in equity are included in the income statement when the foreign operation is partially disposed or sold.
The corporation documents at the inception of the transaction the relationship between hedging instruments and hedged items, as well as its risk management objectives and strategy for undertaking various hedging transactions. The corporation also documents its assessment, both at hedge inception and on an ongoing basis, of whether the derivatives that are used in hedging transactions are highly effective in offsetting changes in fair values or cash flows of hedged items.
2.11 InventoriesRaw materials, supplies, and consumables are stated at the lower of cost or net realizable value. Finished products and work in progress are stated at the lower of production cost or net realizable value. Production cost includes the costs of materials, direct and indirect manufacturing costs, and contract related costs of construction. Inventories are valued by reference to weighted average costs. Provisions are made for slow-moving and excess inventories.
2.12 Trade receivablesTrade and other accounts receivable are stated at face value less provision for impairments. The respective value corresponds approximately to the amortized cost. A provision for impairment of trade receivables is established when there is objective evidence that the
2.9 Financial assetsFinancial assets, including marketable securities, are classified into the following four categories: “financial assets at fair value through profit or loss,” “available-for-sale financial assets,” “loans and receivables,” and “held-to-maturity financial assets.” Classification depends on the purpose for which the financial assets were acquired. Management determines the classification of assets at the date of purchase and reviews it on every accounting date. The fair value of financial instruments is either taken from an actively traded market or, in the case of non-traded financial instruments, from a valuation using standard formula-based methods. The marketable securities held by the corporation belong either to the first or the second category.
a) Financial assets at fair value through profit or lossAssets in this category are capitalized at fair value and subsequently adjusted to fair values, with any adjustments charged or credited to financial income. Derivative financial instruments are recorded at fair value (cost at the time of acquisition) and subsequently adjusted to fair values. Financial assets designated at fair value from inception are those that are managed and their performance is evaluated on a fair value basis, in accordance with a documented investment strategy. With the exception of derivative financial instruments that meet the requirements of a “cash flow hedge” or a “net investment hedge,” all adjustments are charged or credited to financial income. Assets in this category are classified as current assets.
b) Available-for-sale financial assetsAvailable-for-sale financial assets are non-derivatives that are either designated in this category or not in any of the other categories. They are included in non-current assets unless management intends to dispose of the investment within 12 months of the balance sheet date.
c) Loans and receivablesLoans and receivables are non-derivative financial assets with fixed or determinable payments that are not quoted in an active market. They are included in the current assets, unless the maturity is greater than 12 months after the balance sheet date. These are classified as non-current assets. Loans and receivables are classified as trade and other receivables in the balance sheet.
d) Held-to-maturity financial assetsNon-derivative financial assets with fixed or determinable payment terms and fixed maturities are classified as held to maturity when there is the positive intention and ability to hold to maturity. After initial recognition held-to-maturity investments are measured at amortized cost using the effective interest method. Gains and losses are recognized in profit or loss when the investments are derecognized or impaired, as well as through the amortization process.
Purchases and disposals of financial assets are recognized on the trade date. The corporation assesses at each balance sheet date whether there is objective evidence that a financial asset or group of financial assets is impaired. Investments are initially recognized at fair value plus transaction costs for all financial assets not carried at fair value through profit or loss. Financial assets carried at fair value through profit or loss are initially recognized at fair value and transaction costs are expensed in the income statement. Financial assets are derecognized when the right to receive cash flows from the investments has expired or has been transferred and the corporation has transferred all substantial risks and rewards of ownership. Available-for-sale financial assets and financial assets at fair value through profit or loss are subsequently carried at fair value. Loans and receivables and held-to-maturity financial assets are carried at amortized cost using the effective interest

76 Sulzer | Annual Report 2011
Corporate accounting principles
corporation will not be able to collect all the amounts due according to the original payment terms of the receivables. Significant financial difficulties of the debtor, probability that the debtor will enter bankruptcy or financial reorganization, and default or delinquency in payments are considered indicators that the trade receivable is impaired. Receivables that are past due more than 120 days are subject to regular review and adequate impairment is considered. The amount of the impairment provision is the difference between the carrying amount and the present value of estimated future cash flows, discounted at the original effective interest rate. An impairment charge is booked within selling and marketing expenses in the income statement and the carrying amount of the trade receivable is deducted through an allowance account. When a trade receivable is uncollectible, it is written off against the allowance account for trade receivables. Any subsequent recoveries of amounts previously written off are credited against selling and marketing costs in the income statement.
2.13 Cash and cash equivalentsCash and cash equivalents comprises bills, postal giro, and bank accounts, together with other short-term highly liquid investments with original maturities of three months or less. Bank overdrafts are reported within borrowings in the current liabilities.
2.14 Share capitalOrdinary shares are classified as equity. Incremental costs directly attributable to the issue of ordinary shares and share options are recognized as a deduction from equity, net of any tax effects.
When share capital recognized as equity is repurchased, the amount of the consideration paid, which includes directly attributable cost, is net of any tax effects and is recognized as a deduction from equity. Repurchased shares are classified as treasury shares and are presented as a deduction from total equity. When treasury shares are sold or reissued subsequently, the amount received is recognized as an increase in equity and the resulting surplus or deficit on the transaction is transferred to/from retained earnings.
2.15 Trade payablesTrade payables and other payables are stated at face value. The respective value corresponds approximately to the amortized cost.
2.16 BorrowingsFinancial debt is stated at fair value when initially recognized, after recognition of transaction costs. In subsequent periods, it is valued at amortized cost. Any difference between the amount borrowed (after deduction of transaction costs) and the repayment amount is reported in the income statement over the duration of the loan using the effective interest method. Borrowings are classified as current liabilities unless the corporation has an unconditional right to defer settlement of the liability for at least 12 months after the balance sheet date.
2.17 Current and deferred income taxesThe current income tax charge is calculated on the basis of the tax laws enacted or substantively enacted at the balance sheet date in the countries where the corporation’s subsidiaries and associates operate and generate taxable income. The management periodically evaluates positions taken in tax returns with respect to situations in which applicable tax regulations are subject to interpretation and establishes provisions where appropriate on the basis of amounts expected to be paid to the tax authorities. The liability method is used to provide deferred taxes on all temporary differences between the tax base of assets and liabilities and their carrying amounts in the consolidated financial statements. Deferred taxes are valued by applying tax rates (and regulations) in force on the balance sheet date or any that have essentially
been legally approved and are expected to apply at the time when the deferred tax asset is realized or the deferred tax liability is settled.Deferred tax assets are applied to the extent that it is likely that a taxable profit will be available against which the temporary difference can be applied. Deferred tax liabilities arising as a result of temporary differences relating to investments in subsidiaries and associated companies are applied unless the corporation can control when temporary differences are reversed and it is unlikely that they will be reversed in the foreseeable future.
2.18 Employee benefitsa) Defined benefit plansThe liability recognized in the balance sheet in respect of defined benefit pension plans is the present value of the defined benefit obligation at the balance sheet date less the fair value of plan assets, together with adjustments for unrecognized actuarial gains or losses and past service costs. The defined benefit obligation is calculated annually by independent actuaries using the projected unit credit method. The present value of the defined benefit obligation is determined by discounting the estimated future cash outflows using interest rates of high-quality corporate bonds. Actuarial gains and losses arising from experience adjustments and changes in actuarial assumptions in excess of the greater of 10% of the value of plan assets or 10% of the defined benefit obligation are charged or credited to income over the employees’ expected average remaining working lives.
b) Defined contribution plansDefined contribution plans are defined to be pure savings plans, under which the employer makes certain contributions into a separate legal entity (fund) and does not have a legal or an extendible (constructive) liability to contribute any additional amounts in the event this entity does not have enough funds to pay out benefits. A “constructive” commitment exists when it can be assumed that the employer will voluntarily make additional contributions in order not to endanger the relationship with its employees. Company contributions to such plans are considered in the income statement as personnel expenses.
c) Other employee benefitsSome subsidiaries provide other post-employment benefits to their employees. Short-term benefits are payable within 12 months after the end of the period in which the employees render the related employee service. In the case of liabilities of a long-term nature, the discounting effects and employee turnover are to be taken into consideration. Provisions for other post employment employee benefits are reported as long-term provisions in category “Other employee benefits.”
In case of termination benefits (e.g., contributions on early retirement) the calculation of the provision is similar to the calculation for post-employment benefits. Obligations to employees arising from restructuring measures are included under the category “Restructuring provisions.”
d) Share-based compensationSulzer operates equity-settled and cash-settled share-based compensation plans. For the equity-settled share-based compensation plan, the fair value of the employee service received in exchange for the grant of the options is recognized as an expense. The total amount to be expensed over the vesting period is determined by reference to the fair value of the options granted, excluding the impact of any non-market vesting conditions (e.g., profitability and sales growth targets). At each balance sheet date, the entity reassesses its estimates of the number of options that are expected to be exercised. It recognizes the impact of the reassessment of original estimates, if any, in the income statement, and a corresponding adjustment to equity over the options is exercised. For cash-settled share-based payments, a liability equal to the proportion of the goods or service received is recognized at the current fair value
Financial sectionB
usiness reviewG
overnanceIntroduction
77Sulzer | Annual Report 2011
Corporate accounting principles
determined at each balance sheet date. Refer to note 32, “Share participation plans,” for further information.
2.19 ProvisionsProvisions for environmental restoration, restructuring cost, and legal claims are recognized when: the corporation has a present legal or constructive obligation as a result of past events; it is probable that an outflow of resources will be required to settle the obligation; and the amount has been reliably estimated. Restructuring provisions comprise lease termination penalties and employee termination payments. Provisions are not recognized for future operating losses. Where there is a number of similar obligations, the likelihood that an outflow will be required in settlement is determined by considering the class of obligation as a whole. A provision is recognized even if the likelihood of an outflow with respect to any one item included in the same class of obligations may be small.
Provisions are measured at the present value of the expenditures expected to be required to settle the obligation using a pretax rate that reflects current market assessments of the time value of money and the risks specific to the obligation. The increase in the provision due to the passage of time is recognized as interest expense.
2.20 Revenue recognitionRevenue comprises the fair value of the consideration received or receivable for the sale of goods and rendering of services in the ordinary course of the corporation’s activities. Revenue is shown net of value-added tax, returns, rebates, and discounts and after eliminating sales within the corporation. The corporation recognizes revenue when the amount of revenue can be reliably measured, when it is probable that future economic benefits will flow to the entity, and when specific criteria have been met.
a) Sale of goods/productsRevenue from the sale of goods/products derives in the ordinary course of business. Goods and products are described as ordinary when they are part of the official product range of the Sulzer organization. Goods and products are those items produced/engineered and/or purchased for resale. This includes standard products (off the rack) as well as (pre-)engineered or tailor-made products.
Revenue from the sale of goods is recognized when all of the below-stated conditions are fulfilled. The return rights of products and goods are also considered. The conditions for the recognition of revenue from sale of goods and products are as follows:• it is probable that any future economic benefit associated with
the revenue will flow to the entity,• the revenue can be measured reliably,• the cost incurred or to be incurred can be measured reliably,• the entity (seller) has transferred significant risks and rewards
of ownership to the buyer, and• the entity (seller) has retained neither continuing managerial
involvement nor effective control over the goods.
Revenue is recognized only when it is probable that it is collectible and measurable. Revenue can only be collectible when there is a binding sales agreement. Once revenue is recognized, any subsequent uncertainty about the collectability of the revenue is recognized as an expense/adjustment to the amount receivable rather than as an adjustment to revenue.
b) Rendering of servicesThe rendering of services involves an entity performing an agreed task for a customer. This service may involve asset maintenance;
professional services; and the construction, development, or customization of assets. Service contracts may be single-element, in which the entity renders one type of service, or multiple-element contracts that provide for the delivery of more than one service, or may include the delivery of goods as well as services. Services are often performed within the reporting period. The percentage of completion basis is applicable to such services, but the stage of completion increases from 0% to 100% within one accounting period.
Services that are provided over a period beyond the reporting period involve estimates. Revenue is then recognized according to the stage, or percentage, of completion of the contract. The method used to determine the stage of completion will depend on the nature of the contract. A consistent approach is taken to the revenue recognition of similar contracts.
Revenue from rendering of services is recognized by reference to the stage of completion of the transaction when the following conditions are cumulatively met:• the amount of revenue can be measured reliably,• the flow of economic benefits to the entity is probable,• the state of completion at the period end can be measured reliably, and• the cost incurred to date and the cost to completion can be
measured reliably.
c) Percentage of completion methodMajor long-term customer orders are reported using the percentage of completion method (PoC), based on the percentage of costs to date compared with the total estimated contract costs, contractual milestones, or performance. The income statement contains a share of sales, including an estimated share of profit, while the balance sheet includes the corresponding trade accounts receivable after adjustment for advance payments received. When it appears probable that the total costs of an order will exceed the expected income, the total amount of expected loss is recognized immediately in the income statement. The impact out of the percentage of completion orders on the consolidated income statement and balance sheet is shown in note 15, “Percentage of completion contracts.”
d) Other revenueRevenue from the use of entity assets by third parties yielding interest, royalties, and dividends in the form of:• interest charges for the use of cash or cash equivalents or amounts
due to the entity,• royalty charges for the use of long-term assets (e.g., patents,
trademarks, copyrights, and computer software) and• dividend distribution of profits to holders of equity investments
in proportion to their holdings of a particular class of capital.
Interest is recognized using the effective interest method. Royalties are recognized on an accrual basis in accordance with the substance of the relevant agreement. Dividends are recognized when the shareholder’s right to receive payment is established.
The earnings process is complete when all of the following have cumulatively occurred:• it is probable that economic benefits will flow to the entity,• revenue can be measured reliably.
2.21 Discontinuing operationsIn line with IFRS 5, Sulzer classifies operations as discontinuing if the criteria for “held for sale” classification have been met. This is the case if it is a major line of business, geographical area of operations or part thereof, and when there is a coordinated plan to dispose of a major line of business or geographical area of operations.

78 Sulzer | Annual Report 2011
Corporate accounting principles
2.22 Assets and disposal groups held for saleA non-current asset or a group of assets is classified as “held for sale” (IFRS 5) if its carrying amount will be recovered principally through a sale transaction rather than through continuing use. For this to be the case, the management must be committed to sell the assets, the assets must be actively marketed for sale, and the sale is expected to be completed within one year. A non-current asset or a group of assets classified as “held for sale” shall be measured at the lower of its carrying amount or fair value less selling cost.
2.23 Dividend distributionDividend distribution to the shareholders of Sulzer Ltd is resolved upon decision of the general assembly and will be paid in the same reporting period.
3 Financial risk management3.1 Financial risk factorsThe corporation’s activities expose it to a variety of financial risks: market risk (including currency risk, fair value interest rate risk, cash flow interest rate risk, and price risk), credit risk, and liquidity risk. The corporation’s overall risk management program focuses on the unpredictability of financial markets and seeks to minimize potential adverse effects on the corporation’s financial performance. The corporation uses derivative financial instruments to hedge certain risk exposures.
Risk management is carried out by a central treasury department (Corporate Treasury). Corporate Treasury identifies, evaluates, and hedges financial risks in close cooperation with the corporation’s affiliated companies. Principles for overall risk management, as well as policies covering specific areas, such as foreign exchange risk, interest rate risk, credit risk, use of derivative financial instruments and non-derivative financial instruments, and investment of excess liquidity exist in writing.
(a) Market risk(i) Foreign exchange riskThe corporation operates internationally and is exposed to foreign exchange risk arising from various currency exposures, primarily with respect to the EUR, CHF, USD, CAD, and GBP.
Foreign exchange risk arises when future commercial transactions or recognized assets or liabilities are denominated in a currency that is not the entity’s functional currency. Management has set up a policy to require affiliated companies to manage their foreign exchange risk against their functional currency. The affiliated companies are required to hedge their major foreign exchange risk exposure using forward contracts or other standard instruments, usually transacted with Corporate Treasury.
For segment reporting purposes, each affiliated company designates contracts with Corporate Treasury as fair value hedges or cash flow hedges, as appropriate. Presently, most of the contracts are designated as cash flow hedges. External foreign exchange contracts are designated at the corporate level as hedges of foreign exchange risk on specific assets, liabilities, or future transactions on a gross basis.
The corporation has certain investments in foreign operations, whose net assets are exposed to foreign currency translation risk. If required, currency exposure arising from the net assets of the corporation’s foreign operations is managed primarily through borrowings denominated in the relevant foreign currencies.
The following tables show the hypothetical influence on the income statement for 2011 and 2010 related to foreign exchange risk. The volatility used for the calculation is the one-year historic volatility on December 31 for the relevant currency pair and year. For 2011, the only currency pairs with significant inherent risk were the EUR versus the CHF as well as the USD versus the CAD.
2011 in income statement
millions of CHF
Currency pair EUR/CHF USD/CAD
Volatility 16.3% 10.3%Effect on profit after tax (rate increase) 0.8 0.4Effect on profit after tax (rate decrease) –0.8 –0.4
2010 in income statement
millions of CHF
Currency pair USD/CAD EUR/AED
Volatility 11.5% 11.9%Effect on profit after tax (rate increase) –1.4 0.4Effect on profit after tax (rate decrease) 1.4 –0.4
If, on December 31, 2011, the EUR had increased by 16.3% against the CHF with all other variables held constant, profit after tax for the year would have been CHF 0.8 million higher mainly due to foreign exchange gains on EUR-denominated internal assets. A decrease of the rate would have caused a loss of the same amount.

Financial sectionB
usiness reviewG
overnanceIntroduction
79Sulzer | Annual Report 2011
Corporate accounting principles
The following tables show the hypothetical influence on equity for 2011 and 2010 related to foreign exchange risk of the most important currency pairs as at December 31 of the respective year. The volatility used for the calculation is the one-year historic volatility on December 31 for
the relevant currency pair and year. Most of the hypothetical effect on equity is a result of fair value changes of derivative financial instruments designated as hedges of future cash flows in foreign currencies.
(ii) Price riskThe corporation is exposed to equity securities price risk because of investments held by the corporation and classified on the consolidated balance sheet either as “available-for-sale” or at “fair value through profit or loss.”
The corporation’s equity investments are mostly publicly traded and are included in the equity index SPI.
The table below summarizes the hypothetical impact of increases/decreases of the SPI on the corporation’s post-tax profit for the year and on equity. The analysis is based on the assumption that the equity index had increased/decreased by its one-year historic volatility at December 31 with all other variables held constant and all the corporation’s equity instruments moved according to the historical correlation with the index.
Post-tax profit for the year would increase as a result of gains on equity securities classified as at “fair value through profit or loss.” Equity would increase as a result of gains on equity securities classified as “available-for-sale.” A decrease of the equity markets would cause a loss of the same amount.
(iii) Interest rate sensitivityThe corporation’s interest rate risk arises from interest bearing assets and liabilities. Assets and liabilities at variable rates expose the corporation to cash flow interest rate risk. Assets and liabilities at fixed rates expose the corporation to fair value interest rate risk.
The corporation analyzes its interest rate exposure on a net basis. The following table shows the hypothetical influence on the income statement for variable-interest-bearing assets net of liabilities at variable interest rates, assuming market interest rate levels would have increased/decreased by 100 basis points. For the most significant currencies EUR, USD, BRL, and CNY, increasing interest rates would have a positive impact on the income statement, since the value of variable-interest-bearing assets (comprising mainly cash and cash equivalents) would exceed the value of variable-interest-bearing liabilities. For the CHF, however, increasing interest rates would have a negative impact, because the amount of variable-interest-bearing liabilities would be larger than the respective assets.
2011 in equity
millions of CHF
Currency pair EUR/CHF EUR/USD GBP/USD EUR/GBP USD/MXN USD/BRL GBP/CHF
Volatility 16.3% 11.9% 8.4% 8.8% 14.8% 15.7% 16.6%Effect on equity (rate increase) –6.8 3.6 3.3 –2.9 –2.6 –1.9 –1.6Effect on equity (rate decrease) 6.8 –3.6 –3.3 2.9 2.6 1.9 1.6
2010 in equity
millions of CHF
Currency pair GBP/USD EUR/CHF USD/CHF USD/MXN BRL/CHF USD/CAD EUR/GBP
Volatility 10.1% 8.9% 10.7% 11.5% 13.6% 11.5% 9.2%Effect on equity (rate increase) 4.7 –3.2 –3.1 –1.8 –1.7 –1.3 –1.1Effect on equity (rate decrease) –4.7 3.2 3.1 1.8 1.7 1.3 1.1
millions of CHF 2011 2010
Index Volatility
Impact on post-tax
profit Impact on
equity Volatility
Impact on post-tax
profit Impact on
equity
SPI 20.5% 0.6 3.6 14.4% 0.4 4.2
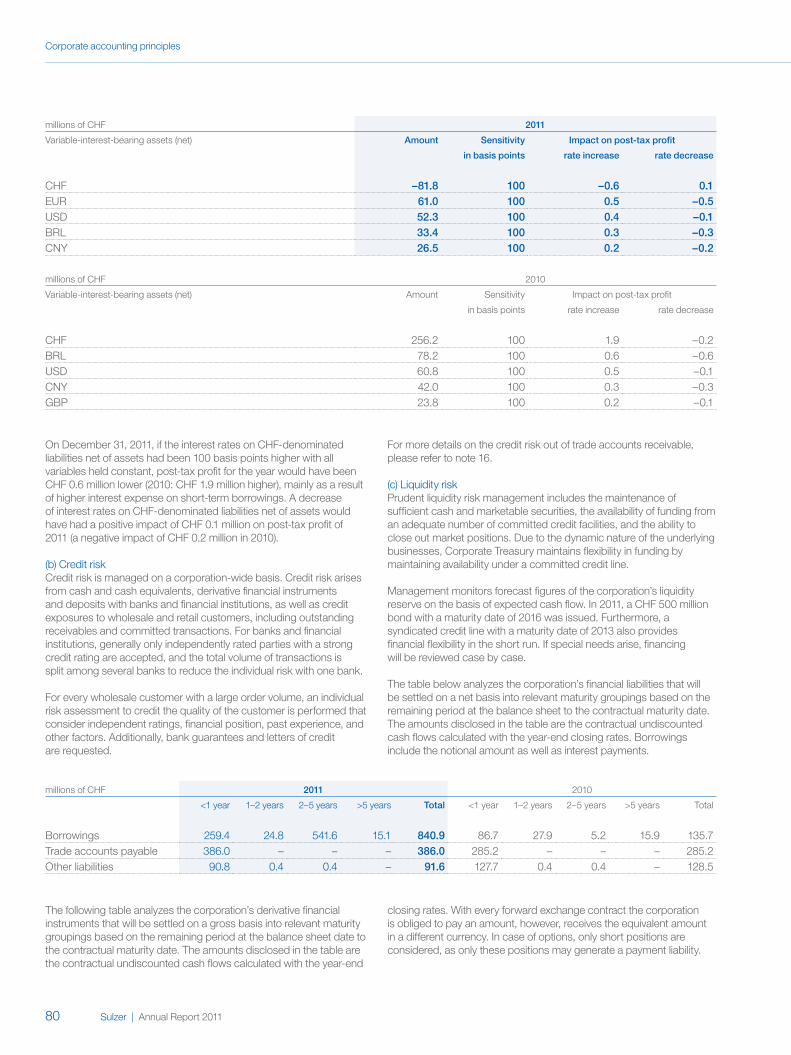
80 Sulzer | Annual Report 2011
Corporate accounting principles
On December 31, 2011, if the interest rates on CHF-denominated liabilities net of assets had been 100 basis points higher with all variables held constant, post-tax profit for the year would have been CHF 0.6 million lower (2010: CHF 1.9 million higher), mainly as a result of higher interest expense on short-term borrowings. A decrease of interest rates on CHF-denominated liabilities net of assets would have had a positive impact of CHF 0.1 million on post-tax profit of 2011 (a negative impact of CHF 0.2 million in 2010).
(b) Credit riskCredit risk is managed on a corporation-wide basis. Credit risk arises from cash and cash equivalents, derivative financial instruments and deposits with banks and financial institutions, as well as credit exposures to wholesale and retail customers, including outstanding receivables and committed transactions. For banks and financial institutions, generally only independently rated parties with a strong credit rating are accepted, and the total volume of transactions is split among several banks to reduce the individual risk with one bank.
For every wholesale customer with a large order volume, an individual risk assessment to credit the quality of the customer is performed that consider independent ratings, financial position, past experience, and other factors. Additionally, bank guarantees and letters of credit are requested.
For more details on the credit risk out of trade accounts receivable, please refer to note 16.
(c) Liquidity riskPrudent liquidity risk management includes the maintenance of sufficient cash and marketable securities, the availability of funding from an adequate number of committed credit facilities, and the ability to close out market positions. Due to the dynamic nature of the underlying businesses, Corporate Treasury maintains flexibility in funding by maintaining availability under a committed credit line.
Management monitors forecast figures of the corporation’s liquidity reserve on the basis of expected cash flow. In 2011, a CHF 500 million bond with a maturity date of 2016 was issued. Furthermore, a syndicated credit line with a maturity date of 2013 also provides financial flexibility in the short run. If special needs arise, financing will be reviewed case by case.
The table below analyzes the corporation’s financial liabilities that will be settled on a net basis into relevant maturity groupings based on the remaining period at the balance sheet to the contractual maturity date. The amounts disclosed in the table are the contractual undiscounted cash flows calculated with the year-end closing rates. Borrowings include the notional amount as well as interest payments.
millions of CHF 2011
Variable-interest-bearing assets (net) Amount Sensitivity Impact on post-tax profit
in basis points rate increase rate decrease
CHF –81.8 100 –0.6 0.1EUR 61.0 100 0.5 –0.5USD 52.3 100 0.4 –0.1BRL 33.4 100 0.3 –0.3CNY 26.5 100 0.2 –0.2
millions of CHF 2010
Variable-interest-bearing assets (net) Amount Sensitivity Impact on post-tax profit
in basis points rate increase rate decrease
CHF 256.2 100 1.9 –0.2BRL 78.2 100 0.6 –0.6USD 60.8 100 0.5 –0.1CNY 42.0 100 0.3 –0.3GBP 23.8 100 0.2 –0.1
millions of CHF 2011 2010
<1 year 1–2 years 2–5 years >5 years Total <1 year 1–2 years 2–5 years >5 years Total
Borrowings 259.4 24.8 541.6 15.1 840.9 86.7 27.9 5.2 15.9 135.7Trade accounts payable 386.0 – – – 386.0 285.2 – – – 285.2Other liabilities 90.8 0.4 0.4 – 91.6 127.7 0.4 0.4 – 128.5
The following table analyzes the corporation’s derivative financial instruments that will be settled on a gross basis into relevant maturity groupings based on the remaining period at the balance sheet date to the contractual maturity date. The amounts disclosed in the table are the contractual undiscounted cash flows calculated with the year-end
closing rates. With every forward exchange contract the corporation is obliged to pay an amount, however, receives the equivalent amount in a different currency. In case of options, only short positions are considered, as only these positions may generate a payment liability.

Financial sectionB
usiness reviewG
overnanceIntroduction
81Sulzer | Annual Report 2011
Corporate accounting principles
3.2 Capital risk managementThe corporation’s objectives when managing capital are to safeguard the corporation’s ability to continue as a going concern in order to provide returns for shareholders and benefits for other stakeholders and to maintain an optimal capital structure to reduce the cost of capital.
In order to maintain or adjust the capital structure, the corporation may adjust the amount of dividends paid to shareholders, return capital to shareholders, issue new shares, or sell assets to reduce debt.
As do others in the same industry, the corporation monitors capital on the basis of the gearing ratio. This ratio is calculated as total financial debt divided by total equity (debt-to-equity ratio). The equity capital as shown in the balance sheet corresponds to the managed equity capital.
The gearing ratio as at December 31, 2011 and 2010, was as follows:
millions of CHF 2011 2010
Total financial debt 767.6 128.0Total equity (excluding non-controlling interests) 2 097.8 1 895.0Gearing ratio 0.37 0.07
The increase in the gearing ratio during 2011 resulted from a significant increase in financial debt.
3.3 Fair value estimationThe fair value of financial instruments traded in active markets (such as trading and available-for-sale securities) is based on quoted market prices at the balance sheet date. The quoted market price used for financial assets held by the corporation is the current bid price. Such instruments are included in level 1.
The fair value of financial instruments that are not traded in an active market (e.g., over-the-counter derivatives) is determined by using valuation techniques. The corporation uses a variety of methods and makes assumptions that are based on market conditions existing at each balance sheet date. Such instruments are included in level 2.
millions of CHF 2011
<1 year 1–2 years 2–5 years >5 years Total
Forward exchange contracts– outflow 1 056.3 19.9 – – 1 076.2– inflow 1 056.3 19.9 – – 1 076.2Other forward contracts– outflow 2.1 19.2 – – 21.3– inflow – – – – –Other options– outflow – – – – –– inflow – 33.2 – – 33.2
millions of CHF 2010
<1 year 1–2 years 2–5 years >5 years Total
Forward exchange contracts– outflow 1 185.2 21.9 – – 1 207.1– inflow 1 185.2 21.9 – – 1 207.1Other forward contracts– outflow – – 19.2 – 19.2– inflow – – – – –Other options– outflow 11.5 – – – 11.5– inflow – – 33.2 – 33.2

82 Sulzer | Annual Report 2011
Corporate accounting principles
The following table presents the financial assets and liabilities that are measured at fair value at December 31, 2011.
millions of CHF Level 1 Level 2 Level 3 Total
AssetsFinancial assets at fair value through profit or loss 3.6 4.5 – 8.1Derivative assets – 6.9 – 6.9Available-for-sale financial assets 28.2 – – 28.2Total assets 31.8 11.4 – 43.2
LiabilitiesFinancial liabilities at fair value through profit or loss – – – –Derivative liabilities – 16.9 – 16.9Total liabilities – 16.9 – 16.9
The following table presents the financial assets and liabilities that are measured at fair value at December 31, 2010.
millions of CHF Level 1 Level 2 Level 3 Total
AssetsFinancial assets at fair value through profit or loss 2.7 10.0 – 12.7Derivative assets – 38.2 – 38.2Available-for-sale financial assets 31.1 – – 31.1Total assets 33.8 48.2 – 82.0
LiabilitiesFinancial liabilities at fair value through profit or loss – – – –Derivative liabilities – 13.9 – 13.9Total liabilities – 13.9 – 13.9
Quoted market prices or dealer quotes for similar instruments are used for long-term debt. The fair value of forward foreign exchange contracts is determined using quoted forward exchange rates at the balance sheet date.
The carrying value less allowance for doubtful trade receivables and payables are assumed to approximate their fair values due to the short-term nature of trade receivables. Allowances are based on past experience in the relevant markets. The fair value of financial liabilities for disclosure purposes is estimated by discounting the future contractual cash flows at the current market interest rate that is available to the corporation for similar financial instruments.
The corporation does not have significant financial assets for which valuation techniques not based on observable market data are used (level 3).
4 Critical accounting estimates and judgmentsAll estimates and assessments are continually reviewed and are based on historical experience and other factors, including expectations regarding future events that appear reasonable under the given circumstances. The corporation makes estimates and assumptions that relate to the future. By their nature, these estimates will only rarely correspond to actual subsequent events. The estimates and assumptions that carry a significant risk, in the form of a substantial adjustment to the present values of assets and liabilities within the next financial year, are set out below.
a) GoodwillIn accordance with the accounting policies set forth in section 2.6 “Intangible assets,” the corporation carries out an annual impairment test on goodwill. The recoverable amount from cash-generating units is measured on the basis of value-in-use calculations. These calculations require the establishment of assumptions.
The management defines budgeted gross margins based on developments in the past and on future market expectations. The applied discount rates are based on pretax interest rates and reflect the specific risks of the respective industry.
b) Income taxesThe corporation is obliged to pay income taxes in numerous jurisdictions. Significant assumptions are required in order to determine global tax provisions. There are many transactions and calculations for which the ultimate tax determination is uncertain during the ordinary course of the business.

Financial sectionB
usiness reviewG
overnanceIntroduction
83Sulzer | Annual Report 2011
Corporate accounting principles
c) ProvisionsThe provisions for warranties/liabilities include significant amounts to cover pending items in connection with liabilities and disagreements with the buyer of the locomotive business. The assessment of the related risks is, in view of the complex character of the contracts involved and their partially long-term nature, difficult.
d) Revenue recognitionThe corporation uses the percentage of completion method (PoC) in accounting for major long-term contracts. The use of the PoC method requires the corporation to estimate the proportional revenue and costs. If circumstances arise that may change the original estimates of revenues, costs, or extent of progress toward completion, estimates are revised. These revisions may result in increases or decreases in estimated revenues or costs and are reflected in income in the period in which the circumstances that give rise to the revision become known by management.
e) Fair value of derivatives and other financial instrumentsThe fair value of financial instruments that are not traded in an active market (e.g., over-the-counter derivatives) is determined by using valuation techniques. The corporation uses a variety of methods and makes assumptions that are based on market conditions existing at each balance sheet date. Quoted market prices or trader quotes for similar instruments are used for long-term debt. The fair value of interest rate swaps is calculated as the present value of the estimated future cash flows. The fair value of forward foreign exchange contracts is determined using quoted forward exchange rates at the balance sheet date.
f) Employee benefit plans The present value of the pension obligation and the plan assets depends on a number of factors that are determined on an actuarial basis using a number of assumptions. Assumptions used in determining the defined benefit obligation and the plan assets include the discount rate, the expected rate of return on plan assets, and the participation of Sulzer in the pension plans. The assumptions are reviewed and reassessed at the end of each year based on observable market data, i.e., interest rate of high-quality corporate bonds denominated in the corresponding currency and asset management studies. The participation of Sulzer in the pension plans covers the active employees and the retirees related to Sulzer.

84 Sulzer | Annual Report 2011

Financial sectionB
usiness reviewG
overnanceIntroduction
85Sulzer | Annual Report 2011
01 Significant changes in the scope of consolidation
All current figures related to business combinations in the reporting period are of temporary nature only as they can change during the measurement period. If the estimates need to be revised, the allocation of the cost of the business combination shall be adjusted accordingly. The impact on cash flow of the acquisitions listed below is disclosed in note 30.
Significant changes in 2011Cardo Flow SolutionsOn July 29, 2011, Sulzer acquired with Cardo Flow Solutions, one of the leading suppliers of pumps and related equipment in the attractive water market for a total cash consideration of SEK 6.2 billion (CHF 893.3 million). In 2010, Cardo Flow Solutions generated approximately CHF 463 million in sales and an adjusted EBITDA of CHF 67 million, implying a 14.5% EBITDA margin. The business has around 1 900 employees.
Headquartered in Malmö, Sweden, Cardo Flow Solutions is a full-line supplier of pumps and related equipment such as lifters, mixers, aerators, compressors, control and monitoring equipment, and services for the water market, which accounts for around 90% of sales. With this acquisition, Sulzer entered the highly attractive water pump market and became a leading player in it. In addition, Sulzer further strengthened its global position as a supplier of pumps and related services in the general industry, including the pulp and paper industry. Water became a key strategic market for Sulzer, accounting for approximately 13% of annual sales. The water market offers growth potential in both mature and emerging markets, driven by long-term trends such as population growth, increasing water consumption, urbanization, and environmental protection. The acquisition creates a strong platform for further growth, driven by global geographic expansion and continued technological development of complete pumping solutions, good aftermarket opportunities by leveraging Sulzer’s existing service network, and cross-selling opportunities with the combined product offering. The acquired businesses will be fully integrated in Sulzer Pumps, and the initial phase of the integration process is expected to take about nine months. Synergies have been identified and will mainly be achieved through broader geographic presence, combined solutions, joint sourcing, and shared services. Synergies are expected in sales and costs.
Cash acquired amounted to CHF 41.1 million. Recognized intangible assets amounted to CHF 240.7 million. The resulting goodwill comparing the purchase price of CHF 893.3 million paid in cash (total consideration) and the net assets acquired amounted to CHF 538.7 million. The goodwill is attributable to synergies from entering new geographical markets, combined solutions, joint sourcing, and shared services. Part of goodwill (CHF 5.9 million) will lead to taxable valuation differences. Transaction costs related to third parties are recognized in general and administrative expenses and amount to CHF 6.0 million. Since the acquisition date, order intake has amounted to CHF 160.1 million, sales have amounted to CHF 179.0 million, and operating income has amounted to CHF –17.8 million, including amortization of step-ups and intangible assets, restructuring cost, and transaction cost.
Acquired net assets of Cardo Flow Solutions
millions of CHF Fair value
Intangible assets 240.7Property, plant and equipment 60.3Other non-current assets 0.3Deferred income tax assets 11.5Inventories 68.0Trade accounts receivable 87.7Other current assets 77.6Employee benefit plans –8.7Deferred income tax liabilities –73.3Trade accounts payable –22.5Current provisions –21.2Other liabilities with third parties –65.8Identified acquired net assets 354.6
C.L. Engenharia Ltda.On May 31, 2011, Sulzer Chemtech acquired the privately owned maintenance specialist C.L. Engenharia Ltda. in Brazil for a purchase price of BRL 20.0 million (CHF 10.7 million). The related goodwill amounted to CHF 2.5 million. The acquired company achieved sales of BRL 20.6 million (CHF 11.7 million) in 2010 with approximately 300 employees. With this acquisition, Sulzer Chemtech enhanced the competitiveness of its tower field service activities in Brazil by adding the competencies of a local contractor with a skilled crew. Transaction costs amounted to CHF 0.4 million.
OtherIn addition, Sulzer Chemtech acquired the assets of Black Magic Crew Ltd in Canada. The contribution of the acquisition to the consolidated incomestatement and to the total of Sulzer’s employees is not material. There was no goodwill resulting from the transaction.
Notes to the consolidated financial statements

86 Sulzer | Annual Report 2011
Notes to the consolidated financial statements
01 Significant changes in the scope of consolidation (continued)
The acquired assets of the two acquisitions of Sulzer Chemtech were as follows:
Acquired net assets
millions of CHF Fair value
Intangible assets 5.7Property, plant and equipment 1.7Inventories 0.2Trade accounts receivable 1.0Other current assets 3.2Liabilities with third parties –1.9Identified acquired net assets 9.9
Significant changes in 2010Sulzer Real Estate LtdOn October 27, 2010, Sulzer successfully completed the transaction of its Winterthur real estate portfolio with Implenia Ltd, which was first announced on August 31, 2010. By acquiring Sulzer Real Estate Ltd in a share deal structure, Implenia Ltd took over Sulzer’s operationally non-essential real estate in Switzerland, including liabilities.
The net transaction value was approximately CHF 83 million in 2010. In addition, there was a value attached to sales contracts already signed for various properties that were closed in 2011. In 2010, the EBIT contribution from the sale of Sulzer Real Estate Ltd amounted to CHF 47.8 million and from the already-signed contracts, CHF 3.8 million. In 2011, the EBIT contribution from the disposal of the real estate activities in Switzerland amounted to CHF 18.2 million.
Castle Support Services PlcOn June 3, 2010, Sulzer acquired Castle Support Services Plc, the parent company of Dowding & Mills, for a total purchase price of GBP 127.5 million. Castle shares trading on the Alternative Investment Market (AIM) at the London Stock Exchange have been cancelled. As of December 31, 2010, Sulzer (UK) Holdings Ltd held 100% of shares of Castle Support Services Plc. Dowding & Mills employs approximately 1 350 people in the UK, USA, Australia, and UAE.
Cash acquired amounted to CHF 33.6 million. Recognized intangible assets totaled CHF 64.2 million. The resulting goodwill comparing thepurchase price of CHF 213.6 million paid in cash (total consideration) and the net assets acquired amounted to CHF 141.6 million. The goodwill is attributable to synergies from entering new geographical markets and the related increase in the service portfolio. The goodwill will not lead to taxable valuation differences. Transaction costs were recognized in general and administrative expenses and came to CHF 3.3 million in first half year 2010. Non-controlling interests related to the acquisition were measured at proportionate equity with an amount of CHF –0.5 million. Since the acquisition date, order intake has amounted to CHF 123.0 million, sales have amounted to CHF 123.0 million, and operating income has amounted to CHF 12.5 million.
Acquired net assets of Castle Support Services Plc
millions of CHF Fair value
Intangible assets 64.2Other non-current assets 60.9Inventories 21.2Trade accounts receivable 33.8Other current assets 39.5Employee benefit plans –45.6Other liabilities with third parties –102.0Identified acquired net assets 72.0

Financial sectionB
usiness reviewG
overnanceIntroduction
87Sulzer | Annual Report 2011
Notes to the consolidated financial statements
01 Significant changes in the scope of consolidation (continued)
Bekaert Diamond-like Carbon (DLC) CoatingsOn July 1, 2010, Sulzer Metco acquired Bekaert’s diamond-like carbon (DLC) coating activities for a purchase price of EUR 14.1 million (CHF 18.6 million). The resulting goodwill amounted to CHF 0.3 million. Bekaert’s DLC coatings business develops and markets thin-film coatings, which combine very low frictional resistance and extreme hardness. Since the acquisition date, order intake has amounted to CHF 12.9 million, sales have amounted to CHF 12.4 million, and operating income has amounted to CHF –0.4 million including restructuring expenses of CHF 2.4 million.
Acquired net assets of Bekaert’s diamond-like carbon (DLC) coating activities
millions of CHF Fair value
Intangible assets 1.9Other non-current assets 13.5Inventories 0.6Trade accounts receivable 3.7Other current assets 3.7Liabilities with third parties –5.1Identified acquired net assets 18.3
Significant changes in ownership interest in subsidiaries without loss of controlSulzer India LtdIn 2011, Sulzer continued to acquire the public shares of Sulzer India Ltd. As required by local law, Sulzer accepted the remaining publicly held shares at the offer price of INR 1 180 per share for a period of 12 months from the date of delisting. The exit offer ended mid-September 2011. As of December 31, 2011, Sulzer Ltd held 96.27% (2010: 94.01%) of Sulzer India Ltd. Therefore, a total amount of CHF 15.9 million for 16.27% (2010: CHF 13.3 million for 14.01%) was paid to public shareholders of Sulzer India Ltd. The remaining share of non-controlling interest is measured at proportionate equity as part of total non-controlling interests.
02 Major currency exchange rates
CHF 2011 2010
Average rate
Year-end rate
Average rate
Year-end rate
1 EUR 1.23 1.22 1.38 1.251 GBP 1.42 1.45 1.61 1.451 USD 0.89 0.94 1.04 0.941 BRL 0.53 0.50 0.59 0.561 CAD 0.90 0.92 1.01 0.94100 CNY 13.71 14.93 15.40 14.20100 INR 1.91 1.76 2.28 2.09100 MXN 7.15 6.72 8.25 7.57100 SEK 13.66 13.62 14.48 13.961 SGD 0.70 0.72 0.76 0.73100 ZAR 12.26 11.61 14.25 14.11

88 Sulzer | Annual Report 2011
Notes to the consolidated financial statements
03 Segment information
millions of CHF Sulzer Pumps Sulzer Metco Sulzer Chemtech Sulzer Turbo Services
2011 2010 2011 2010 2011 2010 2011 2010
Order intake (unaudited) 1 705.6 1 613.7 673.6 643.1 701.7 621.3 477.6 400.4Nominal growth (unaudited) 5.7% –4.2% 4.7% 17.9% 12.9% 24.7% 19.3% 43.9%Adjusted growth (unaudited)1) 10.4% –1.7% 15.3% 21.8% 21.2% 24.7% 14.3% 5.0%
Order backlog (unaudited) 1 343.5 1 336.6 77.4 71.3 310.7 274.3 130.1 115.1
Sales 1 747.8 1 576.1 667.3 623.5 667.0 574.6 488.0 399.1Nominal growth 10.9% –15.1% 7.0% 12.1% 16.1% –9.1% 22.3% 37.0%Adjusted growth (unaudited)1) 14.7% –13.5% 17.8% 15.7% 23.7% –8.9% 18.1% 0.2%
Research and development expenses 18.7 11.0 20.2 19.6 30.5 25.9 – –
Operating income before depreciation/amortization EBITDA 210.2 215.2 91.9 81.5 97.8 93.2 69.2 55.9
Depreciation/amortization –42.0 –26.2 –23.2 –24.4 –34.7 –34.7 –16.0 –14.0
Operating income EBIT 168.2 189.0 68.7 57.1 63.1 58.5 53.2 41.9Return on sales (EBIT/sales) ROS 9.6% 12.0% 10.3% 9.2% 9.5% 10.2% 10.9% 10.5%Return on capital employed (EBIT in % of average capital employed) ROCE 20.5% 55.5% 18.2% 14.6% 15.3% 14.4% 14.9% 13.6%
Operating assets 2 281.1 1 026.7 497.0 465.6 641.8 582.1 520.6 516.9Unallocated assets – – – – – – – –Total assets as of December 31 2 281.1 1 026.7 497.0 465.6 641.8 582.1 520.6 516.9
Operating liabilities 812.3 702.7 106.8 100.6 220.0 176.6 151.7 142.3Unallocated liabilities – – – – – – – –Total liabilities as of December 31 812.3 702.7 106.8 100.6 220.0 176.6 151.7 142.3
Operating net assets 1 468.8 324.0 390.2 365.0 421.8 405.5 368.9 374.6Unallocated net assets – – – – – – – –Total net assets as of December 31 1 468.8 324.0 390.2 365.0 421.8 405.5 368.9 374.6
Employees (number of full-time equivalents) as of December 31 8 211 5 904 2 259 2 045 3 634 2 973 2 654 2 5871) Adjusted for currency effects as well as acquisitions and divestitures.
Sulzer Pumps is a market leader in pump technology and solutions. Sulzer Metco is a market leader in surface technology. Sulzer Chemtech is a market leader for separation, mixing, and service solutions. Sulzer Turbo Services is a leading independent provider of service solutions for rotating equipment. There are no significant transactions across the segments.

Financial sectionB
usiness reviewG
overnanceIntroduction
89Sulzer | Annual Report 2011
Notes to the consolidated financial statements
03 Segment information (continued)
millions of CHF Total divisions Others Total Sulzer
2011 2010 2011 2010 2011 2010
Order intake (unaudited) 3 558.5 3 278.5 7.6 10.2 3 566.1 3 288.7Nominal growth (unaudited) 8.5% 9.0% – – 8.4% 9.0%Adjusted growth (unaudited)1) 13.9% 7.5% – – 13.7% 7.5%
Order backlog (unaudited) 1 861.7 1 797.3 2.3 2.5 1 864.0 1 799.8
Sales 3 570.1 3 173.3 7.8 10.4 3 577.9 3 183.7Nominal growth 12.5% –4.9% – – 12.4% –5.0%Adjusted growth (unaudited)1) 17.4% –6.6% – – 17.2% –6.6%
Research and development expenses 69.4 56.5 2.3 2.0 71.7 58.5
Operating income before depreciation/amortization EBITDA 469.1 445.8 13.7 65.2 482.8 511.0
Depreciation/amortization –115.9 –99.3 –2.8 –5.3 –118.7 –104.6
Operating income EBIT 353.2 346.5 10.9 59.9 364.1 406.4Return on sales (EBIT/sales) ROS 9.9% 10.9% – – 10.2% 12.8%Return on capital employed (EBIT in % of average capital employed) ROCE 18.0% 23.9% – – 18.8% 28.1%
Operating assets 3 940.5 2 591.3 24.1 37.2 3 964.6 2 628.5Unallocated assets – – – – 575.8 863.2Total assets as of December 31 3 940.5 2 591.3 24.1 37.2 4 540.4 3 491.7
Operating liabilities 1 290.8 1 122.2 58.8 76.9 1 349.6 1 199.1Unallocated liabilities – – – – 1 087.0 391.4Total liabilities as of December 31 1 290.8 1 122.2 58.8 76.9 2 436.6 1 590.5
Operating net assets 2 649.7 1 469.1 –34.7 –39.7 2 615.0 1 429.4Unallocated net assets – – – – –511.2 471.8Total net assets as of December 31 2 649.7 1 469.1 –34.7 –39.7 2 103.8 1 901.2
Employees (number of full-time equivalents) as of December 31 16 758 13 509 244 231 17 002 13 7401) Adjusted for currency effects as well as acquisitions and divestitures.
The most significant activities comprised under “Others” are Real Estate, Sulzer Innotec, Corporate Center, and consolidation adjustments.

90 Sulzer | Annual Report 2011
Notes to the consolidated financial statements
04 Segment information by geographical region
millions of CHFOperating assets by company location
Capital expenditure in intangible and tangible assets
by company location Sales by region
2011 2010 2011 2010 2011 2010
Europe 2 539.1 1 453.6 59.2 47.9 1 268.0 1 024.4North America 630.7 561.0 17.4 21.2 837.1 840.3Central and South America 194.2 158.7 6.2 7.9 330.4 323.8Asia, Middle East, Australia 513.3 392.1 29.1 40.4 984.3 802.9Africa 87.3 63.1 1.3 0.7 158.1 192.3Total 3 964.6 2 628.5 113.2 118.1 3 577.9 3 183.7
Sales of divisions by region (as percentage)
Europe North AmericaCentral and
South AmericaAsia, Middle East,
Australia Africa
2011 2010 2011 2010 2011 2010 2011 2010 2011 2010
Sulzer Pumps 31.2% 24.0% 21.2% 24.0% 13.3% 16.8% 25.7% 23.3% 8.6% 11.9%Sulzer Metco 53.4% 54.4% 23.3% 23.3% 1.9% 1.9% 21.2% 20.2% 0.2% 0.2%Sulzer Chemtech 30.7% 32.9% 21.0% 25.3% 6.4% 3.6% 41.2% 37.5% 0.7% 0.7%Sulzer Turbo Services 30.2% 25.7% 35.7% 43.3% 8.8% 6.7% 24.7% 24.2% 0.6% 0.1%
In Switzerland, operating assets amounted to CHF 386.3 million in 2011 (2010: CHF 392.6 million) and third-party sales to CHF 59.2 million (2010: CHF 57.1 million). The country representing more than 10% of third-party sales in 2011 was the USA with CHF 671.1 million. In 2010, the country representing more than 10% of third-party sales was the USA with CHF 698.3 million. The countries that represented more than 10% of operating assets by company location in 2011 were the USA with CHF 524.7 million (2010: CHF 452.9 million) and Great Britain with CHF 400.6 million (2010: CHF 356.5 million). No other countries represented more than 10% of operating assets and sales from third parties in 2011 or 2010. In 2011 and 2010, no customer represented 10% or more of the corporation’s third-party sales.
05 Personnel expenses
millions of CHF 2011 2010
Salaries and wages 843.2 769.1Employee defined contribution plans 19.4 24.0Employee defined benefit plans 25.4 23.8Cost of share-based payments 10.5 9.4Other personnel costs 157.8 147.3Total personnel expenses 1 056.3 973.6
Personnel expenses increased by CHF 82.7 million from the previous year mainly caused by the higher number of full-time employees as a consequence of the acquisitions of Cardo Flow Solutions and C.L. Engenharia Ltda.

Financial sectionB
usiness reviewG
overnanceIntroduction
91Sulzer | Annual Report 2011
Notes to the consolidated financial statements
06 Employee benefit plans
The defined benefit obligation for the active members of pension plans is the present value of accrued pension obligations at balance sheet date considering future salary and pension increases as well as turnover rates (using the Project Unit Credit Method). The defined benefit obligation for the retirees is the present value of the ongoing pensions considering future pension increases. In Switzerland and in most other countries, pension liabilities are covered by assets held by separate legal entities. The financing of pension benefit plans in Germany, however, is made by means of provisions accrued in the accounting records of the respective companies. The actuarial valuations for the defined benefit plans were performed at the balance sheet closing date. The Swiss pension plans are treated as defined benefit plans in accordance with IAS 19.
millions of CHF 2011 2010
Funded plans
Unfunded plans Total Total
Reconciliation of the amount recognized in the balance sheet as of December 31Present value of funded defined benefit obligation –1 973.3 – –1 973.3 –1 852.7Fair value of plan assets 1 859.4 – 1 859.4 1 895.8Overfunding (+) / underfunding (–) –113.9 – –113.9 43.1Present value of unfunded defined benefit obligation – –56.2 –56.2 –60.1Unrecognized actuarial gains (–) / losses (+) 98.0 1.3 99.3 31.5Overfunding not recognized1) –13.6 – –13.6 –89.6Asset (+) / liability (–) recognized in the balance sheet2) –29.5 –54.9 –84.4 –75.1– thereof as liabilities under non-current provisions3) –46.4 –54.9 –101.3 –93.2– thereof as prepaid expenses 16.9 – 16.9 18.1
Pension expenses recognized in profit or lossCurrent service cost (employer) –31.0 –33.0Interest cost –65.6 –67.4Expected return on plan assets 83.9 79.7Actuarial gain (+) / loss (–) recognized –94.5 18.6Past service cost 2.8 –0.2Effect of overfunding not recognized 76.0 –25.1Effect of curtailment and settlements 0.1 0.3Expense recognized in profit (+) / loss (–) –28.3 –27.1– thereof charged to personnel expenses –25.4 –23.8– thereof charged to financial income (interest on unfunded plans) –2.9 –3.3
Actual return on plan assets 25.4 99.7
Principal actuarial assumptions as of December 31Discount rate 3.1% 3.5%Expected rate of return on plan assets 4.2% 4.7%Future salary increases 1.8% 2.3%Future pension increases 0.7% 0.7%Expected average remaining working lives in years 9.6 9.6Life expectance at retirement age (male/female) in years 21/25 19/231) Legal requirements, particularly those in Switzerland, restrict the utilization of overfunded amounts in separate legal benefit plans. Only amounts for which the future
economic benefit to the employer is imminent are capitalized in the consolidated balance sheet.2) As disclosed in the corporate accounting principles, Sulzer will apply the amendment to IAS 19 for its 2012 or 2013 consolidated financial statements. Due to the
amendment to IAS 19, the consolidated equity of Sulzer will be more volatile in future periods. The asset to be considered as of January 1, 2012, would amount to CHF 16.9 million (as of January 1, 2011, CHF 18.1 million) and the liability as of January 1, 2012, would amount to CHF –200.6 million (as of January 1, 2011, CHF –124.7 million).
3) The increase of the provisions relates to the acquisition of Cardo Flow Solutions. The therewith recognized provisions amount to CHF 9.4 million.
The expected return on plan assets is determined by considering the expected returns available on the assets underlying the current investment policy. The expected long-term return for investment categories is as follows: 2.0% for bonds, 5.8% for equities, 3.6% for properties, and 3.0% for others.

92 Sulzer | Annual Report 2011
Notes to the consolidated financial statements
06 Employee benefit plans (continued)
millions of CHF 2011 2010
Reconciliation of defined benefit obligationDefined benefit obligation as of January 1 1 912.8 1 754.6Interest cost 65.6 67.4Current service cost (employer) 31.0 33.0Contributions by plan participants 9.9 9.7Past service cost –2.9 0.2Benefits paid/deposited –124.4 –138.2Change in scope of consolidation 36.1 223.6 Curtailment and settlements –0.1 –0.3Actuarial gain (–) / loss (+) on obligation 103.2 34.9Currency translation differences –1.7 –72.3Defined benefit obligation as of December 311) 2 029.5 1 912.8
Reconciliation of the fair value of plan assetsFair value of plan assets as of January 1 1 895.8 1 770.3Expected return on plan assets 83.9 79.7Contributions by the employer/benefits paid directly by the employer2) 26.2 30.3Contributions by plan participants 9.9 9.7Benefits paid/deposited –124.4 –138.2Change in scope of consolidation 26.7 180.1 Curtailment and settlements – –Actuarial gain (+) / loss (–) on plan assets –58.5 20.0Currency translation differences –0.2 –56.1Fair value of plan assets as of December 31 1 859.4 1 895.8– thereof equity instruments Sulzer Ltd 1.6 1.7– thereof equity instruments—third-party 503.0 502.4– thereof debt instruments—third-party 731.6 721.6– thereof properties occupied by or used by third-parties 311.4 307.3– thereof others 311.8 362.8
Best estimate of contributions for upcoming financial yearContributions by the employer/benefits paid directly by the employer2) 27.9 23.4Contributions by plan participants 10.4 9.21) The defined benefit obligation 2011 includes the funded part (CHF 1 973.3 million) and the unfunded part (CHF 56.2 million).2) Benefits paid directly by the employer mainly refer to the German plans.

Financial sectionB
usiness reviewG
overnanceIntroduction
93Sulzer | Annual Report 2011
Notes to the consolidated financial statements
06 Employee benefit plans (continued)
Five-year summary
millions of CHF 2011 2010 2009 2008 2007
Present value of funded defined benefit obligation –1 973.3 –1 852.7 –1 687.8 –3 209.6 –3 422.2Fair value of plan assets 1 859.4 1 895.8 1 770.3 3 152.6 3 859.4Overfunding (+) / underfunding (–) –113.9 43.1 82.5 –57.0 437.2Present value of unfunded defined benefit obligation –56.2 –60.1 –66.8 –63.1 –73.8
Experience adjustments on defined benefit obligation –1.4 –7.3 31.2 –5.0 –21.7Experience adjustments on plan assets –58.5 20.0 289.2 –628.7 –66.8
07 Research and development expenses
In 2011, total research and development expenses amounted to CHF 71.7 million (2010: CHF 58.5 million). The increase is mainly driven by the higher research and development expenses in the divisions (CHF 69.4 million in 2011 vs. CHF 56.5 million in 2010) caused by the amortization expenses of those intangible assets from the Cardo Flow Solutions acquisition, which have research and development character. The research and development expenses of Sulzer Innotec, the corporate research and development department, amounted in 2011 to CHF 2.9 million (2010: CHF 2.3 million). Sulzer Innotec and some of the divisions maintain close cooperation with the Swiss Federal Institutes of Technology as well as domestic and foreign universities and research laboratories. A breakdown of the research and development expenses per division is shown in note 03, “Segment information.”
08 Other operating income and expenses
millions of CHF 2011 2010
Income from rental/leasing of real estate 0.6 11.5Gain from sale of real estate 1.0 4.9Income from services to third parties 8.3 8.1Operating currency exchange gains – 2.0Other operating income 34.8 77.6Total other operating income 44.7 104.1
Expenses from rental/lease of real estate – –10.9Restructuring expenses –15.0 –3.9Operating currency exchange losses –1.1 –Other operating expenses –28.9 –30.5Total other operating expenses –45.0 –45.3
Total other operating income and expenses –0.3 58.8
Total other operating income and expenses amounted with CHF –0.3 million compared to CHF 58.8 million in the previous year. Due to the fact that Sulzer Real Estate Ltd was sold in 2010, rental income and expenses decreased accordingly. In 2011, the pending sales, which were originally part of the Sulzer Real Estate Ltd, were sold. A profit of CHF 18.2 million (2010: CHF 51.6 million) was realized under “Other operating income” out of this transaction. For detailed information about the sale of Sulzer Real Estate Ltd, please refer to note 01.

94 Sulzer | Annual Report 2011
Notes to the consolidated financial statements
09 Financial income and expenses
millions of CHF 2011 2010
Interest and securities income 8.7 9.5
Interest expenses –11.9 –5.8Interest on unfunded employee benefit plans –2.9 –3.3Interest expenses –14.8 –9.1
Total interest income –6.1 0.4
Income from participations and other financial assets –0.5 0.2Fair value changes –11.9 3.3Other financial income/expenses 0.5 1.2Currency exchange gains/losses 23.3 –9.5Total other financial income 11.4 –4.8
Total financial income 5.3 –4.4– thereof from financial assets held at fair value through profit or loss –11.7 4.3– thereof from available-for-sale financial assets 0.6 0.7– thereof from loans and receivables – 0.2– thereof from borrowings –11.9 –5.8
The income on interest and securities slightly decreased while, mainly due to the issue of a CHF 500 million bond, interest expenses significantly increased compared with 2010. The “Fair value changes” largely comprise the fair valuation of derivative financial instruments that are classified as financial assets or financial liabilities at fair value through profit or loss and that are used as hedging instruments with regard to foreign exchange risks. The impact of the fair valuation of these derivatives partially offsets the currency exchange gains incurred during 2011 due to the continuous high volatility in foreign exchange rates.

Financial sectionB
usiness reviewG
overnanceIntroduction
95Sulzer | Annual Report 2011
Notes to the consolidated financial statements
10 Income taxes
millions of CHF 2011 2010
Current income tax expenses –98.8 –107.9Deferred income tax expenses 9.4 10.2Total income tax expenses –89.4 –97.7
The weighted average tax rate results from applying each subsidiary’s statutory income tax rate to the income before taxes and non-controlling interest. Since the corporation operates in countries that have differing tax laws and rates, the consolidated weighted average effective tax rate will vary from year to year according to variations in income per country and changes in applicable tax rates.
millions of CHF 2011 2010
Income before income tax expenses 369.4 402.0Weighted average tax rate 27.4% 28.4%
Income taxes at weighted average tax rate –101.2 –114.2Income taxed at different tax rates 3.8 6.9Effect of tax loss carryforwards and allowances for deferred income tax assets 2.9 3.2Expenses not deductible for tax purposes –2.1 –7.1Effect of changes in tax rates and legislation 1.0 –1.3Prior period items and others 6.2 14.8Total income tax expenses –89.4 –97.7Effective income tax rate 24.2% 24.3%
The effective income tax rate of 24.2% was positively impacted by the capital gains, which were taxed at a low rate, generated from the disposal of the real estate activities in Switzerland; the release of no longer required tax provisions, and by the dissolution of valuation allowances on remaining tax assets.
Income tax liabilities
millions of CHF 2011 2010
Balance as of January 1 59.0 105.8Changes in scope of consolidation 2.0 0.8Additions 64.1 78.7Released as no longer required –11.3 –17.3Released for utilization –50.9 –106.3Currency translation differences –0.6 –2.7Total income tax liabilities as of December 31 62.3 59.0– thereof non-current 12.8 22.2– thereof current 49.5 36.8

96 Sulzer | Annual Report 2011
Notes to the consolidated financial statements
10 Income taxes (continued)
Summary of deferred income tax assets and liabilities in the balance sheet
millions of CHF 2011 2010
Assets Liabilities Assets Liabilities
Intangible assets 2.7 102.3 2.4 32.9Property, plant and equipment 2.9 25.0 1.9 19.0Other financial assets 0.8 15.2 0.3 9.3Inventories 32.1 5.9 21.1 5.8Other assets 19.7 14.1 29.1 12.1Non-current provisions 22.7 1.9 13.2 1.9Current provisions 33.0 2.5 34.7 3.4Other current liabilities 21.2 25.9 18.8 29.2Tax loss carryforwards 28.8 – 28.3 –Elimination of intercompany profits 4.1 – 3.7 –Total potential tax effect 168.0 192.8 153.5 113.6
Valuation allowances –8.1 – –15.7 –Deferred income tax—gross 159.9 192.8 137.8 113.6
Offset of assets and liabilities –59.8 –59.8 –47.5 –47.5Net recorded deferred income tax assets and liabilities 100.1 133.0 90.3 66.1
Deferred income taxes directly recorded in equity amounted to CHF 0.1 million (2010: CHF –2.8 million). Thereof, CHF 2.2 million (2010: CHF –0.5 million) are related to the cash flow hedges recognized in other comprehensive income and CHF –2.1 million (2010: CHF –2.3 million) are related to fair value changes on available-for-sale financial assets. In compliance with the exception clause of IAS 12, the corporation does not recognize deferred taxes on investments in subsidiaries in the balance sheet.
Tax loss carryforwards
millions of CHF 2011 2010
Expiring in the next 3 years 14.2 7.9Expiring in 4–7 years 26.3 62.7Available without limitation 91.6 67.3Total tax loss carryforwards 132.1 137.9
Calculated potential tax assets thereof 28.8 28.3Valuation allowances –7.9 –14.4Net tax assets from tax loss carryforwards 20.9 13.9
Deferred income tax assets are recognized for tax loss carryforwards to the extent that the realization of the related tax benefit through future taxable profits is probable.

Financial sectionB
usiness reviewG
overnanceIntroduction
97Sulzer | Annual Report 2011
Notes to the consolidated financial statements
11 Intangible assets
millions of CHF 2011 2010
Goodwill
Other intangible
assets Total Goodwill
Other intangible
assets Total
Acquisition costBalance as of January 1 482.5 251.2 733.7 403.6 197.7 601.3 Changes in scope of consolidation 586.6 276.4 863.0 135.9 66.9 202.8 Additions – 1.8 1.8 – 1.6 1.6 Disposals – –3.8 –3.8 – –3.7 –3.7 Reclassifications – 1.8 1.8 – 1.0 1.0 Currency translation differences –8.2 –2.3 –10.5 –57.0 –12.3 –69.3 Balance as of December 31 1 060.9 525.1 1 586.0 482.5 251.2 733.7
Accumulated amortizationBalance as of January 1 – 104.7 104.7 – 89.4 89.4 Changes in scope of consolidation – 9.8 9.8 – 0.1 0.1 Additions – 39.7 39.7 – 23.0 23.0Disposals – –3.6 –3.6 – –3.3 –3.3 Reclassifications – 0.7 0.7 – –0.4 –0.4 Impairment – 0.2 0.2 – – – Currency translation differences – –0.7 –0.7 – –4.1 –4.1 Balance as of December 31 – 150.8 150.8 – 104.7 104.7
Net book valueAs of January 1 482.5 146.5 629.0 403.6 108.3 511.9As of December 31 1 060.9 374.3 1 435.2 482.5 146.5 629.0
The change in goodwill in 2011 refers to the acquisition of Cardo Flow Solutions and C.L. Engenharia Ltda. (for further information, see note 01). The position “Other intangible assets” includes the capitalized intangible assets in connection with the acquisition of Cardo Flow Solutions as well as purchased patents, licenses, brand names and know-how, software licenses, and capitalized development costs. The amortization of “Other intangible assets” increased mainly due to the amortization of the capitalized intangible assets acquired with Cardo Flow Solutions. In 2003, Sulzer Metco entered into a long-term risk- and revenue-sharing agreement for the development and supply of jet engine components for the Airbus A380. The recoverability of this capitalized intangible asset is directly associated with the long-term development partnership. The corresponding share paid to third parties for the development cost has been capitalized for an amount of CHF 7.5 million as of December 31, 2011 (2010: CHF 8.3 million).
Goodwill impairment test
millions of CHFSulzer
PumpsSulzer Metco
Sulzer Chemtech
Sulzer Turbo Services Total
Goodwill, net book value as of December 31, 2010 77.7 104.1 108.9 191.8 482.5Goodwill, net book value as of December 31, 2011 659.3 101.4 110.9 189.3 1 060.9
The test is based on the following assumptions:Growth rate for the residual amount 1.7% 2.0% 0.0% 0.5%Pretax discount rate 12.4% 12.3% 11.1% 13.4%
Goodwill is allocated to the smallest identifiable cash-generating unit (CGU) identified according to the appropriate operating segment and reported to the CEO (chief operating decision maker). The fair value of this unit is determined by calculating its value in use. The calculation is based on cash flow projections derived from mid-range plans that have been approved by management. Cash flows beyond this planning period are extrapolated using the rather conservative growth rates stated above. The assumptions above were used for the analysis of every cash-generating unit allocated to the appropriate operating segment.

98 Sulzer | Annual Report 2011
Notes to the consolidated financial statements
11 Intangible assets (continued)
Compared with the prior year growth and pretax discount rates were adjusted where necessary. The allocation of goodwill to the segments is displayed in the table above. No impairment charge had to be recognized in 2011 and 2010. Sensitivity analyses with respect to parameters such as growth and discount rate did not give reason to adjust the respective initial impairment test assessments.
12 Property, plant and equipment
millions of CHF 2011
Land and buildings
Machinery and technical
equipment
Other non-current
assets
Assets under
construction Total
Acquisition costBalance as of January 1 366.0 719.5 223.6 36.1 1 345.2Changes in scope of consolidation 43.5 121.4 0.4 1.5 166.8Additions 7.9 31.5 14.0 58.0 111.4Disposals –0.6 –17.2 –8.3 0.1 –26.0Reclassifications –3.5 31.9 0.8 –40.5 –11.3Currency translation differences –4.8 –12.0 –6.5 –0.5 –23.8Balance as of December 31 408.5 875.1 224.0 54.7 1 562.3
Accumulated depreciationBalance as of January 1 137.1 508.3 168.2 – 813.6Changes in scope of consolidation 13.4 86.4 0.2 – 100.0Additions 14.1 46.6 17.9 – 78.6Disposals –0.5 –15.4 –7.3 – –23.2Reclassifications –8.9 –0.6 –0.1 – –9.6Impairment – 0.2 – – 0.2Currency translation differences –2.1 –10.4 –4.3 – –16.8Balance as of December 31 153.1 615.1 174.6 – 942.8
Net book valueAs of January 1 228.9 211.2 55.4 36.1 531.6As of December 31 255.4 260.0 49.4 54.7 619.5
Thereof leased property, plant and equipmentAcquisition cost of leased property, plant and equipment 5.3 1.6 0.2 – 7.1Accumulated depreciation 2.4 0.6 – – 3.0Net book value as of December 31 2.9 1.0 0.2 – 4.1
Leasing commitments (present value) 3.4 0.5 0.2 – 4.1
Fire insurance value 597.4 1 376.0 372.6 54.7 2 400.7
The book value of real estate properties no longer essential for Sulzer’s operations decreased to CHF 3.7 million (2010: CHF 4.7 million). Sulzer plans to sell the remaining properties over time. The fair value of these properties exceeds the book value by approximately CHF 3 million.

Financial sectionB
usiness reviewG
overnanceIntroduction
99Sulzer | Annual Report 2011
Notes to the consolidated financial statements
12 Property, plant and equipment (continued)
millions of CHF 2010
Land and buildings
Machinery and technical
equipment
Other non-current
assets
Assets under
construction Total
Acquisition costBalance as of January 1 534.3 677.9 223.2 39.0 1 474.4Changes in scope of consolidation –148.3 92.3 13.5 –3.9 –46.4Additions 11.1 29.9 14.8 60.7 116.5Disposals –17.9 –31.4 –17.1 0.9 –65.5Reclassifications 20.8 23.3 10.0 –57.7 –3.6Currency translation differences –34.0 –72.5 –20.8 –2.9 –130.2Balance as of December 31 366.0 719.5 223.6 36.1 1 345.2
Accumulated depreciationBalance as of January 1 268.8 477.7 169.8 – 916.3Changes in scope of consolidation –118.1 68.1 12.1 – –37.9Additions 15.7 45.7 18.7 – 80.1Disposals –14.4 –28.7 –16.3 – –59.4Reclassifications –0.3 –0.4 –1.3 – –2.0Impairment 0.2 0.3 1.2 – 1.7Currency translation differences –14.8 –54.4 –16.0 – –85.2Balance as of December 31 137.1 508.3 168.2 – 813.6
Net book valueAs of January 1 265.5 200.2 53.4 39.0 558.1As of December 31 228.9 211.2 55.4 36.1 531.6
Thereof leased property, plant and equipmentAcquisition cost of leased property, plant and equipment 5.7 1.2 0.1 – 7.0Accumulated depreciation 2.3 0.5 – – 2.8Net book value as of December 31 3.4 0.7 0.1 – 4.2
Leasing commitments (present value) 4.0 0.6 – – 4.6
Fire insurance value 545.2 1 124.9 348.0 36.1 2 054.2

100 Sulzer | Annual Report 2011
Notes to the consolidated financial statements
13 Other financial assets
millions of CHF 2011
Available-for- sale financial
assetsLoans and
receivables Total
Balance as of January 1 31.1 4.8 35.9Changes in scope of consolidation – – –Additions – 3.7 3.7Deductions – –0.3 –0.3Reclassifications – – –Changes in fair value –2.9 – –2.9Currency translation differences – –0.2 –0.2Balance as of December 31 28.2 8.0 36.2
millions of CHF 2010
Available-for- sale financial
assetsLoans and
receivables Total
Balance as of January 1 27.4 4.7 32.1Changes in scope of consolidation – –0.2 –0.2Additions – – –Deductions –5.1 –0.1 –5.2Reclassifications – 0.4 0.4Changes in fair value 8.9 – 8.9Currency translation differences –0.1 – –0.1Balance as of December 31 31.1 4.8 35.9
Financial assets that belong to the category “Available-for-sale financial assets” include securities of a capital investment nature and participations of less than 20%. The fair value revaluation of CHF –2.9 million (2010: CHF 8.9 million) was recognized through other comprehensive income not affecting net income. The category “Loans and receivables” includes mainly loans and receivables to third parties with maturities beyond 12 months.The net book value of the category “Available-for-sale financial assets” of CHF 28.2 million consists of the participation in Burckhardt Compression.
14 Inventories
millions of CHF 2011 2010
Raw materials, supplies, and consumables 198.4 148.7Work in progress 329.7 282.9Finished products and trade merchandise 147.3 102.2Total inventories 675.4 533.8
In 2011, Sulzer recognized write-downs of CHF 24.8 million (2010: CHF 15.4 million) in the income statement. Total accumulated write-downs on inventories amounted to CHF 80.9 million as of December 31, 2011 (2010: CHF 66.5 million). Material expenses in 2011 amounted to CHF 1 619.0 million (2010: CHF 1 450.1 million).
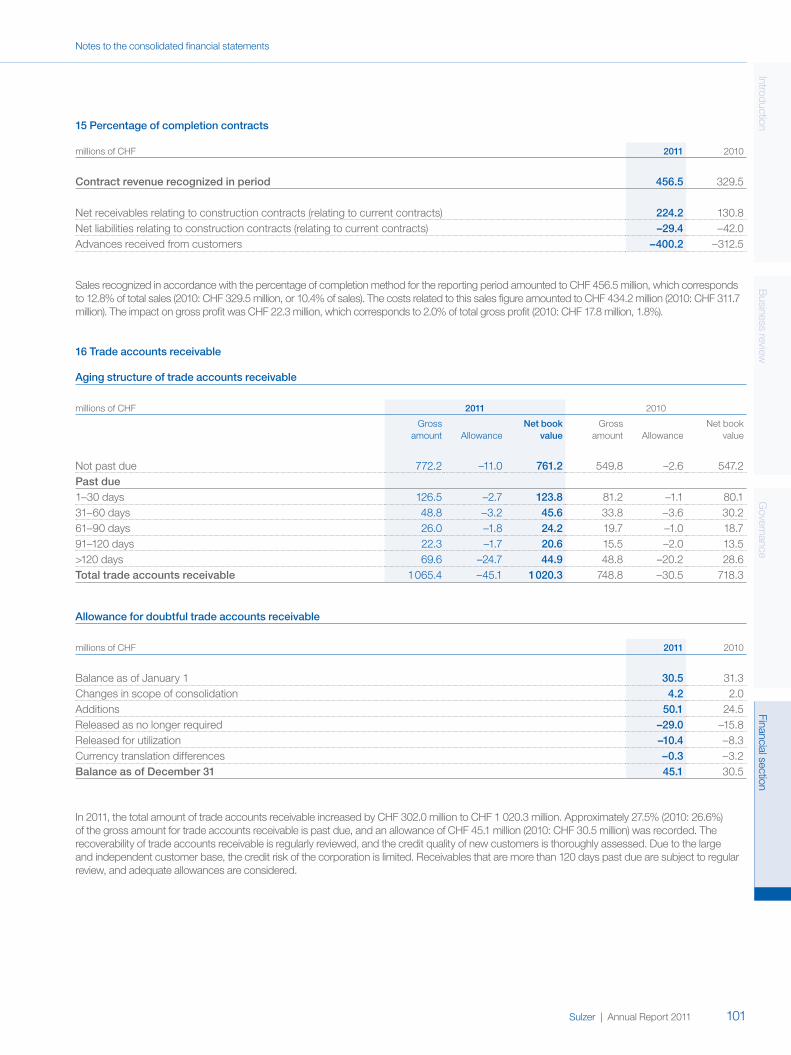
Financial sectionB
usiness reviewG
overnanceIntroduction
101Sulzer | Annual Report 2011
Notes to the consolidated financial statements
15 Percentage of completion contracts
millions of CHF 2011 2010
Contract revenue recognized in period 456.5 329.5
Net receivables relating to construction contracts (relating to current contracts) 224.2 130.8Net liabilities relating to construction contracts (relating to current contracts) –29.4 –42.0Advances received from customers –400.2 –312.5
Sales recognized in accordance with the percentage of completion method for the reporting period amounted to CHF 456.5 million, which corresponds to 12.8% of total sales (2010: CHF 329.5 million, or 10.4% of sales). The costs related to this sales figure amounted to CHF 434.2 million (2010: CHF 311.7 million). The impact on gross profit was CHF 22.3 million, which corresponds to 2.0% of total gross profit (2010: CHF 17.8 million, 1.8%).
16 Trade accounts receivable
Aging structure of trade accounts receivable
millions of CHF 2011 2010
Gross amount Allowance
Net book value
Gross amount Allowance
Net book value
Not past due 772.2 –11.0 761.2 549.8 –2.6 547.2Past due1–30 days 126.5 –2.7 123.8 81.2 –1.1 80.131–60 days 48.8 –3.2 45.6 33.8 –3.6 30.261–90 days 26.0 –1.8 24.2 19.7 –1.0 18.791–120 days 22.3 –1.7 20.6 15.5 –2.0 13.5>120 days 69.6 –24.7 44.9 48.8 –20.2 28.6Total trade accounts receivable 1 065.4 –45.1 1 020.3 748.8 –30.5 718.3
Allowance for doubtful trade accounts receivable
millions of CHF 2011 2010
Balance as of January 1 30.5 31.3Changes in scope of consolidation 4.2 2.0Additions 50.1 24.5Released as no longer required –29.0 –15.8Released for utilization –10.4 –8.3Currency translation differences –0.3 –3.2Balance as of December 31 45.1 30.5
In 2011, the total amount of trade accounts receivable increased by CHF 302.0 million to CHF 1 020.3 million. Approximately 27.5% (2010: 26.6%) of the gross amount for trade accounts receivable is past due, and an allowance of CHF 45.1 million (2010: CHF 30.5 million) was recorded. The recoverability of trade accounts receivable is regularly reviewed, and the credit quality of new customers is thoroughly assessed. Due to the large and independent customer base, the credit risk of the corporation is limited. Receivables that are more than 120 days past due are subject to regular review, and adequate allowances are considered.

102 Sulzer | Annual Report 2011
Notes to the consolidated financial statements
17 Other accounts receivable and prepaid expenses
millions of CHF 2011 2010
Receivables from tax authorities 47.9 43.3Derivative financial instruments 6.6 38.0Other accounts receivable 22.9 54.3Total other accounts receivable 77.4 135.6
Insurance premiums 4.0 3.3Overfunding of employee benefit plans 16.9 18.1Other prepaid expenses 28.5 22.2Total prepaid expenses 49.4 43.6
Total other accounts receivable and prepaid expenses 126.8 179.2
For further details on the position “Derivative financial instruments,” refer to note 27, “Derivative financial instruments.” Other accounts receivable do not include any material positions that are past due or impaired.
18 Assets held for sale
millions of CHF 2011 2010
Property, plant and equipment 0.9 3.7Total assets held for sale 0.9 3.7
Total liabilities directly associated with assets held for sale – –
All amounts disclosed as “Assets held for sale” reflect transactions that Sulzer expects will be closed within the next 12 months. The amount shown as of December 31, 2011, represents the projected sale of properties located in Poland and Germany.
19 Cash and cash equivalents
millions of CHF 2011 2010
Average eff. interest rate Amount
Average eff. interest rate Amount
Cash 379.3 522.8Cash equivalents 43.3 145.3Total cash and cash equivalents 1.47 422.6 1.21 668.1

Financial sectionB
usiness reviewG
overnanceIntroduction
103Sulzer | Annual Report 2011
Notes to the consolidated financial statements
20 Marketable securities
millions of CHF 2011 2010
Designated at fair value through profit or loss 8.1 12.7Total marketable securities 8.1 12.7
Marketable securities designated at fair value through profit or loss as of December 31, 2011, consist of equities (99%) and interest-bearing investments (1%). Fair value adjustments are booked in the financial income.
21 Pledged assets
millions of CHF 2011 2010
Land and buildings 2.4 2.4Machinery and equipment 0.6 0.7Total pledged assets 3.0 3.1
22 Share capital
thousands of CHF 2011 2010
Number of shares
Share capital
Number of shares
Share capital
Balance as of December 31 (par value CHF 0.01) 34 262 370 342.6 34 262 370 342.6
The share capital amounts to CHF 342 623.70, made up of 34 262 370 shares with dividend entitlement with a par value of CHF 0.01. All shares are fully paid in and registered. Further details on the individual equity components are presented in the consolidated statement of changes in equity on page 70.
Share ownershipSulzer shares are freely transferable provided that, when requested by the company to do so, buyers declare that they have purchased and will hold the shares in their own name and for their own account. Nominees shall only be entered in the share register with the right to vote, provided that they meet the following conditions: The nominee is subject to the supervision of a recognized banking and financial market regulator; the nominee has entered into an agreement with the Board of Directors concerning his status; the share capital held by the nominee does not exceed 3% of the registered share capital entered in the commercial register; and the names, addresses, and number of shares of those individuals for whose account the nominee holds at least 0.5% of the share capital have been disclosed. The Board of Directors is also entitled, beyond these limits, to enter shares of nominees with voting rights in the share register, provided that the above-mentioned conditions are met (see also paragraph 6a of the Articles of Association at www.sulzer.com/regulations).
2011 2010
Number of shares in %
Number of shares in %
Shareholders holding more than 3% and Sulzer LtdRenova Group 10 699 797 31.23 10 689 797 31.20Threadneedle Asset Management Holdings Ltd 1 028 210 3.00Sulzer Ltd 457 863 1.34 546 478 1.59
Sulzer Ltd is not aware of any other agreements between the shareholders named above regarding the shares held or regarding the execution of voting rights. The total number of shares held by Sulzer Ltd as of December 31, 2011, amounted to 457 863, which are mainly held for the purpose of the management stock option and restricted stock unit plan (refer to note 32).

104 Sulzer | Annual Report 2011
Notes to the consolidated financial statements
23 Earnings per share
2011 2010
Net income attributable to shareholders of Sulzer Ltd (millions of CHF) 279.8 300.4Average number of shares outstanding 33 906 689 33 693 120Adjustment for share participation plans 254 852 366 166Average number of shares for calculating diluted earnings per share 34 161 541 34 059 286
Earnings per share, attributable to a shareholder of Sulzer Ltd (in CHF)Basic earnings per share 8.25 8.92Diluted earnings per share 8.19 8.82Dividend per share 3.001) 3.001) Proposal to the Annual General Meeting.
24 Borrowings
millions of CHF 2011 2010
Short-term Long-term Total Short-term Long-term Total
Bonds – 496.6 496.6 – – –Bank loans 235.8 22.9 258.7 83.2 31.1 114.3Mortgage loans – 7.3 7.3 – 7.7 7.7Other loans and debts – 0.5 0.5 0.4 0.9 1.3Leasing obligations 0.4 4.1 4.5 0.2 4.5 4.7Total borrowings 236.2 531.4 767.6 83.8 44.2 128.0– thereof due in <1 year 236.2 – 236.2 83.8 – 83.8– thereof due in 1–5 years – 516.7 516.7 – 28.9 28.9– thereof due in >5 years – 14.7 14.7 – 15.3 15.3
Compared to 2010, the outstanding short-term borrowings increased by CHF 152.4 million. The use of the syndicated credit line, which was established in 2007, was CHF 195.9 million as of December 31, 2011. It is subject to financial covenants based on net financial indebtness and EBITDA. During 2011, the outstanding long-term borrowings increased by CHF 487.2 million, in particular due to the issue of a long-term bond. The fair value of the outstanding bond amounts to CHF 511.1 million as per December 31, 2011. The fair value of the other financial borrowings is approximately equivalent to their carrying amount.
Borrowings by currency
2011 2010
millions of CHF in %
Interest rate
millions of CHF in %
Interest rate
BRL 16.2 2.1 4.5% 19.2 15.0 4.5%CHF 662.2 86.3 1.8% 45.8 35.8 0.5%EUR 45.9 6.0 2.8% 43.9 34.3 2.8%GBP 11.7 1.5 1.3% 11.8 9.2 1.2%USD 10.3 1.3 4.6% 2.4 1.9 2.8%Other 21.3 2.8 – 4.9 3.8 –Total 767.6 100.0 – 128.0 100.0 –

Financial sectionB
usiness reviewG
overnanceIntroduction
105Sulzer | Annual Report 2011
Notes to the consolidated financial statements
Outstanding bond
millions of CHF 2011 2010
Amortized costs Nominal
Amortized costs Nominal
2.25% 2011–2016 496.6 500.0 – –Total 496.6 500.0 – –
In the year under review, Sulzer Ltd issued a CHF-denominated 2.25% domestic bond in the aggregate principal amount of CHF 500 million for a term of five years. The subscription took place on July 6, 2011. The effective interest rate is 2.42%.
25 Provisions
millions of CHFEmployee
benefit plans1)
Other employee benefits
Warranties/ liabilities Restructuring Environmental Other Total
Balance as of December 31, 2010 93.2 53.3 107.1 10.5 20.6 85.3 370.0
Changes in scope of consolidation 9.4 – 8.0 4.8 – 9.3 31.5Additions 5.1 1.7 50.9 8.4 –0.5 35.7 101.3Released as no longer required –0.5 –1.7 –19.4 –0.4 – –5.3 –27.3Released for utilization –4.0 –10.5 –28.7 –4.9 –0.1 –24.9 –73.1Reclassifications – – – – –1.5 1.3 –0.2Currency translation differences –1.9 –0.4 –4.4 –0.2 – –0.2 –7.1Total provisions as of December 31, 2011 101.3 42.4 113.5 18.2 18.5 101.2 395.1– thereof non-current 101.3 36.9 19.9 5.1 18.3 42.3 223.8– thereof current – 5.5 93.6 13.1 0.2 58.9 171.31) For further details of employee benefit plans refer to note 06.
The largest position in provisions refers to “Warranties/liabilities.” These provisions include customer claims, penalties, litigation, and legal cases relating predominantly to delivered goods. In 2011, this position increased by CHF 6.4 million to CHF 113.5 million. The provision for risks referring to an ongoing dispute with the purchaser of the locomotive business is accrued within this category. The category “Other employee benefits” decreased by CHF 10.9 million to CHF 42.4 million. The main reason for the decrease was the significant decrease of the provision in connection with the cash-settled stock option plans (see note 32). This liability is measured at fair value at each balance sheet date and adjusted for vesting reasons. The liability amounted to CHF 0.8 million as of December 31, 2011 (2010: CHF 11.3 million). The remaining portion of “Other employee benefits” includes provisions for jubilee gifts, early retirement of senior managers, and other obligations to employees. The provisions in the “Environmental” category cover the obligations from risks related to environmental issues. “Other” includes provisions that do not fit into the aforementioned categories. A large number of these provisions refer to onerous contracts. In addition, a provision for ongoing asbestos lawsuits is included. Based on the currently known facts, Sulzer is of the opinion that the resolution of the open cases will not have material effects on its liquidity or financial condition. Although Sulzer expects a large part of the category “Other” to be realized in 2012, by their nature, the amounts and timing of any cash outflows are difficult to predict.

106 Sulzer | Annual Report 2011
Notes to the consolidated financial statements
26 Other current and accrued liabilities
millions of CHF 2011 2010
Notes payable 3.3 2.2Social security institutions 12.6 10.6Taxes (VAT, withholding tax) 27.9 28.6Derivative financial instruments 16.6 13.3Other current liabilities 47.0 73.0Total other current liabilities 107.4 127.7
Vacation and overtime claims 39.6 32.4Salaries, wages, and bonuses 87.4 79.7Contract-related costs 98.4 106.3Other accrued liabilities 86.5 56.9Total accrued liabilities 311.9 275.3
Total other current and accrued liabilities 419.3 403.0
The line “Other current liabilities” includes a forward contract on treasury shares of CHF 19.2 million (2010: CHF 19.2 million). The accrued liabilities for vacation and overtime claims as well as salaries, wages, and bonuses increased by 13% due to the higher number of employees.
27 Derivative financial instruments
millions of CHF 2011 2010
Derivative assets Derivative liabilities Derivative assets Derivative liabilities
Notional value
Fair value
Notional value
Fair value
Notional value
Fair value
Notional value
Fair value
Forward exchange contracts 487.0 6.1 589.2 16.8 651.2 26.9 555.9 13.9Other forward contracts – – 2.1 0.1 – – – –Other options 37.4 0.8 – – 62.6 11.3 – –Total 524.4 6.9 591.3 16.9 713.8 38.2 555.9 13.9– thereof due in <1 year 510.4 585.4 707.4 540.4– thereof due in 1–2 years 14.0 5.9 6.4 15.5– thereof due in 2–5 years – – – –– thereof due in >5 years – – – –
The notional and the fair value of derivative assets and liabilities include current and also non-current derivative financial instruments. The cash flow hedges of the expected future sales were assessed as highly effective. As at December 31, 2011, a net unrealized profit of CHF 0.4 million (2010: CHF 9.0 million) with a deferred tax asset of CHF 2.2 million (2010: deferred tax liability of CHF 0.5 million) relating to these cash flow hedges were included in equity. In 2011, a gain of CHF 5.9 million (2010: a loss of CHF 0.5 million) cash flow hedge reserve was recognized in profit or loss. There was no ineffectiveness that arose from cash flow hedges in 2011 (2010: CHF 0.0 million). There was no ineffectiveness to be recorded from fair value hedges and net investments in foreign entity hedges. The maximum exposure to credit risk at the reporting date is the fair value of the derivative assets in the balance sheet.
The notional value of the outstanding forward foreign exchange contracts as at December 31, 2011, amounted to CHF 1 076.2 million (2010: CHF 1 207.1 million). The hedged, highly probable forecast transactions denominated in foreign currency are mostly expected to occur at various dates during the next 12 months. Gains and losses recognized in the hedging reserve (cash flow hedges) in equity on forward foreign exchange contracts as of December 31, 2011, are recognized either in sales, cost of goods sold, or in other operating income/expenses in the period or periods during which the hedged transaction affects the income statement. This is generally within 12 months from the balance sheet date unless the gain or loss is included in the initial amount recognized for the purchase of fixed assets, in which case, recognition is over the lifetime of the asset (5 to 10 years).

Financial sectionB
usiness reviewG
overnanceIntroduction
107Sulzer | Annual Report 2011
Notes to the consolidated financial statements
28 Other financial commitments
millions of CHF 2011 2010
Rented premises Other Total
Rented premises Other Total
Maturity <1 year 22.1 10.2 32.3 14.6 7.4 22.0Maturity 1–5 years 51.1 14.4 65.5 38.5 12.1 50.6Maturity >5 years 16.2 – 16.2 23.9 0.1 24.0Operating lease 89.4 24.6 114.0 77.0 19.6 96.6
Total commitments for future investments and acquisitions 0.4 2.4 2.8 – 1.5 1.5
29 Contingent liabilities
millions of CHF 2011 2010
Pledges in favor of third parties 1.8 1.5Guarantees in favor of third parties – –Total contingent liabilities 1.8 1.5
30 Cash flow from acquisitions
millions of CHF 2011 2010
Non-current assets –308.7 –143.9Inventories –68.2 –21.9Other current assets –181.0 –80.2Liabilities 193.4 152.4Identified acquired net assets –364.5 –93.6Cash acquired 43.9 36.5Subtotal –320.6 –57.1Goodwill –541.2 –141.9Purchase of loans given – –Purchase price to be paid in future periods 0.7 1.0Payments of purchase price relating to prior periods –3.4 –Total cash flow from acquisitions –864.5 –198.0
Refer to note 01 for information on the acquisitions and their impact in 2010 and 2011.

108 Sulzer | Annual Report 2011
Notes to the consolidated financial statements
31 Capital expenditure by category (unaudited)
millions of CHF 2011 in % 2010 in %
Expansion 63.0 55.6 71.7 60.7Rationalization 2.3 2.0 3.8 3.2Replacing 31.7 28.0 20.4 17.3IT 6.3 5.6 6.9 5.8QESH (Quality, environment, safety, and health) 2.9 2.6 2.1 1.8Other 7.0 6.2 13.2 11.2Total capital expenditure by category 113.2 100.0 118.1 100.0
The total capital expenditure for intangible assets amounted to CHF 1.8 million (2010: CHF 1.6 million) and for property, plant and equipment to CHF 111.4 million (2010: CHF 116.5 million).
32 Share participation plans
Stock option planFrom 2002 until 2008, there was a Sulzer stock option plan in place for the Sulzer Management Group and board members. Awards were made annually and were dependent on the organizational position of the employee. The exercise price was determined on the basis of the average stock market price of the Sulzer share during the last ten days before the options were granted. Sulzer operates equity- and cash-settled compensation plans. For equity-settled compensation plans, 25% of the options vest after one year, with an additional 25% vesting in each of the following three years. Equity-settled options are valid for ten years from the grant date. They do not lead to an increase of the company’s share capital. For cash-settled compensation plans, one-third of the options vest after one year, with an additional one-third vesting in each of the following two years. Cash-settled options are valid for five years from the date of grant. One option entitles the purchase of ten shares. In 2011, a total of CHF 0.0 million was charged to the operating income for the existing option plans. In the previous year, CHF 1.4 million was included in operating income. The cash-settled plan is hedged with derivative instruments of a Swiss bank.
For details on option holdings by members of the Board of Directors and the Executive Committee, see note 109 of Sulzer Ltd’s financial statements.
Option right for ten Sulzer shares 2011
Grant yearOutstanding
01.01.2011Granted
2011Exercised
2011Forfeited
2011Expired
2011Outstanding
31.12.2011
Average exercise price
in CHF
2002 1 829 – 579 – – 1 250 34.082003 1 650 – 260 – – 1 390 17.302004 4 030 – 1 150 – – 2 880 31.802005 4 938 – 1 595 – – 3 343 52.202006 5 050 – 5 050 – – – 94.202007 16 500 – 5 340 240 – 10 920 149.502008 25 522 – 9 080 360 – 16 082 127.90Total 59 519 – 23 054 600 – 35 865 –
Weighted average exercise price in CHF 112.30 – 111.89 136.54 – 112.15 –

Financial sectionB
usiness reviewG
overnanceIntroduction
109Sulzer | Annual Report 2011
Notes to the consolidated financial statements
32 Share participation plans (continued)
Option right for ten Sulzer shares 2010
Grant yearOutstanding
01.01.2010Granted
2010Exercised
2010Forfeited
2010Expired
2010Outstanding
31.12.2010
Average exercise price
in CHF
2002 2 365 – 536 – – 1 829 34.322003 3 050 – 1 400 – – 1 650 17.302004 7 030 – 3 000 – – 4 030 31.802005 9 913 – 4 975 – – 4 938 52.202006 21 852 – 16 442 360 – 5 050 94.202007 32 182 – 15 282 400 – 16 500 149.502008 35 442 – 9 040 880 – 25 522 127.90Total 111 834 – 50 675 1 640 – 59 519 –
Weighted average exercise price in CHF 109.78 – 106.31 125.77 – 112.30 –
Expiry of option rights for ten Sulzer shares
Year of expiry 2011 2010
Number of options
Average exercise
price in CHFNumber of
options
Average exercise
price in CHF
2011 – – 5 050 94.202012 12 170 137.65 18 329 138.012013 17 472 119.10 27 172 121.182014 2 880 31.80 4 030 31.802015 3 343 52.20 4 938 52.20Outstanding as of December 31 35 865 – 59 519 –
In 2011, no options were granted.
Restricted stock unit plan settled in Sulzer shares Since 2009, there has been a restricted stock unit (RSU) plan in place for the Sulzer Management Group and board members. Awards are made annually and depend on the organizational position of the employee. For equity-settled restricted stock unit plans, one-third of the RSUs vest after one year, with an additional one-third vesting in each of the following two years. One RSU award is settled with one Sulzer share. The number of awards granted is determined on the basis of the average stock market price of the Sulzer share during the last ten days before the awards are granted and the cash equivalent determined per participant. After vesting, the unrestricted shares are transferred to the plan participant. They do not lead to an increase of the company’s share capital. In 2011, a total of CHF 7.4 million (2010: CHF 6.7 million) was charged for this restricted stock unit plan to the operating income. Awards to members of the Board of Directors automatically vest with the departure from the board.
For details of restricted stock unit holdings by members of the Board of Directors and the Executive Committee, see note 109 of the financial statements of Sulzer Ltd.

110 Sulzer | Annual Report 2011
Notes to the consolidated financial statements
32 Share participation plans (continued)
Restricted stock units 2011
Grant yearOutstanding
01.01.2011Granted
2011Exercised
2011Forfeited
2011Expired
2011Outstanding
31.12.2011
Average stock price at grant
date in CHF
2009 109 616 – 60 707 352 – 48 557 47.482010 75 170 – 27 215 2 773 – 45 182 98.412011 – 55 938 390 2 079 – 53 469 142.62Total 184 786 55 938 88 312 5 204 – 147 208 –
Restricted stock units 2010
Grant yearOutstanding
01.01.2010Granted
2010Exercised
2010Forfeited
2010Expired
2010Outstanding
31.12.2010
Average stock price at grant
date in CHF
2009 184 870 – 63 379 11 875 – 109 616 47.482010 – 79 290 – 4 120 – 75 170 98.41Total 184 870 79 290 63 379 15 995 – 184 786 –
Performance share plan settled in Sulzer shares For members of the Executive Committee, a performance share plan (PSP) was introduced in 2010. It is a front-loaded one-off plan with a performance period of three years (2010–2012). Executive Committee members received performance share units (PSUs) of Sulzer Ltd, Winterthur, as a portion of their compensation. The PSP includes a requirement for the participants to invest a portion of their restricted stock unit (RSU) grants 2010–2012 into the PSP. The company matched these investments by a defined co-investment. The number of the performance share units (PSUs) granted at the grant date is based on the number of RSUs shifted into the PSP and the company match divided by the grant price of the 2010 RSU plan. The achievement of the defined performance indicators based on financial objectives determines the effective number of PSUs to be vested on March 31, 2013. The plan does not lead to an increase of the company’s share capital. In 2011, a total of CHF 3.1 million (2010: CHF 1.3 million) was charged to the operating income.
For details of performance share units by members of the Executive Committee, see note 109 of the financial statements of Sulzer Ltd.
Performance share units 2011
Grant yearOutstanding
01.01.2011Granted
2011Exercised
2011Forfeited
2011Expired
2011Outstanding
31.12.2011
Average stock price at grant
date in CHF
2010 46 660 5 305 – 20 322 – 31 643 98.41

Financial sectionB
usiness reviewG
overnanceIntroduction
111Sulzer | Annual Report 2011
Notes to the consolidated financial statements
33 Transactions with members of the Board of Directors, Executive Committee, and related parties
Key management compensation
thousands of CHF 2011 2010
Short-term benefits
Equity-based compensation
Pensions and social
contributions TotalShort-term
benefitsEquity-based
compensation
Pensions and social
contributions Total
Board of Directors 1 026 926 144 2 096 927 1 069 85 2 081Executive Committee 7 321 4 544 1 682 13 547 6 256 3 150 1 381 10 787
The amounts for equity-based compensation are valued according to IFRS 2. There are no outstanding loans with members of the Board of Directors or the Executive Committee as per balance sheet date.
No shares have been granted to members of the Board of Directors, the Executive Committee, or related persons, with the exception of shares granted in connection with equity-settled plans and service awards.
Related partiesAdministration and asset management of the Sulzer pension fund in Switzerland is done by staff members of Sulzer Management Ltd. The individual foundations do not have their own staff. The related costs were invoiced to the foundations (2011: CHF 4.2 million; 2010: CHF 3.4 million). As of December 31, 2011, sales with related parties controlled by the major shareholder (Renova Group) amounted to CHF 1.2 million (2010: CHF 8.3 million) with open receivables of CHF 0.5 million. Fees for consulting services from a company controlled by the major shareholder of Sulzer amounted to CHF 0.4 million (2010: CHF 0.2 million). Sales recorded with other related parties amounted to CHF 5.9 million and costs of goods sold to CHF 6.9 million. Receivables and payables related therewith amounted to CHF 1.3 million and CHF 2.3 million respectively.
At the time of completion of the corporation’s consolidated financial statements on February 14, 2012, no other major business transactions or outstanding balances with the Renova Group, their representatives, or any other related parties or companies were known.
Board and Executive Committee compensation disclosures as required by Swiss law (article CO 663b–663c)These consolidated financial statements have been prepared in accordance with IFRS. The compensation disclosure requirements in accordance with the Swiss law for companies, the Swiss Code of Obligations (CO), are disclosed in the financial statements of Sulzer Ltd, note 109.
34 Auditor remuneration
Fees for the audit work by PricewaterhouseCoopers as the group auditor amounted to CHF 2.8 million (2010: CHF 2.9 million). Additional services provided by PricewaterhouseCoopers amounted to total CHF 0.3 million (2010: CHF 0.6 million). This figure includes CHF 0.1 million (2010: CHF 0.2 million) for accounting-related fees and CHF 0.2 million (2010: CHF 0.4 million) for tax and legal fees.
35 Corporate risk management process
Sulzer has an integrated risk management system that is under constant scrutiny for further improvement.
A defined risk management process and four common tools (risk assessment schedule, risk-profiling matrix, risk description schedule, loss control schedule) are applied in order to assess and control all key risks, to implement and maintain risk financing and risk transfer measures, to monitor the results, and to define and implement corrective actions if required. The divisions and the corporation generate their respective key risk-profiling matrices and complete and update the related risk control schedules on an annual basis. These schedules identify specific risk exposures and the related risk objectives, list existing loss controls, address their effectiveness, list (where required) additional or alternative loss controls, and determine responsibilities and time frames for their implementation. The divisions’ key risk-profiling matrices are reviewed at the corporate level and are then consolidated into a division’s key risk-profiling matrix. The head of Corporate Risk Management informs the Audit Committee at least once a year of the current risks and risk mitigation as well as of the progress toward achieving major risk objectives. The risk management process is audited by corporate auditing.

112 Sulzer | Annual Report 2011
Notes to the consolidated financial statements
36 Subsequent events after the balance sheet date
On January 10, 2012, Sulzer Pumps acquired the assets and liabilities of the privately owned pump company Hidrotecar S.A. in Burgos, Spain, for a purchase price of EUR 11.5 million (approximately CHF 14.0 million). The acquired company achieved sales of EUR 13 million (approximately CHF 16 million) in 2010 and it employs about 50 people. With this acquisition, Sulzer Pumps is adding complementary products to its product range and reinforcing its presence in the attractive water markets in Europe, the Middle East, and Africa.
The Board of Directors authorized these consolidated financial statements for issue on February 14, 2012. They are subject to approval at the Annual General Meeting, which will be held on April 5, 2012. The Board of Directors and the Executive Committee are, at the time of completion of the corporation’s consolidated financial statements on February 14, 2012, not aware of any events that would materially affect these statements.

Financial sectionB
usiness reviewG
overnanceIntroduction
113Sulzer | Annual Report 2011
Notes to the consolidated financial statements
37 Major subsidiaries
31.12.2011 Europe
Subsidiary General manager
Participation Registered capital (including paid-in capital in the USA
and Canada)
Research and development
Production and engineering Sales Service Division
Switzerland Sulzer Pumpen AG, Winterthur 100% SulzerKim Jackson CHF 3 000 000 Pumps
Sulzer Metco AG, Wohlen 100% SulzerMarkus Sauerbruch CHF 5 000 000 Metco
Sulzer Chemtech AG, Winterthur 100% Sulzer Urs Fankhauser CHF 10 000 000 Chemtech
Sulzer Mixpac AG, Haag 100% SulzerOliver Bailer CHF 100 000 Chemtech
Sulzer Markets and Technology AG, Winterthur 100% OthersUrs Hirt CHF 4 000 000
Sulzer Management AG, Winterthur 100% OthersJürgen Brandt CHF 500 000
Sulzer Finance (Switzerland) AG, Winterthur 100% OthersJean-Daniel Millasson CHF 3 600 000
Germany Sulzer Pumpen (Deutschland) GmbH, Bruchsal 100% SulzerGert Müller EUR 2 300 000 Pumps
Cardo Production Lohmar GmbH, Lohmar 100% SulzerWerner Simon EUR 41 978 000 Pumps
Sulzer Metco Europe GmbH, Kelsterbach 100% SulzerPaul-Heinz Müller-Planteur EUR 1 000 000 Metco
Sulzer Metco Coatings GmbH, Salzgitter 100% SulzerFranz Jansen EUR 1 000 000 Metco
Sulzer Friction Systems (Germany) GmbH, Bremen 100% SulzerDietmar Köster EUR 1 000 000 Metco
Sulzer Metaplas GmbH, Bergisch Gladbach 100% SulzerValentin Bühler EUR 1 000 000 Metco
Sulzer Metco WOKA GmbH, Barchfeld 100% SulzerSalvatore Musso EUR 1 000 000 Metco
Sulzer Chemtech GmbH, Linden 100% SulzerRoland Böcher EUR 300 000 Chemtech
Sulzer Holding (Deutschland) GmbH, Singen 100% OthersGert Müller EUR 20 000 000
Sulzer Beteiligungen (Deutschland) GmbH, Singen 100% OthersGert Müller EUR 25 000
Finland Sulzer Pumps Finland Oy, Kotka 100% SulzerMikko Hirvensalo EUR 16 000 000 Pumps
France Sulzer Pompes France SASU, Mantes 100% SulzerEric de Truchis EUR 6 600 000 Pumps
Sulzer Pompes Process SASU, Schweighouse-s/Moder 100% SulzerLaurent Riva EUR 462 000 Pumps
Sulzer Sorevi S.A.S., Limoges 100% SulzerValentin Bühler EUR 250 000 Metco
Great Britain Sulzer Pumps (UK) Ltd., Leeds 100% SulzerRichard Whiteley GBP 9 610 000 Pumps
Sulzer Metco (UK) Ltd., Cwmbran 100% SulzerAndy Coomber GBP 500 000 Metco
Sulzer Metco Coatings Ltd., Cheshire 100% SulzerBarry Godwin GBP 57 125 Metco
Neomet Ltd., Stockport 100% SulzerRichard Hammersley GBP 292 671 Metco
Sulzer Chemtech (UK) Ltd., Stockton on Tees 100% SulzerJonathan Marley GBP 100 000 Chemtech
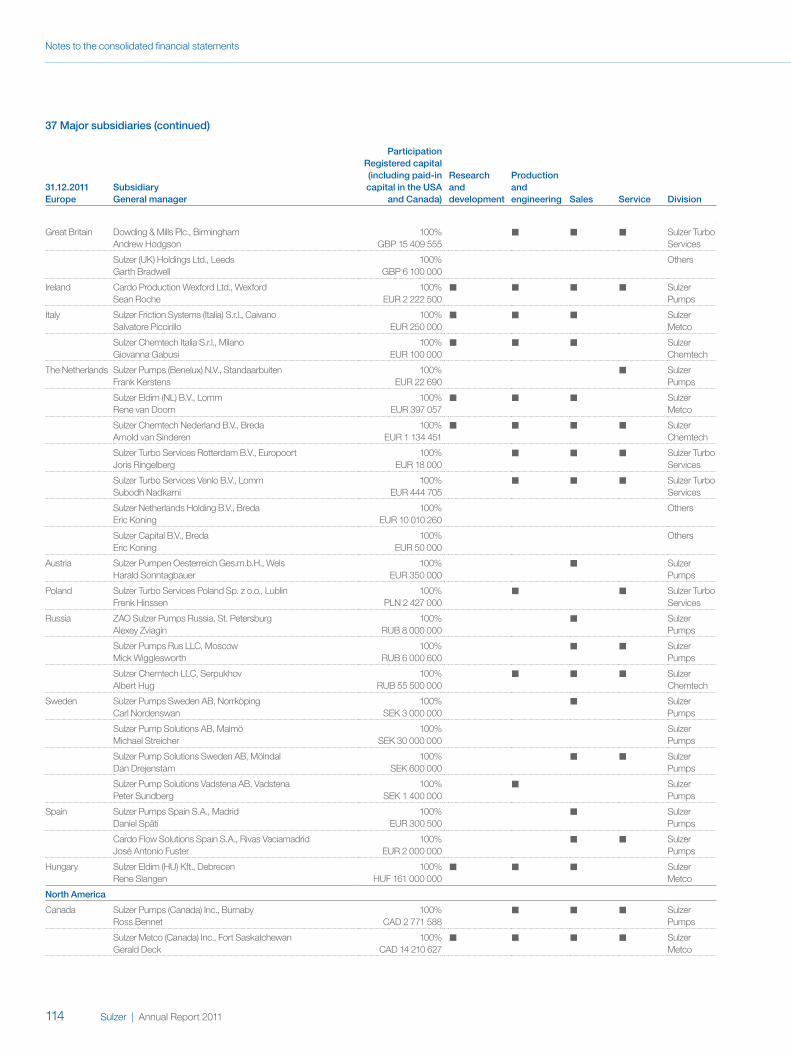
114 Sulzer | Annual Report 2011
Notes to the consolidated financial statements
Great Britain Dowding & Mills Plc., Birmingham 100% Sulzer TurboAndrew Hodgson GBP 15 409 555 Services
Sulzer (UK) Holdings Ltd., Leeds 100% OthersGarth Bradwell GBP 6 100 000
Ireland Cardo Production Wexford Ltd., Wexford 100% SulzerSean Roche EUR 2 222 500 Pumps
Italy Sulzer Friction Systems (Italia) S.r.l., Caivano 100% SulzerSalvatore Piccirillo EUR 250 000 Metco
Sulzer Chemtech Italia S.r.l., Milano 100% SulzerGiovanna Gabusi EUR 100 000 Chemtech
The Netherlands Sulzer Pumps (Benelux) N.V., Standaarbuiten 100% SulzerFrank Kerstens EUR 22 690 Pumps
Sulzer Eldim (NL) B.V., Lomm 100% SulzerRene van Doorn EUR 397 057 Metco
Sulzer Chemtech Nederland B.V., Breda 100% SulzerArnold van Sinderen EUR 1 134 451 Chemtech
Sulzer Turbo Services Rotterdam B.V., Europoort 100% Sulzer TurboJoris Ringelberg EUR 18 000 Services
Sulzer Turbo Services Venlo B.V., Lomm 100% Sulzer TurboSubodh Nadkarni EUR 444 705 Services
Sulzer Netherlands Holding B.V., Breda 100% OthersEric Koning EUR 10 010 260
Sulzer Capital B.V., Breda 100% OthersEric Koning EUR 50 000
Austria Sulzer Pumpen Oesterreich Ges.m.b.H., Wels 100% SulzerHarald Sonntagbauer EUR 350 000 Pumps
Poland Sulzer Turbo Services Poland Sp. z o.o., Lublin 100% Sulzer TurboFrenk Hinssen PLN 2 427 000 Services
Russia ZAO Sulzer Pumps Russia, St. Petersburg 100% SulzerAlexey Zviagin RUB 8 000 000 Pumps
Sulzer Pumps Rus LLC, Moscow 100% SulzerMick Wigglesworth RUB 6 000 600 Pumps
Sulzer Chemtech LLC, Serpukhov 100% SulzerAlbert Hug RUB 55 500 000 Chemtech
Sweden Sulzer Pumps Sweden AB, Norrköping 100% SulzerCarl Nordenswan SEK 3 000 000 Pumps
Sulzer Pump Solutions AB, Malmö 100% SulzerMichael Streicher SEK 30 000 000 Pumps
Sulzer Pump Solutions Sweden AB, Mölndal 100% SulzerDan Drejenstam SEK 600 000 Pumps
Sulzer Pump Solutions Vadstena AB, Vadstena 100% SulzerPeter Sundberg SEK 1 400 000 Pumps
Spain Sulzer Pumps Spain S.A., Madrid 100% SulzerDaniel Späti EUR 300 500 Pumps
Cardo Flow Solutions Spain S.A., Rivas Vaciamadrid 100% SulzerJosé Antonio Fuster EUR 2 000 000 Pumps
Hungary Sulzer Eldim (HU) Kft., Debrecen 100% SulzerRene Slangen HUF 161 000 000 Metco
North America
Canada Sulzer Pumps (Canada) Inc., Burnaby 100% SulzerRoss Bennet CAD 2 771 588 Pumps
Sulzer Metco (Canada) Inc., Fort Saskatchewan 100% SulzerGerald Deck CAD 14 210 627 Metco
37 Major subsidiaries (continued)
31.12.2011 Europe
Subsidiary General manager
Participation Registered capital (including paid-in capital in the USA
and Canada)
Research and development
Production and engineering Sales Service Division

Financial sectionB
usiness reviewG
overnanceIntroduction
115Sulzer | Annual Report 2011
Notes to the consolidated financial statements
Canada Sulzer Chemtech Canada Inc., Edmonton 100% SulzerGanapathy Murthy CAD 1 000 000 Chemtech
Sulzer Turbo Services Canada Ltd., Edmonton 100% Sulzer TurboJohn O’Connor CAD 7 000 000 Services
USA Sulzer Pumps (US) Inc., Brookshire, Texas 100% SulzerMauricio Bannwart USD 40 381 108 Pumps
Sulzer Process Pumps (US) Inc., Easley, South Carolina 100% SulzerAlan Crawford USD 27 146 250 Pumps
Sulzer Metco (US) Inc., Westbury, New York 100% SulzerFriedrich Herold USD 26 865 993 Metco
Sulzer Friction Systems (US) Inc., Dayton, Ohio 100% SulzerEric Schueler USD 1 236 953 Metco
Sulzer Chemtech USA Inc., Tulsa, Oklahoma 100% SulzerLance Golwas USD 47 895 000 Chemtech
Sulzer Mixpac USA Inc., Salem, New Hampshire 100% SulzerRichard Wilson USD 100 Chemtech
Sulzer Turbo Services Houston Inc., La Porte, Texas 100% Sulzer TurboDarayus Pardivala USD 18 840 000 Services
Sulzer Turbo Services New Orleans Inc., Belle Chasse, Louisiana 100% Sulzer TurboDarayus Pardivala USD 4 006 122 Services
Sulzer EMS Inc., Phoenix, Arizona 100% Sulzer TurboDarayus Pardivala USD 97 Services
Sulzer US Holding Inc., Sugar Land, Texas 100% OthersKelli Edell USD 200 561 040
Mexico Sulzer Pumps México, S.A. de C.V., Cuautitlán Izcalli 100% SulzerMarcelo Suhner MXN 4 887 413 Pumps
Sulzer Chemtech, S. de R.L. de C.V., Cuautitlán Izcalli 100% SulzerLeopoldo Rodriguez MXN 31 345 500 Chemtech
Central and South America
Argentina Sulzer Turbo Services Argentina S.A., Buenos Aires 100% Sulzer TurboFlavio Romero ARS 7 730 091 Services
Brasil Sulzer Brasil S.A., Jundiaí 100% SulzerRicardo Coco BRL 82 054 659 Pumps
ABS Industria de Bombas Centrifugas Ltda., Curitiba 100% SulzerJosé César Grande BRL 8 077 706 Pumps
Sulzer Friction Systems do Brasil Ltda., Diadema 100% SulzerRonald Bremberger BRL 4 418 273 Metco
CL Engenharia Ltda., Triunfo 100% SulzerJorge Celada BRL 5 700 000 Chemtech
Venezuela Sulzer Pumps (Venezuela) S.A., Barcelona 100% SulzerPablo Moros VEB 200 000 000 Pumps
Sulzer Turbo Services Venezuela S.A., Caracas 100% Sulzer TurboFlavio Romero VEB 5 000 Services
Africa
South Africa Sulzer Pumps (South Africa) (Pty) Ltd., Elandsfontein 75% SulzerRicardo Coco ZAR 100 450 000 Pumps
Sulzer (South Africa) Holdings (Pty) Ltd., Elandsfontein 100% SulzerRicardo Coco ZAR 16 476 Pumps
Nigeria Sulzer Pumps (Nigeria) Ltd., Lagos 100% SulzerAndrew Percy NGN 10 000 000 Pumps
37 Major subsidiaries (continued)
31.12.2011 North America
Subsidiary General manager
Participation Registered capital (including paid-in capital in the USA
and Canada)
Research and development
Production and engineering Sales Service Division

116 Sulzer | Annual Report 2011
Notes to the consolidated financial statements
United Arab Emirates
Sulzer Pumps Middle East FZCO, Dubai 100% SulzerAndreas Schulte AED 500 000 Pumps
Saudi Arabia Sulzer Pumps (Saudi Arabia) LLC, Al Khobar 100% SulzerRajesh Chakravarty SAR 1 000 000 Pumps
Bahrain Sulzer Chemtech Middle East S.P.C., Al Seef 100% SulzerRafic Traboulssi BHD 50 000 Chemtech
Asia
India Sulzer Pumps India Ltd., Navi Mumbai 99% SulzerRamanathan Venkatasubramanian INR 25 000 000 Pumps
Sulzer Tech India Pvt. Ltd., Navi Mumbai 100% SulzerA.S. Kothekar INR 100 000 Pumps
Sulzer Friction Systems (India) Ltd., Chennai 100% SulzerVeeraganta Bhaskara Ramam INR 7 100 000 Metco
Sulzer India Ltd.1), Pune 96% SulzerBalaji Bakthisaran INR 34 500 000 Chemtech
Sulzer Chemtech Tower Field Services (India) Pvt. Ltd., Mumbai 100% SulzerS Ramann INR 500 000 Chemtech
Indonesia PT Sulzer Turbo Services Indonesia, Purwakarta 100% Sulzer TurboK. Agus Susena IDR 28 234 800 000 Services
Japan Sulzer Daiichi K.K., Tokyo 60% SulzerTakumi Seki JPY 30 000 000 Pumps
Sulzer Metco (Japan) Ltd., Tokyo 100% SulzerNorio Yumiba JPY 180 000 000 Metco
Singapore Sulzer Pumps Asia Pacific Pte Ltd., Singapore 100% SulzerRVS Mani SGD 1 000 000 Pumps
Sulzer Metco (Singapore) Pte Ltd., Singapore 100% SulzerSei Kwong Leong SGD 600 000 Metco
Sulzer Chemtech Pte Ltd., Singapore 100% SulzerVictor Chiam SGD 1 000 000 Chemtech
South Korea Sulzer Korea Ltd., Seoul 100% SulzerYoungbae Kim KRW 222 440 000 Pumps
People’s Republic of China
Sulzer Dalian Pumps & Compressors Ltd., Dalian 100% SulzerThomas Tu CNY 115 000 000 Pumps
Sulzer Pumps Suzhou Ltd., Suzhou 100% SulzerLee Zhenyi Lu CNY 82 069 324 Pumps
Sulzer Metco Surface Technology (Shanghai) Co. Ltd., Shanghai 100% SulzerMartin Tempus CHF 7 300 000 Metco
Sulzer Shanghai Eng. & Mach. Works Ltd., Shanghai 100% SulzerMel Chua CNY 61 432 607 Chemtech
Australia
Sulzer Pumps (ANZ) Pty Ltd., Wheelers Hill 100% SulzerDavid Armstrong AUD 100 000 Pumps
Sulzer Metco Australia Pty Ltd., Sydney 100% SulzerScott Elson AUD 500 000 Metco
Sulzer Chemtech Pty Ltd., Adelaide 100% SulzerDale Calderbank AUD 500 000 Chemtech
Dowding & Mills (Australia) Pty Ltd., Brendale 100% Sulzer TurboChris Langham AUD 5 308 890 Services
Sulzer Australia Holding Pty Ltd., South Yarra 100% OthersDavid Baird AUD 7 000 100
1) Shareholding increase according to the numbers of shares bought back.
37 Major subsidiaries (continued)
31.12.2011 Middle East
Subsidiary General manager
Participation Registered capital (including paid-in capital in the USA
and Canada)
Research and development
Production and engineering Sales Service Division

Financial sectionB
usiness reviewG
overnanceIntroduction
117Sulzer | Annual Report 2011
Auditors’ report
Report of the statutory auditor Winterthur, February 14, 2012to the General Meeting ofSulzer LtdWinterthur
Report of the statutory auditor on the consolidated financial statementsAs statutory auditor, we have audited the consolidated financial statements of Sulzer Ltd, which comprise the income statement, statement of comprehensive income, balance sheet, statement of changes in equity, statement of cash flows, and notes (pages 68 to 116), for the year ended December 31, 2011.
Board of Directors’ responsibilityThe Board of Directors is responsible for the preparation and fair presentation of the consolidated financial statements in accordance with the International Financial Reporting Standards (IFRS) and the requirements of Swiss law. This responsibility includes designing, implementing and maintaining an internal control system relevant to the preparation and fair presentation of consolidated financial statements that are free from material misstatement, whether due to fraud or error. The Board of Directors is further responsible for selecting and applying appropriate accounting policies and making accounting estimates that are reasonable in the circumstances.
Auditor’s responsibilityOur responsibility is to express an opinion on these consolidated financial statements based on our audit. We conducted our audit in accordance with Swiss law and Swiss Auditing Standards as well as the International Standards on Auditing. Those standards require that we plan and perform the audit to obtain reasonable assurance whether the consolidated financial statements are free from material misstatement.
An audit involves performing procedures to obtain audit evidence about the amounts and disclosures in the consolidated financial statements. The procedures selected depend on the auditor’s judgment, including the assessment of the risks of material misstatement of the consolidated financial statements, whether due to fraud or error. In making those risk assessments, the auditor considers the internal control system relevant to the entity’s preparation and fair presentation of the consolidated financial statements in order to design audit procedures that are appropriate in the circumstances, but not for the purpose of expressing an opinion on the effectiveness of the entity’s internal control system. An audit also includes evaluating the appropriateness of the accounting policies used and the reasonableness of accounting estimates made, as well as evaluating the overall presentation of the consolidated financial statements. We believe that the audit evidence we have obtained is sufficient and appropriate to provide a basis for our audit opinion. OpinionIn our opinion, the consolidated financial statements for the year ended December 31, 2011 give a true and fair view of the financial position, the results of operations and the cash flows in accordance with the International Financial Reporting Standards (IFRS) and comply with Swiss law.
Report on other legal requirementsWe confirm that we meet the legal requirements on licensing according to the Auditor Oversight Act (AOA) and independence (article 728 CO and article 11 AOA) and that there are no circumstances incompatible with our independence.
In accordance with article 728a paragraph 1 item 3 CO and Swiss Auditing Standard 890, we confirm that an internal control system exists which has been designed for the preparation of consolidated financial statements according to the instructions of the Board of Directors.
We recommend that the consolidated financial statements submitted to you be approved.
PricewaterhouseCoopers AG
Christian Kessler Marcel ToblerAudit expert Auditor in charge
Enclosure:• Consolidated financial statements (income statement, statement of comprehensive income, balance sheet, statement of changes in equity,
statement of cash flows, and notes)

118 Sulzer | Annual Report 2011
Five-year summaries of key financial data
Key figures from consolidated income statement and statement of cash flows
millions of CHF 2011 2010 2009 2008 2007
Sales 3 577.9 3 183.7 3 350.4 3 713.5 3 537.0Operating income before depreciation/amortization EBITDA 482.8 511.0 479.2 575.9 501.3Operating income EBIT 364.1 406.4 368.0 475.1 393.5Return on sales (EBIT/sales) ROS 10.2% 12.8% 11.0% 12.8% 11.1%Return on capital employed (EBIT/capital employed) ROCE 18.8% 28.1% 24.8% 30.6% 24.2%Depreciation/amortization 118.7 104.6 111.2 100.8 107.8Research and development expenses 71.7 58.5 63.4 59.6 51.8Net income attributable to shareholders of Sulzer Ltd 279.8 300.4 270.4 322.9 284.1– in percentage of equity attributable to shareholders of Sulzer Ltd ROE 13.3% 15.9% 15.2% 21.0% 18.4%Capital expenditure 113.2 118.1 112.2 116.0 134.8Free cash flow 82.3 149.5 528.8 363.1 156.2Cash flow from operating and investing activities –729.0 62.2 501.0 251.9 177.7Employees (number of full-time equivalents) as of December 31 17 002 13 740 12 183 12 726 11 599Personnel expenses 1 056.3 973.6 944.0 961.5 948.5
Key figures from consolidated balance sheet
millions of CHF 2011 2010 2009 2008 2007
Non-current assets 2 203.2 1 295.6 1 200.4 1 203.0 1 294.1– thereof property, plant and equipment 619.5 531.6 558.1 605.8 655.0Current assets 2 337.2 2 196.1 2 183.8 2 227.2 2 171.9– thereof cash and cash equivalents and marketable securities 430.7 680.8 767.1 488.5 384.5Total assets 4 540.4 3 491.7 3 384.2 3 430.2 3 466.0
Equity attributable to shareholders of Sulzer Ltd 2 097.8 1 895.0 1 777.5 1 538.3 1 551.2
Non-current liabilities 902.1 348.1 327.2 316.6 340.9– thereof long-term borrowings 531.4 44.2 49.0 25.9 28.1Current liabilities 1 534.5 1 242.4 1 268.1 1 567.3 1 565.7– thereof short-term borrowings 236.2 83.8 47.5 156.5 157.9
Net liquidity1) –336.9 552.8 670.6 306.1 198.5Equity ratio2) 46.2% 54.3% 52.5% 44.8% 44.7%Borrowings-to-equity ratio (gearing) 0.37 0.07 0.05 0.12 0.121) Cash and cash equivalents and marketable securities, less short- and long-term borrowings.2) Equity attributable to shareholders of Sulzer Ltd in relation to total assets.
Five-year summaries of key financial data

Financial sectionB
usiness reviewG
overnanceIntroduction
119Sulzer | Annual Report 2011
Five-year summaries by division
Order intake Sales
millions of CHF 2011 2010 2009 2008 2007 2011 2010 2009 2008 2007
Divisions 3 558.5 3 278.5 3 006.7 4 098.1 4 043.7 3 570.1 3 173.3 3 336.3 3 697.4 3 527.2Sulzer Pumps 1 705.6 1 613.7 1 684.5 2 308.7 2 076.9 1 747.8 1 576.1 1 856.7 1 817.0 1 733.8Sulzer Metco 673.6 643.1 545.5 715.6 762.8 667.3 623.5 556.0 743.5 753.1Sulzer Chemtech 701.7 621.3 498.4 770.4 890.8 667.0 574.6 632.3 823.3 761.3Sulzer Turbo Services 477.6 400.4 278.3 303.4 313.2 488.0 399.1 291.3 313.6 279.0Others 7.6 10.2 10.9 18.5 10.3 7.8 10.4 14.1 16.1 9.8Total 3 566.1 3 288.7 3 017.6 4 116.6 4 054.0 3 577.9 3 183.7 3 350.4 3 713.5 3 537.0
Operating income (EBIT) Capital employed (average)
millions of CHF 2011 2010 2009 2008 2007 2011 2010 2009 2008 2007
Divisions 353.2 346.5 312.7 472.1 416.4 1 965.9 1 447.5 1 436.8 1 473.3 1 529.0Sulzer Pumps 168.2 189.0 204.7 231.9 199.2 820.0 340.5 416.7 433.8 448.0Sulzer Metco 68.7 57.1 20.5 69.6 75.8 377.5 391.9 412.1 433.8 443.2Sulzer Chemtech 63.1 58.5 54.5 140.1 116.3 412.2 406.2 417.9 426.2 464.1Sulzer Turbo Services 53.2 41.9 33.0 30.5 25.1 356.2 308.9 190.1 179.5 173.7Others 10.9 59.9 55.3 3.0 –22.9 –29.4 –0.6 49.9 80.5 96.4Total 364.1 406.4 368.0 475.1 393.5 1 936.5 1 446.9 1 486.7 1 553.8 1 625.4
Order backlog Employees1)
millions of CHF 2011 2010 2009 2008 2007 2011 2010 2009 2008 2007
Divisions 1 861.7 1 797.3 1 869.3 2 094.7 1 975.1 16 758 13 509 11 890 12 427 11 312Sulzer Pumps 1 343.5 1 336.6 1 436.0 1 518.6 1 303.8 8 211 5 904 5 928 6 239 5 686Sulzer Metco 77.4 71.3 57.2 68.2 99.7 2 259 2 045 1 796 2 105 2 054Sulzer Chemtech 310.7 274.3 238.9 347.9 414.0 3 634 2 973 2 977 2 769 2 393Sulzer Turbo Services 130.1 115.1 137.2 160.0 157.6 2 654 2 587 1 189 1 314 1 179Others 2.3 2.5 2.4 5.5 3.0 244 231 293 299 287Total 1 864.0 1 799.8 1 871.7 2 100.2 1 978.1 17 002 13 740 12 183 12 726 11 5991) Number of full-time equivalents as of December 31.
Five-year summaries by division

120 Sulzer | Annual Report 2011
Five-year summaries by region
Order intake by region
millions of CHF 2011 2010 2009 2008 2007
Europe 1 301.9 1 016.0 945.3 1 286.1 1 293.9North America 891.1 820.5 762.8 1 070.6 1 225.1Central and South America 334.3 311.4 288.8 283.1 205.8Asia, Middle East, Australia 925.6 959.7 807.5 1 177.5 1 148.7Africa 113.2 181.1 213.2 299.3 180.5Total 3 566.1 3 288.7 3 017.6 4 116.6 4 054.0
Sales by region
millions of CHF 2011 2010 2009 2008 2007
Europe 1 268.0 1 024.4 1 046.5 1 276.2 1 319.7North America 837.1 840.3 951.7 1 048.5 1 017.5Central and South America 330.4 323.8 238.7 195.5 162.4Asia, Middle East, Australia 984.3 802.9 885.4 1 039.6 887.4Africa 158.1 192.3 228.1 153.7 150.0Total 3 577.9 3 183.7 3 350.4 3 713.5 3 537.0
Capital employed (average) by company location
millions of CHF 2011 2010 2009 2008 2007
Europe 1 291.6 904.4 953.2 1 046.6 1 045.5North America 357.8 344.7 380.3 367.1 417.5Central and South America 60.2 45.1 46.0 33.4 49.1Asia, Middle East, Australia 205.5 139.0 99.8 96.6 91.3Africa 21.4 13.7 7.4 10.1 22.0Total 1 936.5 1 446.9 1 486.7 1 553.8 1 625.4
Employees by company location1)
2011 2010 2009 2008 2007
Europe 7 595 5 874 4 915 5 724 5 544North America 3 308 2 949 2 864 3 156 2 943Central and South America 1 431 810 823 710 563Asia, Middle East, Australia 4 186 3 633 3 125 2 700 2 157Africa 482 474 456 436 392Total 17 002 13 740 12 183 12 726 11 5991) Number of full-time equivalents as of December 31.
Five-year summaries by region
Financial sectionB
usiness reviewG
overnanceIntroduction
121Sulzer | Annual Report 2011
Financial section
Financial statements of Sulzer Ltd
Financial statements of Sulzer LtdBalance sheet of Sulzer Ltd 122Income statement of Sulzer Ltd 123Changes in equity of Sulzer Ltd 123Notes to the financial statements of Sulzer Ltd 124Appropriation of net profit 130Annual General Meeting 130
Auditors’ report 131

122 Sulzer | Annual Report 2011
Financial statements of Sulzer Ltd
Balance sheet of Sulzer LtdDecember 31
millions of CHF Notes 2011 2010
Non-current assetsOperational assets – –Investments in subsidiaries and other companies 102 946.6 700.1Loans to subsidiaries 919.8 186.3– thereof subordinated CHF 2.0 millionOther loans and financial assets 1.8 1.7Total non-current assets 1 868.2 888.1
Current assetsAccounts receivable from subsidiaries 165.0 456.7Other accounts receivable and prepayments 2.4 34.6Marketable securities 103 67.3 90.0Cash 2.2 9.6Total current assets 236.9 590.9
Total assets 2 105.1 1 479.0
EquityRegistered share capital 104 0.3 0.3Legal reserves 160.4 159.3Reserves for treasury stock 104 45.1 46.2Free reserves 986.5 676.5Unappropriated retained earnings 7.6 6.5Net profit for the year 109.1 413.9Total equity 1 309.0 1 302.7
Non-current liabilitiesNon-current financial liabilities 496.6 –Non-current provisions 79.9 80.9Non-current liabilities with subsidiaries – –Total non-current liabilities 576.5 80.9
Current liabilitiesCurrent financial liabilities 160.0 40.0Current provisions 5.8 8.3Current liabilities with subsidiaries 28.7 15.1Accounts payable and accrued liabilities 105 25.1 32.0Total current liabilities 219.6 95.4Total liabilities 796.1 176.3
Total equity and liabilities 2 105.1 1 479.0

Financial sectionB
usiness reviewG
overnanceIntroduction
123Sulzer | Annual Report 2011
Financial statements of Sulzer Ltd
Income statement of Sulzer LtdJanuary – December
millions of CHF Notes 2011 2010
RevenuesInvestment income 195.9 409.1Financial income 34.8 68.8Other income 28.4 30.6Total revenues 259.1 508.5
ExpensesAdministrative expenses 107 27.4 29.7Financial expenses 115.7 42.0Investment and loan expenses 7.3 14.7Income taxes –0.5 5.5Other expenses 0.1 2.7Total expenses 150.0 94.6
Net profit for the year 109.1 413.9
Changes in equity of Sulzer LtdJanuary – December
millions of CHFShare
capitalLegal
reservesReserves for
treasury stockFree
reservesRetained earnings
Net income Total
Equity as of January 1, 2009 0.3 149.4 56.1 361.5 7.2 203.9 778.4
Dividend –95.9 –95.9Allocation of net income 110.0 –2.0 –108.0 –Net profit for the year 302.2 302.2Change in reserves for treasury stock 1.2 –1.2 –
Equity as of December 31, 2009 0.3 150.6 54.9 471.5 5.2 302.2 984.7
Dividend –95.9 –95.9Allocation of net income 205.0 1.3 –206.3 –Net profit for the year 413.9 413.9Change in reserves for treasury stock 8.7 –8.7 –
Equity as of December 31, 2010 0.3 159.3 46.2 676.5 6.5 413.9 1 302.7
Dividend –102.8 –102.8Allocation of net income 310.0 1.1 –311.1 –Net profit for the year 109.1 109.1Change in reserves for treasury stock 1.1 –1.1 –
Equity as of December 31, 2011 0.3 160.4 45.1 986.5 7.6 109.1 1 309.0

124 Sulzer | Annual Report 2011
Financial statements of Sulzer Ltd
Notes to the financial statements of Sulzer Ltd101 Valuation principles
The financial statements as of December 31, 2011, are in compliance with the requirements of the Swiss Corporation law. However, for the purpose of including Sulzer Ltd in the consolidated financial statements, the corporate accounting principles remain fully applicable.
102 Investments in subsidiaries
A list of the major subsidiaries held directly or indirectly by Sulzer Ltd is included on pages 113 to 116 (note 37).
103 Marketable securities
millions of CHF 2011 2010
Treasury stock 59.2 83.1Other shares 8.1 6.9Total marketable securities 67.3 90.0
104 Registered share capital
The share capital amounts to CHF 342 623.70, made up of 34 262 370 shares with a par value of CHF 0.01. All shares are fully paid in and registered.
Share ownershipDetails of the composition and changes relating to the issued share capital, the share capital authorized but not issued, and the shares held as treasury stock, are included in note 22 to the consolidated financial statements. Details of share data ownership are also provided in note 22.
Treasury stock held by Sulzer Ltd
millions of CHFNumber
of shares
Total acquisition
cost
Balance as of January 1, 2011 546 478 46.2Purchase 230 220 24.1Sale –318 835 –25.2Balance as of December 31, 2011 457 863 45.1
The treasury stock held covers the options from the shares participation plan and restricted stock unit plan. The total number of shares as of December 31, 2011, amounted to 457 863 (2010: 546 478).

Financial sectionB
usiness reviewG
overnanceIntroduction
125Sulzer | Annual Report 2011
Financial statements of Sulzer Ltd
105 Accounts payable and accrued liabilities
millions of CHF 2011 2010
Other liabilities 1.2 6.1Accrued liabilities 23.9 25.9Total accounts payable and accrued liabilities 25.1 32.0
The accrued liabilities in 2011 include CHF 1.4 million of outstanding options on treasury shares (2010: CHF 7.3 million).
106 Contingent liabilities
millions of CHF 2011 2010
Guarantees, sureties, comfort letters for subsidiaries– to banks and insurance companies 1 483.4 1 503.5– to customers 432.0 446.4Guarantees to third parties – –Syndicate transactions – –Total contingent liabilities 1 915.4 1 949.9
As of December 31, 2011, CHF 386.9 million (2010: CHF 466.2 million) of guarantees, sureties, and comfort letters for subsidiaries to banks and insurance companies were utilized.
107 Administrative expenses
millions of CHF 2011 2010
Personnel expenses 12.0 17.4Other administrative expenses 15.4 12.3Total administrative expenses 27.4 29.7
108 Risk management process
Sulzer Ltd is the ultimate parent company of the Sulzer corporation. The key risks of Sulzer Ltd are covered through the risk management process (see note 35 to the consolidated financial statements) of the corporation.

126 Sulzer | Annual Report 2011
Financial statements of Sulzer Ltd
109 Compensation and share participation of the Board of Directors, Executive Committee, and related parties
This note has been prepared in accordance with the requirements of the Swiss Code of Obligations (CO), and differs from the compensation disclosures in note 33, mainly due to different valuation.
Compensation 2011
thousands of CHF Base salary Bonus4)
Cash com-
pensation
Pension fund
contribution Other Subtotal
Restricted stock unit
(RSU) plan6)
Performance share
plan (PSP)7) Total
Board of Directors 1 021 – 1 021 – 5 1 026 889 – 1 915Jürgen Dormann, Chairman and Chairman of the Strategy Committee 438 – 438 – – 438 223 – 661Luciano Respini 101 – 101 – – 101 111 – 212Vladimir V. Kuznetsov, Chairman of the Nomination and Remuneration Committee 98 – 98 – – 98 111 – 209Jill Lee2) 69 – 69 – – 69 111 – 180Hans Hubert Lienhard1) 22 – 22 – 3 25 – – 25Marco Musetti2) 69 – 69 – – 69 111 – 180Daniel J. Sauter 87 – 87 – – 87 111 – 198Klaus Sturany, Chairman of the Audit Committee 110 – 110 – – 110 111 – 221Tim Summers1) 27 – 27 – 2 29 – – 29
Executive Committee3) 3 250 2 175 5 425 754 2 242 8 421 1 113 458 9 992– thereof highest single compensation Ton Büchner, CEO 670 473 1 143 120 2 0465) 3 309 – –6678) 2 642
No compensation was granted to former members of the Board of Directors or the Executive Committee. Non-arm’s-length compensation was granted neither to present or former members of the Board of Directors or the Executive Committee nor to related parties.
1) Member until April 14, 2011.2) Member since April 14, 2011.3) Members of the Executive Committee:
– Ton Büchner, CEO (until October 31, 2011) – Peter Alexander, President of Sulzer Turbo Services – Jürgen Brandt, CFO and ad interim CEO (since November 1, 2011) – Urs Fankhauser, President of Sulzer Chemtech – Alfred Gerber, General Counsel – Kim Jackson, President of Sulzer Pumps – César Montenegro, President of Sulzer Metco
4) Expected variable wage elements.5) Consists of a discretionary bonus of CHF 1.7 million and the payout of vacation balances of CHF 346 000.6) RSU awards assigned during the reporting period had a fair value of CHF 126.93 at the grant date. The fair values include a 11% discount according to the tax
procedure regarding reduction due to the limited availability at the grant date (i.e., CHF 15.69). Employer contribution to the social security institutions due to the execution of equity instruments is not included.
7) Represents one-third of the amount invested in the PSP (2010–2012) assigned during the reporting period with an average stock price of CHF 98.41 at the grant date. Employer contribution to the social security institutions due to the execution of equity instruments is not included. The PSP 2010–2012 will vest in 2013.
8) Reversal of prior year investment in the PSP of CHF 667 000.

Financial sectionB
usiness reviewG
overnanceIntroduction
127Sulzer | Annual Report 2011
Financial statements of Sulzer Ltd
109 Compensation and share participation of the Board of Directors, Executive Committee, and related parties (continued)
Compensation 2010
thousands of CHF Base salary Bonus4)
Cash com-
pensation
Pension fund
contribution Other Subtotal
Restricted stock unit
(RSU) plan5)
Performance share
plan (PSP)6) Total
Board of Directors 927 – 927 – – 927 889 – 1 816Jürgen Dormann, Chairman and Chairman of the Strategy Committee 421 – 421 – – 421 223 – 644Luciano Respini 90 – 90 – – 90 111 – 201Vladimir V. Kuznetsov, Chairman of the Nomination and Remuneration Committee 93 – 93 – – 93 111 – 204Hans Hubert Lienhard 72 – 72 – – 72 111 – 183Urs Andreas Meyer1) 23 – 23 – – 23 – – 23Daniel J. Sauter 80 – 80 – – 80 111 – 191Klaus Sturany, Chairman of the Audit Committee 95 – 95 – – 95 111 – 206Tim Summers2) 53 – 53 – – 53 111 – 164
Executive Committee3) 3 187 2 895 6 082 722 174 6 978 1 297 1 531 9 806– thereof highest single compensation Ton Büchner, CEO 720 900 1 620 141 – 1 761 148 667 2 576
No compensation was granted to former members of the Board of Directors or the Executive Committee. The short-term loan of CHF 0.1 million granted in prior years to one member of the Executive Committee was paid back in 2010. Non-arm’s-length compensation was granted neither to present or former members of the Board of Directors or the Executive Committee nor to related parties.
1) Member until April 15, 2010.2) Member since April 15, 2010.3) Members of the Executive Committee:
– Ton Büchner, CEO – Peter Alexander, President of Sulzer Turbo Services – Jürgen Brandt, CFO (since November 1, 2010) – Urs Fankhauser, President of Sulzer Chemtech – Alfred Gerber, General Counsel – Kim Jackson, President of Sulzer Pumps – Peter Meier, CFO (until July 24, 2010) – César Montenegro, President of Sulzer Metco
4) Expected variable wage elements.5) RSU awards assigned during the reporting period had a fair value of CHF 87.58 at the grant date. The fair values include a 11% discount according to the tax
procedure regarding reduction due to the limited availability at the grant date (i.e., CHF 10.83). Employer contribution to the social security institutions due to the execution of equity instruments is not included.
6) Represents one-third of the amount invested in the PSP (2010–2012) assigned during the reporting period with an average stock price of CHF 98.41 at the grant date. Employer contribution to the social security institutions due to the execution of equity instruments is not included. The PSP 2010–2012 will vest in 2013.

128 Sulzer | Annual Report 2011
Financial statements of Sulzer Ltd
109 Compensation and share participation of the Board of Directors, Executive Committee, and related parties (continued)
Shareholders 2011
Sulzer shares
Options free to be
sold (F)1)
Options not free to be sold (NF)1)
Restricted stock units (RSU)
(NF)1)
Other call options
Total call options, share
awards and shares2)
Put options
Board of Directors 29 435 4 375 – 16 711 – 89 896 –Jürgen Dormann 10 993 – – 4 172 – 15 165 –Vladimir V. Kuznetsov 2 180 750 – 2 605 – 12 285 –Jill Lee – – – 879 – 879 –Marco Musetti – – – 879 – 879 –Luciano Respini 6 936 125 – 3 483 – 11 669 –Daniel J. Sauter 8 180 3 500 – 2 605 – 45 785 –Klaus Sturany 1 146 – – 2 088 – 3 234 –
Executive Committee 17 805 7 230 – 25 395 – 115 500 –Jürgen Brandt 350 – – 1 545 – 1 895 –Peter Alexander 2 109 – – 4 143 – 6 252 –Urs Fankhauser 1 578 3 600 – 5 352 – 42 930 –Alfred Gerber 5 205 1 200 – 3 651 – 20 856 –Kim Jackson 3 094 600 – 5 352 – 14 446 –César Montenegro 5 469 1 830 – 5 352 – 29 121 –1) Options / Restricted stock units assigned by Sulzer as compensation.2) One option entitles the purchase of ten shares, one RSU award is converted into one share. This has been reflected in the total balance.
Shareholders 2010
Sulzer shares
Options free to be
sold (F)1)
Options not free to be sold (NF)1)
Restricted stock units (RSU) (NF)1)
Other call options
Total call options and
shares2)
Put options
Board of Directors 24 534 7 375 1 000 21 122 – 129 406 –Jürgen Dormann 7 923 – – 3 987 – 11 910 –Vladimir V. Kuznetsov 878 500 250 3 028 – 11 406 –Hans Hubert Lienhard 3 738 1 500 250 3 028 – 24 266 –Luciano Respini 4 756 1 375 250 4 784 – 25 790 –Daniel J. Sauter 6 878 4 000 250 3 028 – 52 406 –Klaus Sturany 361 – – 1 995 – 2 356 –Tim Summers – – – 1 272 – 1 272 –
Executive Committee 24 016 8 830 3 300 38 698 – 184 014 –Ton Büchner 16 591 2 000 1 000 8 717 – 55 308 –Peter Alexander 20 100 400 4 687 – 9 707 –Jürgen Brandt 350 – – – – 350 –Urs Fankhauser 1 500 3 800 600 6 869 – 52 369 –Alfred Gerber 3 116 800 400 4 687 – 19 803 –Kim Jackson 32 – 600 6 869 – 12 901 –César Montenegro 2 407 2 130 300 6 869 – 33 576 –1) Options / Restricted stock units assigned by Sulzer as compensation.2) One option entitles the purchase of ten shares, one RSU award is converted into one share. This has been reflected in the total balance.

Financial sectionB
usiness reviewG
overnanceIntroduction
129Sulzer | Annual Report 2011
Financial statements of Sulzer Ltd
109 Compensation and share participation of the Board of Directors, Executive Committee, and related parties (continued)
Information on options and restricted stock units assigned by Sulzer as compensation
2002 2003 2004 2005 2007 2008 RSUs2) Total3)
F1) F F F F F NF F NF
Board of Directors 500 500 500 625 750 1 500 16 711 43 750 16 711Jürgen Dormann – – – – – – 4 172 – 4 172Vladimir V. Kuznetsov – – – – – 750 2 605 7 500 2 605Jill Lee – – – – – – 879 – 879Marco Musetti – – – – – – 879 – 879Luciano Respini – – – 125 – – 3 483 1 250 3 483Daniel J. Sauter 500 500 500 500 750 750 2 605 35 000 2 605Klaus Sturany – – – – – – 2 088 – 2 088
Executive Committee – – – 30 2 700 4 500 25 395 72 300 25 395Jürgen Brandt – – – – – – 1 545 – 1 545Peter Alexander – – – – – – 4 143 – 4 143Urs Fankhauser – – – – 1 800 1 800 5 352 36 000 5 352Alfred Gerber – – – – – 1 200 3 651 12 000 3 651Kim Jackson – – – – – 600 5 352 6 000 5 352César Montenegro – – – 30 900 900 5 352 18 300 5 3521) Options assigned by Sulzer as compensation and free to be sold.2) Total RSUs 2009, 2010, and 2011 granted but not yet vested.3) One option entitles the purchase of ten shares, one RSU award is converted into one share. This has been reflected in the total balance.
Option seriesYear
of issueExpiration
dateExercise
price
2002 2002 04.2012 36.502003 2003 04.2013 17.302004 2004 04.2014 31.802005 2005 04.2015 52.202006 2006 04.2011 94.202007 2007 03.2012 149.502008 2008 03.2013 127.90

130 Sulzer | Annual Report 2011
Financial statements of Sulzer Ltd
Appropriation of net profitin CHF 2011 2010
Net profit for the year 109 100 000 413 900 000Unallocated profit carried forward from previous year 7 617 294 6 504 404Total available profit 116 717 294 420 404 404
Proposal by the Board of Directors: Appropriation to free reserves – 310 000 000
Dividend 102 787 110 102 787 110
Balance carried forward 13 930 184 7 617 294
Distribution per share CHF 0.01Gross dividend 3.00 3.00less 35% withholding tax 1.05 1.05Net payment 1.95 1.95
The Board of Directors proposes the payment of a dividend of CHF 3.00 per share to the Annual General Meeting on April 5, 2012.
Annual General Meeting
The 98th ordinary Annual General Meeting will be held on Thursday, April 5, 2012, at 10.00 a.m. at Eulachhalle, Wartstrasse 73, Winterthur (Switzerland).

Financial sectionB
usiness reviewG
overnanceIntroduction
131Sulzer | Annual Report 2011
Auditors’ report
Report of the statutory auditor Winterthur, February 14, 2012to the General Meeting ofSulzer LtdWinterthur
Report of the statutory auditor on the financial statementsAs statutory auditor, we have audited the financial statements of Sulzer Ltd, which comprise the balance sheet, income statement, statement of changes in equity and notes (pages 122 to 130), for the year ended December 31, 2011.
Board of Directors’ responsibilityThe Board of Directors is responsible for the preparation of the financial statements in accordance with the requirements of Swiss law and the company’s articles of incorporation. This responsibility includes designing, implementing and maintaining an internal control system relevant to the preparation of financial statements that are free from material misstatement, whether due to fraud or error. The Board of Directors is further responsible for selecting and applying appropriate accounting policies and making accounting estimates that are reasonable in the circumstances.
Auditor’s responsibilityOur responsibility is to express an opinion on these financial statements based on our audit. We conducted our audit in accordance with Swiss law and Swiss Auditing Standards. Those standards require that we plan and perform the audit to obtain reasonable assurance whether the financial statements are free from material misstatement.
An audit involves performing procedures to obtain audit evidence about the amounts and disclosures in the financial statements. The procedures selected depend on the auditor’s judgment, including the assessment of the risks of material misstatement of the financial statements, whether due to fraud or error. In making those risk assessments, the auditor considers the internal control system relevant to the entity’s preparation of the financial statements in order to design audit procedures that are appropriate in the circumstances, but not for the purpose of expressing an opinion on the effectiveness of the entity’s internal control system. An audit also includes evaluating the appropriateness of the accounting policies used and the reasonableness of accounting estimates made, as well as evaluating the overall presentation of the financial statements. We believe that the audit evidence we have obtained is sufficient and appropriate to provide a basis for our audit opinion.
OpinionIn our opinion, the financial statements for the year ended December 31, 2011 comply with Swiss law and the company’s articles of incorporation.
Report on other legal requirementsWe confirm that we meet the legal requirements on licensing according to the Auditor Oversight Act (AOA) and independence (article 728 CO and article 11 AOA) and that there are no circumstances incompatible with our independence.
In accordance with article 728a paragraph 1 item 3 CO and Swiss Auditing Standard 890, we confirm that an internal control system exists which has been designed for the preparation of financial statements according to the instructions of the Board of Directors.
We further confirm that the proposed appropriation of available earnings complies with Swiss law and the company’s articles of incorporation. We recommend that the financial statements submitted to you be approved.
PricewaterhouseCoopers AG
Christian Kessler Marcel ToblerAudit expert Auditor in charge
Enclosures:• Financial statements (balance sheet, income statement, statement of changes in equity and notes)• Proposed appropriation of the available earnings

neutralPrinted Matter
No. 01-11-160349 – www.myclimate.org© myclimate – The Climate Protection Partnership
132 Sulzer | Annual Report 2011
Imprint
Imprint
This document may contain forward-looking statements, including, but not limited to, projections of financial developments and future performance of materials and products, containing risks and uncertainties. These statements are subject to change based on known and unknown risks and various other factors that could cause the actual results or performance to differ materially from the statements made herein.
The Sulzer Annual Report 2011 is also available in German and online at www.sulzer.com/AR2011. Furthermore, the report is available as a summary in German or in English.The original version is in English.
Published by: Sulzer Ltd, Winterthur, Switzerland, © 2012Concept/Layout: Addison Corporate Marketing, London, UKPhotographs: Andy Wilson, London, UK
Hal Bergman, Getty images (cover, pages 10/11); Kevin Phillips, Getty Images; Corbis Premium RF, Alamy; DreamPictures, Getty images; Nga Nguyen, Getty images; Corbis Premium RF, Alamy; PhotoEdit, Alamy (internal front cover, page 5); John Zoiner, Getty (pages 12/13); Jesse Swallow, Getty (pages 14/15); daitoZen, Getty (pages 16/17); Pete Atkinson, Getty (page 25); Digital Vision, Getty (page 29); Fuse, Getty (page 33); Caro, Alamy (page 37).
Printing: Mattenbach AG, Winterthur, Switzerland
This report is printed in a climate-neutral process on Forest Stewardship Council (FSC) certified paper.

Investor information
133Sulzer | Annual Report 2011
Data per share
CHF 2011 2010 2009 2008 2007
Net income attributable to a shareholder of Sulzer Ltd 8.25 8.92 8.06 9.59 8.35
Change from prior year –8% 11% –16% 15% 34%
Free cash flow 2.43 4.44 15.75 10.78 4.59
Equity attributable to a shareholder of Sulzer Ltd 62.06 56.20 52.95 45.83 46.11
Dividend 3.001) 3.00 2.80 2.80 2.80
Payout ratio 36% 34% 35% 29% 34%
Average number of shares outstanding 33 906 689 33 693 120 33 567 516 33 675 840 34 035 7001) Proposal to the Annual General Meeting.
Stock market information
2011 2010 2009 2008 2007
Registered share (in CHF)
– high 158.50 144.00 96.40 165.20 192.40
– low 84.35 80.10 39.15 54.00 137.50
– year-end 100.40 142.50 81.10 60.00 166.50
Market capitalization as of December 31
– number of shares outstanding 33 804 507 33 715 892 33 570 526 33 562 931 33 642 550
– in millions of CHF 3 394 4 805 2 723 2 014 5 601
– in percentage of equity 162% 254% 153% 131% 361%
P/E ratio as of December 31 12.2x 16.0x 10.1x 6.3x 19.9x
Dividend yield as of December 31 3.0% 2.1% 3.5% 4.7% 1.7%1) Proposal to the Annual General Meeting.
Shareholder structure as of December 31, 2011
number of sharesNumber of
shareholders Shareholding
1–100 5 605 0.8%
101–1 000 5 018 5.0%
1 001–10 000 725 6.1%
10 001–100 000 116 12.0%
More than 100 000 17 49.1%
Total registered shares (excluding treasury shares Sulzer Ltd) 11 481 73.0%
Title Security No. Investdata Reuters Bloomberg
Listed on SIX Swiss Exchange Registered share 3 838 891 SUN SUN.S SUN SW

Sulzer Ltd8401 WinterthurSwitzerlandPhone +41 52 262 11 22Fax +41 52 262 01 01
www.sulzer.com
Corporate CommunicationsPhone +41 52 262 72 72Fax +41 52 262 00 [email protected]
Investor RelationsPhone +41 52 262 20 22Fax +41 52 262 00 [email protected]