solomonssfw chapter 9,2
TRANSCRIPT

1/7/2011
1
Organic ChemistryTenth Edition
T. W. Graham SolomonsCraig B. Fryhle
Welcome to CHM 2211Organic Chemisty II
Chapters 2 (IR), 9, 13-20.
Chapter 2 and Chapter 9
Spectroscopy(interaction of molecule with electromagnetic
radiations)
Ch. 2 - 2
Chapter 2: Infrared Spectroscopy (IR)
Chapter 9: Nuclear Magnetic Resonance (NMR)
Chapter 9: Mass Spectrometry (MS)
Chapter 13: Ultraviolet- visible Spectroscopy (UV-VIS)
Spectroscopy
Electromagnetic Radiation
• The different forms of electromagnetic radiation make up the electromagnetic spectrum.
Infrared SpectroscopyElectromagnetic Radiation
• The electromagnetic spectrum is arbitrarily divided into different regions.
• Wavelength () and frequency () are inversely related:
Wavelength increases as frequency decreases.Wavelength increases as frequency decreases.
Frequency increases as wavelength decreases.
• The energy (E) of a photon is directly proportional to its frequency and therefore reversely proportional to wavelength:
E = h [h = Planck’s constant]
= c/[C= speed of light]

1/7/2011
2
Infrared Spectroscopy
Background• Infrared (IR) spectroscopy is used to identify the functional groups
in a compound. It uses IR radiation as the energy source.
• Frequencies in IR spectroscopy are reported using a unit called wavenumber ():
~
= 1/~
• Wavenumber is inversely proportional to wavelength and is given in y p p g greciprocal centimeters (cm–1).
• Therefore, frequency (and energy) increases as the wavenumber increases.
Using the wavenumber scale, IR absorptions for all organic compounds (functional groups) occur from 4000 cm–1 to 400 cm–1.
Infrared Spectroscopy
• Absorption of IR light causes changes in the vibrational motions of a molecule.
• The different vibrational modes available to a molecule include stretching and bending modes.
• The vibrational modes of a molecule occur only at specific frequencies which correspond to the frequency of IR light.
Infrared Spectroscopy
• When the frequency of IR light matches the frequency of a particular vibrational mode, the IR light is absorbed, causing the amplitude of the particular bond stretch or bond bend to increase.
Infrared SpectroscopyCharacteristics of an IR Spectrum
• In an IR spectrometer, light passes through a sample.
• Frequencies that match the vibrational frequencies are absorbed, and the remaining light is transmitted to a detector.
• An IR spectrum is a plot of the amount of transmitted light versus its wavenumber.

1/7/2011
3
Infrared Spectroscopy• Let us now consider the IR spectrum of 1-propanol, CH3CH2CH2OH. •Always look for the characteristic peak of the functional group present in the molecule•Characteristics of an IR Spectrum for 1-Propanol are the specific absorption of the OH group:
• Each peak corresponds to a particular kind of bond, and each bond type (such as O—H and C—H) occurs at a characteristic frequencycharacteristic frequency.
• Wavenumber, frequency and energy decrease from left to right.
• Where a peak occurs is given in reciprocal centimeters (cm-1).
Infrared SpectroscopyCharacteristics of an Infrared Spectrum
• The IR spectrum is divided into two regions: the functional group region (at 1500 cm-1), and the fingerprint region (at < 1500 cm-1)
• Please note a characteristic peak for a carbonyl from from ketone and ester at ~1700 cm-1.
Infrared Spectroscopy
• Bonds absorb in four predictable regions of an IR spectrum.
Summary of the four regions of the IR spectrum
Infrared SpectroscopyIR Absorptions in Hydrocarbons - Alkane
Hexane has only C-C single bonds and sp3 hybridized C atoms. Therefore it has only one major absorption at 3000-2850 cm-1.
1/7/2011
4
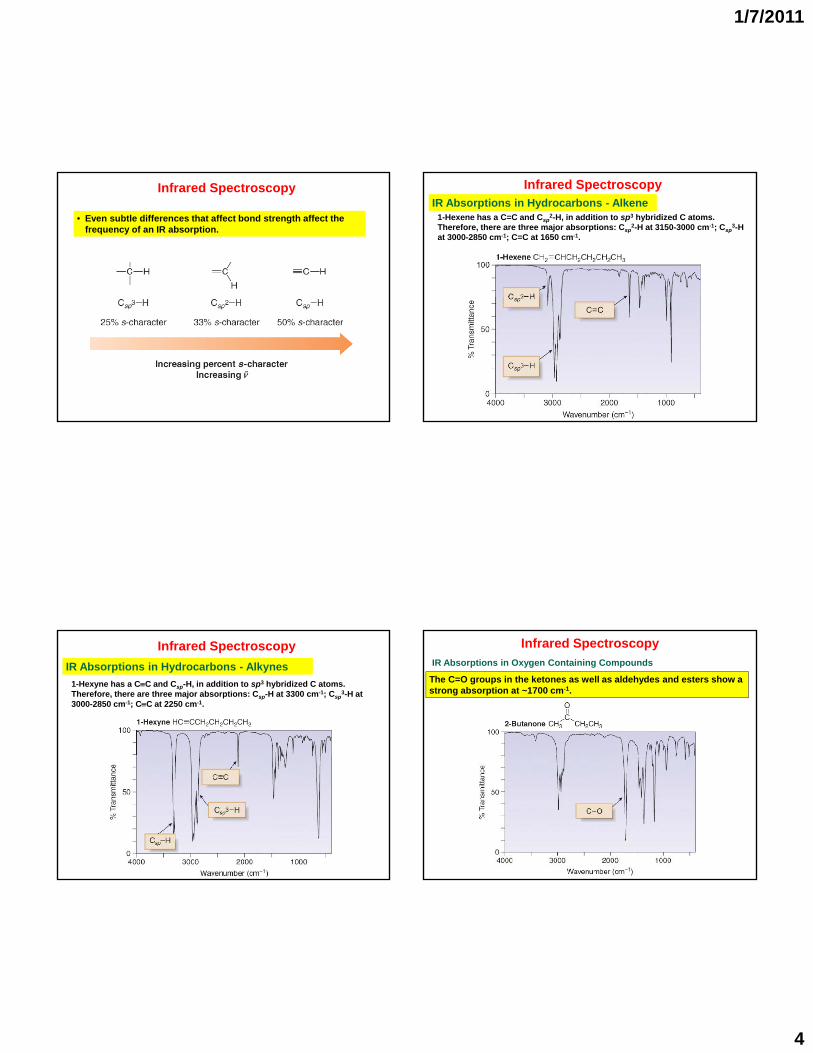
Infrared Spectroscopy
• Even subtle differences that affect bond strength affect the frequency of an IR absorption.
Infrared SpectroscopyIR Absorptions in Hydrocarbons - Alkene
1-Hexene has a C=C and Csp2-H, in addition to sp3 hybridized C atoms.
Therefore, there are three major absorptions: Csp2-H at 3150-3000 cm-1; Csp
3-H at 3000-2850 cm-1; C=C at 1650 cm-1.
Infrared Spectroscopy
IR Absorptions in Hydrocarbons - Alkynes
1-Hexyne has a CC and Csp-H, in addition to sp3 hybridized C atoms. Therefore, there are three major absorptions: Csp-H at 3300 cm-1; Csp
3-H at 3000-2850 cm-1; CC at 2250 cm-1.
Infrared Spectroscopy
IR Absorptions in Oxygen Containing Compounds
The C=O groups in the ketones as well as aldehydes and esters show a strong absorption at ~1700 cm-1.
1/7/2011
5
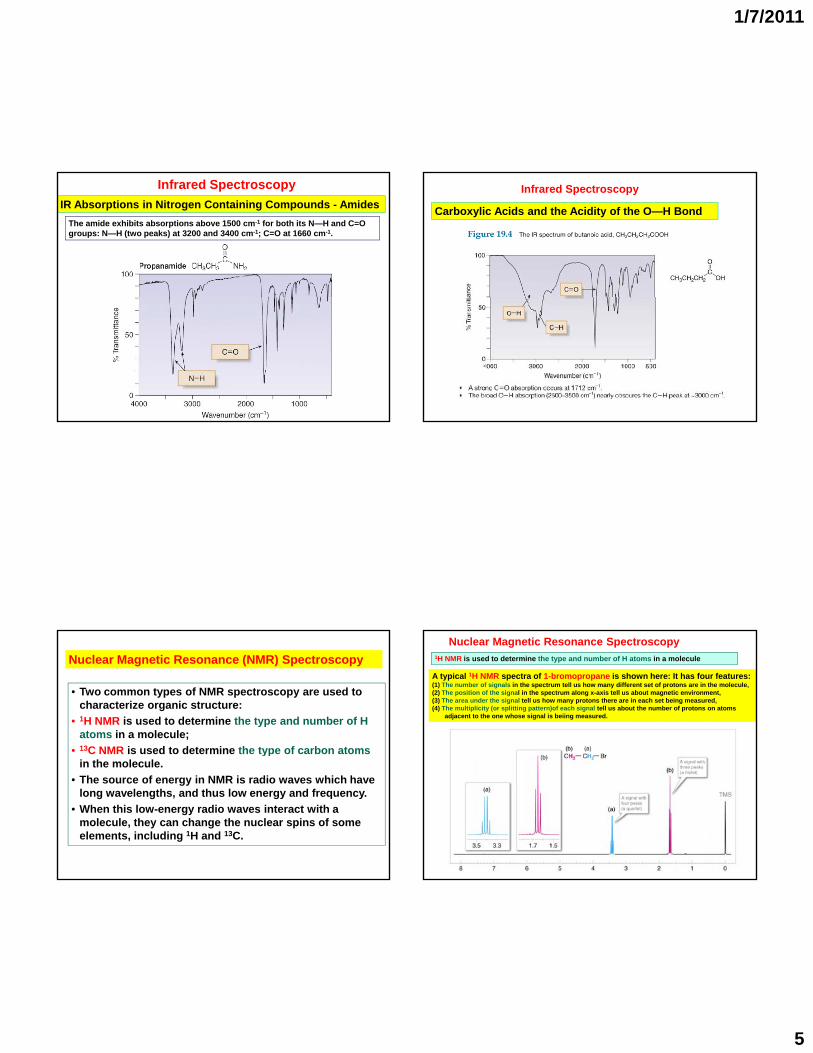
Infrared Spectroscopy
IR Absorptions in Nitrogen Containing Compounds - Amides
The amide exhibits absorptions above 1500 cm-1 for both its N—H and C=O groups: N—H (two peaks) at 3200 and 3400 cm-1; C=O at 1660 cm-1.
Carboxylic Acids and the Acidity of the O—H Bond
Infrared Spectroscopy
Nuclear Magnetic Resonance (NMR) Spectroscopy
• Two common types of NMR spectroscopy are used to characterize organic structure:
• 1H NMR is used to determine the type and number of H atoms in a molecule;
• 13C NMR is used to determine the type of carbon atoms ypin the molecule.
• The source of energy in NMR is radio waves which have long wavelengths, and thus low energy and frequency.
• When this low-energy radio waves interact with a molecule, they can change the nuclear spins of some elements, including 1H and 13C.
Nuclear Magnetic Resonance Spectroscopy1H NMR is used to determine the type and number of H atoms in a molecule
A typical 1H NMR spectra of 1-bromopropane is shown here: It has four features:(1) The number of signals in the spectrum tell us how many different set of protons are in the molecule,(2) The position of the signal in the spectrum along x-axis tell us about magnetic environment,(3) The area under the signal tell us how many protons there are in each set being measured,(4) The multiplicity (or splitting pattern)of each signal tell us about the number of protons on atoms
adjacent to the one whose signal is beiing measured.

1/7/2011
6
NMR Spectroscopy - Chemical Shift Values
•The position of a signal on the x axis of NMR spectrum its called chemical shift
• It is measured in ppm, according to the following equation:•Protons in a given environment absorb in a predictable region in an NMR spectrum.
NMR Spectroscopy - Chemical Shift Values
• Most protons absorb between 0-10 ppm.
• The terms “upfield” and “downfield” describe the relative location of peaks. Upfield means to the right. Downfield means to the left.
• NMR absorptions are measured relative to the position of a reference peak at 0 ppm on the scale due to tetramethylsilane (TMS). TMS is a volatile inert compound that gives a single peak upfield from typical NMR absorptions.
Nuclear Magnetic Resonance Spectroscopy
• An NMR spectrum is a plot of the intensity of a peak against its chemical shift, measured in parts per million (ppm).
1H NMR—The Spectrum
Nuclear Magnetic Resonance Spectroscopy
• The area under an NMR signal is proportional to the number of absorbing protons.
• An NMR spectrometer automatically integrates the area under the peaks, and prints out a stepped curve (the integral) on the spectrum.
• The height of each step is proportional to the area under the peak, which in turn is proportional to the number of absorbing protons.
1H NMR—Intensity of Signals (Integration)

1/7/2011
7
Nuclear Magnetic Resonance Spectroscopy
1H NMR—Spin-Spin Splitting
The signal from a given proton will be split by the effect of magnetic fields associated with protons on neighboring carbons.
Nuclear Magnetic Resonance Spectroscopy1H NMR—Spin-Spin Splitting
General rule which describes the splitting patterns commonly seen in the 1H NMR spectra of organic compounds is as follow:
A number of peaks from vicinal coupling in set is equaled
n + 1
Where n is the number of vicinal hydrogens [at nearby (adjacent) carbons] that are nonequivalent to those producing the signal
Please note that HA and Hb are separated by three bonds.They are called are vicinal protons because they are on adjacent carbons. Three bond coupling between them is called vicinal coupling
Splitting is not generally observed between protons separated by more than three bonds.
that are nonequivalent to those producing the signal
NMR Spectroscopy -1H NMR—Spin-Spin Splitting
Whenever two (or three) different sets of adjacent protons are equivalent to each other, use the n + 1 rule to determine the splitting pattern.
In general we have to ask only one question and then use N + 1 rule.
Question. How many protons are there on the adjacent carbon or carbons?
Answer is N = 6: Therefore, we should expect 7 lines in the multiplet for H at CHBr carbon

1/7/2011
8
Consider the spectrum of alkyl bromides with molecular formula C3H7Br.
NMR Spectroscopy –Interpretation of Proton NMR Spectra: Chapter 9.3
1. Count the number of signal!2. Correlate chemical shift with possible structural environments!3. Determine the relative area of each signal!4. Interpret the splitting pattern!5. Join the fragments to make a molecule which structure would
be consistent with data!
CH3
CH2
CH2
Br
CH3
CH
OR
Br
CH3
Nuclear Magnetic Resonance Spectroscopy
• When a charged particle such as a proton spins on its axis, it creates a magnetic field. Thus, the nucleus can be considered to be a tiny bar magnet.
• Normally, these tiny bar magnets are randomly oriented in space. However, in the presence of a magnetic field B0, they are oriented with or against this applied field.
• The energy difference between these two states is very small (<0.1 cal).
Nuclear Spin – The Origin of the Signal
The energy difference between these two states is very small (<0.1 cal).
Nuclear Magnetic Resonance Spectroscopy
• In a magnetic field, there are now two energy states for a proton:
a lower energy state with the nucleus aligned in the same direction as B0; and a higher energy state with the nucleus aligned opposed to B0.
• When an external energy source (h) that matches the energy difference (E) between these two states is applied, energy is absorbed, causing the nucleus to “spin flip” from one orientation to another.
• The energy difference between these two nuclear spin states corresponds to the low frequency RF region of the electromagnetic spectrum.q y g g p
Nuclear Magnetic Resonance Spectroscopy
Schematic of an NMR spectrometer
• Protons (which are the nuclei of hydrogen atoms) that are in different environments absorb at slightly different frequencies, so they are distinguishable by NMR.
• The frequency at which a particular proton absorbs is determined by the strength of the magnetic field generated by the electrons around it.
• NMR spectrometers are referred to as 300 MHz or 500 MHz instruments, and so forth, depending on the frequency of the RF radiation used for resonance.
• These spectrometers use powerful magnets to create a small but measurable energy difference between two possible spin states.

1/7/2011
9
Nuclear Magnetic Resonance Spectroscopy
• In the vicinity of the nucleus, the magnetic field generated by the circulating electron decreases the external magnetic field that the proton “feels”.
• Since the electron experiences a lower magnetic field strength, it needs a lower frequency to achieve resonance. Lower frequency is to the right in an NMR spectrum, toward a lower chemical shift, so shielding shifts the absorption upfield.
Shielding and Deshielding of Protons
Nuclear Magnetic Resonance Spectroscopy
• The small magnetic field generated by electrons is called an induced field. Since the actual magnetic field sensed by proton is slightly less than the external field, the electrons are said to shield the protons and the signal is shifted upfield since lower energy is needed to achieve resonance.
Shielding and Deshielding of Protons
Nuclear Magnetic Resonance Spectroscopy
Position of Signals - Shielding and Deshielding of ProtonsRelation to Chemical Shift
Nuclear Magnetic Resonance Spectroscopy
Position of Signals - Shielding and Deshielding of ProtonsRelation to Chemical Shift

1/7/2011
10
Nuclear Magnetic Resonance Spectroscopy
• In a magnetic field, the six electrons in benzene circulate around the ring creating a ring current.
• The magnetic field induced by these moving electrons reinforces the applied magnetic field in the vicinity of the protons.
• The protons thus feel a stronger magnetic field and a higher frequency is needed for resonance. Thus they are deshielded and absorb downfield.
Position of Signals - Shielding and Deshielding of ProtonsAromatic Compounds
Nuclear Magnetic Resonance Spectroscopy
• In a magnetic field, the loosely held electrons create a magnetic field that reinforces the applied field in the vicinity of the protons.
• Since the protons now feel a stronger magnetic field, they require a higher frequency for resonance. Thus the protons are deshielded
and the absorption is downfield.
Position of Signals - Shielding and Deshielding of ProtonsAlkenes
Nuclear Magnetic Resonance Spectroscopy
• In a magnetic field, the electrons of a carbon-carbon triple bond are induced to circulate, but in this case the induced magnetic field opposes the applied magnetic field (B0).
• Thus, the proton feels a weaker magnetic field, so a lower frequency is needed for resonance. The nucleus is shielded and the absorption is upfield.
Position of Signals - Shielding and Deshielding of ProtonsAlkynes
Nuclear Magnetic Resonance Spectroscopy1H NMR—Position of Signals – Effect of electronegativity
• Protons near electronegative atoms are deshielded, so they absorb downfield
• This deshielded nucleus experiences a higher magnetic field strength, to it needs a higher frequency to achieve resonance.
• Higher frequency is to the left in an NMR spectrum, toward higher chemical shift—so deshielding shifts an absorption downfield..

1/7/2011
11
Nuclear Magnetic Resonance Spectroscopy
Summary —Shielding and Chemical Shift Values
Aldehyde protons are highly deshielded and resonantes at around 9.8 ppm. Why?
Nuclear Magnetic Resonance SpectroscopyChemical Shift Equivalent and Nonequivalent Protons.
Homotopic and Heterotopic Hydrogens
• How do we decide whether two or more protons in a molecule are in identical environment (chemical!, magnetic!)?- Atom replacement method
Replacing any one of the six hydrogens of ethane by different atoms gives the samecompound All six hydrogens are homotopic and therefore chemical shift equivalent
Heterotopic atoms have different chemical shift and are not chemical shift equivalent
Homotopic hydrogen have identical environment and will have the same chemical shift. They are said to be chemical shift equivalent.
Thus, replacing of hydrogens from methyl OR methylene group yields TWO differentcompounds. Chloroethane has two sets of hydrogens that are heterotopic to each others
compound. All six hydrogens are homotopic and therefore chemical shift equivalent.
Nuclear Magnetic Resonance Spectroscopy
• The number of NMR signals equals the number of different types of protons in a compound.
• Protons in different environments give different NMR signals.
• Equivalent protons (chemically and magnetically) give the same NMR signal.
Number of Signals
Chemical Shift Equivalent and Nonequivalent Protons.Homotopic and Heterotopic Hydrogens
Nuclear Magnetic Resonance Spectroscopy
• However, two H atoms on a ring or double bond protons are equivalent only if they are cis (or trans) to the same groups.
1H NMR—Number of Signals

1/7/2011
12
Nuclear Magnetic Resonance Spectroscopy
1H NMR—Enantiotopic and Diastereotopic Protons.
Enantiotopic hydrogens have the same chemical shift and appear in the same signal.
Nuclear Magnetic Resonance Spectroscopy
1H NMR—Enantiotopic and Diastereotopic Protons.
Diastereotopic hydrogens have different chemical shifts and will give different signals.
Nuclear Magnetic Resonance Spectroscopy
1H NMR Spectra for alkenes:How can we distinguish between E and Z isomers?Different magnitude of the coupling constant for the hydrogen in trans and cis relation
The magnitude of the coupling constant J for trans protons are larger than for the cisprotons (the lines in respective doublets are more separated)
Nuclear Magnetic Resonance Spectroscopy1H NMR—OH Protons: The Spectra of alcohols.
• Under usual conditions, an OH proton does not split the NMR signal of adjacent protons.
• The signal due to an OH proton is not split by adjacent protons.

1/7/2011
13
Nuclear Magnetic Resonance Spectroscopy1H NMR—Spin-Spin Splitting: Doublet formation
The frequency difference, measured in Hz between two peaks of the doublet is called the coupling constant, J.
The magnetic field sensed by a proton (Ha) being observed is affected by the magnetic moment of an adjacent proton (Hb) A proton (Hb) can be aligned with the magnetic field or against the magnetic field,
resulting in two energy states for Hb
The observed proton (Ha) senses the two different magnetic moments of Hb as a slight change in the magnetic field; one magnetic moment reinforces the external field and one substracts from it
The signal for Ha is split into a doublet with a 1:1 ratio of peak areas
The magnitude of the splitting is called the coupling constant Jab and is measured in Hertz (Hz)
Nuclear Magnetic Resonance Spectroscopy1H NMR—Spin-Spin Splitting; Triplet formation When two adjacent protons Hb are coupled to Ha, there are four
possible combinations of the magnetic moments for the two Hbs Two of these combinations involve pairings of magnetic moments that cancel
each other, causing no net displacement of signal
One combination of magnetic moments reinforces and another subtracts from the applied magnetic field
Ha is split into a triplet having a 1:2:1 ratio of signal areas

1/7/2011
14
When three adjacent protons are coupled to Ha, there are 10 possible combinations of the magnetic moments for the Hbs Four unique orientations exist and so Ha is split into a quartet with intensities 1:4:4:1
1H NMR—Spin-Spin Splitting: Quartet formation Nuclear Magnetic Resonance Spectroscopy - 13C NMR
13C signals are not split. Each type of carbon atom appears as a single peak
One peak for each magnetically distinct carbon
NMR Spectroscopy- 13C NMR
• The two features of a 13C NMR spectrum that provide the most structural information are the number of signals observed and the chemical shifts of those signals.
• The lack of splitting in a 13C spectrum is a consequence of the low natural abundance of 13C.
• Recall that splitting occurs when two NMR active nuclei—like two protons—are close to each other. Because of the low natural abundance of 13C nuclei (1.1%), the chance of two 13C nuclei being bonded to each other is very small (0.01%), and so no carbon-carbon splitting is observed.
• A 13C NMR signal can also be split by nearby protons. This 1H-13C splitting is usually eliminated from the spectrum by using an instrumental technique that decouples the proton-carbon interactions, so that every peak in a 13C NMR spectrum appears as a singlet.
13C NMR Spectroscopy -—Number of Signals
• The number of signals in a 13C spectrum gives the number of different types of carbon atoms in a molecule.
• Because 13C NMR signals are not split, the number of signals/lines in the 13C spectrum equals number of nonequivalent carbons.
• In contrast to the 1H NMR situation, peak intensity is not proportional to the number of absorbing carbons, so 13C NMR signals are not integrated.

1/7/2011
15
13C Chemical ShiftsJust as in 1H NMR spectroscopy, chemical shifts in 13C NMR
depend on the electron density around the carbon nucleus Decreased electron density causes the signal to move downfield (deshielding)
Increased electron density causes the signal to move upfield (shielding)
Because of the wide range of chemical shifts, it is rare to have two 13C peaks coincidentally overlap
A group of 3 peaks at 77 comes from the common NMR solvent deuteriochloroform and can be ignored
Nuclear Magnetic Resonance Spectroscopy
13C NMR—Number of Signals
Nuclear Magnetic Resonance Spectroscopy
13C NMR—Number of Signals
Nuclear Magnetic Resonance Spectroscopy