solid waste generation in oregon · 6/2/2007 · total generation of solid waste (including both...
TRANSCRIPT

Oregon Department of Environmental Quality
Waste Prevention Strategy – Background Paper #1
Solid Waste Generation in Oregon
Composition and Causes of Change
Prepared by
February 2007
Solid Waste Program

Oregon Department of Environmental Quality Page 1 07-LQ-005
Solid Waste Generation in Oregon: Composition and Causes of Change
Prepared by David Allaway, Oregon DEQ
February 6, 2007 Executive Summary Waste Generation Up 70% in 12 Years Since DEQ first began tracking recovery and disposal of solid waste in 1992, the quantity of waste generated in Oregon has grown significantly. Waste generation – both on a total as well as a per-capita basis – has grown every year since 1992. According to published DEQ statistics, total generation of solid waste (including both recovery and disposal) increased 70% between 1993 and 2005. Population growth accounts for only a portion of that increase; on a per-capita basis Oregonians sent 43% more off to be recycled, composted, or disposed in 2005 than we did 12 years earlier. This finding implies that the throughput of materials in our homes and businesses has grown rapidly, and by extension, that our consumption and use of natural resources has grown as well. Even as some industries become more efficient in their use of resources and reduce their environmental burdens per ton of material produced, such improvements may be offset by increases in both total and per-capita consumption. Purpose of this Report Oregon law calls for total waste generation to stabilize by 2009. In order for this goal to be met, assuming population continues to grow, per-capita generation will need to reverse its upward trend and begin to fall. In order to better define its role in helping the state achieve this goal, the Oregon DEQ is in the process of developing a Waste Prevention Strategy. As part of that project, DEQ has developed this report, the purpose of which is threefold:
• Characterize Oregon’s waste generation, including, where possible, its components on a material- and product-specific basis.
• Describe the recent changes in waste generation. Why has Oregon’s waste stream grown so rapidly, even on a per-person basis? Which materials have grown at a faster rate than others?
• Where possible, explain the causes of the reported increase in waste generation. Increasing Generation of Construction/Demolition Wastes, Yard Debris, and Plastics During the period studied in detail by this report (1993 – 2002), according to data published by DEQ, the greatest increases in per-capita generation occurred in the categories of yard debris, a variety of materials associated with building practices (lumber, inerts), scrap metal, and plastics. However, some of the increases reported by DEQ did not result from increases in materials use or “wasting behaviors” but rather represent shifts in how wastes were managed or reported.

Oregon Department of Environmental Quality Page 2 07-LQ-005
During the same time period, the U.S. EPA, which only traces changes in municipal wastes excluding construction and demolition debris, observed relatively little change in per-capita waste generation. DEQ’s estimates include many construction and demolition wastes; EPA’s estimates normally do not. This explains in part how DEQ finds per-capita generation to be rising while EPA finds little to no change. Interestingly, for the one year in which EPA estimated per-capita construction and demolition waste (1996), EPA’s per-capita estimate of municipal waste plus construction/demolition waste was within 10% of DEQ’s estimate of per-capita solid waste. According to EPA, during the period 1993 – 2002, per-capita generation of durable goods increased, while per-capita generation of non-durable goods was essentially flat and per-capita generation of containers and packaging waste actually fell slightly. Among specific product types, EPA found that generation of plastic packaging, clothing/footware, commercial printing, small appliances, and carpets/rugs outpaced growth in personal consumption expenditures, which historically has grown in fairly close parallel with waste generation. Causes of Increasing Waste Generation In this report, DEQ identifies and attempts to evaluate 16 different hypotheses as to why per-capita waste generation has grown. While data to evaluate some of these hypotheses is lacking, it appears that 11 – 19% of the total increase can be attributed to changes in the reporting of waste data, particularly scrap metal. These increases are not real, but rather an artifact of inconsistencies in data collection and interpretation. An additional 5 – 20% of the total increase in per-capita generation can readily be explained as waste management has shifted away from “non-counting” methods such as burning and home composting and toward “counting” methods such as centralized composting and landfilling. These shifts represent an increase in “waste generation as it is counted,” but do not represent a real increase in material use or “wasting” behavior. This estimate (5 – 20%) is probably low, due to insufficient data. The remaining growth in per-capita generation – perhaps 50% to 80% of the observed increase – appears to be caused by real increases in waste-generating activities and materials use. Oregonians are, in fact, producing greater discards per person (on average) than we were in the early 1990s. An increase in the generation of building-related wastes (construction, renovation, and demolition debris) appears to be a significant factor, and one that will continue to be of import into the future. Because most building-related waste results from renovation and demolition activities (as opposed to construction), the majority of building materials consumed don’t end up as wastes until years or decades after construction. Today’s building wastes are largely materials that were purchased and installed years or decades ago. This is a different pattern than, say, packaging or non-durable goods, which tend to become waste within days or months of purchase. At the same time, new single-family homes are become larger and even more material-intensive, portending the possibility of even higher generation of waste in the future, once these buildings eventually undergo renovation and demolition.

Oregon Department of Environmental Quality Page 3 07-LQ-005
In addition to increasing waste from buildings, other likely causes of increasing waste generation in Oregon include:
• increased purchases of household furnishings (associated in part with larger house sizes), • decreases in the durability and repair of so-called “durable goods,” and • other increases in consumption associated with rising incomes, falling prices, increased
access to credit, more pervasive marketing, changes in social norms, and other factors. In addition, real generation of yard debris (leaves, grass, prunings) may also be up, although the cause of such increase is not immediately obvious. Evidence for some of these increases is somewhat limited, and further research into these topics may be appropriate.
Oregon Department of Environmental Quality Page 4 07-LQ-005
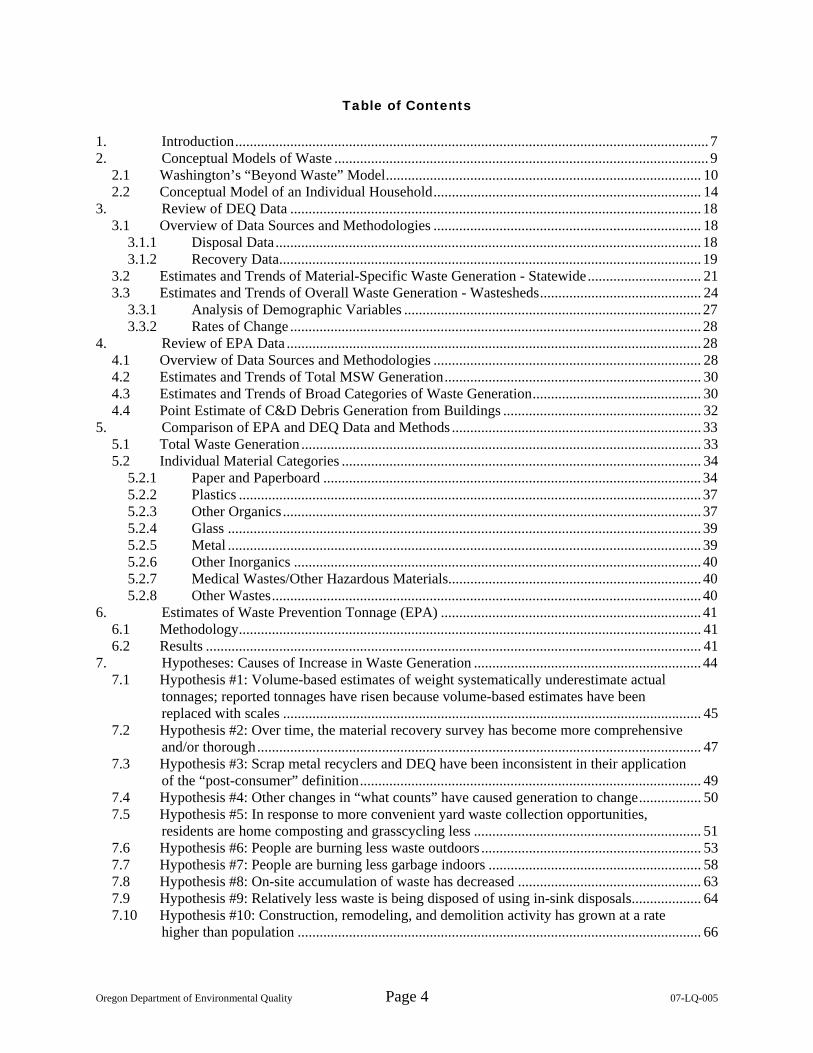
Table of Contents 1. Introduction................................................................................................................................. 7 2. Conceptual Models of Waste ...................................................................................................... 9
2.1 Washington’s “Beyond Waste” Model...................................................................................... 10 2.2 Conceptual Model of an Individual Household......................................................................... 14
3. Review of DEQ Data ................................................................................................................ 18 3.1 Overview of Data Sources and Methodologies ......................................................................... 18
3.1.1 Disposal Data.................................................................................................................... 18 3.1.2 Recovery Data................................................................................................................... 19
3.2 Estimates and Trends of Material-Specific Waste Generation - Statewide............................... 21 3.3 Estimates and Trends of Overall Waste Generation - Wastesheds............................................ 24
3.3.1 Analysis of Demographic Variables ................................................................................. 27 3.3.2 Rates of Change ................................................................................................................ 28
4. Review of EPA Data ................................................................................................................. 28 4.1 Overview of Data Sources and Methodologies ......................................................................... 28 4.2 Estimates and Trends of Total MSW Generation...................................................................... 30 4.3 Estimates and Trends of Broad Categories of Waste Generation.............................................. 30 4.4 Point Estimate of C&D Debris Generation from Buildings ...................................................... 32
5. Comparison of EPA and DEQ Data and Methods .................................................................... 33 5.1 Total Waste Generation ............................................................................................................. 33 5.2 Individual Material Categories .................................................................................................. 34
5.2.1 Paper and Paperboard ....................................................................................................... 34 5.2.2 Plastics .............................................................................................................................. 37 5.2.3 Other Organics.................................................................................................................. 37 5.2.4 Glass ................................................................................................................................. 39 5.2.5 Metal ................................................................................................................................. 39 5.2.6 Other Inorganics ............................................................................................................... 40 5.2.7 Medical Wastes/Other Hazardous Materials..................................................................... 40 5.2.8 Other Wastes..................................................................................................................... 40
6. Estimates of Waste Prevention Tonnage (EPA) ....................................................................... 41 6.1 Methodology.............................................................................................................................. 41 6.2 Results ....................................................................................................................................... 41
7. Hypotheses: Causes of Increase in Waste Generation .............................................................. 44 7.1 Hypothesis #1: Volume-based estimates of weight systematically underestimate actual
tonnages; reported tonnages have risen because volume-based estimates have been replaced with scales .................................................................................................................. 45
7.2 Hypothesis #2: Over time, the material recovery survey has become more comprehensive and/or thorough......................................................................................................................... 47
7.3 Hypothesis #3: Scrap metal recyclers and DEQ have been inconsistent in their application of the “post-consumer” definition............................................................................................. 49
7.4 Hypothesis #4: Other changes in “what counts” have caused generation to change................. 50 7.5 Hypothesis #5: In response to more convenient yard waste collection opportunities,
residents are home composting and grasscycling less .............................................................. 51 7.6 Hypothesis #6: People are burning less waste outdoors ............................................................ 53 7.7 Hypothesis #7: People are burning less garbage indoors .......................................................... 58 7.8 Hypothesis #8: On-site accumulation of waste has decreased .................................................. 63 7.9 Hypothesis #9: Relatively less waste is being disposed of using in-sink disposals................... 64 7.10 Hypothesis #10: Construction, remodeling, and demolition activity has grown at a rate
higher than population .............................................................................................................. 66

Oregon Department of Environmental Quality Page 5 07-LQ-005
7.11 Hypothesis #11: As house sizes (measured in square feet) have grown, the per-capita generation of construction (and possibly demolition) waste has grown ................................... 69
7.12 Hypothesis #12: As house sizes (measured in square feet) have grown, there is greater acquisition of durable goods/furnishings (and resulting waste), as “stuff expands to fill the available space” ........................................................................................................................ 70
7.13 Hypothesis #13: The average number of people per household has fallen, resulting in higher per-capita waste generation due to losses in “efficiency of scale” in household economies ................................................................................................................................. 71
7.14 Hypothesis #14: Durable goods are less durable and/or less likely to be repaired or reused .... 71 7.15 Hypothesis #15: Packaging is more “wasteful”......................................................................... 75 7.16 Hypothesis #16: People are buying more goods (as incomes have risen and prices of many
goods have fallen) and as a result, generating more waste ....................................................... 76 7.17 Qualitative Review of Other Causes of Increasing Acquisition and Waste .............................. 78 7.18 Summary of Hypotheses............................................................................................................ 79
7.18.1 Hypotheses........................................................................................................................ 81 7.18.2 Relative Impacts on Per-Capita Generation...................................................................... 82
8. Conclusions............................................................................................................................... 84 Figures Figure 1 Total and Per-Capita Waste Generation, Oregon “Official” Figures, 1993 - 2005 Figure 2 Per-Capita Waste Generation (Oregon), 1992 – 2005 (pounds per person per day) Figure 3 Conceptual Model of Material Transformation within the Economy Figure 4 Solid Waste Relative to other Key Waste and Material Flows in Washington,
2000 Figure 5 Conceptual Model of Household Waste Generation Figure 6 2000 vs. 2001 Per-Capita Generation, Official vs. Adjusted Results Figure 7 Material-Specific Estimates of Oregon 1993 and 2002 Per-Capita Waste
Generation and Average Annual Percent Change Figure 8 Wasteshed Variance from Statewide Average Per-Capita Generation, 2002 - 2004 Figure 9 Wastesheds with Highest and Lowest Percent Change in Per-Capita Waste
Generation, 1993 – 1995 (average) vs. 2002 – 2004 (average) Figure 10 EPA Estimates of Per-Capita Waste Generation, 1960 – 2003 Figure 11 Per-Capita Generation by Waste Type, 1960 – 2003 Figure 12 EPA Estimate of 1996 Building-Related C&D Debris Generation Figure 13 Comparison of Oregon and U.S. EPA Estimates of Per-Capita Waste Generation
(2002) and Rates of Change Figure 14 Source Reduction by Major Material Categories, 2000 (EPA) Figure 15 Source Reduction/Expansion for Individual Components of MSW – 2000 (EPA) Figure 16 Disposal Reporting in Oregon by Estimation Method, 1993 and 2002 Figure 17 Per-Capita Recovery by Method, Scrap Metal, 1993 and 2002 Figure 18 Percent of Oregon Households Burning various Wastes (1996) Figure 19 Unprompted, First Responses to “What do you typically do with (material)?”
(1996) Figure 20 Percent of Households Burning Outdoors, Lakeview, and La Grande (2002) Figure 21 “Cold Season” as a Percentage of “Warm Season” Monthly Averages for
Residential Garbage Route Collections

Oregon Department of Environmental Quality Page 6 07-LQ-005
Figure 22 Correlation between Wood Stove Use and Depressed Cold Weather Residential Waste Generation
Figure 23 Household Use of In-Sink Garbage Disposals for Food Scraps, Metro (1998 and 2004)
Figure 24 Oregon Employment in Reuse/Repair-Related SIC Codes Figure 25 Summary of Hypotheses

Oregon Department of Environmental Quality Page 7 07-LQ-005
1. Introduction This report has been prepared in support of the Oregon Department of Environmental Quality’s (DEQ’s) Waste Prevention Strategy. The purpose of the Waste Prevention Strategy is to provide DEQ with a road map to help the State achieve the statutory waste generation goals by setting priorities and actions for reuse and prevention for 2007 through 2017. The Strategy is intended to define and clarify DEQ’s role in waste prevention and reuse for the coming years. In advance of Strategy development, DEQ is undertaking research into a number of topics related to waste prevention and waste generation. This report is part of that larger background research and information gathering phase. Specifically, it evaluates data around a broad but very important question: why has waste generation in Oregon has risen so dramatically since DEQ began tracking waste generation in 1992? As shown in Figure 1, between 1993 and 2005, total waste generation (expressed as the sum of “counting” disposal and “counting” recovery) increased 70%, from 3.3 million tons (1993) to 5.5 million tons (2005).1 Of course, some of that increase may be explained by increases in population. The state’s population rose 19% between 1993 and 2005. But during the same period, per-capita waste generation grew at an even faster rate - 43% - and thus accounts for more of the increase in total waste generation than population growth.2 The right hand side of Figure 1 factors out population growth by showing waste generation expressed in per-person terms. Figure 2 portrays the same results expressed in pounds per Oregonian per day.
Figure 1. Total and Per-Capita Waste Generation, Oregon “Official” Figures, 1993 - 20053
Year Total Waste Generation (tons) Per-Capita Waste Generation (pounds) Recovery Disposal Generation Recovery Disposal Generation 1993 975,000 2,281,000 3,255,000 637 1,491 2,128 1994 1,119,000 2,313,000 3,432,000 717 1,483 2,200 1995 1,257,000 2,362,000 3,624,000 790 1,484 2,277 1996 1,338,000 2,497,000 3,835,000 825 1,539 2,364 1997 1,462,000 2,633,000 4,095,000 886 1,595 2,480 1998 1,605,000 2,696,000 4,301,000 958 1,609 2,568 1999 1,626,000 2,789,000 4,415,000 958 1,644 2,602 2000 1,766,000 2,778,000 4,544,000 1,028 1,617 2,645 2001 1,999,000 2,635,000 4,634,000 1,152 1,518 2,670 2002 2,029,000 2,723,000 4,753,000 1,158 1,554 2,712 2003 2,117,000 2,797,000 4,914,000 1,195 1,579 2,775 2004 2,305,000 2,920,000 5,225,000 1,287 1,630 2,917 2005 2,511,000 3,026,000 5,537,000 1,383 1,667 3,050 1 This equates to an average annual growth rate of 4.5%. Data from 1992 is excluded from this analysis because it is the first year that DEQ collected comprehensive data on recovery quantities and the data is considered relatively incomplete. 2 From 1993 – 2005, average annual growth rates were 1.4% for population and 3.0% for per-capita waste generation. 3 These represent figures as published by DEQ in its “2005 Oregon Material Recovery and Waste Generation Rates Report,” with subsequent corrections to waste generation data for 2002 and 2003.

Oregon Department of Environmental Quality Page 8 07-LQ-005
Figure 2. Per Capita Waste Generation (Oregon), 1992 – 2005
(pounds per person per day)
Understanding the causes of historic growth in waste generation is important if the state hopes to proactively work to meet its statutory goals for reducing waste generation. These goals, contained in Oregon Revised Statutes (ORS) 459A.010(1), are:
(c) For the calendar year 2005 and subsequent years, that there be no annual increase in per capita municipal solid waste generation; and (d) For the calendar year 2009 and subsequent years, that there be no annual increase in total municipal solid waste generation.
Conventional wisdom often holds that historically, waste generation has gone up as consumption has gone up, and that consumption has gone up as the economy has grown. Yet in a world of finite land and resources, perpetual increases in waste generation (and its “upstream” corollary, resource extraction) are viewed as environmentally harmful and unsustainable. When DEQ’s Waste Policy Leadership Group evaluated this issue in 2000, it recommended statewide generation goals as a way of encouraging Oregonians (including DEQ) to “delink” waste generation from economic growth. The challenge inherent in the goals is to find ways to enjoy the benefits of a vibrant, sustainable economy that meets the needs of Oregonians, but without continuing increases in waste.

Oregon Department of Environmental Quality Page 9 07-LQ-005
Better understanding the causes of rising waste generation (both in total terms and also on a per-capita basis) may also be useful in understanding the environmental ramifications of this growth, and targeting certain types of materials or products for interventions. Historically, increasing waste generation has been a result both of population increases and increases in per-capita generation. The role and causes of population growth are generally well understood, and it is not the intent of this report to address issues related to population growth. In contrast, the causes of increases in per-capita generation are not as well understood. The remainder of this report focuses on waste generation from a per-capita perspective, treating the contribution of population as a well-understood and fixed variable not discussed further. At the center of this report is a comparison of waste generation data from two sources: DEQ and the U.S. Environmental Protection Agency (EPA). DEQ and EPA take very different approaches to estimating waste generation, and comparing and contrasting these two approaches (and their results) yields some important findings. Following this evaluation, the report lists a number of hypotheses as to why per-capita waste generation in Oregon has grown so significantly. Where information is available and resources allow, each of these hypotheses are then tested. From this, a clearer picture emerges of waste generation, its growth, and the causes of its growth. Consistent use of terminology is important when discussing these topics. A robust conceptual model of “waste” is also essential, particularly since DEQ’s and EPA’s data sets do not fully overlap. It is to terminology and a consistent understanding of “waste” that the report turns next. 2. Conceptual Models of Waste Oregon’s waste generation goals apply only to municipal solid waste (MSW) and to major components of construction and demolition (C&D) waste. MSW includes waste from households, commercial establishments, institutions, and similar wastes (lunchroom, office waste) from industry and government. C&D wastes that are counted include materials such as wood, glass, roofing materials, wallboard, and most other manufactured products used in construction. Two large components of C&D wastes are specifically excluded from counting in Oregon: rock/concrete/asphalt and similar inert materials, and metal from major building demolition. Generally speaking, waste from industrial processes, forestry, agriculture, regulated hazardous wastes, and biosolids and other wastes disposed by sewer are not counted toward Oregon's waste generation goals. This section of the report presents two conceptual models of waste:
• The conceptual model of material flows developed for the Washington State Department of Ecology “Beyond Waste” Project. This model addresses all materials and all wastes at the level of the whole economy.
• A conceptual model of consumption and solid waste at the individual household level. This model looks at materials from households that may contribute to solid waste generation as defined in Oregon. Although the model is designed around households, it is easily applied to businesses as well.

Oregon Department of Environmental Quality Page 10 07-LQ-005
2.1 Washington’s “Beyond Waste” Model This discussion draws extensively from “Waste & Material Flows in Washington: A Conceptual Model and Characterization of Waste and Material Flows” (June 2, 2003), prepared for the Washington State Department of Ecology by Cascadia Consulting Group and Ross & Associates Environmental Consulting Ltd. (hereafter referred to as the “Beyond Waste Report”). All solid (and hazardous) wastes are composed of combinations of raw materials. Raw materials can be:
• Extracted or harvested; • Transformed into components; • Assembled into products; • Distributed to users (whether business, industry, or residents); • Recycled into other products and re-distributed; and, eventually • Disposed.
This transformation of materials into products, their distribution, use and ultimate disposition can generate waste at each step in the process. Figure 3 depicts the flow of materials through Oregon’s economy. This materials flow framework is based on a model developed by the World Resources Institute (WRI) for use in its recent study of material flows in the United States and four other countries.4 Similar models are used by the U.S. EPA and the U.S. Geological Survey (USGS). The model focuses on Oregon’s human economy and its interface with the natural environment, following the convention adopted from WRI. Using this approach:
• Materials enter the economy when they are purchased; and • Materials exit the economy when they are no longer available to play a role in the
economy.
4 WRI is a Washington, DC based think-tank devoted to sustainable development. The materials flow framework presented in this report is adapted from a model presented in the year 2000 WRI report Weight of Nations: Material Outflows from Industrial Economies.

Oregon Department of Environmental Quality Page 11 07-LQ-005
Figure 3. Conceptual Model of Material Transformation within the Economy
Material Inputs The left side of Figure 3 depicts the material inputs to Oregon’s economy. Materials can enter the economy as raw materials or in process, component, or finished goods, as defined below.
• Raw materials can be extracted (including mining, logging, and harvest) in Oregon and added to the economy for processing. Raw materials can also be imported from other states or countries. Many materials, however, enter Oregon’s economy as process goods, components, or finished goods imported from elsewhere in the U.S. or from other nations.
• Process goods are chemicals and other materials that are used in product manufacture but are not themselves included in finished goods.
• Components are items in various degrees of assembly that will be included in finished goods. Components may be produced in other areas and then assembled into finished goods in Oregon, such as parts for electronics or ingredients for processed foods.
• Finished goods are those ready for retail or wholesale trade. In addition to raw materials, the natural environment also supplies the economy with energy, air, water, and a variety of essential services including air and water purification through natural biotic processes.

Oregon Department of Environmental Quality Page 12 07-LQ-005
Material Transformation within the Economy Materials that enter the economy pass through a transformation process on their way to ultimate disposition. This transformation includes the following steps:
• Extraction and acquisition, such as acquiring wood chips from trees. • Materials manufacture, such as the production of kraft linerboard. • Product manufacture, such as making a corrugated box out of kraft linerboard and other
components. • Distribution, such as shipping and selling corrugated boxes to catalog order-fulfillment
warehouses. • Consumption, such as using the corrugated box to ship items to customers.
For any given product, not all of these steps occur in Oregon. For imported finished products, for example, only the last two steps occur in Oregon. Material goods can be classified into four different types:
• Non-durable goods, those with typical lifetimes of less than three years. Examples include newspapers, magazines, and food. Clothing is sometimes considered to be a non-durable good.
• Durable goods, those with typical lifetimes of three years or longer. Examples include appliances and furniture. Consumer electronics are often considered to be durable goods.
• Infrastructure, which includes materials that become part of the built environment, such as buildings, roads, and utility networks. Such structures typically last for decades or longer.
• Packaging. Almost all durable and non-durable goods (and most infrastructure materials) are contained in packaging at one or more points during their lifetimes.
As part of, and following, consumption, some materials are accumulated as stocks. These materials accumulate in the economy as highly durable goods or infrastructure (such as roads and buildings). The rate of accumulation of such material stocks is typically faster than the output of those stocks as wastes (e.g., more buildings are constructed than are torn down) although natural disasters (such as a major earthquake) have the potential of converting large quantities of stocks into wastes very quickly. Generally, total material input is greater than total material output, as some materials are held in long-lived goods and the built environment. Ultimately, however, all inputs must eventually leave the economy as outputs, even if held as stocks for a long duration. Material Outputs Many materials exit Oregon’s economy as products exported to other states or countries. Just as process goods, components, and finished goods are imported to Oregon, others are exported. The right-hand side of Figure 3 depicts these product exports. The lower portion of Figure 3 addresses non-product outputs from Oregon’s economy. These non-product outputs include municipal solid waste, construction and demolition waste, industrial wastes, biosolids, hazardous wastes, and toxic releases. Note that extraction wastes are not depicted as outputs from the economy. Because they are never purchased, output extraction wastes never enter the economy as defined in this report.

Oregon Department of Environmental Quality Page 13 07-LQ-005
Nonetheless, they are closely connected to economic activity, are generated in large quantities, and may have significant environmental impacts. Order of Magnitude Estimates of Material Flows Some authors have reported that the wastes that consumers and businesses generate represent only a small fraction of the total wastes associated with our current industrial economy.5 As part of its “Beyond Waste” Project, consultants for the Washington Department of Ecology made order of magnitude estimates of these waste flows for the purpose of making broad comparisons. DEQ may conduct similar estimates at some later time, however, the two states’ economies are similar enough (in composition, not size) that Washington’s estimates should have some rough, order-of-magnitude relevance to Oregon.6 Figure 4 illustrates the relative contribution of different estimated waste streams to Washington State’s total waste and material flows.
Figure 4. Solid Waste Relative to other Key Waste and Material Flows in Washington, 20007
32%
3%
7%
28%
11%
5%
8%
4% 2%
Carbon dioxide (32%)
Other gases (3%)
Coal overburden (7%)
Earth moving (28%)
Agricultural soil erosion (11%)
Manures (5%)
Other agriculture, forestry, and mining (8%)
Solid waste (4%)
Other (hazardous, dredging, fertilizers,biosolids, etc.) (2%)
5 For example, see Hawken, Paul, Amory Lovins, and L. Hunter Lovins, Natural Capitalism, Little, Brown and Company: Boston, 1999, or Brown, Lester, Eco-Economy, W.W. Norton and Company: New York, 2001. 6 One significant exception is coal overburden, which is produced in Washington state but not Oregon. 7 Data from “Waste & Material Flows in Washington: A Conceptual Model and Characterization of Waste and Material Flows” (June 2, 2003), prepared for the Washington State Department of Ecology by Cascadia Consulting Group and Ross & Associates Environmental Consulting Ltd.

Oregon Department of Environmental Quality Page 14 07-LQ-005
Relevance to Oregon’s Waste Prevention Strategy
• Solid waste generation is relatively small, although it is highly visible and may have greater environment impacts, on a per-ton basis, than some of the other waste types shown in Figure 4.
• Many goods consumed in Oregon are made from raw materials, process goods, components, and finished goods that are manufactured elsewhere. By extension, the environmental burdens of consumption by Oregonians are distributed globally.
• Many raw materials, process goods, components, and finished goods that are produced in Oregon are not consumed in Oregon.
• Some of today’s wastes are materials that were accumulated as stocks decades ago, and the additions to stocks today – such as through new construction – will eventually contribute to waste generation sometime in the future.
2.2 Conceptual Model of an Individual Household The model discussed previously examined the entire economy of Oregon. This next model zooms in to the level of an individual household, and examines the various flows of goods, materials, and wastes that pass into, through, and out of a generic household. This is useful because it illustrates the variety of ways in which households acquire materials that eventually become wastes, as well as the variety of methods in which wastes can be discarded – including several methods that are not quantified as waste generation by DEQ’s Solid Waste Program. As with the previous model, the focus is on materials; air, water, and energy are recognized but not explicitly addressed. Unlike the previous model, this household-scale model looks only at materials which either become municipal solid waste, or have the potential to do so. Although this model is organized around an individual household, it is equally valid for an individual business. However, for a business, inputs and outputs may be more complex, including process goods, component goods, finished goods, and raw materials as both material inputs and product outputs. The model is portrayed graphically in Figure 5. Here, material inputs include items that are purchased, gifts, other items received through the mail (bills, unwanted catalogs, etc.), and other acquisition (including “found” items, items brought home from work/school, etc.).
Oregon Department of Environmental Quality Page 15 07-LQ-005
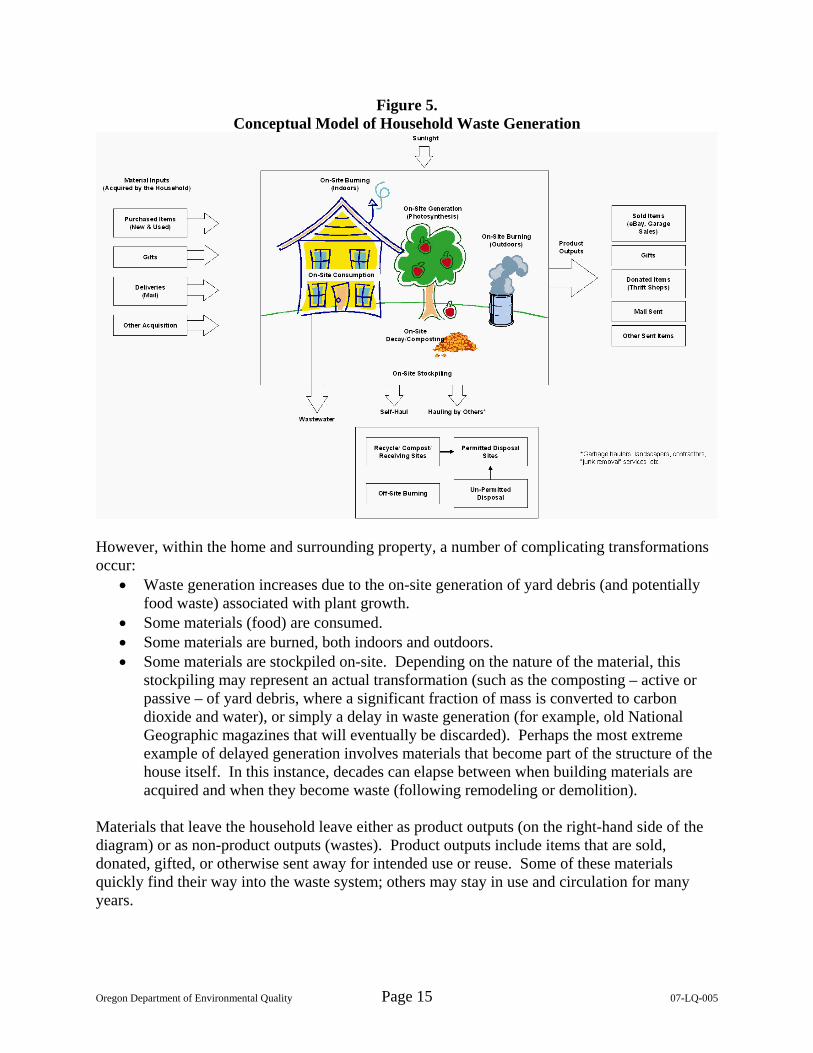
Figure 5. Conceptual Model of Household Waste Generation
However, within the home and surrounding property, a number of complicating transformations occur:
• Waste generation increases due to the on-site generation of yard debris (and potentially food waste) associated with plant growth.
• Some materials (food) are consumed. • Some materials are burned, both indoors and outdoors. • Some materials are stockpiled on-site. Depending on the nature of the material, this
stockpiling may represent an actual transformation (such as the composting – active or passive – of yard debris, where a significant fraction of mass is converted to carbon dioxide and water), or simply a delay in waste generation (for example, old National Geographic magazines that will eventually be discarded). Perhaps the most extreme example of delayed generation involves materials that become part of the structure of the house itself. In this instance, decades can elapse between when building materials are acquired and when they become waste (following remodeling or demolition).
Materials that leave the household leave either as product outputs (on the right-hand side of the diagram) or as non-product outputs (wastes). Product outputs include items that are sold, donated, gifted, or otherwise sent away for intended use or reuse. Some of these materials quickly find their way into the waste system; others may stay in use and circulation for many years.

Oregon Department of Environmental Quality Page 16 07-LQ-005
The primary distinction between product and non-product outputs is that product outputs are viewed as having value in use, while non-product outputs are normally viewed as having little to no value. The value of non-product outputs, if any, is generally limited to scrap value. Non-product outputs are disposed of down the drain (including food waste disposed of using in-sink disposals), as well as materials hauled to recyclers, composters, and other waste management facilities. Relevance to Oregon’s Waste Prevention Strategy
• Waste generation, defined as the sum of waste sent to “counting” recovery sites and permitted disposal sites, represents only a portion of outputs.
• A significant number of on-site transformation processes exist. Particularly in rural areas where burning and on-site stockpiling may be more common, these processes may handle a significant quantity of what would otherwise become non-product outputs.
• Just as the previous model showed that solid wastes are only a fraction of all material flows in the economy, “waste generation” (as counted in Oregon) represents only a portion of the fate of the household’s material inputs.
• Consumption of various materials generates various amounts of solid waste. For example, the amount of newspapers that a household generates as municipal solid waste is probably fairly close to the quantity of newspapers acquired. In contrast, waste generation associated with the consumption of firewood (in the form of ashes) is much less than the quantity of firewood acquired.
• “Consumption” and “acquisition” are not the same. Households can consume items they don’t acquire (such as food grown on-site). Conversely, “consumption” implies use (and at least partial destruction of value, as items, once consumed, are typically discarded as unwanted). In contrast, some materials (such as books that one buys but never reads) are acquired but never consumed.8
• While “waste generation” is sometimes viewed as synonymous with “consumption” or “acquisition,” in fact the three activities are not exactly the same. In the long term, increasing acquisition will lead to increases in waste generation, and increases in waste generation are caused by increasing acquisition. However, particularly at the level of the individual household and over shorter time periods, waste generation may increase for causes unrelated to changes in acquisition or consumption, and an increase in consumption and/or acquisition does not necessarily translate into an immediate increase in waste generation.
Consumption, Acquisition, and Satisfaction Not illustrated in Figure 5 is the role that consumption (and/or acquisition) plays in personal sense of well-being, happiness, or satisfaction. These issues may be of critical importance to understanding at least some of the causes of acquisition, consumption, and resulting waste generation behaviors among consumers. A full exploration of the interplay between consumption, acquisition, and satisfaction is outside the scope of this document, but a short digression is in order to briefly lay out some of the issues.9 8 For more on these and related concepts, readers may want to review the document “Celebrating Consumption” by Bruce Nordman, Lawrence Berkeley National Laboratory, viewed 1/8/07 at http://eetd.lbl.gov/EA/Buildings/BNordman/C/cons3.html. 9 Drawn partially from Nordman, Ibid.

Oregon Department of Environmental Quality Page 17 07-LQ-005
The satisfaction obtained from consumption is not necessarily the same as the satisfaction obtained from acquisition. For example, the satisfaction that one obtains from buying fancy clothes may be different from the satisfaction (or lack thereof) that one obtains from “consuming” (wearing) them. If shopping for clothes and the anticipation of wearing them generates pleasure, but they no longer fit well when one goes to put them on, then the satisfaction derived from acquisition is likely to be greater than the satisfaction derived from consumption. Conversely, for a person who dislikes haggling with car salesmen and/or takes on significant debt to afford the down payment, but benefits greatly from the use of a car, the satisfaction of using (“consuming”) the car may far outweigh the satisfaction associated with acquiring it. Clearly, at a psychological level, acquisition and consumption are not the same. It is also potentially useful to recognize that consumption per se does not necessarily generate satisfaction. In consumption, products are used to deliver services that people want (food provides nutrition, clothing provides warmth, etc.), but the translation of those services into well-being is the realm of a separate transformative process that combines both physiological and psychological elements. This can be examined using several examples. First, consider two people: a cold, hungry man and a well-fed child. Both are given a choice between two items to eat: a hot bowl of stew or an ice cream cone. Consumption of either food provides a service (nutrition); consumption of the stew provides an additional service (warmth). The stew arguably provides better nutrition (as well as warmth) than the ice cream, so it could be argued that the stew provides greater “service” than the ice cream. Yet the child may derive greater satisfaction from the ice cream, while the cold and hungry man derives greater satisfaction from the stew. Further, depending on disposition and other psychological conditions, the child may derive greater satisfaction overall from consuming ice cream, even though consumption of stew provides more and greater service (nutrition, warmth) than consumption of the ice cream. Similarly, two people may be given the option of acquiring a fur coat or a fleece jacket made from recycled polyethylene. Both coats may perform comparably in providing the wearers with warmth. Each also allows the wearer to make certain statements regarding fashion, style, and/or values. Arguably, this is also a service that is derived from “consuming” the coat. This service will vary as a function of the individuals’ cultural backgrounds, social networks, and values. The first person may obtain immense personal satisfaction from wearing and being seen in a fur coat, while the second may obtain an equally greater sense of satisfaction from forgoing the choice of fur. Clearly then, the psychological satisfaction that individuals derive from consumption is not necessarily related to the quantity or quality of the service that the act of consumption delivers. As a corollary, more consumption does not necessarily translate into more satisfaction. Finally, it is important to note that changes in social standards and expectations can cause changes in how much satisfaction is derived from any given unit of consumption. For example, acquiring and “consuming” a 1,200 square foot home in 1950 likely generated far more satisfaction for the average Oregonian than would be generated from the same acquisition and consumption practice today.

Oregon Department of Environmental Quality Page 18 07-LQ-005
3. Review of DEQ Data DEQ has devoted extensive resources to tracking waste flows in Oregon since 1992, the year following the first Legislative adoption of statewide and wasteshed-specific recovery goals.10 Disposal and recovery data are tracked separately. No regular tracking system is in place for material acquisition, consumption, reuse, burning, on-site disposal, or other material flows, although some limited data is available (see Section 7). 3.1 Overview of Data Sources and Methodologies 3.1.1 Disposal Data DEQ counts as “disposed” wastes that are generated within Oregon and sent to disposal sites, which consist of landfills and two permitted waste incinerators. Disposal site operators report tonnages on a quarterly (for larger facilities) or annual (for smaller facilities) basis. Tonnage reporting provides the basis for the payment of per-ton disposal fees. Tonnage reports include both “counting” wastes from residential, commercial, and construction/demolition sources (which are reported by county), as well as “non-counting” wastes such as contaminated cleanup material, asbestos, industrial and agricultural waste, pure loads of rubble/rock/asphalt, etc. (Only “counting” wastes are included in the estimate of waste generation.) The majority of waste is actually weighed, although some small facilities estimate incoming volumes of compacted and uncompacted wastes and convert these volumes to tons, using DEQ-provided conversion factors.11 Waste imported from other states is a significant portion of all wastes disposed in Oregon, but is not included in this evaluation. Oregon exports a very small amount of solid waste for disposal in other states, and these tonnages (if reported) are included in this evaluation. The composition of “counting” waste disposed is characterized through a waste composition study, which is normally conducted once every two or three years. In recent years, the study has been co-funded by Metro, with other local governments (including Marion County and the City of Eugene) periodically joining in for additional sampling in their communities. While some other U.S. states also conduct waste composition studies, few compare to Oregon’s in terms of quality and comprehensiveness. A typical study involves the following basic steps:
• Disposed waste is divided into distinct substreams, such as residential garbage trucks, drop boxes, and self-haulers bringing waste to transfer stations and landfills.
• Samples of waste (normally 200+ pounds in weight) are collected from each substream from various disposal sites around the State.
• Each sample is sorted into categories (as many as 84 different categories). • Each category for each sample is weighed. • Statistical analysis is used to estimate the composition of each substream. • Data from all substreams are combined and weighted by the estimated tonnage of each
substream, to produce a statewide estimate of total waste composition.
10 The term “wasteshed” is generally synonymous with counties, with a few notable exceptions. The Portland-area counties of Clackamas, Multnomah, and Washington are combined into the Metro Wasteshed. The City of Milton-Freewater, located in Umatilla County, is its own distinct wasteshed. Finally, some wastesheds include whole cities that cross county lines. For example, the Linn Wasteshed includes the entire population of the City of Albany, including those waste generators also located in Benton County. 11 In 2002 an estimated of 99.2% of “counting” waste disposed was actually weighed, up from 72.4% in 1993.

Oregon Department of Environmental Quality Page 19 07-LQ-005
Two optional, additional steps involve “contamination analysis” and “material counts”: • In the contamination analysis, randomly-selected field samples are re-sorted, cleaned, and
dried to estimate the amount of contamination in each sorted material. This information is used to adjust the direct disposal-site composition to estimate the amount of “clean, dry” material being thrown away.12
• Certain materials (beverage containers, oil filters, and fluorescent tubes) are counted (in addition to being weighed).
The results of the waste composition studies are applied against annual tonnage reports to estimate the quantity of different materials disposed of in given years. Recent studies sort waste into approximately 84 different categories. Some categories are materials (“low grade paper,” “plastic film,” “food”) or mixes of materials (“mixed wood/materials”) while other categories are organized around products or types of products (such as “hardcover books,” disposable diapers,” and “computers”). 3.1.2 Recovery Data DEQ conducts an annual material recovery survey, which is used to estimate recovery tonnages both on a statewide as well as individual wasteshed level. Recovery tonnages are combined with disposal data to estimate “waste generation”; subsequently dividing recovery by generation provides the “calculated” recovery rate.13 Oregon law requires that all public and private recycling and material recovery operations respond to DEQ’s material recovery survey or be subject to enforcement action. Oregon’s waste haulers and private recycling companies must report on all the recyclable materials they handle, including the amount collected, wasteshed (generally the same as county) of origin of each material, and where materials are marketed. Oregon’s recovery rate includes only post-consumer materials generated in Oregon and collected for recycling, composting, or energy recovery. Waste from manufacturing and industrial, agricultural, and forestry processes (pre-consumer materials) are not included, nor are recyclable materials imported into Oregon from out-of-state. Generally, reconditioned and reused materials such as second-hand clothing, furniture, and other thrift-shop items, are not included, nor is edible food rescue. Refilling and reuse of beverage bottles is counted, although this practice has virtually disappeared in Oregon. Because of the difficulty of separating post-consumer scrap metal from commercial and industrial scrap metal, scrap metal dealers are exempt from mandatory reporting for metals received from private sources. Metal scrap from vehicles and from major demolition are 12 The findings of the contamination study are significant for certain materials. For example, in the 2002 waste composition study, contamination analysis reduced the estimated amount of paper disposed by about 21%. Plastics disposal was reduced by about 19%, and food waste went up at least 5%. This approach was pioneered by DEQ’s Peter Spendelow and is one of the reasons Oregon’s waste composition studies are widely viewed as being among the nation’s best. 13 Credits for waste prevention, reuse, and home composting are added to the “calculated” recovery rate in order to arrive at the “total” recovery rate for individual wastesheds. The value of these credits (typically 2% each) was set by legislation in 1997, but does not affect the evaluation contained in this report.
Oregon Department of Environmental Quality Page 20 07-LQ-005
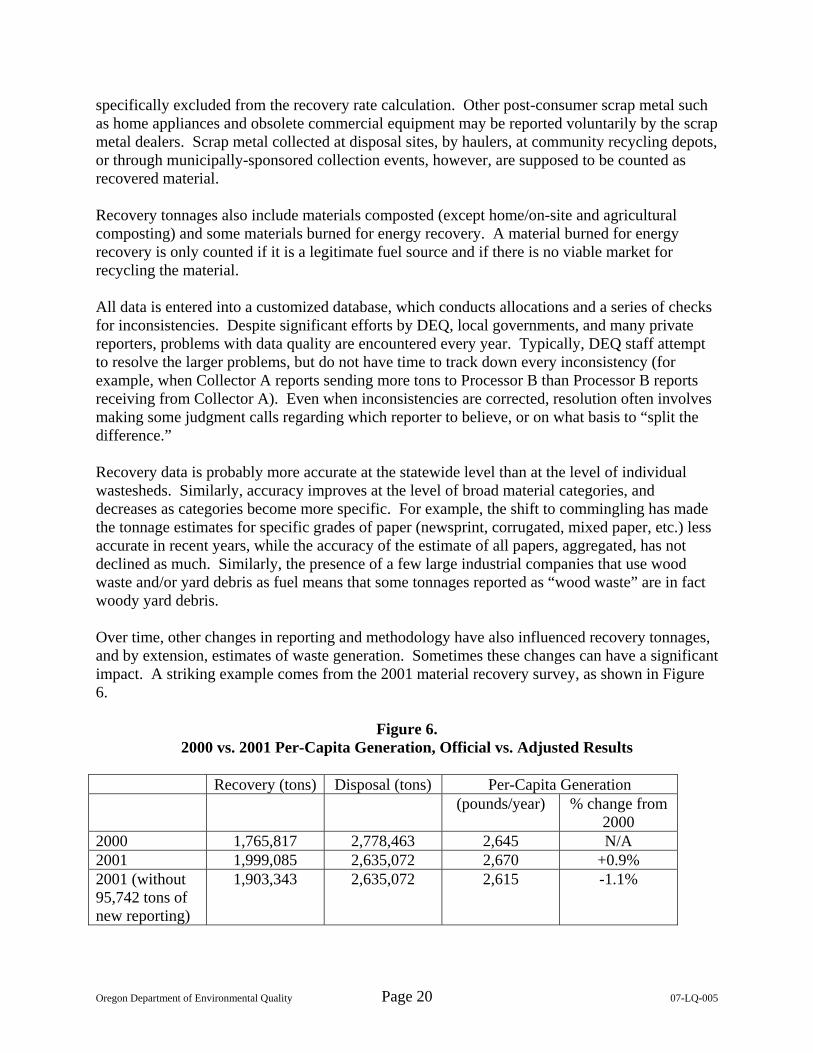
specifically excluded from the recovery rate calculation. Other post-consumer scrap metal such as home appliances and obsolete commercial equipment may be reported voluntarily by the scrap metal dealers. Scrap metal collected at disposal sites, by haulers, at community recycling depots, or through municipally-sponsored collection events, however, are supposed to be counted as recovered material. Recovery tonnages also include materials composted (except home/on-site and agricultural composting) and some materials burned for energy recovery. A material burned for energy recovery is only counted if it is a legitimate fuel source and if there is no viable market for recycling the material. All data is entered into a customized database, which conducts allocations and a series of checks for inconsistencies. Despite significant efforts by DEQ, local governments, and many private reporters, problems with data quality are encountered every year. Typically, DEQ staff attempt to resolve the larger problems, but do not have time to track down every inconsistency (for example, when Collector A reports sending more tons to Processor B than Processor B reports receiving from Collector A). Even when inconsistencies are corrected, resolution often involves making some judgment calls regarding which reporter to believe, or on what basis to “split the difference.” Recovery data is probably more accurate at the statewide level than at the level of individual wastesheds. Similarly, accuracy improves at the level of broad material categories, and decreases as categories become more specific. For example, the shift to commingling has made the tonnage estimates for specific grades of paper (newsprint, corrugated, mixed paper, etc.) less accurate in recent years, while the accuracy of the estimate of all papers, aggregated, has not declined as much. Similarly, the presence of a few large industrial companies that use wood waste and/or yard debris as fuel means that some tonnages reported as “wood waste” are in fact woody yard debris. Over time, other changes in reporting and methodology have also influenced recovery tonnages, and by extension, estimates of waste generation. Sometimes these changes can have a significant impact. A striking example comes from the 2001 material recovery survey, as shown in Figure 6.
Figure 6. 2000 vs. 2001 Per-Capita Generation, Official vs. Adjusted Results
Recovery (tons) Disposal (tons) Per-Capita Generation (pounds/year) % change from
2000 2000 1,765,817 2,778,463 2,645 N/A 2001 1,999,085 2,635,072 2,670 +0.9% 2001 (without 95,742 tons of new reporting)
1,903,343 2,635,072 2,615 -1.1%

Oregon Department of Environmental Quality Page 21 07-LQ-005
DEQ official (revised) statistics show that recovery in 2001 increased 223,000 tons from 2000, while disposal was down only 143,000 tons. The difference was attributed to an increase in waste generation of just over 90,000 tons. On a per-capita basis, waste generation appeared to be up 0.9%. However, a more careful analysis of the 2001 recovery tonnage found that almost 96,000 tons of “new” recovery was, in fact, not truly new recovery but rather new to the reporting system. Most was attributed to first-time voluntary reporting by one of the area’s large scrap metal dealers. The identification by DEQ of two lead acid battery recyclers that had never before been surveyed also added to the total. Staff’s decision to also include certain inert materials (such as old toilets crushed and used as road base) for the first time contributed roughly 8,000 of the 96,000 tons. The introduction of all of this new data in a single year caused the results of the survey to be skewed. Had the 96,000 tons not been included in 2001 numbers, then recovery from 2000 to 2001 would have grown by only 127,000 tons – much more closely matching the decrease in disposal of 143,000 tons. In this scenario, per-capita generation would have been reported as decreasing by 1.1% (because population grew), as opposed to increasing by 0.9%. Similarly, a reported 44% increase in 2004 of “counting” scrap metal recycling over 2003 (an increase of 114,000 tons) strains belief, as does another increase of 27% (102,000 tons) in 2005. This increase in scrap metal recovery is likely not correlated to an increase in use, but rather inconsistencies in reporting/counting and/or a liquidation of stockpiles resulting from higher metal prices. 3.2 Estimates and Trends of Material-Specific Waste Generation - Statewide Waste generation is defined as the sum of disposal plus recovery. Figures 1 and 2 show total “counting” waste generation in Oregon for the years 1993 – 2005. Missing from these figures is any evaluation of material-specific trends. By combining waste disposal tonnages with waste composition data, estimates can be developed of the quantity of specific materials and products in the disposed waste stream. For certain categories (more so at the broad commodity level), comparable data is available from the material recovery survey, although in other instances, differences in definitions and data availability make it difficult to compare disposal and recovery data. Figure 7 illustrates material-specific waste generation, expressed on the basis of pounds per Oregonian per year, for the years 1993 and 2002.14 For each year, three estimates are provided:
• A “low estimate,” which corresponds to the lower bound of the 90% confidence interval for statewide waste composition data, added to the point estimate of recovery tonnage minus 5% (to account for the likelihood of estimation error).15
14 These are the earliest and latest years for which both material recovery survey data and waste composition data are available. 15 The waste composition study is a sampling study and therefore subject to methods of classical statistics including the development of confidence intervals. In contrast, the materials recovery survey is a census (an attempt to count all known materials) and therefore a confidence interval is not readily defined. 5% is used as an “educated guess” in order to represent uncertainty in the results of the material recovery survey.

Material
Oregon low
estimate
Oregon mid
estimate
Oregon high
estimate
Oregon low
estimate
Oregon mid
estimate
Oregon high
estimate low mid-point high low mid-point high
TOTAL PAPER 606 630 655 606 639 675 -0.61% 0.15% 0.87% -34 9 51Total recyclable paper 521 553 585 525 565 608 -0.83% 0.24% 1.23% -40 12 65
Cardboard/Brown bags 213 225 236 242 258 274 0.65% 1.55% 2.38% 14 33 53Newspaper & magazines 151 161 171 151 165 180 -0.95% 0.27% 1.38% -13 4 21
Newspaper 114 120 127 N/A N/A N/AMagazines 37 41 44 N/A N/A N/A
High-grade paper 62 67 73 46 50 54 -4.92% -3.32% -1.90% -25 -18 -11Low-grade recyclable paper combined 95 100 105 86 92 100 -1.93% -0.86% 0.13% -16 -7 1
Nonrecyclable paper combined 74 77 80 68 74 80 -1.50% -0.49% 0.44% -10 -3 3
TOTAL PLASTICS 105 111 118 143 152 162 2.64% 3.54% 4.38% 29 41 52Rigid plastic containers 19 20 21 26 28 29 2.91% 3.74% 4.52% 6 8 10Film plastic N/A N/A N/A 50 55 60
OTHER ORGANICS 854 887 919 1,170 1,222 1,270 3.05% 3.62% 4.17% 275 335 394Yard debris, wood 388 425 463 621 678 735 4.08% 5.31% 6.44% 184 252 321
Yard debris 201 217 234 301 331 362 3.51% 4.79% 5.96% 79 114 149Wood 187 208 229 320 347 373 4.63% 5.83% 6.93% 105 139 172
Food (includes animal waste and grease) 268 282 295 267 283 300 -0.80% 0.06% 0.86% -20 1 23Tires 26 34 42 29 31 32 -4.60% -1.29% 1.32% -12 -4 4Carpet 11 16 22 22 30 39 2.19% 7.07% 10.63% 4 14 24Textiles 29 32 36 24 28 32 -3.95% -1.67% 0.26% -10 -5 1All other organics 97 172
Roofing/Tarpaper N/A - included in "all other organics" above 67
GLASS 95 101 108 83 90 98 -2.52% -1.26% -0.12% -21 -11 -1Total container glass 81 85 90 70 76 81 -2.42% -1.36% -0.37% -17 -10 -3Window+other glass 13 16 19 11 15 20 -6.01% -0.86% 2.76% -7 -1 4
Fluorescent lights & tubes N/A N/A N/A 0 0 1
METAL (including electronics) 136 147 158 241 260 278 5.52% 6.53% 7.47% 91 113 134Metals excl. electronics N/A N/A N/A 227 238 249Electronics (computers, brown goods) N/A N/A N/A 14 21 29Aluminum 13 15 17 N/A N/A N/ATin & aerosol cans 25 27 28 N/A N/A N/AOther scrap metal 95 105 114 N/A N/A N/A
OTHER INORGANICS 113 128 143 183 207 228 3.84% 5.47% 6.92% 52 79 106
"MEDICAL WASTES" 2 4 5 1 2 3 -26.30% -7.35% -0.66% -3 -2 0
OTHER HAZARDOUS MATERIALS 30 33 36 44 48 53 2.91% 4.30% 5.55% 10 15 21
Water & Residue (Detailed) 81 90 99 79 92 108 -2.04% 0.20% 2.10% -15 2 18
Total (numbers may not sum exactly due to rounding) 2,131 2,711 580
Figure 7.Material-Specific Estimates of Oregon 1993 and 2002 Per-Capita Waste Generation and Average Annual Percent Change
1993 Generation (pounds/person) 2002 Generation (pounds/person) 1993 to 2002 Average Annual % Change 1993 to 2002 Change (pounds/person)

Oregon Department of Environmental Quality Page 23 07-LQ-005
• A “mid estimate,” which corresponds to the point estimate of waste composition data, added to the point estimate of recovery tonnage (assuming no error in either study).
• A “high estimate,” which corresponds to the higher bound of the 90% confidence interval for statewide waste composition data, added to the point estimate of recovery tonnage plus 5% (to account for the likelihood of estimation error).
Focusing on the 2002 “mid” estimate, for purposes of illustration:
• The category of “other organics” contributes 45% of the total generation. This includes fairly comparable quantities of wood (13% of total), yard debris (12% of total), and food waste (10% of total), followed by much smaller quantities of roofing, tires, carpet, and textiles (1 – 3% each).
• Paper is the next largest category, contributing 24% to the total generation of waste. Corrugated and kraft bags contribute 10% to the total, followed by newspapers and magazines (primarily newspapers) at 6%. High-grade office paper contributes 2% to the generation of waste.
• Metal is the third largest category, at 10% of all waste generation. Electronics and brown goods contribute 1% to total generation of waste.
• Other categories include “other inorganics” (gypsum, rock, dirt, rubble, ceramics) at 8%, plastics at 6%, glass at 3%, and “hazardous materials” at 2%. The majority of hazardous materials, by weight, are lead acid batteries and motor oil, and are recycled or recovered.
Comparing DEQ estimates for 1993 to 2002, three possible annual rates of change are calculated:
• ”Mid-point,” which compares the mid-point estimate for 2002 against the mid-point estimate for 1993.
• “Low,” which compares the low estimate of change against the mid-point estimate for 1993.
• “High,” which compares the high estimate of change against the mid-point estimate for 1993.16
Using these three different estimates of annual change, materials can be classified into three groups: increasing per-capita generation, decreasing per-capita generation, and change in per-capita generation stable or trends unclear. Increasing Per-Capita Generation. Materials where Figure 7 suggests that per-capita generation almost certainly increased between 1993 and 2002 include:
• Total plastics (per-capita generation up 2.6 – 4.4% per year), including the relatively small but visible category of “rigid plastic containers.”
• Yard debris (per-capita generation up 3.5 – 6.0% per year). • Wood waste (per-capita generation up 4.6 – 6.9% per year). • Carpet (per-capita generation up 2.2 – 10.6% per year).
16 The “low” and “high” change are estimated by treating the 1993 and 2002 low and high estimates as if they were standard confidence intervals (+C), then taking the average between low and high estimates for C1993 and C2002, then calculating the change from 1993 to 2002 as equaling mean2002 - mean1993 + √([C1993]2 + [C2002]2).

Oregon Department of Environmental Quality Page 24 07-LQ-005
• Metal (per-capita generation up 5.5 – 7.5% per year; although as noted above, these numbers are partly attributed to reporting changes and are generally suspect as a proxy for consumption).
• Other inorganics, including non-wood construction/demolition wastes (per-capita generation up 3.8 – 6.9% per year).
Decreasing Per-Capita Generation. Materials where per-capita generation almost certainly decreased between 1993 and 2002 include:
• High-grade office paper (per-capita generation down 1.9 to 4.9% per year, although some of this apparent decline is likely attributable to the shift toward commingling and the tendency for some office paper to be sent to newsprint mills and counted as newsprint).
• Container glass (per-capita generation down 0.4 to 2.4% per year). Trends Unclear. From DEQ’s data, trends in per-capita generation are unclear for many materials, most notably the large categories of “total paper” and food waste. In both of these categories, per-capita generation appears to be flat or close to it. While the statistics suggest per-capita growth in the category of “newspapers and magazines,” this might be attributed to commingling and the tendency to send other grades of paper (such as mixed waste paper) to newsprint mills and report it as “newsprint.” 3.3 Estimates and Trends of Overall Waste Generation - Wastesheds The following discussion is for all wastes generated, aggregated together. Statistically meaningful estimates of waste generation for individual materials in individual wastesheds are not available except for a few large wastesheds that have conducted their own waste composition studies. Figure 8 illustrates that the rate of per-capita generation is widely variable across the state. Using an average of per-capita generations from 2003, 2004, and 2005, Figure 8 shows that the Metro wasteshed is the most prolific generator of waste, with per-capita generation 113% of the statewide average. Other wastesheds with above-average per-capita generation include Deschutes (104% of statewide average), Yamhill (101%), Marion (100%), Lane (100%), and Umatilla (100%).

Oregon Department of Environmental Quality Page 25 07-LQ-005
Figure 8. Wasteshed Variance from Statewide Average Per-Capita Generation, 2003 - 2005
Other patterns include the following:
• Per-capita generation is higher in most counties west of the Cascades than those east of the Cascades.
• Higher population counties tend to have higher per-capita waste generation. This is true both west of the Cascades (Metro, Marion, Lane, Jackson), as well as east of the Cascades (Deschutes, Klamath, Umatilla).
• A few counties stand out in stark contrast to their neighbors. For example, Gilliam County’s per-capita generation is relatively high, perhaps because its residents enjoy free landfilling. Umatilla County’s per-capita generation is also unusually high for Eastern Oregon. West of the Cascades, Coos and Columbia counties generate waste at rates well below their neighbors.
Why do some communities in Oregon have higher or lower rates of waste generation? Possible explanations include the following:
• Degree of urbanization. Counties with a higher percentage of residents living in urban areas are expected to have higher per-capita “counting” waste generation for at least two reasons: • Urban areas have more burning restrictions, and lower social tolerance for burning, as
well as fewer opportunities to stockpile wastes. (For example, it has been reported by a former elected official that “many” Sherman County residents don’t use the County’s solid waste system because they operate their own personal dumps.)
<50% of Statewide Average
50%-70% of Statewide Average
70%-90% of Statewide Average
90%-110% of Statewide Average
>110% of Statewide Average
SHER
MAN
CLATSOPCOLUMBIA
TILL
AMO
OK
MULTNOMAH
HOO
D RIV
WASCO
GILLIAM
MORROW
UMATILLAWALLOWA
UNION
JEFFERSONWHEELER
LINC
OLN
BENT
ON
YAMHILL CLACKAMAS
DESCHUTES
CROOK
HARNEYMALHEURLAKE
KLAMATHJACKSONJOSEPHINE
COOS
GRANT
BAKER
POLK MARION
LINN
DOUGLAS
LANE
CURRY
WASH
Note: Percentages are of a non-weighted average for the years 2003 – 2005.
SHER
MAN
CLATSOPCOLUMBIA
TILL
AMO
OK
MULTNOMAH
HOO
D RIV
WASCO
GILLIAM
MORROW
UMATILLAWALLOWA
UNION
JEFFERSONWHEELER
LINC
OLN
BENT
ON
YAMHILL CLACKAMAS
DESCHUTES
CROOK
HARNEYMALHEURLAKE
KLAMATHJACKSONJOSEPHINE
COOS
GRANT
BAKER
POLK MARION
LINN
DOUGLAS
LANE
CURRY
WASH
SHER
MAN
CLATSOPCOLUMBIA
TILL
AMO
OK
MULTNOMAH
HOO
D RIV
WASCO
GILLIAM
MORROW
UMATILLAWALLOWA
UNION
JEFFERSONWHEELER
LINC
OLN
BENT
ON
YAMHILL CLACKAMAS
DESCHUTES
CROOK
HARNEYMALHEURLAKE
KLAMATHJACKSONJOSEPHINE
COOS
GRANT
BAKER
POLK MARION
LINN
DOUGLAS
LANE
CURRY
WASH
Note: Percentages are of a non-weighted average for the years 2003 – 2005.

Oregon Department of Environmental Quality Page 26 07-LQ-005
• More commercial activity. A significant portion of wastes are generated in commercial activities as well as the construction and demolition of commercial buildings. Communities with relatively more commercial activity will generate more waste, particularly if residents from counties with less commercial activity come to these communities for business and services. For example, Deschutes County probably generates more waste per-capita from health care facilities than Jefferson or Crook Counties, since many people from Prineville and Madras go to Bend for medical procedures and hospitalizations.
• Restrictions on outdoor burning. Outside of the Willamette Valley, DEQ restricts open burning within three miles of cities with populations of 4,000 or more. Inside the Willamette Valley, DEQ restricts open burning within three miles of cities with populations of 1,000 or more, and within six miles of cities within 45,000 or more. In addition, restrictions on open burning may otherwise be adopted and enforced by various cities, counties, and fire districts.17
• Incomes and wealth. Consumption of goods contributes to waste generation. Areas with higher incomes (which also tend to be urban) are expected to produce more waste because their residents’ incomes are higher.
• Rainfall and vegetation zones. An estimated 12% of “counting” waste generation in 2002 was yard debris. Actual generation is higher because of the significant quantities of yard debris (relative to other materials) that are home composted or burned, and thus go uncounted. Some areas of the state produce more vegetative waste per acre of developed land than others, as a result of differing rainfall, soil, and vegetation types.
• Provision of recycling/composting services. Where recycling and composting opportunities are provided, residents may be less likely to burn paper and yard debris, or compost on-site.
• Cost of waste management. Communities with higher waste management costs are expected to have lower waste generation, all other things being equal. It is important to note that “costs” include not only tipping fees but the costs to the household or businesses for waste removal. In remote communities served by small or distant landfills, tipping fees may be high, as are the costs (including time) of self-hauling wastes.
• Reliance on burning for home heat. Where residents are more likely to heat their homes with firewood, wastes such as wood scraps, paper, and potentially other wastes are also more likely to be burned indoors. These wastes do not count toward generation.
• Tourism. Tourism activity likely adds more to waste generation than it does to in-county population. In this event, counties with significant tourism activities may have higher per-capita waste generation.
• Construction activity. Rapidly-growing areas, or other areas with significant construction, remodeling and demolition activity, may have higher per-capita waste generation.
17 May 16 2000 DEQ memorandum on “Rulemaking Proposal and Rulemaking Statements – Rules for Open Burning, OAR 340 Division 264; State Implementation Plan, OAR 340-200-0040”.

Oregon Department of Environmental Quality Page 27 07-LQ-005
3.3.1 Analysis of Demographic Variables To try and better understand the relationship between some of these variables and per-capita waste generation for different wastesheds, DEQ undertook a multiple regression analysis. “Multiple regression” is a statistical technique that allows for the investigation of the causal effect of multiple “independent variables” (such as income, urbanization, wood stove use, etc.) on a separate “dependent variable” (in this case, per-capita waste generation).18 For its “dependent variable,” DEQ used the annual per-capita generation for each wasteshed, averaged across the period 1993 and 2004.19,20 This multi-year average was used instead of a single year’s estimate in order to “iron out” any single-year discrepancies. For independent variables, DEQ used the following for each wasteshed:21
• Population density (persons per square mile of land). A variety of time periods were tested, including 2004 only, and averages of 1993 – 2004, 1993 – 1996, 1997 – 2000, and 2001 – 2004.
• Degree of urbanization (year 2000 only), defined as the percentage of residents living in areas classified by the U.S. Census Bureau as either “urban areas” or “urban clusters.”
• Per-capita income, expressed in real (inflation-adjusted) terms (year 2000 dollars). A variety of time periods were used, including 2003 only, and averages of 1993 – 2003, 1993 – 1996, 1997 – 2000, and 2001 – 2003.
• Percentage of households reporting the use of wood heat as their primary heating source, 1990 and 2000.
DEQ combined these independent variables in various permutations and found no meaningful correlation between per-capita waste generation and either 1990 use of wood heat, or population density (any time period) when combined with other variables. In contrast:
• Per-capita real (inflation-adjusted) income (for various time periods) was found to have a statistically significant correlation with per-capita generation in most combinations with other variables. Not surprisingly, the modeling shows that holding other variables constant, communities with higher per-capita income have higher per-capita generation.
• 2000 rates of wood as a primary heat source had a statistically significant correlation with per-capita generation in all cases. The modeling shows that counties with higher reliance on wood for heat have lower per-capita waste generation.
• Degree of urbanization was found to have a statistically significant correlation with per-capita generation only when wood heat was excluded from the analysis, suggesting that urban residents are less likely to heat with wood (confirmed in Section 7.7 below) and also that this variable contributes little if any to the analysis when wood heating is included.
18 For additional information on regression analysis, see http://www.law.uchicago.edu/Lawecon/WkngPprs_01-25/20.Sykes.Regression.pdf. 19 For the sake of this analysis, the Milton-Freewater and Umatilla wastesheds were combined. 20 The regression analysis described here was conducted prior to completion of the 2005 material recovery survey. Following completion of the 2005 survey, DEQ revised downwards recovery tonnages for the years 2002, 2003, and 2004. While other results described in this report reflect these revisions (unless specifically noted), the discussion of regression analysis is based on the earlier (pre-revision) data. 21 As U.S. Census data was used for all of these variables, data is actually for counties, not wastesheds, except for the Metro wasteshed, which combines data from Multnomah, Washington, and Clackamas counties.

Oregon Department of Environmental Quality Page 28 07-LQ-005
The analysis with the highest adjusted R2 (.546) was the combination of 1993 – 2003 average per-capita real income and 2000 wood heat. Put simply, the analysis shows that 54.6% of the variance between wastesheds in 1993 – 2004 average per-capita generation can be explained by these two variables (1993 – 2003 average per-capita real income and 2000 wood heat). The remaining 45.4% of variance in per-capita generation is explained by other variables (not studied). 3.3.2 Rates of Change Comparing average per-capita waste generation for the periods 1993 – 1995 vs. 2002 – 2004, Oregon as a whole saw per-capita generation increase by 29%. Four counties actually saw a decrease in per-capita generation during this period; all other counties observed increases. Figure 9 shows the five counties/regions with the largest per-capita increases and the five counties/regions with the smallest increases (or in four cases, actual decreases). There are no obvious patterns within or between either of these two groups.
Figure 9. Wastesheds with Highest and Lowest Percent Change in Per-Capita Waste Generation,
1993 – 1995 (average) vs. 2002 – 2004 (average)
Largest Increase Smallest Increase (or Decrease) Crook (+95%) Wheeler (-24%) Polk (+77%) Lake (-18%) Curry (+74%) Douglas (-1%)
Josephine (+67%) Wallowa (no change) Sherman (+65%) Deschutes (+2%)
4. Review of EPA Data 4.1 Overview of Data Sources and Methodologies EPA and DEQ use a similar definition of waste generation, but different definitions of “municipal solid waste.” EPA defines waste generation as “the amount of materials and products that enter the waste stream before recycling, composting, landfilling, or combustion takes place.” However, the boundaries of what is included as “municipal solid waste” are not the same, and EPA’s methodology is radically different from DEQ’s. EPA defines MSW to include “wastes such as durable goods, nondurable goods, containers and packaging, food scraps, yard trimmings, and miscellaneous inorganic wastes from residential, commercial, institutional and industrial sources. MSW does not include wastes from other sources such as construction and demolition wastes, automobile bodies, municipal sludges, combustion ash, and industrial process wastes that might be disposed in municipal waste landfills or incinerators.”22
22 Administrative and packaging waste from industrial sources are included; industrial process wastes (sludges, slags, etc.) are not included.
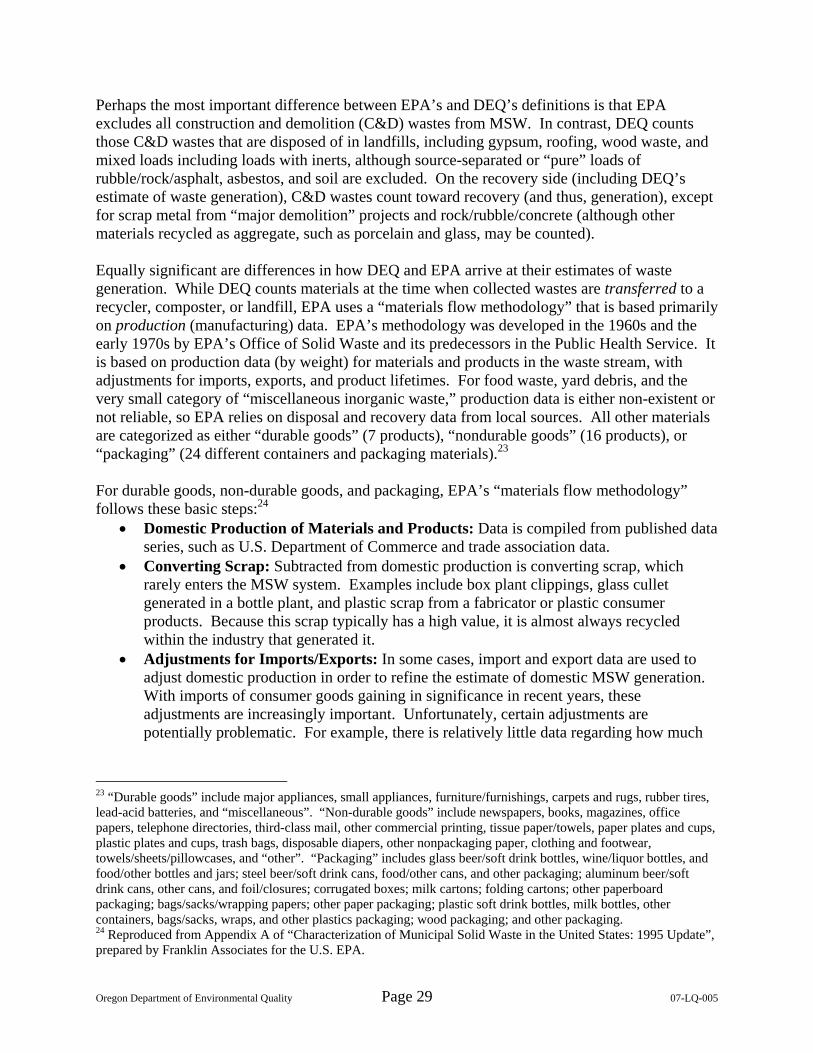
Oregon Department of Environmental Quality Page 29 07-LQ-005
Perhaps the most important difference between EPA’s and DEQ’s definitions is that EPA excludes all construction and demolition (C&D) wastes from MSW. In contrast, DEQ counts those C&D wastes that are disposed of in landfills, including gypsum, roofing, wood waste, and mixed loads including loads with inerts, although source-separated or “pure” loads of rubble/rock/asphalt, asbestos, and soil are excluded. On the recovery side (including DEQ’s estimate of waste generation), C&D wastes count toward recovery (and thus, generation), except for scrap metal from “major demolition” projects and rock/rubble/concrete (although other materials recycled as aggregate, such as porcelain and glass, may be counted). Equally significant are differences in how DEQ and EPA arrive at their estimates of waste generation. While DEQ counts materials at the time when collected wastes are transferred to a recycler, composter, or landfill, EPA uses a “materials flow methodology” that is based primarily on production (manufacturing) data. EPA’s methodology was developed in the 1960s and the early 1970s by EPA’s Office of Solid Waste and its predecessors in the Public Health Service. It is based on production data (by weight) for materials and products in the waste stream, with adjustments for imports, exports, and product lifetimes. For food waste, yard debris, and the very small category of “miscellaneous inorganic waste,” production data is either non-existent or not reliable, so EPA relies on disposal and recovery data from local sources. All other materials are categorized as either “durable goods” (7 products), “nondurable goods” (16 products), or “packaging” (24 different containers and packaging materials).23 For durable goods, non-durable goods, and packaging, EPA’s “materials flow methodology” follows these basic steps:24
• Domestic Production of Materials and Products: Data is compiled from published data series, such as U.S. Department of Commerce and trade association data.
• Converting Scrap: Subtracted from domestic production is converting scrap, which rarely enters the MSW system. Examples include box plant clippings, glass cullet generated in a bottle plant, and plastic scrap from a fabricator or plastic consumer products. Because this scrap typically has a high value, it is almost always recycled within the industry that generated it.
• Adjustments for Imports/Exports: In some cases, import and export data are used to adjust domestic production in order to refine the estimate of domestic MSW generation. With imports of consumer goods gaining in significance in recent years, these adjustments are increasingly important. Unfortunately, certain adjustments are potentially problematic. For example, there is relatively little data regarding how much
23 “Durable goods” include major appliances, small appliances, furniture/furnishings, carpets and rugs, rubber tires, lead-acid batteries, and “miscellaneous”. “Non-durable goods” include newspapers, books, magazines, office papers, telephone directories, third-class mail, other commercial printing, tissue paper/towels, paper plates and cups, plastic plates and cups, trash bags, disposable diapers, other nonpackaging paper, clothing and footwear, towels/sheets/pillowcases, and “other”. “Packaging” includes glass beer/soft drink bottles, wine/liquor bottles, and food/other bottles and jars; steel beer/soft drink cans, food/other cans, and other packaging; aluminum beer/soft drink cans, other cans, and foil/closures; corrugated boxes; milk cartons; folding cartons; other paperboard packaging; bags/sacks/wrapping papers; other paper packaging; plastic soft drink bottles, milk bottles, other containers, bags/sacks, wraps, and other plastics packaging; wood packaging; and other packaging. 24 Reproduced from Appendix A of “Characterization of Municipal Solid Waste in the United States: 1995 Update”, prepared by Franklin Associates for the U.S. EPA.

Oregon Department of Environmental Quality Page 30 07-LQ-005
packaging enters the US with imported goods. This uncertainty may be causing EPA’s estimates to become less reliable over time.
• Diversion from MSW: Adjustments are made to account for diversions away from MSW. For example, some paperboard is used in building materials (which EPA doesn’t count as MSW), while toilet tissue is disposed in sewer systems rather than becoming MSW.
• Adjustments for Product Lifetimes: Finally, for products that have relatively long lifetimes (such as furniture and appliances), data on average lifetimes are used to adjust the data series, to reflect a time delay between production and waste generation.
4.2 Estimates and Trends of Total MSW Generation EPA’s published data set currently runs from 1960 to 2003. This section provides an overview of per-capita waste generation and then focuses in on the same period evaluated for DEQ’s data above, 1993 – 2002.25 Figure 10 illustrates per-capita waste generation, materials recovery, composting, and discards of MSW for the period 1960 – 2003.
Figure 10. EPA Estimates of Per-Capita Waste Generation, 1960 – 2003
(pounds per person per day) 1960 1970 1980 1990 1995 2000 2003 Generation 2.68 3.25 3.66 4.50 4.45 4.56 4.45 Recovery for recycling 0.17 0.22 0.35 0.64 0.96 1.02 1.04 Recovery for composting Neg. Neg. Neg. 0.09 0.20 0.32 0.32 Total materials recovery 0.17 0.22 0.35 0.73 1.16 1.34 1.36 Discards after recovery 2.51 3.03 3.31 3.77 3.29 3.22 3.09 According to EPA, per-capita generation rose dramatically between 1960 and 1990, but then was essentially flat or even declined a little between 1990 and 2003. EPA also estimates that per-capita disposal declined significantly after 1990, from 3.77 to 3.09 pounds per person per day. 4.3 Estimates and Trends of Broad Categories of Waste Generation Figure 11 shows the change in per-capita generation by broad category of waste type, according to EPA statistics. Manufactured items (goods and packaging) all saw significant growth between 1960 and 1990, followed by much lower growth (or even slight declines) thereafter. According to EPA, per-capita generation of packaging and containers peaked in 1995, and per-capita generation of non-durable goods peaked in 2000. Generation of durable goods has continued to grow at a slow rate. According to EPA, the category of “other,” which is primarily yard and food waste, saw a dramatic drop in the early 1990s due to the wide scale adoption of home composting and grasscycling.
25 1993 generation is taken as the mid-point of EPA’s biennial estimates for 1992 and 1994.

Oregon Department of Environmental Quality Page 31 07-LQ-005
Figure 11. Per-Capita Generation by Waste Type, 1960 - 200326
0
100
200
300
400
500
600
1960 1970 1980 1990 1995 2000 2003
Poun
ds p
er P
erso
n pe
r Yea
r
Durable GoodsNondurable GoodsContainers and PackagingOther (Food, Yard Trimmings, Inorganics)
Comparing waste generation in 1960 and 2003 also yields some interesting findings. The waste stream in 1960 was 38% organic “other” and 62% manufactured materials (packaging and goods). By 2003, “other” organics were only 25% of total waste generated, while manufactured materials had grown to 75% of the total. The increasing significance of products in the waste stream is an ongoing trend that can be traced back to 1900 or even earlier.27 On an average annualized basis, between 1960 and 2003:
• Per-capita waste generation of durable goods rose 2.1% per year. • Per-capita waste generation of non-durable goods rose 1.9% per year. • Per-capita waste generation of containers and packaging rose 1.2% per year. • Per-capita waste generation of “other” (yard/food) rose a mere 0.2% per year.
26 Please note that the x-axis (time series) of Figure 11 is not linear. 27 For more discussion on this point, see “The Next Frontier for MSW” by Helen Spiegelman and Bill Sheehan in the February, 2006 BioCycle.

Oregon Department of Environmental Quality Page 32 07-LQ-005
However, for the period 1992 to 2003 (corresponding to the historic period covered by DEQ’s data), EPA estimates that:
• Per-capita waste generation of durable goods rose 1.0% per year. • Per-capita waste generation of non-durable goods rose only 0.1% per year. • Per-capita waste generation of containers and packaging fell by 0.3% per year. • Per-capita waste generation of “other” (yard/food) fell by 1.3% per year.
Evaluation of broad material categories is provided in Section 5.2. Data for individual product and material categories (listed in footnote 23) are available from EPA’s report or from DEQ if desired, but are not examined here in the interest of time. 4.4 Point Estimate of C&D Debris Generation from Buildings While EPA excludes construction and demolition (C&D) debris from its periodic estimates of MSW generation, it has – on one occasion – published an estimate of the generation of C&D debris.28 EPA’s methodology was to combine national Census Bureau data on construction industry activities (from 1996) with point source waste assessment data (waste sampling and weighing) at a variety of construction and demolition sites to estimate the amount of building-related C&D debris produced nationally. The report excludes C&D wastes from infrastructure (roads, bridges, etc.) construction/demolition as well as land-clearing wastes. EPA estimated that for 1996, generation of building-related C&D debris was 136 million tons, or 2.75 pounds per person per day. Added to EPA’s estimate of MSW generation of 3.28 pounds per person per day (from Figure 10, straight-line extrapolation between 1995 and 2000), this brings the estimate of total waste generation (MSW + C&D) to 6.03 pounds per person per day. This is quite close to DEQ’s estimate of 6.46 pounds per person per day (although EPA’s C&D estimate likely includes some materials, such as pure loads of rubble/brick/asphalt/concrete/rock and source-separated scrap metal, which would not be included in DEQ’s estimates). EPA’s methodology results in estimates of waste generation for six different combinations of sources (residential vs. nonresidential) and activity (construction, renovation, and demolition), as shown in Figure 12.
28 “Characterization of Building-Related Construction and Demolition Debris in the United States”, prepared by Franklin Associates for the U.S. EPA, June 1998.
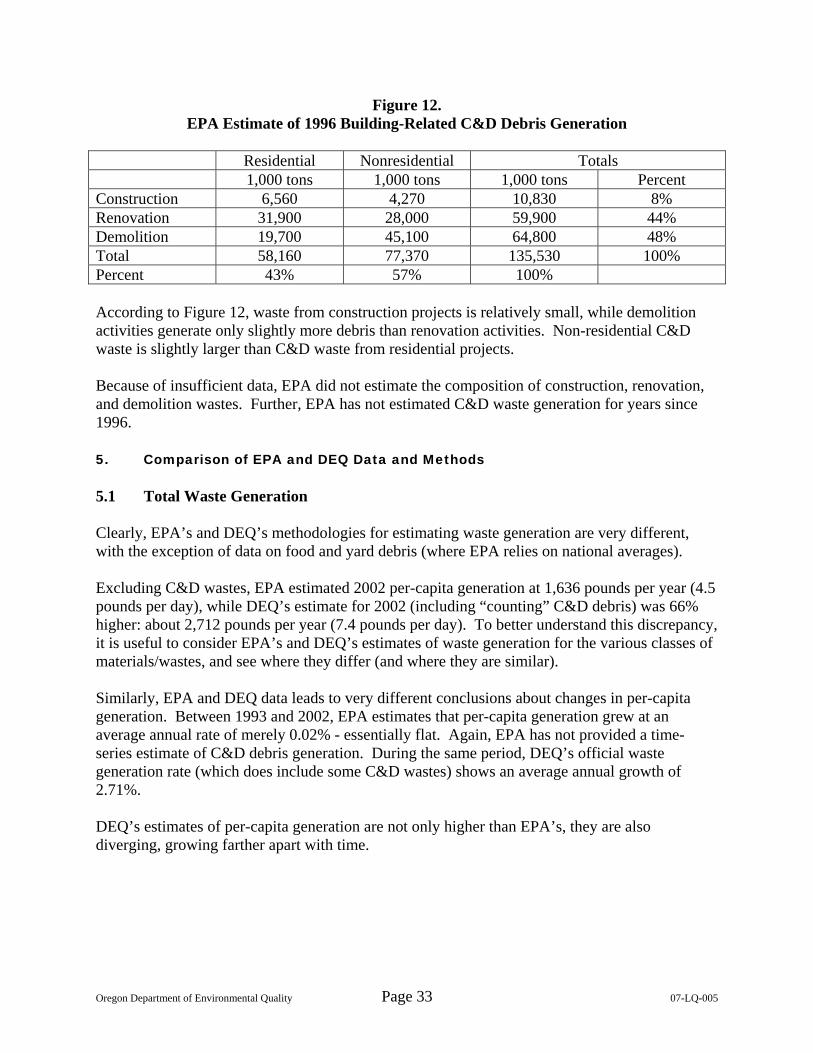
Oregon Department of Environmental Quality Page 33 07-LQ-005
Figure 12. EPA Estimate of 1996 Building-Related C&D Debris Generation
Residential Nonresidential Totals 1,000 tons 1,000 tons 1,000 tons Percent Construction 6,560 4,270 10,830 8% Renovation 31,900 28,000 59,900 44% Demolition 19,700 45,100 64,800 48% Total 58,160 77,370 135,530 100% Percent 43% 57% 100% According to Figure 12, waste from construction projects is relatively small, while demolition activities generate only slightly more debris than renovation activities. Non-residential C&D waste is slightly larger than C&D waste from residential projects. Because of insufficient data, EPA did not estimate the composition of construction, renovation, and demolition wastes. Further, EPA has not estimated C&D waste generation for years since 1996. 5. Comparison of EPA and DEQ Data and Methods 5.1 Total Waste Generation Clearly, EPA’s and DEQ’s methodologies for estimating waste generation are very different, with the exception of data on food and yard debris (where EPA relies on national averages). Excluding C&D wastes, EPA estimated 2002 per-capita generation at 1,636 pounds per year (4.5 pounds per day), while DEQ’s estimate for 2002 (including “counting” C&D debris) was 66% higher: about 2,712 pounds per year (7.4 pounds per day). To better understand this discrepancy, it is useful to consider EPA’s and DEQ’s estimates of waste generation for the various classes of materials/wastes, and see where they differ (and where they are similar). Similarly, EPA and DEQ data leads to very different conclusions about changes in per-capita generation. Between 1993 and 2002, EPA estimates that per-capita generation grew at an average annual rate of merely 0.02% - essentially flat. Again, EPA has not provided a time-series estimate of C&D debris generation. During the same period, DEQ’s official waste generation rate (which does include some C&D wastes) shows an average annual growth of 2.71%. DEQ’s estimates of per-capita generation are not only higher than EPA’s, they are also diverging, growing farther apart with time.

Oregon Department of Environmental Quality Page 34 07-LQ-005
5.2 Individual Material Categories To better understand the differences between DEQ’s and EPA’s estimates, all materials in both MSW generation studies are discussed below according to the following broad groupings:
• Paper; • Plastics; • Other organics (yard debris, wood, food, tires, carpet, textiles, etc.); • Glass; • Metal; • Other inorganics (brick, rubble, gypsum, etc.); • Medical wastes/other hazardous materials; and • Others/not classified.
Results are summarized in Figure 13, which compares Oregon and EPA estimates of per-capita generation as well as rate of change between 1993 and 2002. For the sake of simplicity, and because EPA did not characterize (by waste type) C&D wastes, EPA’s single point estimate (1996) of C&D debris generation is excluded from this discussion. 5.2.1 Paper and Paperboard As shown in Figure 13, Oregon’s estimate of per-capita generation of paper waste is slightly higher than EPA’s: 606 – 675 pounds per person (DEQ) as opposed to 585 pounds per person (EPA) in 2002. While DEQ’s waste composition study provides fairly detailed and accurate information by grade and application of paper, detailed, grade-specific results from the material recovery survey have suffered with the spread of commingling. In contrast, EPA’s data, which is based largely on production and sales reports, is quite specific, dividing paper and paperboard products in MSW into 17 different subcategories.29 Among EPA’s 17 paper subcategories, three comprise just over half of total generation of waste paper (in 2003): corrugated boxes comprised 36% of all paper in MSW generation, followed by newspapers (newsprint and groundwood inserts) at 15%. DEQ’s estimates for these two major subcategories are, consistent with the category total, higher than EPA’s:
• For DEQ’s subcategory of cardboard + brown bags (corresponding closely to EPA’s two categories of “corrugated boxes” and “bags and sacks”), DEQ estimates 2002 generation at 242 – 274 pounds/person-year, while EPA estimates 219 pounds/person-year.
• For DEQ’s subcategory of newspaper + magazines (corresponding to EPA’s categories of “newsprint,” “groundwood inserts,” and “magazines”), DEQ estimates 2002 generation at 151 – 180 pounds/person-year, while EPA estimates 104 pounds/person year.
29 EPA reports on 11 types of paper nondurable goods and 6 types of paper containers/packaging. Nondurable paper goods include: newsprint, groundwood newspaper inserts, books, magazines, office papers, telephone directories, third class/Standard (A) mail, other commercial printing, tissue paper and towels, paper plates and cups, and other nonpackaging paper (including tissue in disposable diapers, paper in games and novelties, cards, etc.). Paper containers/packaging includes: corrugated boxes, milk cartons, folding cartons (such as cereal and cracker boxes), other paperboard packaging, bags and sacks, and other paper packaging.

Material
Oregon low
estimate
Oregon mid
estimate
Oregon high
estimate EPA estimate Oregon lowOregon mid-
point Oregon high EPA
TOTAL PAPER 606 639 675 585 -0.61% 0.15% 0.87% -0.30%Total recyclable paper 525 565 608 -0.83% 0.24% 1.23%
Cardboard/Brown bags 242 258 274 219 0.65% 1.55% 2.38% -0.23%Newspaper & magazines 151 165 180 104 -0.95% 0.27% 1.38% -1.46%
Newspaper N/A N/A N/A 91 -1.25%Magazines N/A N/A N/A 14 -2.71%
High-grade paper 46 50 54 50 -4.92% -3.32% -1.90% -0.45%Low-grade recyclable paper combined 86 92 100 -1.93% -0.86% 0.13%
Nonrecyclable paper combined 68 74 80 -1.50% -0.49% 0.44%
TOTAL PLASTICS 143 152 162 183 2.64% 3.54% 4.38% 2.64%Rigid plastic containers 26 28 29 2.91% 3.74% 4.52%Film plastic 50 55 60
OTHER ORGANICS 1,170 1,222 1,270 597 3.05% 3.62% 4.17%Yard debris, wood 621 678 735 4.08% 5.31% 6.44%
Yard debris 301 331 362 197 3.51% 4.79% 5.96% -2.90%Wood 320 347 373 93 4.63% 5.83% 6.93% 0.29%
Food (includes animal waste and grease) 267 283 300 189 -0.80% 0.06% 0.86% 1.65%Tires (DEQ) 29 31 32 -4.60% -1.29% 1.32%Rubber/leather (EPA) 46 0.01%Carpet 22 30 39 -0.10% 7.07% 15.62%Textiles 24 28 32 71 -3.95% -1.67% 0.26% 3.26%All other organics (DEQ) 172
Roofing / Tarpaper 67
GLASS 83 90 98 89 -2.52% -1.26% -0.12% -1.48%Total container glass 70 76 81 77 -2.42% -1.36% -0.37% -1.88%Window+other glass 11 15 20 12 -6.01% -0.86% 2.76% 1.61%
Fluorescent lights & tubes 0 0 1
METAL (including electronics) 241 260 278 128 5.52% 6.53% 7.47% 0.33%Metals excl. electronics 227 238 249Electronics (computers, brown goods) 14 21 29Aluminum N/A N/A N/A 22 -0.26%Tin & aerosol cans N/A N/A N/AOther scrap metal N/A N/A N/A
OTHER INORGANICS 183 207 228 25 3.84% 5.47% 6.92%Other inorganics except gypsum 0 130 0 ( Rock / Concrete) / Brick 0 40 0 Gypsum wallboard 0 77 0 Other inorganics 0 37 0 25
"MEDICAL WASTES" 1 2 3 -26.30% -7.35% -0.66%
OTHER HAZARDOUS MATERIALS 44 48 53 2.91% 4.30% 5.55%
Water & Residue (Detailed) 79 92 108 -2.04% 0.20% 2.10%EPA "Other" 30 0.99%
Total 2,711 1,589 2.71% 0.02%
(<------------from Figure 7------------>)
Figure 13.Comparison of Oregon and U.S. EPA Estimates of Per-Capita Waste Generation (2002) and Rate of Change
2002 Generation (pounds/person) 1993 to 2002 Average Annual % Change

Oregon Department of Environmental Quality Page 36 07-LQ-005
In contrast, EPA’s and DEQ’s estimates of “high-grade” or “office paper” are nearly identical, although DEQ’s estimates likely undercount office paper since some recovered office paper is diverted to newsprint mills and counted as newsprint. DEQ estimates generation of 46 – 54 pounds per person per year, while EPA estimates 50 pounds per person per year. Between 1993 and 2002, EPA estimates that generation of paper in MSW decreased at an average annual rate of 0.3% per year. During the same period, DEQ estimated an average annual increase of 0.15% per year, representing the midpoint in a range from –0.61% to +0.87%. EPA’s estimate is well within DEQ’s estimated range and close to DEQ’s midpoint estimate. This consistency between studies suggests that per-capita generation of paper, overall, has probably been relatively flat. On a subcategory basis, DEQ observed the sharpest decline in the category of “high-grade paper,” although this may be an artifact of the trend toward commingling and the diversion of office paper toward newsprint mills and subsequent mis-reporting of it in the material recovery survey. EPA states that paper consumption is relatively sensitive to economic conditions. Declines in paper generation are typically observed in recession years. Oregon’s estimate of overall higher generation for paper waste might be explained by several reasons, including:
• Higher than average retail sales, and associated paper packaging. Per-capita retail sales in 1997 were $10,297 for Oregon vs. $9,190 for the U.S.30 Higher retail sales may also translate into more paper used in print advertising.
• Higher rates of newspaper readership or reading overall. According to statistics published by the Newspaper Association of America, newspaper readership correlates positively with educational attainment and age, and whites are more likely to read newspapers than blacks, with Hispanics having the lowest levels of readership.31 Oregon has above-average rates of high school graduates (85.1% of people 25 years or older vs. 80.4% for the nation) and college graduates (25.1% of people 25 years or older with a bachelor’s degree, vs. 24.4% for the nation). It also trends slightly older (12.8% of persons were 65 or older vs. 12.4% for the nation) and much whiter (83.5% white not of Hispanic/Latino origin, vs. 69.1% for the nation) and less Hispanic (8.0% vs. 12.5%) than the nation as a whole.32
• Historical and cultural preference for paper packaging. Although most large grocery stores in Oregon now default to plastic bags, Oregon law requires the provision of paper bags as an option.
• Missing import data. EPA’s reports estimate the amount of corrugated used to package goods imported to the U.S. from other countries. However, certain categories lack complete import data and therefore EPA’s estimate of corrugated from outside the U.S. may be low.
30 U.S. Census Bureau, 2000 Census. 31 Newspaper Association of America, see http://www.naa.org/ReadershipPages/Research-and-Readership/Readership-Statistics.aspx. 32 U.S. Census Bureau, 2000 Census.

Oregon Department of Environmental Quality Page 37 07-LQ-005
At the same time, there are several reasons why EPA’s estimate should actually be higher than DEQ’s:
• EPA’s estimate of “paper” includes paper filling in diapers, which DEQ classifies in another category altogether.
• EPA’s methodologies include all paper discarded regardless of method. Significant quantities of paper are probably burned (both in fireplaces and outdoor burning) in Oregon, and these are included in EPA’s estimates but excluded from DEQ’s.
5.2.2 Plastics As shown in Figure 13, DEQ’s estimate of plastics in solid waste is slightly lower than EPA’s. DEQ’s estimates a range of 143 – 162 pounds per person per year, while EPA data equates to 183 pounds per person per year (both for 2002). Both studies have documented relatively strong growth in generation for this waste type. Between 1993 and 2002 DEQ estimates an average annual growth rate (per-capita) of between 2.6 and 4.4%, while EPA data for the same time period averages 2.6%. Comparison of DEQ and EPA data on a subcategory level is difficult because of the way in which recycling data is reported in Oregon. Using EPA data, plastics can generally be divided into three categories: durable goods, nondurable goods, and containers/packaging. In 2003, 45% of plastics in MSW were in containers and packaging, followed by 32% for durable goods and 24% in non-durable goods (plastic plates, trash bags, etc.). Between 1994 and 2003, plastic in durable goods saw the highest rate of growth in per-capita waste generation (according to EPA), growing at an average of 3.4% per year, compared to 2.3% per year for non-durable goods and 2.1% for plastics in packaging and containers. In contrast, DEQ’s estimates of waste generation for rigid plastic containers only (a subset of plastics in packaging/containers) were considerably higher, with average annual growth rates ranging from 2.9% to 4.5% between 1993 and 2002. It is widely believed that the explosive growth in sales for bottled water and “sports drinks” have fueled this steep climb in per-capita generation of rigid plastic containers. 5.2.3 Other Organics This broad category of waste includes yard debris, food waste, wood, textiles/clothing, tires and other rubber products, and carpets.33 DEQ’s estimates include roofing/tarpaper (including the paper fraction) while EPA excludes this altogether as a construction/demolition material. DEQ’s estimates also encompass an “other organics” category that includes disposable diapers; multi-material furnishings such as chairs, tables, and mattresses; and other carbon-containing wastes including cigarette butts, hair, wax, linoleum, dryer lint, vacuum bags, charcoal, dead animals, and disposable hygiene products. These differences in the broad category definition make it most useful to compare DEQ and EPA data on a subcategory basis.
33 DEQ includes all carpets in this category; EPA only includes textile-based (wool, cotton) carpets.

Oregon Department of Environmental Quality Page 38 07-LQ-005
Yard Debris. DEQ estimates per-capita generation of yard debris (grass, leaves, prunings) at 301 – 362 pounds per person per day in 2002, compared to an EPA estimate of 197 pounds per person per day. Since EPA’s estimates are derived from surveys of programs around the country, and yard debris generation is very much a function of weather, soils, vegetation regimes and landscaping norms, it is not at all surprising that DEQ’s and EPA’s estimates are so divergent. Similarly, DEQ estimates that per-capita generation of yard debris has grown at an average annual rate of 3.5 – 6.0% per year between 1993 and 2002, while EPA estimates that per-capita generation fell an average of 2.9% per year during the same period due to the aggressive promotion of home compost and grasscycling practices. Increasing rates of per-capita yard debris generation in Oregon might be explained by a number of possible factors, including:
• Reduced on-site burning. • Reduced on-site composting or stockpiling, particularly as convenient curbside collection
and drop-off opportunities became more available. • A maturation of urban landscapes (trees planted in the 1950s – 1970s may be entering
their peak years of growth), and/or a gradual removal of the urban forest canopy leading to one-time increases in woody debris.
Some of these factors are explored in greater detail in Section 7, below, but a thorough examination is outside the scope of this report. Wood Waste. Again, DEQ’s estimates of wood waste generation are considerably higher than EPA’s: 320 – 373 pounds per person per year (DEQ) in 2002 vs. 93 pounds per person per year (EPA). EPA claims average annual growth rates between 1993 and 2002 of 0.3%, while DEQ has observed average annual growth of 4.6 to 6.9%!
Differences between DEQ’s and EPA’s estimates are undoubtedly linked to the exclusion of construction/demolition waste from EPA’s definition of “municipal solid waste.”
It is important to note that DEQ’s estimates of yard debris and wood waste include some “crossover” between subcategories, particularly with regard to woody yard debris, which is inconsistently classified by hog fuel markets (sometimes woody yard debris is reported as “yard waste” and sometimes as “wood waste”).
Food Waste. DEQ estimates 2002 per-capita generation ranging from 267 to 300 pounds per person per year, whereas EPA estimates only 189 pounds per person per year. As with yard debris, EPA’s estimates of food waste are based not on a top-down materials flow model but rather represent an average of waste composition and disposal data from around the country, combined with a model that uses demographic data on population, grocery store and restaurant sales, and numbers of prisoners and students in institutions. The difference between Oregon’s estimate and the national average is not easy to explain but may be an artifact of incomplete data or modeling errors on the part of EPA.

Oregon Department of Environmental Quality Page 39 07-LQ-005
While EPA estimates that per-capita generation of food waste grew at an average annual rate of 1.6% between 1993 and 2002, DEQ’s data suggests that changes – if any – were smaller, with the average annual change expressed as something between -0.8% and +0.9%. Because this result is derived largely from DEQ’s waste composition studies (almost all food waste generated is disposed), it carries a high degree of confidence. However, DEQ’s definition of waste generation excludes food diverted through on-site composting, feeding to animals, and in-sink disposal.
Tires/Rubber&Leather. DEQ estimates 2002 per-capita generation of tires at 29 – 32 pounds per person per year. EPA’s estimate of 46 pounds per person per year for “rubber and leather” includes 33 pounds of rubber tires, very close to DEQ’s estimate.
Textiles. This is the only subcategory of “other organics” where EPA’s estimate (71 pounds per person per year) is higher than DEQ’s (24 – 32 pounds per person per year). DEQ’s category includes only clothing, rags, curtains, and other whole fabric materials that are disposed, whereas EPA’s estimate includes all of these clothing types as well as the fraction of textiles in furniture, carpets, tires, and footware, as well as textiles that are recovered for export or reprocessing. 5.2.4 Glass DEQ and EPA estimates for per-capita generation of glass are remarkably consistent. DEQ’s estimate for 2002 ranges from 83 to 98 pounds per person per year; EPA’s data leads to an estimate for 2002 of 89 pounds per person per year. This consistency continues when subcategories are examined:
• Generation of container and bottle glass is estimated at 70 – 81 pounds per person per year by DEQ, and 77 pounds per person per year by EPA.
• Window and other glass is estimated at 11 – 20 pounds per person per year by DEQ, and 12 pounds per person per year by EPA, not including construction and demolition waste.
Both DEQ and EPA have also documented a decline in container glass in the waste stream, although the decline is not as precipitous as many believe, since steeper declines in glass in food applications have been partially offset by increasing glass use for beer. DEQ estimates an average annual rate of change for container glass ranging from -2.4% to -0.4% between 1993 and 2002, while EPA data results in an estimated average annual change of negative 1.88% during the same time period. 5.2.5 Metal DEQ’s estimate of per-capita generation of waste metal in 2002 ranges from 241 – 278 pounds per person per year. This is significantly higher than EPA’s estimate of 128 pounds per person per year. As with many other materials, commingling and the nature of reporting for recycling in Oregon makes it difficult to evaluate DEQ’s overall metal estimate in detail.

Oregon Department of Environmental Quality Page 40 07-LQ-005
Possible explanations for DEQ’s significantly higher estimate includes: • On the disposal side, DEQ’s “metal” category includes a subcategory of “computers,
brown goods, and other small appliances.” Approximately 67 pounds (out of 241 – 278) generated in 2002 included products that are primarily metal (by weight) but include some non-metal components, including plastic and other materials used in computers, printers, fans, hair dryers, can openers, kitchen blenders, umbrellas, and insulated wires.
• EPA excludes metal in construction and demolition wastes from its definition of MSW. On the flip side, EPA’s estimates of metal include approximately 7 pounds per person per year of lead in lead acid batteries, which DEQ counts elsewhere (not as metal) in its generation model. EPA estimates that per-capita generation of waste metal has grown at an average annual rate of 0.3% between 1993 and 2002. DEQ’s data suggests an average annual growth rate ranging from 5.5 – 7.5%. At least some of this increase is an artifact of inconsistencies in reporting by the scrap metal recyclers (see Sections 7.2 and 7.3). 5.2.6 Other Inorganics DEQ estimated per-capita generation of 183 – 228 pounds per year in 2002. By subcategory, generation was 37% gypsum wallboard, 19% rock/concrete/brick, and 43% “other” (which includes soil, dirt, sod, pet litter, animal feces, fiberglass insulation, plaster, ash, ceramics, china, and porcelain). EPA estimates “other inorganics” at only 25 pounds per person per year, based on sampling studies. Again, EPA does not purposely include C&D wastes in its estimates. Comparing 1993 to 2002 per-capita generation estimates, DEQ estimates that this broad category has grown at an average annual rate of 3.8 to 6.9%. 5.2.7 Medical Wastes/Other Hazardous Materials EPA makes no estimate of these materials. DEQ estimates per-capita generation in 2002 ranging from 45 – 56 pounds per year. Much of this total is represented by lead acid battery and used motor oil recycling and recovery. 5.2.8 Other Wastes DEQ’s waste composition study includes a catchall category of “water and residue,” which is derived from the contamination part of the study. It includes both water (from rain and from food), and residue from bottles and containers that are too difficult to separate and weigh by means other than washing. Water and residue contributed 79 – 108 pounds per person per year to DEQ’s estimate of waste generation in 2002. EPA estimates 30 pounds per person per year of “other” wastes, which includes electrolytes in batteries and human wastes in disposable diapers.

Oregon Department of Environmental Quality Page 41 07-LQ-005
6. Estimates of Waste Prevention Tonnage (EPA) For the years 1996 and 2000, EPA published estimates of “source reduction” (decreases in generation) and “source expansion” (increases in generation) for a variety of materials. This section briefly summarizes EPA’s methodology and results.34 6.1 Methodology In order to quantify source reduction, EPA (and its contractor, the Tellus Institute) developed a methodology that involves estimating what the waste generation rate would have been had source reduction not taken place. Waste prevention is then defined as the difference between what waste generation actually was vs. what it would have been. Actual generation is known (from the same data set as described in Section 4 of this report). Estimating what waste generation would have been is a little trickier. Evaluation was undertaken of the correlation between 1960 and 1990 of waste generation and a variety of economic measures. EPA found that the economic variable that correlated most closely with waste generation was real (inflation-adjusted) Personal Consumption Expenditures (PCE). PCE, a component of the Gross Domestic Product (GDP), is an economic measure of consumer spending. EPA found a close historical correlation between the amount of money consumers spend and the amount of waste that is generated. Using 1990 as a baseline, EPA used the historic relationship between PCE and waste generation and applied it to the years 1996 and 2000. Where waste generation grew at a slower rate than predicted by PCE, EPA concludes that “source reduction” has occurred. In other words, less waste is being generated per unit of consumer spending. In a few cases, EPA identified “source expansion,” that is, where individual material waste streams grew at a faster rate than PCE. 6.2 Results A summary of EPA’s results for 2000 are shown in Figure 14.
34 For more information, please refer to U.S. EPA, “National Source Reduction Characterization Report for Municipal Solid Waste in the United States”, November 1999; and U.S. EPA, “Municipal Solid Waste in The United Sates: 2000 Facts and Figures”, June 2002.

Oregon Department of Environmental Quality Page 42 07-LQ-005
Figure 14. Source Reduction by Major Material Categories, 2000 (EPA)
(in millions of tons) Waste Stream Million Tons Source
Reduced Million Tons Actually
Generated Source Reduction
Rate35 Durable goods 5.4 36.3 13% Nondurable goods 9.3 63.7 13% Containers and packaging
15.5 74.7 17%
Other MSW (yard trimmings, food)
25.0 57.1 30%
Total 55.1 231.9 19% According to EPA, in the absence of source reduction, MSW in the U.S. would have been roughly 55.1 million tons larger (287 million tons) in 2000. Source reduction avoided an increase of nearly 25%. Clearly, the amount of waste produced per unit of consumer spending has fallen. However, it is important to remember that EPA’s estimates of waste generation do not include construction, remodeling, and demolition materials. The greatest source reduction (both in relative and absolute terms) was observed in the category of “other MSW,” primarily yard waste, although container and packaging waste is 17% lower in 2000 (per dollar of PCE) than it would have been if packaging waste as a function of PCE had remained unchanged since 1990. Similarly, the waste of “durable goods” and “nondurable goods” are both down 13%. This conclusion runs contrary to the conventional wisdom of many in the solid waste field, who are not familiar with EPA’s approach or even the idea that waste prevention can be estimated in the first place. Unfortunately, this has led to a significant disconnect, as EPA holds that a significant quantity of waste prevention has occurred in recent years, while at the same time many waste professionals note that “nothing ever happens with waste prevention.” The disconnect is caused in part by the fact that much of the waste prevention has occurred quietly and as a result of process, product, and packaging changes by manufacturers. These changes, typically conducted outside of the public’s view, have largely gone unnoticed by many in the solid waste field. Figure 15 provides a more detailed summary of source reduction, and source expansion, by component in 2000, as published by the EPA.
35 Defined as (source reduction)/(source reduction + generation).
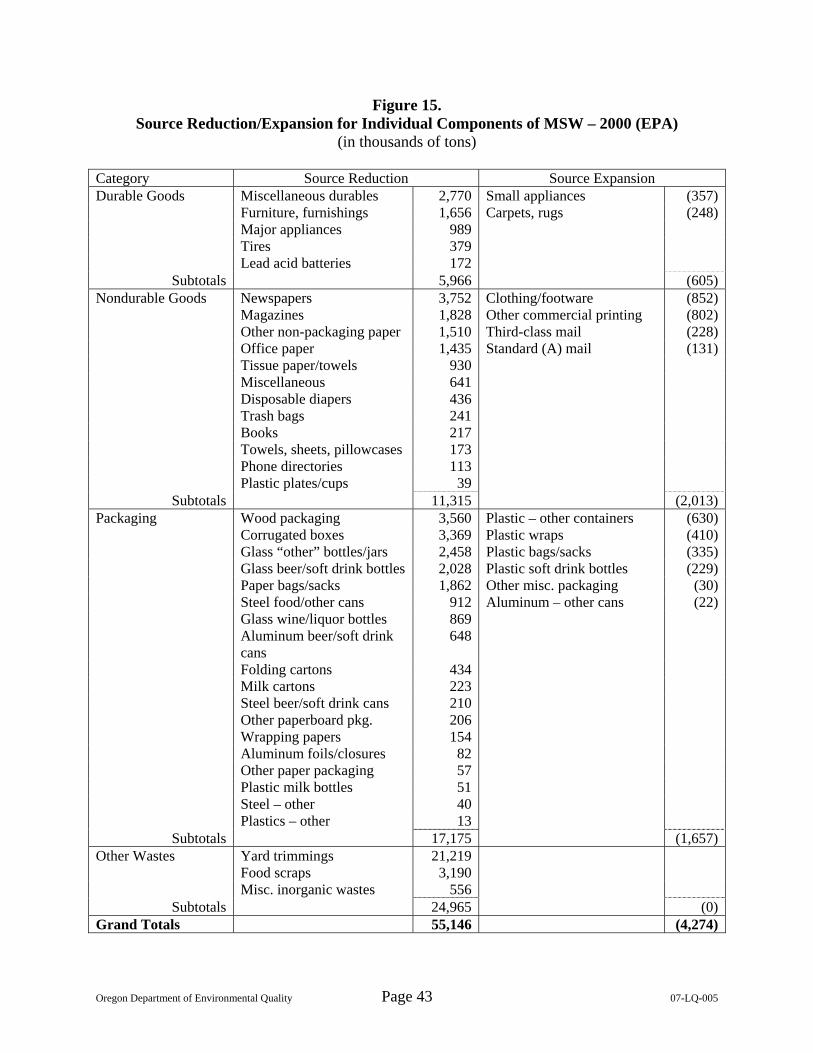
Oregon Department of Environmental Quality Page 43 07-LQ-005
Figure 15. Source Reduction/Expansion for Individual Components of MSW – 2000 (EPA)
(in thousands of tons) Category Source Reduction Source Expansion
Miscellaneous durables 2,770 Small appliances (357)Furniture, furnishings 1,656 Carpets, rugs (248)Major appliances 989 Tires 379
Durable Goods
Lead acid batteries 172 Subtotals 5,966 (605)
Nondurable Goods Newspapers 3,752 Clothing/footware (852) Magazines 1,828 Other commercial printing (802) Other non-packaging paper 1,510 Third-class mail (228) Office paper 1,435 Standard (A) mail (131) Tissue paper/towels 930 Miscellaneous 641 Disposable diapers 436 Trash bags 241 Books 217 Towels, sheets, pillowcases 173 Phone directories 113 Plastic plates/cups 39
Subtotals 11,315 (2,013)Packaging Wood packaging 3,560 Plastic – other containers (630) Corrugated boxes 3,369 Plastic wraps (410) Glass “other” bottles/jars 2,458 Plastic bags/sacks (335) Glass beer/soft drink bottles 2,028 Plastic soft drink bottles (229) Paper bags/sacks 1,862 Other misc. packaging (30) Steel food/other cans 912 Aluminum – other cans (22) Glass wine/liquor bottles 869 Aluminum beer/soft drink
cans 648
Folding cartons 434 Milk cartons 223 Steel beer/soft drink cans 210 Other paperboard pkg. 206 Wrapping papers 154 Aluminum foils/closures 82 Other paper packaging 57 Plastic milk bottles 51 Steel – other 40 Plastics – other 13
Subtotals 17,175 (1,657)Other Wastes Yard trimmings 21,219 Food scraps 3,190 Misc. inorganic wastes 556
Subtotals 24,965 (0)Grand Totals 55,146 (4,274)

Oregon Department of Environmental Quality Page 44 07-LQ-005
By EPA’s estimates, the majority of material and product categories in the U.S. experienced source reduction between 1990 and 2000. However, a few categories grew at a rate faster than PCE, and therefore experienced “source expansion.” The categories with the greatest growth (in tons) include:
• Plastic containers, bags/sacks, wraps, and bottles (other than milk bottles); • Clothing/footware; • Other commercial printing (reports, prospectuses, etc.); • Third-class/standard (A) mail; • Small appliances; and • Carpets and rugs.
7. Hypotheses: Causes of Increase in Waste Generation So why has per-capita generation in Oregon increased 40% between 1993 and 2004? A variety of hypotheses have been put forward. These generally fall into three categories: A. Changes in Waste Reporting
1. The measurement system has become more accurate (for example, as landfills have introduced scales).
2. The material recovery survey has gradually become more comprehensive and/or thorough.
3. Scrap metal recyclers and DEQ have been inconsistent in their application of the “post-consumer” standard.
4. Other changes in “what counts” have caused generation to change. B. Shifts in Waste Management
5. In response to more convenient yard waste collection opportunities, residents are home composting and grasscycling less.
6. In response to more regulation and greater awareness of the hazards of outdoor burning, people are burning less waste outdoors.
7. People are burning less garbage indoors. 8. On-site accumulation of waste has decreased. 9. Relatively less waste is being disposed of using in-sink disposals.
C. Increases in Consumption, Resource Use, and Waste Generation
10. Construction, remodeling, and demolition activity has grown at a rate higher than population.
11. As house sizes (measured in square feet) have grown, the per-capita generation of construction (and possibly demolition) waste has grown.
12. As house sizes (measured in square feet) have grown, there is greater consumption of durable goods/furnishings, as “stuff expands to fill the available space.” Eventually this leads to higher waste generation.
13. The average number of people per household has fallen, resulting in higher per-capita waste generation due to losses in “efficiency of scale” in household economies.
14. Durable goods are less durable and/or less likely to be repaired or reused. 15. Packaging is more “wasteful.” 16. People are buying more goods (as real prices have fallen, and incomes have risen)

Oregon Department of Environmental Quality Page 45 07-LQ-005
In the following text, each of these hypotheses is discussed and, where data is readily available, evaluated. Results are summarized in Figure 23 at the end of this section. 7.1 Hypothesis #1: Volume-based estimates of weight systematically underestimate
actual tonnages; reported tonnages have risen because volume-based estimates have been replaced with scales
Explanation: Generation is defined as the sum of recovery and disposal. Most information is based on measured tons (materials passed over a scale) although some reporting is based on estimates of volumes converted to weight using DEQ-approved material densities. During the time period in question (1993 – 2002), some communities installed scales at their transfer stations/recycling centers and/or landfills. Some local government staff and waste haulers have suggested that increasing per-capita generation is an artifact of the change from volume- to weight-based measurement of disposed and/or recovered materials. Evaluation: This hypothesis likely explains only a very small fraction of the increase in per-capita generation. To understand why, disposal and recovery tonnages have to be examined separately. Disposal Disposal sites can report quantities to DEQ using one of three different formats:
• By weight; • Using volume-to-weight conversions; and • For very small sites, landfills can estimate the total population using the site and multiply
by 1 ton per person. Figure 16 shows the percentage of tons disposed reported in each of these three formats for 1993 and 2002, illustrating that there has been a significant shift from volume- to weight-based reporting since 1993.
Figure 16. Disposal Reporting in Oregon by Estimation Method, 1993 and 2002
% of “Counting” Tons Reported (Disposal Only)
1993 2002 Weight-based 72.41% 99.19% Volume-to-weight 26.76% 0.81% Population-based 0.83% 0.01% The population-based method likely overestimates waste disposal since the small, rural communities that use (or used) it have disposal of less than the standard of one ton per person per year. However, so few tons were reported using this method that this impact is very small.

Oregon Department of Environmental Quality Page 46 07-LQ-005
While a significant portion of disposed tons have shifted from volume- to weight-based reporting, this shift would only contribute to increasing per-capita generation if volume-based estimates, on average, underestimated (as opposed to overestimated) tonnages. DEQ reviewed reports from nine disposal sites that changed from volume- to weight-based estimations (via the installation of scales) at some time between 1993 and 2002. Pre- and post-change estimates of disposal were compared in order to determine if there were any large shifts in tonnage that coincided with the introduction of scales. One disposal site was excluded from evaluation because it began accepting waste from neighboring, in-county, landfills that were closed at or about the same time as the installation of scales. At the remaining eight sites, only waste tonnages from the home county of each landfill were considered (because some landfills began accepting out-of-county waste at the same time they installed scales). Two comparisons were made:
• Volume-derived tons the year before the change vs. weighed tons the year after the change; and
• Volume-derived tons two years before the change vs. weighed tons two years after the change.
In the first comparison (one year before vs. one year after), weights at all eight landfills (summed together) actually fell 3% following the installation of scales. Giving all landfills an equal weighting factor (treating very small landfills the same as larger landfills), average tonnage was up 3%. However, population in Oregon during the period 1993 – 2002 grew at an average rate of 1.5% per year, suggesting that the change in weight disposed on a per-capita basis trended toward the negative when scales were introduced.36 In the second comparison (two years before vs. two years after), weights at all eight landfills increased 5% (weighted), and increased 10% on average if all landfills are given an equal weighting factor. However, this represents a span of four years, a significant length of time and one in which most communities in Oregon typically observe flat to increasing population. During the period 1993 – 2002, Oregon’s annual average population growth of 1.5% translates into an average rate of 4.6% over a four-year period (from year one to year four). This in turn cuts the per-capita change in waste disposal down to a range of +0% (weighted) to +5% (unweighted) following the introduction of scales. At most, then, the conversion to scales at landfills in Oregon increased per-capita disposal by 21 pounds per year (representing a simple average of 1993 and 2002 disposal, multiplied by the percentage that shifted from volume- to weight-based estimates during this period, multiplied by a 5% increase, and divided by population). On the opposite extreme of these findings, if the conversion to scales led to a decrease of 3%, the same formula results in an estimate that per-capita disposal fell by 13 pounds per year as a result of scales yielding more accurate results.
36 Per-capita use of individual landfills can’t easily be estimated (several of the landfills serve portions of political jurisdictions).

Oregon Department of Environmental Quality Page 47 07-LQ-005
Recovery On the recovery side, most data submitted to DEQ is reported in tons (although motor oil is typically reported in gallons). There is no easy way for DEQ to determine whether or not the reporter originally measured the recovery in tons, or estimated it in cubic yards and converted it to tons. As such, there is no easy way to estimate the quantity of recovered materials that have undergone a shift from volume- to weight-based reporting, or to estimate the impact of such a shift. A theoretical evaluation of the possible impact of this shift on per-capita waste generation might involve the following steps, provided for illustration purposes only:
• Review the list of recovered materials and identify which are more likely to be based on volume-based estimates. For the sake of illustration, DEQ assumes that all paper, metal, plastic, and glass has consistently been weighed during the period 1993 – 2002, but that yard debris, wood waste, food waste, roofing/tarpaper, and other inorganics (brick, rock, gypsum, etc.) may have been reported partially from volume-based estimates.
• Estimate the recovered tonnage for these materials (yard debris, wood waste, food waste, roofing/tarpaper, and other inorganics). The average between 1993 and 2002 recovery for these materials is 351 pounds per capita.
• For the materials that may have been based on volume-based estimates, estimate the percentage of these wastes (recovered) that underwent a shift between 1993 and 2002 from volume- to weight-based estimates. For the sake of illustration, DEQ assumes that 50% of these recovered materials underwent such a shift (they were previously estimated based on volumes but are now weighed on scales). This translates into 175 pounds per capita (50% of 351).
• Assume that volume-based estimates systematically undercounted the actual tonnage of material. For example, if volume-based estimates systematically undercount actual tonnage by 10%, then the shift from volume- to weight-based estimates would account for roughly 18 pounds per person per year of increased waste generation.
However, volume-based estimates are no more likely to underestimate tonnage than they are to overestimate tonnage. In any case, as the example above illustrates, the potential impact of these shifts on overall per-capita waste generation are likely small, if they exist at all. 7.2 Hypothesis #2: Over time, the material recovery survey has become more
comprehensive and/or thorough Explanation: Roughly 45% of total “counting” waste generation (in 2005) is comprised of material identified in DEQ’s Material Recovery Survey. As the survey has evolved, recyclers that did not report in earlier years are now reporting. In some cases (such as two lead acid battery recyclers that DEQ did not survey until the 2001 survey year), this is because DEQ was not aware of certain recycling activities or entities. In at least one other case (also in 2001), a scrap metal recycler decided to begin voluntary reporting.

Oregon Department of Environmental Quality Page 48 07-LQ-005
As a result of more recovered items being included in “what counts” and reported in the first place, waste generation has increased (as long as these materials were not previously being counted as disposal). Evaluation: As noted earlier (Figure 6), in the 2001 reporting year, DEQ identified that new reporting (both voluntary and mandatory) of scrap metal and auto battery recycling was responsible for approximately 88,000 “new” tons of generation, while including recycling of inerts added another 8,000 tons to the total.37 In all cases, these were not new on-the-ground recycling activities, but rather were merely new to DEQ’s system of reporting and/or counting. Assuming that none of the 2001 tonnages were actually new recovery, and the tonnages from these sources were comparable between 2002 and 2001, these specific changes added 55 pounds to the statewide estimate of 2,712 pounds per person generated in 2002. The changes specific to 2001 are unusual in that they were identified and specifically evaluated by DEQ staff as changes in reporting. What about similar changes in previous years? The natural expansion of the survey universe is one reason that data from the first material recovery survey (1992) are not considered in this evaluation. Recovery tonnages from 1992 are assumed to be artificially low due to the challenges with administering a comprehensive survey for the first time. As part of preparing this report, DEQ staff with historical experience with the material recovery survey (Judy Henderson and Peter Spendelow) reviewed the list of materials recovered and estimates of tonnages recovered by material by year.38 For most other materials (including papers, plastics, glass, motor oil, tires, yard debris, and wood waste) staff were unable to recollect any comparable “discoveries” of large reporters who were added to the system after they had begun recovering materials.39,40 Scrap metal tonnages have been very inconsistent, because of changes in who reports, what’s reported, and how DEQ interprets the reports. These issues are difficult to separate. The impact on waste generation from “new” tonnage from the large recycler who began reporting in 2001 is addressed in this hypothesis; all other impacts on waste generation resulting from changes in scrap metal reporting are addressed in the estimate for the following hypothesis.
37 The change in scrap metal reporting involved a large metal recycler who began reporting “counting” tonnages from self-haul sources in 2001. The auto battery change involved the significant quantity of auto batteries that are recycled by retailers. DEQ has never surveyed the battery retailers but in 2001 began surveying the recyclers who serve those retailers, leading to an almost 10-fold increase in reported recovery tonnage for auto batteries. 38 See Table 8 of DEQ’s 2005 Oregon Materials Recovery and Waste Generation Report, located at http://www.deq.state.or.us/lq/pubs/docs/sw/2005MRWGRatesReport.pdf. 39 Of course, many organizations began reporting following 1993, but staff believe that in almost all cases, these represented new recovery activities, as opposed to long-standing recovery activities that were belatedly included in the reporting system after 1993 and where the addition of their recovery tonnage would represent a false “increase” in waste generation. 40 In an earlier version of this report, DEQ noted one possible change involving the recycling of inerts. However, following publication of the draft report, DEQ revised its standard for counting of inerts for recovery and applied this new standard retroactively, thus making this issue moot.

Oregon Department of Environmental Quality Page 49 07-LQ-005
7.3 Hypothesis #3: Scrap metal recyclers and DEQ have been inconsistent in their application of the “post-consumer” definition
Explanation: Oregon’s recovery rate is supposed to exclude commercial scrap metal, including discarded vehicles or parts of vehicles and major equipment, as well as scrap metal collected at the point of generation (such as an industrial user of metal) by a scrap metal dealer. In contrast, “post-consumer” metal, including scrap metal collected at disposal sites, by haulers, at community recycling depots, or through municipally-sponsored collection events, is supposed to be counted as recovered material. Scrap metal self-hauled to a scrap yard by commercial or residential sources is also supposed to be counted. Because of the difficulty of separating post-consumer scrap metal from commercial and industrial scrap metal, scrap metal dealers are exempt from mandatory reporting. When they do report, they are asked to report only scrap metal collected at disposal sites, by haulers, at community recycling depots, through municipally-sponsored collection events, and direct haul by individuals from residential or commercial sources. Scrap metal from appliance recycling is now being counted but not all appliance recycling was counted in 1993. Metal recovery is subdivided into aluminum cans, tin/steel cans, and “scrap metal.” Excluding tin/steel and aluminum cans from this mix leaves the category of “scrap metal,” which is where inconsistencies in counting are most likely to appear. “Counting” recovery of scrap metal grew from 27 pounds/person in 1993 to 86 pounds/person in 2002 (after subtracting out the addition of scrap metal from new reporters, which is already accounted for in hypothesis #2, above41). Scrap metal tonnage can be evaluated by method of recycling, dividing tonnages into the following three categories:
• Separation at dirty MRFs (counts); • Other post-consumer collection by haulers and solid waste facilities (on-route, recycling
depots, transfer stations) (counts); and • Other/private recyclers (some counts, some doesn’t).
Figure 17 shows per-capita recovery (pounds per person per year) for 1993 and 2002 by these three methods of recovery.42
Figure 17. Per-Capita Recovery by Method, Scrap Metal, 1993 and 2002
(Pounds per person per year) 1993 2002 Dirty MRFs 2 5 Other collection by haulers/solid waste facilities 20 36 Subtotal, “pure” post-consumer 22 41 Private recyclers 6 44 Total 27 86 Sums do not equal totals due to rounding. 41 This is done to avoid double-counting in Figure 25. 42 Again, reporting already addressed in hypothesis #2 is not included here.

Oregon Department of Environmental Quality Page 50 07-LQ-005
While recovery in the “pure” post-consumer categories grew 97%, counting recovery from private recyclers grew 681% during the same period. The increase in recycling at dirty MRFs and by haulers makes sense as this period saw a significant increase in MRFing of C&D waste as well as increasing recycling of other materials from households, businesses, and construction/demolition sites. However, an 8-fold increase in recycling by private recyclers seems surprising. Given the challenges of separating “post-consumer” counting from non-counting scrap metal, perhaps some of this increase is explained by inconsistencies in reporting and counting. Evaluation: At issue is the increase of recycling by private recyclers, from 6 pounds/person in 1993 to 44 pounds/person in 2002. (By 2004, this number had increased to 125 pounds/person.) Such an increase seems suspect. For the sake of simplicity, DEQ uses two methods to estimate the low and high end of the range of how much of the increase (between 1993 and 2002) is “real” vs. a function of accounting changes:
• Low estimate: Assumes the 2002 estimate (44 pounds/person) is correct and should have increased at the same rate as “pure” post-consumer (97% since 1993). In this approach, private recyclers should have reported 23 pounds/person in 1993 and the remaining 21 pounds/person are an accounting artifact.
• High estimate: Assumes the 1993 estimate (6 pounds/person) is correct and 2002 recovery should have increased at the same rate as “pure” post-consumer (97%). In this approach, private recyclers should have reported 12 pounds/person in 2002 and the remaining 32 pounds/person are an accounting artifact.
7.4 Hypothesis #4: Other changes in “what counts” have caused generation to change Explanation: Other changes or inconsistencies in “what counts” toward waste generation would contribute to artificial changes in per-capita generation. Evaluation: DEQ staff involved with waste disposal and recovery studies identified one additional example of an inconsistency in counting. For a number of years, tire residue was not counted toward disposal, but this decision was reversed in the 1999 counting year when it became apparent that whole tires (which have always counted toward generation) were being ground and disposed of as “tire residue.” An estimated 5,223 tons of steel belts, fabric, and other tire residue were excluded from counting in 1993, or 3 pounds per person. Per-capita generation of tires fell slightly between 1993 and 2002 but not enough to change this estimate of the impact of this omission on per-capita generation.

Oregon Department of Environmental Quality Page 51 07-LQ-005
7.5 Hypothesis #5: In response to more convenient yard waste collection opportunities, residents are home composting and grasscycling less
Explanation: The tonnage of yard waste (leaves, grass, and brush) collected and counted for recovery in 2002 was more than 2.5 times higher than yard waste counted for recovery in 1993. Popular wisdom attributes much of this increase to the expansion of curbside yard waste collection services (coupled with variable rates for garbage collection) as well as an increase in the number and convenience of compost facilities and drop-off sites. (When DEQ began permitting compost facilities in 1999 there were 24 facilities requiring permits; by the end of 2004, 44 facilities were permitted.) The expansion of yard waste collection and recovery programs has diverted materials from disposal, but not all of the collected materials were previously disposed. Some were previously composted, “grasscycled,” or chipped into mulch on-site. This tonnage was not previously counted, so the diversion of these materials to “counting” recovery sites results in an apparent increase in waste generation. Evaluation: There are two methods of evaluating this hypothesis: a) the use of longitudinal survey data and/or b) comparison of collection tonnages immediately prior to and following the introduction of new yard waste recovery programs. Both of these methods are considered, in turn, below. Method One: Survey Data The only area of the state where DEQ identified longitudinal surveys of yard waste practices was in the Portland Metro area; Metro has conducted surveys in 1990, 1995, 1998, 2001, and 2004.43 In addition to these surveys, DEQ conducted a statewide survey of households in 1996, and Marion County conducted a survey of residents in 1998. Jackson County conducted limited surveying in 2001 and 2004, but lack of sufficient documentation as well as design problems with the 2001 survey make their results problematic. In the Metro region, residential curbside yard debris collection was introduced in most communities between 1991 and 1994.44 Metro’s 1995 survey states: “The one in three households that composted their debris (on-site; actually is 35%) remained unchanged (from the 1990 survey) though slightly fewer said they piled it in their yards (2% in 1995, rate unknown in 1990). Other disposal methods such as burning, and taking debris to a recycling center showed little change between 1990 and 1995.” Metro’s 1998, 2001, and 2004 surveys found that participation in home composting (by any method; not to be confused with use of Metro-sponsored compost bins) was statistically unchanged between those years. 43 DEQ only reviewed Metro surveys from 1995 (“1995 Solid Waste and Recycling Telephone Survey”, Gilmore Research Group), 1998 (“Household Compost Survey”, Gilmore Research Group), and 2004 (“2004 Home Composting Survey, Market Decisions Corporation). 44 Tualatin began weekly collection in 10/91; Clackamas County began weekly collection in 1/92; Portland began monthly collection in 4/92 and changed to bi-weekly in 7/93; Gresham began weekly collection in 9/92; Lake Oswego began weekly collection in 10/92; Washington County began bi-weekly curbside in 1/94; Wilsonville began weekly curbside in 3/94.

Oregon Department of Environmental Quality Page 52 07-LQ-005
Metro’s 1998 survey found that 7% of households previously had composted yard debris (on-site) but had stopped.45 Among those who stopped composting (at home), the largest reasons were:
• Takes too much time/too lazy/easier to throw it away (27%); • Just moved so haven’t started/don’t do it any more (19%); • Not enough space/no place for it (17%); and • Have yard debris pickup/recycle it (17%).
Thus, as of 1998, only 1% of households (17% of 7%) reported discontinuing on-site composting because of the provision of yard debris pickup. Using a simple average of 646 pounds per composting household, and assuming that Metro’s results are representative of the entire state, and apply to the period 1993 – 2002, this translates into a contribution to statewide per-capita generation of approximately 2 pounds/year.46 A higher estimate would be to assume that perhaps 75% of households that stopped on-site composting did so because of the provision of yard waste collection; this assumption (along with the assumptions that Metro’s results are representative of the entire state and apply to the period 1993 - 2002) translates into a contribution to statewide per-capita generation of approximately 11 pounds/year.47 Metro’s survey results suggest that the added convenience of curbside collection and multiple yard waste acceptance sites has had relatively little impact on home composting behavior. One possible explanation for this is that some people who compost at home do so primarily to produce a soil amendment for on-site use; the added convenience of new off-site composting options is assumed to have less impact on residents who compost for the sake of their own soil health, as opposed to those who compost primarily as a way to manage discards. Metro’s 2004 survey found that both yard debris and food scrap composters are much more likely to be active gardeners than the general population.48 While the DEQ and Marion County surveys do not provide any longitudinal data, a quick review of key findings may be of interest. DEQ’s 1996 telephone survey of households in Oregon found that 45% of residents compost waste at home, although rural residents are significantly more likely to compost waste (54%), compared to their suburban (42%) or urban (41%) counterparts. Those who live outside of a city
45 Similar results were found for food waste; 7% of households in 1998 used to compost food scraps on-site but had discontinued, but for a different mix of reasons. These questions were not repeated in 2004. 46 646 pounds of materials composted on-site per participating household is the mean of diversion estimates reported by 35 community programs surveyed for the report “Economic Cost-Benefit Analysis of Home Composting Programs in the United States”, prepared by Applied Compost Consulting for The Composting Council in 1995. Assuming that the experience of the entire state is comparable to that of the Metro region, the 1% of households who stopped composting due to the provision of yard waste collection is multiplied by an estimate of the number of households statewide in 2002, then by 646 pounds/household, and the result is divided by the state’s population. 47 Survey data suggests that some households stop on-site composting for other reasons including illness, use of landscaping services, etc. 48 This survey also found that composters are also more likely to live on large lots. One might hypothesize that as average lot size decreases, participation in home composting will fall.

Oregon Department of Environmental Quality Page 53 07-LQ-005
are more likely to compost waste (53%) than those inside a city (40%). Homeowners are more likely to compost than renters (52% vs. 24%). Suburbanites and urbanites are more likely to compost yard debris at home (compared to rural residents), while rural residents are more likely to compost food waste than their urban and suburban counterparts. When asked “what do you do with your yard debris,” the first (unprompted response) from 29% of residents was home composting.49 DEQ may wish to consider repeating the 1996 telephone survey in order to determine how these – and other – behaviors have changed during the last ten years. The Marion County survey (1998) found that 44% of households compost “things like yard clippings and food waste at home.”50 Method Two: Tonnage Data In theory, it should be possible to evaluate residential generation (or at least disposal + yard debris) pre- and post- the provision of new curbside collection services. Unfortunately, evaluating how much of the increase in yard waste diversion is truly “new diversion” (away from counting disposal) as opposed to “shifted diversion” (away from uncounted on-site management, or counted self-haul) is exceptionally difficult because of the complicating presence of self-haul activity (both for disposal and composting) and the fact that yard waste generation can change significantly from one year to the next simply as a function of precipitation. Further, many communities that added yard waste collection did so right around 1992, so DEQ does not have tonnage data prior to program implementation. DEQ asked staff from the City of Portland, City of Eugene, and Clackamas County for any documentation they might have on this phenomenon of “shifted” diversion, but none were able to provide any meaningful data. Conclusions While this hypothesis seems plausible, limited data is available that allows the hypothesis to be tested. The data that was identified is ambiguous and does not clearly confirm the hypothesis. A series of assumptions leads to an estimate that if this hypothesis is valid, the contribution to per-capita generation in 2002 was merely 11 pounds. Actual contributions to per-capita generation may be larger but evidence is lacking. 7.6 Hypothesis #6: People are burning less waste outdoors Explanation: In 2000, the Environmental Quality Commission adopted new rules that limited outdoor burning in some areas of the State. Throughout the study period (1993 – 2002), DEQ implemented an open burning program that combined education of the hazards of burning with enforcement against violators. Some local governments and fire districts operate their own open burning programs that are more restrictive than DEQ’s. It is hypothesized that these efforts, as well as expanded low-cost recycling and composting options, led to a reduction of waste burned outdoors on a per-capita basis, and that waste that was previously burned is now being managed
49 “Public Opinion Survey, Residential Recycling”, Riley Research Associates (1996). 50 Survey results included in Dotten & Associates, “1998 Recycling Communications Plan (for) Marion County Solid Waste Management”.

Oregon Department of Environmental Quality Page 54 07-LQ-005
through the formal solid waste system, and is therefore now being counted.51 This shift from undocumented to documented management would explain some of the increase in per-capita waste generation. Evaluation: DEQ identified eight sources of information regarding the frequency of outdoor burning in Oregon and Oregonians’ awareness of outdoor burning. Two sources involved statewide surveys (conducted in 1996 and 2001), while the other six sources were local: one survey each in Marion County (1996), La Grande (2002), and Lakeview (2002), and three surveys commissioned by Metro (1995, 1998, and 2004). The first statewide survey was a telephone survey commissioned by DEQ and conducted by Riley Research Associates in 1996 (described in hypothesis #5, above). This survey slightly oversampled the Metro area and slightly undersampled other areas. Key findings include:
• When asked “Which of the following ways (does) your household dispose of garbage?”, followed by a list of prompts, 38% claimed to burn at least some of their waste: • 18% claim to burn waste outdoors but not indoors. • 12% claim to burn waste indoors but not outdoors. • 8% claim to burn waste both indoors and outdoors.
• 26% claim to burn at least some waste outdoors: • Rural residents are much more likely to burn waste outdoors than their suburban or
urban counterparts (55% vs. 15% and 11% respectively). • Those who live outside city limits burn waste outdoors much more often that those
inside the city limits (50% vs. 14%). • Those who live in the “Rest of State” category are much more likely to burn waste
outdoors, compared to those in the I-5 Corridor and Portland Metro area (46% vs. 31% and 14%).
• In the Metro area, those outside the Urban Growth Boundary are also much more likely to use this method of disposal, compared to those inside the boundary (44% vs. just 7%).
• However, many of the households who burn outdoors do not use this method as their primary garbage disposal method. Among households who mentioned more than one method of managing garbage, when asked “which one do you use to get rid of most of your garbage,” only 1% said that burning outdoors was their primary method.
• 20% of households burn waste indoors: • 30% of rural residents burn waste indoors. • Those outside city limits burn waste indoors more often than those in incorporated
areas (25% vs. 16%). • For those households who use multiple methods to manage their wastes, 1% said that
burning indoors was their primary method.
51 The impact on outdoor burning of providing composting options was demonstrated in 2002 in La Grande. A survey of 300+ households receiving home composting bins found that the percentage of households burning outdoors fell from 9% (before bin distribution) to 1% (after bin distribution) for leaves/grass and from 24% to 13% for branches/shrubs.

Oregon Department of Environmental Quality Page 55 07-LQ-005
Figure 18 shows the percentage of households who report burning various materials (in response to a question “What types of materials do you burn?” but without waste-specific prompts). Paper is by far the most commonly burned material, followed by wood waste (lumber), and yard debris.
Figure 18. Percent of Oregon Households Burning various Wastes (1996)
Households That Burn
(n = 227) All Households Surveyed
(N = 600) Any/All 100% 38% Paper 64% 25% Wood Waste/Lumber 30% 12% Yard Debris 25% 10% All Burnables 7% 3% Cardboard Boxes 2% 1% Plastic 2% 1% Miscellaneous 7% 3% The DEQ/Riley survey also asked households about how they managed a variety of specific waste types. For these questions, each waste type was named but management options were not prompted. Only the first response was recorded. Results are shown in Figure 19.
Figure 19. Unprompted, First Responses to “What do you typically do with (material)?” (1996)
Burn Indoors Burn Outdoors Wood scraps 36% 13% Yard debris 1% 14% Junk mail 10% 9% Corrugated cardboard 3% 7% Plastic bottles NR 1% Plastic bags/wrap 1% 2% Food waste NR NR Newspaper 6% 3% Dirty paper, such as soiled napkins
8% 8%
NR = No response Rural residents are more likely to burn scraps of wood indoors, compared to urban and suburban counterparts (47% vs. 34% and 34%). Residents without garbage service are more likely to burn their junk mail, compared to those with garbage service (49% vs. 18%).

Oregon Department of Environmental Quality Page 56 07-LQ-005
The second statewide survey was conducted by the Washington State University Social and Economic Sciences Research Center (SESRC) in 2001 for the states of Oregon, Washington, and Idaho.52 This telephone survey was primarily focused on indoor burning of wood, but did ask a few questions regarding outdoor burning:
• 24% of respondents reported burning some items (including orchard waste and yard waste) outdoors. This is statistically equivalent to the 26% rate reported in the 1996 Riley survey, although that survey slightly oversampled the Metro area, where the rate of burning is low. Correcting for this brings the 1996 outdoor burning rate to 27%. While it appears that the rate of outdoor burning fell slightly between 1996 (27%) and 2001 (24%), the difference between the two results is likely not statistically significant.
• 15% of respondents in 2001 reported burning something other than orchard and yard wastes outdoors, such as paper, lumber or garbage. Differences in survey design make it difficult to compare this against 1996 (DEQ/Riley) results.
Results of the local surveys generally confirm the patterns observed in the DEQ/Riley survey:
• Metro’s 1995 survey found that 5% of Metro-area households report burning yard waste, which demonstrated “little change from 1990.”
• Metro’s 1998 survey found a much higher rate of burning (indoor vs. outdoor burning was not specified), suggesting differences between the two surveys in how the question was asked. Regardless, in 1998, 19% of Metro-area households reported burning brush waste, 5% reported burning leaves/pine needles, and less than 1% reported burning grass clippings.
• By 2004, these rates had all fallen slightly, to 15% for brush waste (down from 19%), 3% for leaves/pine needles (down from 5%), and again 1% for grass clippings.
• DEQ commissioned mail-back surveys of households in Lakeview and La Grande in 2002. Percentages of households burning a variety of materials outdoors in these two communities are shown in Figure 20.53
Figure 20.
Percent of Households Burning Outdoors, Lakeview, and La Grande (2002) Lakeview La Grande Leaves/grass 17.3% 16.7% Branches/shrubs 26.7% 32.1% Wood 7.3% 15.5% Paper 20.0% 14.3% Cardboard 16.0% 10.7% Metal 0.7% 0.4% Plastics 3.3% 0.8% Garbage 4.7% 3.6% Stumps 3.3% 4.8% 52 “Wood Burning Stove Survey for Idaho, Oregon and Washington State: Data Report”, prepared for Idaho Department of Environmental Quality by Washington State University Social and Economic Sciences Research Center, August 2001. 53 “Lakeview 2002 Oregon Woodheating Survey Overview Report” and “La Grande 2002 Oregon Woodheating Survey Overview Report”, both prepared for the Oregon DEQ by Oregon Institute of Technology, October 2002.

Oregon Department of Environmental Quality Page 57 07-LQ-005
• 80% of Lakeview respondents who reside outside the city limits burn outdoors while just
over 20% of city residents burn outdoors. • Similarly, in La Grande, 80% of respondents outside the city limits burn outdoors while
just over 25% inside the city limits burn outdoors. • Finally, Marion County’s 1996 survey did not ask about burning practices but did find
that 72% of residents agreed that “burning household yard trimmings pollutes the air,” 7% couldn’t say, and 21% disagreed.54
Longitudinal data from Metro (1998 vs. 2002) as well as statewide (1996 vs. 2001) suggest that participation in outdoor burning has remained fairly steady with perhaps a decline of a few percentage points during survey periods. Statewide data prior to 1996 was not identified. Good data on the composition of materials burned is lacking, although it appears that yard waste, followed by lumber and paper, are the materials most commonly burned outdoors. Data from multiple sources suggests that residents in rural areas are much more likely to burn wastes outdoors. So, what does this mean for the quantity of wastes burned outdoors in 1993 vs. 2002? A comparison of 1990 and 2000 U.S. Census data shows that the population of Oregon living in areas classified as “rural” declined from 29.5% in 1990 to 21.3% in 2000. This suggests that during this period, an average of 0.8% of Oregon’s population each year moved into urbanized settings, or stayed in place while their surroundings became urbanized. The 1996 DEQ/Riley survey found that rural residents are much more likely to burn waste outdoors than their suburban or urban counterparts (55% vs. 15% and 11% respectively). The following assumptions are then made:
• The 0.8% annual shift (observed between 1990 and 2000) held constant between 1993 and 2002.
• These residents shifted from rural to suburban settings. • The 40% spread in burning rates between rural and suburban residents (observed in 1996)
held constant between 1993 and 2002. • The residents who shifted from rural to suburban settings changed their behavior, on
average, to match that of suburban residents. These assumptions combine to result in an estimate that between 1993 and 2002, 3.0% of Oregon households ceased outdoor burning as a result of increasing urbanization and population density. Estimating the tonnages not burned as a result of this shift is more problematic. For the sake of simplicity, DEQ assumes:
• Between 30% and 50% of all waste generated in 2002 was from residential sources, including residential construction/remodeling (this translates into 817 – 1,361 pounds/person-year generated at residences).
54 “Attitudes and Perceptions towards Recycling Household Yard Trimmings”, prepared for Marion County Solid Waste by DRC Research, 1996.

Oregon Department of Environmental Quality Page 58 07-LQ-005
• Based on a review of waste composition data and limited survey data above, between 20% and 40% of this residential waste was burned outdoors by households who do burn outdoors.55
Combining these assumptions with the estimated 3.0% of Oregonians who stopped outdoor burning between 1993 and 2002 results in an estimate that 2002 per-capita waste generation (statewide) is between 5 and 16 pounds higher than in 1993, as a result of reductions in outdoor burning of household wastes associated with urbanization. To reflect the potential that households that continued to burn may have reduced the quantity of materials due to more education and/or the addition of new recovery options (for example, reduced burning of paper, plastic, or yard debris), DEQ adds to the estimate above an estimate derived from the following assumptions:
• 24% of households reporting outdoor burning in 2001 shrank to 23.2% in 2002. • Households generated 817 - 1,361 pounds/person-year at residences. • Households that continued to burn outdoors were burning 30% of this waste in 1993 but
this fell by 20%, to 24% in 2002. These assumptions add another 11 - 19 pounds to the estimate of increased waste generation in 2002. Again for the sake of simplicity, potential reductions in outdoor burning of wastes from non-residential sources were also estimated under two scenarios. One assumes that 70% of all waste is from nonresidential sources and that 10% of it might be burned outdoors, the other assumes that 50% of waste is nonresidential and 20% might be burned outdoors. Both estimates assume that only 1.0% of Oregon business waste shifted away from outdoor burning during this period (due to the concentration of business wastes in areas where burning was already prohibited, and the logistical challenges, lack of space, and labor costs of burning business wastes). This adds another 2 – 3 pounds/person to per-capita generation in 2002, bringing the total for this hypothesis to 18 – 38 pounds per person. 7.7 Hypothesis #7: People are burning less garbage indoors Explanation: While most discussions of garbage burning focus on outdoor burning, data suggests that some households burn wastes indoors as well. If indoor burning of garbage has declined, then waste generation would appear to increase, as wastes shift from a “non-counting” management method (burning) to “counting” management methods such as landfilling, composting, or recycling. Evaluation: Survey data specific to indoor burning of wastes is very limited.
55 Oregon’s 2002 waste composition study finds that waste from residential route trucks is 25% paper, 12% plastics, 9% yard debris, and 2% wood. Other materials include food (25%), diapers (5%), textiles (3%), glass (3%), metals (6%), and other inorganics (7%). The low estimate above is based on burning of yard debris, wood, and some paper. The higher estimate is based on burning yard debris, wood, most paper, and most plastics.

Oregon Department of Environmental Quality Page 59 07-LQ-005
As described in the previous section, the 1996 DEQ/Riley survey found that 20% of households reported burning at least some wastes indoors. Rates were higher in rural areas (30%) and among residents who live outside of incorporated city limits (25%). Looking at specific materials, when asked the unprompted question “What do you typically do with . . .” followed by a list of materials, 36% of Oregonians gave “burn indoors” as their first response for wood scraps. As shown in Figure 19 (above), responses were 10% for junk mail, 8% for “dirty paper such as soiled napkins,” and 6% for newspaper. The survey also found that rural residents more likely to burn scraps of wood indoors, compared to urban and suburban counterparts (47% vs. 34% and 34%). The only other survey data on indoor burning comes from DEQ’s 2002 survey of home compost bin recipients in La Grande.56 5% of households reported burning woody prunings indoors prior to receiving their home compost bins; 1% reported indoor burning of “green trimmings and weeds.” No other data was identified specific to indoor burning of wastes. However, additional data does exist regarding indoor burning of wood. These two behaviors may be related to each other, particularly in households that rely on wood for heat. While the primary motivation of outdoor burning is presumably to reduce the volume of accumulated trash, some people burn waste indoors both to manage trash but also for heat. (For example, this author has neighbors who burn garbage in the winter and cool spring mornings, but not when the weather warms up.) This suggests that indoor garbage burning may be associated with use of wood stoves and fireplaces for heat. If reliance on wood for heat is reduced, indoor burning of waste may be reduced as well. Evidence that wastes are burned indoors for heat comes from the regression analysis discussed in Section 3.3.1, above. Counties with higher rates of wood stove and fireplace use as a primary heat source tend to have lower per-capita waste generation. Reliance on wood for residential heat declined precipitously during the 1990s. According to the U.S. Census, 17% of Oregon households in 1990 relied on wood as their primary source of heat. By 2000, this had fallen to just 7% of Oregon households. Reliance on wood varies widely across the state, from 1% of households in Multnomah County (in 2000) to 49% of households in Wheeler County. Every county in Oregon witnessed declines in the percentage of households relying on wood as their primary heat source between 1990 and 2000:
• In 1990, the highest-ranked counties were Grant (63%), Wheeler (62%), Wallowa (58%). • In 2000, these three counties were still the top-ranked wood users, but rates had fallen
significantly: Wheeler (49%), Grant (36%), Wallowa (33%). • In 1990, the counties with the smallest percentage of households relying on wood as the
primary heat source were Multnomah (4%), Washington (6%), and Marion (11%). • In 2000, these three counties maintained their positions in the ranking, but rates had
fallen by more than half each: Multnomah (1%), Washington (2%), Marion (4%).
56 “Survey of Home Compost Bin Recipients, La Grande Oregon”, prepared by Oregon DEQ, June 2004.

Oregon Department of Environmental Quality Page 60 07-LQ-005
Decreasing reliance on wood for heat was also documented in DEQ’s 2002 surveys in La Grande and Lakeview, referenced in the discussion of the previous hypothesis. Further evidence that some wastes are being burned for residential heat comes from seasonal patterns of waste disposal.57 DEQ’s waste composition studies from 1998, 2000, and 2002 report waste collected by quarter, collection type, and area of the state. If households are burning wastes for heat, then residential collections during cold weather would be lower than during warm weather, assuming that waste generation is constant year-round. In fact, residential waste generation is not constant year-round (there is greater landscaping and remodeling activity during warmer weather), yet the quarterly data is still useful for two reasons:
• It allows comparison of seasonal differences in different areas of the state. If waste is being burned for heat, then seasonal differences should be more pronounced in areas with greater reliance on wood burning.
• It allows comparison of seasonal differences over time. If waste is being burned for heat, then seasonal differences should become less pronounced as reliance on wood heat decreases.
Figure 21 illustrates the “gap” between cold-season and warm-season on-route residential disposal. “Cold-season” is defined as the first quarter of the year (January – March); “warm season” is defined as the second and third quarters (April – September). For each period, average monthly garbage collected in residential garbage route trucks was calculated; Figure 21 shows the “cold season” monthly average as a percentage of the “warm season” monthly average.
Figure 21. “Cold Season” as a Percentage of “Warm Season” Monthly Averages for Residential
Garbage Route Collections 1998 2000 2002 Metro 94.6% 95.4% 97.9% Rest of State 81.1% 84.8% 90.6% This data supports the hypothesis that some households are burning garbage indoors for heat. The difference between cold and warm season disposal is less pronounced in the Metro area, where home wood use is lower. The data also supports the theory that indoor burning of waste for heat declined concurrent with the move away from wood heat. DEQ’s 1998 waste composition study provides even greater geographic detail, and further supports the hypothesis. Average monthly on-route garbage collections from single-family residences in January – March were:
• 98% of average monthly collections April – September in the City of Portland; • 92% elsewhere in the Metro area; • 92% in Marion County;
57 See Table A1 (Appendix A) of DEQ’s Oregon Solid Waste Characterization and Composition reports for 1998, 2000, and 2002.
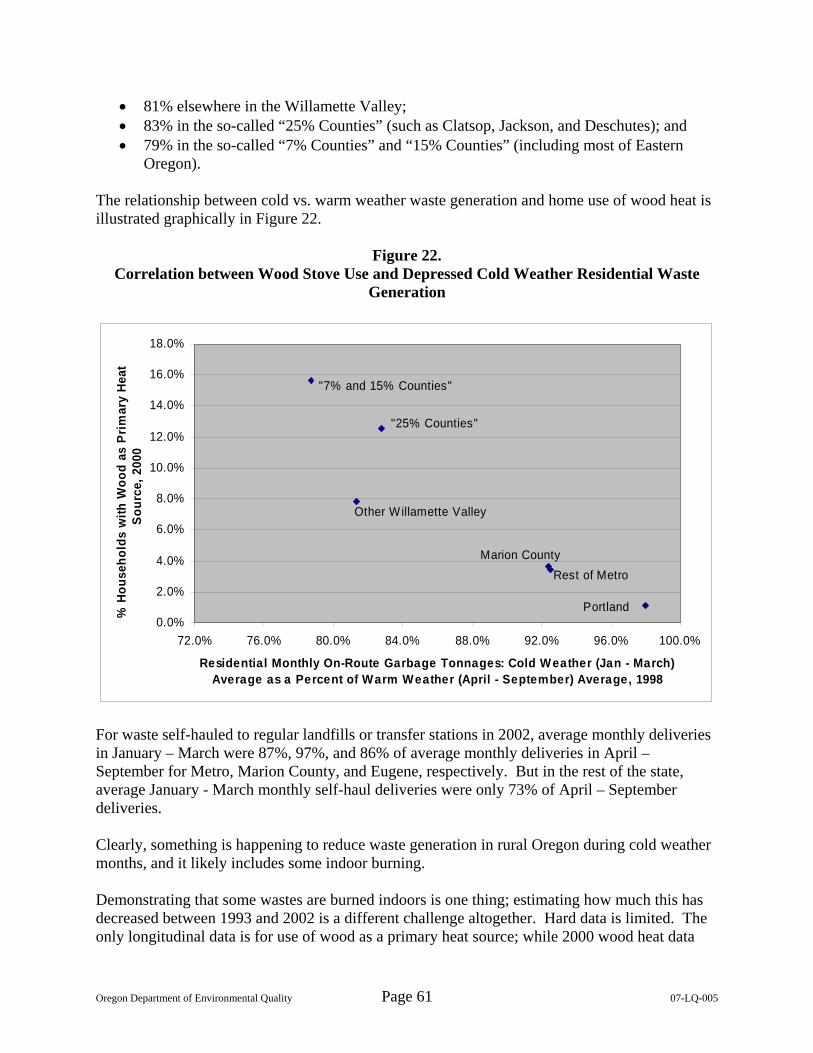
Oregon Department of Environmental Quality Page 61 07-LQ-005
• 81% elsewhere in the Willamette Valley; • 83% in the so-called “25% Counties” (such as Clatsop, Jackson, and Deschutes); and • 79% in the so-called “7% Counties” and “15% Counties” (including most of Eastern
Oregon). The relationship between cold vs. warm weather waste generation and home use of wood heat is illustrated graphically in Figure 22.
Figure 22. Correlation between Wood Stove Use and Depressed Cold Weather Residential Waste
Generation
0.0%
2.0%
4.0%
6.0%
8.0%
10.0%
12.0%
14.0%
16.0%
18.0%
72.0% 76.0% 80.0% 84.0% 88.0% 92.0% 96.0% 100.0%
Residential Monthly On-Route Garbage Tonnages: Cold Weather (Jan - March) Average as a Percent of Warm Weather (April - September) Average, 1998
% H
ouse
hold
s w
ith W
ood
as P
rim
ary
Hea
t So
urce
, 200
0
Portland
"7% and 15% Counties"
"25% Counties"
Other Willamette Valley
Marion CountyRest of Metro
For waste self-hauled to regular landfills or transfer stations in 2002, average monthly deliveries in January – March were 87%, 97%, and 86% of average monthly deliveries in April – September for Metro, Marion County, and Eugene, respectively. But in the rest of the state, average January - March monthly self-haul deliveries were only 73% of April – September deliveries. Clearly, something is happening to reduce waste generation in rural Oregon during cold weather months, and it likely includes some indoor burning. Demonstrating that some wastes are burned indoors is one thing; estimating how much this has decreased between 1993 and 2002 is a different challenge altogether. Hard data is limited. The only longitudinal data is for use of wood as a primary heat source; while 2000 wood heat data

Oregon Department of Environmental Quality Page 62 07-LQ-005
correlates well (inversely) with per-capita waste generation, data from 1990 does not. Unfortunately, attempts to use the results of the regression analysis (in Section 3.3.1) to estimate reductions in garbage burning associated with shifts away from wood as a primary heat source yield unbelievable results.58 DEQ used the following alternative approach as an estimation method:
• Simple regression analysis was conducted on the data points in Figure 22. The two variables were found to have a strong, inverse correlation (R2 of 0.852; P-value of 0.0086). The analysis predicted the following relationship: every 1% increase in wood heating decreases the cold/warm ratio for residential on-route disposal by 1.24% (95% confidence range of -0.54% to -1.96%).
• U.S. Census data on wood as a primary heat source was reviewed for 1990 and 2000 for two geographic areas: the three Metro-area counties, and the remainder of the state. For each area, a straight-line average % decline per year was calculated then multiplied by 9, assuming that the average rates of decline 1990 – 2000 and 1993 – 2002 were the same.
• The cold/warm ratios for the Metro region and the rest of the state was taken from Figure 21 for the year 2002.
• Working backwards from 2002 to 1993, for both regions DEQ estimated the cold/warm ratio in 1993, by subtracting from the 2002 cold/warm ratio the following: (9 years) x (annual rate of decline of wood use) x (Z), where Z equals 0.52 (low estimate), 1.24 (mid-point estimate), and 1.96 (high estimate), drawn from the regression analysis described above. In this way, DEQ projected the cold/warm ratio for 1993 as a function of wood heating.
• To estimate the increasing tonnage of residential on-route disposal attributed to the decrease in indoor use of wood, DEQ then projected what the 2002 cold/warm ratio would be if indoor wood use had held constant from 1993. By multiplying this ratio against 2002 actual warm weather average collections, and subtracting it from actual 2002 cold weather average collections, DEQ estimated the increase in average monthly collections during cold weather attributed to the decrease in reliance on wood for heat.
• “Cold” season in Figures 21 and 22 was defined as January – March, because hauler data is only available on a quarterly basis. However, only 43% of heating degree days in an average year occur during these three months.59 To account for burning that occurs during the fall and early spring, the average monthly change in burning was multiplied by 3 (to cover the full “cold” quarter) and then again by a factor of (1 + 0.75) (to account for a 75% of the total number of heating degree days [43% x 1.75 = 75%], given than some
58 The regression analysis suggested that there was 95% confidence that every 1% decrease in use of wood as a primary heat source would increase per-capita waste generation (County-wide) by 10 – 38 pounds. In a hypothetical County with 10,000 people, all living in households of equal size, if 100 people (1%) stopped using wood as a primary heat source, we should be 95% confident that waste generation would increase by 100,000 – 380,000 pounds, or 1,000 – 3,800 pounds per person who stopped burning. Given that per-capita generation in Oregon in 2002 was 2,723 pounds, including waste from all sources (including commercial and some construction/demolition activities), a per-person reduction in burning of 1,000 – 3,800 pounds/year seems difficult to believe. Possible explanations for the discrepancy include a) this is one of those rare times when the true value falls outside of the 95% confidence interval; b) some other variable, closely tied to but not the same as indoor burning, is actually contributing to increases in waste generation. 59 Using 1960 – 1990 averages for the Portland International Airport; http://www.worldclimate.com/cgi-bin/data.pl?ref=N45W122+1306+356751C.
Oregon Department of Environmental Quality Page 63 07-LQ-005
heating degree days don’t result in fireplace/woodstove use). This led to estimates of 11,925 – 44,920 tons/year of increase in residential garbage collection routes attributed to reductions in wood stove/fireplace use for heat.
• However, not all household garbage is collected via on-route collection. Particularly in rural areas of the state, self-haul is the dominant mode of collection. DEQ assumed that percent reductions in garbage burning associated with reduced fireplace use would be comparable between self-haulers and on-route customers. In 2002, statewide January – March self-haul tonnage was 87% of residential on-route garbage collection tonnage. The on-route tonnage estimates above were multiplied by this factor to estimate the increase in self-haul tonnage attributable to the reduction in wood heat.
• Finally, DEQ attempted to account for the burning of recyclables. As a rough estimate, DEQ assumed that 10 – 30% of wastes burned in fireplaces would otherwise go to recycling (as opposed to disposal). The disposal estimates for on-route and self-haul were combined and then multiplied by the appropriate factors to estimate the quantity of materials recycled in 2002 that are “new” tonnage from 1993 as a result of reductions in indoor burning.
• Combining these three estimates (residential on-route garbage; self-haul; recycling) for 2002 and both areas (Metro, non-Metro) and dividing by 2002 population results in an estimate that reduced indoor burning of wastes contributed 14 – 69 pounds per person per year to Oregon’s official 2002 waste generation estimate.
7.8 Hypothesis #8: On-site accumulation of waste has decreased Explanation: Households may be accumulating less waste on site and sending more waste off-site, where it is counted as part of generation. This change could be a result of several factors, including:
• A general trend toward urbanization and a decrease in average lot sizes. • Increased local enforcement of code violations (nuisance stockpiling). • Shifts in cultural norms and expectations.
Evaluation: The only firm data DEQ identified was from its 1996 residential telephone survey, where, in response to a list of prompts, 4% of households reported that they dispose of at least some of their garbage on their property (not including composting or on-site burning, which were represented by separate prompts). No data was identified that would allow for an evaluation of whether that percentage has changed over time. One might assume that on-site accumulation of waste is more frequent in rural or low-density areas than in urban or high-density areas. If this were true, then per-capita waste generation (as counted by DEQ) might correlate with urbanization and or population density. Using each wasteshed as a separate data point, DEQ conducted multi-variate regression analysis to explore the relationship between per-capita generation and several possible variables, including per-capita income, population density, % of population living in urban settings (defined as either “urban areas” or “urban clusters” by the U.S. Census Bureau), and percent of households relying on wood as their primary source of heat. In no cases did population density correlate well with per-capita generation, suggesting that any statistical relationship between density and waste generation is weak.

Oregon Department of Environmental Quality Page 64 07-LQ-005
Percent urbanization yielded similar results except for one evaluation, where it was combined only with per-capita income. However, percent urbanization also correlates (inversely) with use of wood for heat, and when all three variables are considered together (urbanization, per-capita income, and wood heat), the relationship between urbanization and per-capita generation is no longer significant. Put differently, any relationship between urbanization and per-capita generation may well be explained by the lower use of wood for heat in urban areas. This impact on per-capita generation has already been estimated (above), and to avoid double-counting, the relationship between urbanization and per-capita waste generation cannot be further estimated. As such, while this hypothesis seems plausible, no data was identified that allows it to be readily evaluated. 7.9 Hypothesis #9: Relatively less waste is being disposed of using in-sink disposals Explanation: Food waste put down in-sink garbage disposals is not counted as part of waste generation. If households and businesses have shifted away from the use of in-sink disposals, more food would be entering the solid waste system, and would be contributing to the increase in waste generation. Evaluation: DEQ identified four Oregon-specific sources of data regarding residential use of in-sink disposals, as well as data from other studies and market share data for in-sink disposals in residential construction. Comparable data regarding non-residential practices was not identified, despite an information request submitted to the Board of Directors of Oregon ACWA (Association of Clean Water Agencies). The 1996 DEQ/Riley Research survey read to residents a list of methods of managing wastes, and asked if they used each one. In-sink disposals were not on the list, but 3% of respondents mentioned them anyway (when asked “Did I miss any disposal methods?”). The survey later asked an unprompted question regarding what households do with their food waste. This time, fully 16% named the garbage disposal as their first response. Urban and suburban residents (both 22%) were more likely than rural residents (11%) to provide this response. Unfortunately, a similar statewide survey has not been repeated so no trends can be observed. However, Metro’s 1998 and 2004 home compost surveys both asked about food scraps. Responses are shown in Figure 23.

Oregon Department of Environmental Quality Page 65 07-LQ-005
Figure 23. Household Use of In-Sink Garbage Disposals for Food Scraps, Metro (1998 and 2004)
All Users Use for
“Some” Use for “Half”
Use for “Most”
Use for “All”
1998 40% 11.2% 7.6% 7.2% 14.0%2004 51% 21.9% 8.7% 7.6% 12.2% These results suggest that the use of in-sink disposals as a method of discarding food scraps increased between 1998 and 2004, although more users are infrequent users, and the percentage of households using in-sink disposals for all of their food may have actually fallen slightly. Increasing use of in-sink disposals as reported by the Metro surveys is consistent with growing market share for these devices. Nationwide, the percentage of occupied housing units with an in-kitchen disposal grew from 42% in 1993 to 46% in 2001; in-sink disposals are included in about two-thirds of new residential construction.60 In the Portland Metropolitan Area (defined as Clackamas, Columbia, Multnomah, Washington, Yamhill, and Clark counties), the percentage of occupied housing units with an in-kitchen disposal grew from 52% in 1995 to 61% in 2002, and in-sink disposals were included in 87-88% of all new construction.61 Two other point estimates of garbage disposal use come from the City of Eugene and the City of Tucson. In a January 2006 survey conducted of residents eligible to participate in a pilot residential food waste collection program, between 9% and 16% of households reported not participating in the pilot project specifically because they prefer to use an in-sink garbage disposal.62 An innovative study in Tucson, Arizona, used techniques of contemporary anthropology to understand the quantity and causes of residential food loss. On-site interviews with 28 households found that nearly 40% reported using a garbage disposal. However, many of these same households said that they limited their use of the disposal to food that smelled bad or was “badly deteriorated.” According to the lead researchers:
“The view that garbage disposals are ‘inconvenient’ and that informants preferred to dispose of food waste in a trash can was an unexpected finding. There were informants in two households that said they did not use the garbage disposal because it was old and they were ‘worried that it would get stopped up.’ Another informant said that they hated
60 U.S. Census, American Housing Survey for the United States 1993 and American Housing Survey for the United States 2001. 61 U.S. Census, American Housing Survey for the Portland Metropolitan Area in 1995 and American Housing Survey for the Portland Metropolitan Area in 2002. 62 City of Eugene, Food Collection Pilot Project Survey Results, January 2006. Households in the pilot project were divided into two groups: those provided with collection buckets, and those not. Among households with buckets, 52% didn’t participate in the pilot project and of these 31% said they preferred to use an in-sink disposal. Among households not provided with buckets, 70% didn’t participate and of these 12.5% said they preferred to use an in-sink disposal.

Oregon Department of Environmental Quality Page 66 07-LQ-005
to use it ‘because it was just another mechanical device that could foul up.’ Most informants could not exactly explicate why the garbage disposal was seen as inconvenient. After watching and inquiring while some households cleaned up after dinner it appeared that disposing of food waste in the garbage disposal included more effort (and hence additional time) when compared to disposal in the trash can. Additionally, the increased effort created increased awareness about the amount of food waste, along with attached negative perceptions, in informant’s realities. This is an area in need of additional research.”63
The Tucson research suggests that the presence of an in-sink disposal doesn’t necessarily imply widespread use. In any event, the limited longitudinal data that does exist suggests that residential disposal use is actually up slightly. To estimate the impact on per-capita generation, DEQ began with an estimate that the average household generates 467 pounds of food per year.64 Using the Metro survey data, and assigning percentages of food waste sent to the sewer for each of the options in Figure 23 (some = 10%; half = 50%; most = 75%; all = 90%) DEQ estimated that in the Metro region, 0.36% of residential food generated shifted from garbage to sewer between 1998 and 2004. Extrapolating this finding statewide and assuming a constant annual shift between 1993 and 2002, DEQ estimates that increasing residential disposal use actually decreased per-capita waste generation by 1 pound/person. A second estimate used data from a University of Wisconsin study which concluded that the quantity of food wastes sent to landfill and sewer were roughly equal.65 Combining this with DEQ’s estimates of food waste landfilled and the same assumptions above regarding rates of shift leads to an estimate that increasing residential disposal use decreased per-capita waste generation between 1993 and 2002 by 3 pounds/person. As noted earlier, no data was identified regarding non-residential use of in-sink disposals, and therefore no estimate is developed. 7.10 Hypothesis #10: Construction, remodeling, and demolition activity has grown at a
rate higher than population Explanation: By DEQ’s rough estimate, approximately 22% of waste generated in 2002 was from construction and demolition (C&D) activities. An exact estimate is difficult to obtain; this rough estimate undercounts certain materials (all corrugated and scrap metal is excluded) but overcounts others (all wood waste, including wood packaging, is included). EPA estimates (see Section 4.4) that remodeling and demolition contribute about 90% of the total C&D wastes; construction activities themselves generate much less waste.
63 “Household Food Loss Perceptions: Results of the Household Interviews”, Timothy Jones, Andrew Bockhorst, Brian McKee, and Aida Ndiaye, January 2003. 64 “USDA Food Flows and Loss Report”, presented by Timothy W. Jones, Ph.D., at the BioCycle West Coast Conference 2006, Portland, OR, March 20 2006. 65 “A Brief Summary and Interpretation of Key Points, Facts, and Conclusions for University of Wisconsin Study: Life Cycle Comparison of Five Engineered Systems for Managing Food Waste”, William F. Strutz, In-Sink-Erator Corporation, 1998.

Oregon Department of Environmental Quality Page 67 07-LQ-005
C&D activities are driven by a variety of factors including:
• Employment/business growth. • Low interest rates. • The need for repairs (such as re-roofing) as the existing stock of buildings ages. • Rising wealth, particularly in the form of home equity and lines of credit used for
remodeling. • Increasing commercial activity (including tourism and second homes).
If construction, renovation, and demolition activities increased at a rate faster than population, then, all other things being equal, growth in the rate of C&D waste generation would be expected to contribute to rising per-capita generation of waste. Evaluation: DEQ’s 2002 estimate of C&D waste, albeit rough, shows generation rising from 341 pounds/person-year in 1993 to 601 pounds/person-year in 2002, for an average annual increase of 7%.66 This estimate excludes scrap metal and corrugated but includes all wood waste generated (including wood packaging). DEQ was not able to locate a single, comprehensive source of data on construction, renovation, and demolition activity for the entire state of Oregon, across both residential and commercial sectors. Data on renovation activity is particularly difficult to come by, as many renovation activities (such as re-roofing) are unpermitted. In lieu of permit, square footing, or housing start data, DEQ has chosen to use construction employment as a proxy measure for construction, renovation, and demolition activity.67 Regression analysis was used to compare DEQ’s estimates of annual per-capita C&D waste generation for the years 1993 – 2002 against employment in three different categories for the same time period:
• Construction of buildings; • Specialty trade contractors; and • All construction.
66 See Figure 3 and pages 12 – 15 of DEQ’s “2002 Oregon Solid Waste Characterization and Composition” report. This estimate of 601 pounds/person-year in 2002 includes approximately 11 pounds/person-year of bricks that were counted as recovery (and generation) at the time the 2002 Solid Waste Characterization and Composition report was published but that were subsequently removed from recovery (and generation) estimates. However, the revision in question only applied to the year 2002 and does not impact estimates of C&D generation for any other years in the time series. For the year 2002, the revision results in a downward adjustment of less than 2%. Thus, this revision is expected to have a minimal impact on the results of the regression analysis, and in the interest of staff time, the regression analysis was not repeated for this revised data set. The regression analysis described in this section is based on the pre-revision time series. 67 Employment may not be the best measure, since some employment activities (electricians and plumbers, for example) generate less waste per employee than others (general contractors, roofers, drywall installers). Shifts between these subcategories (for example, if more re-roofing is occurring relative to new construction) could cause waste generation per employee to change. Also, changes in construction practices (increased use of pre-manufactured components) might change the waste generation per employee as less labor is required over time. However, given the relatively short period of this study (1993 – 2002, or ten years), the impact of such changes is expected to be relatively small.

Oregon Department of Environmental Quality Page 68 07-LQ-005
The category of “all construction” includes “construction of buildings,” “specialty trade contractors,” and a third subcategory, “heavy and civil engineering construction.” Given that the wastes generated in this last subcategory are expected to largely consist of non-counting inerts, heavy/civil engineering construction was not evaluated by itself. The majority of employment (62% of “all construction” employment in 2003) is found among the specialty trade contractors, which include plumbing, heating, air conditioning, painting, electrical, masonry, tilework, driveway/sidewalk, plastering, drywall, carpentry, roofing, siding, and window trades. Since the dependent variable (per-capita C&D generation) is expressed in per-capita terms, employment was also converted to a per-capita basis (average annual employment per 1,000 Oregonians) for the sake of this analysis. The closest correlation (highest R2) observed was between specialty trade contractors and per-capita C&D waste generation (P = 0.002; adjusted R2 = 0.67). This demonstrates a statistically meaningful relationship between per-capita employment in the specialty trades and per-capita C&D waste generation, and that 67% of the year-to-year variance in per-capita C&D waste generation can be explained by employment in the specialty construction trades. Very good correlations were also observed when using per-capita employment in all construction (P = 0.008; adjusted R2 = 0.55) and construction of buildings (P = 0.035; adjusted R2 = 0.38), although adding “construction of buildings” and “specialty trade contractors” together does not improve upon the results for specialty trade contractors alone.68 Per-capita employment in the specialty trades increased between 1993 and 2002 (from 10.6 people per 1,000 Oregonians in 1993 to 14.1 in 2002), this suggests that construction, renovation and demolition activities also increased (at a rate faster than population growth), and that waste generation also increased during this same time period as a result of this increased activity. The results of the regression analysis are used to estimate the increase in C&D waste attributed to increasing employment (and thus activity), using the following steps:
• 2002 per-capita generation of C&D waste was assumed to equal 601 pounds (as referenced above).
• The simple regression analysis was used to derive a mid-point estimate that every increase in specialty trades employment of 1 person per 1,000 Oregonians would increase per-capita C&D generation by 46 pounds/year. Estimated low and high ends of the 95% confidence interval are 22 and 70 pounds/year, respectively.
• Between 1993 and 2002, the number of people employed in the specialty trades per 1,000 Oregonians grew from 10.6 to 14.1, or an increase of 3.5.
• This increase was multiplied by the factors above to estimate that increasing employment in the specialty trades between 1993 and 2002 (a proxy for increasing construction, renovation, and demolition activities) was responsible for 78 – 248 pounds/person of waste generation in 2002 (with a mid-point estimate of 163 pounds/person).
68 DEQ also conducted regression analysis using per-capita generation of C&D waste as the dependent variable and residential housing starts as the independent variable, and found no statistically meaningful correlation between the two.

Oregon Department of Environmental Quality Page 69 07-LQ-005
7.11 Hypothesis #11: As house sizes (measured in square feet) have grown, the per-capita generation of construction (and possibly demolition) waste has grown
Explanation: Average house size in the U.S. has grown steadily. Larger houses require more building materials and therefore lead to greater quantities of construction, renovation, and demolition debris. Evaluation: Without a doubt, average house sizes have increased. The average one-family house built in the Western U.S. was 2,050 square feet in 1993 and 2,350 square feet in 2002.69 Larger homes require more materials, although one might expect that as house sizes increase, economies of scale would reduce the material used per square foot of floor space. However, several sources suggest that the opposite is true: not only are houses becoming larger, but they are also using more material per square foot. According to an article in the Journal of Industrial Ecology:
“The U.S. National Association of Home Builders (NAHB) estimates the materials used in building a 2,082-square-foot (193-m2) single-family house to include 13,837 board-feet of framing lumber, 11,550 square feet (1,073 m2) of sheathing, and 16.92 tons (15,350 kg) of concrete. One would expect that, relative to material use, there would be an economy of scale as house size increased -- that material use per unit area of floor area would drop as floor area increased. But that is not necessarily the case, according to Gopal Ahluwalia, the director of research at NAHB. Although NAHB has not compiled data on material use as a function of house size, Ahluwalia believes that, because larger houses tend to have taller ceilings and more features, larger houses may actually consume proportionally more materials. He estimates that a new 5,000-square-foot house will consume three times as much material as the 2,082-square-foot house NAHB has modeled, even though its square footage is only 2.4 times as large. Even if Ahluwalia's intuition is not correct and larger houses are more material-efficient per unit area of floor, the higher ceilings and added features in large houses may mean that material use efficiency improvements with increased floor area of a house are not proportionate -- that is, that the increased material efficiency one would expect from purely geometrical calculations is not realized. The use of lumber, structural panels, and nonstructural panels in new houses . . . has increased steadily between 1950 and 1992, as houses have grown in size. But when we examine total wood use per unit of floor area, we find that it dropped between 1950 and 1970 -- perhaps due to the substitution of plywood sheathing for board sheathing and the introduction of more wood-efficient roof trusses. Then, around 1970, wood use per square foot of floor area began to increase again, and by 1992 it was up about 12% from the low point. Exactly why this is occurring is not clear; it could result from an increasing use of 2×6s instead of 2×4s for wall framing, or a shift to more complex geometries.”70
69 U.S. Census; viewed 3/31/06 at http://www.census.gov/const/C25Ann/sftotalmedavgsqft.pdf. Interestingly, while the general trend of house size was upward since 1973 (when the data set begins), decreases were observed in 1974-1975, 1979, 1983, 1985, and 1991-1994. 70 Alex Wilson and Jessica Boehland, “Small is Beautiful: U.S. House Size, Resource Use, and the Environment”, in the Journal of Industrial Ecology, Volume 9, Issues 1-2, 2005.

Oregon Department of Environmental Quality Page 70 07-LQ-005
Larger buildings coupled with more material-intensive design and construction practices represents a double-whammy for C&D debris generation: not only are buildings larger, more materials are also being used on a per square foot basis. The impact of this trend on C&D debris generation will be long-lasting, since the large majority of materials purchased for use in construction don’t become wastes until renovation and demolition occur (see Section 4.4). Estimating the contribution of this shift on waste generation is difficult and not within the resources available for this report. Some of the increasing tonnage of waste associated with larger and more resource-intensive construction is likely already reflected in the estimate for hypothesis #10. 7.12 Hypothesis #12: As house sizes (measured in square feet) have grown, there is
greater acquisition of durable goods/furnishings (and resulting waste), as “stuff expands to fill the available space”
Explanation: Average house size in the U.S. has grown steadily, while the number of people living in an average household has trended downwards. This means that the average American has more floor space than ever before. Two- and three-car garages and “bonus rooms” are common in new construction, and facilitate the accumulation (and hence, acquisition) of stuff, which eventually becomes solid waste. Evaluation: As noted in Hypothesis #11, the size of newly constructed homes increased during all but one year of the period 1993 - 2002. As older homes are more likely to be demolished than newer homes, this suggests that the average size of occupied single-family homes has been increasing. That such an increase would translate into greater acquisition of household furnishings (and eventually, more waste) seems intuitive, although the assumption would benefit from more evaluation. Not only do larger floor plans allow for more acquisition, but homes may be more cluttered and “full” than they used to be. Evidence of this trend includes the relatively new employment phenomena of “household organizational consultant” and this author’s anecdotal observation of increasing prevalence of urban garages bursting at the seams and “clutter rooms” (typically a guest bedroom) full of stuff.71 These all suggest that not only are larger homes leading to increasing consumption (and waste), but that the quantity of materials acquired per square foot of home space may have also increased. However, DEQ did not identify any readily available data that allows this causation to be confirmed and its quantitative impact on waste generation estimated.
71 Not only do garages appear to be “more full”, they are also larger. In 1967, 48% of new single-family houses had garages for two or more cars; by 2002, that figure had jumped to 82% (source: Alex Wilson and Jessica Boehland, op. cit.).

Oregon Department of Environmental Quality Page 71 07-LQ-005
7.13 Hypothesis #13: The average number of people per household has fallen, resulting in higher per-capita waste generation due to losses in “efficiency of scale” in household economies
Explanation: The long-term demographic trend in Oregon and the U.S. is smaller families and households. Some residential waste generation is a function of number of people (for example, doubling the number of people in a home may double the consumption – and waste – of dental floss, facial tissues, and other items that are not typically shared). However, some waste generated by households does not increase linearly with household size. A house on a single-family lot with four residents is unlikely to generate twice as much yard waste as the same house on the same lot with only two residents. Similarly, newspaper and magazine readership (and waste) doesn’t double as the household population doubles, because family members share some publications. Thus, as household size falls, per-capita waste generation tends to rise. Evaluation: According to the U.S. Census, the average household size in Oregon fell by only a sliver – from 2.52 people in 1990 to 2.51 people in 2000. This change is likely not large enough to explain much, if any, of the increase in per-capita waste generation observed between 1993 and 2002. 7.14 Hypothesis #14: Durable goods are less durable and/or less likely to be repaired or
reused Explanation: Durable goods are broadly defined as consumer items with lifetimes of three years or longer. They include large and small appliances (including consumer electronics), furniture, furnishings (dishes, linens), carpets and rugs, hardware/tools, rubber tires, and lead-acid batteries. According to the EPA, in 2003 durable goods comprised 17% of total MSW (excluding C&D debris) and were also growing at a rate faster than non-durable goods, packaging, or organics. Many people complain of the lack of quality and “workmanship” in new durable goods, particularly goods made overseas, suggesting that so-called “durable goods” are in fact, less durable than they used to be. In addition, there are fewer repair options for durable goods, and the cost of repair is often prohibitive when compared to the cost of replacement (particularly as some items have become more difficult to repair). Time scarcity among U.S. households compounds this problem, as buying used or having an item repaired often requires more time than buying a new replacement item. Evaluation: This hypothesis actually combines two separate ideas: a) that durable goods are less durable; and b) durable goods are less likely to be repaired or reused. Reduced Durability. A cursory Internet search revealed very little literature on actual declines in product durability over the past fifteen years. However, one fascinating study suggests that, in fact, many durable goods are lower quality and less long-lasting than they used to be, in part because of the shift in manufacturing overseas, and specifically, toward China.72 72 Marc J. Schniederjans, Qing Cao, and John R. Olson, “Consumer Perceptions of Product Quality: Made in China”, in the Quality Management Journal, Volume 11, Number 3, 2004.

Oregon Department of Environmental Quality Page 72 07-LQ-005
Three U.S. professors undertook an e-mail survey of 912 people (“consumers”) in the U.S. Survey respondents were asked about their experience with recently-purchased goods made in China. (The authors describe a massive shift in recent years resulting in many U.S. consumers now having “no choice but to choose Chinese-made products because of the dominance of Chinese-made products in the market.”) The survey focused on durable goods as well as clothing. Among other questions, consumers were asked about the actual durability of the product, versus their expectation of what the durability should have been based on their experience or perception purchasing goods not made in China. Although these results are based on a combination of real experience as well as perceptions, the authors cite other research demonstrating that product durability can be accurately measured by consumer perceptions. Sufficient responses were obtained to conduct statistical analysis on 51 different products, running the gamut from chairs and tables to various consumer electronics, clothes, hardware, and toys. In all 51 categories, the mean duration for Chinese goods was lower than the mean duration for non-Chinese goods. In most cases, non-Chinese goods were, on average, rated to last more than twice as long as similar goods made in China.73 Coupled with the massive flood of Chinese goods in the U.S. marketplace (in 1993, the U.S. imported $31.5 billion from China; by 2002 imports had grown to $125.2 billion, and surged to $243.4 billion in 200574), this data on consumers’ perceptions and experience with Chinese vs. non-Chinese goods suggests that durable goods are, in fact, becoming less durable. Decline of Repair and Reuse. One measure of the possible decline of repair and reuse is to compare employment in various repair/reuse industries. Figure 24 illustrates that some repair/reuse industries have gained employment, while others have lost, comparing the years 1993 and 2000. Since Oregon’s population grew during this same period, a more useful metric is not total employment but rather employment per million Oregonians.
73 For example, the mean expected duration for telephones was 88 months if not made in China, but 20 months if made in China. Non-Chinese towels were given a mean expected duration of 60 months, compared to 30 for Chinese-made towels. The only category where Chinese-made goods had mean lifetimes within 20% of non-Chinese goods was in the category of nonelectrical toys (Chinese products: 10.9 months; non-Chinese products: 12.2 months). 74 http://www.census.gov/foreign-trade/balance/c5700.html#2004

Oregon Department of Environmental Quality Page 73 07-LQ-005
Figure 24. Oregon Employment in Reuse/Repair-Related SIC Codes75
Average Employment Average Employment per
1,000,000 Oregonians Industry Sector (SIC Code)
1993 2000 1993 2000 % change Used merchandise stores (5932)
1,407 1,978 460 576 +25%
Computer maintenance and repair (7378)
366 459 120 134 +12%
Motor vehicle parts, used (5015)
687 837 225 244 +8%
Watch, clock and jewelry repair (7631)
66 80 22 23 +8%
Tire retreading and repair shops (7534)
273 226 89 66 -26%
Reupholstery and furniture repair (7641)
262 201 86 58 -32%
Radio and TV repair (7622) 514 356 168 104 -38% Electric repair shops, not elsewhere classified (7629)
1,062 690 347 201 -42%
Refrigeration service and repair (7623)
171 105 56 31 -45%
Totals 4,808 4,932 1,572 1,435 -9% Certain sectors – used merchandise stores, computer maintenance and repair, used motor vehicle parts, and watch/clock/jewelry repair – saw increases in per-capita employment between 1993 and 2000. The increase in employment in used goods retailing is not surprising, given the recent dramatic changes in clothing manufacture and retailing, as described by the Worldwatch Institute:
“In 1920, the average U.S. household spent 17 percent of its total expenditures on clothing. In 2001, the figure was a mere 4.4 percent, despite the fact that consumers were buying far more garments. Indeed, clothing has become so cheap that it is hard to give away. The surfeit of clothes is largely attributable to the exploitation of female labor in apparel factories throughout Asia and Central America. Labor’s share of production is at historically low levels . . . Developments in the new global economy have exacerbated these problems. The Asian financial crisis of the late 1990s . . . led a number of Asian economies to collapse. Wages throughout the region plummeted after the crisis. Wal-Mart, which controls 15 percent of the U.S. apparel markets and is the world’s largest clothing retailer, continuously squeezes labor costs in Chinese factories . . . workers have had little success resisting these conditions, because the transnational companies go
75 Data from Oregon Employment Department, www.qualityinfo.org.

Oregon Department of Environmental Quality Page 74 07-LQ-005
elsewhere if workers make demands and because factory owners enjoy political protections from their governments . . . Meanwhile, these factors have led to declining prices in the United States, where apparel prices fell by 10 percent over the last decade, with an especially sharp drop after the Asian downturn. The number of garments purchased has skyrocketed, increasing a stunning 73 percent between 1996 and 2001. Consumers reduced how frequently they wear new items and discarded their purchases at record rates. By 2001, the average U.S. consumer purchased 48 new pieces of apparel a year. Goodwill officials report that rates of consumer discard rose by 10 percent a year throughout the 1990s. Clothing became a disposable, and hence freely available, good.”76
Similarly, increases in the category of “computer maintenance and repair” likely reflects in part the growing use of computers. As shown in Figure 24, these gains were offset by steeper declines in “mainline” repair industries: tire retreading, furniture repair and reupholstery, and the service/repair of televisions, radios, refrigerators, and other electronics. Oregon’s experience is reflective of larger national trends. According to the Professional Service Association, the number of electronics-repair shops has fallen from 20,014 in 1992 to 7,168, while the number of appliance repair shops fell from 18,546 to 11,620. Besides the dwindling number of repair shops, other factors contributing to declining repairs include the following:77
• The price of new products is relatively low, due to the flood of imports. Prices for desktop computers have dropped by about $400 between 2001 and 2005, and the prices of over-the range microwave ovens and top-freezer refrigerators fell about $200 each during the same period.
• Older appliances use more energy. Today’s refrigerators are up to 30 percent more energy-efficient than those sold in 2001; subsequently, utility and other conservation programs are more active in encouraging consumers to upgrade appliances.
• New high-tech appliances and electronics products are more challenging and expensive to repair.
Impact on Per-Capita Generation While this hypothesis clearly seems reasonable, estimating the impact of these changes on per-capita generation is very difficult and would require additional resources.
76 Juliet Schor, “U.S. Consumers, Cheap Manufacturers, and the Global Sweatshop”, in State of the World 2004, The Worldwatch Institute, p. 117. 77 From a summary of an October 2005 Consumer Reports article, cited in a Waste Prevention Forum (a service of the National Waste Prevention Coalition) list-serve e-mail dated September 13, 2005.

Oregon Department of Environmental Quality Page 75 07-LQ-005
7.15 Hypothesis #15: Packaging is more “wasteful” Explanation: Packaging and containers comprised 32% of U.S. generation of MSW (excluding C&D debris) in 2003, according to the EPA. Packaging is a highly visible component of the waste stream, and the generation of packaging waste underwent dramatic increases during the 1960s, 1970s, and 1980s (see Figure 11). Nearly everyone in the waste reduction field can share at least one example of “outrageously wasteful packaging” they’ve recently experienced, suggesting that some of the increase in Oregon’s per-capita generation of waste is attributed to packaging. Evaluation: DEQ’s model of Oregon-specific waste generation does not provide very accurate data for packaging, primarily because of the manner in which information is reported in the material recovery survey. In contrast, the U.S. EPA treats containers/packaging as one of four major categories in its waste generation estimates. EPA’s results are counter-intuitive for many: per-capita generation of containers and packaging actually fell by 4% between 1992 and 2003, from 534 to 514 pounds per person per year. EPA provides several examples of how packaging materials have been “lightweighted” over the last several decades, including the following:
• Plastic milk jugs weigh 30% less than they did 20 years ago.78 • The weight of aluminum cans has decreased by 52 percent since 1972—29 cans can be
made from a pound of aluminum, up from 22 cans in 1972.79 Why the apparent disconnect between EPA’s data and the opinions of many consumers (and waste professionals)? Possible explanations include the following:
• EPA’s data might be incorrect. In particular, as more consumer goods in the U.S. are imported from other countries, as opposed to using packaging made in the U.S., EPA’s method for estimating packaging waste generation may be becoming less accurate.
• The number of packages is increasing even as the weight of those packages is decreasing. For example, the number of plastic beverage bottles disposed of in Oregon grew from 148 million in 1998 to 238 million in 2002 – a 61% increase in just four years, which is suggestive of a significant increase in use. As explained in Section 6, U.S. manufacturers continued to squeeze materials out of packaging throughout the 1990s, either through lightweighting or substituting plastic for heavier materials. As a result, many consumer packages are less heavy than they once were. Consumers, however, might not be aware of this “lightweighting,” and are responding to real tactile and visual experiences of increasing packaging.
• Per-capita generation of packaging waste generation grew dramatically between 1960 and 1990, and some people may be reacting to that change, assuming that it has continued unabated through the 1990s and into the 21st century.
• Packaging has become less recyclable, particularly as plastic has grown in both market share and total per-capita generation. (Per-capita waste generation of plastics in packaging and containers grew at an average annual rate of 2.1% between 1994 and 2003.) The increase in difficult-to-recycle plastics may cause some to conclude that overall packaging generation is increasing.
78 http://www.epa.gov/epaoswer/non-hw/muncpl/plastic.htm, viewed April 12, 2006. 79 http://www.epa.gov/epaoswer/non-hw/muncpl/alum.htm, viewed April 12, 2006.

Oregon Department of Environmental Quality Page 76 07-LQ-005
• Consumers are more aware of packaging because they’re experiencing greater quantities of it, particularly as catalog and Internet shopping have grown in popularity. Shifts from traditional “storefront” shopping to on-line shopping shift packaging waste from retail stores to households.
In conclusion, certain types of packaging waste are increasing. However, unless EPA’s numbers are mistaken, per-capita generation of packaging is no longer increasing. Even as more packaged goods are being sold, and consumers have more tactile experiences with packaging (including over-packaging), these increases have been offset, at least in part, by shifts in materials and improvements in packaging technology that have allowed packaging materials to be “lightweighted.”80 7.16 Hypothesis #16: People are buying more goods (as incomes have risen and prices of
many goods have fallen) and as a result, generating more waste Explanation: As shown in Figure 5, acquisition is one of the primary sources of waste. During the study period (1993 – 2002), average incomes rose and the price of some goods fell, making goods more affordable. As a result, waste generation increased. Evaluation: Average per-capita incomes in “real” (2000), or inflation-adjusted, terms rose $3,040 in Oregon, from a statewide average of $24,670/person in 1993 to $27,710/person in 2002.81 This represents a 12% increase in average real incomes (after inflation).82 Most counties saw increases in average per-capita real income, although real incomes fell in several eastern Oregon counties (Gilliam, Sherman, Malheur, Harney, Jefferson, Lake, and Wheeler). Because these numbers are expressed in “real” terms, they account for inflation, including potential reduced costs for certain consumer goods. However, the use of any inflation adjustment is based on a “market basket” estimation. Falling prices for many “waste-generating” consumer goods may be masked by rising costs in other categories of consumer expenditures, such as housing, medical care, education, energy, and transportation. As such, consumer goods may have become even more affordable than these statistics suggest. Comparison of average annual per-capita real incomes and annual average per-capita waste generation for each of the years 1993 – 2002 for the state as a whole reveals a striking correlation (P-value of 0.0000005; adjusted R2 = 0.959). A statistically-meaningful correlation between real per-capita income and per-capita waste generation was also observed when comparing
80 EPA’s reported slowing of growth – and recent declines – in per-capita generation of packaging waste does not, however, indicate that opportunities for further reductions in this category no longer exist or are not desirable. For the purposes of this report, the reduction in per-capita generation is presented merely in the context of exploring why Oregon’s overall rate of MSW generation has grown. 81 “Personal income” is defined as “the income that is received by all persons from all sources. It is calculated as the sum of wage and salary disbursements, supplements to wages and salaries, proprietors' income with inventory valuation and capital consumption adjustments, rental income of persons with capital consumption adjustment, personal dividend income, personal interest income, and personal current transfer receipts, less contributions for government social insurance.” 82 It is important to note that these statistics are for the average Oregonian. Even as average incomes rose, economic stratification has worsened. Real incomes for many lower- and middle-income households have not kept pace with the average, and in some cases real incomes have declined.

Oregon Department of Environmental Quality Page 77 07-LQ-005
wastesheds against each other (see Section 3.3.1). Using statewide results, regression analysis suggests that every $1,000 increase in real per-capita income will cause per-capita waste generation to rise by 177 pounds/year, with a 95% confidence range of 149 – 205 pounds/year. Applying this finding to the $3,040 increase in per-capita real incomes between 1993 and 2002 (statewide) leads to a predicted increase in per-capita generation of 539 pounds/person (with low and high estimates corresponding to the 95% confidence range end-points of 453 and 624 pounds/person). However, the relationship between rising real incomes and rising per-capita generation is not necessarily entirely a result of increasing acquisition and consumption of goods. Incomes can be spent in a variety of ways, including the following:
• Consumption of goods • Consumption of services • Taxes • Savings • Investments
Increases in incomes may be spent more on services than goods. For example, some of the increase in construction/demolition debris evaluated earlier was probably a result of rising incomes being spent not entirely on goods, but also on paid construction and remodeling services (as reflected in rising per-capita employment in the specialty construction trades). Similarly, rising incomes may cause households to burn less garbage outdoors and/or indoors (since more disposable income becomes available to pay for garbage removal service and/or other sources of heat). Rising incomes may also increase the per-capita generation of landscaping, both as landscaping becomes more intensive, and as on-site self-management is replaced with removal by a paid landscaping service. Thus, some of the impact of rising incomes on waste generation may already be reflected in the hypotheses evaluated previously in this report. As evidence that rising incomes do not always translate into rising acquisition of goods, retail sales in Oregon failed to grow at the same rate as incomes during the period 1992 – 2002: real per-capita incomes grew 13% (from $24,480 to $27,710), while in-state per-capita real retail sales only grew 2% (from $10,280 to $10,470).83 Of course, this same period saw significant growth in on-line retailing, so purchases by Oregonians are increasingly no longer occurring at Oregon retailers, and are becoming more difficult to estimate. Two other attempts to study the relationships between incomes, expenditures, and waste generation should be mentioned. An unpublished report by John Walsh for the City of Portland applied statistical techniques to estimates of in-city MSW generation for the time period 1986 – 1995. Using multiple regression analysis, it found that population and per-capita income, together, explained 78% of the year-to-year variance in per-capita generation (R2 = 0.78).84 The second evaluation, described in Section 6, used regression analysis to determine the relationship
83 Personal income estimates form U.S. Department of Commerce, Bureau of Economic Analysis. Retail sales estimates form U.S. Department of Commerce, Economic Census. Retail sales data are only available for 1992, 1997, and 2002. 84 “Waste Generation Model Report”, prepared by John P. Walsh for the City of Portland. No date; likely circa 1996.
Oregon Department of Environmental Quality Page 78 07-LQ-005
between MSW generation (as defined by EPA) and a variety of national statistics, including population, wages, nominal and real gross domestic product (GDP), and nominal and real personal consumption expenditures (PCE) for the time period 1960 to 1994.85 This evaluation found that real (inflation-adjusted) PCE had a greater correlation with MSW generation than wages. Unfortunately, PCE data is not available for the State of Oregon. Thus, given the data sets and limitations identified above, DEQ cannot state that the estimated increase in per-capita generation of 453 – 624 pounds/person associated with rising real incomes is entirely a consequence of increased acquisition of goods. Likely some fraction of this estimate is a result of increasing acquisition of goods (linked to increasing real incomes), as opposed to increasing remodeling, reduced burning, etc. However, that fraction is difficult to estimate. 7.17 Qualitative Review of Other Causes of Increasing Acquisition and Waste While difficult to evaluate and even more difficult to quantify, the literature suggests some other possible reasons why solid waste – and its corollary, acquisition – is on the rise in the U.S. Briefly, other possible explanations include the following:86
• Increased demand by consumers, resulting from advertising, changes in cultural norms, changes in social influences (style, status), physiological impulses (physical pleasure derived from consumption), and psychological associations (emotional pleasure derived from consumption). o Some writers suggest that increasing acquisition is a consequence of the decline in
social capital and interaction in the U.S., which in turn is a consequence of time limitations (driven by long work hours, more two-earner families), residential sprawl, and higher rates of television viewing.
o Others suggest that increasing income inequality is partly to blame, as the rising gap between rich and poor (and decline of the middle class) generates an “envy machine.” After “the rich and super-rich began a bout of conspicuous luxury consumption” in the early 1980s, Juliet Schor reports, members of “the upper middle class followed suit with their own imitative luxury spending...” In turn, the 80% below who lost ground also “engaged in a round of compensatory keeping-up consumption.” This reflects what Juliet Schor refers to as the “New Consumerism,” a shift from “keeping up with the Joneses” (one’s neighbors and peers) to instead comparing oneself against the lifestyles and consumption patterns of top income earners. An upward bias in media images of the “normal household” have also contributed to this shift.
85 “National Source Reduction Characterization Report For Municipal Solid Waste in the United States”, US EPA, November 1999. 86 For example, see The Worldwatch Institute, “State of the World 2004: Special Focus – The Consumer Society”; “The Politics of Consumption: An Interview with Juliet Schor”, viewed 5/15/06 at http://aurora.icaap.org/2004Interviews/JulietSchor.html and Gar Alperovitz, “Time to Get Serious About Inequality and Sustainability”, viewed 5/15/06 at http://www.greens.org/s-r/38/38-17.html.

Oregon Department of Environmental Quality Page 79 07-LQ-005
o In 2000, American workers could produce in 12 hours what took 40 hours in 1950. Faced with this reality, people could have chosen to reduce their work hours and live as they did in the 1950s – but for the most part, Americans followed the path of increasing consumption.87 Put differently, the benefits of increasing worker productivity have been channeled almost exclusively to increasing consumption (as opposed to reducing labor). This in turn creates a treadmill of increasing consumption. The more people work, the more difficult it is to create satisfying leisure time. Increasing hours spent at work ironically also leads to increasing time spent watching television, which in turn is correlated to increases in consumption.
• Increased supply of goods available at lower prices, resulting from huge increases in production and resource extraction efficiency, reduced tariffs (a consequence of globalization), cheaper labor (another consequence of globalization), cheap energy and improved transportation (resulting in lower distribution costs), and rapid turnover of new products (in electronics, tied to Moore’s law). Increasing capital investment in production contributes to this supply glut. Overcapacity in production demands that consumption be stimulated in order for industries to recover their investments of capital.
• Increased availability of credit. U.S. consumer debt is now growing twice as fast as incomes, and the household savings rate is now in negative territory – U.S. households, on average, are spending in excess of their incomes.88
• Economic subsidies and government policies (for example, tax subsidies for roomy suburban homes in low density developments).
7.18 Summary of Hypotheses Each of the hypotheses discussed above are summarized in Figure 25. It is essential to understand that the several hypotheses, while deemed reasonable, did not lend themselves to estimated impacts on growth in per-capita generation, given limited data and resources for analysis. Even when estimates are provided, these estimates are very rough and far from definitive. They represent the first published attempt to quantitatively dissect the causes of increasing waste generation in Oregon. Further analysis and evaluation could very well prove some of the estimates to be mistaken.
87 During this same time period, even as incomes rose, Americans’ sense of well being did not. According to the Worldwatch Institute, “In the US . . . the average person’s income more than doubled between 1957 and 2002 (in real terms), yet the share of people reporting themselves to be ‘very happy’ over that period remained static.” Rather, multiple studies show that happy people tend to have strong, supportive relationships, a sense of control over their lives, good health, and fulfilling work. 88 http://www.bea.gov/bea/newsrel/gdpnewsrelease.htm

Oregon Department of Environmental Quality Page 80 07-LQ-005
Figure 25. Summary of Hypotheses
Hypotheses Reasonable? Likely Contribution to
Increase in Per-Capita Generation, 1993 –
2002 (pounds/person-year)
1. Volume-based estimates of weight systematically underestimate actual tonnages; reported tonnages have risen because volume-based estimates have been replaced with scales
Not very -13 to +21 pounds/year89
2. Material recovery survey has become more comprehensive and/or thorough
Yes +55 pounds/year
3. Scrap metal recyclers and DEQ have been inconsistent in their application of the “post-consumer” definition.
Yes +21 to +32 pounds/year90
4. Other changes in “what counts” have caused generation to change
Yes (tire residue)
+3 pounds/year
Subtotal, Reporting Changes/Inconsistencies +66 to +111 pounds/year (11 – 19% of total)
5. In response to more convenient yard waste collection opportunities, residents are home composting and grasscycling less.
Yes, but data is limited and doesn’t strongly support hypothesis
0 to +11 pounds/year
6. People are burning less waste outdoors Limited data; somewhat supports hypothesis
+18 to +38 pounds/year
7. People are burning less waste indoors. Yes +14 to +69 pounds/year 8. On-site accumulation of waste has decreased Insufficient
data N/A91
9. Relatively less waste is being disposed of using in-sink disposals.
No; residential data suggests the opposite
-1 to -3 pounds/year92
Subtotal, Shifts in Waste Management +29 to +117 pounds/year (5 – 20% of total)
89 For shifts in disposal reporting only. Shifts in reporting of recovered materials are not estimated but their impact, if any, is likely small (as described in Section 7.1). 90 The estimate for hypothesis 3 already accounts for scrap metal’s contribution to the estimate of hypothesis 2, in order to avoid double-counting. 91 While there is a statistical correlation between urbanization and per-capita waste generation (counties with more urban populations also have higher per-capita generation), DEQ did not identify any firm evidence that rural counties have lower waste generation because more wastes are being stockpiled or illegally disposed on site. 92 Residential only; non-residential data not available.

Oregon Department of Environmental Quality Page 81 07-LQ-005
10. Construction, remodeling, and demolition activity
has grown at a rate higher than population, leading to more waste
Yes +78 to +248 pounds/year
11. As house sizes (measured in square feet) have grown, the per-capita generation of construction (and possibly demolition) waste has grown
Yes Insufficient data; partially included in #10, above.93
12. As house sizes (measured in square feet) have grown, there is greater acquisition of durable goods/furnishings. “Stuff expands to fill the available space.” Eventually this leads to higher waste generation.
Yes Insufficient data to estimate in isolation.
13. The average number of people per household has fallen, resulting in higher per-capita waste generation due to losses in “efficiency of scale” in household economies.
Barely Too small to estimate.
14. Durable goods are less durable and/or less likely to be repaired or reused
Yes Too difficult to estimate in isolation.
15. Packaging is more “wasteful” Unclear; seems unlikely
N/A
16. People are buying more goods (as real prices have fallen, incomes have risen)
Yes Too difficult to estimate in isolation.
Subtotal, Real Increases in Consumption and Use (very incomplete)
+78 to +248 pounds/person (incomplete)
Grand Total, all categories (incomplete)
+173 to +476 pounds/person [midpoint: +324]
Actual Observed Increase +580 pounds/person 7.18.1 Hypotheses DEQ found evidence to support most of the hypothesis behind the causes of increasing per-capita generation. However, a few hypotheses were disproven, or remain questionable:
• Hypothesis #1: DEQ was unable to demonstrate that the shift from volume- to weight-based reporting of waste disposal necessarily caused an artificial increase in per-capita waste generation, although this remains a possibility. Even if it did cause an increase, the relative impact is likely small (upper estimate of 21 pounds/person out of 591 pounds/person increase observed between 1993 and 2002).
• Hypothesis #5: Data was lacking to support the oft-reported “yard debris effect,” where the introduction of off-site yard waste composting opportunities causes households to cease on-site stockpiling or home composting of yard debris, and thus increase per-capita generation. Evaluation using what limited data was available resulted in a smaller estimated impact on per-capita generation than was expected.
93 See Section 7.11. Some of the increase in waste generation associated with the trend toward larger and more resource-intensive construction is already included in the estimate for hypothesis #10.

Oregon Department of Environmental Quality Page 82 07-LQ-005
• Hypothesis #9: What limited data was found suggests that households may be increasing their use of in-sink disposals, so it seems very unlikely that this behavior has caused per-capita generation to rise. Information on commercial in-sink disposal use was not found.
• Hypothesis #13: While the average number of people per household has fallen, the decline has been so slight that its impact on per-capita generation is likely very small.
• Hypothesis #15: Popular wisdom to the contrary, and despite increasing consumer exposure to certain types of packaging (plastics and e-commerce/catalog packaging), EPA data suggests that per-capita generation of packaging waste (on a weight basis) actually fell slightly during the study period (1993 – 2002).
It is important to note that the list of hypotheses evaluated above is not necessarily comprehensive. There are likely a variety of other reasons, not identified in this report, that help to explain why reported per-capita generation has increased. 7.18.2 Relative Impacts on Per-Capita Generation One of the central reasons for conducting this evaluation was to better understand how much of the reported increase in per-capita generation is truly a result of increases in “wasting,” as opposed to improvements or changes in reporting, or shifting of wastes from “non-counting” to “counting” handling methods. DEQ’s evaluation of the relative magnitude of these contributors to increasing per-capita generation is limited by several factors:
• The list of hypotheses evaluated is not comprehensive. • Insufficient data existed to generate estimates of the impact on per-capita generation of
several hypotheses, particularly those involving increases in acquisition and use of goods. • Even where estimates were generated, in many cases these estimates were based on very
limited analysis, a result of sparse data and/or insufficient time and resources to conduct a more robust evaluation.
As such, the estimates contained in Figure 25 should be considered to be very rough. However, despite these limitations, they do provide the first published estimate of the causes of increasing waste generation in Oregon. Findings specific to the reported increase in per-capita generation between 1993 and 2002 of 591 pounds/person-year include the following:
• An estimated 11 – 19% of the increase (66 – 111 pounds) is attributed to changes in the reporting of waste data (hypotheses #1 - #4). This estimate is fairly complete, although some uncertainty persists particularly involving scrap metal recycling numbers.
• An additional 5 – 20% of the increase (29 – 117 pounds) is attributed to shifts in the management of wastes, from “non-counting” methods such as burning and home composting to “counting” methods such as centralized composting and disposal (hypotheses #5 - #9). This estimate is moderately complete but drawn from limited data, and is missing estimates involving on-site accumulation. Actual impacts may be higher than estimated.
• Combining these two estimates suggests that perhaps somewhere between 16% and 39% – possibly higher – of the observed increase in per-capita generation is caused by factors other than increases in “wasting” activities.

Oregon Department of Environmental Quality Page 83 07-LQ-005
• Assuming the previous estimate is a little low, then perhaps 50% - 80% of the observed increase in per-capita generation is actually caused in increases in waste-generating activities (hypotheses #10 - #16, plus others not identified).
• One important factor was the increase of construction, renovation, and demolition activities, which contributed between 13% and 43% (78 – 248 pounds) of the increase in per-capita generation. By a separate estimate (see Section 7.10), C&D materials grew by 260 pounds/person during the study period, although this estimate excludes corrugated and scrap metal, while including wood from all sources.
• The remaining increase in per-capita generation likely resulted from other activities and causes, including increased purchase of household furnishings (associated with larger house sizes), decreases in the durability and repair of durable goods, and other increases in consumption buoyed by rising incomes, falling prices, increased access to credit, increased marketing, changes in social norms, and other factors.
A comparison of the results of Figure 25 and the observed changes in waste generation shown in Figure 7 is illustrative. According to Figure 7, most of the 580 pounds/person increase in per-capita generation between 1993 and 2002 was likely caused by growth in a few select materials:
• wood (139 pounds/person), • yard debris (114 pounds/person), • metal (113 pounds/person), • “other inorganics” such as wallboard, concrete, soil, brick, and porcelain (79
pounds/person), • the mixture of roofing/tarpaper/other organics (up 75 pounds/person), and • plastics (41 pounds/person).
Much of the supposed increase in per-capita generation of metal can be explained by hypotheses #2 and #3, albeit at the high end of the estimates for those hypotheses. Other increases in scrap metal generation, along with increases in wood, roofing/“other organics,” and “other inorganics” are all suggestive of increases in C&D activities. The observed increase in yard debris generation is consistent with the findings of hypotheses #5 - #7, although these estimates by themselves under-predict the magnitude of the observed increase. This suggests that either the estimated impacts of hypotheses #5 - #7 are too low, hypothesis #8 (reduced on-site stockpiling) is significant, or there are other causes for increasing generation of yard debris (such as more intensive landscaping and/or pruning/cutting). In conclusion, Figures 7 and 25 draw pictures of increasing waste generation that are, at the broad level, fairly consistent with each other: a real increase in waste associated with a real increase of construction, renovation, and demolition activities, coupled with reported increases in yard waste, inerts, and scrap metal generation, which are at least partially attributable to changes in reporting and shifts in waste management (reduced burning, etc.). One area where these analyses are less consistent is in manufactured goods other than C&D materials (and metal). Figures 7, 11, and 13 suggest relatively little increase in the per-capita generation of these materials (except plastics). EPA suggests that among the broad categories of MSW, generation of durable goods (as waste) increased the most between 1990 and 2003, which

Oregon Department of Environmental Quality Page 84 07-LQ-005
would be consistent with DEQ’s hypotheses #12 (more furnishings), #14 (lower durability), and #16 (increased consumer spending). Estimates that were quantified in Figure 25 only add up to 173 – 476 pounds/person, and thus fail to explain the full increase in observed generation of 580 pounds/person. This suggests that either the estimates in Figure 25 are low, or the hypotheses without estimates are significant (such as hypothesis #16, increased consumer spending). This leaves open the possibility that increasing consumption of manufactured goods is driving some of the increase in per-capita generation, without proving that this is a significant factor one way or the other. Again, EPA’s findings (which are likely incomplete with regard to imported goods) suggest increasing generation of durable goods, and a very small increase in generation of non-durable goods, during the period 1992 – 2003 (see Section 4.3). 8. Conclusions DEQ has estimated waste generation in Oregon for every year since 1992. Setting aside 1992 due to problems with incomplete data associated with the first year of surveying, DEQ estimates that waste generation has grown 70%, from 3.3 million tons (1993) to 5.5 million tons (2005). During this same period, Oregon’s population grew by 17%, while per-capita generation of waste grew 43% - more than twice as fast as population. In response to Legislatively-adopted waste generation goals and in preparation for development of its Waste Prevention Strategy, DEQ undertook this review of waste generation, including its components, recent changes, and the possible causes of those changes. Insufficient data made a thorough review of these issues infeasible given limited resources available at this time. Despite these challenges, DEQ has significantly improved its understanding of the components, changes, and causes of waste generation. This report represents the most comprehensive review of waste generation conducted in Oregon to date, and likely represents one of the more comprehensive reviews of the topic conducted in the U.S. in recent years, at least at the state or local level. At the federal level, the U.S. EPA has invested significant resources in tracking waste generation and even estimates of waste prevention. While DEQ’s definition of “waste generation” includes waste from construction, renovation, and demolition activities, such wastes are excluded from EPA’s estimates. This and other methodological differences make a comparison of EPA’s and DEQ’s statistics challenging, although conducting that comparison yields some valuable findings. Section 2 of this report describes two conceptual models of waste generation. The first, adapted from the Washington Department of Ecology and a model developed by the World Resources Institute, illustrates solid waste as a relatively small, but highly visible, material flow resulting from a variety of economic activities. This evaluation illustrates that many of the materials that flow through Oregon’s economy neither originate, nor end up as solid waste, here in Oregon. The second conceptual model illustrates waste generation at the level of an individual household (or business), and demonstrates a variety of methods that households have to manage unwanted/discarded materials – many of which (indoor burning, outdoor burning, home composting, on-site disposal, and use of sewer systems) do not “count” toward DEQ’s estimate of waste generation. In addition, this model illustrates an important distinction between manufactured materials (goods, packaging) and “grown” wastes that are produced at the point of

Oregon Department of Environmental Quality Page 85 07-LQ-005
waste generation as a result of photosynthesis. Manufactured materials often have significant environmental impacts “upstream” of the consumer (in terms of resource extraction, manufacturing, and transportation) while “grown” wastes (yard debris, food from gardens) have “upstream” impacts that are limited to planting, consumptive water use, optional fertilizer/herbicide/pesticide use, and harvesting. Once in a landfill, many manufactured materials are largely inert, whereas grown materials may be a significant source of methane, a potent greenhouse gas. Sections 3 – 6 of this report compare and contrast DEQ and EPA data on waste generation. On the surface, DEQ and EPA draw very different conclusions regarding waste generation. DEQ concludes that per-capita generation grew by 27% between 1993 and 2002, while EPA holds that per-capita generation was essentially flat during the same period. EPA’s data, however, excludes waste from construction, renovation, and demolition activities, which DEQ found grew at a significant rate during this period. For some manufactured materials, DEQ’s and EPA’s estimates of per-capita generation are remarkably close. When they differ, reasonable explanations were identified in many cases – either because of differences between Oregon and national average conditions, or, more typically, because of differences and/or shortcomings in estimation methodologies. According to DEQ estimates, the greatest increases in per-capita generation (between 1993 and 2002) occurred in the material categories of wood (lumber), yard debris (prunings, trimmings, clippings), scrap metal, “other inorganics” (brick, rock, rubble, wallboard), roofing, and plastics. The large increase in scrap metal generation is at least partially – if not largely – explained by inconsistencies in reporting and counting. As several of these materials are associated with construction/demolition activities, they are excluded from EPA’s estimates. Among the materials that both agencies attempt to quantify, DEQ’s and EPA’s estimates of yard waste generation are among the most divergent. DEQ’s estimate of 2002 per-capita generation for yard debris is 68% higher than EPA’s, and while EPA estimates that per-capita generation of yard debris declined at an average annual rate of 3% between 1993 and 2002, DEQ’s observation is that per-capita generation rose at an average rate of 5% per year. This inconsistency is likely explained, at least in part, by differences in local vs. national conditions, such as climate, growing conditions, historic tree canopy, and landscaping standards. Findings for other key materials tracked by both DEQ and EPA include the following:
• Paper and paperboard: DEQ’s estimate of per-capita generation is slightly (9%) higher than EPA’s. Overall, per-capita generation of waste paper has been relatively flat between 1993 and 2002. EPA believes that corrugated cardboard, paper bags, newspapers, magazines, office paper, and other non-packaging paper all underwent significant source reductions during the 1990s, while paper used in other commercial printing (such as reports and prospectuses) and third-class mail increased.
• Plastics: Both DEQ and EPA have observed strong growth in per-capita generation of plastics. Between 1994 and 2003, plastic in durable goods saw the highest rate of growth in per-capita waste generation (according to EPA), growing at an average of 3.4% per year, compared to 2.3% per year for plastics in non-durable goods, and 2.1% for plastics in packaging and containers.

Oregon Department of Environmental Quality Page 86 07-LQ-005
• Food waste: DEQ’s estimate of per-capita generation is significantly (50%) higher than EPA’s.
• Glass: DEQ’s and EPA’s estimates are remarkably consistent. Overall generation of this material is falling, even as glass re-captures market share in beer packaging.
Among product types, EPA holds that the U.S. economy produced less waste per unit of personal consumption expenditures (PCE) in 2000 than it did in 1990. This suggests that waste generation is already, at least partially, de-linking from economic growth. In fact, had the historic (1960 – 1994) relationship between PCE and MSW generation remained constant, MSW would have been 25% larger in 2000 than it was observed to be. EPA attributes this change to source reduction in a variety of material categories. This estimate of the magnitude of recent source reductions has received scant attention. Yet even while EPA reports that most categories of waste underwent source reduction in the 1990s, several categories of products bucked that trend. Waste generation per unit of PCE increased during the 1990s for most forms of plastic packaging, clothing/footware, commercial printing, third-class/standard mail, small appliances, and carpets/rugs. Again, it is important to remember that most materials associated with construction, renovation, and demolition are not included in EPA’s evaluations. Section 7 of this report tackled the challenging task of explaining why Oregon’s per-capita generation of waste has grown at such a steep rate since 1993. A total of 16 hypotheses were identified and evaluated, with a few surprising results. While data is limited, estimates were made of the relative contribution that different hypotheses contribute to the reported growth in generation:
• An estimated 11 – 19% (66 – 111 pounds) of the increase in per-capita generation is attributed to changes in the reporting of waste data. These increases in generation are not real, but rather an artifact of inconsistencies in data collection and interpretation.
• An additional 5 – 20% of the increase (29 – 117 pounds) can be readily explained as waste management has shifted away from “non-counting” methods such as burning and home composting and toward “counting” methods such as centralized composting and disposal. These shifts represent an increase in “waste generation as it is counted,” but do not represent a real increase in material use or “wasting” behaviors. Apparent reductions in indoor burning contribute a surprising amount to this finding. This overall estimate (5 – 20%) is drawn from limited data, and is lacking data involving on-site accumulation and management, particularly of yard debris. The actual magnitude of shifts into the “counting” system may be higher than estimated here.
• The remaining increase – perhaps 50% to 80% of the observed increase in per-capita generation – appears to be caused in increases in waste-generating activities. Among these activities, a significant increase in construction, renovation, and demolition activities (for buildings) appears to be the largest contributor to rising per-capita generation. Yard debris generation also appears to be up. Other apparent factors likely include increased purchases of household furnishings (primarily associated with larger house sizes), decreases in the durability and repair of durable goods, and other increases in consumption buoyed by a variety of possible factors, including rising incomes, falling prices, increased access to credit, increased marketing, and changes in social norms.

Oregon Department of Environmental Quality Page 87 07-LQ-005
This evaluation is not as thorough or accurate as could be achieved with a greater investment of resources. However, some trends have now become more apparent, while other long-held assumptions have been called into question. With this data in hand, DEQ and other Oregonians now have a better understanding of the causes of increasing waste generation. In developing its Waste Prevention Strategy, DEQ is not required to target only waste types that are growing, but can also consider factors such as life cycle toxicity, energy, and natural resource burdens, other environmental and economic impacts, and opportunities for change. In any case, understanding what’s in our waste, how it is changing over time, and the causes of that change will hopefully result in greater success as DEQ, local governments, businesses, and residents all work to continue the shift from a “throw-away” to a conservation society.

Oregon Department of Environmental Quality
Waste Prevention Strategy – Background Paper #8
Product Stewardship and Extended Producer Responsibility
As a Policy Approach for Waste Prevention
Prepared by
February 2007
Solid Waste Program

Product Stewardship and Extended Producer Responsibility As a Policy Approach for Waste Prevention
Prepared by Jan Whitworth, Oregon DEQ
February 9, 2007 Introduction and Overview The purpose of this background paper is to summarize the key aspects of product stewardship (PS) and extended producer responsibility (EPR) programs and policies. Even though PS and EPR have become established principles of environmental policy in many countries, to date, they have seen limited use in the United States. In the scheme of waste management policies PS and EPR are relatively new, first conceived in Sweden in the early 1990’s. Many PS and EPR policies and programs are still in the early years of implementation and there is little definitive research data and information available on the measurable impacts that PS and EPR policies have on waste prevention and waste prevention related activities. Overall, based on documentation reviewed, PS and EPR policies are more relevant to and have a stronger impact on reduced resource and environmental impacts and sustainability through “upstream” design and manufacturing actions and limited impact on “downstream” waste prevention, primarily through reuse and dematerialization. Most of the downstream policy impacts center on resource recovery and recycling. What is Waste Prevention? In the context of the Oregon Department of Environmental Quality (DEQ) Waste Prevention Strategy, 2006 – 2016, waste prevention means: • Reducing consumption (and wasting) of goods outright without substitution. • Extending the life of products already in use (and by extension, delaying purchase of
replacement items). • Shifting purchases from disposable or single use products to products that are more durable,
repairable, or reusable. • Purchasing used products in lieu of new products. • Shifting purchases from material intensive products to products that are less material
intensive (dematerialization). • Shifting consumption from goods to services so that needs and wants are satisfied in a
different manner.
What are Product Stewardship and Extended Producer Responsibility? PS and EPR are similar policy approaches to address the environmental and public health impacts of products throughout the entire life cycle of the product. PS and EPR policies shift part or all of the responsibility for the end-of-life management of a product from traditional waste management entities, including rate payers, local governments and waste management companies, to the product manufacturers. The primary aim of these policy approaches is to encourage the manufacturers of products to reduce environmental and health impacts across the entire life cycle of the product. The main distinction between the two terms is that PS includes the concept of shared responsibility systems and polices that include roles for government,
Oregon Department of Environmental Quality Page 1 07-LQ-012

environmental groups, retailers, non profit organizations as well as the product producers/manufacturers. EPR is traditionally refers to pure producer/manufacturer responsibility for their products at end of life. Commonly, and in the case of this paper, these terms are often used interchangeably and policies and programs under both concepts have common elements. There are a variety of different policy tools that are employed under the general concept of PS and EPR. Several of them together usually work in some combination to establish the framework for a PS or EPR program aimed at a particular product or group of products. They include: • Producer take-back programs, collective and individual (example RBRC/batteries); • Legislative mandates on the producer to restrict or identify materials in products (example
RoHS [Restriction of Hazardous Substances], product labeling); • Disposal bans (example CRTs); • System financing mechanisms that incent the producer (example ARF, producer pays, taxes); • Recovery rate goals for the producer; and • Deposit-refund systems (example bottle bill). PS and EPR policies and programs tend to be used for products that have specific types of characteristics and not necessarily for all products. Examples include: • Products with toxic constituents that may become a problem at end of life. Examples
include: batteries, electronics, used oil, pharmaceuticals, paint, mercury containing products, pesticides, radioactive materials.
• Products that because of their size are not easily and conveniently thrown in the garbage. Examples include: carpet and other building materials, TVs, Computers, appliances, tires, propane tanks/gas canisters.
• Products with multiple material types that make them difficult to recover in the traditional recycling systems. Examples include: packaging, electronics, vehicles.
Relationship between Product Stewardship and Waste Prevention and Possible Applications PS and EPR policy approaches aim to impact the environmental effects of a product throughout its life cycle. Consequently, information that links PS and EPR policies directly to waste prevention or reduced waste generation is extremely limited or only vaguely make that connection. PS and EPR focus on and drive environmental and waste management system results and not necessarily reduced consumption of products or reduced generation of waste. This review concludes, based on current research and reports, PS and EPR policy approaches are best applied in the context of the broader goals of sustainability and reduced life cycle environmental and toxicity impacts rather than focused specifically on waste prevention and reduced waste generation. Waste prevention and reduced waste generation in some cases will be a result, among several, of a PS or EPR policy application but should not be the driving factor for using such policy applications. That conclusion aside, the review identifies the following waste prevention methods that can be associated with various PS and EPR policies and programs:
Oregon Department of Environmental Quality Page 2 07-LQ-012

1. Product Design Change – dematerialization, product durability and upgradeability. Policy
examples that encourage this type of waste prevention include light-weighting of products or packaging driven by system funding mechanisms that are established through manufacturer licensing or registration fees based on weight of the product or packaging.
2. Reuse – Legislative goals by product type, primarily seen with packaging, that mandate both reuse and recycling goals. For example, Austria mandates goals for refillable beverage containers. In the EU reuse and recycling goals are mandated for automobile manufacturers. However, it appears that the goals are combined so it is difficult to distinguish which portion is reuse and which is recycling. The situation is similar for electrical and electronic equipment (EEE) in the EU.
3. Upstream reduced waste generation in the manufacturing process. Summary of Policy Tools and Factors Affecting Results PS and EPR approaches usually involve a combination of policy tools rather than one single tool, such as product take-back. Many of these policies are familiar and have been used over the years as solid waste management policies to achieve various purposes. The experience and literature now evaluates them in a PS and EPR context, which includes impact on product design and reuse as well as other over impacts throughout the life cycle of the product. Some of the common policy tools used in PS and EPR are described below. 1. Product Take-Back – producers are assigned the responsibility of taking back their products
at the end of their useful life. 2. Advance Disposal/recovery Fees – A tax or fee is charged on the product when it is sold. The
fee is set to reflect end-of-life waste management costs of the product. The fee can be visible or invisible to the consumer when they pay it. The producer or retailer is responsible for collecting the fee but may have no other responsibility for the product’s end-of-life management beyond that point.
3. End-of-life Waste Management Fees – Consumers are charged a fee by the handler at the point of disposal or recycling that covers the cost of managing the product they are throwing away.
4. Deposit/Refund – A deposit is paid by the consumer at the time the product is purchased and is refunded when the product or its packaging (depending on which material is targeted) is returned by the consumer for reuse, recycling or disposal. Producers, or someone else in the products life cycle chain, may be responsible for collecting the deposit and for end-of-life collection and refund.
5. Tax on Virgin Materials or Subsidy/Tax Credit for use of Recycled material – A manufacturer is required by pay a tax on certain virgin materials used in the manufacture of their product or conversely the manufacturer can claim a tax credit for the use of certain recycled materials in the manufacture of their product.
6. Reuse Recycling, Reduction Goals or Rates – Laws are established that mandate goals for specific products or materials for producers.
7. Landfill/Disposal Ban – Specific product, product component is not allowed to be disposed.
Oregon Department of Environmental Quality Page 3 07-LQ-012

The chart below summarizes the application of the various policy tools.
Product or Waste Stream
Stage in Product Chain
Direct Response to policy
Take-back Product and waste streams
Disposal with strong signals to resource extraction and design stages
Reuse, recycling, some source reduction and design
ARF/ADF Product Recovery/disposal Recycling and some reuse
EOL Management Fees
Waste Stream Disposal Possible illegal disposal, recycling
Deposit/Refund Product Recycling and disposal
Recycling, reuse, and some design
Materials Tax Product (specific materials inputs)
Resource extraction and design
Reduced use/inputs of targeted materials and design
Disposal Ban Product and Waste Stream
Disposal and recycling
Recycling and some design
Product Toxic Reduction Requirements
Product Design and disposal Design, reduced use of target materials
Product Recycled Content Requirements
Product Design Design, reduced raw/virgin material input
In addition to the policy tools themselves there other factors that can have an impact on how the policies are implemented and how successful they can be. These factors are described below. • Cooperation of consumers is important and effected by financial incentives, convenience,
awareness of programs and impacts, size of product. • Amount of hazardous substances in the product that disposal problems and increased end-of-
life management costs. • Value of materials in the products. • Potential for product design changes that can reduce material use and the cost of recycling at
end-of-life. • Complexity of the product composition making it more difficult to costs of design changes
and recovery of the product. • Shorter product life-span reduces issues related to orphan and historic product in the system. • Mandatory programs are proving to be more effective than voluntary programs. • Manufacturer responsibility can be physical and/or financial, depending on how system is set
up and what the product is. • Individual manufacturer responsibility is more effective than collective responsibility in
generating design changes in product. • Goals or target rates for collection help establish collection infrastructure. Recycling and
reuse goals and rates help drive technology and design changes.
Oregon Department of Environmental Quality Page 4 07-LQ-012

• Number of producers and distributors in the market place determine if collective or individual system responsibility is used or is effective. Large number indicates collective third party organizations are useful. A small number lends itself more to individual responsibility.
Summary There appears to be no conclusive or overwhelming evidence so far indicating that PS and EPR policy tools have a major and direct impact on pure waste prevention as we have defined it for the purposes of the DEQ Waste Prevention Strategy. However, it is clear that PS and EPR policies can directly and positively influence reduced environmental impacts and overall sustainability related to the entire life cycle of a product. Given this information, it appears that PS and EPR policies can be considered as part of the Strategy but will likely be dependent on the identification of specific products that may need addressing and will more closely relate to life cycle impacts of the product or material rather than to pure waste prevention or reduced waste generation. Resources 1. Computers and the Environment: Understanding and Managing Impacts. Edited by R. Kuehr
and E. Williams. United Nations University, Hamburg Germany, 2003. 285pp. 2. Towards Sustainable Household Consumption? Trends and Policies in OECD Countries.
OECD Observer, July 2002. 12pp. 3. Extended Producer Responsibility as a Driver for Design Change – Utopia or Reality? By
Naoko Tojo. Doctoral Dissertation, Lund University, September 2004. 324pp. 4. Analytical Framework for Evaluating the Costs and Benefits of Extended Producer
Responsibility Programmes. Prepared by the Working Group on Waste Prevention and Recycling, Environmental Policy Committee, Environment Directorate, Organization for Economic Co-operation and Development. March 2005. 57pp.
5. Proceedings of OECD Seminar on Extended Producer Responsibility: EPR Programme Implementation and Assessment, Part 2: Assessing EPR Policies and Programs. Prepared by the Working Party on National Environmental Policy, Environment Policy Committee, Environment Directorate, Organization for Economic Co-operation and Development. October 2003. 122pp.
6. EPR Policies and Product Design: Economic Theory and Selected Case Studies. Prepared by Working Group on Waste Prevention and Recycling, Environment Policy Committee, Environment Directorate, Organization for Economic Co-operation and Development. 2005. 39pp.
7. Extended Producer Responsibility Policies in the United States and Canada: History and Status. By B. Sheehan and H. Spiegelman. Published in Governance and Sustainability: The Case of Integrated Product Policy. Heidelberg, Germany. 2005. 25pp.
8. Making the Business Case for Extended Product Responsibility: A Snapshot of Leading Practices and Tools. Prepared by the Tellus Institute for the U.S. Environmental Protection Agency. April 1999. 75pp.
9. Cell Phones: A Poster Child for Extended Producer Responsibility. INFORM. January 2004. 4pp.
10. EPR: What Does It Mean? Where Is It Headed? By B. Fishbein. INFORM. 1998. 19pp.
Oregon Department of Environmental Quality Page 5 07-LQ-012

11. Transitioning to Zero Waste – What Can Local Government Do NOW? By H. Spiegelman. Product Policy Institute. March 2006. 16pp.
12. Extended Producer Responsibility: A New Imperative for U.S. Waste Management. By C. Eicke. University of Oregon Dept. of Environmental Studies. June 2004. 78pp.
13. Unintended Consequences: Municipal Solid Waste Management and the Throwaway Society. By H. Spiegelman and B. Sheehan, PH.D. Product Policy Institute. March 2005. 18pp.
14. Websites: 1) Product Stewardship Institute at www.productstewardship.us; 2) Northwest Product Stewardship Council at www.productstewardship.net; and 3) Center for Clean Products and Clean Technologies at the University of Tennessee at http://eerc.ra.utk.edu/ccpct/index.html.
Oregon Department of Environmental Quality Page 6 07-LQ-012
Oregon Department of Environmental Quality
Waste Prevention Strategy – Background Paper #7
Other States and International Efforts
A Summary of Selected Waste Prevention and Reuse Programs and Initiatives Outside of Oregon
Conducted for
Oregon Department of Environmental Quality, Solid Waste Program
Prepared by
December 2006
Oregon Department of Environmental Quality 07-LQ-011

Acknowledgments
The authors of this background paper gratefully acknowledge the valuable contributions of the following individuals to the Waste Prevention Strategy research and development process.
Land Quality Solid Waste Policy and Program Development 811 SW 6th Avenue Portland, Oregon 97204 (503) 229-5913 (800) 452-4011 toll-free (503) 229-6977 fax www.deq.state.or.us David Allaway and Jan Whitworth, project managers Loretta Pickerell, solid waste policy and programs manager
DEQ Waste Prevention Strategy Steering Committee Members David Allaway, DEQ Julie Daniel, BRING Recycling Leslie Kochan, DEQ Meg Lynch, Metro Mike Riley, ReSource Jan Whitworth, DEQ
DEQ Technical Assistants Susan Christensen Cathie Davidson Scott Fairley Brian Fuller Shari Harris-Dunning Leslie Kochan Bruce Lumper
The authors particularly wish to thank all of the interviewees from nonprofits, businesses, local governments, state agencies, and educational institutions for their valuable and candid contributions and insights, without with these reports would not have been possible. Interviewees are listed separately.
Jessica Branom-Zwick, Marc Daudon, Peter Erickson, and Christy Shelton of Cascadia Consulting Group contributed to the research and preparation of several background papers supporting development of the Waste Prevention Strategy. Additional staff members assisted with interviews.
Anna Fleder, James Goldstein, and John Stutz of Tellus Institute and David Stitzhal of Full Circle Environmental also contributed to this research project.
In the interest of waste prevention, this background paper is intended for electronic distribution and viewing. If a hard copy is required, please print double-sided on recycled paper.
Oregon Department of Environmental Quality 07-LQ-011

Waste Prevention: Other States and International Efforts
Executive Summary............................................................................................4
1 Introduction and Overview......................................................................6 1.1 Project Overview ................................................................................................................ 6 1.2 Waste Prevention Background........................................................................................... 6 1.3 Research Scope and Evaluation Methods ......................................................................... 7 1.4 Report Outline .................................................................................................................. 10
2 Resource Productivity Improvements..................................................11 2.1 Overview........................................................................................................................... 11 2.2 Program Description......................................................................................................... 11
California Integrated Waste Management Board....................................................... 11 2.3 Challenges........................................................................................................................ 12 2.4 Assessment ...................................................................................................................... 13
3 Alternative Business Models ................................................................14 3.1 Overview........................................................................................................................... 14
Design for Environment (DfE) .................................................................................... 14 Supply Chain Management........................................................................................ 14 Product Stewardship.................................................................................................. 14 Leasing and “Servicizing”........................................................................................... 15
3.2 Program Descriptions ....................................................................................................... 15 Design for Environment (DfE) Programs ................................................................... 15 Supply Chain Management........................................................................................ 16
3.3 Challenges........................................................................................................................ 17 3.4 Assessment ...................................................................................................................... 17
4 Public Education and Awareness.........................................................18 4.1 Overview........................................................................................................................... 18 4.2 Program Descriptions ....................................................................................................... 18
Washington State Beyond Waste Program ............................................................... 18 King County, Washington .......................................................................................... 19 City of Seattle, Washington........................................................................................ 20 Vermont Builds Greener Program.............................................................................. 20 U.S. Green Building Council – Leadership in Energy and Environmental Design .... 20 California Integrated Waste Management Board....................................................... 21 Alameda County, California ....................................................................................... 21
4.3 Challenges........................................................................................................................ 22 4.4 Assessment ...................................................................................................................... 22
Waste Prevention and Reuse Efforts 1 Background Paper #7 Outside of Oregon December 2006

5 Economic Incentives .............................................................................23 5.1 Overview........................................................................................................................... 23
Pay-As-You-Throw (PAYT)........................................................................................ 23 Resource Management Contracting .......................................................................... 23
5.2 Program Descriptions ....................................................................................................... 24 Pay-As-You-Throw (PAYT)........................................................................................ 24 Resource Management Contracting .......................................................................... 24
5.3 Challenges........................................................................................................................ 24 5.4 Assessment ...................................................................................................................... 25
6 Regulatory Requirements......................................................................26 6.1 Overview........................................................................................................................... 26 6.2 Program Descriptions ....................................................................................................... 26
San Francisco, California........................................................................................... 26 British Columbia Product Stewardship Programs...................................................... 27 King County, Washington .......................................................................................... 27 Massachusetts Department of Environmental Protection.......................................... 28 Germany Packaging Ordinance and the Green Dot Program ................................... 30 The Netherlands Packaging Covenant III .................................................................. 30
6.3 Challenges........................................................................................................................ 31 6.4 Assessment ...................................................................................................................... 31
7 Government Leadership by Example ...................................................32 7.1 Overview........................................................................................................................... 32 7.2 Program Descriptions ....................................................................................................... 32
San Francisco, California........................................................................................... 33 City of Seattle, Washington........................................................................................ 33 King County, Washington .......................................................................................... 33 Massachusetts Department of Environmental Protection.......................................... 34
7.3 Challenges........................................................................................................................ 34 7.4 Assessment ...................................................................................................................... 34
8 European Sustainable Consumption Initiatives ..................................35 8.1 Overview........................................................................................................................... 35 8.2 Program Descriptions – European Union......................................................................... 36
Resource Productivity Improvements ........................................................................ 36 Alternative Business Models...................................................................................... 36 Public Awareness and Action .................................................................................... 37 Economic Incentives .................................................................................................. 37 Regulatory Requirements .......................................................................................... 37 Government Leadership by Example......................................................................... 37
8.3 Program Descriptions – European Nations ...................................................................... 38 Finland National Programme on Sustainable Consumption and Production ............ 38 United Kingdom Framework for Sustainable Consumption and Production.............. 39 United Kingdom National Resource and Waste Forum............................................. 39
Waste Prevention and Reuse Efforts 2 Background Paper #7 Outside of Oregon December 2006

8.4 Challenges........................................................................................................................ 40 8.5 Assessment ...................................................................................................................... 41
9 Summary Findings.................................................................................43
Appendix A. Interview Template.....................................................................46
Appendix B. References..................................................................................47
Waste Prevention and Reuse Efforts 3 Background Paper #7 Outside of Oregon December 2006

Executive Summary
Oregon’s 1995-2005 solid waste management plan identified waste prevention as a high priority and established a vision of Oregon citizens making a value shift from a “throw-away” society to a conservation society by 2005. From 1993 through 2005, however, Oregon’s total waste generation increased 70 percent, and per-capita generation increased 43 percent. The Department of Environmental Quality is currently working to develop a statewide Waste Prevention Strategy to help the state meet its goals of stabilizing total and per-capita waste generation. To support development of this strategy, DEQ hired a team led by the Cascadia Consulting Group, and including Tellus Institute, to conduct background research on existing waste prevention and reuse efforts and to describe the connection between waste prevention and broader environmental benefits.
This background paper focuses on waste prevention and reuse efforts outside of Oregon. It is intended to provide the Waste Prevention Strategy Steering Committee with an understanding of the leading programs and techniques for solid waste prevention that have been implemented in other jurisdictions in the U.S. and internationally, as a means of informing DEQ as to the most promising techniques, policies, and programs to consider for its strategy. In carrying out this research, the consultant team conducted a literature review, examined program reports, and interviewed selected program managers to gain a full understanding of the scope and impacts of the various efforts.
As outlined below, we have identified six major strategies for waste prevention and reuse activities and have organized the main body of this report accordingly to these categories:
Resource Productivity Improvements
Alternative Business Models
Public Awareness and Action
Economic Incentives
Regulatory Requirements
Government Leadership by Example
For each approach, we have summarized and assessed what are considered to be among the most successful programs. To provide an additional perspective to policymakers concerning the nature and target of the programs reviewed, we identified three broad categories of waste reduction strategies: supply-side efforts that focus on waste prevention in the production and sale of goods and services by manufacturers and retailers; demand-side initiatives that address sustainable consumption opportunities by consumers and communities; plus policy-side efforts by government through legislation, regulation and programmatic initiatives. This framework is intended to help DEQ consider and prioritize the alternative strategies most appropriate for Oregon.
Waste Prevention and Reuse Efforts 4 Background Paper #7 Outside of Oregon December 2006

Overall Findings
Individual waste prevention and reuse programs should be integrated in a coherent overall strategy to maximize effectiveness. Standalone elements such as education or technical assistance for home composting, for example, are much more effective when combined with economic or policy incentives such as Pay-As-You-Throw pricing or disposal bans. Similarly, technical assistance efforts for Design for Environment programs have greater impact in the context of Extended Producer Responsibility (EPR) programs or requirements. For maximum impact, strategies should incorporate supply-side, demand-side, and policy-side initiatives in a consistent and mutually reinforcing framework.
Sustainable consumption initiatives, such as those underway in Europe, offer significant waste prevention potential, well beyond the levels currently deemed achievable in the U.S. The potential is greatest where the focus is not limited to technological improvements and dematerialization, but includes consideration of values and lifestyle changes such as downsizing of living space, increased reliance on public transit and car-sharing rather than private vehicle ownership, and adopting lifecycle and precautionary approaches as a consumer of goods and services.
Focus on priority materials and/or sectors, based on waste reduction potential assessment, including both prevention and reuse. As part of their broader waste reduction efforts (prevention, reuse and recovery) and in order to prioritize their programmatic resources and achieve the “best bang for the buck,” the states of Washington and Massachusetts have targeted materials and sectors based on tonnage remaining in the disposed waste stream and their waste reduction potential. In Massachusetts, for example, this approach resulted in programs for commercial and residential organics (commercial food waste and home composting) and for construction and demolition (C&D) waste, especially wood, asphalt shingles and gypsum wallboard. In Washington, the Department of Ecology has a similar focus on C&D waste, which accounts for 25% of annual waste generation in the state, and organics, which composes another 25% of Washington’s annual generation. Note that much of Washington’s organics cycle activity is for recycling/composting, not reusing edible food.
Economic instruments such as taxes or fees should be part of the mix, but should be linked to long-term waste prevention goals in the context of increasing resource productivity. Getting price signals right for goods and services by including environmental externalities is an important element for achieving the structural changes in the economy that are required to move toward a sustainable production and consumption system.
Measuring effectiveness of waste prevention programs is challenging but important. The old sayings “what gets measured gets done” and “measure what matters” hold some truth. Measurement of waste prevention is critical for gauging progress and for targeting program efforts and resources. Unfortunately, waste prevention measurement is often quite challenging due to several factors. First, for educational and other programs, direct measurements are generally infeasible and alternative metrics must be used as a proxy, such as the numbers of people reached by a certain program. Second, there are many factors that impact the generation of waste, such as changes in general economic conditions. While some of these can often be addressed by normalizing the data (based on economic activity levels, for example), there is often a lack of good baseline data for comparison. This observation was confirmed repeatedly in the literature review and interviews. And third, there is often a time lapse between the initiation of waste prevention programs and their impact, such as Design for Environment efforts to increase durability of appliances. Nonetheless, a
Waste Prevention and Reuse Efforts 5 Background Paper #7 Outside of Oregon December 2006

number of organizations or jurisdictions (e.g., the OECD) have identified meaningful metrics for a variety of waste prevention techniques and DEQ should consider doing so.
Government partnerships with the private sector, NGOs, and other stakeholders are critical for the successful development and implementation of waste prevention and reuse programs. Policies and programs developed by government agencies without meaningful involvement by the citizens, businesses, and other organizations ultimately responsible for changing their production or consumption patterns will not gain the support necessary for effective implementation.
Resource Productivity Improvement Findings
Many Resource Productivity Improvement programs, in particular, pollution prevention and light-weighting, have already proven to be highly effective in preventing waste.
Emerging approaches such as industrial ecology and dematerialization through micro- and nanotechnology hold enormous promise, but the appropriate role of government and level of public effort have not yet been entirely worked out.
Alternative Business Models Findings
The range of Design for Environment (DfE) experiences indicate that incentives are key for getting manufacturers to redesign their products to reduce waste, toxicity, or other environmental impacts. To the extent possible, standardizing environmental purchasing criteria beyond an individual municipality or even state would ease the burden on manufacturers and suppliers for meeting waste prevention and other environmental criteria.
To date, public policy has played little role in promoting “servicizing,” or selling a service or a function rather than a product. There are however, a number of possible government policy initiatives (e.g., removal of virgin material and disposal subsidies, or tax policy which favors producer, not customer, ownership of durable goods) that could help realize the potential environmental gains associated with product-based services.
Public Awareness and Action Findings
The most effective programs appear to be those that: 1) are well integrated into a larger strategy; 2) identify clear priorities; 3) are linked to quantitative and achievable waste reduction targets or goals, especially if these were developed through an inclusive stakeholder process; 4) include a tracking mechanism to measure success; and 5) relate to or are motivated by regulatory requirements.
The effectiveness of public awareness and education programs is highly dependent on level of resources these programs receive.
Waste Prevention and Reuse Efforts 6 Background Paper #7 Outside of Oregon December 2006

Economic Incentives Findings
Coupled with other initiatives, Resource Management (RM) Contracting holds considerable promise as a means to help transform the waste management industry into a waste prevention and materials management industry. RM Contracting is in its infancy, and initial RM program results primarily show enhanced recycling of materials; however, as new contractors gain experience and the RM industry matures over time, the strategic alliances formed may enable RM contractors to influence upstream decisions related to product design and material choice, use, and handling, not just disposal practices.
Pay-As-You-Throw programs for the municipal (residential) sector are already widely implemented in Oregon. Nonetheless, based on the experience of other jurisdictions, there may be room to refine rates and implementation strategies to make it even more effective.
Regulatory Requirements Findings
Extended producer responsibility (EPR) programs offer governments a tool to shift responsibility for end-of-life product management by internalizing the external environmental costs of goods and services, and are a means to help reshape how society thinks about production and consumption behavior.
While many programs do not systematically track their waste prevention impacts, and it is difficult to do so, establishing reduction targets and an accepted method for tracking progress can be an effective way to motivate businesses, consumers, and agency staff responsible for program implementation.
Government Leadership by Example Findings
One of the greatest successes of Government Leadership by Example programs is in the area of Environmentally Preferred Purchasing (EPP). The breadth of products and services included in such programs should continue to grow.
The public sector has had considerable success in the green building area, and as states’ experience has increased, many have moved from an EPP focus to an integrated design approach in which the whole building is looked at as an integrated system from the outset. This will result in greater environmental benefits, but its impact on waste prevention is not always consistent.
Waste Prevention and Reuse Efforts 7 Background Paper #7 Outside of Oregon December 2006

1 Introduction and Overview
1.1
1.2
Project Overview
To support development of its statewide Waste Prevention Strategy, Oregon’s Department of Environmental Quality (DEQ) conducted or commissioned background research on existing waste prevention and reuse efforts and related topics. In 2006, DEQ hired a team led by Cascadia Consulting Group, and including Tellus Institute, to conduct some of this background research. Department staff conducted other research efforts in-house. Eight background papers summarize research findings on the following topics:
1. Waste Generation (DEQ);
2. Environmental Considerations – The benefits of waste prevention and reuse as an environmental strategy and in the context of sustainability (Cascadia);
3. State of Oregon Efforts – State government waste prevention programs in Oregon, including but not limited to DEQ’s solid waste grants (Cascadia);
4. Local Government Efforts – Local government waste prevention programs in Oregon, particularly those covered in DEQ’s 2% recovery rate credit program (Cascadia);
5. Nongovernmental Organizations and Infrastructure – Nongovernmental organizations providing reuse and waste prevention infrastructure and services in Oregon, with an emphasis on food, building materials, electronics, and thrift stores (Cascadia);
6. Business (DEQ);
7. Other States and International Efforts – Waste prevention and reuse efforts outside of Oregon, including examples from around the U.S. and the world (Tellus Institute and Cascadia); and
8. Product Stewardship (DEQ).
This report, Background Paper #7, focuses on waste prevention and reuse efforts outside of Oregon. Together, these eight reports compose the research and information-gathering phases designed to inform the development of Oregon’s strategy for waste prevention. This information has been developed to help the Department of Environmental Quality, DEQ’s Waste Prevention Strategy Steering Committee, external stakeholders, and agency managers to develop a statewide Waste Prevention Strategy. The Department will implement the Waste Prevention Strategy in 2007 and beyond.
Waste Prevention Background
Waste prevention sits at the top of the waste management hierarchy, followed by reuse, recycling, composting, energy recovery, and landfilling. Oregon’s 1995-2005 solid waste management plan identified waste prevention as a high priority. It also established a vision of Oregon citizens making a value shift from a “throw-away” society to a conservation society by 2005. From 1993 through 2005, however, Oregon’s total waste generation increased 70 percent and per-capita generation increased 43 percent.
Waste Prevention and Reuse Efforts 6 Background Paper #7 Outside of Oregon December 2006

DEQ’s statewide Waste Prevention Strategy will be designed to help Oregon meet its goals, established in 2001, to stabilize total and per-capita waste generation. Waste generation is defined as the sum of materials recovered (e.g., through recycling) and materials disposed (e.g., in a landfill). Many of DEQ past solid waste efforts have focused on recycling, while waste prevention and reuse, the preferred objectives in the waste management hierarchy, typically have received relatively less emphasis.
Definitions
In this report, the broad category of waste prevention is defined as diminishing the amount of solid waste generated that is collected for recovery (recycling or composting) or for final disposal in landfills or waste incinerators. DEQ categorizes general waste prevention into three types:
“Pure” waste prevention (also called source reduction in this report), diminishes the amount of solid waste generated or resources used, without increasing toxicity, through changes in the design, manufacture, purchase, or use of products or packaging. Examples include buying and using less/fewer materials or products, purchasing and using durable, reusable materials instead of disposables, and improving packaging efficiency.
Reuse extends the life of a product or material by repairing, modifying, or finding new uses for it (in its original or a similar form – rather than changing its identity through recycling and making new products). Reuse activities include typical thrift store operations for used clothing and household goods as well as edible food rescue, used building materials, computer reuse, and other categories.
Home composting is defined broadly to mean managing organic materials onsite at homes, businesses, and institutions through composting, grasscycling, worm bins, and mobile chipping operations, which facilitate onsite management of yard debris. (Stockpiling and burning organics are not included as waste prevention. Curbside collection and centralized composting of organic materials are counted as recovery.)
Jurisdictions within and beyond Oregon may use different definitions of waste reduction. DEQ defines waste reduction to mean any effort that diverts materials from disposal. Thus, waste reduction encompasses both waste prevention and recovery, which in turn includes recycling and off-site composting. This approach is consistent with the U.S. Environmental Protection Agency’s definition. Confusion may arise, however, because some other states and programs consider waste reduction to mean reducing the amount or toxicity of waste generated or reusing materials. In Oregon, local governments and solid waste program operators can be similarly inconsistent on this matter, contributing to the ambiguity. For the purposes of this report and the Waste Prevention Strategy, however, "waste reduction" means disposal avoidance and includes both waste prevention and recovery.
1.3 Research Scope and Evaluation Methods
This report focuses on waste prevention and reuse efforts outside of Oregon. It is intended to provide DEQ’s Waste Prevention Strategy Steering Committee with a thorough understanding of the successful programs and techniques for solid waste prevention implemented in other jurisdictions in the U.S. and internationally, and an assessment of the utility and implications of these techniques for Oregon. The report focuses heavily on state-level programs, as these will be particularly relevant to the needs of the Department of Environmental Quality. In addition, our review pays special attention to “sustainable consumption” initiatives in Europe. The working definition of sustainable consumption, produced at the 1994 Oslo Roundtable on Sustainable Production and Consumption hosted by the Norway Ministry of the Environment, is “the use of
Waste Prevention and Reuse Efforts 7 Background Paper #7 Outside of Oregon December 2006

services and related products which respond to basic needs and bring a better quality of life, while minimizing the use of natural resources and toxic materials so as not to jeopardize the needs of future generations.” These European initiatives are at the cutting edge of waste prevention efforts and address deep issues concerning values and lifestyle choices. Their potential for waste reduction goes far beyond conventional programs.
The first step in the research process was a brainstorming effort among the Project team and DEQ staff to identify leading national and international solid waste prevention and reuse programs that warrant further investigation. This complements the review of in-state efforts described in Background Papers #3, #4, and #5, and contributes to a thorough understanding of the possibilities and effectiveness of solid waste prevention and reuse techniques. Based on an initial list of leading programs of interest, our research included an extensive literature review of the studies, reports, policies, and websites about such programs. This was supplemented by email and telephone follow-up to clarify information and fill gaps, as well as selective interviews with key program managers (see Interview Template in Appendix A). Given the deep expertise of DEQ staff in this field, we worked closely with the Department in prioritizing the programs of greatest interest. Where information was available, we also documented the key actors and partnerships involved and lessons for effective engagement.
Waste Prevention Programs Reviewed
Ultimately, our review included the following North American waste prevention programs:
Alameda County Waste Management Authority and Recycling Board
California Integrated Waste Management Board
Florida
King County, Washington
Maine
Massachusetts Executive Office of Environmental Affairs, Environmentally Preferable Purchasing Program
Minnesota Office of Environmental Assistance, Product Stewardship Initiative
New York City, Bureau of Waste Prevention and Recycling
San Francisco, California
Seattle, Washington
Vermont Builds Greener Program
Washington State Department of Ecology, Beyond Waste Program
Alberta
British Columbia, Canada, Product Stewardship Program
Waste Prevention and Reuse Efforts 8 Background Paper #7 Outside of Oregon December 2006

Canadian National Office of Pollution Prevention, Extended Producer Responsibility, Life Cycle Management, and Eco-Labeling Programs
Ontario
Internationally, programs considered include:
European Commission, proposed new strategy for waste prevention
European Union, Sustainable Consumption initiatives
Germany, Packaging Ordinance, Green Dot, Integrated Product Policy, and Sustainable Consumption Program
Netherlands, Extended Producer Responsibility Program
United Kingdom, Waste Prevention Project of the National Resource and Waste Forum In addition, our literature review drew on several key organizations active in the waste prevention arena, including:
U.S. Green Building Council
North American Sustainable Consumption Alliance
U.S. Environmental Protection Agency
INFORM
This represents a plethora of waste prevention and reuse programs that have been developed and tested in the U.S. and abroad in recent years. These include leasing and “servicizing,” sustainable consumption efforts, environmentally preferable purchasing (EPP), extended producer responsibility (EPR), grasscycling and xeriscaping, onsite management/reuse of organic waste, remanufacturing, industrial ecology, materials exchanges, paper reduction efforts, policy and legislative initiatives, and many others. Programs are often defined by location (home, office, school or campus), sector (construction, hospitality, auto), or by product/material (packaging, paper, mercury). Many of the most successful programs involve partnerships among government, business, and consumers.
For purposes of this report, we have organized these programs into six major strategies:
Resource Productivity Improvements
Alternative Business Models
Public Education and Awareness
Economic Incentives
Regulatory Requirements
Government Leadership by Example
Waste Prevention and Reuse Efforts 9 Background Paper #7 Outside of Oregon December 2006

To help guide DEQ concerning the nature and target of the programs reviewed, the Project Team has identified three broad categories of waste reduction strategies: supply-side efforts that focus on waste prevention in the production and sale of goods and services by manufacturers and retailers (Resource Productivity Improvements and Alternative Business Models), demand-side initiatives that address sustainable consumption opportunities by consumers and communities (Public Awareness and Action), and policy-side efforts by government through legislation, regulation and programmatic initiatives (Economic Incentives, Regulatory Requirements, Government Leadership by Example). Note that it is not uncommon for a jurisdiction’s waste prevention or reuse initiatives, or even a single program, to fall within more than one of these categories.
In considering the leading programs under each category, it is important to keep in mind that the individual program elements are related to one another and, thus, they should be seen as part of a coherent and well-coordinated overall strategy. The synergies among programs can be just as important as the individual programs. For example, Design for Environment efforts are often at least partially motivated by Extended Producer Responsibility (EPR) requirements, enhanced environmental reporting requirements (lifecycle and supply chain included), or other initiatives.
This report on experience outside Oregon reviews, evaluates, and summarizes the most relevant information and experiences that DEQ should consider in developing its own waste prevention and reuse programs. A draft of this report was submitted to DEQ’s Project Steering Committee in June, and this revised draft reflects several changes based on the comments and recommendations received from the Committee.
It is important to note that many of the waste prevention and reuse programs and policies from outside of Oregon reviewed here are relatively new and that few have been systematically evaluated by either the agencies responsible for their implementation or independent agencies. Moreover, as mentioned in previous reports, waste prevention is often difficult to measure and quantify. Thus, many findings are more qualitative than quantitative, though our review tries to identify organizations and programs that appear to be most effective and offer the best models for further reuse and waste prevention efforts.
1.4 Report Outline
This report on the reuse and waste prevention efforts outside of Oregon is organized into the following chapters. In addition, an interview template and references are included as appendices.
1. Introduction and Overview
2. Resource Productivity Improvements
3. Alternative Business Models
4. Public Education and Awareness
5. Economic Incentives
6. Regulatory Requirements
7. Government Leadership by Example
8. European Sustainable Consumption Initiatives
9. Summary Findings
Waste Prevention and Reuse Efforts 10 Background Paper #7 Outside of Oregon December 2006

2 Resource Productivity Improvements
2.1 Overview
2.2
Numerous programs in jurisdictions throughout the U.S. and abroad are aimed at improving resource productivity (also called eco-efficiency) from manufacturers and business service providers. These include:
Pollution prevention (P2)
Lean manufacturing
Green permitting
Lightweighting
Industrial ecology
Technological advances, including:
- Miniaturization and dematerialization
- Micro- and nanotechnology
These efforts are all aimed at changing private-sector behavior through education, technical assistance, incentives, and/or regulation, and have considerable overlap with the subsequent chapters of this report. In this section, therefore, we describe only a few programs related to resource productivity improvements.
In addition to the direct benefits of utilizing less material and energy per unit of output, these practices also produce indirect benefits by reducing the related “external” costs of pollution that result in environmental degradation and public health impacts. While these costs are generally not reflected in the price of such goods or services (see chapter 5 on economic incentives), their reduction is an important societal benefit.
Program Description
California Integrated Waste Management Board
In November 2001, the CIWMB adopted a Strategic Plan highlighting sustainability, product stewardship, energy recovery, environmental justice, safe disposal of waste, and the promotion of a zero-waste philosophy. Zero-waste strives to maximize waste reduction and use the most effective processing or manufacturing practices to optimize efficiency and conserve natural resources. It promotes both front-end (e.g., waste prevention and reuse) and back-end (e.g., recycling) methods as well as using waste to generate energy. Obviously, it is the Board’s front-end reduction efforts that are relevant to Oregon DEQ’s efforts.
Waste Prevention and Reuse Efforts 11 Background Paper #7 Outside of Oregon December 2006

Part of CIWMB’s strategy is to promote best business practices in product manufacturing and handling by:
Partnering with other State agencies to create cross-media approaches to working with business to assist in achieving zero waste.
Partnering with trade associations to promote cost-beneficial source reduction and related manufacturing improvement opportunities (e.g., through improved technologies, packaging efficiencies, best business practices).
Creating model programs that are self-sustaining and transferable to others.
Evaluating long-term benefits of pilot programs or models.
CIWMB’s efforts have resulted in significant waste prevention and diversion that reduced amounts disposed since 1989, as measured by the Board’s disposal reporting system. While the Board’s work that has contributed to waste prevention has focused on a variety of programs and waste streams – edible food rescue, organics diversion, California Materials Exchange (CalMAX), Waste Reduction Awards Program (WRAP), and green building – CIWMB’s packaging redesign efforts are most relevant in terms of this chapter of the report on improving resource productivity. The idea of efficient packaging and waste reduction in packaging in California began with the Shipping and Distribution Partnership, a voluntary effort created to encourage businesses to adopt more efficient packaging and distribution systems that save money while preventing waste and improving operations. As elsewhere, packaging related waste comprises approximately one third of the state’s solid waste.
In addition to direct elimination or reduction of packaging, the Board promotes designing refillable or reusable packages as well as producing recyclable packages and packages made of recyclable material. CIWMB’s packaging redesign initiative focuses on preventing or reusing (or recycling) five key materials:
Composites
Paper
Plastic
Steel/Metal
Wood
2.3 Challenges
Among the most significant challenges facing governments attempting to encourage resource productivity improvements in the manufacturing and service sectors are the inertia of existing production systems and the significant costs to companies of modifying them; a lack of awareness and/or willingness among businesses to alter existing practices; the fact that long-term environmental and health consequences of product lifecycles are not reflected in their price; the reliance on voluntary programs where regulatory authority does not exist or does not enjoy adequate political support; dematerialization technologies (e.g., micro- and nanotechnology) that have not yet been proven or commercialized; and a lack consumer education and demand for products and services that generate less waste. Many of these challenges relate to and are further discussed in the other chapters of this report.
Waste Prevention and Reuse Efforts 12 Background Paper #7 Outside of Oregon December 2006

2.4 Assessment
There is a vast array of existing and emerging public sector programs aimed at encouraging and facilitating resource productivity improvements throughout the manufacturing and service sectors. Experience with some of these – pollution prevention and light-weighting, for example – have already proven to be effective in preventing waste, while other emerging approaches such as industrial ecology and dematerialization through micro- and nanotechnology, hold enormous promise but the potential role for government efforts remains unclear and deserves further attention. Initiatives to promote product stewardship, Design for Environment (DfE) approaches, and purchasing of environmentally preferable products (EPP), described in later sections, will also result in resource productivity improvements.
Waste Prevention and Reuse Efforts 13 Background Paper #7 Outside of Oregon December 2006
3 Alternative Business Models
3.1 Overview
Over the past quarter of a century businesses in the U.S. and around the world have become increasingly concerned with the environmental impacts of their products and services. Driven by a combination of factors – more stringent environmental regulations, growing demand for “green” products among consumers, and a recognition that preventing waste and pollution can save money and improve a company’s image – new business models have emerged that reduce waste and prevent toxic pollution. These alternative models include:
Design for Environment (DfE)
There are three main approaches governments take to promote DfE in industry: 1) voluntary programs where agencies provide information and possibly technical assistance or procurement preferences; 2) regulatory requirements in which mandatory take-back provisions or material bans are imposed; or 3) a combination of these approaches.1 The best way to measure the effectiveness of DfE initiatives would be to track product design changes in industry. Unfortunately, it is difficult to sort out the many causal factors that often accompany product design changes, and there are few documented examples of specific product changes clearly attributable to DfE efforts. Note that most DfE programs focus on reducing or eliminating toxic materials as opposed to preventing solid waste.
Supply Chain Management
Supply chain management approaches recognize that waste prevention and other environmental improvements can often be most efficiently implemented if the whole product chain, or system, is involved. Supply chain management addresses the performance of materials, components, and goods and services that an organization buys and uses. Ideally, supply chain management identifies the most significant waste prevention opportunities by considering the entire product system and working cooperatively with suppliers to prevent such waste. This often involves the use of lifecycle assessment (LCA) tools. There are three dimensions to environmental supply chain management: 1) the supply chain through a network of upstream and downstream linkages; 2) the environmental impacts of materials and energy inputs and outputs; and 3) the management of the business organization.
Product Stewardship
Product stewardship is a product-centered approach to waste prevention and environmental protection. Also known as extended product responsibility (EPR), product stewardship requires those in the product life cycle – manufacturers, retailers, users, and disposers – to share responsibility for reducing the environmental impacts of products. As such product stewardship is distinct from and goes beyond manufacturer-centered extended producer responsibility approaches. It recognizes that waste reduction and other environmental improvements will be enhanced by going beyond producers acting alone, to include retailers, consumers, and the existing waste management infrastructure. Note that product stewardship approaches and the
1 Given the important role of government regulation in promoting Design for Environment efforts in the business sector, many of the DfE programs are closely related to the programs described in chapter 6, Regulatory Requirements.
Waste Prevention and Reuse Efforts 14 Background Paper #7 Outside of Oregon December 2006
key stakeholders will vary from one product system to another. Note also that in the program descriptions that follow, we have not included EPR, as these programs are described in chapter 6, Regulatory Requirements.
Leasing and “Servicizing”
Servicizing refers to selling a service or function rather than a product, and can include operating leases and trade-ins. Actual ownership of the product remains with the supplier, and customers generally pay for use and maintenance of the product. Servicizing can therefore be thought of as very closely related to or a type of extended product responsibility. Some servicizing examples include carpet leasing, office equipment leasing, outsourcing of onsite chemical management, and office furniture supply and maintenance.
Potential customer benefits include:
Environmental and cost savings without much effort on customer's behalf.
Allows customer to focus on their primary areas of business.
Maintenance and ultimate disposal is the supplier's responsibility.
Product(s) are managed by the supplier, who best knows the product, liabilities, and waste reduction opportunities.
Optional shared savings create incentives for both the customer and supplier to reduce and recycle. Suppliers can establish a market niche by proving their products meet certain codes or policy.
In servicizing relationships, the vendor may function as much as a partner, problem-solver, and information resource as the product provider. Servicizing has inherent incentives to maximize and recapture the end-of-life value of products and equipment.
3.2 Program Descriptions
Design for Environment (DfE) Programs
The European Union’s Restrictions on Hazardous Substances (RoHS) Directive is perhaps the most far-reaching regulatory approaches to DfE to date. It requires manufacturers to replace mercury, lead, hexavalent chromium, and other heavy metals in a variety of products, including:
- Large household appliances: refrigerators, washers, stoves, air conditioners
- Small household appliances: vacuum cleaners, hair dryers, coffee makers, irons
- Computing/communications equipment: computers, printers, copiers, phones
- Consumer electronics: TVs, DVD players, stereos, video cameras
- Lighting: lamps, lighting fixtures, light bulbs
- Power tools: drills, saws, nail guns, sprayers, lathes, trimmers, blowers
- Toys and sports equipment: videogames, electric trains, treadmills
- Automatic dispensers: vending machines, ATM machines
Waste Prevention and Reuse Efforts 15 Background Paper #7 Outside of Oregon December 2006

The following products are currently exempted from RoHS compliance:
- Large stationary industrial tools
- Control and monitoring equipment
- National security use and military equipment
- Medical devices
- Some light bulbs and some batteries
- Spare parts for electronic equipment in the market before July 1, 2006.
Other countries that are working on their own version of RoHS:
- RPCEP (Regulation for Pollution Control of Electronic Products): China Effective July 1, 2006
- GPSSI (Japan Green Procurement Survey Standardization Initiative): Japan Effective July 1, 2006
- SB20 (Electronic Waste Recycling Act of 2003): California, USA Goes into effect January 1, 2007
- Adopting the European Union’s RoHS Directive: Australia, Canada, Korea, Taiwan
E.U.’s Waste Electronic and Electrical Equipment (WEEE) Directive mandates aggressive reuse and recycling targets of 65-75% for certain products. Producers must comply with these requirements if they want to sell their products in Europe. WEEE Directive 2002/96/EC mandates the treatment, recovery, and recycling of electric and electronic equipment (prior to the WEEE Directive, 90% was landfilled). All applicable products in the E.U. market after August 13, 2006, must pass WEEE compliance and carry the "Wheelie Bin" sticker.
In the packaging arena, Germany’s mandatory Packaging Ordinance and the associated Green Dot Program has resulted in design changes for beverage packaging in Germany and elsewhere in Europe. On the voluntary side, the U.S. Environmental Protection Agency’s DfE Program and the U.K.’s Waste Minimization and Resources Action Programme (WRAP) cite design changes by manufacturers.
Supply Chain Management
Most government efforts on supply chain management have focused on educating and providing technical assistance to private sector businesses. Trainings have been organized at the state and regional level, often with support from the U.S. Environmental Protection Agency. In addition, many government bodies, at all levels, are directly influencing their suppliers through environmental requirements, primarily through green procurement programs. In many states (including Massachusetts, Minnesota, New York, and Washington) these programs have expanded greatly in recent years from an initial focus on office supplies and equipment to virtually all goods and services a state requires.
Waste Prevention and Reuse Efforts 16 Background Paper #7 Outside of Oregon December 2006

3.3 Challenges
3.4 Assessment
Product stewardship/EPR initiatives as well as Design for Environment programs based on a mandatory approach are challenged by the same political obstacles that many other regulatory programs face in building support among diverse interests. Managing supply chain issues is extremely complex, and there are a number of issues that will affect the growth of supply chain management as a tool for meeting business objectives and improving environmental performance. Companies often have diverse suppliers that can range from multinationals to small and medium-sized enterprises. Another challenge is designing adequate incentives (internally and externally) and insuring that waste prevention and other environmental requirements are met and that data are reliable. Overcoming these and other issues will affect the extent to which supply chain management approaches are used in the future. The emerging servicizing model is still relatively new and unfamiliar to many producers and consumers, and requires both additional analytical work on the costs and benefits to producers and consumers, as well as considerable public education.
It is important to note that the degree to which DfE approaches are relevant varies by product type, with packaging, electronics, beverage container, carpet, and vehicles already showing considerable promise in various jurisdictions, both in Europe and the U.S. The range of DfE experience indicates that incentives are key for getting manufacturers to redesign their products to reduce waste, toxicity, or other environmental impacts. These incentives can be in the form of take-back requirements or material bans on the regulatory side, or through preferential tax treatment, public procurement, and/or financial or technical support. Experience in Europe and elsewhere has shown that if producers are required to bear the full cost of managing their discarded products they will have a direct incentive to account for such costs in their decisions about product design and marketing. For example, Germany’s mandatory Packaging Ordinance and the associated Green Dot Program have resulted in design changes for beverage packaging in Germany and elsewhere in Europe. On the voluntary side, the U.S. Environmental Protection Agency’s DfE Program and the U.K.’s Waste Minimization and Resources Action Programme (WRAP) cite design changes by manufacturers.
Many government bodies, at all levels, are influencing their suppliers through environmental requirements, primarily through green procurement programs. Expansion and additional promotion of environmental purchasing activities and tools can further this effort. In addition, there is a role for technical assistance and incentives for small businesses to apply greening-the-supply-chain techniques, as individually they often lack the buying power and resources to influence suppliers. To the extent possible, standardizing environmental purchasing criteria (e.g., Energy Star) beyond an individual municipality or even state would ease the burden on manufacturers and suppliers for meeting such criteria.
To date public policy has played little role in promoting servicizing. There are, however, a number of possible government policy initiatives that could help realize the potential environmental gains associated with product-based services. Policies that incorporate the social costs of materials extraction and disposal into the purchase price of products are likely to have two effects: building further market demand for decoupling ownership from product use; and building demand for lifecycle management as an explicit component of service offerings. Such policies include, for example, removal of virgin material and disposal subsidies, or tax policy which favors producer, not customer, ownership of durable goods. Government can also play an important role as convener and facilitator of stakeholder processes to explore these and additional policy initiatives and forms of technical assistance. While EPR/servicizing policies have received their share of criticism, they have also focused the attention of businesses on providing environmentally beneficial end-of-life services.
Waste Prevention and Reuse Efforts 17 Background Paper #7 Outside of Oregon December 2006

4 Public Education and Awareness
4.1 Overview
4.2
Education and awareness-building activities are intrinsically tied to and reinforce the other waste prevention and reuse strategy elements. Increased concern by policymakers and the public over local and global environmental impacts of consumption is reflected in a host of public education and action campaigns to address the demand side of the equation. These efforts go well beyond the common practice of informing citizens about the benefits of household practices, such as grasscycling and backyard composting, to far-reaching initiatives that promote sustainable consumption opportunities by consumers and communities. Such efforts focus on building consumer demand for more environmentally friendly or preferable products and growing the “sustainable lifestyle” movement (including the simplicity movement). Techniques include the full range of media, from radio and television (including public service announcements) to newspapers and other printed materials (including transit posters and bill stuffers) to the internet. Techniques such as community-based social marketing (CBSM)2 have emerged as particularly effective ways for reaching and educating targeted audiences and for encouraging specific behavior change toward waste prevention and other goals.
Several jurisdictions in the U.S. have strong demand-side programs built around public education and awareness. In the following section, particular emphasis is given to programs related to education and promotion of green building practices, an important focus of Oregon’s waste prevention efforts. In addition, the European Union and its members are world leaders in the sustainable consumption arena. Their experience is highlighted below in chapter 8 of this report.
Program Descriptions
Washington State Beyond Waste Program
Washington’s Beyond Waste program explicitly takes on “the substantial task of redefining American consumerism and culture.” It views waste as inefficient resource use, and adopts a materials flow framework to help identify, evaluate, and prioritize activities and sectors that produce significant waste flows in terms of volume and/or toxicity. The program aims to minimize material and waste flows through efficient use of resources, recovering material for high-value reuse, and incorporating “cradle-to-cradle” design. The Beyond Waste Program has established long-term (30-year) goals and five-year milestones, and has identified 64 specific actions to move Washington toward this vision. Three broad strategies have focused on:
Making green building practices mainstream. Goals include increasing awareness, knowledge and access to green building resources, developing and implementing incentives for green design and construction and removing disincentives, and maximizing reuse and recycling of construction and demolition (C&D) materials. The plan calls for the following specific actions:
- Adopt LEED standards for all new state buildings
- Make residential Built Green program available to all residents
2 Community-based social marketing comprises five steps: selecting behaviors, identifying barriers, developing strategies, conducting a pilot, and broad scale implementation. It is used primarily to try and change environmentally-harmful behaviors among residents and businesses.
Waste Prevention and Reuse Efforts 18 Background Paper #7 Outside of Oregon December 2006

- Technical assistance to builders re: LEED and Built Green programs
- State procurement guidelines should require green building materials
- Support deconstruction industry through grants, pilots, training
- Work with local governments to ensure adequate C&D processing capacity (especially for concrete, gypsum, wood)
- Intensify work with national partners on building material product stewardship
- Educate architects and contractors about designing buildings for less waste and deconstruction
Establishing an organics recovery cycle. Actions include increasing the residential and commercial organics recovery programs and resolving statutory and regulatory barriers.
Reducing hazardous waste in the industrial sector. Actions include sector focused reduction plans (mercury, PBDE), providing incentives to businesses to adopt sustainability practices, and encouraging waste haulers to become materials brokers.
King County, Washington
King County has an expansive public education around waste prevention, including:
Green Building Program
Provides tools and assistance to promote high recycling and reuse rates. Examples of tools include jobsite waste guidelines, a waste management template, sample waste recycling specifications, a directory of local construction waste recyclers. Assistance includes presentations to jobsite workers, site visits and assessments, and research about recycling and reuse options.
- Prevent Jobsite Waste
- Design Specifications and Waste Management Plans (includes examples of design specifications that use specific language to address expectations for waste reduction)
- Construction, Demolition, and Landclearing Debris Recycling
EcoConsumer (Gateway Program)
- Promotes conscientious purchasing choices
- EcoConsumer TV ads; featured resources for TV ads
- EcoConsumer columns in The Seattle Times
- Other public outreach (radio interviews and public presentations)
- Waste calculator (similar to eco-footprint calculator)
- Links to directories, guides, household tips and green lifestyle advice
Waste Prevention Resources
- Waste prevention tips and information on reducing junk mail, and the National Waste Prevention Coalition (including Waste Prevention Forum)
- Waste free holidays (business partners)
- Northwest Yard Days
Waste Prevention and Reuse Efforts 19 Background Paper #7 Outside of Oregon December 2006

- EcoDeals.org (website featuring high-performance products and services, descriptions, coupons, and more)
City of Seattle, Washington Seattle has long been known as a leader in waste prevention and reuse.
Education and Technical Assistance – Seattle Public Utilities, the agency responsible for managing the City’s solid waste, has a robust education and technical assistance program that promotes home composting, grasscycling, and natural gardening.”
“Use It Again, Seattle!” is the City’s popular way of keeping reusable items out of the landfill. Residents can drop off their unwanted but reusable items free of charge. Items are first made available to local charity partners. Remaining items are then made available to the public. While until this year Use It Again events were held at the neighborhood level, SPU found this to be expensive and is currently piloting a similar effort at a single location -- one of the City’s major recycling and disposal stations.
The Resource Venture initiative provides free educational materials, technical assistance, and training to help businesses reduce waste and prevent pollution. It also has a strong green building program with an emphasis on preventing C&D waste.
Vermont Builds Greener Program A joint project of Vermont Building for Social Responsibility and the Vermont Energy Investment Corporation, the Vermont Builds Greener Program certifies residential buildings that are constructed to meet a set of sustainability criteria. This is similar to the approach used by the U.S. Green Building Council in its well-known Leadership in Energy and Environmental Design (LEED) Program in which points are assigned based on the extent to which green building practices and materials are used.
A particularly strong feature of the Vermont program with respect to waste prevention is its emphasis on house size: a significant number of points are related to house size, with smaller houses receiving points while larger houses are penalized.
Points are also achieved through sustainability strategies such as rehabilitating an old house rather than building new, using building products made from salvaged, recycled, or waste-stream content such as used doors, cabinets and countertops, and salvaging wood for reuse.
Reduce, Re-Use and Recycle section includes points for:
- On-site separation of materials for reuse and recycling (wood, cardboard, metal, drywall, asphalt shingles)
- Optimize material use through use of standard design (ceiling height, wall length)
- Optimal Value Engineering (OVE) to reduce the amount of materials used in framing.
U.S. Green Building Council – Leadership in Energy and Environmental Design Through its Leadership in Energy and Environmental Design (LEED) program, the USGBC has been very successful in raising awareness of the benefits of green building. Its successful development and broad dissemination of LEED standards are having a transformative impact in the commercial sector, with thousands of buildings nationwide pursuing LEED certification, and USGBC is attempting to do the same for housing with the recently released LEED Home Program
Waste Prevention and Reuse Efforts 20 Background Paper #7 Outside of Oregon December 2006

(Draft). Like its predecessors, LEED Home is a certification program for green homes, with a point system for different levels of green (Certified, Silver, Gold, Platinum).
LEED Home places considerable emphasis on resource use and recognizes the important driver that house size is:
- 24 of 108 total points for Materials and Resources use
- Home size emphasized due to relationship to materials and energy use whereby up to 10 points are awarded for smaller than national average home size and larger than average homes are penalized by point deductions
- Up to 2 points each for material efficient framing and reduced job-site waste generation
- Points also available for improving durability of the building envelope, components and systems through appropriate design and materials selection and installation
California Integrated Waste Management Board
CIWMB has an extensive education and technical assistance program and provides residents and businesses with a wide range of materials to promote waste reduction and reuse. The elements of the Board’s program include educational materials concerning:
Business Waste Reduction Resources Index
Beyond Waste Prevention
Construction and Demolition
Environmentally Preferable Purchasing – Green Lodging
Organics (e.g., biosolids, food scrap management, home gardening, grasscycling, greenscaping, sustainable commercial landscaping)
Packaging
Paper Reduction Information Resources
Reuse
Waste Prevention Information Exchange (very extensive online directory of informational resources organized by prevention and reuse topic)
Alameda County, California
Alameda County’s Business Assistance Program is designed to prevent waste, boost resource efficiency and materials recovery, and enhance markets for recyclables. The program targets businesses, public agencies and institutions and includes commercial, industrial and office environments. The program includes:
Comprehensive environmental assessments and financial (grants) and technical assistance to implement waste prevention practices.
Marketing campaign to prevent transport marketing waste, through promoting reusable shipping containers and other methods.
In addition, the Alameda County Organics Program provides educational workshops and tours, (Bay-Friendly Gardening), and coordination with the Master Composter project and the Compost and Worm Bin Distribution program to support onsite composting and waste prevention.
Waste Prevention and Reuse Efforts 21 Background Paper #7 Outside of Oregon December 2006

Achievements include the diversion of over 16,000 tons of material from residential programs and 22,000 tons from commercial programs in 2004 (includes onsite and centralized composting). Program has maintained a 20% participation rate for compost bin sales.
4.3 Challenges
4.4 Assessment
Several important challenges face public education and awareness campaigns for waste prevention and reuse. There is a general reluctance on the part of businesses and citizens to modify existing practices until they are forced to do so, either through regulation or in response to a perceived crisis. Moreover, businesses and citizens are bombarded with messages and advice on an ongoing basis. It is difficult to make waste prevention and reuse rise above the myriad of other issues facing society. Educational messages therefore need to strike a balance between urgency based on the negative consequences of inaction, and the positive implications for citizens, businesses, and society generally of implementing prevention activities.
Specific educational efforts may not be well coordinated with other elements and a broader waste prevention and reuse strategy, thereby weakening their effectiveness. If not part of an integrated strategy with clear priorities, awareness campaigns may not identify the most important specific actions that citizens and businesses should implement to achieve waste prevention. Since waste prevention results from a combination of many factors, it is difficult to measure or even estimate the impact of educational initiatives. Community-based social marketing techniques have begun to introduce the importance of measuring the impact of educational programs, but evaluating effectiveness remains an important challenge. This lack of evaluation data leads to a final hurdle, that of obtaining adequate resources to maintain educational programs.
Waste prevention and reuse educational efforts vary widely across jurisdictions in the U.S. and abroad, ranging from general public service announcements with vague pronouncements about using resources wisely to specific initiatives with explicit guidance on why and how to reduce particular wastes. All programs are built on the premise that public education and awareness are essential elements for successful waste prevention. Of course, the success of these programs, wherever they are located, depends partly on an adequate ongoing level of funding.
The most effective programs, such as King County and Washington State, appear to be those that: 1) are well integrated into a larger strategy; 2) identify clear priorities; 3) are linked to quantitative and achievable waste reduction targets or goals, especially if these were developed through an inclusive stakeholder process; 4) include a tracking mechanism to measure success; and 5) relate to or are motivated by regulatory requirements. The recent popularity of education programs aimed at promoting green building is not surprising, as they meet most if not all of these criteria.
Note that in terms of placing the waste prevention education initiative within a larger strategy, where appropriate DEQ should look for opportunities to link the effort with “hot” issues that have gained public attention, such as climate change or the loss of timber stocks.
Waste Prevention and Reuse Efforts 22 Background Paper #7 Outside of Oregon December 2006

5 Economic Incentives
5.1 Overview
Economic instruments are a powerful tool for promoting waste prevention and reuse, both through taxing wasteful practices and by positive financial incentives for preferred practices. “Environmental taxes,” as they are sometimes referred to, can take the form of point-of-sale levies, pre-disposal fees, packaging taxes, as well as alternative pricing or contracting arrangements for waste management. Positive incentives may include tax credits for capital investments in waste prevention technologies or processes, or direct support or subsidy for adoption of such technologies and/or practices.
Two key programs aimed at preventing waste by altering the way waste management services are provided and paid for are Pay-As-You-Throw (PAYT) or Variable Rate systems, and Resource Management (RM) Contracting, primarily aimed at the business sector. While these approaches are initially aimed downstream at the waste produced, ultimately they promote waste reduction and reuse.
Pay-As-You-Throw (PAYT)
As the name implies, Pay-As-You-Throw (PAYT) changes the way in which garbage collection and disposal services are priced. Rather than the traditional fixed bill for unlimited collection, PAYT systems set their charges based on the amount of waste disposed (usually per bag or can, sometimes by weight). This approach mirrors how we pay for other utilities such as electricity, gas, and water, and provides waste generators (households or businesses) with an incentive to reduce the amount of waste discarded, either through waste prevention, reuse, or recycling. While most diversion of waste from disposal results from increased recycling rates, a significant fraction (5-10% or more) is related to waste prevention efforts. As noted in the program descriptions below, over the past two decades PAYT programs have become increasingly popular throughout the country.
Resource Management Contracting
RM contracting addresses an essential and often overlooked approach to waste prevention: the contractual relationships between waste generators and waste management service providers. Contracts are pervasive in the commercial/industrial waste management field and directly influence the way the vast majority of businesses manage their waste. Unlike traditional solid waste service contracts, an RM approach compensates waste contractors based on performance in achieving the organization's waste reduction goals rather than the volume of waste disposed. As a result, RM contracts align the interests of generators and contractors so that they share the financial benefits of cost-effective resource efficiency through prevention, recycling, and recovery.
RM contracting is similar to performance-based contracting that has been used in the energy and the chemical purchasing, use, and management industries for a number of years. Under RM contracting the contractor takes responsibility for managing a company’s waste and is paid a set fee, at or below the company’s current waste management costs. The contractor adopts the risk for waste management but also gains financial rewards for making it more efficient. The efficiency gains are shared between the contractor and the business.
RM contracting recognizes that waste management is not part of the core business or expertise of most companies. Through an RM contract, the contractor provides the waste management expertise and has a vested interest in minimizing waste.
Waste Prevention and Reuse Efforts 23 Background Paper #7 Outside of Oregon December 2006

5.2 Program Descriptions
Pay-As-You-Throw (PAYT)
According to a recent inventory of state regulations and policies, as of 2001 at least four states mandated some form PAYT or Variable Rate pricing: Iowa, Minnesota, Washington, and Wisconsin, while Oregon includes PAYT as one of the options from a menu of choices communities must select. 3 Thirteen states gave preference in their financial incentives or grants to communities with PAYT systems, and about 33 states actively promote or offer education about PAYT. Leading states where PAYT is most common include California, Iowa, Massachusetts, Michigan, Minnesota, New York, Ohio, Oregon, Vermont, Washington, and Wisconsin.
In Massachusetts, for example, as part of the state Department of Environmental Protection’s 2006 Revision to the Solid Waste Master Plan, the Department continued its longstanding support for Pay-As-You-Throw programs through grants and technical support for municipal PAYT programs. In 2004, 116 Massachusetts municipalities had implemented PAYT programs with a few programs added since that time.
Resource Management Contracting
To date, the U.S. Environmental Protection Agency and several states (e.g., Massachusetts, Nebraska, Nevada) have done much to test the effectiveness of RM contracting. USEPA has been promoting Resource Management contracting through its WasteWise Program and website (see http://www.epa.gov/epaoswer/non-hw/reduce/wstewise/wrr/rm.htm), which includes an extensive guidance document on “Resource Management: Innovative Solid Waste Contracting Methods.” The agency has also sponsored training of businesses and waste management firms.
Massachusetts DEP funded a two-phase pilot project assessing RM contracting practices and potential in nine diverse commercial, industrial and institutional settings in Massachusetts. Pilot projects in Massachusetts and elsewhere have shown great promise for diverting significant fractions (an additional 15-30%) of the commercial waste stream. Public sector RM projects in other states have been implemented at the county and school district levels.
While not a state-incentivized program, General Motors’ successful implementation of RM contracting in several of its North American plants provides a sense of the potential impact of RM. GM saw dramatic waste reductions, increases in recycling, and cost savings. Raytheon has also recently implemented RM contracting in its Northeast operations and will be closely monitoring its waste reduction impacts.
5.3 Challenges
A key challenge is to help create a sustainable, long-term market for RM services so waste management companies as well as firms with procurement expertise and industrial and commercial operations experience develop RM capabilities and become RM service providers. To accomplish this may require resources from DEQ to educate and motivate both potential customers and suppliers of RM services. The goal should be to develop and implement a critical
3 Skumatz Economic Research Associates, 2001.
Waste Prevention and Reuse Efforts 24 Background Paper #7 Outside of Oregon December 2006
mass of RM programs, so that customers and RM service providers will perpetuate RM contracting activity without significant further resources from the Department.
5.4 Assessment
Pay-As-You-Throw programs for the municipal (residential) sector are already widely practiced in Oregon. Nonetheless, based on the vast experience in other jurisdictions, there may be room to refine rates and implementation strategies to make it even more effective.
Resource Management contracting pilots in Massachusetts and elsewhere show significant waste reduction potential, on the order of 15-30%. RM aligns the interests of businesses with their Resource Management contractors and shifts the incentives toward minimizing waste. RM contracting can be applied across many industrial and commercial sectors.
While in the near term RM contractors are likely to continue to come from the waste management and recycling industry and focus primarily on diversion and recycling, the potential exists for transitioning RM contracting into an effective waste prevention strategy. Such a transition will require the RM industry to mature and attract new contractors with expertise in a range of industrial and commercial operations, including procurement, product design, and packaging. Over time, the strategic alliances formed may enable RM contractors to influence upstream decisions related to product design and material choice, use, and handling, not just waste management practices. This upstream focus will be necessary for RM contracting to achieve more significant waste reductions and contribute to DEQ’s aggressive waste prevention objectives.
There are strong precedents for this kind of approach in the energy and the chemicals arenas. As a voluntary approach, there should be little opposition from industry, though the waste management industry may be reluctant to embrace a new business model. Moreover, waste management practices and costs generally do not receive much attention from business managers. State educational and training efforts would need to be offered to businesses and potential RM service providers, emphasizing the potential for win-win outcomes.
Coupled with other initiatives, RM contracting holds considerable promise as a means to help transform business thinking from a waste management mentality to a waste prevention and materials management approach. To strengthen its Leadership by Example efforts, DEQ could consider employing RM contracting for its own facilities (where permissible), and include information on Resource Management contracting in its existing education and technical assistance efforts.
Waste Prevention and Reuse Efforts 25 Background Paper #7 Outside of Oregon December 2006

6 Regulatory Requirements
6.1 Overview
6.2
A variety of regulatory requirements have been successful in achieving waste prevention targets. Among the most effective initiatives are: extended producer responsibility (EPR) and material or waste bans.4 These programs often lead to or are closely linked with the alternative business models, such as Design for Environment or product stewardship, described above in chapter 3. It is important to note that while it may be more difficult to gain political support for regulatory requirements than voluntary programs, they provide a more potent tool to government agencies for reaching significant waste prevention targets.
As defined by the Organization for Economic Co-operation and Development (OECD), EPR is an environmental policy approach in which a producer’s responsibility, physical and/or financial, for a product is extended to the post-consumer stage of a product’s life cycle. There are two key features of EPR policy: the shifting of responsibility (physically and/or economically, fully or partially) upstream to the producer and away from municipalities; and providing incentives to producers to take environmental considerations into the design of the product. European countries have implemented EPR programs for many years, and have had particular success with reducing packaging materials through fee systems and other mechanisms.5
Material or waste bans can also be powerful motivators for preventing waste, encouraging reuse, or reducing toxicity. Bans can be focused either on product inputs or on product disposal. Both are aimed at changing the practices of businesses and consumers. Some programs prohibit use of certain materials in product formulation or manufacture, such as mercury. These are generally pursued to eliminate or reduce toxic materials and are based on an understanding that viable alternative materials exist. Thus, these are often referred to as toxics substitution initiatives. Other programs ban the disposal of certain types of materials, either because of their toxicity, or their high volume in the waste stream and availability of alternative management options.
Program Descriptions
San Francisco, California
Following a new state regulation that bans a wide range of common household hazardous waste products from the trash, in early 2006 the San Francisco Board of Supervisors passed an EPR Resolution that:
Supports statewide legislation and local initiatives requiring manufacturers to take responsibility for collecting and recycling their products at the end of their useful life;
4 Mandatory requirements and specifications for governments to purchase environmentally preferable products (EPP) may also be considered a regulatory approach. For purposes of this review, since EPP programs are often voluntary guidelines and because their direct focused is government internal behavior, they are discussed below in chapter 7, Government Leadership by Example.
5 Oregon DEQ has produced an excellent fact sheet on International Packaging Regulations, available at: http://www.deq.state.or.us/lq/pubs/docs/sw/packaging/intlpkgregulations.pdf.
Waste Prevention and Reuse Efforts 26 Background Paper #7 Outside of Oregon December 2006

Urges the California Legislature to pursue statewide extended producer responsibility legislation targeted at universal waste.
Advises the City’s Department of the Environment to develop EPR policies such as leasing products rather than purchasing them, and requiring the manufacturers of products sold to City departments to offer less toxic alternatives, and to take responsibility for managing their products at the end of their useful life; and
Commits the City and County of San Francisco to continue to support EPR initiatives.
While it is too early to assess the impacts of the City’s new EPR Resolution, it is perhaps the strongest statement to date about EPR from a local government in the U.S. The Resolution may be on the cutting edge of a shift in thinking among local governments, which have historically borne the responsibility for collecting and disposing of waste. As the resolution puts it, “By covering the costs of collection and disposal, local governments are subsidizing the production of waste because manufacturers know that whatever they produce the local government will foot the bill for recycling or disposal.”
British Columbia Product Stewardship Programs
The BC Ministry of the Environment created an Industry Product Stewardship Business Plan (approved in 2002), which established the framework to support the development of the Product Stewardship Program. The program has two key features:
Based on Extended Producer Responsibility (EPR) concepts, it places the onus for end-of-life product management (physically and/or economically, fully or partially) on producers and consumers rather than general taxpayers; and
It provides incentives to producers to consider environmental impacts in the design of products.
To support the development of new programs, an October 2004 Recycling Regulation includes core EPR requirements for beverage containers, and includes plans to transform electronics (e-waste), tire, and battery recycling programs into EPR programs.
King County, Washington
Product stewardship is an important component of King County’s 2001 Comprehensive Solid Waste Management Plan. The Solid Waste Division promotes product stewardship in order to:
Reduce local government’s waste disposal costs by sharing the responsibility for managing certain wastes with manufacturers, retailers and consumers;
Reduce the use of toxic materials in products ; and
Conserve resources by encouraging waste prevention, reuse and recycling through good product design.
The King County Product Stewardship and Strategies report (2002) focuses on the county’s initial stewardship targets: electronics equipment and products containing mercury, provides background information on policies, and describes how target products and materials are selected. The County’s Solid Waste Division is a member of regional and national organizations (the Northwest Product Stewardship Council, and the Product Stewardship Institute), that work
Waste Prevention and Reuse Efforts 27 Background Paper #7 Outside of Oregon December 2006

with businesses, government agencies and nonprofit groups to promote product stewardship principles and reduce the health and environmental impacts of consumer products.
As part of its overall strategy, the County established the Take it Back Network and initiated the Regional Take it Back Pilot Projects (funded by grant as part of EPA’s Plug-In To eCycling Campaign) to collect and reuse or recycle used electronics. It has also been a key player in the development of recent Washington state legislation to require the take back of certain electronics.
Massachusetts Department of Environmental Protection
Massachusetts is one of a number of states that employ waste bans that prohibit disposal of certain materials. The Code of Massachusetts Regulations (310 CMR 19.017) authorizes Massachusetts DEP to restrict or prohibit certain components of the waste stream from disposal if the Department determines that disposal of the material presents a potential adverse impact to public health, safety or the environment. In determining whether to restrict or prohibit the disposal of other materials the Department may consider the following criteria: 1) the nature and degree of potential adverse impacts; 2) the quantities of restricted materials generated; 3) the availability of non-disposal management options for the restricted materials; 4) the economic impact on the facility, class of facilities or generators subject to the restriction; and 5) other factors it deems relevant.
As summarized in the table on the following page, the waste bans started in the early 1990s with lead batteries, leaves and yard waste, tires, white goods, paper, aluminum and other metals, and certain plastics. It was expanded in 2000 to include cathode ray tubes (CRTs), and most recently in July 2006 with the inclusion of certain construction and demolition (C&D) waste including asphalt paving, brick, concrete, metal and wood. The recent addition of C&D waste was in the works for several years and resulted from a multi-stakeholder process. A key issue that delayed implementation was the need to ensure that adequate materials processing and reuse capacity was available in the state to handle the significant quantity of C&D material the ban was expected to generate. DEP addressed this through technical assistance and financial incentives to materials processors and the funding and documentation of pilot projects to demonstrate the feasibility of alternative management methods. With C&D waste accounting for almost a third of waste disposed in Massachusetts, the Department plans to expand the list of banned C&D materials in the near future.
While the waste bans have resulted in significant increases in recycling of the banned materials, they have also provided strong incentives for reuse and to some extent waste prevention. It is important to note that along with the waste bans, DEP implemented a compliance and enforcement program to ensure proper implementation. This system includes a permitting and inspection program, including waste stream monitoring and load inspections, for waste management facilities. As with other programs, the effectiveness of the enforcement efforts, especially in the early years, is dependent on adequate funding.
Waste Prevention and Reuse Efforts 28 Background Paper #7 Outside of Oregon December 2006
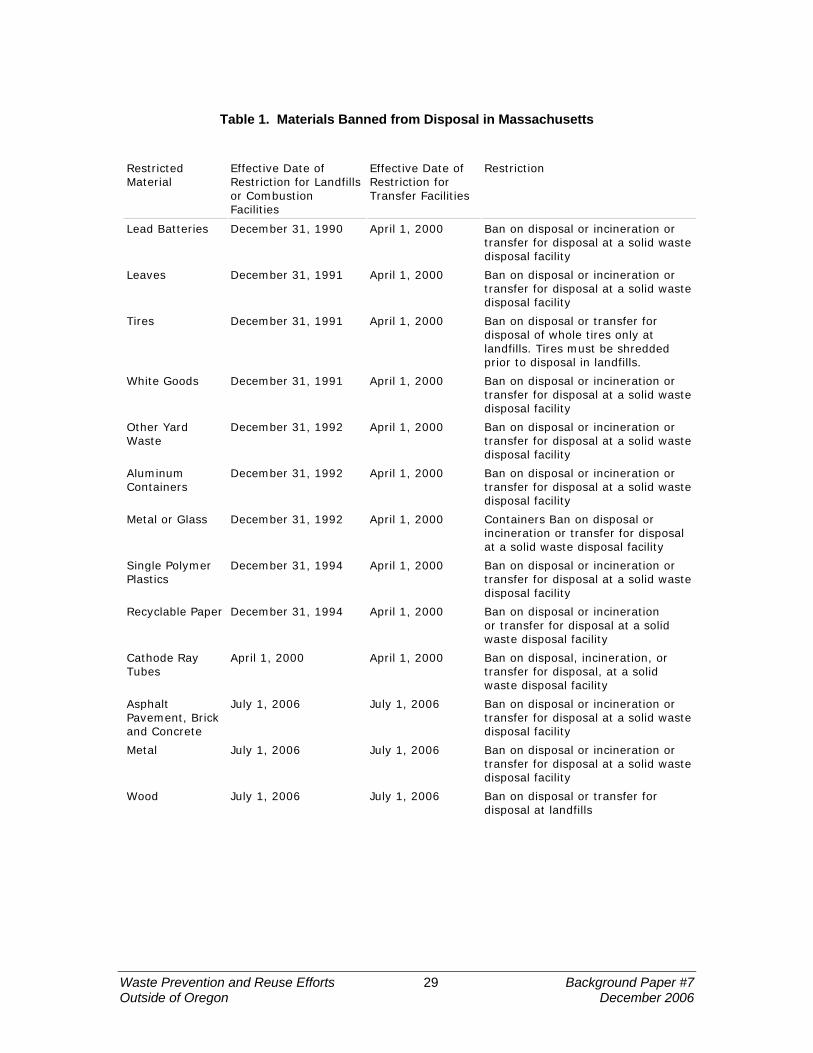
Table 1. Materials Banned from Disposal in Massachusetts
Restricted Material
Effective Date of Restriction for Landfills or Combustion Facilities
Effective Date of Restriction for Transfer Facilities
Restriction
Lead Batteries December 31, 1990 April 1, 2000 Ban on disposal or incineration or transfer for disposal at a solid waste disposal facility
Leaves December 31, 1991 April 1, 2000 Ban on disposal or incineration or transfer for disposal at a solid waste disposal facility
Tires December 31, 1991 April 1, 2000 Ban on disposal or transfer for disposal of whole tires only at landfills. Tires must be shredded prior to disposal in landfills.
White Goods December 31, 1991 April 1, 2000 Ban on disposal or incineration or transfer for disposal at a solid waste disposal facility
Other Yard Waste
December 31, 1992 April 1, 2000 Ban on disposal or incineration or transfer for disposal at a solid waste disposal facility
Aluminum Containers
December 31, 1992 April 1, 2000 Ban on disposal or incineration or transfer for disposal at a solid waste disposal facility
Metal or Glass December 31, 1992 April 1, 2000 Containers Ban on disposal or incineration or transfer for disposal at a solid waste disposal facility
Single Polymer Plastics
December 31, 1994 April 1, 2000 Ban on disposal or incineration or transfer for disposal at a solid waste disposal facility
Recyclable Paper December 31, 1994 April 1, 2000 Ban on disposal or incineration or transfer for disposal at a solid waste disposal facility
Cathode Ray Tubes
April 1, 2000 April 1, 2000 Ban on disposal, incineration, or transfer for disposal, at a solid waste disposal facility
Asphalt Pavement, Brick and Concrete
July 1, 2006 July 1, 2006 Ban on disposal or incineration or transfer for disposal at a solid waste disposal facility
Metal July 1, 2006 July 1, 2006 Ban on disposal or incineration or transfer for disposal at a solid waste disposal facility
Wood July 1, 2006 July 1, 2006 Ban on disposal or transfer for disposal at landfills
Waste Prevention and Reuse Efforts 29 Background Paper #7 Outside of Oregon December 2006

Germany Packaging Ordinance and the Green Dot Program
In 1991, Germany established the Ordinance on the Avoidance of Packaging Waste (Packaging Ordinance). The Ordinance was expanded several times, and as of 1993, required all manufacturers – foreign and domestic – to take back and recycle or reuse all types of consumer packaging used to contain and transport goods from the point of sale to consumption. Manufacturers, retailers and distributors may be exempt from the Ordinance if they participate in the Duales System Deutschland GmbH (DSD), or Dual System of Germany. The DSD, set up in 1990 as a nonprofit, collects, sorts and recycles post-consumer packaging from households and businesses throughout Germany. This prompted an industry initiative, the Green Dot Program, to avoid individual take-back regulations. Participants in this system label their products with the Green Dot, which indicates that packaging should not be returned to the manufacturer or distributor, but instead should be collected and recycled through the DSD.
The Duales System Deutschland GmbH (DSD), or Dual System of Germany:
Maintains over 600 companies as members.
Requires its members to pay a license fee (for the Green Dot trademark) based on the type and weight of the packaging materials (this acts as an incentive for waste prevention).
Requires members to adhere to certain standards for the use of certain types of packaging materials.
Motivated the European Union to implement the European Packaging Directive (1994) to standardize national measures and set recovery targets for packaging.
Is now licensed to 20 other E.U. countries who are trying to comply with the Packaging Directive.
While the Packaging Ordinance has established an elaborate system for recycling packaging materials, it has also provided an important incentive to prevent waste through packaging redesign and minimization.
The Netherlands Packaging Covenant III
The Netherlands has also focused on reducing and recycling product packaging, using a voluntary system based on a series of covenants. The first Packaging Covenant was signed in 1991. The third Packaging Covenant (PC III) came into effect in 2002 and expired in January 2006. It is being replaced by the Packaging, Paper and Board Management Decree to govern waste collection, prevention and recycling. The new approach will require producers to pay for the separate collection or post-separation of household packaging waste. Since 1991, the PC has been successful in continuously reducing the use and disposal of packaging material and consequently the environmental impact of packaging waste. In the early years, reductions in packaging waste were on the order of 6-15% per year. In the last few years, however, reductions have declined to about 1-2% per year. The program’s monitoring system has been reviewed and altered many times since 1991, and requires ongoing scrutiny and refinement.
Objective for prevention of packaging: The Packaging Covenant stipulated that the total volume of packaging would not rise by more than two-thirds of the percentage increase of GDP between the years of 1999 and 2005. This objective recognizes the need to decouple waste generation and economic activity. The GDP grew by 10.2% during this period, while the total volume of new
Waste Prevention and Reuse Efforts 30 Background Paper #7 Outside of Oregon December 2006

packaging on the market increased by 8.8%, exceeding the objective’s target of no more than 6.8%.
There was also an agreement to cap disposal of packaging waste in 2005 at 850 kilotons, but 2004 data (935 kilotons disposed) indicate this target is a long way from being reached.
6.3 Challenges
6.4 Assessment
Several challenges are associated with the implementation of regulatory requirements. The first is political will. While mandatory programs and requirements are often considerably more effective than voluntary ones, there is frequently resistance to new regulations by certain stakeholders because they may require changes and potential cost increases in established manufacturing processes or business practices. The political power of such opponents can often inhibit the adoption of strong mandatory programs. Implementing effective processes in which stakeholders with different interests are engaged in the development of new regulations can be time-consuming and difficult. The second challenge relates to enforcement, which is closely linked with resources and staffing constraints on the part of governments. A lack of human and financial resources can significantly weaken regulatory program effectiveness. In Massachusetts, for example, the DEP’s budget has been consistently reduced over the past several years, resulting in cuts in waste facility inspections and enforcement.
Experience in several jurisdictions, including Massachusetts, British Columbia, Germany, and elsewhere, has demonstrated that regulatory programs can have an important impact on preventing waste and encouraging reuse. Germany (through the Green Dot program) is a leader in Europe for packaging reduction and recycling. Between 1990 and 2004, the DSD has led to a 14% decrease in per capita consumption of packaging.
The Massachusetts waste bans, combined with effective public education, have been enormously successful in promoting home composting and preventing yard waste from entering the waste stream. Also, regulatory requirements often spawn related product redesign efforts by manufacturers to prevent waste and facilitate product collection and reuse. While many programs do not systematically track their waste prevention impacts, and it is difficult to do so, establishing reduction targets and an accepted method for tracking progress can be an effective way to motivate businesses, consumers, and agency staff responsible for program implementation. EPR programs offer governments a tool to shift responsibility for end-of-life product management by internalizing the external environmental costs of goods and services, and are a means to help reshape how society thinks about production and consumption behavior. In the absence of national regulations, regional efforts such as the Northwest Product Stewardship Council promote broader adoption of EPR approaches, which may lessen the burden of multiple state-level requirements on manufacturers.
Waste Prevention and Reuse Efforts 31 Background Paper #7 Outside of Oregon December 2006

7 Government Leadership by Example
7.1 Overview
7.2
Government leadership and involvement in waste prevention programs has a strong bearing on program effectiveness. There are numerous reasons for governments to champion waste prevention programs, including: demonstration that such programs are feasible, and that governments should play a role in reducing a state’s waste generation; incorporation of policies and tactics in the public realm that the government recommends to others; and transfer of lessons learned and best practices with other governments.
Government leadership is demonstrated in several types of programs, including Environmentally Preferred Procurement/Purchasing (EPP), setting regional targets for waste prevention and reduction, and internal practices such as duplex copying and green building.
Program Descriptions
California Integrated Waste Management Board (CIWMB)
In 1999 new California legislation (AB 75) required state agencies and large state facilities to divert at least 25 percent of their solid waste from landfill disposal or transformation facilities by January 1, 2002, and at least 50 percent by January 1, 2004. Diversion was defined to include reducing potential waste by means such as source reduction, recycling, and composting. Under the law, each state agency and large state facility must adopt and submit an integrated waste management plan (IWMP) to the CIWMB, which outlines the steps to be taken to achieve the mandated waste diversion goals. The law also requires state agencies and state facilities to submit annual reports to CIWMB regarding solid waste reduction beginning April 2002.
The CIWMB bolstered its efforts in November 2001, when it adopted a Strategic Plan highlighting the following themes: sustainability, product stewardship, energy recovery, environmental justice, safe disposal of waste, and the promotion of a zero-waste philosophy. The last goal, “Zero-Waste,” is an outstanding waste prevention effort by a public entity, and the details and objectives for meeting the goal are outlined below.
Overview of Goal 7, Zero-Waste:
“Promote a ‘zero-waste California’ where the public, industry and government strive to reduce, reuse or recycle all municipal solid waste materials back into nature or the marketplace in a manner that protects human health and the environment and honors the principles of California’s Integrated Waste Management Act.”
Maximize waste reduction and use the most effective processing or manufacturing practices to optimize efficiency and conserve natural resources through both front-end (e.g. source reduction) and back-end (e.g. recycling) methods as well as by using waste to generate energy.
Goal 7 Objectives (strategies to meet these objectives are detailed in the appendix):
Promote source reduction to minimize the amount of waste generated.
Promote best business practices in product manufacturing and handling.
Waste Prevention and Reuse Efforts 32 Background Paper #7 Outside of Oregon December 2006

Encourage recycling activities and new technologies in all business and residences.
Promote new or existing technologies and processes to address existing or emerging waste streams.
Work with other State agencies to promote zero-waste strategies that would ultimately put State agencies in a position to lead by example.
San Francisco, California
San Francisco has a number of innovative City programs that promote waste reduction and reuse through government leadership:
Precautionary Principle – In 2003 the San Francisco Board of Supervisors adopted a set of environmental regulations for the City and County of San Francisco that recognizes the Precautionary Principle as the guiding model for future legislation. This approach asks whether a given product or practice is safe, whether it is really necessary, and whether products or practices with less environmental impact would perform just as well.
Green Building – The City’s Environmental Code (Chapter 7) reflects San Francisco’s commitment to green building and requires that new municipal buildings and significant renovations of 5,000 square feet or more meet the LEED Silver standard. It also established the interagency Resource Efficient Building (REB) Task Force to guide development of City green building standards and oversee their implementation. The Department of Environment published an extensive Green Building Compliance Guide for San Francisco Municipal Buildings as a resource and step-by-step guide for professionals working on the planning, design, construction, operation, and demolition of City buildings.
Less-toxic Purchasing – San Francisco’s Environmentally Preferable Purchasing Program works to minimize the purchase of products containing hazardous ingredients used in the City's custodial services, fleet maintenance, and facility maintenance in favor of using alternate products that pose less risk to City employees and to the environment. The Program develops guidelines to determine when the City should make purchasing changes to support the goal of using of less harmful products, and has developed a list of environmentally preferable practices and products for City Departments to use. This is institutionalized in the Environmentally Preferable Purchasing Ordinance, which is Chapter 2 of the City and County of San Francisco Environment Code.
City of Seattle, Washington
Seattle’s Paper Waste Prevention Campaign aims to reduce the environmental impact associated with the City’s purchase, use and recycling of printer and copier paper through reducing overall consumption of paper and other practices. Executive Order (2005) calls for City departments to reduce paper consumption by 30% by end of 2006 and purchase 100% recycled content paper. Progress toward the 30% reduction goals is included as part of the performance evaluations of department managers. From January to May, 2006 the City’s paper consumption fell 8-12% compared with the same period in 2004.
King County, Washington
The Green Building Ordinance in King County, adopted in 2005, charges all County departments to incorporate the LEED rating system as the standard for all projects. The County established a
Waste Prevention and Reuse Efforts 33 Background Paper #7 Outside of Oregon December 2006

Green Building Team consisting of representatives from various departments including Natural Resources and Parks, Transportation, Development and Environmental Services, Finance, and Executive Services. The team has expertise in project management, architecture, design, landscape architecture, engineering, resource conservation and budget analysis, and promotes the use of green building practices in all buildings that the county constructs, remodels and renovates.
Massachusetts Department of Environmental Protection
The Massachusetts DEP recently established a surplus office equipment reuse program for state agencies, municipalities and other institutions. The program includes a user-friendly website for state agencies and others seeking surplus equipment, and facilitates exchanges, saving money for both parties and avoiding sending usable office equipment for disposal.
7.3 Challenges
7.4 Assessment
Several challenges pertain to the Government Leadership by Example programs, not the least of which is budgeting the necessary resources to initiate and maintain programs. There are also logistical challenges in implementing many of the above programs in terms of ensuring that the appropriate infrastructure exists for material reuse. For example, maximizing the reuse of C&D materials (or used office equipment) requires adequate collection and storage infrastructure as well as creation or facilitation of ready markets to utilize the C&D materials.
CIWMB claims to have been extremely successful, as state agencies reported diverting 77% of their total waste by 2002, far surpassing their target of 25% waste diversion by 2002 and 50% by 2004. While some of the diversion from disposal resulted from waste prevention and reuse, the fraction is not readily available, but it is clear that the majority was from recycling.
Perhaps the greatest success for Government Leadership by Example programs is in the area of EPP. Many states, including Oregon, have implemented aggressive green procurement programs that have had significant impacts in promoting a whole range of environmentally preferred products from chlorine free paper with high post-consumer content, to building specifications requiring waste preventing building techniques. Some states such as Massachusetts have achieved standard price contracts with suppliers of such products that allow municipalities and other non-state public agencies to purchase these goods and services under the same preferential terms as the state. Estimates of the value of purchases under EPP programs run into billions of dollars annually for some of the larger states.
The green building area in particular has seen considerable success, and as states’ experience has increased, many have moved from an EPP focus to an integrated design approach in which the whole building is looked at an integrated system from the outset. The result is not only the prevention of significant amounts of construction waste, but also reductions in energy and water resources, and their associated costs, used throughout buildings’ lifecycle.
Waste Prevention and Reuse Efforts 34 Background Paper #7 Outside of Oregon December 2006

8 European Sustainable Consumption Initiatives
8.1 Overview
While technological development and innovation have significantly increased resource efficiency and improved environmental outcomes in the U.S. and elsewhere, increased consumption and changes in lifestyles associated with increased wealth tend to outweigh such gains. “Sustainable consumption” initiatives in Europe are at the cutting edge of waste prevention efforts and address deep issues concerning values and lifestyle choices. The potential of these programs for waste reduction goes far beyond conventional programs. They are, therefore, given special focus in this section. Here we highlight both the broad initiatives at the E.U. level, as well as selected best practices at the member country level, where much of the policy formulation and implementation activity occurs to influence consumption habits and environmental performance. This review is not intended to be exhaustive, as there are a myriad of local, national, and E.U.-wide sustainable consumption efforts underway. Rather, it is meant to provide a clear sense of the European framework and an understanding of selected key accomplishments in this area.6
In 2002, at the World Summit on Sustainable Development in Johannesburg, European Union (E.U.) countries pledged to advance policies for sustainable consumption and production (SCP). The European Council followed up on this commitment in 2003 by developing a 10-year framework. This 10-year framework, as part of the Marrakech process (named after the location for the first International Expert Meeting in June 2003) includes the creation of a Regional Strategy on Sustainable Consumption and Production and an accompanying Regional Council of Government to oversee the 10-year framework.7
Following commitments “to promote sustainable patterns of production and consumption” made at the 2002 World Summit, the E.U. has developed a range of instruments to promote sustainable consumption and production, including:
- Integrated Pollution Prevention and Control (IPPC)
- E.U. Eco-Management and Audit Scheme (EMAS)
- E.U. proposed directive on eco-design and end-use products
- Social and fair-trade labels
- Thematic strategy on waste prevention and recycling
- Thematic strategy on the sustainable use of natural resources
- New framework for taxation of energy products and electricity
6 It is important to note that according to the OECD, per capita solid waste generation in Europe is already significantly lower than in the U.S. (e.g., approximately 50% less in Germany and 30% less in France).
7 Given the depth of economic and social transformation required to successfully implement SCP programs, a number of countries in the E.U., including the United Kingdom, recognize that SCP efforts have to look well beyond 10 years.
Waste Prevention and Reuse Efforts 35 Background Paper #7 Outside of Oregon December 2006

- Integrated Product Policy (IPP)
- New E.U. chemicals policy (REACH)
- E.U. Environmental Technology Action Plan.
The European Union places its sustainable consumption policies and initiatives within the larger context of the E.U.’s sustainable development initiatives, including the E.U.’s Lisbon Strategy of Economic and Social Renewal (2000), the Sustainable Development Strategy (Gothenburg, 2001), and the Sixth Community Environment Action Programme (6EAP). The primary objective of the Lisbon Strategy is to make the E.U. the world’s “most competitive and dynamic knowledge-based economy” by 2010. The Sustainable Development Strategy supplemented the Lisbon Strategy by bolstering the emphasis on environmental protection, and the need to promote economic, social and environmental objectives simultaneously. The 6EAP focuses on environmental goals for the E.U., including in the area of waste prevention and recycling, and lays out the key objectives, central to which are efforts to decouple environmental pressure and economic growth. These sustainable development policies provide a useful context for both understanding the E.U. sustainable consumption efforts, and also for evaluating the transferability and applicability of E.U. SCP approaches to Oregon.
8.2 Program Descriptions – European Union
The initiatives that comprise the E.U. SCP effort fall into several categories outlined below. In this section, we highlight those that appear to be most relevant for potential use in Oregon.
Resource Productivity Improvements
E.U. Environmental Technology Action Plan (ETAP)
- Survey to identify technology that can effectively address environmental problems.
- Identification of barriers that inhibit development and implementation of these technologies.
- Development of action plan to address barriers. The Sixth E.U. Framework Programme for Research and Technological Development
- Focuses on changing industrial processes and projects to promote SCP and highlights long-term research activities to enhance SCP objectives.
Alternative Business Models
Corporate Social Responsibility
- Campaign and toolkit to raise awareness about CSR (65 national events in 25 countries).
Waste Prevention and Reuse Efforts 36 Background Paper #7 Outside of Oregon December 2006

Public Awareness and Action
Environmental labeling
- The E.U. eco-label (the Flower) was introduced in 1992. A current initiative is in the midst of broadening the range of eco-label criteria.
Report on Sustainable Household Consumption in Europe
- European Environment Agency drafted a contribution to the next “State of the environment and outlook” report, describing sustainable household consumption in Europe including past trends and future projections.
Economic Incentives
Economic Instruments
- Environmentally-related taxes (e.g., on energy, water)
- State aid for environmental purposes
- Trade policies and preferential tariffs
Regulatory Requirements8
Integrated Product Policy (IPP)
- Improve existing mechanisms (the IPP “toolbox”) to make them more product-focused, and optimize the synergies between mechanisms.
- Target products with the greatest potential for improvement and enhance their environmental performance.
Government Leadership by Example
Public Procurement Policies
- Commission Communication about the possibilities for basing public procurement policies on environmental and social factors.
- Handbook on Green Procurement – provides detail on items in the Commission Communication and gives specific examples on how to incorporate environmental considerations into public procurement policies.
8 Through an earlier regulatory initiative, the European Commission’s Landfill Directive (Council Directive 99/31/EC) set aggressive reduction targets for municipal biodegradable waste going to landfills (reaching 65% reduction by 2013). This serves as another incentive for E.U. countries to pursue SCP and other waste prevention strategies.
Waste Prevention and Reuse Efforts 37 Background Paper #7 Outside of Oregon December 2006

- In 2004, adoption of public procurement Directives that establish guidelines for adopting environmental and social considerations into procurement policies.
Analytical Tools
- Indicators: developed by the Commission in order to track progress on meeting SCP and sustainable development goals. Task force created an indicator framework with 10 themes including SCP. The indicators will be revised periodically.
8.3 Program Descriptions – European Nations
Key sustainable consumption programs in Europe at the national level include: Austria: Eco-efficiency Action Programme Finland: National Programme on Sustainable Consumption and Production Germany: National Process of Sustainable Consumption and Production United Kingdom: Government Framework for Sustainable Consumption and Production,
and the U.K. National Resource and Waste Forum
Several other European countries have also introduced sustainable consumption efforts in recent years, including Hungary’s Network for Sustainable Consumption and Production, but there is little information to date on the effectiveness of these efforts.
Finland National Programme on Sustainable Consumption and Production
Based on the work of a multi-stakeholder advisory committee comprising government, business, environmental and consumer interests, in June 2005 Finland released its National Programme to promote sustainable consumption and production. The key objectives of the Programme are to increase the efficiency of the usage of materials and energy through all stages of product life cycles, and to promote environmental education and the development and adoption of environmental technologies. Finland’s Programme recognized that its key challenges included: high usage levels of natural resources, significant harmful environmental impacts outside of Finland due to Finnish consumption and production patterns, and high greenhouse gas emissions.
The committee's proposals include 73 specific measures, and acknowledged that new kinds of policy instruments will be required to reach the proposed targets, including financial incentives such as taxation schemes that encourage eco-efficiency, and leading by example in the public sector regarding public works and purchasing policies.
Importantly, the committee stressed that the quality of life should not be defined primarily by the ownership of material goods. Its recommendations aim to encourage innovations that improve the availability of services, communally owned goods and rentable products. These are examples of the deep changes in lifestyles mentioned in the overview of the European sustainable consumption initiatives, above.
To improve resource productivity, the Programme calls for support of research on technologies and financial instruments to promote more efficient production processes and waste prevention, special service centers to provide technical assistance to businesses, and the development of more concrete targets for improvements in material- and energy-efficiency, and reductions in waste. There is also a focus on promoting new product-service concepts and environmental management systems in the construction sector that encourage favorable waste management
Waste Prevention and Reuse Efforts 38 Background Paper #7 Outside of Oregon December 2006

practices. Other elements include a strong commitment to public sector purchasing strategies to ensure that environmental considerations are integrated into all public sector purchases.
United Kingdom Framework for Sustainable Consumption and Production
The U.K. Framework for Sustainable Consumption and Production was published jointly by the Department of Environment, Food and Rural Affairs (Defra) and the Department of Trade and Industry (Dti) in 2003. It describes how the U.K. is implementing its commitments made at the WSSD and subsequent E.U. meetings. The Framework focuses on decoupling economic growth and environmental degradation, prioritizing efforts based on the most pressing environmental threats, increasing resource efficiency in production of goods and services, and leveraging market changes through government procurement practices and incentives. It calls for taking a holistic approach that considers entire lifecycles of products and services, and intervening as early as practicable in the resource/waste flow process.
The Framework also recognizes the importance of engaging the full range of stakeholders in devising effective SCP initiatives, and suggests that a policy package, rather than a single instrument, is necessary. To date, the United Kingdom’s SCP efforts have included initiatives on energy, water, vehicles, waste, and the use of economic instruments.
Efforts involving economic instruments focus on environmental taxes and are consistent with the U.K. government’s view that decoupling economic growth from environmental degradation requires policies to address externalities. The Climate Change Levy, the landfill tax, and the aggregates levy are all attempts to reflect external costs, implement the “polluter pays” principle, and increase resource productivity. The Aggregates Levy introduced in 2002, for example, reduces demand for primary aggregates (sand, gravel, and crushed rock) by increasing their cost and encourages the use of recycled and secondary materials. The Aggregates Levy Sustainability Fund aims to reduce the environmental impacts per ton of aggregates extraction and helps to stimulate the market for recycled and secondary materials. Similarly, the landfill tax, introduced in 1996, has been increased significantly over time – to £21 per ton for 2006/07 and is expected to increase by at least £3 per ton a year until it reaches a medium to long-term rate of £35 per ton. The government is considering extending it to other methods of disposal, namely incineration, to further promote waste prevention, reuse and recycling. In addition to taxes, a number of funding programs have been established in the United Kingdom to stimulate technological innovation to improve resource productivity.
Finally, through its new approach to “sustainable procurement” the U.K. government aims to use the public sector’s significant buying power to steer the marketplace and provide incentives for environmentally preferable products. With existing commitments regarding procurement of paper, timber, renewable electricity and alternative fuel vehicles are in place, there is considerable room for expansion and improved coordination.
United Kingdom National Resource and Waste Forum
In 2001 the U.K. National Resource and Waste Forum was created. The Forum builds cross-sector solutions and promotes sustainable resource and waste management. It is open to parties committed to realizing these goals and comprises government agencies, businesses, NGOs, and others. The Forum has established the U.K. Framework for Waste Prevention to address the link between increased wealth and waste, and to inform sustainable consumption efforts. There are three phases of this effort 1) information gathering; 2) program development; 3) program delivery and evaluation, The Phase 1 report (August 2003) was intended to inform policy development and focus on priority waste streams with high potential prevention, such as organics (kitchen food wastes), packaging (plastic, glass, paper, metal), paper (non-packaging), single-use disposable
Waste Prevention and Reuse Efforts 39 Background Paper #7 Outside of Oregon December 2006

products, white goods, electronics, and furniture. It also identified three waste prevention components:
Demand side: consumers and communities
Supply side: retailers and manufacturers
Policy side: legislative change
The Forum initially focused on addressing the demand side through a local action toolkit with the following elements:
- Home and community composting of yard, food and other organic waste – potentially 25-30% of household waste
- Smart shopping – how the consumer can reduce packaging waste and single use products
- Paper waste – how householders and community groups can stop unwanted mailings
- Product life – how the community can encourage repair and reuse of products including resale/redistribution
- Service systems – how new businesses can be created which will reduce disposal such as diaper laundering and hire services
The Forum is currently developing programs for the supply side including:
- Packaging workshops for the supply chain - Eco design support for producers - Re-use schemes for refillable packaging - Measures to reduce production of unwanted mailings - Measures to moderate growth in single use products
Policy side initiatives are also underway:
- Measures to reduce production of unwanted mailings - Measures to moderate growth in single use products - Grading systems to encourage life extension of high value products
8.4 Challenges
This section describes several challenges that have emerged from the European SCP efforts. We have focused on the experience in Western Europe, rather than in Central and Eastern Europe, as we believe the experience in the west is more applicable to Oregon. Some of the primary challenges to date are as follows:
• Sensitivity around questioning lifestyles and the cultural notions equating consumption with quality of life
• De-coupling environmental degradation and natural resources use from economic growth
Waste Prevention and Reuse Efforts 40 Background Paper #7 Outside of Oregon December 2006

• Integrating policies intended to address SCP issues. Many such policies operate on different timelines and with different progress indicators and therefore do not optimize synergies between the efforts.
The first challenge listed above – reconsidering lifestyle choices and changing consumer behavior – gets at the core of SCP efforts. Altering consumer values and lifestyles is critical to achieving environmental stewardship beyond levels typically achieved through waste prevention efforts. A review of SCP efforts in 2004 noted that resource use, pollution and waste generation are all expected to continue to increase in Europe due to increased material consumption relating to consumer trends.
The task of reducing consumption is particularly difficult because it requires targeting a variety of variables, and it is often difficult to isolate the impacts or each variable, let alone the interaction between them. For example, it is hard for policy analysts and regulators to distinguish between drivers of individual consumption (affected heavily by personal income, prices, diversity of products, e.g.) and societal consumption (affected primarily by macro-level demographic, economic, technological, institutional, socio-cultural and environmental factors) for the purposes of tracking and reducing overall consumption.9 In addition, it is often difficult to isolate consumption and production patterns from each other; changing the design and production of products will likely influence consumers’ purchasing patterns and create new feedback loops.10 Given the strong cultural inclination in the U.S. toward increasing material possessions and against strong governmental regulation and tax policies, we expect that the task of altering consumer patterns and behavior will be even more difficult to address in the U.S. than in Europe.
8.5 Assessment
In working to develop SCP policies, one must account for the fact that SCP crosses many sectoral and topical boundaries. As such, a varied package of coherent policies – informed by consultation with stakeholders – is critical to a successful effort. In addition, there is a strong need to go beyond technological and efficiency-related policies to target consumer values and lifestyle choices. A coherent package would include supply, demand, and policy oriented tools, with much attention given to policies targeting producer and consumer behavior – namely, focusing on economic instruments and education.
In examining and deciding upon economic instruments to promote SCP, there are several important issues to consider – many of which relate to market failures. The most prominent is the presence of externalities, and incorporating these into SCP policies. As shown in the U.K. experience, this is particularly critical for decoupling economic growth from environmental degradation. The U.K. has initiated a new technique for achieving this; it has developed nine “decoupling indicators” that comprise a “basket of indicators” for SCP. These indicators compare the environmental impacts of certain products, processes or externalities with the associated GDP and/or household consumption. The basket includes economy indicators, resource use indicators and indicators for specific sectors. The basket will be particularly useful in tracking progress toward targets, and helping policy makers assess the extent that various sectors still need to be decoupled.
9 Background Paper: European Stakeholder on Sustainable Consumption and Production. Ostend, Belgium, November 25-26, 2004. (2.1)
10 Background Paper: European Stakeholder on Sustainable Consumption and Production. Ostend, Belgium, November 25-26, 2004. (2.1)
Waste Prevention and Reuse Efforts 41 Background Paper #7 Outside of Oregon December 2006

Other issues for consideration in developing SCP-related economic tools include imperfections in the market such as asymmetrical information, the lack of competition in certain sectors, contractual problems that can present barriers for efficient resource use, a shortage of appropriate skilled labor, access to capital, and methods for stimulating innovation while shifting and restructuring the economy.
Educational efforts will help address both an inclination toward material consumption as well as information failures that may lead consumers to harmful products. One critical message to get across to consumers is that small lifestyle choices can have large implications for the environment and the economy. Governments and other parties should use information, regulation, and economic incentives to raise consumer awareness and promote SCP. Effective examples from the U.K. and elsewhere include eco-labeling, differential tax rates, and a variety of price signals.
Waste Prevention and Reuse Efforts 42 Background Paper #7 Outside of Oregon December 2006

9 Summary Findings
Overall Findings
Individual waste prevention and reuse programs should be integrated in a coherent overall strategy to maximize effectiveness. Standalone elements such as education or technical assistance for home composting, for example, are much more effective when combined with economic or policy incentives such as Pay-As-You-Throw pricing or disposal bans. Similarly, technical assistance efforts for Design for Environment programs have greater impact in the context of Extended Producer Responsibility (EPR) programs or requirements. For maximum impact, strategies should incorporate supply-side, demand-side, and policy-side initiatives in a consistent and mutually reinforcing framework.
Sustainable consumption initiatives, such as those underway in Europe, offer significant waste prevention potential, well beyond the levels currently deemed achievable in the U.S. The potential is greatest where the focus is not limited to technological improvements and dematerialization, but includes consideration of values and lifestyle changes such as downsizing of living space, increased reliance on public transit and car-sharing rather than private vehicle ownership, and adopting lifecycle and precautionary approaches as a consumer of goods and services.
Focus on priority materials and/or sectors (based on waste reduction potential assessment, including both prevention and reuse). As part of their broader waste reduction efforts (prevention, reuse and recovery), in order to prioritize their programmatic resources and achieve the “best bang for the buck” the states of Washington and Massachusetts have targeted materials and sectors based on tonnage remaining in the disposal waste stream and their waste reduction potential. In Massachusetts, for example, this approach resulted in programs for commercial and residential organics (commercial food waste and home composting), and C&D, especially wood, asphalt shingles and gypsum wallboard. In Washington, the Department of Ecology has a similar focus on C&D waste, which accounts for 25% of annual waste generation in the state, and organics, which comprise another 25% of Washington’s annual generation. Note that much of Washington’s organics cycle activity is for recycling/composting, not reusing edible food.
Economic instruments such as taxes or fees should be part of the mix, but should be linked to long-term waste prevention goals in the context of increasing resource productivity. Getting price signals right for goods and services by including environmental externalities is an important element for achieving the structural changes in the economy that are required to move toward a sustainable production and consumption system.
Measuring effectiveness of waste prevention programs is challenging but important. The old sayings “what gets measured gets done” and “measure what matters” hold some truth. Measurement of waste prevention is critical for gauging progress and for targeting program efforts and resources. Unfortunately, waste prevention measurement is often quite challenging due to several factors. First, for educational and other programs, direct measurements are generally infeasible and alternative metrics must be used as a proxy; such as the numbers of people reached by a certain program. Second, there are many factors that impact the generation of waste, such as changes in general economic conditions. While some of these can often be addressed by normalizing the data (based on economic activity levels, for example), there is often a lack of good baseline data for comparison. This observation was confirmed repeatedly in the literature review and interviews. And third, there is often a
Waste Prevention and Reuse Efforts 43 Background Paper #7 Outside of Oregon December 2006

time lapse between the initiation of waste prevention programs and their impact, such as Design for Environment efforts to increase durability of appliances. Nonetheless, a number of jurisdictions (e.g., the OECD) have identified meaningful metrics for a variety of waste prevention techniques and DEQ should consider doing so.
Government partnerships with the private sector, NGOs and other stakeholders are critical for the successful development and implementation of waste prevention and reuse programs. Policies and programs developed by government agencies without meaningful involvement by the citizens, businesses, and other organizations ultimately responsible for changing their production or consumption patterns will not gain the support necessary for effective implementation.
Resource Productivity Improvement Findings
Many Resource Productivity Improvement programs, in particular, pollution prevention and light-weighting, have already proven to be highly effective in preventing waste.
Emerging approaches such as industrial ecology and dematerialization through micro- and nanotechnology hold enormous promise, but the appropriate role of government and level of public effort have not yet been entirely worked out.
Alternative Business Models Findings
The range of Design for Environment (DfE) experience indicates that incentives are key for getting manufacturers to redesign their products to reduce waste, toxicity, or other environmental impacts. To the extent possible, standardizing environmental purchasing criteria beyond an individual municipality or even state would ease the burden on manufacturers and suppliers for meeting waste prevention and other environmental criteria.
To date, public policy has played little role in promoting servicizing (selling a service or a function rather than a product). There are however, a number of possible government policy initiatives (e.g., removal of virgin material and disposal subsidies, or tax policy which favors producer, not customer, ownership of durable goods) that could help realize the potential environmental gains associated with product-based services.
Public Awareness and Action Findings
The most effective programs appear to be those that: 1) are well integrated into a larger strategy; 2) identify clear priorities; 3) are linked to quantitative and achievable waste reduction targets or goals, especially if these were developed through an inclusive stakeholder process; 4) include a tracking mechanism to measure success; and 5) relate to or are motivated by regulatory requirements.
The effectiveness of public awareness and education programs is highly dependent on level of resources these programs receive.
Economic Incentives Findings
Coupled with other initiatives, Resource Management (RM) Contracting holds considerable promise as a means to help transform the waste management industry into a waste prevention and materials management industry. While RM Contracting is in its
Waste Prevention and Reuse Efforts 44 Background Paper #7 Outside of Oregon December 2006

infancy, and initial RM program results primarily show enhanced recycling of materials, as new contractors gain experience and the RM industry matures over time, the strategic alliances formed may enable RM contractors to influence upstream decisions related to product design and material choice, use, and handling, not just disposal practices.
Pay-As-You-Throw programs for the municipal (residential) sector are already widely implemented in Oregon. Nonetheless, based on the experience of other jurisdictions, there may be room to refine rates and implementation strategies to make it even more effective.
Regulatory Requirements Findings
EPR programs offer governments a tool to shift responsibility for end-of-life product management by internalizing the external environmental costs of goods and services, and are a means to help reshape how society thinks about production and consumption behavior.
While many programs do not systematically track their waste prevention impacts, and it is difficult to do so, establishing reduction targets and an accepted method for tracking progress can be an effective way to motivate businesses, consumers, and agency staff responsible for program implementation.
Government Leadership by Example Findings
One of the greatest successes of Government Leadership by Example programs is in the area of Environmentally Preferred Purchasing (EPP). The breadth of products and services included in such programs should continue to grow.
The public sector has had considerable success in the green building area, and as states’ experience has increased, many have moved from an EPP focus to an integrated design approach in which the whole building is looked at as an integrated system from the outset. This will result in greater environmental benefits, but its impact on waste prevention is not always consistent.
Waste Prevention and Reuse Efforts 45 Background Paper #7 Outside of Oregon December 2006

Appendix A. Interview Template
Introduction: We have identified your agency as having effective waste reduction programs and would like to follow up with you concerning some specific details of your programs. We are interested in information concerning waste reduction – through prevention and reuse efforts – as distinct from waste recycling.
1. Context and Motivation a. What is the motivation for this program? Are there regulatory requirements in place? b. Is there a specific waste reduction target in place? c. If so, what is the date and quantity set for the target?
2. Program Details a. What year was the program started? b. What location or population does it serve? (e.g., residential, commercial, size) c. What are the major activities of the program and what materials does it affect?
3. Results (by program) a. What is the amount of waste reduced by sector and waste type? (tons, if available) b. What amount is slated for reuse vs. reduction? c. Are there any measurable changes in waste generation levels for the program’s target
audience?
4. Evaluation and Effectiveness a. How effective do you think this program is at reducing waste generation? b. What evaluation (if any) has been conducted for this program? c. What are the results of such evaluations? What are the key findings? Is there
documentation for the results?
5. Costs (by program) a. What are the total annual (for 2005 if available) costs for the following two categories:
i. Staff/labor for the agency implementing the program ii. Other
6. Barriers and Opportunities a. How could the program be improved? Is there untapped potential? b. What opportunities do you see for expanding your waste reduction activities? c. What are the major barriers preventing an expansion of your waste reduction efforts (e.g.,
resources, education/awareness/promotion)? d. Do you think that your program is replicable at the state level (in the U.S.)? e. What are the lessons learned from your efforts? f. What trends for your program do you foresee? What program elements might be most
important in the future?
7. Other Comments a. Are you aware of any similar programs that you see as models elsewhere? Have any
other programs used your work as a model? b. Do you have any other comments you would like to share with DEQ as it develops a
waste prevention strategy?
Thank you very much for your time and assistance with this research.
Waste Prevention and Reuse Efforts 46 Background Paper #7 Outside of Oregon December 2006

Appendix B. References
Calcott, Paul and Margaret Walls, 2000. “Can Downstream Waste Disposal Policies Encourage Upstream ‘Design for Environment’?” American Economic Review, V90 no. 2 (May): pp 233-237.
Calcott, Paul and Margaret Walls, 2005. “Waste, Recycling, and ‘Design for Environment’: Roles for Markets and Policy Instruments,” Resource and Energy Economics.
Cascadia Consulting Group and Ross and Associates, 2004. Expanding Green Building Practices in Washington State, Beyond Waste Consultant Team Issue Paper #5, for Washington State Department of Ecology.
Cascadia Consulting Group and Ross and Associates, 2003. Achieving the Beyond Waste Vision: A Framework for Moving Forward. Beyond Waste Consultant Team Issue Paper #2, for Washington State Department of Ecology.
Cascadia Consulting Group and Ross and Associates, 2003. Waste and Material Flows in Washington. Beyond Waste Consultant Team Issue Paper #1, for Washington State Department of Ecology.
Center for Policy Alternatives, 1996. “Pilot Projects in Source Reduction Measurement” http://www.p2pays.org/ref/12/11221.pdf.
European Commission, 2004. “Sustainable consumption and production in the European Union.”
Finland Ministry of the Environment, 2006. “Getting more from less – Proposals for Finland's national programme to promote sustainable consumption and production.” http://www.ymparisto.fi/default.asp?contentid=137670&lan=en.
Five Winds International, 2006. “Design for Environment (DfE) Opportunities within Alberta’s Waste Stewardship Programs,” Alberta Environment.
Hanisch, Carola, 2000. “Is Extended Producer Responsibility Effective?,” Environmental Science & Technology V34, Issue 7, 170A-175A.
INFORM, Community Waste Prevention Toolkit, http://www.informinc.org/cwp_00.php.
Linderhof, Vincent, Peter Kooreman, Maarten Allers, Doede Wiersma, 2001. “Weight-based Pricing in the Collection of Household Waste: The Oostzaan Case,” Resource and Energy Economics V23: 359-371.
“Long Life Better Than Reincarnation: Promotion Product Durability” at http://www.aislingmagazine.com/aislingmagazine/articles/TAM21/Longer%20Life.html.
Massachusetts Department of Environmental Protection, 2006. Solid Waste Master Plan: 2006 Revision.
Netherlands Packaging Commission, 2005. Annual Report (2004).
North American Sustainable Consumption Alliance, database of projects at http://nasca.icspac.net/. Organization for Economic Cooperation and Development (OECD). 2001. Extended Producer Responsibility: A Guidance Manual for Governments, OECD, Paris.
Waste Prevention and Reuse Efforts 47 Background Paper #7 Outside of Oregon December 2006

Palmer, Karen and Margaret Walls. 2002. The Product Stewardship Movement: Evaluating Costs, Effectiveness, and the Role for Policy, Resources for the Future Report, November. Available at http://www.rff.org/rff/Publications/Reports.cfm.
Ross and Associates and Cascadia Consulting Group, 2003. Moving Toward Beyond Waste in the Industrial Sector. Beyond Waste Consultant Team Issue Paper #3. February 28, 2003. Available at http://www.ecy.wa.gov.
San Francisco Department of Environment, 2004. Green Building Compliance Guide for San Francisco Municipal Buildings. Available at: http://www.sfenvironment.com/aboutus/innovative/greenbldg/gb_compliance_guide.pdf
StopWaste.org, 2006. Alameda County Source Reduction and Recycling Plan, Vision 2010: 75% and Beyond.
Tellus Institute, 2002. Waste Reduction Program Assessment and Analysis for Massachusetts. Prepared for Massachusetts Department of Environmental Protection.
United Kingdom Department of Environment, Food and Rural Affairs (Defra) and Department of Trade and Industry (Dti), 2003. “Changing Patterns: U.K. Government Framework for Sustainable Consumption and Production.”
United Kingdom HM Treasury, 2002. “Tax and the environment: using economic instruments.”
United Kingdom National Resource and Waste Forum, 2006. “Waste Prevention – Winning the Big Prize,” www.nrwf.org.uk/Wasteprevention.htm, accessed 6/06.
United Nations Environment Programme, 2004. “Background Paper: European Stakeholder Meeting on Sustainable Consumption and Production.” Ostend, Belgium, November 25, 2004.
United States Green Building Council, 2005. LEED for Homes Project Checklist, Version 1.72.
United States Environmental Protection Agency, 2000. Pursuing Perfection: Case Studies Examining Lean Manufacturing Strategies, Pollution Prevention, and Environmental Regulatory Management Implications. Prepared under USEPA Contract # 68-W50012.
United States Environmental Protection Agency, 1998. “Municipal Solid Waste Source Reduction: A Snapshot of State Initiatives”, EPA530-R-98-017.
Vermont Builds Greener, 2005. Vermont Builds Greener (VBG) Program, Version 3.5.
Washington State Department of Ecology, 2005. A Brief Guide to the Washington State Beyond Waste Plan: A Plan of Action to Reduce Solid and Hazardous Waste. June 5, 2005. Available online at http://www.ecy.wa.gov/pubs/0504011.pdf.
Washington State Department of Ecology, 2002. Product Stewardship Strategy. April 2002. Available online at http://www.ecy.wa.gov.
Waste Prevention and Reuse Efforts 48 Background Paper #7 Outside of Oregon December 2006

Oregon Department of Environmental Quality
Waste Prevention Strategy – Background Paper #6
Waste Prevention in Businesses
An Overview of Waste Prevention Potential, Benefits, and Barriers
Prepared by
February 2007
Solid Waste Program

Waste Prevention in Businesses
Prepared by David Allaway, Oregon DEQ February 9, 2007
Executive Summary The purpose of this research is to help DEQ’s Waste Prevention Strategy Steering Committee, as well as other interested stakeholders, understand key issues involving waste prevention in the non-residential sector – including the extent of untapped waste prevention potential, benefits and barriers of waste prevention, and characteristics of successful outreach efforts. The research effort identified several primary information sources. However, waste prevention in businesses is a topic that has received relatively little evaluation. The various research efforts that DEQ identified tend to be framed inconsistently, which limits the ability to conduct meaningful comparisons between studies. How much waste prevention potential is there in the business sector? • Generally, businesses may generate upwards of half of all municipal solid waste (MSW). In
addition, product design and packaging decisions made by businesses shape the waste generated by other sectors (households, C&D).
• Waste prevention potential in businesses is generally not well documented, and is challenging to evaluate.
Studies have identified more than 100 different waste prevention best management practices (BMPs). Some apply to multiple business types, while others are specific to a single industry. Even within a single business sector, certain BMPs may not apply to some businesses.
The sheer number of opportunities also demonstrates the complexity of “helping businesses with waste prevention”, since the needs of and opportunities at different types of businesses (as well as businesses within the same sector or with the same type of activity) can be very diverse. There are as many ways to prevent waste as there are to create it.
Within any given business, adoption of many BMPs can be partial, with opportunity for further improvement. This complicates efforts to evaluate untapped potential.
• Most businesses are already “lean” or “efficient” in at least some material uses because they have already adopted a variety of waste prevention BMPs (even though they rarely refer to these using the phrase “waste prevention”). Brainstorming or referring to generic “laundry lists” of options often results in long list of options, many of which for any given business are either not applicable or are already in progress.
• Existing adoption rates vary widely by BMP. For example, several studies have found that fewer than 25% of businesses consistently copy and/or print using both sides of the page. In contrast, many businesses already reuse office supplies and reuse pallets (if they have them).
• Outreach programs that conduct on-site technical assistance visits to businesses have found moderate potential for improvement among participating businesses. For example:
Across the first three communities involved in DEQ’s Resource Efficiency Program, 48% of materials recommendations to businesses were implemented within the first two years of the project. 61% of participants saved a measurable amount of materials, although in some cases the savings were relatively small.
Oregon Department of Environmental Quality Page 1 07-LQ-010

Among the six primary business participants in DEQ’s recent packaging waste prevention project, four (67%) made packaging improvements and three of these four (50% of the total) saved money as a result.
Metro’s Recycle at Work program has demonstrated adoption rates for recommended waste prevention BMPs ranging from 20% (double-sided copying) to 67% (managing mailing lists for outgoing mail to prevent waste).
What are the benefits to businesses of waste prevention? The literature identifies the following benefits: • Reduced disposal/waste management costs. • Reduced purchasing costs. • Potential for reduced labor costs/improved labor efficiency. • Potential for reduced storage costs. • Potential for reduced freight costs. • Potential for improved customer satisfaction. Of these, reduced disposal/waste management costs are typically much smaller – even orders of magnitude smaller – than other savings. Waste prevention practices save businesses much more on procurement than they do on disposal. Potentially even more important than procurement savings are potential labor savings, as many businesses spend significantly more on labor than they do on materials. With few exceptions, most successful waste prevention practices either reduce labor requirements or are at least labor neutral. What are the barriers to waste prevention in businesses? While many barriers are specific to individual best practices, businesses, or industries, there are some barriers that appear to be common across many different businesses. Barriers can generally be classified into three categories: values, information, and structural barriers. Value-related barriers include lack of shared vision and commitment to environmental improvement across different business lines or units, competing workload priorities, resistance to change, and a potential perception that waste prevention means doing without and lowering the standard of living (this may also be an “information” barrier due to insufficient information about economic impacts and sustainability). Information-related barriers include a belief that waste prevention only results in small benefits (although this is in fact sometimes true), misleading information provided by suppliers, uncertainty associated with new technologies or practices, confusion regarding environmental trade-offs both between waste prevention and recycling/recycled content objectives, and confusion regarding the need to prevent waste in the first place. Several studies suggest that waste prevention may be under utilized because recycling is perceived as accomplishing the same benefits. Certainly, the phrase “waste prevention” is not as well understood as recycling is. Structural barriers can be both internal and external to the business. Internal barriers can include diffuse responsibility and decision-making, including corporate policies that run counter to waste prevention interests. Insufficient influence in supply chain management is a frequent barrier, as is management and employee turnover. Other barriers include small potential savings (some
Oregon Department of Environmental Quality Page 2 07-LQ-010

businesses are already very “lean” with limited untapped potential), potential labor inefficiencies or ergonomic concerns associated with specific waste prevention practices, market inertia, and the complexity of certain practices and competing alternatives. What characteristics make for successful business outreach programs? Relatively few business outreach programs have a meaningful waste prevention element. However, based on the literature, the following characteristics likely would contribute to successful outreach to businesses: • Where on-site assistance is provided (such as a “waste evaluation” service), ongoing follow-
through and involvement is valuable (if not essential). • Stable, long-term funding. • In comprehensive or “multi-resource” programs (such as waste prevention plus energy and
water conservation, or even waste prevention and recycling), a concerted focus on waste prevention is essential if it is to achieve results that are meaningful relative to other program elements.
• Securing the support of internal business “champions”. • Engaging suppliers. • Working with and through business trade and professional organizations. • Local presence and/or identity. • Tactical use of data (including case studies) to demonstrate potential savings. • Fully understanding barriers and benefits of the desired behavior(s). • Including labor productivity benefits (and impacts) alongside the more commonly referenced
benefits of avoided disposal, procurement, and environmental impacts. • Being able to address environmental trade-offs between options. • Partnership agreements in writing. • Avoiding the term “waste reduction” and instead focusing on vocabulary that makes more sense
to businesses, such as “resource productivity” or “materials efficiency”. Table of Contents Overview ..............................................................................................................................................4 Methodology and Data Sources ...........................................................................................................4 How Much Waste Prevention Potential Is There in the Business Sector?...........................................7
Metro Telephone Survey..................................................................................................................8 Metro Recycle at Work ..................................................................................................................10 Alameda County Waste Production Measurement Study ..............................................................11 Metro Packaging Market Assessment ............................................................................................16 Other Studies ..................................................................................................................................17
What Are the Benefits to Businesses of Waste Prevention?..............................................................19 What Are the Barriers to Waste Prevention in Businesses?...............................................................20 What Characteristics Make for Successful Business Outreach Programs?........................................23
Oregon Department of Environmental Quality Page 3 07-LQ-010

Overview As part of background research for DEQ’s Waste Prevention Strategy, DEQ staff has undertaken a limited review of waste prevention in businesses. The non-residential sector is where DEQ has conducted much of its targeted waste prevention work in recent years, including the Resource Efficiency Program, Northwest Materialsmart campaign, packaging project, and some technical assistance/outreach. Because of limited resources and the need to coordinate with other research tasks occurring in parallel, this research project excludes construction/remodeling/demolition business activities. Further, the scope of the research is limited by resource constraints and draws heavily on personal experience and published reports already known to staff. Key questions addressed by this research include the following: • How much waste prevention potential is there in the business sector? • What are the benefits to waste prevention in businesses? • What are the barriers to waste prevention in businesses? • What characteristics make for successful business outreach programs? Methodology and Data Sources In preparing this report, DEQ has relied on the following sources of information: 1. “Waste Evaluation Survey”, prepared for Metro by Gilmore Research Group, June 2001.
Gilmore Research Group conducted 624 interviews with Metro-region businesses in April 2001. This includes 370 interviews with business that had received an on-site waste evaluation (WE), and 254 interviews with randomly selected businesses that had not received a waste evaluation (Non-WE). Sample for the WE interviews came from local government databases (in Multnomah, Washington, and Clackamas counties) of those receiving a waste evaluation between 1998 and 2001. Non-WE businesses were selected at random from the general population of area businesses. The surveys were administered by telephone and addressed a variety of questions specific to waste prevention as well as recycling and “buy recycled” activities.
2. Review of Metro-area Recycle at Work Database, unpublished document prepared by David
Allaway (Oregon DEQ) with assistance from Heidi Rahn and Alison Cable (Metro), July 5, 2006.
Since 2001, local governments in the Portland area have implemented a region-wide business technical assistance program, now called “Recycle at Work”. The program, coordinated and co-funded by Metro, provides on-site visits to area businesses. A central database tracks the interventions and the status of “best practices” in the areas of recycling, “buy recycled” and waste prevention. For ten waste prevention practices, program staff track adoption status on a 3-point scale, where 1 = no/minimal adoption; 2 = moderate adoption; and 3 = maximized adoption. DEQ and Metro recently reviewed data from more than 450 businesses to determine adoption rates for various prevention practices and also extent of change (where businesses had received follow-up visits).
Oregon Department of Environmental Quality Page 4 07-LQ-010

3. “Oregon Resource Efficiency Program: Evaluation of Resource Efficiency Programs in Cannon Beach, Corvallis and Milwaukie, July 1996 – June 1998”, prepared for Oregon DEQ by David Allaway (Harding Lawson Associates), December 21, 1998.
This report details the results of two-year community-based “Resource Efficiency Programs” in three Oregon communities. Each program involved public-private partnerships working with businesses, schools, and government facilities to conserve materials, water and energy resources and reduce solid waste generation. The report draws on extensive analysis of participant data and exit interviews with participants and local program managers to identify barriers and benefits to participants.
4. “Business Packaging Waste Prevention Project (2002 – 2005): Project Evaluation Report”, prepared by David Allaway (Oregon DEQ), February 2006.
DEQ, with financial assistance from Metro and the U.S. EPA, recently completed a pilot project targeting waste prevention opportunities among businesses that use packaging. DEQ worked with a small number of businesses to identify and support implementation of packaging waste prevention changes. As part of project evaluation, DEQ identified benefits and barriers to packaging change at the level of the individual business as well as for the larger pilot project as a whole.
5. “Metro Business Waste Prevention Market Assessment: Shipping and Packaging Wastes”, prepared by Delyn Kies (Kies Strategies) for Metro, July 31, 2006.
Partly in response to potential opportunities uncovered by DEQ’s packaging project (above), Metro commissioned a market assessment of shipping and packaging waste prevention practices and opportunities. The market assessment covered five different types of businesses in the Portland area: wholesale/retail (non-food), manufacturing/assembly/production (non-food), food and beverage production, food and beverage delivery (grocery, produce), and research/development/testing services. Short telephone interviews and a smaller number of in-depth interviews were used to gather information about a variety of different transport packaging best practices, including current adoption rate, and perceived benefits and barriers.
6. “TNS Report”, unpublished document prepared by Mike Jeletic (Oregon DEQ), May 18, 2006.
Case studies on the web site of the Oregon Natural Step Network were reviewed. Case studies include both local (Oregon) and international leaders. For each, the author identified different waste prevention practices that were featured in the case study, and also evaluated how frequently waste prevention activities were featured relative to other types of environmental improvement (energy conservation, recycling, etc.).
Oregon Department of Environmental Quality Page 5 07-LQ-010

7. “Solid Waste Generation in Oregon: Composition and Causes of Change”, prepared by David Allaway (Oregon DEQ), February 2007.
Section 6 of this report summarizes EPA research into waste prevention in the 1990s. EPA concludes that source reduction in the 1990s avoided an increase in the U.S. municipal solid waste stream of nearly 25%. Much of this decline was due to lightweighting of containers and packaging, as well as changes in nondurable and durable goods. While some of these changes were driven by changes in demand (consumer purchasing), others were due to efforts by manufacturers to trim waste and materials use from production.
8. “Profiting from Source Reduction: Measuring the Hidden Benefits”, prepared by the Community Environmental Council and Global Futures for the Alameda County Source Reduction and Recycling Board, December 1997.
The objective of this study was to research, develop, test and demonstrate source reduction measurement tools for businesses and institutions in Alameda County. The study presents a set of measurement tools, including both county-wide (macro-level) and company specific (micro-level) measures. Case studies demonstrate a range of applications of different measurement methods.
9. “Waste Production Measurement Study”, prepared for Alameda County Source Reduction and Recycling Board by Environmental Science Associates, Natural Logic and Skumatz Economic Research Associates, December 2002.
The purpose of this study was to gain a detailed understanding of the ways that non-residential establishments produce solid wastes, and to seek the most effective ways to prevent those wastes from occurring. Through 350 phone interviews and approximately 90 site visits, the consultants were able to correlate different types of business “activities” (such as administration, shipping/receiving, maintenance) with different types of businesses (defined by SIC code). Detailed site visits were spread across approximately 20 categories of activities, and were used to develop generic process maps for different business activities, and determine the applicability and adoption rate of a variety of waste reduction practices.
10. Waste Prevention Estimator Tool, prepared for Stopwaste.org (Alameda County Source
Reduction and Recycling Board and Waste Management Authority) by Environmental Science Associates and Skumatz Economic Research Associates, unpublished, 2005.
Stopwaste.org’s “Waste Prevention Estimator Tool” (WPET) is an internal management tool developed in part to help the agency target specific best practices and/or industry sectors for focused outreach. Drawing on the results of the Waste Production Measurement Study (above), information on the composition of Alameda County’s business mix, and several hundred waste prevention case studies drawn from businesses around the U.S. (many from Oregon), the WPET estimates the average impact (in tons and/or dollars) that can be expected by an “average” business implementing a specific practice. The tool evaluates approximately 63 different best practices. Using some significant assumptions regarding potential for increased adoption, Stopwaste.org recently used the tool to develop a short list of “top ranked” practices for further consideration. Modeled results are highly sensitive to the assumptions as well as the quality of the underlying data.
Oregon Department of Environmental Quality Page 6 07-LQ-010

11. “Measuring Waste Reduction”, prepared for Seattle Public Utilities by Burton Hamner
(Hamner and Associates), March 30, 2005.
The author conducted interviews about waste prevention with 30 business organizations in Seattle. He concludes that the terms “waste reduction” and “waste prevention” are not well understood and are often confused with recycling, even among environmental leaders. Very little prevention is documented, and there are few compelling reasons to do so. Waste disposal is typically a relatively small cost; the study did not consider costs of procurement or use.
12. “Business Waste Reduction Study 1998”, prepared for Metro by Gwenn A. Baldwin, Cindi Carrell and Rueben Nisenfeld (Dotten & Associates, Inc.), January 19, 1999.
Executive interviews and focus groups were conducted with executives and “implementers” at a large number of Portland-area office and warehouse-type businesses. This research focused on barriers and approaches to increase both recycling and waste prevention among area businesses.
In addition to the documents described above, the author has also relied on his personal experience conducting waste, waste prevention, and environmental/resource efficiency assessments at businesses and institutions over the last 15 years. How Much Waste Prevention Potential Is There in the Business Sector? Solid wastes from commercial/institutional/industrial sources are significant in quantity, relative to other sources. In the Metro area, for example, at least 54% of all solid waste generated comes from commercial/institutional/industrial sources. Households and construction/demolition sites each contribute significantly less to the total than commercial (non-C&D) sources. Yet the contribution of businesses to waste generation is even larger than these figures suggest. By making decisions about the design, durability, reusability, marketing and packaging of both household goods and construction items, as well as the availability of credit, businesses exert a considerable influence on the generation of wastes that are typically associated with households and construction/demolition projects. For example, EPA’s study of waste prevention found that generation of container and packaging waste was 17% lower in 2000 (per dollar of Personal Consumption Expenditures, PCE) than it would have been if packaging waste as a function of PCE had remained unchanged since 1990. Similarly, the waste generation of “durable goods” and “nondurable” goods both declined 13% (as a function of PCE) during the 1990s. While some of this decline may have been caused by changes in consumer purchasing patterns, evidence suggests that much of it was due to process, product, and packaging changes quietly made by manufacturers. These changes went largely unnoticed by many in the solid waste field, suggesting an important maxim: just because a change or an activity is not apparent, does not mean that it hasn’t occurred. A corollary is that large increases in the overall generation of waste may mask decreases in specific sectors or substreams. For example, despite increases in overall generation of solid waste,
Oregon Department of Environmental Quality Page 7 07-LQ-010

businesses are not necessarily becoming more wasteful in their use of materials. Data on quantities of waste generated by businesses is remarkably limited. Turning specifically to waste that is generated at businesses, very few studies have explicitly evaluated the potential for further waste prevention, or even the rate of adoption of different waste prevention activities. In theory, this could be done by identifying a number of specific “best practices” and then visiting or surveying a variety of businesses to determine how many have already adopted each “best practice” (if applicable), and of the non-adopters, how many could easily or readily change. Of the information resources identified above, four collected data on the adoption rate of specific waste prevention practices: Metro’s 2001 telephone survey, Metro’s “recycle at work” program, Alameda County’s Waste Production Measurement Study, and Metro’s market assessment of packaging waste prevention practices. These four studies are compared in Figure 1. Results of each are summarized below.
Figure 1. Comparison of Four Studies of Waste Prevention Adoption Rates at Businesses
Metro
Telephone Survey (2001)
Metro Recycle at Work
Alameda Waste Production Measurement Study
Metro Packaging Market Assessment
Geographic location
Metro region (Oregon)
Metro region (Oregon)
Alameda County, CA
Metro region (Oregon)
Time period April 2001 2001 – 2005 2002 2006 Data collection Random
telephone survey
Site visits (some random, some targeted)
Site visits (targeted)
Random telephone survey, targeted in-depth interviews
Business types All All ~20 types of business activities
5 business sectors
Metro Telephone Survey As described earlier, this survey distinguished between businesses that had received waste evaluations (“WE”) and those that hadn’t (“non-WE”). All were asked about their participation in seven different waste prevention activities. Results are summarized in Figure 2. Of the seven practices, some clearly demonstrate more potential for improvement than others:
• Only 27% and 29% of non-WE businesses usually print and copy double-sided, respectively, while 42% and 35% say they do so “seldom” or never.
• In the middle are four practices (surplus donation, durable dishware, e-mail/electronic files, packaging reuse), where 44% - 56% of non-WE businesses “usually” engage in the practice while 19% - 26% do so “seldom” or “never”.
Oregon Department of Environmental Quality Page 8 07-LQ-010

• At the other end of the spectrum is reuse of office supplies (78% “usually”, 4% “seldom” or “never”).
Businesses that have received waste evaluations tend to have slightly higher adoption rates for waste prevention than businesses that have not received the evaluations. Whether this is a result of the waste evaluation process, or whether businesses that agree to waste evaluations are already more likely to be practicing waste prevention, was not evaluated.
Figure 2.
Waste Prevention Adoption Rates, Metro Telephone Survey (2001) Waste Evaluation Businesses Non-Waste Evaluation
Businesses Seldom
or Never Sometimes Usually Seldom
or NeverSometimes Usually
Print two-sided documents
33% 30% 33% 42% 22% 27%
Make two-sided copies 25% 30% 39% 35% 28% 29% Donate surplus furniture, computers, equipment and other supplies
20% 11% 49% 26% 16% 44%
Use durable dishware instead of disposable paper and plastic cups
23% 13% 50% 23% 18% 48%
Use e-mail, electronic documents, web sites, central bulletin boards to reduce paper use
16% 20% 61% 21% 17% 52%
Reuse or return shipping containers such as cardboard boxes and pallets or packaging materials like peanuts and bubble wrap
17% 15% 63% 19% 19% 56%
Reuse office supplies such as file folders and binders
2% 8% 89% 4% 15% 78%
All respondents (n=624) were also asked what other activities their businesses did to reduce waste. Other activities mentioned (without prompts) included: • circulate single copy of a document instead of making copies, 11% mention • stop buying unrecyclable items, 10% mention • get off unwanted mailing lists, 9% mention • use cloth towels/air dryers instead of paper towels, 6% mention • reuse as much as possible, 5% mention • compost yard debris on site, 2% mention
Oregon Department of Environmental Quality Page 9 07-LQ-010

• educational programs on energy consumption/recycling, 2% mention • use electronics instead of paper, 2% mention • keep inventory low, 1% mention • use less, 1% mention • compost food on site, 1% mention • donate food/disposables/other items, 1% mention • misc. others, 5% mention Fifty-six percent (56%) said none and 9% did not know. WE respondents were significantly more likely than Non-WE respondents to report they circulate single copy of a document instead of making copies (14% versus 7%), stop buying unrecyclable items (12% versus 6%), get off unwanted mailing lists (13% versus 3%), and use cloth towels/air dryers instead of paper towels (9% versus 3%). Metro Recycle at Work DEQ and Metro’s recent review of the Recycle at Work database yielded some interesting findings regarding both the applicability of specific prevention practices, as well as the adoption rate of these practices. The database used by the local government Recycle at Work staff defines ten waste prevention practices and provides examples of “low”, “medium”, and “high” rates of implementation for each. For example, one of the practices is “double sided copying”. To record a business as being at a “high” level of implementation, the waste evaluator would need to observe: • All high-volume copy machines have duplex capacity, and are set to default to duplex. • Single-sided copying (for multi-page documents) is done by only a small number of employees
(if any). • Visual inspection of paper recycling etc. shows that most multi-page documents have been
copied on both sides. Obviously, some interpretation is required on the part of the individual evaluator. Not all practices are tracked at all businesses. Implementation status for specific practices may not be recorded for a variety of reasons. Some practices may not be applicable to all businesses. In that case, the status of that practice is less likely to be recorded (for example, “two-sided printing” might not apply to small retail businesses). Further, some waste evaluators may be unwilling to ask about/observe information on all ten of the waste prevention practices. Therefore, the number of businesses for which implementation status for specific waste prevention practices are recorded may provide some indication of applicability, and by extension, potential. One significant caveat while interpreting this data is that the population of businesses in the database is not necessarily representative of the larger mix of businesses in the Metro area. As such, data regarding waste prevention may also not be representative of the larger mix of businesses in the Metro area. In addition, while the database was designed to be simple and encourage consistency, there is no guarantee that standards are applied consistently across jurisdictions, between multiple recycling specialists working for the same jurisdiction, or even between multiple recycling specialists visiting the same business at several different points in time.
Oregon Department of Environmental Quality Page 10 07-LQ-010

The ten waste prevention practices are listed below, followed by the number of businesses for which implementation status was recorded: • Durable dishware (485) • Two sided copying (449) • E-mail, electronic documents, web sites; document routing (388) • Reusable office supplies (320) • Mailing lists – reduce incoming mail (268) • Two-sided printing (251) • Donate surplus computers, furniture, equipment, other supplies (220) • Mailing lists – manage outgoing mail to prevent waste (185) • Reusable shipping containers (142) TIE • Reusable packaging (142) TIE Some businesses receive follow-up visits anywhere from one month to one year or more following the initial visit and recommendations. At these follow-up visits, recycling specialists may record the then-current level of adoption. In this way, some rough indication of change can be determined. At businesses where implementation status was recorded more than once, the following indicates the percentage of businesses that have shown improvement since their first visit (either going from a “low” to a “medium” or “high”, or from a “medium” to a “high”): • Mailing lists – manage outgoing mail to prevent waste (67%) • E-mail, electronic documents, web sites; document routing (61%) • Reusable shipping containers (54%) • Reusable packaging (51%) • Reusable office supplies (49%) • Donate surplus computers, furniture, equipment, other supplies (44%) • Durable dishware (42%) • Mailing lists – incoming mail (36%) • Two-sided printing (21%) • Two sided copying (20%) From this data, it appears that certain recommendations are easier – or for some other reason, more likely to be implemented – than others. Specifically, recommendations about improving management of mailing lists and electronic communication appear to be more likely to be acted upon, while the ever-popular recommendations about double-sided printing and copying are least likely to lead to change. This last finding is consistent with the earlier (2001) Metro telephone survey, which found that double-sided copying and printing were the least likely of seven waste prevention activities to be practiced. Alameda County Waste Production Measurement Study While this study occurred outside of Oregon, the results likely have some applicability here. Of perhaps greatest interest to the question of waste prevention potential are the results of the ~90 site visits. At each, the status of waste prevention (and reduction) opportunities were observed and recorded as either “in progress”, “not in progress, but opportunity present”, or “not applicable”. “Not applicable” was recorded if the materials were not present or were only present in small quantities, or if the procedures were not used or only a minor part of the activity.
Oregon Department of Environmental Quality Page 11 07-LQ-010

Because the site visits were divided among several different business activities, the number of visits per activity is relatively low. This limits the statistical confidence of the results. Selected results are portrayed in Figure 3.
Figure 3. Selected Results, Alameda County Waste Production Measurement Study
Activity (# of Visits) Opportunity
In progress
Not in progress but opportunity
present
Not applicable
Manufacturing from Raw Materials (9 visits) 1. Incentives to encourage takeback program
with suppliers, customers 11% 44% 44%
2. Replace sacks, fiber drums or plastic pails with bulk/supersack/reusable container options
22% 33% 44%
3. Reusable masks and boots for clean rooms 0% 33% 66% 4. Returnable barrels for product 33% 11% 55% 5. Reuse of material barrel/containers 33% 44% 22% 6. Pallet reuse 22% 0% 77% 7. Remove cardboard spacers on shipments 0% 0% 100% 8. Improve QC to reduce quantities of off-spec
products 55% 0% 44%
9. Use wheeled carts, bulk containers: move product internally
22% 11% 66%
10. Work with suppliers to optimize packaging 11% 44% 44% 11. Reduce individual film packaging 11% 11% 77% 12. Try bulk delivery/pick-up with local
customers 33% 33% 33%
13. Use packaging and process wastes for internal uses (e.g. waste textile to tie together sweaters vs. plastic bags)
33% 22% 44%
Non-Food Manufacturing (14 visits) 14. Computer optimization of material
utilization, production process, etc. to maximize yield, minimize raw materials and scrap
29% 36% 36%
15. Computerized management of inventory, ordering, pick/pack, process changes, better specifications to reduce waste
21% 29% 50%
16. Non-computerized optimization of production planning and work layout
29% 21% 50%
17. Reduce inventory of raw materials/just-in-time production
29% 7% 64%
18. Bulk supply of stable chemicals with permanent on-site containers
0% 36% 64%
19. Reduce consumer packaging 21% 29% 50%
Oregon Department of Environmental Quality Page 12 07-LQ-010

Activity (# of Visits) Opportunity
In progress
Not in progress but opportunity
present
Not applicable
20. Reusable containers for internal plant movement/storage
21% 7% 71%
21. Discuss container tack back, packaging alternatives with suppliers
14% 43% 43%
22. Investigate reusable product shipping boxes with regular clients
14% 36% 50%
23. Investigate reusable/returnable containers vs. LDPE bags for shipments to regular and local customers
7% 43% 50%
24. Improve quality control on computer input and office orders
7% 50% 43%
25. Improve process QC to reduce scrap 36% 29% 36% 26. Purchase and implement software to
eliminate pick slips (lists on screens instead of paper)
0% 7% 93%
27. Order pre-cut components in optimal configuration to minimize materials used and trim waste
43% 14% 43%
28. Computer optimization of material utilization, production process etc. to maximize yield, minimize raw materials and scrap
14% 36% 50%
29. Process changes to reduce waste 7% 43% 50% 30. Floor padding and work procedures to
minimize product breakage 0% 21% 79%
31. Design and promote retail display mechanisms that rely on more product and less packaging
0% 29% 71%
32. Reuse or return incoming packaging materials
21% 57% 21%
33. Reuse extra double-walled boxes for shipments
0% 7% 93%
34. Reuse waste cardboard as pallet spacers 14% 28% 57% 35. Reusable containers between manufacturing
site and distribution centers 21% 14% 64%
36. Supplier takeback for supersacks, metal drums, plastic drums, thread cones
7% 36% 57%
37. Talk with customers receiving foam forms and bubble-wrapped products about trading packaging back and forth
14% 36% 50%
Food Production (10 visits) 38. Upstream quality control (e.g. better
sanitation at egg ranches, better handling by truckers)
20% 10% 70%
Oregon Department of Environmental Quality Page 13 07-LQ-010

Activity (# of Visits) Opportunity
In progress
Not in progress but opportunity
present
Not applicable
39. Bulk supply of stable feedstocks/ingredients 70% 20% 10% 40. Reusable product containers with own
trucking fleet and key customers
30% 30% 40%
41. Reusable containers/trays for internal plant movement and storage
50% 20% 30%
42. Reusable containers with key suppliers (e.g. supersacks, metal drums, plastic drums, etc.)
50% 50% 0%
43. Conduct QC before packaging (so off spec product is not packaged)
70% 20% 10%
44. Adjust machinery to minimize product and packaging trim waste
10% 60% 30%
45. Seamless line automation 30% 40% 30% 46. Tune process to reduce product spillage or
loss 30% 30% 40%
47. Capture line spillage for batch rework 20% 30% 50% 48. Minimize or optimize product change
sequencing, or maintain separate lines for major products
20% 20% 60%
49. Programmable stretchwrap machines or protocol vs. “use your judgement”
10% 50% 40%
50. Eliminate or replace extraneous packaging 20% 0% 80% 51. Ask suppliers to reduce excess inbound
packaging 0% 60% 40%
Printing and Publishing (4 visits) 52. Increase use of electronic file transfer,
intranet/on-line proof editing, and returnable zip disk proof editing vs. paper printout
0% 75% 25%
53. Set duplex as default on printers 0% 50% 50% 54. Weigh waste to identify problems and
measure impact of improvement measures 25% 75% 0%
55. Paper core reuse 25% 0% 75% 56. Waste OCC as pallet spacers vs. new OCC 25% 25% 50% 57. Increase reuse of cardboard 25% 75% 0% 58. Repair or upgrade CD burning equipment to
reduce damage 0% 50% 50%
Retail (12 visits) 59. Reusable plastic totes: product
delivery/return 25% 75% 0%
60. Reuse plastic 5-gallon buckets 0% 17% 83% 61. Reduce packaging 8% 92% 0%
Oregon Department of Environmental Quality Page 14 07-LQ-010

Activity (# of Visits) Opportunity
In progress
Not in progress but opportunity
present
Not applicable
62. Reuse shredded paper/packing peanuts 17% 67% 17% 63. Reuse cardboard boxes 42% 50% 8% 64. Use plastic pallets 25% 50% 25% 65. Donate unused product 33% 50% 17% 66. Pallet reuse/return 42% 0% 58% Food Service (7 visits) 67. Reusable plastic totes: product
delivery/return 14% 86% 0%
68. Use reusable plates, cups, utensils 100% 0% 0% 69. Reuse plastic 5-gallon buckets 29% 71% 0% 70. Reduce packaging 0% 100% 0% 71. Reuse cardboard boxes 0% 0% 100% 72. Reduce paper towel use 57% 43% 0% 73. Food donation 0% 100% 0% Administrative (8 visits) 74. Print/copy double-sided 0% 100% 0% 75. Save/reuse single-sided scrap paper 38% 12% 50% 76. Produce internal reports electronically 25% 62% 12% 77. Make stock forms available online 50% 25% 25% 78. Send faxes electronically 50% 38% 12% 79. Train employees to edit on screen rather
than edit printed text 12% 88% 0%
80. Take advantage of existing software capabilities that conserve paper
50% 50% 0%
81. Digital signatures 0% 75% 25% 82. Purchase printers/copiers that can double-
side 88% 0% 12%
83. Acquire software allowing electronic faxing 38% 50% 12% 84. Acquire software allowing electronic
imaging 12% 50% 38%
85. Change settings on software/hardware to avoid unnecessary automatic summary print-outs
0% 100% 0%
Space Planning, Building Maintenance, Equipment Maintenance (4 visits)
86. Make repairs on an as-needed basis 100% 0% 0% 87. Reduce packaging 25% 0% 75% 88. Reuse of materials 75% 25% 0% 89. Donate/resell used materials 50% 50% 0% 90. Carpet leasing 0% 75% 0% 91. Perform scheduled, routine maintenance 75% 0% 25%
Oregon Department of Environmental Quality Page 15 07-LQ-010

Activity (# of Visits) Opportunity
In progress
Not in progress but opportunity
present
Not applicable
Vehicle Maintenance and Repair (4 visits) 92. Reduce packaging from suppliers (esp. for
filters) 0% 75% 25%
93. Purchase rebuilt parts/return used parts to supplier
50% 25% 25%
94. Use nearby suppliers to minimize shipping and packaging
50% 50% 0%
95. Leverage central warehouse purchasing to get more parts and supplies received in bulk
0% 25% 75%
Of the 95 unique activity/opportunity combinations shown above, relatively few (20) present opportunities at more than half of the businesses visited. Most of these are located among the business activities that received relatively few site visits (and thus the data may be less representative of the larger business community). Another 12 unique activity/opportunity combinations present opportunities at none of the businesses visited. If nothing else, this confirms the idea that every business is different. The sheer number of opportunities also demonstrates the complexity of “helping businesses with waste prevention”, since the needs of and opportunities at different types of businesses (as well as businesses within the same sector or with the same type of activity) can be very diverse. Metro Packaging Market Assessment Metro’s recent market assessment for shipping/packaging waste prevention was intended in part to evaluate the current adoption rates and future potential for a variety of packaging best management practices (BMPs). Many of the BMPs can be implemented in degrees (just a little, somewhat, half the time, most of the time, etc.), but the telephone survey questions were mostly binary (yes/no) in nature. As a result, a large percentage of businesses report participating in many of the BMPs. For example, 82% of businesses involved in wholesale and retail trade (non-food) report reusing corrugated cartons. But in-depth interviews suggest that most businesses that reuse cartons do so only for internal shipments, which typically comprise a very small percentage of total carton use. Thus, the apparent high adoption rate (82%) masks the large potential among businesses that already reuse cartons in limited applications, but could (in theory) expand their use significantly. As such, the quantitative results generated by this study are, by themselves, insufficient to generate a complete picture of potential for growth in packaging waste prevention BMPs. However, based on additional information gathered through in-depth interviews, the consultants grouped the following packaging BMPs into three tiers, as follows: • Tier One - High rate of current adoption; likely some potential for new or improved adoption
using existing resources and business-to-business strategies: Reuse of corrugated cardboard boxes Appropriate box size Reusable packaging for void fill Alternatives to boxes (shipping bags for non-breakable items, in particular)
Oregon Department of Environmental Quality Page 16 07-LQ-010

• Tier Two - Some significant use in certain sectors; longer term potential for new adoption with education and technical assistance:
Reusable shipping containers (plastic totes, etc.) Alternatives to boxes (other than shipping bags for non-breakable items)
• Tier Three - Lower rate of adoption; lower potential for new adoption based on industry- or product-specific requirements:
Alternatives to stretch wrap (such as reusable tie-down straps/bands) Reusable plastic pallets and palletainers Pallet pooling or rental
Other Studies In addition to the studies described above, a few other projects provide some limited insight into the potential for more waste prevention among Oregon businesses: • Evaluation of Oregon’s first three Resource Efficiency Programs (1996 – 1998) involved a
database of 768 recommendations made to 71 participants during the first year of programs in Cannon Beach, Corvallis, and Milwaukie. Recommendations were coded by type (materials, energy, water). Across all three communities, 48% of materials recommendations were implemented within the first two years of the project. 61% of participants saved a measurable amount of materials, although in some cases the savings were relatively small. This finding suggests that, at the time at least, many businesses that voluntarily participated in these programs had opportunities to make at least one waste prevention improvement.
• DEQ’s packaging project identified limited waste prevention opportunities at some businesses. In all cases, the large majority of packaging waste prevention ideas that were “brainstormed” proved to be either already implemented, not feasible, or too small to bother with. (This may reflect more on the nature of brainstorming than on waste prevention potential, however.) Of the six primary business participants, four made packaging improvements and three of these four (50% of the total) saved money as a result.
• Specific to different packaging practices, DEQ identified greater savings potential in the realm of customer order fulfillment such as catalog sales (where customers may order multiple permutations of sizes and numbers of items). Fewer opportunities were observed in routine packing environments, where the same number of items are packaged in the same configuration over and over again (for example, food product manufacturing).
While not specific to Oregon, Stopwaste.org’s Waste Prevention Estimator Tool was recently used to evaluate a short list of top-ranked “best practices” from among a list of 63 options. Top-ranked practices included: • Reusable plastic totes • Duplex printing and copying • Vendor take-back and/or other reuse of pallets • Electronic forms and other office paper reduction (eliminate header sheets, etc.) • Reuse cardboard boxes • Manufacturing process changes • Repair and reuse furniture and equipment Finally, the review of 23 case studies on the website of the Oregon Natural Step Network yields some limited insight into waste prevention potential, not by identifying what businesses haven’t yet done, but rather by highlighting examples of what leading businesses have done. Many of the case
Oregon Department of Environmental Quality Page 17 07-LQ-010
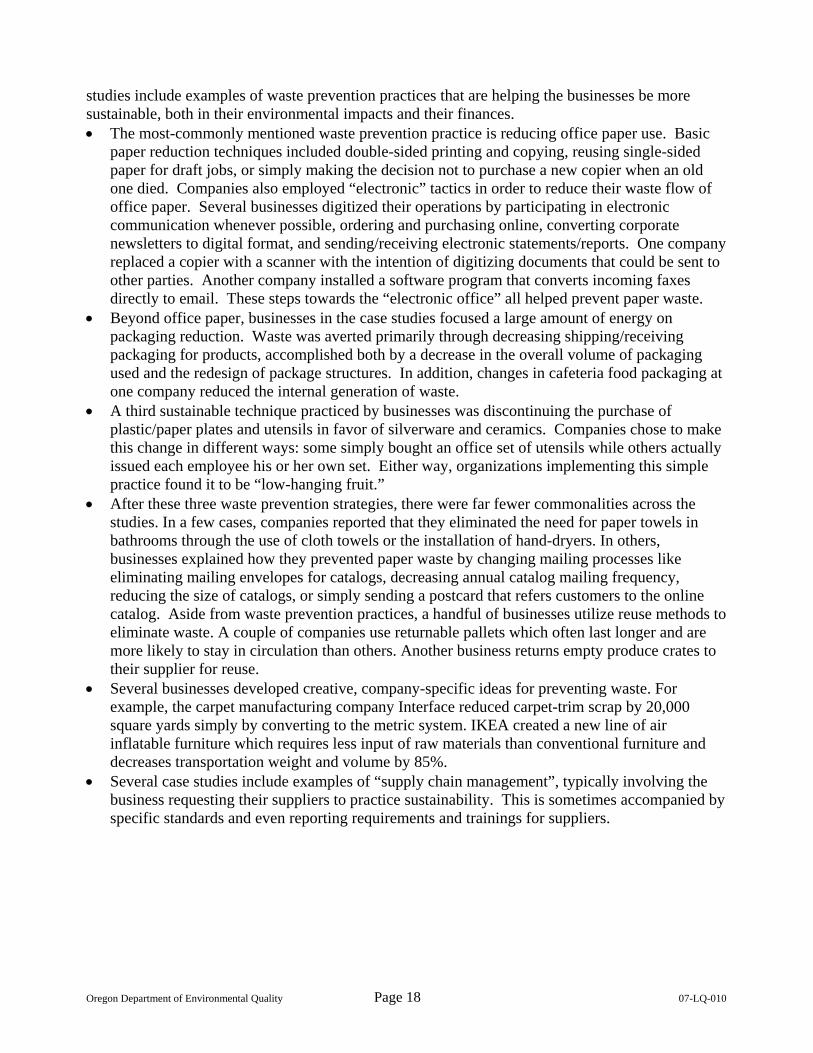
studies include examples of waste prevention practices that are helping the businesses be more sustainable, both in their environmental impacts and their finances. • The most-commonly mentioned waste prevention practice is reducing office paper use. Basic
paper reduction techniques included double-sided printing and copying, reusing single-sided paper for draft jobs, or simply making the decision not to purchase a new copier when an old one died. Companies also employed “electronic” tactics in order to reduce their waste flow of office paper. Several businesses digitized their operations by participating in electronic communication whenever possible, ordering and purchasing online, converting corporate newsletters to digital format, and sending/receiving electronic statements/reports. One company replaced a copier with a scanner with the intention of digitizing documents that could be sent to other parties. Another company installed a software program that converts incoming faxes directly to email. These steps towards the “electronic office” all helped prevent paper waste.
• Beyond office paper, businesses in the case studies focused a large amount of energy on packaging reduction. Waste was averted primarily through decreasing shipping/receiving packaging for products, accomplished both by a decrease in the overall volume of packaging used and the redesign of package structures. In addition, changes in cafeteria food packaging at one company reduced the internal generation of waste.
• A third sustainable technique practiced by businesses was discontinuing the purchase of plastic/paper plates and utensils in favor of silverware and ceramics. Companies chose to make this change in different ways: some simply bought an office set of utensils while others actually issued each employee his or her own set. Either way, organizations implementing this simple practice found it to be “low-hanging fruit.”
• After these three waste prevention strategies, there were far fewer commonalities across the studies. In a few cases, companies reported that they eliminated the need for paper towels in bathrooms through the use of cloth towels or the installation of hand-dryers. In others, businesses explained how they prevented paper waste by changing mailing processes like eliminating mailing envelopes for catalogs, decreasing annual catalog mailing frequency, reducing the size of catalogs, or simply sending a postcard that refers customers to the online catalog. Aside from waste prevention practices, a handful of businesses utilize reuse methods to eliminate waste. A couple of companies use returnable pallets which often last longer and are more likely to stay in circulation than others. Another business returns empty produce crates to their supplier for reuse.
• Several businesses developed creative, company-specific ideas for preventing waste. For example, the carpet manufacturing company Interface reduced carpet-trim scrap by 20,000 square yards simply by converting to the metric system. IKEA created a new line of air inflatable furniture which requires less input of raw materials than conventional furniture and decreases transportation weight and volume by 85%.
• Several case studies include examples of “supply chain management”, typically involving the business requesting their suppliers to practice sustainability. This is sometimes accompanied by specific standards and even reporting requirements and trainings for suppliers.
Oregon Department of Environmental Quality Page 18 07-LQ-010

What Are the Benefits to Businesses of Waste Prevention? The literature identifies the following benefits: • Reduced disposal/waste management costs. • Reduced purchasing costs. • Potential for reduced labor costs/improved labor efficiency. • Potential for reduced storage costs. • Potential for reduced freight costs. • Potential for improved customer satisfaction. In many instances, disposal savings are much smaller than other savings. Typically, procurement costs are much higher than disposal costs. This explains why the financial benefits to businesses of waste prevention are typically much larger than the financial benefits of recycling, even if the tonnages diverted from landfill are much smaller. While recycling reduces disposal costs, prevention reduces both disposal and procurement costs (with the potential for savings in labor, freight, and storage as well). Since most materials cost much more to buy than to dispose of, any activity that reduces procurement expenses is likely to result in higher savings than recycling. The report “Profiting from Source Reduction: Measuring the Hidden Benefits” calls this out and also provides several compelling examples involving labor efficiencies associated with waste prevention: “The benefits of source reduction have typically been measured with an emphasis on product purchase and landfill disposal cost. Although these are important benefits of source reduction, this narrow approach to measurement is only the tip of the iceberg and may fail to recognize the vast majority of potential benefits that source reduction can provide to business, government and communities.” For example, the report compares the potential savings from reducing paper use through source reduction ($ per ream), from an analysis and productivity model developed for the Alameda County Social Services Agency. Savings are as follows:
• Purchase savings: $2.12/ream • Use savings: $25.70/ream • Recycling revenue: ($0.25/ream) • Disposal savings: $0.13/ream
Similarly, cost savings from Target’s Softlines Detrashing program, where Target directed vendors to reduce unwanted packaging that required extensive “detrashing” by retail staff prior to placement on the sales floor, are estimated as follows:
• Vendor packaging savings: $3,000,000 • Target labor savings: $4,500,000 • Target disposal savings: $45,000
According to the report, “If Target were only looking at the disposal end of its source reduction program, it is not likely they would have had the incentive to negotiate major changes with their product suppliers.” Generally speaking, it is much easier to convince a business to implement a waste prevention change if it frees up labor time than it is to convince a business to spend more labor time in order to reduce procurement costs. As such, the potential for labor efficiency (or inefficiency) has the
Oregon Department of Environmental Quality Page 19 07-LQ-010

potential to significantly impact businesses’ willingness to implement waste prevention practices. With few exceptions, most successful waste prevention practices are at least labor neutral. “Labor costs” include not only wages and benefits as a function of time required to complete a task, but also worker injuries. For example, some companies prefer polyester or steel pallet bands to pallet wrap because they report that the bands are easier to apply and result in less lower back strain. What Are the Barriers to Waste Prevention in Businesses? The literature is replete with discussion of the barriers to waste prevention in businesses as well as barriers experienced by government-sponsored “technical assistance” type of outreach programs. Some types of barriers appear to be nearly universal, while others are specific to individual waste prevention practices or industry types. Barriers can generally be classified into three categories: values, information, and structural barriers. Value-related barriers include the following: • Competing workload priorities, and a feeling of being overloaded and reluctance to initiate
activities that will increase this feeling. • Reluctance to change existing practices (fear of “upsetting the apple cart”). • A perception that waste prevention will not contribute –and may detract from – the efficiency of
existing business practices. • A perception that source reduction means doing without and lowering the standard of living
(although this may be more of an information-related barrier). • Aesthetic concerns associated with activities such as reuse and double-sided copying, and/or a
belief that added layers of packaging are necessary to satisfy customer expectations. • Lack of shared vision and commitment to environmental improvement across different business
lines, offices or units of a larger company. • Complacency about environmental responsibility. • Conversely, past environmental leadership (all “easy” changes already made). Information-related barriers include: • Lack of accurate baseline data. • Lack of information about what can be done to prevent waste. • A belief that source reduction activities only result in small benefits. According to the study
“Measuring the Hidden Benefits”, “this belief is, in part, a result of measurement methods that ignore major benefits such as improvements in labor productivity.” For many businesses, waste management costs are very small. For example, at one large Seattle institution, garbage costs equate to about 0.04% of total expenses. A message that says “waste prevention will help you save money on garbage bills” is unlikely to be successful because reducing garbage bills is not a significant motivator for many businesspeople.
• Misleading information provided by suppliers. Bad information may be provided unintentionally (because the supplier is misinformed), or intentionally (because the supplier opposes changes to the status quo).
• Some sectors, such as manufacturing, may have a continuing need for engineering-level technical assistance to determine the cost-effectiveness of specific waste prevention measures that require capital investments and significant process changes.
Oregon Department of Environmental Quality Page 20 07-LQ-010

• Confusion regarding environmental trade-offs between waste prevention and recyclability/recycled content objectives.
• Waste prevention may be under utilized because recycling is perceived as accomplishing the same benefits. Again, from “Measuring the Hidden Benefits”, “Employees may think that it doesn’t matter if more materials are used since they are being recycled, and increased recycling helps the community meet its recycling goals.” Similarly, the “Waste Production Measurement Study” points out that efforts made by most administrative offices to reduce paper use have been minimal or temporary. It speculates that paper recycling programs are widespread and may be viewed as “the solution” by the companies implementing them. Dotten & Associates found that both executives and implementers “said they had some awareness of the difference between recycling and waste prevention, (but) they frequently only talked about recycling . . . Participants had to be continually prompted to continue discussions about waste prevention.”
Specific to these last two points, the Seattle Public Utilities report “Measuring Waste Reduction” explores the confusion between “reduction” (what DEQ calls “prevention/reuse”) and recycling in detail. Based on detailed interviews with thirty different businesses, many of which are environmental leaders, the author concluded:
“The meaning of the terms ‘waste reduction’ or ‘waste prevention’ is not clearly understood by the interviewees. Only a few of them could even describe what the concepts mean, much less provide data bout it. All confused it with recycling, at least in part. Any promotion of ‘waste reduction’ is unlikely to succeed because almost no-one understands what it means . . . However, participants in the interviews said they definitely pay attention to the best practices for resource efficiency in their specific sectors . . . Some participants (interviewees) spoke of ‘value engineering’ or similar phrases around ‘value’. It proved challenging to explain ‘waste reduction’ to the participants.”
“Even among the organizations identified as the most environmentally advanced, they don’t think about reduction per se. For example digital imaging is commonly used as an example of waste reduction . . . but they think about it in terms of efficiency and productivity, not waste reduction.
Yet while the phrase “waste prevention” may not be as well understood as “recycling”, it may be as or nearly as prevalent, at least among leading businesses. DEQ’s review of 20 business and 3 government case studies on the web site of the Oregon Natural Step Network found that 18 of the case studies included at least one waste prevention practice. This compares favorably to reducing toxics (20 case studies), energy conservation (19 case studies), using recycled materials (18 case studies) recycling and green building (14 case studies each), renewable energy (11 case studies), conserving water (7 case studies), and purchasing organic food (4 case studies). Structural barriers include: • Diffuse responsibility within the business. There may be no direct connection between those
that use resources and those that pay for them. Employees may feel powerless to implement changes, particularly if managing waste produced as a result of decisions made elsewhere in the business.
Oregon Department of Environmental Quality Page 21 07-LQ-010

• In the case of businesses with multiple locations, corporate control can be a significant barrier. For example, an auto dealer may not be able to limit the amount of protective material that is shipped with new cars.
• Insufficient influence (either real or perceived) in supply chain management (with vendors). • Management and employee turnover. • Growth and reorganization pulling staff time away from labor-intensive reuse. • Seasonal nature of business making it difficult to work on or implement changes during certain
times of the year. • Small potential savings – some businesses may already be very “lean” and have few waste
prevention opportunities without a complete overhaul of their business model. • Waste prevention activities may take more time. For example, on many copy machines making
a 2-sided copy is slower than making two one-sided copies. • Ergonomic concerns. • Market inertia. Source reduction changes the way things are done. According to “Measuring
the Hidden Benefits”, for example, 16-pound paper appears to work as well as standard 20-pound paper for all office documents, while using 20 percent less material, but there is no inherent motivation to make this change.
• Complexities due to specific methods. The Waste Production Measurement Study points out that in some industries a waste can be “prevented” by redirecting the material into wastewater, packaging, or some other output stream. This approach differs from waste prevention that is accomplished by reducing the use of materials, but it is viewed as an option in these industries, and this can be a challenge for waste prevention outreach efforts to overcome.
Metro’s packaging market assessment identified several barriers specific to individual packaging best practices, as follows: • Barriers to reusing corrugated cardboard boxes include customer perception and product
branding, and potential health regulations. • Barriers to choosing an appropriate box size include the additional labor required to choose
the right box. • Barriers to reusing void fill include customer perception. • Barriers to alternatives to boxes (such as shipping bags) include the need to protect fragile
items. • Barriers to pallet wrap alternatives (such as reusable tie-down straps or bands) include the
need to ship non-uniform loads consisting of multiple box sizes and/or irregular packaging. • Barriers to reusable shipping containers, pallets, and pallet pooling/rental include the use of
open-loop distribution, the up-front cost to purchase containers, replacement costs, administrative costs of tracking, concern about getting reusables back, and lack of awareness. Specific to pallet pooling/rental, many companies already have a steady supply of already used pallets that come to them essentially “free”.
In addition, Alameda County’s Waste Production Measurement Study provides long lists of barriers specific to a wide variety of business activities. In the interest of time, these lists are not reproduced here but can be made available upon request.
Oregon Department of Environmental Quality Page 22 07-LQ-010

What Characteristics Make for Successful Business Outreach Programs? Relatively few business outreach programs focus on waste prevention. Rather, prevention is often included as part of a “waste audit” service that often focuses on recycling. Further, many business outreach programs (even the pure “recycling” ones) suffer from poor and/or minimal evaluation. As such, it is not immediately obvious what qualifies a business outreach program as being truly “successful”, at least specific to waste prevention. Fortunately, programs in Oregon (both sponsored by DEQ and Metro) typically benefit from more extensive evaluation. These programs have been able to draw some conclusions – although not always based on quantitative analysis – as to the characteristics that a successful business outreach program would (or should) have. DEQ’s Resource Efficiency Program found that key success factors included having a local “resource efficiency coordinator” (REC) located in the same community as the businesses, providing on-site assistance, and regular, ongoing follow-through and interaction. Stable, long-term funding is also a critical success factor. DEQ also found that while its multi-resource approach (energy, water, materials) was successful, less documentation exists about materials efficiency than water and energy. A multi-resource approach generates several barriers. More training is required for the REC. Compared to single-resource programs, the assessment process is more complicated. Whereas water and energy are billed contemporaneous with use, materials are not. Water and energy billing data tends to be readily available and simple to evaluate, whereas purchasing data is often difficult to obtain, spread over hundreds of items, and not easily summarized. Benchmarks exist to compare energy use against comparable businesses, but similar benchmarks have not been developed for materials. Collecting information about materials use and opportunities tends to be more “intrusive” than energy or water conservation, as it requires more understanding of processes and practices. Further, the interests and preferences of the individual REC can strongly influence what kinds of resources are targeted during the assessment and therefore which kind of resources will be saved. DEQ’s evaluation report concludes that “in a comprehensive (all resources) program, a concerted effort and ongoing attention by the REC is required for materials efficiency to achieve implementation results comparable to energy and water.” More recently, DEQ’s evaluation of its packaging waste prevention project identified the following factors as contributing to the success of the project: identification and cultivation of relationships with “champions” internal to the businesses, being visible and approachable to other business staff during site visits, engaging suppliers, tactical use of data to demonstrate potential savings, developing information resources and skills to evaluate environmental trade-offs, having partnership objectives in writing, and avoiding getting bogged down in minutia. Burton Hamner, in his recommendations to the Seattle Public Utilities notes that the phrase “waste reduction” is confusing and should not be used in marketing. “There are better terms that make more sense to businesses. These might include ‘resource productivity’, ‘materials management’ or even just ‘efficiency’. One useful approach to finding the right phrases is to work with focus groups of customers to choose the right words for marketing. This should be a high priority as the right words need to be put into practice as soon as possible . . . think of this as a branding exercise, since the Waste Reduction brand is apparently not working . . . Businesses are more likely to respond more positively to best practices in their sectors around productivity and materials management, relative to ‘waste’.
Oregon Department of Environmental Quality Page 23 07-LQ-010

Hamner goes on to describe waste prevention as “a management challenge, not a technical one. It needs a management framework and since most waste managers are not in the upper organization levels, they can’t create that framework. If waste reduction is integrated into a management model that business already understands, it would be received by a different kind of executive.” Specifically, he recommends the Baldrige Performance Management System of the US National Institution for Standards and Technology (see http://www.quality.nist.gov/ for information) as an excellent framework for promoting resource efficiency. He describes the system as “based on operations performance, well suited for conservation and reduction efforts, and already supported extensively at the national and state level.” Delyn Kies, in recent recommendations to Metro regarding packaging waste prevention outreach, recommended the following for successful outreach:
• a full assessment of barriers (such as health codes, availability of pallet poolers); • incorporating packaging-specific promotion into existing “Recycle at Work” outreach; • developing case studies; • building on similar programs; and • investigating opportunities to partner with trade association (RPCC), packaging suppliers,
organizations. On this last note, it was noted that with only one exception, all of the businesses interviewed obtain information about packaging options from their existing packaging suppliers. Several documents stress the importance of compelling case studies that both motivate and inform. Dotten & Associates’ 1999 report to Metro notes that “Most companies seemed open to receiving information on waste prevention, as long as it is designed with benefits and efficiency as its primary themes.” This report also states “Programs designed by outside organizations, that are not coordinated with the company’s business practices, and that require what may be unnecessary changes in the corporate culture, are less likely to be implemented.” This implies that successful outreach programs will customize outreach to existing business practices and meet the business on the businesses’ own terms, as opposed to expecting all businesses to change to meet a certain standard. Finally, the Alameda County “Measuring the Hidden Benefits” report emphasizes the importance of focusing on labor productivity. “Several case studies illustrate how source reduction activities carried out strictly under productivity motivation have extensive cost savings potential for companies and agencies. This suggests that assisting companies with productivity and efficiency improvements may lead to significant source reduction.” Case studies and other outreach materials need to address labor impacts in addition to the more commonly-tracked categories of disposal and procurement savings.
Oregon Department of Environmental Quality Page 24 07-LQ-010

Oregon Department of Environmental Quality
Waste Prevention Strategy – Background Paper #5
Nongovernmental Organizations and Infrastructure
A Summary of Nongovernmental Services and Infrastructure Supporting Reuse and Waste Prevention in Oregon
Conducted for
Oregon Department of Environmental Quality, Solid Waste Program
Prepared by
December 2006
Oregon Department of Environmental Quality 07-LQ-009

Acknowledgments
The authors of this background paper gratefully acknowledge the valuable contributions of the following individuals to the Waste Prevention Strategy research and development process.
Land Quality Solid Waste Policy and Program Development 811 SW 6th Avenue Portland, Oregon 97204 (503) 229-5913 (800) 452-4011 toll-free (503) 229-6977 fax www.deq.state.or.us David Allaway and Jan Whitworth, project managers Loretta Pickerell, solid waste policy and programs manager
DEQ Waste Prevention Strategy Steering Committee Members David Allaway, DEQ Julie Daniel, BRING Recycling Leslie Kochan, DEQ Meg Lynch, Metro Mike Riley, ReSource Jan Whitworth, DEQ
DEQ Technical Assistants Susan Christensen Cathie Davidson Scott Fairley Brian Fuller Shari Harris-Dunning Leslie Kochan Bruce Lumper
The authors particularly wish to thank all of the interviewees from nonprofits, businesses, local governments, state agencies, and educational institutions for their valuable and candid contributions and insights, without with these reports would not have been possible. Interviewees are listed separately.
Jessica Branom-Zwick, Marc Daudon, Peter Erickson, and Christy Shelton of Cascadia Consulting Group contributed to the research and preparation of several background papers supporting development of the Waste Prevention Strategy. Additional staff members assisted with interviews.
Anna Fleder, James Goldstein, and John Stutz of Tellus Institute and David Stitzhal of Full Circle Environmental also contributed to this research project.
In the interest of waste prevention, this background paper is intended for electronic distribution and viewing. If a hard copy is required, please print double-sided on recycled paper.
Oregon Department of Environmental Quality 07-LQ-009

Waste Prevention: NGOs and Infrastructure
Executive Summary................................................................................................. 1
1 Introduction and Overview........................................................................... 5 1.1 Project Overview ....................................................................................................................... 5 1.2 Waste Prevention Background.................................................................................................. 6 1.3 Research Scope and Evaluation Methods ................................................................................ 7 1.4 Report Outline ........................................................................................................................... 7
2 Waste Prevention Education........................................................................ 9 2.1 Overview.................................................................................................................................... 9 2.2 Barriers and Opportunities......................................................................................................... 9 2.3 Assessment ............................................................................................................................. 10
3 Reuse Overview .......................................................................................... 12 3.1 Edible Food Rescue ................................................................................................................ 12 3.2 Computer and Electronics Reuse............................................................................................ 13 3.3 Household Goods and Clothing Reuse ................................................................................... 13 3.4 Building Material Reuse........................................................................................................... 13
4 Edible Food Rescue.................................................................................... 14 4.1 Overview.................................................................................................................................. 14 4.2 Barriers .................................................................................................................................... 14 4.3 Opportunities ........................................................................................................................... 15 4.4 Assessment ............................................................................................................................. 16
5 Computer and Electronics Reuse.............................................................. 17 5.1 Overview.................................................................................................................................. 17 5.2 Barriers .................................................................................................................................... 17 5.3 Opportunities ........................................................................................................................... 18 5.4 Assessment ............................................................................................................................. 19
6 Household Goods and Clothing Reuse..................................................... 20 6.1 Overview.................................................................................................................................. 20 6.2 Barriers .................................................................................................................................... 20 6.3 Opportunities ........................................................................................................................... 21 6.4 Assessment ............................................................................................................................. 21
Waste Prevention Strategy i Background Paper #5 NGOs and Infrastructure December 2006
7 Building Material Reuse.............................................................................. 23 7.1 Overview.................................................................................................................................. 23 7.2 Barriers .................................................................................................................................... 23 7.3 Opportunities ........................................................................................................................... 24 7.4 Assessment ............................................................................................................................. 25 7.5 Green Building......................................................................................................................... 26
8 Summary Findings...................................................................................... 28
Appendix A. Organizational Profiles of Interviewees ........................................ 30 Waste Prevention Education ................................................................................................................ 30
BRING ....................................................................................................................................................30 reSource .................................................................................................................................................30
Edible Food Rescue ............................................................................................................................. 31 Oregon Food Bank .................................................................................................................................31 ACCESS.................................................................................................................................................32 COCAAN ................................................................................................................................................32 Food for Lane County .............................................................................................................................33 Tillamook County Regional Food Bank...................................................................................................33
Computer and Electronics Reuse......................................................................................................... 33 Free Geek...............................................................................................................................................33 StRUT.....................................................................................................................................................34 Monitors and More..................................................................................................................................34 Computer Reuse and Recycling Center .................................................................................................35 St. Vincent de Paul, Eugene...................................................................................................................35
Household Goods and Clothing Reuse ................................................................................................ 35 Goodwill Columbia-Willamette................................................................................................................35 Rogue Transfer and Recycling Station ...................................................................................................36 St. Vincent de Paul, Eugene...................................................................................................................36 Salvation Army, Cascade Division ..........................................................................................................37
Building Materials Reuse...................................................................................................................... 37 ReBuilding Center...................................................................................................................................37 Heartwood Resources ............................................................................................................................37 Gorge Rebuild-It Center..........................................................................................................................38 CART’M ..................................................................................................................................................38 BRING ....................................................................................................................................................39 Habitat for Humanity Bargain Building Supply (Albany)..........................................................................39 Habitat for Humanity ReStore (Bend) .....................................................................................................39 Northwest Demolition and Dismantle......................................................................................................40 ReUse Consulting...................................................................................................................................40 Deconstruction Management Group.......................................................................................................40
Appendix B. Waste Prevention Interview Contacts ........................................... 41
Waste Prevention Strategy ii Background Paper #5 NGOs and Infrastructure December 2006

Executive Summary
Oregon’s 1995-2005 solid waste management plan identified waste prevention as a high priority and established a vision of Oregon citizens making a value shift from a “throw-away” society to a conservation society by 2005. From 1993 through 2005, however, Oregon’s total waste generation increased 70 percent, and per-capita generation increased 43 percent. DEQ is currently working to develop a statewide Waste Prevention Strategy to help the state meet its goals of stabilizing total and per-capita waste generation. To support development of this strategy, DEQ hired the Cascadia Consulting Group to evaluate previous efforts at waste prevention and to assess the connection between waste prevention and broader environmental benefits.
This background paper focuses on nongovernmental efforts in Oregon, including primarily nonprofit organizations as well as several private businesses, relating to material reuse and waste prevention. Specifically, it is intended to provide DEQ, DEQ’s Waste Prevention Strategy Steering Committee, and the interested public with a common understanding of the waste prevention and reuse services and infrastructure that nongovernmental organizations provide in Oregon, including the barriers and opportunities for continued progress. Cascadia reviewed program reports and interviewed administrators at nongovernmental organizations that perform the following activities:
Education that address waste prevention, reuse, and home composting;
Edible food rescue;
Computer and electronics reuse;
Used building material reuse; and
Clothing and household goods reuse (e.g., thrift stores).
In addition, Cascadia conducted a limited literature review of the potential role that “green building” has to play in reducing waste generation.
While these sectors do not represent the entire universe of nongovernmental infrastructure (for example, appliance and furniture repair are both excluded), they are sufficiently broad to capture a reasonable variety of barriers and opportunities.
Overall Findings
Oregon has scores of organizations active in a wide variety of reuse activities. Organizations located around the state help Oregonians reuse many thousands of tons of household goods, electronics, building materials, food, and other materials each year.
Material reuse is not highly profitable. Most organizations involved in reuse are nonprofits with broad missions of community service that rely, at least in part, on grant funds.
Nevertheless, reuse organizations benefit from broad community support, and many opportunities exist for expansion. Clear opportunities exist in building material reuse, food rescue, and household goods reuse. Computer and electronics reuse can also expand if tied to other efforts such as e-scrap recycling and expansion of technology access.
Waste Prevention Strategy 1 Background Paper #5 NGOs and Infrastructure December 2006

Skilled and professional leadership is essential to nonprofit success. Interviewees in all areas stressed the importance of competent leadership and entrepreneurial approaches. Strong leadership can also help counter a reported perception – whether justified or not – that nonprofits lack professionalism. This perception can hamper progress if organizations are overlooked for contracts or funding.
A role for DEQ or other State support is likely to be most cost-effective if focused on capital improvements and reuse-friendly policy. Capital investments help organizations with strong operating revenues grow and increase effectiveness. State policies and incentives can help favor reuse over disposal and help increase demand for items such as used building materials.
Waste Prevention Education Findings
Organizations that provide education addressing waste prevention, including reuse and home composting, do not fit a single mold. However, one common trait is that they generally have grown with strong community support, beginning decades ago as grassroots efforts.
Community outreach and education are core services that these organizations offer. In addition, they may offer tangible opportunities for reuse, such as a used building material or household goods store or online exchange, or business outreach services.
They typically rely on grants or contracts to support some of their work.
Skilled leadership and a tolerance for risk are critical success factors.
The biggest need appears to be funding to conduct education and outreach. Organizations rely on grants and public contracts, but contracts are in short supply and competition for grants is high.
One factor that may hinder the attractiveness of education and outreach to some grantors is the limited availability of data to document the successes of education, outreach, or social marketing efforts.
Edible Food Rescue Findings
Edible food rescue programs recover thousands of tons of perishable food each year to help feed low-income Oregon residents; over 160 Oregon grocery stores are donating perishable food items.
These programs rely on grants and donations, as food is generally provided free-of-charge to those in need at food banks and associated meal centers.
Significant opportunities remain to expand existing food rescue programs and start new ones.
The biggest capital need is refrigeration capacity at direct service providers to enable distribution and serving of perishable food; however, several of these organizations also struggle with operating expenses, such as labor and fuel costs.
Professionalism and consistency are critical success factors for any program. Grocery stores and other donors have little staff time to devote to food donation, and therefore they require food rescue programs to act like any other supplier.
Waste Prevention Strategy 2 Background Paper #5 NGOs and Infrastructure December 2006

Computer and Electronics Reuse Findings
Only a small fraction of discarded computers and electronics are refurbishable and resellable, generally ranging from 5 to 25 percent.
Electronics resale is typically not profitable, and all organizations interviewed rely on outside funding.
The resale value of used electronics is low.
Most organizations focus on job training and providing computers to low-income and other disadvantaged populations.
Computer and electronics organizations do more recycling than reuse and waste prevention. This sector facilitates the reuse of a few hundred tons of electronics annually.
Furthermore, computer reuse is not likely preventing the purchase, one-for-one, of new computers, as used computers are often donated to individuals or institutions who would not otherwise have access. Nevertheless, the expansion of technology access is highly needed and beneficial to Oregon communities.
Household Goods and Clothing Reuse Findings
Household goods and clothing reuse is a strong and growing sector, both in brick-and-mortar retail stores (e.g., Goodwill) and online (e.g., eBay, Craigslist).
Organizations in this sector tend to be financially self-sufficient once established, and sales of materials are often used to raise funds for social services.
Interviewees reported few barriers to continued growth. Dumping at stores and resultant high disposal costs was the major barrier, although others were also mentioned.
Many opportunities exist for expanded reuse, including:
o Opening of new stores to meet demand
o Expansion into new areas (e.g., materials recycling) that have not been traditionally a focus of reuse organizations, which could increase their ability to accept more materials for reuse.
Building Material Reuse Findings
Oregon’s building material reuse and deconstruction industries are among the best in the nation. These industries provide two related services: acceptance and resale of reusable building materials and on-site deconstruction of buildings, which can support reuse of whole structures as well as generate building materials for reuse. Thousands of tons of building materials are reused in Oregon each year.
Organizations involved in building material resale can generally reach self-sufficiency for operating costs, although most rely on grants for expansions and other capital investments. The economics of deconstruction are still shaky, however, as it is usually more expensive than demolition, the standard practice.
Waste Prevention Strategy 3 Background Paper #5 NGOs and Infrastructure December 2006

Demand for many used building materials is high, and significant opportunities remain to expand existing reuse organizations and establish new ones. Interviewees agreed that building material salvage could be successful even at smaller scales in rural areas.
Given their size and quantity of desirable materials, commercial buildings offer a significant opportunity for deconstruction, though deconstruction crews need to be able to fit their work into the tight timelines common to commercial projects. Providing more salvage opportunities at waste facilities would also help support reuse of building materials.
Waste Prevention Strategy 4 Background Paper #5 NGOs and Infrastructure December 2006
1 Introduction and Overview
1.1 Project Overview
To support development of its statewide Waste Prevention Strategy, Oregon’s Department of Environmental Quality conducted or commissioned background research on existing waste prevention and reuse efforts and related topics. In 2006, DEQ hired a team led by Cascadia Consulting Group to conduct some of this background research, and Department staff conducted other research efforts in-house. Eight background papers summarize research findings on the following topics:
1. Waste Generation (DEQ);
2. Environmental Considerations – The benefits of waste prevention and reuse as an environmental strategy and in the context of sustainability (Cascadia);
3. State of Oregon Efforts – State government waste prevention programs in Oregon, including but not limited to DEQ’s solid waste grants (Cascadia);
4. Local Government Efforts – Local government waste prevention programs in Oregon, particularly those covered in DEQ’s 2% recovery rate credit program (Cascadia);
5. Nongovernmental Organizations and Infrastructure – Nongovernmental organizations providing reuse and waste prevention infrastructure and services in Oregon, including these categories (Cascadia):
Edible food rescue;
Building material reuse;
Computer and electronics reuse;
Clothing and household goods reuse (e.g., thrift stores); and
Educational efforts that address waste prevention, reuse, and home composting;
6. Business (DEQ);
7. Other States and International Efforts – Waste prevention and reuse efforts outside of Oregon, including examples from around the U.S. and the world (Tellus Institute and Cascadia); and
8. Product Stewardship (DEQ).
This report, Background Paper #5, focuses on nongovernmental efforts, including both not-for-profit organizations and several private-sector businesses, in Oregon. Together, these eight reports compose the research and information-gathering phases designed to inform the development of Oregon’s strategy for waste prevention. This information has been developed to help the Department of Environmental Quality, DEQ’s Waste Prevention Strategy Steering Committee, external stakeholders, and agency managers to develop a statewide Waste Prevention Strategy. The Department will implement the Waste Prevention Strategy in 2007 and beyond.
Waste Prevention Strategy 5 Background Paper #5 NGOs and Infrastructure December 2006

1.2 Waste Prevention Background
Waste prevention sits at the top of the waste management hierarchy, followed by reuse, recycling, composting, energy recovery, and landfilling. Oregon’s 1995-2005 solid waste management plan identified waste prevention as a high priority. It also established a vision of Oregon citizens making a value shift from a “throw-away” society to a conservation society by 2005. From 1993 through 2005, however, Oregon’s total solid waste generation increased 70 percent and per-capita generation increased 43 percent.
DEQ’s statewide Waste Prevention Strategy will be designed to help Oregon meet its goals, established in 2001, to stabilize total and per-capita waste generation. Waste generation is defined as the sum of materials recovered (e.g., through recycling) and materials disposed (e.g., in a landfill). Many of DEQ’s past solid waste efforts have focused on recycling, while waste prevention and reuse, the preferred objectives in the waste management hierarchy, typically have received relatively less emphasis.
Definitions
In this report, the broad category of waste prevention is defined as diminishing the amount of solid waste generated that is collected for recovery or for final disposal in landfills or waste incinerators. DEQ categorizes general waste prevention into three types:
“Pure” waste prevention (also referred to in this report as source reduction) diminishes the amount of solid waste generated or resources used, without increasing toxicity, through changes in the design, manufacture, purchase, or use of products or packaging. Examples include buying and using less/fewer materials or products, purchasing and using durable, reusable materials instead of disposables, and improving packaging efficiency.
Reuse extends the life of a product or material by repairing, modifying, or finding new uses for it (in its original or a similar form – rather than changing its identity through recycling and making new products). Reuse activities include typical thrift store operations for used clothing and household goods as well as edible food rescue, used building materials, computer reuse, and other categories.
Home composting is defined broadly to mean managing organic materials onsite at homes, businesses, and institutions through composting, grasscycling, worm bins, and mobile chipping operations, which facilitate onsite management of yard debris. (Stockpiling and burning organics are not included as waste prevention. Curbside collection and centralized composting of organic materials are counted as recovery.)
Jurisdictions within and beyond Oregon may use different definitions of waste reduction. DEQ defines waste reduction to mean any effort that diverts materials from disposal. Thus, waste reduction encompasses both waste prevention and recovery, which in turn includes recycling and off-site composting. This approach is consistent with the U.S. Environmental Protection Agency’s definition. Confusion may arise, however, because some other states and programs consider waste reduction to mean reducing the amount or toxicity of waste generated or reusing materials. In Oregon, local governments and solid waste program operators can be similarly inconsistent on this matter, contributing to the ambiguity. For the purposes of this report and the Waste Prevention Strategy, however, "waste reduction" means disposal avoidance and includes both waste prevention and recovery.
Waste Prevention Strategy 6 Background Paper #5 NGOs and Infrastructure December 2006

1.3 Research Scope and Evaluation Methods
This report focuses on nongovernmental efforts to provide reuse and waste prevention infrastructure and services. It is intended to provide DEQ and interested parties with a common understanding of the waste prevention and reuse services and infrastructure that selected nongovernmental organizations (NGOs), including both not-for-profit groups as well as some private businesses, provide in Oregon. It is also designed to inform DEQ and interested parties on the barriers and opportunities for continued progress.
Cascadia researched nongovernmental activities and compiled information through telephone interviews and personal communications with nonprofit and business leaders, DEQ staff, local government staff members, existing reports, websites and other sources, including solid waste grant reports and 2% recovery rate credit applications. The research project developed a database of roughly 150 organizations and more than 460 relevant efforts in Oregon involving state government, local governments, businesses, and nonprofits. We worked with DEQ and Metro staff to identify a set of interviewees intended to target leading programs around the state.
This report draws on existing data and interviews from a sampling of relevant organizations, including industry leaders, but is not a comprehensive study. Cascadia interviewed directors, presidents, and program leaders at nonprofits and businesses involved in reuse and waste prevention as well as all seven of DEQ’s regional solid waste technical assistance staff members.
Waste prevention is often difficult to measure and quantify, and evaluation efforts are frequently limited or non-existent. More quantitative data are generally available on material reuse than for pure waste prevention, though tracking and reporting remain incomplete. Much of the quantitative data cover activity measures rather than baseline data and ongoing measurement of outcomes. Conducting comprehensive, independent evaluations of the activities of the 150 relevant NGOs in Oregon (or even a subset) is beyond the scope of this effort. Accordingly, we necessarily relied on self-reported data from interviews with organizational leaders and available existing data sources. As a result, many findings are more qualitative than quantitative, though our interviews helped to identify organizations and programs that appear more active and effective and to offer potential models for further reuse and waste prevention efforts.
1.4 Report Outline
This report on the reuse and waste prevention efforts of nongovernmental organizations in Oregon is organized into the chapters listed below. Cascadia also conducted a brief literature review on how green building can influence waste prevention, and these findings are included in Chapter 7 on Building Material Reuse.
1. Introduction and Overview
2. Waste Prevention Education
3. Reuse Overview
4. Edible Food Rescue
5. Electronics Reuse
6. Household Goods Reuse
Waste Prevention Strategy 7 Background Paper #5 NGOs and Infrastructure December 2006

7. Building Material Reuse
8. Summary Findings
Waste Prevention Strategy 8 Background Paper #5 NGOs and Infrastructure December 2006

2 Waste Prevention Education
2.1 Overview
Organizations that provide education addressing waste prevention, including reuse and home composting, do not fit a single mold. However, one common trait is that they generally have grown with strong community support, beginning decades ago as grassroots efforts. Community outreach and education is a core service that these organizations offer. In addition, they may offer tangible opportunities for reuse, such as running a bricks-and-mortar store or online exchange for used building materials or household goods or providing business outreach services. Sample organizations that perform broad-based waste prevention and educational activities include BRING in Eugene and reSource in Bend. CART’M in Manzanita conducts some similar educational activities, but the organization is included in the building material reuse category, according to its primary (non-recycling) activity. Other organizations span more than one reuse category (e.g., St. Vincent de Paul of Lane County), but such groups are covered in the individual material sectors: edible food rescue, computer and electronic reuse, used building materials, and household goods and clothing resale.
These educational organizations may obtain grants or public contracts to support the various aspects of their missions. For example, BRING has a contract with Lane County to conduct waste prevention and other environmental education in schools and the community. ReSource has contracts with Deschutes County on various waste prevention and recycling topics.
2.2 Barriers and Opportunities
Our evaluation of waste prevention education organizations identified several barriers to and opportunities for achieving their educational goals. Limited funding for conducting education and outreach is a primary barrier. Organizations rely on grants and public contracts, but contracts are in short supply, and competition is great and long-term stability is low with grants. Even with adequate funding, it is often difficult to evaluate programs’ impact and to demonstrate results that could help enlist support for continued efforts. The growth of the community-based social marketing concept has helped introduce and instill more tracking measures, but in general it is difficult to assess whether educational efforts are achieving desired outcomes. Measuring long-term effects is even more challenging. Some potential supporters view this lack of accountability and rigorous evaluation as detrimental.
Existing reuse organizations are appropriate outlets for waste prevention education and outreach because it reinforces their mission and activities. Increased community awareness of waste prevention helps support reuse efforts and vice versa. Educational organizations that also operate reuse stores can realize sales gains from their outreach, education, and marketing efforts. Sales of used materials can also provide funding to support educational activities. Existing educational organizations that have focused on recycling may be well positioned to expand their efforts into related waste prevention and reuse areas.
Waste Prevention Strategy 9 Background Paper #5 NGOs and Infrastructure December 2006

Waste Prevention Education Example – BRING
BRING is a nonprofit organization in Eugene involved in building material salvage (including deconstruction), recycling, waste prevention, and other environmental education. Its mission states, “BRING promotes a healthy and sustainable environment through education, innovative conservation programs, and community involvement in conserving natural resources. We help people understand the connection between the resources they use and the clean air, pure water and wild places they value.”
BRING conducts a variety of outreach and education activities for both the general public, including youth and adults, and for professional groups, such as contractors. BRING’s presentations and activities for schools include the Reduce Reuse Recycle Slideshow on the importance of the three “Rs” and how to do them, the Wonderful World of Reuse focused on the benefits of and steps to follow for reusing materials, paper-making lessons, worm composting workshops, waste audits, and tours of Lane County’s Glenwood Central Receiving Center for garbage and recycling. Adult educational programs include how-to workshops, tours, presentations to community groups, and events focused on such topics as reducing household toxics, home composting and vermicomposting, and reusing salvaged building materials. BRING reports that its educational efforts reached 7,700 kids and 10,000 adults in 2005.
In 2005, BRING’s used building material store recorded 30,000 transactions, for a total value of $430,000. The organization received 520 tons of items at the store and procured an additional 275 tons of material from its own deconstruction efforts. In addition, BRING operates an online material exchange and provides information to businesses. The organization is currently building a new facility, the Planet Improvement Center, which will house its used building material store and also demonstrate methods of reusing a variety of household materials.
In 2002, a solid waste grant from DEQ enabled BRING to provide education and outreach to contractors, designers, architects, and the public regarding deconstruction and building material reuse. As part of the Deconstruction Jumpstart project, the organization created and distributed a brochure about material reuse from deconstruction. BRING also educated people on the subject at various public events and during site visits.
Additional information may be found online at www.bringrecycling.org.
2.3 Assessment
The review of broad-based NGOs offering waste prevention education programs yielded several lessons. First, no single model exists for a general waste prevention education organization. Different approaches have worked in several communities, depending on local needs and circumstances. Examples include classroom education, workshops for adults, and booths at fairs and festivals.
Second, used material sales can provide a valuable funding source. While this is not a necessary condition for program success, it provides needed income and some independence from grants. It can also raise visibility and public awareness of the organization in the community.
Third, creative, skilled leadership and a tolerance for risk are highly beneficial attributes for these organizations. New opportunities abound, but growth depends on leaders and organizations that can identify challenges and seize tangible opportunities in a timely manner. Financing may be necessary,
Waste Prevention Strategy 10 Background Paper #5 NGOs and Infrastructure December 2006

as with BRING’s Planet Improvement Center, and nonprofit leadership may need willingness to assume debt on the path toward achieving positive outcomes.
Fourth, a DEQ or State role could focus on grant funding for education and a statewide campaign supporting educational efforts on waste prevention. Funding to support education and evaluation efforts would help further the work of these organizations, as would development and promotion of statewide messages encouraging waste prevention.
Waste Prevention Strategy 11 Background Paper #5 NGOs and Infrastructure December 2006

3 Reuse Overview
Reuse organizations connect donors and other generators who have excess goods or items they no longer want with customers who can put them to good use, delaying their eventual recycling or disposal and preventing waste by reducing the need to purchase or produce new items. The reuse sector trades in a wide variety of products. Cascadia interviewed staff and administrators of reuse organizations in four primary sectors: edible food rescue, building materials, computers, and household goods. These interviews revealed barriers common to many or all sectors of reuse as well as barriers specific to individual sectors. This section summarizes those barriers, and the following four chapters discuss research and interview results in more detail. Overall barriers to reuse include:
Limited staff time to perform labor-intensive tasks.
Collecting perishable food donations, refurbishing computers, and deconstructing buildings all take significant staff time and can be difficult tasks for nonprofits with limited budgets to maintain.
Difficulty establishing sufficient infrastructure to handle collection, processing, and distribution of materials for reuse.
Finding and paying for suitable sites and equipment (e.g., used building material stores, low-cost space for disassembling electronics, forklifts, and racking) can be difficult due to limited funds, zoning restrictions, or lack of suitable sites.
Difficult and expensive logistics and transportation of used materials.
Areas of supply and demand are often separated by great distances.
Special storage space may be needed (e.g., refrigeration for edible food rescue).
Simple or outdated tracking and merchandising systems may make it difficult to track inventory and monitor demand.
Interviewees in all sectors mentioned that some potential donors or customers have expressed a lack of trust or concerns about the competency and safety practices of reuse organizations (e.g., food safety, data destruction practices, deconstruction safety).
Barriers specific to individual reuse sectors include the following issues:
3.1 Edible Food Rescue
Some store policies limit edible food rescue (e.g., Wal-Mart and Safeway).
Insufficient capacity for refrigeration, freezers, and warehouse storage.
The challenge of keeping pace with changing consumer habits and food product mixes (e.g., the shift to more restaurant meals, deli items, and other packaged foods requires a different approach for food rescue, though it may also create opportunities).
Waste Prevention Strategy 12 Background Paper #5 NGOs and Infrastructure December 2006

3.2 Computer and Electronics Reuse
Low value of and weak demand for used computers.
Rapidly changing technology.
Perceptions by some that nonprofit electronics handlers are unreliable.
Lack of regulatory preference or requirement to reuse or recycle instead of disposing.
3.3 Household Goods and Clothing Reuse
Dumping at donation sites creates high disposal costs for thrift stores.
Retail stores require network of donation sites and capital investments for expansion.
3.4 Building Material Reuse
Frequent geographic distance between material supplies and demand.
Regulations can discourage reuse (e.g., code restrictions on use of reclaimed lumber).
Insufficient covered areas for sorting and storage, siting difficulties, and concerns from neighbors (e.g., NIMBYism, or “not in my back yard”).
Deconstruction is usually more expensive and time-consuming than demolition.
Disposal is relatively easy and inexpensive.
Waste Prevention Strategy 13 Background Paper #5 NGOs and Infrastructure December 2006

4 Edible Food Rescue
4.1 Overview
Organizations involved in food rescue work with grocery stores, food distributors, institutions, restaurants, caterers, and others to collect and redistribute perishable food that would otherwise be disposed, such as produce, dairy items, pre-packaged deli items (e.g., lunch meats), and other products.
The Oregon Food Bank started the Fresh Alliance program to unify food rescue efforts and attract larger grocery stores and chains. Many of Oregon’s regional food banks are now involved in the program, although several were already doing food rescue on their own. Sample organizations that were interviewed for this study include the following:
Oregon Food Bank (statewide)
Food for Lane County
COCAAN, now known as NeighborImpact (Deschutes County)
ACCESS (Jackson County)
Tillamook County Regional Food Bank (formerly an effort of CARE)
At least 160 grocery stores throughout Oregon are donating perishables through the Fresh Alliance program, but this represents only about a third of the stores that could participate. The level of food recovery by regional food banks varies considerably: one recovers and redistributes over 1,500 tons of perishable food annually and serves 80,000 individuals, while another gathers only limited quantities of bread and no other perishables. In most cases the organizations that perform the food rescue are partnered with several direct service providers to serve meals and distribute food supplies.
4.2 Barriers
The edible food rescue organizations interviewed identified key barriers concerning resource constraints and donor impediments. Edible food rescue organizations usually have limited resources for both operations and expansion. Limited refrigeration capacity at the direct service providers restricts the quantities of perishable food that can be safely collected, distributed, and served. Service providers need more refrigerated trucks and permanent cooler and freezer capacity.
Programs have limited resources to solicit new donors and collect food. Fortunately, the process of soliciting donors is receiving great assistance from the Oregon Food Bank’s Fresh Alliance effort. This statewide umbrella effort offers a clear message to potential donors and reduces solicitation costs. Local organizations still need to provide their own staff to collect the food from donors, however, and these resources may not be available. Transportation costs can be a major factor, especially in rural areas. High transportation costs affect not only the cost to operate the collection truck but also the ability and willingness of volunteers and even food recipients to drive to the organizations.
Donors themselves can also pose a barrier. Some potential donors are concerned about liability. The Good Samaritan law protects donors legally, but concern remains about bad public relations if someone were to get sick. Interviewees report that this has never happened, however, and is very unlikely to happen due to the vigilance of the food banks and the direct service providers. Corporate
Waste Prevention Strategy 14 Background Paper #5 NGOs and Infrastructure December 2006
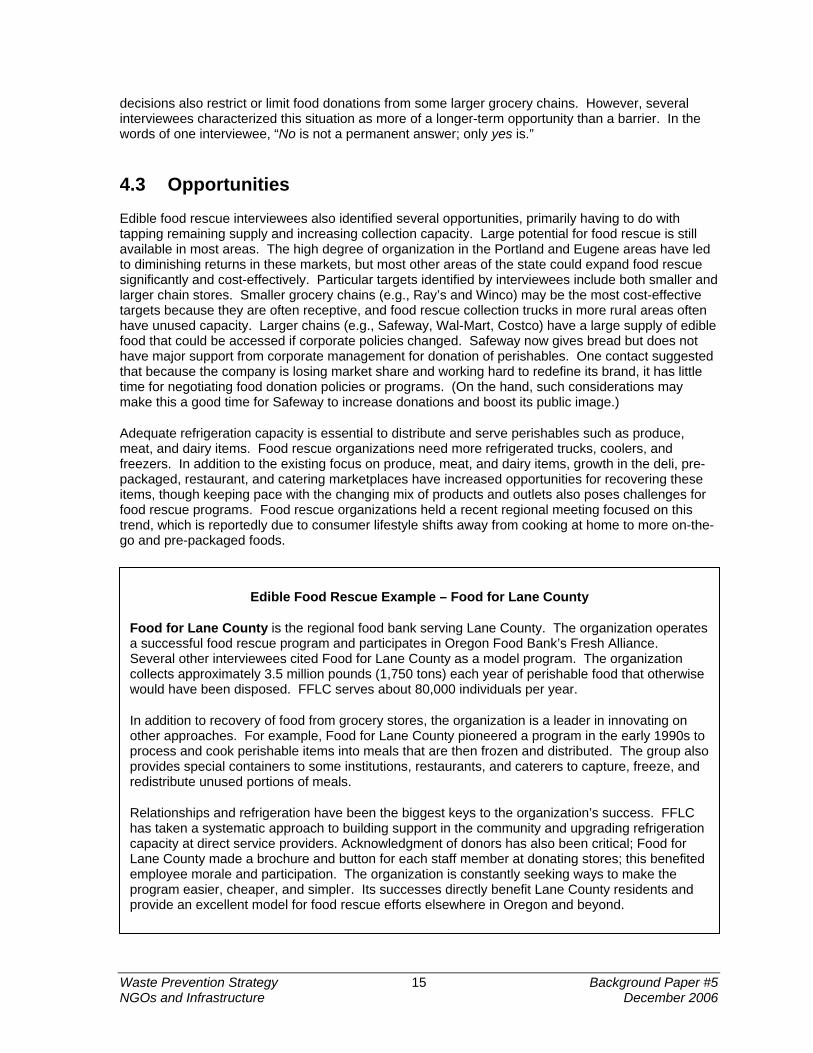
decisions also restrict or limit food donations from some larger grocery chains. However, several interviewees characterized this situation as more of a longer-term opportunity than a barrier. In the words of one interviewee, “No is not a permanent answer; only yes is.”
4.3 Opportunities
Edible food rescue interviewees also identified several opportunities, primarily having to do with tapping remaining supply and increasing collection capacity. Large potential for food rescue is still available in most areas. The high degree of organization in the Portland and Eugene areas have led to diminishing returns in these markets, but most other areas of the state could expand food rescue significantly and cost-effectively. Particular targets identified by interviewees include both smaller and larger chain stores. Smaller grocery chains (e.g., Ray’s and Winco) may be the most cost-effective targets because they are often receptive, and food rescue collection trucks in more rural areas often have unused capacity. Larger chains (e.g., Safeway, Wal-Mart, Costco) have a large supply of edible food that could be accessed if corporate policies changed. Safeway now gives bread but does not have major support from corporate management for donation of perishables. One contact suggested that because the company is losing market share and working hard to redefine its brand, it has little time for negotiating food donation policies or programs. (On the hand, such considerations may make this a good time for Safeway to increase donations and boost its public image.)
Adequate refrigeration capacity is essential to distribute and serve perishables such as produce, meat, and dairy items. Food rescue organizations need more refrigerated trucks, coolers, and freezers. In addition to the existing focus on produce, meat, and dairy items, growth in the deli, pre-packaged, restaurant, and catering marketplaces have increased opportunities for recovering these items, though keeping pace with the changing mix of products and outlets also poses challenges for food rescue programs. Food rescue organizations held a recent regional meeting focused on this trend, which is reportedly due to consumer lifestyle shifts away from cooking at home to more on-the-go and pre-packaged foods.
Edible Food Rescue Example – Food for Lane County
Food for Lane County is the regional food bank serving Lane County. The organization operates a successful food rescue program and participates in Oregon Food Bank’s Fresh Alliance. Several other interviewees cited Food for Lane County as a model program. The organization collects approximately 3.5 million pounds (1,750 tons) each year of perishable food that otherwise would have been disposed. FFLC serves about 80,000 individuals per year.
In addition to recovery of food from grocery stores, the organization is a leader in innovating on other approaches. For example, Food for Lane County pioneered a program in the early 1990s to process and cook perishable items into meals that are then frozen and distributed. The group also provides special containers to some institutions, restaurants, and caterers to capture, freeze, and redistribute unused portions of meals.
Relationships and refrigeration have been the biggest keys to the organization’s success. FFLC has taken a systematic approach to building support in the community and upgrading refrigeration capacity at direct service providers. Acknowledgment of donors has also been critical; Food for Lane County made a brochure and button for each staff member at donating stores; this benefited employee morale and participation. The organization is constantly seeking ways to make the program easier, cheaper, and simpler. Its successes directly benefit Lane County residents and provide an excellent model for food rescue efforts elsewhere in Oregon and beyond.
Waste Prevention Strategy 15 Background Paper #5 NGOs and Infrastructure December 2006
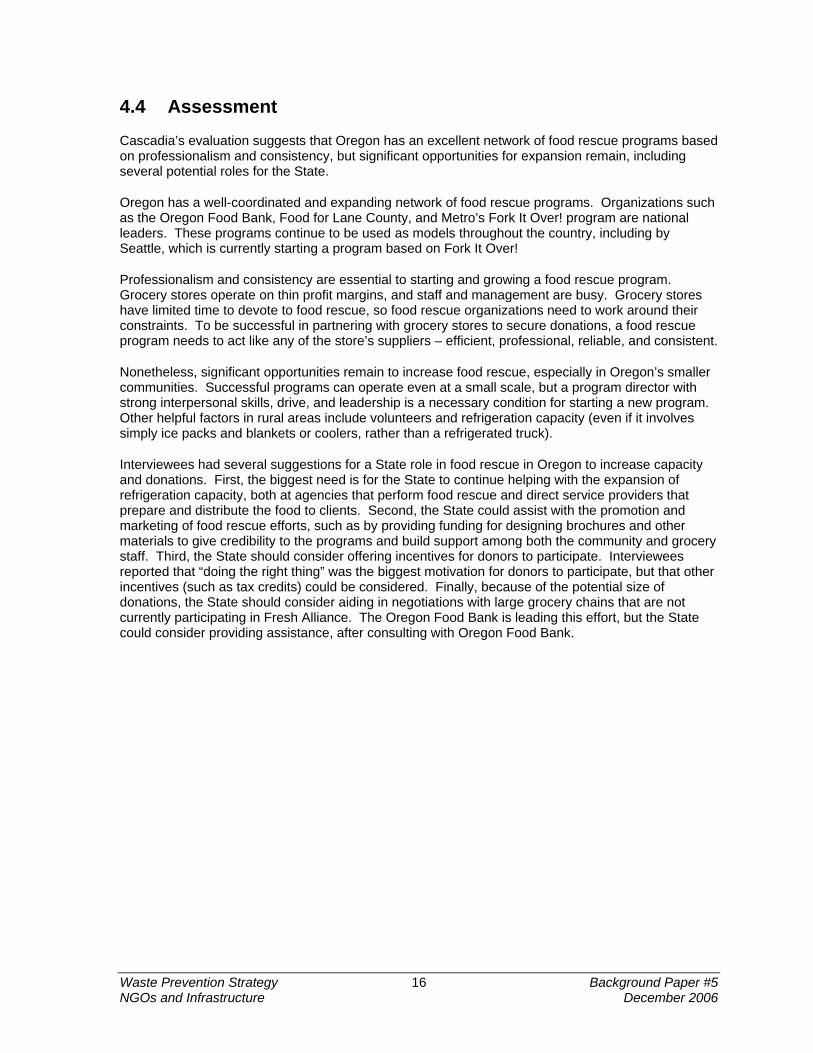
4.4 Assessment
Cascadia’s evaluation suggests that Oregon has an excellent network of food rescue programs based on professionalism and consistency, but significant opportunities for expansion remain, including several potential roles for the State.
Oregon has a well-coordinated and expanding network of food rescue programs. Organizations such as the Oregon Food Bank, Food for Lane County, and Metro’s Fork It Over! program are national leaders. These programs continue to be used as models throughout the country, including by Seattle, which is currently starting a program based on Fork It Over!
Professionalism and consistency are essential to starting and growing a food rescue program. Grocery stores operate on thin profit margins, and staff and management are busy. Grocery stores have limited time to devote to food rescue, so food rescue organizations need to work around their constraints. To be successful in partnering with grocery stores to secure donations, a food rescue program needs to act like any of the store’s suppliers – efficient, professional, reliable, and consistent.
Nonetheless, significant opportunities remain to increase food rescue, especially in Oregon’s smaller communities. Successful programs can operate even at a small scale, but a program director with strong interpersonal skills, drive, and leadership is a necessary condition for starting a new program. Other helpful factors in rural areas include volunteers and refrigeration capacity (even if it involves simply ice packs and blankets or coolers, rather than a refrigerated truck).
Interviewees had several suggestions for a State role in food rescue in Oregon to increase capacity and donations. First, the biggest need is for the State to continue helping with the expansion of refrigeration capacity, both at agencies that perform food rescue and direct service providers that prepare and distribute the food to clients. Second, the State could assist with the promotion and marketing of food rescue efforts, such as by providing funding for designing brochures and other materials to give credibility to the programs and build support among both the community and grocery staff. Third, the State should consider offering incentives for donors to participate. Interviewees reported that “doing the right thing” was the biggest motivation for donors to participate, but that other incentives (such as tax credits) could be considered. Finally, because of the potential size of donations, the State should consider aiding in negotiations with large grocery chains that are not currently participating in Fresh Alliance. The Oregon Food Bank is leading this effort, but the State could consider providing assistance, after consulting with Oregon Food Bank.
Waste Prevention Strategy 16 Background Paper #5 NGOs and Infrastructure December 2006

5 Computer and Electronics Reuse
5.1 Overview
Organizations involved in electronics reuse generally accept material from residential, businesses, and institutional waste generators for a fee. They then sort the equipment into two streams: equipment to be refurbished and resold (typically 5 to 25 percent of the items) and items to be recycled (the remaining 75 to 90 percent). Many programs perform the refurbishing using volunteers or others interested in learning computer job skills. Refurbished computers are then either given to the volunteers, resold for modest prices (generally $100 to $200), or donated to low-income households, schools, or others in need.
About a dozen organizations around the state were identified that focus on these types of services, although some contribute only very limited reuse. We interviewed five relevant organizations:
Free Geek (Portland)
StRUT (currently located in The Dalles; a previous incarnation was based in Portland)
Monitors and More (Roseburg)
Computer Reuse and Recycling Center (Eugene)
St. Vincent de Paul (Eugene)
Some organizations that refurbish and reuse computers each facilitate the reuse of up to about 100 tons per year, representing thousands of computers. However, these activities can occur at a very small scale as well. Monitors and More, the smallest organization we interviewed, reuses only a few hundred computers each year. Even smaller organizations and businesses also exist in this sector.
Computer reuse is not highly profitable. Most organizations interviewed have broader missions that involve community service and rely at least in part on grant funds for both capital and operating costs.
5.2 Barriers
Computer reuse organizations face four main barriers: low demand, limited profit, lack of resources, and poor public perceptions.
Most used computers have little value and demand is low. Only about 5 to 25 percent of computers collected from the public are capable of being refurbished or resold because the technology is outdated due to frequent advances in new computers. The percentage of usable computers can sometimes be higher (60 to 70 percent) from certain business or institutional generators, such as schools. Components and peripherals, such as such as memory and drives, may be reused at a higher rate. Demand for used computers for purchase is low, but many programs provide them as a service to volunteers and other populations in need. A related barrier is that electronics refurbishing and resale is rarely profitable because demand, and therefore price, is generally low. Sales of working computers and recyclables rarely cover costs, so most participating organizations are nonprofits that rely on grants to help cover their capital costs and operating expenses.
Additionally, organizations have limited space and staff resources to disassemble and refurbish electronics. Refurbishing requires more space and staff time than recycling. Most organizations that disassemble rely on job training programs and other forms of low-cost labor.
Waste Prevention Strategy 17 Background Paper #5 NGOs and Infrastructure December 2006
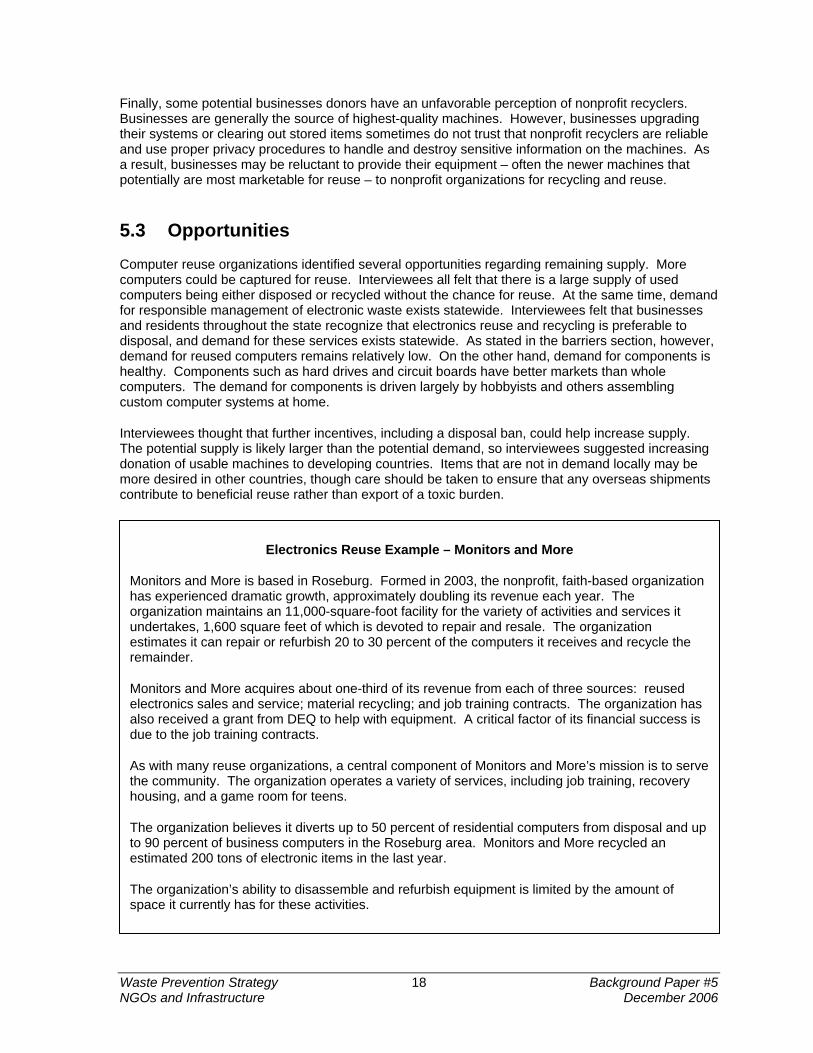
Finally, some potential businesses donors have an unfavorable perception of nonprofit recyclers. Businesses are generally the source of highest-quality machines. However, businesses upgrading their systems or clearing out stored items sometimes do not trust that nonprofit recyclers are reliable and use proper privacy procedures to handle and destroy sensitive information on the machines. As a result, businesses may be reluctant to provide their equipment – often the newer machines that potentially are most marketable for reuse – to nonprofit organizations for recycling and reuse.
5.3 Opportunities
Computer reuse organizations identified several opportunities regarding remaining supply. More computers could be captured for reuse. Interviewees all felt that there is a large supply of used computers being either disposed or recycled without the chance for reuse. At the same time, demand for responsible management of electronic waste exists statewide. Interviewees felt that businesses and residents throughout the state recognize that electronics reuse and recycling is preferable to disposal, and demand for these services exists statewide. As stated in the barriers section, however, demand for reused computers remains relatively low. On the other hand, demand for components is healthy. Components such as hard drives and circuit boards have better markets than whole computers. The demand for components is driven largely by hobbyists and others assembling custom computer systems at home.
Interviewees thought that further incentives, including a disposal ban, could help increase supply. The potential supply is likely larger than the potential demand, so interviewees suggested increasing donation of usable machines to developing countries. Items that are not in demand locally may be more desired in other countries, though care should be taken to ensure that any overseas shipments contribute to beneficial reuse rather than export of a toxic burden.
Electronics Reuse Example – Monitors and More
Monitors and More is based in Roseburg. Formed in 2003, the nonprofit, faith-based organization has experienced dramatic growth, approximately doubling its revenue each year. The organization maintains an 11,000-square-foot facility for the variety of activities and services it undertakes, 1,600 square feet of which is devoted to repair and resale. The organization estimates it can repair or refurbish 20 to 30 percent of the computers it receives and recycle the remainder.
Monitors and More acquires about one-third of its revenue from each of three sources: reused electronics sales and service; material recycling; and job training contracts. The organization has also received a grant from DEQ to help with equipment. A critical factor of its financial success is due to the job training contracts.
As with many reuse organizations, a central component of Monitors and More’s mission is to serve the community. The organization operates a variety of services, including job training, recovery housing, and a game room for teens.
The organization believes it diverts up to 50 percent of residential computers from disposal and up to 90 percent of business computers in the Roseburg area. Monitors and More recycled an estimated 200 tons of electronic items in the last year.
The organization’s ability to disassemble and refurbish equipment is limited by the amount of space it currently has for these activities.
Waste Prevention Strategy 18 Background Paper #5 NGOs and Infrastructure December 2006

5.4 Assessment
Cascadia’s evaluation finds that computer reuse organizations generally have trouble reaching self-sufficiency. The sector as a whole is fairly small; reuse activities are limited, but the sector provides a number of additional social benefits. Potential roles for the State range from continued grants for equipment to assistance with subsidized labor, such as through job training programs.
Electronics refurbishing and reuse organizations have difficulty reaching self-sufficiency. Prices paid for used electronics generally cannot support the labor required to get equipment ready for sale. As a result, programs rely on a variety of other revenue sources, including material recycling, fees charged for accepting equipment, job training contracts, and grants. Free Geek (in Portland) has been the most successful economically, as it is able to support all of its operating costs based on fees and sales of recyclables and reused items. The organization has needed grants only for expansion.
Most organizations have broad missions that include community service. All organizations interviewed have community service as a strong, or even central, part of their mission. Job training and providing of computers to communities in need were two goals cited by all interviewees. For most groups, waste prevention and reuse are a means to support these other missions.
Computer reuse is not a sector where waste prevention efforts are likely to achieve high-tonnage outcomes, but the other benefits are worthwhile and impressive. The largest computer reuse operation interviewed for this study (Free Geek) reuses about 100 tons of computers (thousands of units) per year, while the smallest (Monitors and More) reused only a few hundred computers. Nevertheless, the job training and technology access opportunities that these groups offer provide real benefits to communities while keeping toxic components out of municipal waste landfills.
Up to this time, DEQ efforts have focused largely on expansion and equipment purchases. These grants have been instrumental to interviewees’ success. Other suggestions for further DEQ grants include help with educational materials and public relations to inform communities about reuse options and their benefits as well as continued help with equipment purchases, including processing equipment to help with recycling of non-reusable items. DEQ could also offer technical assistance and information-sharing to help other organizations get started or to begin operations in new geographic areas. Finally, the State could assist with subsidized or low-cost labor, perhaps through the Jobs Plus program.
Waste Prevention Strategy 19 Background Paper #5 NGOs and Infrastructure December 2006

6 Household Goods and Clothing Reuse
6.1 Overview
Clothing and household goods represent a major sector for material reuse. Organizations involved in these reuse activities collect most household goods including clothing, shoes, books, furniture, small appliances, and toys for sale in their retail stores. Items are collected at drop-off sites, retail stores, or sometimes even salvaged from transfer stations. In addition, some organizations deconstruct items for reuse in lower forms (e.g., clothing to rags) or for recycling.
Household goods reuse organizations can range from individual for-profit consignment shops to a major network of thrift shops associated with and supporting nonprofit groups such as Goodwill, St. Vincent de Paul, the Humane Society, and Salvation Army. Cascadia interviewed the following organizations: Goodwill Industries, St. Vincent de Paul, Salvation Army, CART’M, and eBay.
In the Metro area, northwestern Oregon, and Lane County, major organizations sell at least 95 million pounds of household items in their retail stores each year, with Goodwill and St. Vincent de Paul representing the largest portions. Used household goods retailers seem to have developed a successful business model that supports itself profitably. Most interviewees saw opportunities for expansion and reported few major barriers.
6.2 Barriers
Household goods reuse organizations identified two types of barriers: barriers in operations (primarily dumping) and barriers to expansion (including siting, financing, and leadership).
While household goods reuse organizations are generally profitable, the garbage and unusable materials they receive pose a major cost. Interviewees reported that 10 to 35 percent of the material collected is not suitable for reuse, or often even for recycling. One organization spends nearly 2 percent of its retail proceeds dealing with the garbage it receives. Interviewees suggested several remedies. The State could assist by compiling a list of vendors that recycle items that the household thrifts cannot (e.g., electronics, cell phones) or by directly helping them to recycle these items. The State could also offer a discount on landfill fees because these organizations are otherwise providing a service that reduces overall waste generation; they were victims of dumping; they bring loads in bulk that consist mainly of dry trash.
Despite opportunities for expansion, household goods reuse organizations often encounter difficulty when seeking to open in new locations. Some thrift shops fall into several zoning categories – retail, warehouse, services – and thus may have trouble obtaining permits. Interviewees also see a lack of available land in desired areas, and they reported some NIMBY opposition from potential neighbors opposed to locating a thrift store in their neighborhood. People want access to thrift shops, but do not necessarily want them located in their neighborhood, especially if these organizations also employ people from disadvantaged groups, such as formerly incarcerated or low-income persons.
Many household goods reuse organizations are nonprofits, which may be perceived as less reliable and stable than for-profit businesses. Even if they are well-established, this perception can make it more difficult for them to secure investors or loans for expansion projects. Nonprofits also often have risk-averse staff and directors who are less likely to grasp new opportunities boldly. Stores typically take one to three years to become profitable, and they need strong leadership and a donor base of collection sites established before a store can even open.
Waste Prevention Strategy 20 Background Paper #5 NGOs and Infrastructure December 2006

6.3 Opportunities
Household goods reuse organizations see opportunities for growth in their current operations as well as possibilities for expanding into new areas. Interviewees report that their organizations are growing and will continue to grow in the area of household goods reuse. They see unmet demand and believe that more supply of materials remains if they can collect the material. They cannot estimate how much more supply remains, but are very positive about expansion possibilities.
Opportunities also exist in expanding beyond the traditional retail stores to broker commodities such as textiles, plastics, electronics components, and glass that are collected along with resalable and reusable donations.
Additionally, major organizations have well-established collection and processing systems that could be used for items not usually resold in their retail stores at the current time. One interviewee suggested collecting computers to be refurbished. Another organization would be interested in partnering with the State to collect and process e-waste for proper recycling and reuse. Better integration with existing electronics reuse activities may be needed before moving forward with such recommendations.
Household Goods Reuse Example – Goodwill Columbia-Willamette
Goodwill Columbia-Willamette collected 130 million pounds of goods through 100 collection sites in 2005. Goodwill operates 34 retail stores in the Portland Metro area and north into Washington State, east to Bend, south to Corvallis, and west to the coast. The retail stores earn $70 million dollars a year and are profitable enough to support Goodwill’s other service activities. GWCW gives donated items several chances for reuse or recycling. They estimate that:
48 percent of materials are sold in Goodwill’s normal retail stores;
23 percent is sold for greatly reduced prices ($1.39 per pound) at Goodwill’s “as-is” outlet stores or else recycled (the breakdown of this material between recycling and reuse was not available);
9 percent goes to a third-party recycler; and
20 percent goes to the landfill (items that were unusable or unrecyclable).
6.4 Assessment
The household reuse sector is an effective and expanding industry. The sector is strong and growing in both large and small communities and in both traditional retail stores and online. In general, the demand for used household goods is high, and the supply is not fully tapped. The State can help overcome barriers and develop new opportunities for reuse.
Large organizations have extensive collection and retail networks that are self-sufficient and financially support other aspects of the organizations’ missions. They also often open new stores and see opportunities to expand into new materials. The growth in retail stores for used goods comes even as eBay and Craigslist are significant and growing components of the marketplace. For example, eBay has over 1 million registered users in Oregon. We estimated that Oregonians will sell over 10 million items (most of them used) on eBay in 2006 for a value of over $200 million. The highest-value items are most often sold “peer-to-peer” through eBay, Craigslist, other classifieds, or
Waste Prevention Strategy 21 Background Paper #5 NGOs and Infrastructure December 2006

consignment stores. Alternately, materials donated to reuse organizations like Goodwill are often of moderate quality and value.
For the most part, organizations involved in household goods reuse can attain self-sufficiency. Still, possibilities exist for DEQ or other State efforts to develop opportunities or overcome barriers in the sector. In particular, the State can offer help with disposal options for non-reusable items. Non-reusable items can compose a significant fraction of donations. One option suggested was discounts on tipping fees for materials that these reuse organizations are not able to sell or recycle. However, discounted disposal fees could weaken existing incentives to recycle non-reusable goods, instead of disposing of them.
The State could also provide financial assistance for capital expansions and project development. Acquiring financing for program expansions, either through loans or grants, can be difficult. Suggestions by interviewees include:
Offering low-cost bonds or other financing to allow loaning money at below-market interest rates. The StopWaste Partnership in Alameda County, California, provides one potential model. This Bay Area county created a revolving loan fund that provides low-interest loans to local businesses with projects that reduce waste disposed in the county’s landfills. Eligible efforts include source reduction, composting, recycling, processing, or recycled market development activities.
More flexible options for nonprofits to gain access to the State’s Brownfields Redevelopment Fund. This fund would provide another opportunity for nonprofit reuse organizations to obtain support for their expansion efforts, in particular. One interviewee felt nonprofits should be granted the same standing as local governments. Currently, nonprofits have a separate type of application than municipal governments.
Waste Prevention Strategy 22 Background Paper #5 NGOs and Infrastructure December 2006

7 Building Material Reuse
7.1 Overview
Organizations involved in building material reuse operate retail stores or internet sites selling salvaged building materials, source and broker salvaged building materials, and perform building deconstruction. In addition, some companies move entire structures so they can be reused, although such companies were not a major focus of this study. Dozens of nonprofits and private companies are involved in building material reuse. We interviewed ten:
ReBuilding Center (Portland);
Heartwood Resources (Roseburg);
Gorge Rebuild-it Center (Hood River);
BRING (Eugene);
CART’M (Manzanita);
Habitat for Humanity ReStore (Bend);
Habitat for Humanity Bargain Building Supply (Albany);
Northwest Demolition and Dismantle (Portland area);
ReUse Consulting (Washington State); and
Deconstruction Management Group (Portland).
Used building material stores operate on a variety of scales. The largest operation sells an estimated 2,500 tons of materials per year, while others sell a few hundred tons and some are even smaller. One organization, Heartwood Resources, estimated that its operations decreased construction and demolition waste disposal in its area (Douglas County) by 5 to 8 percent.
Building material collection and resale organizations appear to be a successful business model, and most interviewees thought that appropriately scaled operations could succeed in most areas of the state. Deconstruction services may not be as profitable a business model due to the additional costs, labor, logistics, and time typically involved in deconstructing a building instead of demolishing it with a bulldozer and track-hoe.
7.2 Barriers
Building material reuse organizations face barriers on both the supply and the demand side. On the supply side, low tipping fees for waste disposal do not provide much incentive for building material salvage. For example, in Douglas County, home of Heartwood Resources, disposal is free. Even in counties with waste tip fees, disposal is still viewed as inexpensive and does not provide a strong incentive for investing in material salvage, which involves additional time and labor. Many deconstruction projects are only marginally cost-effective. Labor (and associated workers’ compensation insurance for these types of activities) is very costly relative to a bulldozer or track-hoe, and most deconstruction projects are more expensive than demolition. The quality and dedication of
Waste Prevention Strategy 23 Background Paper #5 NGOs and Infrastructure December 2006

deconstruction staff is reportedly the primary factor in whether deconstruction is cost-effective. Even once the materials have been salvaged, building material reuse organizations have limited space to house them. Most contacts interviewed expressed a need for more indoor or covered storage and/or retail space.
On the demand side, though some items show strong sales, demand for other materials is limited. Contacts report difficulty marketing certain items, although these hard-to-sell items vary from region to region. Factors cited for the limited demand include not only a legitimately limited market for specialty items (e.g., theater seats) and an oversupply of outdated styles or technologies (e.g., unsightly and water-wasteful toilets), but also a bias against used materials by some fraction of consumers who see them as inferior. Secondary materials can pose some difficulties during construction. The variation in dimensions and styles of used building materials often means more time is needed to incorporate them in to projects. In addition some building codes do not support reuse for particular structural materials, such as studs; studs can only be reused in limited, non-loadbearing applications.
Finally, material supplies and demand frequently are geographically separated. Interviewees report that in many cases, urban areas provide the bulk of quality material supply, while demand is much higher (relative to population) in more rural areas.
7.3 Opportunities
Opportunities in building material reuse range from increasing capacity and incentives for both supply and demand to new partnerships with other types of organizations.
On the supply side, most interviewees felt that current deconstruction efforts are only “scratching the surface” of what is possible. The biggest opportunities are generally thought to be in the commercial sector, where economies of scale, material quality, and site access are all improved over residential homes. In general, more material could be collected if more building contractors were educated about deconstruction and salvage and if contractors received incentives for source-separation of reusable items.
Increased salvage capacity at transfer stations and at construction and demolition (C&D) waste material recovery facilities could also yield greater supply of materials. Interviewees reported that many usable materials are being disposed of, and increased infrastructure to capture these materials would increase supplies and keep valuable materials out of the waste stream. Building material reuse organizations could also use factory seconds to supplement their supply. Some interviewees obtain a portion of their supply from factory seconds, and one in particular says the economic viability of his organization depends on them.
Reuse organizations could also form partnerships with other efforts. Environmental organizations have been strong partners, but new opportunities may exist in faith-based organizations that advocate stewardship of the earth.
On the demand side, increased sophistication of marketing and sales efforts could increase consumer interest in used building materials. Contacts reported that creativity, sophistication, and “sex appeal” are now needed to help this reuse industry grow and become more mainstream. Interviewees had four particular suggestions that reuse organizations could employ. First, increase storage and distribution systems to minimize transportation costs while still matching buyers and sellers. Second, increase use of internet marketing and sales sites to connect sellers with buyers. Third, increase the focus on a clean and attractive presentation of materials in the retail environment. Fourth, implement more sophisticated inventory control and cash-register technology to manage inventory effectively and chart sales.
Waste Prevention Strategy 24 Background Paper #5 NGOs and Infrastructure December 2006

Building Material Reuse Example – Heartwood Resources
Heartwood Resources is a reused building material store located in Roseburg in Douglas County. Heartwood is a project of the Umpqua Community Development Corporation and is modeled after the ReBuilding Center in Portland. It operates a four-person deconstruction crew and a 10,000-square-foot retail store focusing on used building material.
Its mission extends beyond reused building materials to include job training for low-income and formerly incarcerated individuals. A broader mission that extends beyond reuse and waste prevention benefits is common among NGOs in the reuse industry.
Heartwood Resources is nearly self-sustaining. After four years in business in an economically depressed county with only 100,000 residents and no waste tip fees, Heartwood considers this result a tentative success. In addition, Heartwood reports that the County has estimated a 5 to 8 percent reduction in construction and demolition waste as a result of its efforts.
The State could also increase demand by increasing incentives for using building materials. Interviewees also suggested more flexible codes, cash incentives, or streamlined permitting for new facilities.
7.4 Assessment
Cascadia’s evaluation of Oregon’s reused building material industry shows that it is strong and that opportunities for expansion remain. According to one national consultant interviewed, Oregon has the best deconstruction and building material reuse industry in the country. Contacts generally agreed that many opportunities remain to increase both supply and demand. Critical success factors include a strong entrepreneurial spirit, adequate space, dedicated staff, and good marketing.
Increased deconstruction of commercial buildings is reportedly the biggest opportunity. Commercial buildings offer large supplies of desirable items that are generally more cost-effective to recover than from residential homes, and many commercial structures are not currently deconstructed when they need to be removed. Larger crews and some equipment (e.g., a forklift) greatly increase feasibility of deconstruction, but these resources are not available to all organizations.
Demand is generally high for nearly all high-quality items. Interviewees cited high demand for timbers, lumber, trim, doors, and tubs. Demand for plumbing fixtures, cabinets, and windows is also generally strong, although not all contacts agreed on this assessment.
Interviewees offered many suggestions for an expanded role by the State and DEQ. The State should continue to support green building, including LEED and deconstruction. Support could range from requiring deconstruction in specifications for the decommissioning of government buildings to aligning incentives for waste prevention, including:
Considering tip fee increases, although not all interviewees agreed that this would be effective, given the politics of the building industry;
Requiring salvage at transfer stations and expanding construction and demolition material recovery facilities; and
Limiting the permitting of additional construction and demolition waste landfills.
Waste Prevention Strategy 25 Background Paper #5 NGOs and Infrastructure December 2006

The State could also work with local governments to offer incentives to builders that incorporate waste prevention features and reused materials into their demolition, new construction, and renovation projects.
DEQ should continue grants for capital expansions and improvements in building material reuse activities as well as provide technical assistance and coordinate information-sharing to “shorten the learning curve” for new building material reuse organizations. Finally, the state could facilitate state-subsidized labor, such as summer interns (like AmeriCorps) or inmate labor, to support reuse activities.
7.5 Green Building
Green building is not necessarily a waste prevention or reuse activity, though it may facilitate some material reuse or offer other waste prevention benefits. This research project was not intended to focus on green building in detail, but it does include a brief overview of potential waste prevention benefits that green building activities can provide in Oregon.
Overview of Waste Prevention Benefits
Building practices (including “green building”) can include a number of methods to prevent solid waste through both source reduction and reuse. These practices can be classified into one of the following categories: design principles, construction and deconstruction practices, and materials selection.1
Design Principles
The design of homes and buildings has a large impact both on the materials used to build them and on the materials (and other resources) used throughout its life. Waste can be prevented by reducing the scope and size of the project by remodeling instead of demolishing (when possible) and by building a smaller house. Vaulted ceilings and little-used spaces such as formal dining rooms can often be eliminated. The new LEED residential standard awards points for home sizes smaller than the national average.
Construction and Deconstruction Practices
Methods used to construct and deconstruct buildings can be made more efficient to prevent waste. Construction practices can minimize material use and make deconstructing buildings easier at the end-of-life to allow for material reuse. Three common methods to reduce material use during construction include:
Carefully calculating material quantities and purchasing the proper amount to reduce the waste of building materials as well as of packaging. The National Association of Home Builders estimated that packaging can represent one-third to nearly half of the waste volume on a job site.
Using material-efficient techniques such as advanced framing (e.g., spacing studs every 24 inches instead of the standard 16 inches) to use fewer building materials overall. Advanced
1 Data sources include previous research that Cascadia conducted for Seattle Public Utilities’ Green Home Remodel project and information from such sources as the Energy Star Builders Guide, U.S. Green Building Council’s LEED standards, National Association of Home Builders, and U.S. Environmental Protection Agency programs.
Waste Prevention Strategy 26 Background Paper #5 NGOs and Infrastructure December 2006

framing methods may reduce wood use by up to 25 percent and improve wall insulation values from 5 to 10 percent.
Providing weather protection for stored materials at the job site to reduce losses to damage.
Construction techniques (such as using screws rather than adhesives) can also make salvage deconstruction easier at the end of the building’s life. Deconstruction and salvage activities make building materials available for reuse, which reduces the demand for new, virgin materials. Deconstruction and building material salvage was covered in a separate section of this report. Commonly salvaged items that have strong reuse markets include:
Lumber including timbers, flooring, trim, and studs
Windows and doors
Cabinets
Sinks, tubs, faucets
Material Selection
The material selection stage offers opportunities for waste prevention. Using durable items can prevent or delay the need for replacement, and using salvaged materials reduces current waste disposal. Durable building materials and techniques can reduce the need for remodeling, reconstruction, and maintenance over the life of the building. Materials used on the exterior envelope, such as the roof and siding, are particularly important to construct durably because they protect the rest of the house from weather damage and resulting material waste.
Materials selection also includes choosing used building materials where possible. Deconstruction and salvage reduce the demand for new, virgin materials, but only if new remodeling and construction projects use salvaged materials. Deconstruction and building material salvage was covered in a separate section of this report.
Assessment
Cascadia’s evaluation of green building suggests that market forces may not support the waste prevention benefits of green building as strongly as they support other benefits. Many of the strategies here do not provide significant, marketable benefits (e.g., design for deconstruction, building smaller homes, using screws instead of adhesives). Many green home buyers are often purchasing “values” or a vague, holistic sense of “green” rather than tangible benefits. The most marketable tangible benefit is likely energy efficiency, rather than waste prevention. (Health benefits for residents are another oft-touted advantage of green building, though these benefits usually relate more to efforts like selection of low-toxic materials and proper ventilation, rather than material reuse or waste prevention per se.) Nevertheless, opportunities exist to prevent waste in every phase of building construction, including design, materials selection, construction practices, and deconstruction practices. Incentives may be needed to encourage architects and builders to employ these practices. Green building standards such as LEED are a great start, but more education, outreach, and incentives may be needed to broaden the adoption of these practices.
Waste Prevention Strategy 27 Background Paper #5 NGOs and Infrastructure December 2006

8 Summary Findings
Overall, reuse in Oregon is growing, if not highly profitable. The large supply of good-quality used items, particularly from urban areas, is largely met by a healthy demand. However, almost all organizations interviewed rely on outside funding for expansions and capital improvements, and many rely on outside funding for operating costs. Two primary factors explain the need for outside funding: the market value of many used or leftover items (e.g., electronics, building materials, and rescued food) is relatively low; and many organizations are providing a service to the community rather than trying aggressively to maximize the price they receive for each item. Most organizations involved in reuse are nonprofits with broad missions of community service that extend beyond reusing or reselling items.
Interviewees see many opportunities for expansion. Clear opportunities exist in building material reuse, food rescue, and household goods reuse both to expand existing operations and to establish new programs in other areas of the state. Computer and electronics reuse can also expand if tied to other efforts such as e-scrap recycling, which has higher material volumes and revenue potential, and expansion of technology access, for which grant funding may be available. Most organizations interviewed benefit from broad community support, though some perceptions relating to the trustworthiness of nonprofit reuse organizations or the quality of reused materials could be improved.
Skilled and professional leadership is essential to nonprofit success. Interviewees in all sectors stressed the importance of competent leadership, professional staff, and entrepreneurial approaches. Strong leadership can also help counter a reported perception – whether justified or not – that nonprofits lack professionalism. This perception can hamper progress if organizations are overlooked for contracts, donors, customers, or funding.
Barriers exist, but successful organizations can overcome them through outside assistance and creative leadership. Key barriers include:
Limited staff time to perform labor-intensive tasks (e.g., deconstruction, collecting edible food, computer refurbishing). Interviewees reported a need for skilled, dedicated, professional, long-term staff;
Difficulty establishing sufficient infrastructure, due to limited funds, zoning, lack of suitable spaces, or opposition from neighbors;
Difficult, expensive logistics and transportation for moving goods from areas of large supply to areas of high demand; and
Limited trust in reuse organizations by some company donors or customers.
A DEQ or other State role is likely to be most cost-effective if focused on capital improvements and reuse-friendly policy. Capital investments help organizations with strong operating revenues grow and increase effectiveness. State policies and incentives can help favor reuse over disposal and help increase demand for items such as salvaged building materials. Possible policies or incentives suggested by interviewees include:
Continued grants to support refrigeration capacity for edible food rescue, processing and inventory equipment, design of brochures and other outreach materials, or use of salvaged building materials in construction projects, perhaps in coordination with local governments.
Low-cost loans for capital expansions in the reuse industry, perhaps similar to low-interest financing offered for waste reduction, recycling, and reuse operations offered in other areas, such as Alameda County, California.
Waste Prevention Strategy 28 Background Paper #5 NGOs and Infrastructure December 2006

State tax credits for organizations that perform reuse activities or donate items for reuse.
Subsidized labor or other means of assisting with job-training and other low-cost labor. Oregon’s Jobs Plus program was one suggestion for a means to provide subsidized labor. In addition, one program interviewed benefits from a local contract for job training that provides a substantial portion of the organization’s revenue.
Tip fee incentives, such as increased solid waste tip fees to increase the cost-effectiveness of reuse or tip fee subsidies for the disposal of non-reusable items donated to organizations.
Minimum reuse or salvage requirements for government demolition and deconstruction projects.
Altered landfill and transfer station policies that favor reuse, such as more restricted permitting of landfill capacity for construction and demolition wastes (to make it more difficult or expensive to dispose, rather than reuse or recycle, construction materials) or required material recovery and salvage at transfer stations.
Continued support of green building (including LEED requirements) to encourage waste prevention (e.g., smaller homes, collection and reuse of salvaged materials) in the construction industry.
Technical assistance and coordinated information-sharing to help new organizations during the start-up phase.
Support for education and outreach activities devoted to waste prevention and reuse.
Several organizations interviewed have received DEQ grants in partnership with cities or counties. Interviewees mentioned the support of DEQ and stressed the importance and benefit the grants have provided their organizations.2
2 A few organizations interviewed mentioned they were currently working on DEQ grant applications to help fund new capital investments in equipment or space expansions. Some respondents described frustration in the long lag time, described as many months, between being awarded a DEQ solid waste grant and receiving the funds. One interviewee reported having to revise the organization’s plans based on this lag. (Note that some local governments also noted this concern in their grant reports. An overview of DEQ’s solid waste grants can be found in a separate background paper on Oregon’s state-level waste prevention efforts.)
Waste Prevention Strategy 29 Background Paper #5 NGOs and Infrastructure December 2006

Appendix A. Organizational Profiles of Interviewees
Waste Prevention Education
BRING
BRING is a nonprofit organization in Eugene involved in building material salvage (including deconstruction), waste prevention and other environmental education, and recycling. Its mission is as follows: “BRING promotes a healthy and sustainable environment through education, innovative conservation programs, and community involvement in conserving natural resources. We help people understand the connection between the resources they use and the clean air, pure water and wild places they value.”
BRING conducts a variety of outreach and education activities for both the general public, including youth and adults, and for professional groups, such as contractors. BRING’s presentations and activities for schools include the Reduce Reuse Recycle Slideshow on the importance of the three “Rs” and how to do them, the Wonderful World of Reuse focused on the benefits of and steps to follow for reusing materials, paper-making lessons, worm composting workshops, waste audits, and tours of Lane County’s Glenwood Central Receiving Center for garbage and recycling. Adult educational programs include how-to workshops, tours, presentations to community groups, and events focused on such topics as reducing household toxics, home composting and vermicomposting, and reusing salvaged building materials. BRING reports that its educational efforts reached 7,700 kids and 10,000 adults in 2005.
In 2005, BRING’s used building material store recorded 30,000 transactions, for a total value of $430,000. The organization received 520 tons of items at the store and procured an additional 275 tons of material from its own deconstruction efforts. In addition, BRING operates an online material exchange and provides information to businesses. The organization is currently building a new facility, the Planet Improvement Center, which will house its used building material store and also demonstrate methods of reusing a variety of household materials.
In 2002, a solid waste grant from DEQ enabled BRING to provide education and outreach to contractors, designers, architects, and the public regarding deconstruction and building material reuse. As part of the Deconstruction Jumpstart project, the organization created and distributed a brochure about material reuse from deconstruction. BRING also educated people on the subject at various public events and during site visits.
reSource
ReSource is a nonprofit organization in Bend that provides education and outreach on sustainability issues, including waste prevention messages, to residents, businesses, and institutions in Deschutes County and beyond (Crook and Jefferson counties). Its mission is “to ensure a healthy future by inspiring people in Central Oregon to conserve resources and prevent waste and pollution today.” It began in 1978 as the all-volunteer Bend Recycling Team, and in 2001-2002 the organization sold its recycling center and adopted its new name and a broader mission.
Waste Prevention Strategy 30 Background Paper #5 NGOs and Infrastructure December 2006

ReSource’s current programs include:
OregonSWAP, an online “freebay” materials exchange (a nonprofit exchange modeled after eBay’s approach).
WorkSmart, a business assistance program, which is now a local chapter of the Oregon Natural Step Network (and an offshoot of DEQ’s Resource Efficiency Program pilot project). In 2005, reSource led nearly 20 business workshops on sustainability as part of this program.
From the Ground Up, a natural lawn care program, which includes home composting.
EarthSmart, environmental education programs for youths K-12, which reached more than 6,500 students in 29 schools in every district in its three-county Central Oregon service area (Crook, Deschutes, and Jefferson counties) in 2004.
As for many nonprofits, securing funding for its programs, particularly for its business outreach efforts, is an ongoing challenge for reSource. The organization has contracts with local government for some of its efforts, including its youth education and sustainable landscaping programs. It also obtains funding through donations, sponsorships, memberships, events, fees for services provided, and grants. reSource has obtained some grant funding from DEQ through Deschutes County, but it would like to be able to apply for these funds directly to DEQ (with local government support, but without the county having to submit the application itself and manage any resulting grants).
Edible Food Rescue
Oregon Food Bank
Oregon Food Bank (OFB) is the hub of a network of over 800 hunger-relief agencies in Oregon and nearby Clark County, Washington. OFB coordinates the Fresh Alliance program, which gathers perishable food from Fred Meyer, Albertsons, QFC, Wild Oats, and Whole Foods grocery stores for distribution to local food banks. The organization faces few barriers; rather, OFB has a systematic approach to acquiring new program partners and sources of food. According to the interviewee, “‘No’ isn’t a permanent answer, only ‘yes’ is.” OFB believes that Fresh Alliance has only reached about one-third of the stores that could participate statewide, and it hopes to double the program in the next three years. OFB sees the lack of refrigeration capacity for local agencies as the greatest need.
Like most food rescue organizations, OFB believes the food is out there, presenting an opportunity. The organization takes a systematic approach to evaluating the cost-effectiveness of new food rescue opportunities. The interviewee cautioned that “having a good idea is only the first step.” It takes months and years to build a good program, so organizations should be careful not to take on so much responsibility that they cannot deliver reliable service. Food donors need reliability in order for the model to work over time.
OFB also notes that several larger chains are not donating much, if any, food. These companies include Wal-Mart, whose decisions are made at its headquarters in Arkansas; Costco, whose decisions are made in Issaquah, Washington, and with whom partner organization Food Lifeline is negotiating; and Safeway, which has been a great help with fundraising but has not yet committed to donating perishables. Even so, OFB thinks that smaller, more regional chains may actually be more cost-effective sources of obtaining new donations, as collection trucks in rural areas are often not at capacity; accordingly, they could collect food from new donors at low marginal cost. OFB has also not placed a great deal of emphasis on restaurants due to their lower cost-effectiveness relative to grocery stores.
Waste Prevention Strategy 31 Background Paper #5 NGOs and Infrastructure December 2006

OFB commented that several smaller food banks are not participating in Fresh Alliance or performing other forms of edible food rescue. The contact reported that no food bank is averse to doing edible food rescue, but that the question is staff time and leadership. For OFB to certify a new Fresh Alliance program with a local food bank, the statewide organization needs to be confident that the local group can handle the responsibility. Accordingly, OFB often finds that it is easier to divert rescued food from bigger programs to these small local food banks instead of setting up a whole new program.
ACCESS
ACCESS is the regional food bank in Jackson County. ACCESS collects an estimated 120,000 pounds of food annually through its own food rescue programs (from institutional sources, restaurants, local grocers, and farmers) and 180,000 pounds through participation in the Oregon Food Bank’s Fresh Alliance partnership (from chain groceries such as Albertsons and Fred Meyer).
The organization is currently limited by the refrigeration capacity and warehouse space at direct service providers as well as by high transportation costs, which can be significant for the agency, its volunteers, and clients that need to travel to obtain food. Partly due to increased transportation costs, ACCESS reports that its clients have expressed increased interest in home delivery. ACCESS is looking to expand and estimates it has only tapped 25 to 30 percent of the potential local food supply.
Our contact at ACCESS reported that the biggest key to working with restaurants and institutions is having larger-scale donors. The organization has found that is very difficult to work with smaller restaurants because of the work required to obtain only small quantities of food. ACCESS reports that a new dairy distributor will be siting a facility locally, and the organization hopes to obtain new food supplies from that facility.
COCAAN
The Central Oregon Community Action Agency Network (COCAAN) provides many services to economically disadvantaged people in central Oregon, including running the regional food bank in Deschutes County that serves Deschutes, Crook, and Jefferson counties. COCAAN’s Feed the Need program collects more than 300,000 pounds per year of perishable food through its recovery program. The group has 1,000 square feet of dry storage, a walk-in freezer that can accommodate 10 pallets, and a cooler that can accommodate 10 pallets. The organization served 80,000 people in 2005, although this count includes repeat customers, so fewer unique individuals were served. COCAAN collects regularly from nine grocery stores and one restaurant, and the organization also collects on an on-call basis from six to 10 distributors and other stores.
As its main barriers, COCAAN cited high operations and transportation costs, as well as internal policies at Safeway and Wal-Mart that have restricted donations. The organization hopes to expand its collection of pre-packaged, deli, and restaurant items. COCAAN believes that significant untapped potential still exists in the area, although Safeway and Wal-Mart represent much of that potential.
Key success factors at COCAAN include dedicated volunteers, the size of its service area and clientele, the availability of a facility and vehicles with refrigeration and freezer capacity, its relations with stores, and commitment to the hard work of traveling the region to collect food.
(Note: COCAAN recently changed its name to NeighborImpact.)
Waste Prevention Strategy 32 Background Paper #5 NGOs and Infrastructure December 2006

Food for Lane County
Food for Lane County is the regional food bank serving all of Lane County, and it is the second largest food bank in the state. Food for Lane County collects and distributes an estimated 7 million pounds of food per year, half of which is perishable food that would otherwise have been disposed. As with most food rescue organizations, Food for Lane County faces high transportation costs, especially in rural areas, to obtain food from donors and provide it to those in need. The organization is also working to keep up with the food industry: donors have a changing product mix, including more emphasis on prepared items that may require different handling.
The interviewee believes that statewide opportunities are significant because several counties and regional food banks are not yet performing rescue of perishable food items. Within Lane County, FFLC has good relationships with several grocery store chains operating in Lane County and is collecting edible food from them. The organization’s ability to expand further, however, is hindered unless Safeway changes its corporate policy. Currently, the grocery chain lacks corporate endorsement for food rescue other than bread.
Food for Lane County reported that key success factors include building and maintaining relationships; having appropriate refrigeration; keeping up with industry trends; enhancing and upgrading capacity of frontline, direct service providers to handle perishables; and providing recipes and nutritional information to clients to help use less familiar types of food.
Tillamook County Regional Food Bank
The Tillamook County Regional Food Bank began performing some food rescue efforts in 2001, but it has since scaled back due to funding shortfalls. The food bank now performs only limited rescue of some bread products. It faces insufficient funding, staff, and infrastructure, including lack of a refrigerated vehicle. The organization sees significant potential, however, particularly if it is able to join Fresh Alliance, which would bring an estimated additional 600 to 700 pounds per week of perishables. Key success factors that have kept the Tillamook Food Bank operating include “getting the word out,” building trust with food donors and clients, and the support of the Oregon Food Bank. (Note: This effort was formerly a program of CARE but is now funded by Oregon Food Bank.)
Computer and Electronics Reuse
Free Geek
Free Geek is a nonprofit that recycles used technology to provide computers and job skills to those in need. The organization accepted 420 tons of e-scrap in 2005, and it was able to reuse an estimated 25 percent of that amount, for more than 100 tons. Despite its successes, Free Geek has only limited funds available for expansion and capital improvements and has relied on grants, including support from DEQ, for past expansions. Free Geek uses a Linux operating system rather than Windows to save costs, increase learning opportunities, and allow for more user flexibility. Although demand for its computers is strong, the public has a limited understanding and appreciation of Linux as an operating system.
Technology access is a great need in many rural and lower-income populations. The large supply of used computers being generated every day presents a great opportunity to keep them in productive use by returning the computers to these communities in need. Free Geek estimates that it handles only 5 to 10 percent of Portland’s used computers.
Waste Prevention Strategy 33 Background Paper #5 NGOs and Infrastructure December 2006

Free Geek identified information-sharing among like organizations is one key to success. The organization has also found that a core group of dedicated, long-term volunteers can be very helpful, but that short-term volunteers are difficult to coordinate and use effectively.
StRUT
StRUT, short for Students Recycling Used Technology, is a program in which students collect donated computers and components and upgrade them for use in schools. StRUT was originally formed in 1995 by Intel and the Northwest Regional Educational Service District (NWRESD) of Hillsboro, in the Portland area. The original StRUT closed in 2003 due to state budget shortfalls, but it recently has been reborn as a local program operated out of The Dalles by the Region 9 Education Service District. The program is interested in expanding its activities to other areas of the state, but it wants to validate its model first and avoid expanding too quickly (a problem that contributed to the closure of the previous StRUT effort). StRUT currently serves between 40 and 50 schools, and it distributed 1,900 computers in the 2004-2005 fiscal year.
Since re-forming, StRUT and partner Wasco County have received a DEQ grant but generally lack funding for their computer repair operation. StRUT also feels that the lack of regulatory preference or requirement for recycling computers instead of disposing of them reduces their supply. Many schools are landfilling their old computers, but StRUT estimates that between 60 to 70 percent of the computers donated by schools are reusable, a much higher portion suitable for reuse than in the general stream of used computers. The organization also notes that the demand exists from schools for the program. Many of the computers that the program handles come from schools and return to schools for reuse. However, funding is the limiting factor. The organization faces logistical challenges and high costs to transport used computers.
StRUT’s school-based model is rather specific and may not be appropriate as a model for other organizations. Key needs for any similar program or an expansion of StRUT would be a low-cost facility (StRUT’s current facility, an unused school gym, is free) and staff dedicated to the mission.
Monitors and More
Monitors and More refurbishes, resells, and recycles computers as part of its mission to teach life skills and provide job training to disabled and low-income residents of Douglas County. The organization did not provide exact figures concerning the number of computers or other equipment reused, but it estimated it can repair or refurbish 20 to 30 percent of the computers it receives.
As with most electronics reuse organizations, Monitors and More has limited space to disassemble computers and limited finances to pay staff and trainers. The organization recycles some computers that could be disassembled and potentially rebuilt since it does not have enough space to refurbish all the candidate computers it receives. The organization also currently sees limited demand for used computers, though demand could be increased by connecting with lower-income communities that need the technology.
The interviewee felt that a dedicated leader with both social service and business skills is essential to its organization. Other key success factors included knowing vendors well and taking the time to research recycling markets for e-scrap materials (e.g., circuit boards, metals, plastics, CRTs).
Waste Prevention Strategy 34 Background Paper #5 NGOs and Infrastructure December 2006

Computer Reuse and Recycling Center
The Computer Reuse and Recycling Center (CRRC) in Eugene has a two-pronged mission: to place technology with underserved communities that need it and to recycle what is left over. The organization has reused or resold an estimated 2,300 computers in its two-and-a-half-year history. CRRC estimates that it processes for reuse about one out of every 17 computers it receives.
CRRC faces the two common barriers for electronics reuse: the low value of used computers given rapidly changing technology and limited funding for capital improvements needed to expand its operations. The organization also feels that having staff that are trained and competent in computer repair is critical, but CRRC has had difficulty finding and training such staff.
CRRC sees an opportunity to expand its supply by gaining more contracts or relationships with businesses that are upgrading computers to enable a strong supply of machines suitable for reuse. However, the interviewee noted that a perception exists in the business community, a large potential source of higher-quality used machines, that nonprofit recyclers are not trustworthy or reliable or do not use proper procedures for handling and destroying sensitive data.
St. Vincent de Paul, Eugene
St. Vincent de Paul of Lane County is the largest St. Vincent de Paul organization in the state. In addition to its numerous other activities, the organization collects and rebuilds computers to resell in its stores. Other materials are sorted and donated to a variety of other nonprofit groups for education, recycling, and job training.
Because computer systems are always changing, it difficult to refurbish and provide systems that are current. There is low demand for complete used systems, but the biggest opportunity may be in used components such as memory, circuit boards, and drives. The organization sells $400 to $500 worth of these components every day, making it more than just a marginal activity. St. Vincent de Paul also sees an opportunity for entrepreneurial firms involved in waste prevention to take advantage of Europe’s directive on Waste Electrical and Electronic Equipment (WEEE).
The director stresses the value of strong leadership and management with a tolerance for risk, a factor that he says is uncommon in the nonprofit world. He advocates taking a business approach to the problem that involves identifying the marketplace and opportunities in the area, identifying opportunities they are not “sewn up” by other firms, and taking initiative.
Household Goods and Clothing Reuse
Goodwill Columbia-Willamette
In 2005, Goodwill Columbia-Willamette collected an estimated 130 million pounds (65,000 tons) of household goods through 100 collection sites to sell at 34 retail stores in the Portland Metro area and northwestern Oregon. Goodwill gives donated items several chances for reuse or recycling. Goodwill’s “recycling gauntlet” means that, while 52 percent of the material it receives is not fit for its retail stores, only 20 percent of the material the nonprofit receives goes to the landfill. The material breakdown is estimated as follows:
o 48 percent is sold in retail stores;
o 23 percent is processed for recycling or to be sold in a Goodwill as-is store at greatly reduced prices (by the pound);
Waste Prevention Strategy 35 Background Paper #5 NGOs and Infrastructure December 2006

o 9 percent goes to a third-party recycler; and
o 20 percent goes to the landfill (mostly consisting of trash dumped at their collection sites).
Goodwill cited two main barriers: opening in new locations and dealing with dumping. Because some thrift shops fall into several zoning categories – retail, warehouse, services – they may have difficulty obtaining permits. Goodwill also experiences a lack of available land and some NIMBY sentiments: people want access to thrift shops, but they do not necessarily want them located in their neighborhood, especially if the stores also employ their disadvantaged clients, as Goodwill does.
After-hours dumping is a major problem Goodwill collection sites. Dealing with these unusable and unrecyclable materials costs the organization $1.2 million dollars annually, or about 1.7 percent of revenue. However, the recent change from collection trailers to free-standing storefronts has greatly decreased the amount of trash dumped at donation sites.
Goodwill sees many opportunities to open new retail outlets, despite these difficulties. Demand always exceeds supply, but untapped supply remains and could be tapped if the organization can build more donation sites and increase awareness.
Rogue Transfer and Recycling Station
The Rogue Transfer and Recycling Station contracts with Goodwill of Southern Oregon to salvage reusable items as people dump them. Goodwill has one trained staffer who salvaged 58,000 pounds of goods over two years, including furniture, jewelry, toys, mountain bikes, golf clubs, and cash. However, Goodwill of Southern Oregon is currently experiencing staffing and volunteer shortages, so the salvager has been unable to collect materials regularly despite the supply opportunities.
The transfer station reports that safety training is key to keep salvagers safe on the station floor and that salvaging is only suitable where cars unload onto the station floor, not into a pit or a transfer container.
When asked about establishing a self-service area for people to donate usable items, the interviewee reported that the Rogue landfill formerly had a salvage yard that was very popular, but it lacks sufficient space for one at the transfer station. People loved the salvage yard, but it took too much space and labor to manage. Goodwill’s ad hoc salvage program has therefore worked well, given the space constraints, but support is needed to continue the effort.
St. Vincent de Paul, Eugene
St. Vincent de Paul of Lane County is the largest St. Vincent de Paul organization in the state. The organization takes in 90 tons of used items every day. An estimated 90 percent of this quantity (by weight) is reused, while the remaining fraction is recycled or disposed. The organization reports that opportunities are “laying all over the place.” The biggest opportunity it is currently pursuing is greatly expanding its mattress deconstruction and rebuilding process, which St. Vincent de Paul is attempting to patent and take worldwide. However, financing and capitalization are always a challenge when pursuing new business ventures, particularly in the nonprofit sector.
Nonprofits often have risk-averse staff and directors who are less likely to grasp new opportunities boldly. The director stresses the value of strong leadership and management with a tolerance for risk, a factor that he says is uncommon in the nonprofit world. He advocates taking a business approach to the problem that involves identifying the marketplace and opportunities in the area, identifying opportunities they are not “sewn up” by other firms, and taking initiative.
Waste Prevention Strategy 36 Background Paper #5 NGOs and Infrastructure December 2006

Salvation Army, Cascade Division
The Salvation Army, Cascade Division, collects almost all household items (except mattresses and unusable goods) for resale in their retail stores in the Metro area. Salvation Army collects goods at 28 Fred Meyer locations and sends some materials straight to its stores and some to its warehouse. The warehouse received an estimated 470,000 pounds of goods in April 2006: 50 percent was sold in the retail stores; 15 percent was recycled; and 35 percent went to the landfill.
Salvation Army donations are increasing because of better accessibility with more donation sites. A wide network of donation sites is beneficial, but Salvation Army’s unstaffed trailers typically receive a higher fraction of unusable items that cannot be sold in its retail stores. The organization would appreciate a list of vendors that recycle or resell these items.
Building Materials Reuse
ReBuilding Center
Our United Villages started the ReBuilding Center with a retail store in 1998 and a deconstruction service in 1999. The ReBuilding Center currently takes in more than 2,500 tons per year of used building materials and has a goal to reach 4,500 tons per year in two years. The ReBuilding Center estimates that it serves 90,000 visitors per year.
The organization recently expanded its space and is planning to increase its material volumes in the next couple of years because it sees significant untapped potential. However, the ReBuilding Center is currently looking for capital help to acquire vehicles and racking for displays.
Deconstruction is not profitable on its own, and the high cost of labor and insurance make it hard for deconstruction to compete against demolition. The ReBuilding Center’s deconstruction revenues (just over $600,000) fell short of expenses (nearly $900,000) by nearly $300,000 last year. Sales of deconstruction materials made up some of that difference (nearly $160,000), but the organization still lost a significant amount of money on this aspect of its business. The ReBuilding Center does plan to continue its deconstruction operations, however, and the organization has a goal for helping these activities (including material resale) to reach the break-even point.
The interviewee stated that having a champion and leader who believes in the mission and can make it happen is critical.
Heartwood Resources
Heartwood Resources runs a used building material store located in Roseburg in Douglas County. The organization operates a four-person deconstruction crew and a 10,000-square-foot retail store focusing on used building materials. Heartwood reports that the County has estimated a 5 to 8 percent reduction in construction and demolition waste as a result of its efforts.
Heartwood Resources sees many opportunities to make new connections with contractors and has found that demand for the materials is very strong. The store can sell lumber, cabinets, tubs, and plywood quickly. With bigger equipment such as a backhoe and a forklift, Heartwood could take on larger deconstruction projects. The interviewee feels that a construction and demolition material recovery facility in the county would also provide great opportunities.
Waste Prevention Strategy 37 Background Paper #5 NGOs and Infrastructure December 2006

Heartwood is succeeding in used building materials in an economically depressed and conservative county with only 100,000 people and no landfill tipping fees, a significant disincentive to reuse and recycle. The director sees this result as a testament to the success and replicability of the model, and he suggests that areas with lots of redevelopment would be natural places to start building material recovery.
Gorge Rebuild-It Center
The Gorge Rebuild-It Center began in 2004 in Hood River. It serves 25 to 50 customers per day and is approaching $200,000 in annual revenue. The Rebuild-It Center has already exceeded the goals charted in its initial business plan, although it has insufficient revenue to pay staff adequately and expand its operations.
The organization is experiencing great demand and thinks it can continue to grow, but such growth will rely on supply from outside the area because local supplies lack sufficient quality. The lack of consistency in used building materials does not appeal to contractors’ needs. Currently, the Rebuild-It Center relies on factory seconds in addition to used items to supplement its supply, and sales of these items provides a necessary part of the organization’s revenue.
The Gorge Rebuilt-It Center relied heavily on the wisdom and help of others, including ReUse Consulting, during its start-up period. The interviewee stated a desire to formalize information-sharing among businesses in the used building materials sector, perhaps through an annual meeting.
CART’M
CART’M is a nonprofit organization in Manzanita that operates a facility that includes a transfer station, a recycling center, and a retail store of reused items collected at the facility. The organization resells about 100 tons of items per year, including building materials, kitchen and household goods, linens, electronics, furniture, and other items (but no clothing). CART’M is nearly self-sustaining, with most revenues coming from waste tip fees and reuse sales. However, the organization has relied on grants to help with capital expenditures and expansion. CART’M and its partners City of Manzanita and Tillamook County have received four grants from DEQ to support program operation and expansion.
CART’M sees education to building contractors as a way to increase the supply of materials for resale. Demand is especially strong for lumber, trim, ornamental items (e.g., railings and posts), attractive doors, decorative and tasteful household items, chests of drawers, and good-quality furniture, but CART’M faces several barriers to expansion. The organization lacks a sufficiently large covered area to protect used building materials and other large items from the elements, but it does not have funds for expansion. As residential development increases around its facility, neighbors increasingly have expressed concerns about its operations. Land use restrictions also make it difficult to expand and continue its operations. On the supply side, CART’M faces competition from waste haulers.
The interviewee thinks the model of siting a reuse facility at a transfer station is replicable anywhere that space exists. The co-locating concept is what makes the reuse store financially possible, but community support is necessary. Community support (and the constant public relations to maintain it) has been essential to CART’M operation, but that support has been dwindling as development around its site increases.
Waste Prevention Strategy 38 Background Paper #5 NGOs and Infrastructure December 2006

BRING
BRING is a nonprofit organization in Eugene involved in building material salvage (including deconstruction), waste prevention and other environmental education, and recycling. The organization recorded an estimated 30,000 transactions at its used building material store in 2005 for a total value of $430,000. BRING received 520 tons of items at the store and procured an additional 275 tons of material from the organization’s own deconstruction efforts.
While material demand is high and opportunities for growth remain, low waste tip fees discourage material reuse and recycling. Regulations can discourage material reuse (e.g., building codes that only allow reclaimed framing lumber in limited applications), so state and local governments could do more to “incentivize” reuse and recycling through waste fees and policy. There is a bias among some people that secondary materials are inferior, but attractive presentation of the materials is key to overcoming any negative stereotypes. Sufficient space and creative racking of materials can help provide this attractive presentation of used building materials.
As with most building material reuse organizations, BRING has limited covered space to keep used building materials protected from the elements, a barrier that BRING will address in its new facility, the Planet Improvement Center. The interviewee also thinks potential opportunities exist to partner with faith-based and values-focused communities to build and leverage an ethic of stewardship of natural resources.
Habitat for Humanity Bargain Building Supply (Albany)
Bargain Building Supply in Albany collects building supplies from businesses and residential remodels, including wood, molding, windows, doors, appliances, and lighting. Proceeds fund the construction of Habitat for Humanity houses. The store includes at least 7,000 square feet of retail space (inside and out) and serves about 40 to 50 customers, mainly residential, on an average day.
Bargain Building Supply currently has slightly more material supply than demand, but the organization sees lots of untapped potential. The interviewee foresees that if the store had resources to expand its space and increase its marketing, Bargain Building Supply could double its revenue in the next couple of years. However, the local Habitat for Humanity organization does not have enough financial resources for such an expansion, so grants for capital to open or expand stores and for marketing are very helpful.
Habitat for Humanity ReStore (Bend)
In its 18,000-square-foot facilities in Bend, ReStore resells almost everything needed for a remodel: furniture, electrical fixtures, tools, paint, appliances, siding, toilets, windows, and more. The organization also performed six salvage projects on houses in the last year.
ReStore receives more items than it has retail space to sell, and it resold enough materials to raise funds to support the construction of two Habitat homes last year. The organization sees tremendous potential if it had more space, volunteers, and more marketing to increase awareness. Bend’s population is growing and has significant disposable income, so people are frequently remodeling and donating high-quality items. Demand is quite strong, but supply remains slightly higher at the current time. In the last year, the store grew more than 30 percent in annual profits, mainly due to marketing. The interviewee felt that strong marketing to increase awareness is a key to success.
Waste Prevention Strategy 39 Background Paper #5 NGOs and Infrastructure December 2006

Northwest Demolition and Dismantle
Northwest Demolition and Dismantle is a demolition contractor that performs some selective dismantling and deconstruction on its industrial jobs.
Economics make it difficult to salvage anything smaller than 6” x 6” timbers because labor is required, not just equipment. In addition to poor economics, the window of opportunity to perform deconstruction on residential jobs is very limited. Most jobs cannot wait for it, as builders require demolition to be completed quickly. Northwest Demolition and Dismantle reported that internet marketing has been a huge asset for its business, allowing the company to market the materials that it salvages, particularly timber.
The interviewee suggested two ways the government could help increase supply. First, government contracts could call for deconstruction in job specifications. Second, the state could ban the landfilling of construction and demolition waste, unless a plan has been submitted to maximize material salvage and recycling.
ReUse Consulting
ReUse Consulting performs deconstruction, brokers materials to both retail stores and contractors, offers consulting services, and operates an internet store of used building materials. The organization believes that current efforts are touching only the surface for reuse of building materials. The volume of commercial buildings is high, representing a major area for opportunity. Areas of material generation and areas of high demand, however, may be far apart geographically. Also, the demand for some materials (e.g., 2” x 6” framing lumber) is lower than supply.
ReUse Consulting believes strongly in the need to maintain both brick-and-mortar retail stores and a broader network, possibly internet-based, to connect areas of large material supply with areas of demand. The interviewee has found that commercial customers will not take the time to browse a retail store, and the quantities they need are often beyond what can be stored at retail stores.
Deconstruction Management Group
The Deconstruction Management Group is an Oregon-based company specializing in deconstruction projects and consulting. The interviewee now lives in Virginia, but he has extensive knowledge of and experience with the deconstruction and building material reuse industry in Oregon.
The interviewee believes that Oregon has the best deconstruction and reused building material industry in the nation, and he thinks opportunities are still strong. The cost of workers’ compensation insurance on deconstruction crews, however, is major barrier.
Key success factors in building material salvage include having a leader with a strong entrepreneurial spirit and a devoted deconstruction crew, as the cost-effectiveness of deconstruction hinges directly on the quality of the crew.
He also emphasized that mandates make builders “roll up like porcupines.” The key to advancing new initiatives in the construction industry is to work closely with builders, rather than making them defensive.
Waste Prevention Strategy 40 Background Paper #5 NGOs and Infrastructure December 2006

Appendix B. Waste Prevention Interview Contacts
Ed Armstrong, Tillamook School District Darryl Barton, Hood River Health Department Mickey Beach, Heartwood Resources Chris Bekemeier, Rebuilding Center Dave Bennick, Reuse Consulting Shelly Bowe, CARE, Tillamook County Regional Food Bank Gordon Brown, Benton County Health Department Vern Brown, Salvation Army – Cascade Division (Portland) Susan Christensen, Oregon Department of Environmental Quality, Technical Assistant Carrie Clifton, CARE, Tillamook County Regional Food Bank Dianne Crocker, Habitat for Humanity ReStore (Bend) Julie Daniel, BRING Recycling Cathie Davidson, Oregon Department of Environmental Quality, Technical Assistant Ron Dettwiler, Food for Lane County Brett Dilley, Food Innovation Center (Oregon State University) Catherine England, eBay Jennifer Erickson, Metro, Waste Reduction and Outreach Scott Fairley, Oregon Department of Environmental Quality, Technical Assistant Richard Felly, CART'M Recycling John Fredrick, Goodwill Columbia-Willamette Brian Fuller, Oregon Department of Environmental Quality, Technical Assistant Sarah Grimm, Lane County Shari Harris-Dunning, Oregon Department of Environmental Quality, Technical Assistant Lorraine Kerwood, Computer Reuse and Recycling Center Leslie Kochan, Oregon Department of Environmental Quality, Technical Assistant Matt Korot, City of Gresham Bruce Lumper, Oregon Department of Environmental Quality, Technical Assistant Sherrie Mathison, Yamhill County Terry McDonald, St. Vincent de Paul of Lane County John McEvoy, Linn County Russ McMartin, Wallowa County Bob Morris, Oregon Food Bank Steve Murray, COCAAN (now NeighborImpact) Bailey Payne, Marion County Public Works Jim Primdahl, Deconstruction Management Group Martine Roberts-Pillon, Oregon Department of Environmental Quality George Rollings, Habitat for Humanity Bargain Building Supply (Albany) Michael Russo, Lundquist College of Business (University of Oregon) Jackie Saling, Habitat for Humanity Bargain Building Supply (Albany) Reverend Philip Sano, Free Geek Kathy Schwink, Tillamook County Belle Shepherd, Josephine County Health Department David Skakel, Gorge Rebuild-It Center Brian Smith, Northwest Demolition and Dismantle Max Stafford, Monitors and More Matt Tracy, Columbia County Laurie Triege, Food for Lane County Marty Willie, StRUT (Students Recycling Used Technology) Denise Wolgamott, Rogue Transfer and Recycling Philip Yates, ACCESS, Inc.
Waste Prevention Strategy 41 Background Paper #5 NGOs and Infrastructure December 2006

Oregon Department of Environmental Quality
Waste Prevention Strategy – Background Paper #4
Local Government Efforts
A Summary of Selected Local Government Waste Prevention and Reuse Programs and Activities in Oregon
Conducted for
Oregon Department of Environmental Quality, Solid Waste Program
Prepared by
December 2006
Oregon Department of Environmental Quality 07-LQ-008

Acknowledgments The authors of this background paper gratefully acknowledge the valuable contributions of the following individuals to the Waste Prevention Strategy research and development process.
Land Quality Solid Waste Policy and Program Development 811 SW 6th Avenue Portland, Oregon 97204 (503) 229-5913 (800) 452-4011 toll-free (503) 229-6977 fax www.deq.state.or.us David Allaway and Jan Whitworth, project managers Loretta Pickerell, solid waste policy and programs manager
DEQ Waste Prevention Strategy Steering Committee Members David Allaway, DEQ Julie Daniel, BRING Recycling Leslie Kochan, DEQ Meg Lynch, Metro Mike Riley, ReSource Jan Whitworth, DEQ
DEQ Technical Assistants Susan Christensen Cathie Davidson Scott Fairley Brian Fuller Shari Harris-Dunning Leslie Kochan Bruce Lumper
The authors particularly wish to thank all of the interviewees from nonprofits, businesses, local governments, state agencies, and educational institutions for their valuable and candid contributions and insights, without with these reports would not have been possible. Interviewees are listed separately.
Jessica Branom-Zwick, Marc Daudon, Peter Erickson, and Christy Shelton of Cascadia Consulting Group contributed to the research and preparation of several background papers supporting development of the Waste Prevention Strategy. Additional staff members assisted with interviews.
Anna Fleder, James Goldstein, and John Stutz of Tellus Institute and David Stitzhal of Full Circle Environmental also contributed to this research project.
In the interest of waste prevention, this background paper is intended for electronic distribution and viewing. If a hard copy is required, please print double-sided on recycled paper.
Oregon Department of Environmental Quality 07-LQ-008

Waste Prevention: Local Government Efforts
Executive Summary................................................................................................. 1
1 Introduction and Overview........................................................................... 3 1.1 Project Overview ......................................................................................................... 3 1.2 Waste Prevention Background.................................................................................... 3 1.3 Research Scope and Evaluation Methods .................................................................. 4 1.4 Report Outline ............................................................................................................. 5
2 Overview of Local Government Waste Prevention .................................... 6 2.1 Pay As You Throw....................................................................................................... 6 2.2 Recovery Rate Credits ................................................................................................ 6
Waste Prevention and Recovery Rates .................................................................................... 9 Waste Prevention Activities ..................................................................................................... 11 Waste Recovery Rates in 2005............................................................................................... 12 Recovery Rates and Goals for 2005 ....................................................................................... 13 Recovery Rates and Goals for 2009 ....................................................................................... 14 Potential for Additional 2% Credits.......................................................................................... 15
2.3 Summary of Local Programs and 2% Credits ........................................................... 16
3 Waste Prevention (Source Reduction) ...................................................... 17 3.1 Overview of Waste Prevention Programs ................................................................. 17 3.2 Barriers to Waste Prevention .................................................................................... 18 3.3 Opportunities for Waste Prevention .......................................................................... 19
4 Reuse ........................................................................................................... 21 4.1 Overview of Reuse Programs ................................................................................... 21 4.2 Barriers to Reuse ...................................................................................................... 21 4.3 Opportunities for Reuse ............................................................................................ 22
5 Home Composting ...................................................................................... 23 5.1 Overview of Home Composting Programs ................................................................ 23 5.2 Barriers to Home Composting ................................................................................... 23 5.3 Opportunities for Home Composting ......................................................................... 24
Waste Prevention Strategy i Background Paper #4 Local Government Efforts December 2006

6 Options for State Support .......................................................................... 25 6.1 State Support for Local Government Efforts ............................................................. 25 6.2 Statewide Initiatives to Complement Local Efforts .................................................... 25
Appendix A. Local Government Program Examples ......................................... 26 Benton County ...................................................................................................................... 26 Deschutes County................................................................................................................. 27 Hood River County................................................................................................................ 27 Jackson County..................................................................................................................... 28 Josephine County ................................................................................................................. 29 Lane County.......................................................................................................................... 29 Linn County ........................................................................................................................... 30 Marion County....................................................................................................................... 30 Metro Regional Government ................................................................................................. 31
Fork It Over! Food Rescue Program ....................................................................................... 32 North Portland Tool Library ..................................................................................................... 32 City of Gresham....................................................................................................................... 33
Yamhill County ...................................................................................................................... 34
Appendix B. Waste Prevention Interview Contacts ........................................... 35
Figures Figure 1. Recovery Rate Credits Earned in 2005, by County ...............................................................9
Figure 2. Programs Earning 2% Credits in 2005, by Type and County ..............................................10
Figure 3. Waste Recovery Rates in 2005, by County .........................................................................12
Figure 4. Status in Meeting Recovery Goals for 2005, by County ......................................................13
Figure 5. Progress toward Meeting Recovery Goals for 2009, by County..........................................14
Figure 6. Potential for Additional 2% Credits in Counties Not Meeting 2005 Recovery Goals ...........15
Tables Table 2-1. Program Options for 2% Recovery Rate Credits .................................................................8
Table 3-1. Waste Prevention Program Elements for 2% Credits ........................................................17
Waste Prevention Strategy ii Background Paper #4 Local Government Efforts December 2006

Executive Summary
This report on local government programs related to waste prevention (source reduction), reuse, and home composting in the state of Oregon summarizes research to support the Department of Environmental Quality’s development of a statewide strategy for waste prevention. DEQ commissioned this study in 2006, and this report presents findings based on interviews with DEQ’s solid waste technical assistance staff and local government staff members; review of existing reports, grant reports, and 2% credit applications to DEQ; and other research.
Local governments in Oregon are conducting or supporting a range of waste prevention, reuse, and home composting efforts intended to prevent waste.
Local government waste prevention (source reduction) activities typically include residential education campaigns, school-based programs, and media outreach.
Most reuse activities – for household goods and clothing, building materials, electronics, and perishable food – occur through nongovernmental organizations (NGOs). Local governments may conduct their own internal reuse activities (e.g., for office supplies and equipment) or support the reuse efforts of NGOs through direct assistance and promotion.
Many jurisdictions offer home composting programs, which may include compost bin sales or giveaways, educational materials, demonstration sites, and workshops or other education.
Essentially all wastesheds in Oregon have adopted pay-as-you-throw (PAYT) policies in which waste generators pay a variable rate for their garbage based on the quantities they throw away. Because most areas have already implemented PAYT, little potential exists for expanding such programs. Raising disposal fees, however, could help encourage reuse and other waste prevention activities.
Local governments efforts focused on waste prevention are more common in western Oregon, particularly in larger urban centers.
Waste prevention efforts are most extensive in Oregon’s most populous counties, particularly the Metro region that includes Portland. Active counties are concentrated along the Interstate-5 corridor.
Most counties in the western half of the state offer programs for waste prevention, reuse, and home composting.
Waste prevention efforts are uncommon in rural areas, and eastern Oregon is home to only a handful of local governments leading waste prevention activities.
Local governments face a number of barriers to increasing waste prevention.
Waste prevention often ranks relatively low in the priorities of public agencies. Even in the solid waste management area, recycling tends to come first.
Waste prevention suffers from a lack of quantitative assessment of its benefits and results (particularly for educational efforts), negative perceptions of its economic impact, and lack of understanding and knowledge.
Limited staff time, capacity, and budgets hinder local governments’ ability to implement effective programs. Fostering waste prevention where programs are contracted out to haulers can be even more difficult.
Waste Prevention Strategy 1 Background Paper #4 Local Government Efforts December 2006

Infrastructure and transportation costs can hinder reuse activities. Some materials that could be reused suffer from low market demand (e.g., electronics); demand for edible food is high, but its “reuse” does not generate revenue.
The relative ease and low cost of both purchase and disposal of many consumer goods can facilitate a “throw-away” mentality, instead of encouraging reuse or source reduction.
Several opportunities could help local governments increase waste prevention, and the State can play an important role in fostering waste prevention through local governments.
Many local governments would welcome assistance with designing, implementing, and evaluating effective programs.
Several strong models for reuse operations exist, particularly in used building materials and edible food rescue, which could be expanded to other areas of the state.
The State could help local governments by providing funding and assistance for local efforts as well as fostering information-sharing and networking among peers.
The State could support and complement the work of local governments through statewide educational efforts, including effective message development, public campaigns, and evaluation.
The State could also lead “upstream” work with manufacturers on product stewardship and packaging changes to yield better consumer choices.
Waste Prevention Strategy 2 Background Paper #4 Local Government Efforts December 2006

1 Introduction and Overview
1.1 Project Overview
To support development of its statewide Waste Prevention Strategy, Oregon’s Department of Environmental Quality conducted or commissioned background research on existing waste prevention and reuse efforts and related topics. In 2006, DEQ hired a team led by Cascadia Consulting Group to conduct some of this background research, and Department staff conducted other research efforts in-house. Eight background papers summarize research findings on the following topics:
1. Waste Generation (DEQ);
2. Environmental Considerations – The benefits of waste prevention and reuse as an environmental strategy and in the context of sustainability (Cascadia);
3. State of Oregon Efforts – State government waste prevention programs in Oregon, including but not limited to DEQ’s solid waste grants (Cascadia);
4. Local Government Efforts – Local government waste prevention programs in Oregon, particularly those covered in DEQ’s 2% recovery rate credit program (Cascadia);
5. Nongovernmental Organizations and Infrastructure – Nongovernmental organizations providing reuse and waste prevention infrastructure and services in Oregon, with an emphasis on food, building materials, electronics, and thrift stores (Cascadia);
6. Business (DEQ);
7. Other States and International Efforts – Waste prevention and reuse efforts outside of Oregon, including examples from around the U.S. and the world (Tellus Institute and Cascadia); and
8. Product Stewardship (DEQ).
This report, Background Paper #4, summarizes research on local government waste prevention and reuse programs throughout the state of Oregon, particularly those recognized through DEQ’s 2% recovery rate credit program. Together, these eight reports compose the research and information-gathering phases designed to inform the development of Oregon’s strategy for waste prevention. This information has been developed to help the Department of Environmental Quality, DEQ’s Waste Prevention Strategy Steering Committee, external stakeholders, and agency managers to develop a statewide Waste Prevention Strategy. The Department will implement the Waste Prevention Strategy in 2007 and beyond.
1.2 Waste Prevention Background
Waste prevention sits atop of the solid waste management hierarchy, followed by reuse, recycling, composting, energy recovery, and landfilling. Oregon’s 1995-2005 solid waste management plan identified waste prevention as a high priority. It also established a vision of Oregon citizens making a value shift from a “throw-away” society to a conservation society by 2005. From 1993 through 2005, however, Oregon’s total waste generation increased 70 percent, and per-capita generation increased 43 percent.
Waste Prevention Strategy 3 Background Paper #4 Local Government Efforts December 2006

DEQ’s statewide Waste Prevention Strategy will be designed to help Oregon meet its goals, established in 2001, to stabilize total and per-capita waste generation. Waste generation is defined as the sum of materials recovered (e.g., through recycling) and materials disposed (e.g., in a landfill). Many of DEQ’s past solid waste efforts have focused on recycling, while waste prevention and reuse, the preferred objectives in the waste management hierarchy, typically have received relatively less emphasis.
Definitions
In this report, the broad category of waste prevention is defined as diminishing the amount of solid waste generated that is collected for recovery or for final disposal in landfills or waste incinerators. DEQ categorizes general waste prevention into three types:
“Pure” waste prevention (also referred to in this report as source reduction) diminishes the amount of solid waste generated or resources used, without increasing toxicity, through changes in the design, manufacture, purchase, or use of products or packaging. Examples include buying and using less/fewer materials or products, purchasing and using durable, reusable materials instead of disposables, and improving packaging efficiency.
Reuse extends the life of a product or material by repairing, modifying, or finding new uses for it (in its original or a similar form – rather than changing its identity through recycling and making new products). Reuse activities include typical thrift store operations for used clothing and household goods as well as edible food rescue, used building materials, computer reuse, and other categories.
Home composting is defined broadly to mean managing organic materials onsite at homes, businesses, and institutions through composting, grasscycling, worm bins, and mobile chipping operations, which facilitate onsite management of yard debris. (Stockpiling and burning organics are not included as waste prevention. Curbside collection and centralized composting of organic materials are counted as recovery.)
Jurisdictions within and beyond Oregon may use different definitions of waste reduction. DEQ defines waste reduction to mean any effort that diverts materials from disposal. Thus, waste reduction encompasses both waste prevention and recovery, which in turn includes recycling and off-site composting. This approach is consistent with the U.S. Environmental Protection Agency’s definition. Confusion may arise, however, because some other states and programs consider waste reduction to mean reducing the amount or toxicity of waste generated or reusing materials. In Oregon, local governments and solid waste program operators can be similarly inconsistent on this matter, contributing to the ambiguity. For the purposes of this report and the Waste Prevention Strategy, however, "waste reduction" means disposal avoidance and includes both waste prevention and recovery.
1.3 Research Scope and Evaluation Methods
This report focuses on local government efforts to prevent waste, including those efforts that have earned recognition under DEQ’s 2% recovery rate credit program, described in the next chapter. It is intended to provide DEQ and interested parties with a common understanding and overview of selected local government accomplishments in waste prevention, reuse, and home composting. It is also designed to provide information to DEQ and interested parties on barriers and opportunities for continued progress.
Waste Prevention Strategy 4 Background Paper #4 Local Government Efforts December 2006

Cascadia researched local government activities and compiled information through telephone interviews and personal communications with DEQ staff, local government program managers, and others as well as from 2% credit applications, DEQ letters granting credits, existing reports, and other program documentation. The research project developed a database of more 150 local efforts earning 2% credits and a total of more than 460 relevant efforts in Oregon involving state government, local governments, and nongovernmental organizations (NGOs), including not-for-profit and private-sector organizations. We worked with DEQ to identify a set of interviewees intended to include leading programs as well as a selected sampling of other efforts around the state. Research included interviews with all seven of DEQ’s regional solid waste technical assistance staff, local government staff members, as well as NGOs involved in implementing local government programs.
The scope of this assessment of waste prevention, reuse, and home composting efforts among Oregon’s local governments is limited by available existing data. Conducting comprehensive, independent evaluations of the activities of all 36 counties and 241 incorporated cities in Oregon, or even the more than 150 activities recognized annually in the 2% recovery rate credit program, is beyond the scope of this effort. Accordingly, we necessarily relied on self-reported data from interviews with selected program staff, applications and acknowledgment letters for 2% credits, and any existing evaluation reports.
Waste prevention is often difficult to measure and quantify, and evaluation efforts are frequently limited or non-existent. More quantitative data are generally available on material reuse activities than for pure waste prevention, though tracking and reporting remain incomplete. Much of the quantitative data cover activity measures, rather than baseline data and ongoing measurement of outcomes, which limits effective evaluation efforts. As a result, many findings are more qualitative than quantitative, though our interviews helped to identify programs that appear more active and effective and to offer potential models for further waste prevention efforts.
1.4 Report Outline
This background paper on waste prevention efforts of local governments in Oregon is organized into six chapters:
1. Introduction and Overview
2. Overview of Local Government Waste Prevention
3. Waste Prevention (Source Reduction)
4. Reuse
5. Home Composting
6. Options for State Support
Waste Prevention Strategy 5 Background Paper #4 Local Government Efforts December 2006

2 Overview of Local Government Waste Prevention
Local governments throughout Oregon have created and implemented programs to prevent waste, reuse materials, and compost organic materials onsite. The study identified programs of interest through interviews with DEQ staff members, including the seven solid waste technical assistance staff members who work with local governments throughout the state, and through a review of programs that earned 2% recovery rate credits or received solid waste grants. Not all relevant local government programs applied for and obtained 2% credits, but DEQ’s 2% credit program appears to encompass the more active local governments as well as a mix of other cities and counties taking part in waste prevention.
2.1 Pay As You Throw
One basic way that government can support waste prevention (and reduction) is to establish a rate system in which residents and businesses can save money if they throw away less material. Under such a program, called Pay As You Throw (PAYT), waste generators pay a variable rate based on the amount of trash they actually throw out – typically measured by volume (bin size) – instead of paying a fixed rate for garbage collection. Households and companies may reduce their trash though recycling, composting, and source reduction. Oregon communities already use this method to encourage waste reduction. Nearly every community in Oregon has a PAYT program, with McMinnville’s dating back to 1928.1
PAYT’s impact on source reduction is debatable, though one study estimated that these programs contribute to a 5-6% increase in recycling, a 4-5% increase in yard waste composting, and a 5-7% decrease in waste generation through source reduction.2 PAYT is often assumed to contribute to waste prevention. Its actual source reduction impact is difficult to measure, however, because generation can decrease due to other factors such as economic and packaging trends as well as increases in dumping or backyard burning.
Pay As You Throw is not considered a major opportunity for increasing waste prevention because its adoption is already widespread among Oregon’s jurisdictions. Raising waste disposal tip fees, however, could help foster various waste prevention activities, particularly reuse and home composting.
2.2 Recovery Rate Credits
Under ORS 459A.010, Oregon has established statewide goals for reducing waste generation as well as statewide and wasteshed-specific goals for waste recovery. Wastesheds can move closer to achieving or surpassing their waste recovery goals by applying for credits for their programs. Under HB 3456 (which passed in 1997), wastesheds can implement qualified programs to obtain 2% credits on their recovery rates, for a total of up to 6% credit. Wastesheds align with county boundaries except for the City of Milton-Freewater, which composes its own wasteshed, and the Metro wasteshed, which includes Clackamas, Multnomah, and Washington counties.
1 U.S. Environmental Protection Agency, “Pay As You Throw,” accessed online July 2006, www.epa.gov/epaoswer/non-hw/payt.
2 Skumatz, Lisa A., Measuring Source Reduction: Pay As You Throw / Variable Rates as an Example (Skumatz Economic Research Associates, Inc.: May 2000).
Waste Prevention Strategy 6 Background Paper #4 Local Government Efforts December 2006

The 2% credits provide recognition for programs in the categories of waste prevention, reuse, and residential composting. In addition, a “greater than 2%” credit for residential composting is available for wastesheds that can provide quantitatively verifiable documentation that home composting diverts more than 2% of solid waste generation. Jackson County has received this credit in the past, but no counties currently earn it.
To qualify for a 2% credit, a program must include a public education or promotion campaign and two additional elements particular to the type of program, chosen from a list of four to ten additional options. Table 2-1 lists eligible program elements for each of the three categories of 2% credits. It should be noted the 2% credit for waste prevention as defined in statute includes two elements that do not typically make a direct contribution to waste prevention: buying recycled products and green building.
Waste Prevention Strategy 7 Background Paper #4 Local Government Efforts December 2006

Table 2-1. Program Options for 2% Recovery Rate Credits
Waste Prevention Reuse Home Composting
Reduce the wasteshed annual per-capita waste generation by 2% each year
Conduct a waste prevention media promotion campaign targeted at residential generators
Expand the education program in primary and secondary schools to include waste prevention and reuse
Household hazardous waste (HHW) prevention education program
Local governments will conduct waste prevention assessments of their operations, or provide waste prevention assessments for businesses and institutions and document any waste prevention measures implemented
Conduct a material-specific waste prevention campaign for businesses throughout the wasteshed
Implement a Resource Efficiency Model City program
Material-specific waste prevention campaign focused on a toxic or energy-intensive material
Buy recycled-content products
Local government green building
Operate construction and demolition debris salvage programs with depots
Promote reuse programs offered by local resale businesses, thrift stores and equipment vendors, such as computer and photocopier refurbishers, to the public and businesses
Identify and promote local businesses that will take back white goods for refurbishing and resale to the public;
Develop and promote use of waste exchange programs for the public and private sectors
Site accommodation for recovery of reusable material at transfer stations and landfills
Sidewalk pickup or community fair program in cities over 4,000 population in the wasteshed
A program to encourage leaving grass clippings generated by lawn mowing onsite rather than bagging the clippings for disposal or composting;
A composting program for local schools;
An increase in availability of compost bins for residents
Another program increasing a household’s ability to manage yard trimmings or food wastes
Waste Prevention Strategy 8 Background Paper #4 Local Government Efforts December 2006

Waste Prevention and Recovery Rates
Wasteshed applications for 2% credits serve as an excellent marker for tracking local governments with active waste prevention programs and activities. Higher levels of waste prevention activities under the 2% credit program generally correlate with higher recovery rates. Similarly, applications for 2% credits also appear to correlate with increased attention to waste prevention overall. The following maps illustrate this point, showing that both the highest recovery rates and more waste prevention programs are concentrated in the more urban, western counties in the Metro area and along the Interstate-5 corridor.
As shown in Figure 1, the highest levels of credits (6%, or 2% credit in each of the three credit categories) have been earned by counties along the I-5 corridor. In far eastern Oregon, only two counties, Baker and Union, have earned 2% credits, and their credits are only in a single category, home composting. Three additional eastern Oregon counties – Deschutes, Hood River, and Wasco – that earned credits are located in areas that adjoin western Oregon and are relatively near the population centers of Lane County and the Metro region. Few active waste prevention programs are located in the eastern portion of the state or along the coast. In contrast, in western Oregon, only four counties, all located along the coast or Columbia River, lack credited waste prevention programs. Some of those wastesheds are reportedly in the process of developing eligible programs.
Figure 1. Recovery Rate Credits Earned in 2005, by County
WheelerJefferson
Deschutes
GilliamSherman
Benton
ColumbiaClatsop
Multnomah
Yamhill
Marion
HoodRiver
Wasco
Lane
Douglas
JosephineCurry
Union
Lake
Klamath
UmatillaWallowa
MorrowTillamookWashington
Clackamas
BakerPolk
Lincoln
GrantLinn
Crook
Malheur
HarneyCoos
Jackson
Metro*
WheelerJefferson
Deschutes
GilliamSherman
Benton
ColumbiaClatsop
Multnomah
Yamhill
Marion
HoodRiver
Wasco
Lane
Douglas
JosephineCurry
Union
Lake
Klamath
UmatillaWallowa
MorrowTillamookWashington
Clackamas
BakerPolk
Lincoln
GrantLinn
Crook
Malheur
HarneyCoos
Jackson
Metro*
2% Credits Earned, 2005
6% (all 3 credits)
4% (2 credits)
2% (1 credit)
None
*The three Metro counties compose a single wasteshed (Clackamas, Multnomah, and Washington)
2% Credits Earned, 2005
6% (all 3 credits)
4% (2 credits)
2% (1 credit)
None
*The three Metro counties compose a single wasteshed (Clackamas, Multnomah, and Washington)
Waste Prevention Strategy 9 Background Paper #4 Local Government Efforts December 2006

Geographic distribution of programs earning 2% credits remains similar across the three credit categories: waste prevention, reuse, and home composting. In the category of waste prevention, 13 wastesheds and 15 counties have earned 2% credits.3 For reuse programs, 10 wastesheds and 12 counties have earned such recognition. Sixteen wastesheds and 18 counties have earned credits for home composting programs. Figure 2 shows the distribution of counties with recognized waste prevention, reuse, and home composting programs, by 2% credit category.
Figure 2. Programs Earning 2% Credits in 2005, by Type and County
Counties with Waste Prevention Programs Earning 2% Credits
Counties with Reuse Programs Earning 2% Credits
Counties with Home Composting Programs Earning 2% Credits
Counties and Wastesheds Earning 2% Credits
Wastesheds Counties
Waste Prevention 13 15
Reuse 10 12
Home Composting 16 18
3 The Metro wasteshed covers three counties: Clackamas, Multnomah, and Washington. The Milton-Freewater wasteshed has not obtained any 2% credits.
Waste Prevention Strategy 10 Background Paper #4 Local Government Efforts December 2006

Waste Prevention Activities
Local governments in Oregon are undertaking a wide array of waste prevention, reuse, and home composting efforts, which includes such elements as:
Public education programs (e.g., brochures, media campaigns);
School-based education programs (e.g., classroom studies, school worm bins or in-vessel composters);
Product giveaways or sales (e.g., digital thermometers, compost bins);
Demonstration sites and/or classes (e.g., home composting sites and workshop);
Promotion of relevant businesses (e.g., stores selling reused items or offering repair services);
Contracts or partnerships with nongovernmental service providers;
Events (e.g., subsidized compost bin distribution sales, neighborhood waste swaps);
Logistical support for material reuse (e.g., refrigerated trucks for perishable food rescue); and
Waste audits and technical assistance (for businesses and government).
Following a discussion of waste prevention, 2% credits, and recovery rates, the subsequent chapters provide more information on the three categories of relevant local government activities: waste prevention (source reduction), reuse, and home composting.
Waste Prevention Strategy 11 Background Paper #4 Local Government Efforts December 2006

Waste Recovery Rates in 2005
As shown in Figure 3, waste recovery rates are highest in the western half of the state, primarily along the Interstate-5 corridor. These areas generally are also most active in waste prevention, as recognized through 2% credits. Accordingly, most waste prevention programs are found in wastesheds with the highest recovery rates.
Figure 3. Waste Recovery Rates in 2005, by County
WheelerJefferson
Deschutes
GilliamSherman
Benton
ClatsopColumbia
Multnomah
Yamhill
Marion
HoodRiver
Wasco
Lane
Douglas
JosephineCurry
Union
Lake
Klamath
UmatillaWallowa
MorrowTillamookWashington
Clackamas
Baker
Polk
LincolnGrantLinn
Crook
Malheur
HarneyCoos
Jackson
Metro*Metro*
Waste Recovery Rates, 2005
40% or greater
30%-39%
20%-29%
19% or lower
*Average per-county rate for 3 Metro counties
Waste Recovery Rates, 2005
40% or greater
30%-39%
20%-29%
19% or lower
*Average per-county rate for 3 Metro counties
Waste Prevention Strategy 12 Background Paper #4 Local Government Efforts December 2006

Recovery Rates and Goals for 2005
Whether or not wastesheds are close to meeting their recovery goals shows little correlation with waste prevention activities or 2% credits, likely because the goals are intended to be tailored to the ability and willingness of individual counties to meet them. For example, 2005 recovery goals range from only 8% in Lake County to 62% in the Metro wasteshed. With nearly 15% recovery, Lake has almost doubled its goal, while Metro is not meeting its goal – even though Metro has a recovery rate of nearly 59% (including three 2% credits), the highest in the state. In 2005, 23 wastesheds met their recovery rate goals, including Milton-Freewater (see Figure 4).4 This information may be used to identify areas where enacting waste prevention activities eligible for 2% credits could help wastesheds meet their recovery goals.
Figure 4. Status in Meeting Recovery Goals for 2005, by County
WheelerJefferson
Deschutes
GilliamSherman
Benton
ColumbiaClatsop
Multnomah
Yamhill
Marion
HoodRiver
Wasco
Lane
Douglas
JosephineCurry
Union
Lake
Klamath
UmatillaWallowa
MorrowTillamookWashington
Clackamas
Baker
Polk
LincolnGrantLinn
Crook
Malheur
HarneyCoos
Jackson
Metro*
Status in Meeting Recovery Goals for 2005
Exceeding goal by 5% or more
Meeting or exceeding goal by 0-4.9%
Not meeting goal
*Average per-county amount for for 3 Metro counties
WheelerJefferson
Deschutes
GilliamSherman
Benton
ColumbiaClatsop
Multnomah
Yamhill
Marion
HoodRiver
Wasco
Lane
Douglas
JosephineCurry
Union
Lake
Klamath
UmatillaWallowa
MorrowTillamookWashington
Clackamas
Baker
Polk
LincolnGrantLinn
Crook
Malheur
HarneyCoos
Jackson
Metro*Metro*
Status in Meeting Recovery Goals for 2005
Exceeding goal by 5% or more
Meeting or exceeding goal by 0-4.9%
Not meeting goal
*Average per-county amount for for 3 Metro counties
Status in Meeting Recovery Goals for 2005
Exceeding goal by 5% or more
Meeting or exceeding goal by 0-4.9%
Not meeting goal
*Average per-county amount for for 3 Metro counties
Status in Meeting Recovery Goals for 2005
Exceeding goal by 5% or more
Meeting or exceeding goal by 0-4.9%
Not meeting goal
*Average per-county amount for for 3 Metro counties
4 Recovery rates are typically calculated to one decimal place (tenths), while goals are set as whole integers (no decimals). If recovery rates were rounded to the nearest whole number, the categories for several counties could change slightly.
Waste Prevention Strategy 13 Background Paper #4 Local Government Efforts December 2006

Recovery Rates and Goals for 2009
DEQ has also worked with wastesheds to establish recovery goals for 2009. Often these goals are unchanged from the 2005 goals, but 16 wastesheds have higher recovery goals in 2009. These higher goals for 2009 range from 1 to 17 percentage points higher than the 2005 goals. Of the 23 counties that have met their 2005 recovery goals, all but three wastesheds – Benton, Deschutes, and Lane counties – are also currently meeting their 2009 recovery goals. Figure 5 compares 2005 recovery rates with 2009 recovery goals and categorizes the progress of each county toward meeting its 2009 goal.
Figure 5. Progress toward Meeting Recovery Goals for 2009, by County
WheelerJefferson
Deschutes
GilliamSherman
Benton
ColumbiaClatsop
Multnomah
Yamhill
Marion
HoodRiver
Wasco
Lane
Douglas
JosephineCurry
Union
Lake
Klamath
UmatillaWallowa
MorrowTillamookWashington
Clackamas
Baker
Polk
LincolnGrantLinn
Crook
Malheur
HarneyCoos
Jackson
Metro*
Progress toward Recovery Goals for 2009
Exceeding goal by 5% or more
Meeting or exceeding goal by 0-4%
Not meeting goal
*Average per-county amount for for 3 Metro counties
WheelerJefferson
Deschutes
GilliamSherman
Benton
ColumbiaClatsop
Multnomah
Yamhill
Marion
HoodRiver
Wasco
Lane
Douglas
JosephineCurry
Union
Lake
Klamath
UmatillaWallowa
MorrowTillamookWashington
Clackamas
Baker
Polk
LincolnGrantLinn
Crook
Malheur
HarneyCoos
Jackson
Metro*Metro*
Progress toward Recovery Goals for 2009
Exceeding goal by 5% or more
Meeting or exceeding goal by 0-4%
Not meeting goal
*Average per-county amount for for 3 Metro counties
Waste Prevention Strategy 14 Background Paper #4 Local Government Efforts December 2006

Potential for Additional 2% Credits
Of the 12 counties not meeting their recovery goals, several could meet their goals if they obtained additional credits. As shown in Figure 6, Baker, Harney, Morrow, Sherman, and Wallowa counties could meet their recovery goals by earning additional 2% credits. The Metro wasteshed and Douglas and Jackson counties, however, have already obtained all three available 2% credits, and they are still not meeting their recovery goals. Coos, Curry, Gilliam, and Wasco counties have the opportunity to earn two to three additional 2% credits (for respective additions of 4% to 6% to their recovery rates), but even with the maximum number of credits available, they would not achieve their 2005 recovery goals without otherwise boosting their recovery rates.
Figure 6. Potential for Additional 2% Credits in Counties Not Meeting 2005 Recovery Goals
WheelerJefferson
Deschutes
GilliamSherman
Benton
ColumbiaClatsop
Multnomah
Yamhill
Marion
HoodRiver
Wasco
Lane
Douglas
JosephineCurry
Union
Lake
Klamath
UmatillaWallowa
MorrowTillamookWashington
Clackamas
Baker
Polk
LincolnGrantLinn
Crook
Malheur
HarneyCoos
Jackson
Metro*Metro*
Counties’ potential for additional 2% credits
No Potential
Potential 4%
Potential 6%
Recovery Goal Met
Counties that would not meet goal even with additional credits
Potential to Obtain Additional 2% Credits
Oregon also has established goals for reducing its waste generation. State legislation established the goal of stabilizing per-capita waste generation by 2005 and total waste generation by 2009. Many counties have not yet achieved even the 2005 waste generation goal, as per-capita waste generation continues to grow in most parts of the state. Total waste generation is rising with both increases in per-capita generation rates and state population growth. Strong waste prevention efforts throughout the state will be critical to meeting the ambitious 2009 goals to stabilize waste generation even as population continues to grow.
Waste Prevention Strategy 15 Background Paper #4 Local Government Efforts December 2006

2.3 Summary of Local Programs and 2% Credits
Activities for which local governments have claimed 2% credits have significant overlaps with solid waste grant-funded activities and nongovernmental efforts, which are considered in separate reports. Most of these activities are located in western Oregon. Of the 19 Oregon counties with waste prevention programs, only five are in the eastern part of the state and three of those adjoin western Oregon: Hood River, Wasco, and Deschutes. Similarly, only four counties in western Oregon lack credited waste prevention programs, and some of those may be developing eligible efforts.
These programs include a wide variety of project types and activities. Many are fairly “standard” public education programs, though they must include additional elements (most often school and media components) in order to qualify for a 2% credit. Programs eligible for credits can be conducted by local governments, through contracts, and/or by nonprofits, schools, or other groups. Of the programs that go well above the standard level, most are either located in more populous areas (e.g., Metro, Marion, Lane counties); led by nongovernmental organizations (e.g., reSource in Bend, BRING in Eugene); or both. More rural areas either lack programs entirely or generally are not developing beyond conducting basic activities at the minimum level needed to obtain a recovery rate credit. The following chapters cover waste prevention, reuse, and home composting programs that local governments in Oregon conduct or support. The chapters also present barriers, opportunities, and suggestions for State involvement, as identified primarily through stakeholder interviews.
Waste Prevention Strategy 16 Background Paper #4 Local Government Efforts December 2006

3 Waste Prevention (Source Reduction)
Oregon’s statutory goals establish strict definitions for waste prevention that distinguish it from waste reduction, which includes a range of behaviors that keep garbage out of the landfill, such as recycling and yard waste diversion. Unlike waste reduction, waste prevention focuses on keeping the waste from being generated in the first place. In practice, however, the distinctions between waste prevention and waste reduction activities may become less clear among the public, local government officials, and sometimes even department staff. The issue may be further confused by the inclusion in the 2% credit for waste prevention, as defined in statute, of two elements that typically do not make a direct contribution to waste prevention: buying recycled products and green building.
3.1 Overview of Waste Prevention Programs
All waste prevention programs earning 2% credits are required to provide educational materials to residents. Most programs prepare brochures, but some conduct more extensive media campaigns through radio, television, or newspapers. In addition to providing educational materials, programs must include two additional elements from the following list of 10 options.
Table 3-1. Waste Prevention Program Elements for 2% Credits
Reduce per-capita waste generation by 2% annually
Waste prevention media campaign for residents
K-12 school education program on waste prevention and reuse
HHW prevention education program
Waste prevention assessments for local governments, businesses, and institutions
Material-specific waste prevention campaign for businesses
Resource Efficiency (Model Cities) program
Material-specific waste prevention campaign on a toxic or energy-intensive material
Buy recycled-content products
Local government green building
The most common voluntary program elements are education in schools and media promotion. Sample activities include such efforts as Waste-free Holidays campaigns, Green Schools efforts on waste prevention, and micro grants to schools. NGOs conduct some of these qualifying programs. NGO involvement is more common among programs that go beyond the basic requirements for obtaining a credit.
The capacity of local governments to handle waste prevention efforts varies considerably. A few have a sophisticated understanding of waste prevention and are implementing extensive programs, while others are struggling to provide the most basic services. Mingling of recycling and waste prevention efforts is common among most programs, however, even in the more sophisticated programs (though this mingling may occur purposefully or for convenience, rather than due to a lack of understanding). Regardless of its rationale, this mixing of recycling and waste prevention tends to have adverse impacts for waste prevention, contributing to confusion and reduced emphasis on prevention in comparison with recycling.
Some programs claimed for 2% credits appear to have more emphasis on recycling than prevention. The enabling legislation also allows credit for some efforts that are not primarily waste prevention,
Waste Prevention Strategy 17 Background Paper #4 Local Government Efforts December 2006

particularly buy-recycled and green building programs. Other programs submitted in 2% credit applications do not appear to be waste prevention, such as paint recycling or electronic waste collection. Additionally, the allocation of efforts in local government programs among waste prevention and other topics, such as recycling, is rarely specified, making it unclear if a program is primarily directed toward recycling or waste prevention. Review of these programs and interview responses raises the following questions:
Marion County’s Waste Prevention program goes well beyond the minimum of printing brochures. Its “mandatory” education element includes extensive media coverage in the form of advertising on television, radio, newspapers, buses, billboards, and websites, as well as a special semi-annual tabloid newspaper devoted to waste prevention and other solid waste topics. Examining the various collateral materials would allow an assessment of the degree to which the education program focuses on waste prevention, reuse, and home composting in contrast with other solid waste topics, such as recycling.
Marion County’s program also includes six additional waste prevention elements, rather than only the two that are required. However, many of these efforts also include strong recycling components, and the degree of waste prevention and its effectiveness is unknown. The additional elements include:
Wasteless holiday campaign;
School-based education program in Salem-Keizer district;
HHW prevention education and disposal/exchange programs;
Waste audits for businesses, institutions, other departments;
Mercury thermometer, e-waste, and related campaigns; and
Green building efforts.
Waste Prevention in Marion County
How much waste prevention is enough for a program to receive credit?
Does waste prevention need to be the primary focus of a program in order to qualify, or can it be one element integrated with others?
Does an activity qualify if it is primarily recycling-related as long some waste prevention element is also included?
As long as programs incorporate some waste prevention component, the current evaluation system does not appear to specify any minimum amount of waste prevention needed to qualify for a 2% credit. Some programs currently earning credits appear more focused on recycling than waste prevention.
Summary data on the impact of these waste prevention programs are not available, though general education efforts typically offer fewer tangible, measurable results than more direct services such as business waste audits. Evaluation of measurable outcomes of educational efforts is often lacking for these waste prevention programs, though this type of information typically is lacking more broadly through the field of education and environmental behavior change, not simply for waste prevention alone.
3.2 Barriers to Waste Prevention
Several barriers exist to implementing successful waste prevention programs, including other priorities, lack of evaluation, negative perceptions, resource limitations, lack of incentives, and mingling with recycling efforts, as discussed further in the following section.
Waste prevention is not considered a priority in many communities. Not surprisingly, waste prevention typically ranks much lower in priority for public agencies than more basic needs, such as emergency response and environmental cleanup. Similarly, recycling usually comes before waste prevention, so communities that are struggling to recycle are unlikely to tackle waste prevention.
Waste Prevention Strategy 18 Background Paper #4 Local Government Efforts December 2006

Evaluating results of general education campaigns is difficult and often not completed. Tracking behavior changes, such as those related to consumer purchasing, product choice, and material use, may prove challenging and costly. Surveying can help track some changes, but its self-reported and often qualitative nature may make it better suited for tracking attitudes than certain behaviors. Even when behavior change is measured, forging causal links to educational programs may also prove elusive.
In the absence of documented results demonstrating the effectiveness of waste prevention, negative perceptions arise that waste prevention does not work, is too “fuzzy,” or is too difficult to undertake successfully. Some jurisdictions noted concerns about public perceptions that waste prevention could harm the economy or expressed reservations about their agencies disseminating messages encouraging residents and businesses to buy or use fewer products or less material.
Frequently too few resources are available to implement waste prevention programs. Many public agencies face limited staff resources in general, and these limitations may be particularly stringent for waste reduction, waste prevention, and other conservation programs. In several counties, responsibility for solid waste management activities may account for one-quarter of a full-time equivalent (FTE) or less. In such cases, recycling and disposal typically garner most of the limited available staff resource, and little time, budget, and energy are left to focus on waste prevention.
In some counties, solid waste management responsibilities are delegated to a waste hauler, leaving the county with less regular involvement and direct control of waste programs. When disposal and recycling are managed through hauler-run programs, often a clear incentive to prevent waste may be lacking. When haulers earn payment based on tip fees and tonnages collected, waste prevention may reduce their earnings, creating a disincentive for hauler-run programs to encourage behavior change. Multiple jurisdictions also expressed the belief that low tip fees for residents and businesses provide a disincentive for waste prevention because the disposal alternative is convenient and inexpensive. Incorporating recycling incentives into hauler contracts or franchise agreements has become more common, but examples were not available of similar incentive efforts for waste prevention.
Finally, the term “waste prevention” itself is often conflated or confused with recycling. This mingling may occur for convenience or practical reasons, as the same staff person is often leading all such efforts. The problem arises, however, when this conflation leads both the public and agency program staff to believe that their recycling efforts, however extensive, are “preventing waste” rather than diverting it from the landfill or incinerator.
3.3 Opportunities for Waste Prevention
Opportunities for increased waste prevention vary across the state, based largely on the level of effort for existing local government waste prevention programs, if any. Even in areas with the most active programs, local governments expressed interest in enhancing their efforts, through networking with other programs and technical assistance, particularly related to “proven” messages and activities. These active programs are typically located in the larger metropolitan areas and may have resources and support that are not available to their counterparts in less populous areas.
In the counties spanning most of western Oregon outside of the Lane, Marion, and Metro wastesheds, many local governments stated that they would welcome assistance with designing, implementing (including funding support), and evaluating effective programs for waste prevention. Most DEQ solid waste technical assistance staff members supported the idea of having a menu of proven program options from which local governments could select and tailor for their areas. Local governments either recommended or were amenable to this approach, as long as it includes sufficient flexibility to meet their local needs and interests. In areas that lack existing waste prevention programs, assistance is needed to overcome structural barriers to waste prevention, primarily lack of funding and staff capacity for implementation.
Waste Prevention Strategy 19 Background Paper #4 Local Government Efforts December 2006

Statewide campaigns reaching into these less active areas or more direct support and assistance may help. Such efforts could be coupled with ongoing tracking of environmental knowledge, attitudes, and reported behaviors to help measure outcomes and effectiveness. The National Environmental Education Training Foundation (NEETF) surveys and annual Gallup Poll of environmental concerns provide two national examples of such longitudinal tracking of environmental attitudes and knowledge. Additionally, Minnesota produces an environmental literacy “report card” that offers a potentially relevant state-level model for Oregon.
Options for ways the State could support increased and improved waste prevention programs throughout Oregon appear in Chapter 6.
Waste Prevention Strategy 20 Background Paper #4 Local Government Efforts December 2006
4 Reuse
All reuse programs earning 2% credits are required to provide educational materials to residents. To meet this requirement, most programs prepare brochures or other materials for distribution to residents. Programs must include two additional elements from the following list of six options.
C&D salvage program with depots
Promote reuse programs by local resale stores, thrift shops, etc.
Promote local businesses that refurbish and resell white goods
Promote waste exchange programs
Accommodate salvage at transfer stations and landfills
Sidewalk pick-up or community fair program for reusable items
4.1 Overview of Reuse Programs
Local government reuse programs may include elements such as internal reuse efforts for office supplies and related materials, cleanup events and redistribution of materials such as household goods, or directories or other promotion of reuse/repair businesses. Examples of materials included in reuse programs in Oregon include used building materials; edible food rescue; electronics (e.g., computers, cell phones); household goods, furniture, and appliances; and miscellaneous items, including flowerpots, polystyrene form, wine bottles, latex paint, bicycles, household hazardous waste, and soils.
Many reuse activities are conducted by nonprofit organizations. The programs they conduct tend to go beyond the basic requirements for obtaining a credit. Government can support these efforts through promotion of their efforts or direct financial assistance.
Some reuse programs include significant recycling efforts. Some materials, such as edible food, are well suited for reuse, while others such as electronics may have limited reuse opportunities due to low market demand. Such activities raise the question of how much emphasis on reuse versus recycling a program needs, or what quantity needs be reused, in order to qualify for the reuse credit.
4.2 Barriers to Reuse
Three main barriers to successful reuse programs emerged from interviews with local governments: resource constraints, imbalances between supply and demand, and disincentives related to the ease of disposal.
Reuse programs are hindered by limited staff resources, infrastructure, and funding. Both local government and nonprofit organizations frequently lack the funding and staff resources to implement reuse programs at desired levels. Sales of used building materials and household goods typically earn greater returns than used electronics or food (which is provided as a social service rather than sold to raise funds). Successful reuse activities in these areas may earn enough to cover their operating costs, but often assistance (such as grants) is needed to cover costs of start-up or expansion. Infrastructure needs may also be a limiting factor. Used building material stores, in particular, require large amounts of covered space for storing, organizing, displaying, and selling the goods. NIMBY (not in my backyard) concerns may make it difficult to site or expand these facilities.
Ensuring a critical mass of materials and customers is another challenge facing reuse operations. Transportation logistics must also be considered when matching supply and demand. For some materials, such as food for example, demand currently exceeds supply, and the majority of collected
Waste Prevention Strategy 21 Background Paper #4 Local Government Efforts December 2006

food is easily reused. Alternately, in the case of other materials, such as computers, supply exceeds demand. As a result, only the highest value computers are reused, and economics dictate that the rest are recycled.
Finally, convenient and low-cost disposal creates disincentives for reuse. For example, if contractors can tear down an old house and landfill the materials for a lower cost than to deconstruct and salvage materials for resale (or recycling), they have little incentive to save materials for reuse. Reuse is often more labor-intensive than the status quo, which is typically disposal. This additional labor results in jobs, but it also increases incremental costs, particularly where disposal tip fees are low.
Metro supports more than a dozen reuse programs, including in-house efforts (e.g., office supply reuse), public programs (e.g., neighborhood cleanups), and NGO-based programs. Two interesting model programs are Fork It Over! and the North Portland Tool Library. These programs are summarized below.
Fork It Over! is Metro’s food donation program that focuses on perishable food such as unserved menu items, produce, dairy, and deli items. Fork It Over! does not operate its own collection or distribution infrastructure but instead helps link donors with existing service providers. The program has been used as a model for other areas, such as Spokane and now Seattle in Washington State. The program helps keep tons of materials out of the wastestream, while supporting a valuable social mission of feeding the hungry.
The North Portland Tool Library lends tools free of charge to residents of North Portland. It is supported by grants (including funds from Metro) and donations. The library has over 125 different types of garden, carpentry, plumbing, and electrical power and hand tools. It also offers basic and advanced workshops on using the tools. The tool library is designed to help residents avoid unnecessary purchases of equipment they use only infrequently, save money and materials, and foster community spirit.
Reuse Examples from the Metro Region
4.3 Opportunities for Reuse
Reuse programs provide auxiliary benefits such as saving money and generating jobs. These benefits can help reuse activities, such as used building material supply stores, provide feasible and effective even in weaker economies and smaller communities. The reuse efforts not only prevent waste, they also make valuable materials available to residents at reduced prices.
In addition, many reuse activities also offer important social benefits. Nonprofit reuse operations in particular provide valuable social benefits, such as job training and employment for disadvantaged populations, technology access for low-income residents, and food for the hungry.
Used building material stores and edible food rescue operations have strong model programs that are ripe for expansion into additional communities, including rural areas. These programs have strong track records in communities in different parts of the state, and replicable models can be transferred to other areas where these services do not yet exist or have room for significant expansion.
Options for ways the State could support increased and improved reuse programs throughout Oregon appear in Chapter 6.
Waste Prevention Strategy 22 Background Paper #4 Local Government Efforts December 2006

5 Home Composting
5.1 Overview of Home Composting Programs
Home composting programs earning 2% credits focus on residents, though some efforts to manage organic wastes onsite through in-vessel composting exist at schools, institutions, and grocery stores. In addition to residential composting promotion through information and demonstration sites, programs must include two additional elements from the following list of four options.
Encourage mulching and composting grass clippings onsite
Composting program for local schools
Increase compost bin availability for residents
Other programs to increase onsite management of yard and food wastes
Examples of current local government efforts include educational programs (primarily brochures) regarding composting and grasscycling, demonstration sites and classes, bin distribution programs (e.g., free or subsidized bins, sales events) and school-based programs for composting and worm bins.
5.2 Barriers to Home Composting
Interviewees reported several barriers to implementing successful home composting programs: the ease of the curbside collection alternative, the limited reach of event-based programs, and potential market saturation.
Lane County offers an extensive composting education program through the Master Gardener Compost Specialist program provided in conjunction with the City of Eugene and Oregon State University Extension Service. The Master Gardeners’ Compost Education Team provides composting education to residents and students. The County offers four compost demonstration sites, and Compost Specialists provide public demonstrations, teach worm bin classes, and staff booths at local events.
Several other composting programs are in place in Lane County in addition to the Master Gardener program. Lane County and the City of Eugene provide brochures on grasscycling for onsite management of grass clippings. In-vessel composting projects using Earth Tubs are underway at five elementary, middle, and high schools as well as the University of Oregon, Lane Community College, and a grocery store. The City of Eugene sponsors compost bin sales, and BRING, a local nonprofit, also sells compost bins at its Reuse Warehouse.
Home Composting in Lane County
Residents and local governments may favor curbside collection over home composting. Where curbside collection is available, it is commonly more attractive to residents as it is quite convenient. Similarly, although curbside collection is clearly environmentally preferable to onsite (or centralized) burning or landfilling, further consideration may be needed to assess the value of promoting backyard composting when the alternative is curbside collection.
Home composting programs frequently center on compost bin distribution events. The drawback is that, without follow-up efforts, one-time events may not sustain ongoing behavior change. Ongoing promotion and education on home composting, however, require significantly more resources than hosting an annual bin sale.
Waste Prevention Strategy 23 Background Paper #4 Local Government Efforts December 2006

A few interviewees noted that their compost bin promotions have had lower response rates in recent years than in the past. They speculated that their market may be saturated, or they have at least picked the “low-hanging fruit” in terms of converting residents to backyard composting. Accordingly, potential for new home composting may be limited in those areas, at least among existing residents.
5.3 Opportunities for Home Composting
Though some markets may be saturated, opportunities do exist to expand home composting programs to new residents moving to the area and to new home buyers. Promoting composting and offering bins to residents moving to new homes may help expand this market.
Since Oregon instituted its programs supporting backyard composting, the availability of curbside organics collection for centralized composting has expanded significantly. Though curbside collection lacks some of the environmental benefits of onsite composting (e.g., soil building), it is clearly environmentally preferable to burning, dumping, or stockpiling yard waste. Accordingly, the State may wish to consider the costs and benefits of home composting versus curbside collection in evaluating its resource allocations.
Options for ways the State could support increased and improved home composting programs throughout Oregon appear in the next chapter.
Waste Prevention Strategy 24 Background Paper #4 Local Government Efforts December 2006

6 Options for State Support
While many waste prevention programs are in place in parts of the Oregon, opportunities exist for the State to support current programs as well as to foster their growth in areas that are currently doing less waste prevention or lack existing activities. According to interviews conducted with local government programs, the State is in a unique position to support waste prevention through the following efforts. Options include both direct support to local government efforts as well as statewide initiatives designed to reinforce and complement local efforts.
6.1 State Support for Local Government Efforts
Continue state funding and support for local programs.
Develop a menu of options and work with local government on tailored approaches appropriate to their needs.
Support for capital improvements (over ongoing operating costs).
Facilitate information-sharing and peer networking.
For composting, DEQ should consider likely alternatives (curbside composting versus burning, dumping, or stockpiling) in weighing the costs and benefits (economic and environmental) to determine how much emphasis to place on encouraging home composting.
6.2 Statewide Initiatives to Complement Local Efforts
DEQ could lead efforts to identify and develop messages that work and to produce effective public education campaigns, tailored to meet local needs and interests. Education should be designed to go beyond raising awareness and should yield desired behavior change results.
Consistent, clear messages from all State and DEQ representatives would help clarify concepts of waste prevention and reduce confusion. (Interviewees did not suggest this explicitly, but this consistency may involve DEQ being more selective and strict in the award of its 2% recovery rate credits and its solid waste grants. In particular, clarifying the appropriate roles of waste prevention, reuse, and recovery in 2% credit applications could help encourage improved waste prevention and reuse benefits from the program.)
The State can also lead by example by making DEQ and other state agencies into models for waste prevention, demonstrating practices that other governments, as well as businesses and residents, could adopt.
Document waste prevention results and assist with development of baseline measures and periodic tracking. The State is well positioned to provide ongoing tracking over time.
The State could support increased tip fees for waste disposal, which could help level the playing field for reuse activities and support other waste prevention efforts.
The State could undertake high-level initiatives, such as promoting product stewardship, packaging changes, and upstream changes that help produce better consumer choices. DEQ currently participates in some regional and national product stewardship efforts, and these activities could be continued and expanded.
Waste Prevention Strategy 25 Background Paper #4 Local Government Efforts December 2006

Appendix A. Local Government Program Examples
This section briefly summarizes major barriers, opportunities, and lessons learned as reported in interviews. These self-reported responses do not necessarily reflect the views of the researchers or DEQ.
The counties profiled in this section obtained credits in all three areas: waste prevention, reuse, and home composting. Other counties interviewed include Columbia, Tillamook, and Wallowa.
Nongovernmental organizations conduct activities that are associated with a number of the 2% credits. These efforts are covered in the background paper on nongovernmental organizations and generally are not repeated here. Examples include:
reSource for waste prevention education and home composting;
BRING and Habitat for Humanity for used building materials;
ACCESS and COCAAN for edible food rescue;
St. Vincent de Paul for household goods reuse; and
Computer Reuse and Recycling Center for electronics reuse.
Benton County
Major programs used to earn the 2% credits included Benton Furniture Share, Habitat for Humanity Discount Building and Home Supply Store, and the Get SMART Resource Efficiency Program. Other efforts included the Linn-Benton Food Share; home composters provided for a small fee by waste haulers; and home composting brochures and a demonstration site.
Reported Barriers
Interviewees reported two major barriers to waste prevention programs. First, Benton County seems to have plateaued on influencing the adult population. Focusing on school-age children may be a logical next step. Second, waste prevention programs often either consist of one-time events or require broad lifestyle changes, neither of which seems to be very successful. Instead, programs need to be “automatic and easy for the public,” akin to curbside recycling.
Reported Opportunities
Benton County staff identified several opportunity areas, though not all would qualify as waste prevention. First, the County would like to conduct outreach regarding construction and demolition (C&D) waste. Plans for educating contractors and residents mostly pertain to C&D recycling, but used building materials also can be a good opportunity for reuse. Second, the County expressed interest in food waste collection (for centralized composting, which does not qualify as waste prevention under DEQ’s definition). Benton County currently receives a 2% credit for home composting, though its volunteer-maintained home composting demonstration sites do not appear to be used frequently. Third, many recyclable materials are still going into the landfill, which may present opportunities for reuse (as well as recycling). The interviewee expressed enthusiasm for a number of current reuse activities, such as the Benton Furniture Share, Habitat for Humanity store, and Get SMART program, while new opportunities largely addressed waste recovery.
Waste Prevention Strategy 26 Background Paper #4 Local Government Efforts December 2006

Lessons Learned
The compost demonstration site is maintained by volunteers but is not used very often. Benton County’s absence of a Master Recycler program may contribute to this lack of use. Making waste prevention, reuse, and home composting practices easy and convenient for residents is key to their adoption and success.
Deschutes County
Programs used to earn the 2% credits included many efforts conducted through a local nonprofit, reSource (which we interviewed), including an education program for K-12 students; the WorkSmart business program with waste audits and sustainability workshops; an online materials exchange; and home composting education for citizens and schools as well as bins for sale. Other programs in Deschutes County included Paint Smart and a COCAAN food recovery project.
Reported Barriers
Budget shortfalls and the difficulty of obtaining grants make it difficult to administer programs and sustain them over time. Another funding challenge is that it proved infeasible to fund the WorkSmart program through collecting a portion of shared financial savings from participating businesses.
Reported Opportunities
DEQ can help foster sharing of information, so that programs in different areas can replicate best practices, rather than reinventing the wheel. DEQ could focus on a few key opportunities across the state; best practices for community-based social marketing could be a potential focus. When DEQ wants local programs to conduct surveys or evaluate other metrics, it could offer assistance or a handbook on how to measure effectively. For example, a composting survey done in 2001 yielded mixed results because program staff had not done a survey before, and they lacked resources to hire external assistance. Providing funds for feasibility studies would help fill the gap left by grantors focused on funding on-the-ground implementation.
Lessons Learned
The previous WorkSmart audit program encouraged specific behavior changes, but it proved difficult to ensure that the desired behavior continued over time at the businesses and to sustain funding for the program itself.
WorkSmart’s new sustainability workshop structure attempts to build an ongoing conservation ethic into participating businesses, though its efficacy has not yet been determined.
Hood River County
Programs used to earn the 2% credits included public media campaigns and a suite of 12 school presentations on waste prevention, reuse, composting, and recycling.
Reported Barriers
A key barrier to successful waste prevention programs in Hood River County is that people do not appear excited about waste prevention. More education and incentives may be needed to build enthusiasm. Also, it was suggested that the county government should make it easier to avoid generating waste in the first place; however, no specific ideas were offered. As with many other
Waste Prevention Strategy 27 Background Paper #4 Local Government Efforts December 2006

counties, Hood River County experiences staff shortages; limited resources make it difficult to run a successful program. Lastly, recycling is perceived as a large challenge, especially for rural areas that lack curbside pickup. Waste prevention is seen as an additional hurdle, rather than an opportunity or alternative.
Reported Opportunities
Home composting is one opportunity area, but negative perceptions (e.g., smelly, messy) must be addressed in order to achieve an increase in composting.
Lessons Learned
The interviewee thought the State was doing a good job supporting Hood River’s waste prevention efforts. An improvement would be for the State to work with counties individually on waste prevention, which could occur through an expanded program of solid waste technical assistance from DEQ. Interview responses focused on recycling activities, and the ratio of waste prevention, reuse, and home composting to recycling in the school presentations and other county efforts was not clearly defined.
Jackson County
In Jackson County, programs used to earn the 2% credits included school presentations on waste prevention, the SMART Business program providing waste assessments, a reuse directory, Goodwill salvage at the transfer station, ACCESS Food Share food recovery, and worm bin distribution to area schools.
Reported Barriers
The main barrier to waste prevention programs reported for Jackson County was that transportation costs in rural areas can make programs like food rescue more expensive.
Reported Opportunities
One opportunity for increased recovery in Jackson County is to collect reusable items at the transfer station or landfill. Although plenty of usable items arrive at the transfer station, Goodwill does not have the staff to collect frequently, and the transfer station has no space to set up a salvage area. The landfill formerly had a popular salvage yard, but it requires too much staff time to oversee.
Lessons Learned
The interviewee reported two lessons learned. First, curbside yard debris collection is so convenient that it may reduce home composting. Second, the SMART Business program learned that trying to provide resources and technical assistance in many topic areas (solid waste, energy, water conservation, and pollution prevention) was difficult. Instead, programs may be more effective by focusing on a single area (e.g., solid waste prevention) and providing referrals for businesses interested in other conservation topics.
Waste Prevention Strategy 28 Background Paper #4 Local Government Efforts December 2006

Josephine County
Programs used to earn the 2% credits for Josephine County included a school education campaign with worm bin offers, promotion of reuse practices and reuse businesses, and an education campaign regarding home composting that included a demonstration site.
Reported Barriers
Waste prevention programs are reportedly not a focus in Josephine County, due to both low interest and limited resources. The interviewee reported that waste prevention generally is not a priority for the people who live in the county. Further, general funding has decreased, and staff resources at the county level are very limited. The wasteshed representative is also involved in public health issues and emergency response, which take precedence. County staff members typically do not have the time to focus on waste prevention issues.
Reported Opportunities
The interviewee reported that future expansion opportunities would not be possible without more staff and resources. Similarly, providing funding for pilot projects that are county-specific might be helpful; the interviewee noted that a needs assessment should be done first.
Lessons Learned
Planning grants that were offered to the County are helpful, but when there is neither local support nor buy-in at the county level, it is difficult to support the planning process. More education about these topics, tailored and specific to each county’s situation, could encourage more citizen interest.
Lane County
Programs used to earn the 2% credits included a K-12 waste reduction education program, the “Less is Best” campaign directed at residential generators, the Computer Reuse and Recycling Center, BRING Reusable Building Materials Warehouse, appliance salvage at transfer sites for St. Vincent de Paul, and promotion of composting and grasscycling with school programs (using Earth Tubs for in-vessel composting) and compost bin sales.
Reported Barriers
The primary barrier reported for Lane County is the prevalent “consumer culture” attitude, which runs counter to waste prevention goals. Such attitudes are not specific to Lane County, of course, but they represent a common challenge for waste prevention efforts.
Reported Opportunities
An opportunity to increase waste prevention in Lane County is for State and local agencies to focus more efforts on outreach to large businesses. The interviewee suggested that businesses could be categorized, so that the local governments address local businesses, while the State works with major industries.
Waste Prevention Strategy 29 Background Paper #4 Local Government Efforts December 2006

Lessons Learned
The interviewee reported that DEQ should continue and possibly increase its grant program, which provides the source of funding for many important activities. Further, the State could reexamine its priorities for recycling and waste prevention to weight products with higher environmental impacts, such as plastics and HHW, higher in its priorities for action.
Linn County
Programs used to earn the 2% credits included conducting waste prevention “pre-cycling” presentations at K-12 schools and Master Gardener presentations on backyard composting. The county also has an extensive reuse program which includes a hauler-run swap site, a “set-aside” area at one transfer station, a Habitat for Humanity Bargain Building Supply store, and the Linn-Benton Food Share program.
Reported Barriers
The biggest barrier is lack of funding for waste prevention activities. The local waste haulers, however, are considered to be proactive with regard to waste prevention, though specific examples were not noted.
Reported Opportunities
The interviewee suggested three opportunities to expand waste prevention efforts in Linn County. First, outreach to K-12 students is increasing interest in waste prevention as the next generation learns to value resource conservation as a lifestyle. Second, local government needs to set the example with its own facilities and operations and to let the public know about its activities. And, third, counties should continue to advocate waste prevention to the public in many ways, including through other service providers, such as haulers or NGOs.
Lessons Learned
Two lessons were mentioned in relation to Linn County. Legislation drives waste prevention, specifically the Oregon Recycling Act of 1991. Some types of reuse programs need a certain population size to support them. To have a successful building material reuse program, for example, there must be a large enough population base to support it. However, every community should be able to support some level of reuse activity, such as a thrift shop or transfer station swap site.
Marion County
Programs used to earn the 2% credits included a junk mail campaign, free waste assessments to businesses, a wasteless holiday campaign, food rescue, and a latex paint program.
Reported Barriers
The following barriers were reported for Marion County.
The County has a stable budget but insufficient staff to disseminate all of its key messages.
Working with many small towns and multiple haulers makes it harder to create consistent programs for waste prevention, reuse, composting, or recycling. Haulers are reportedly starting to create similar programs (at least for recycling).
Waste Prevention Strategy 30 Background Paper #4 Local Government Efforts December 2006

Perception that waste prevention is bad for business because it could involve messages telling people not to buy things.
While recycling is an industry with a lot of infrastructure and people whose livelihood depends on its success, waste prevention does not yet have the same network of support.
Either the market for home composters is saturated, or yard debris collection (which is much easier) may be reducing interest in composting at home.
Reported Opportunities
Reported opportunities for Marion County (not all specific to waste prevention) include expanding the role of the County’s waste reduction specialist who deals specifically with green building and LEED projects; working with businesses and residents on capturing food waste, which could include onsite composting; and working with more businesses and multi-family programs.
Lessons Learned
The interviewee recommended that DEQ provide specific support to the County in terms of waste prevention. DEQ and the counties should work together to disseminate the same messages instead of each municipality conducting its own outreach. Furthermore, there are reportedly good opportunities for collaboration between the State and counties as well as among counties themselves. Perhaps DEQ could help with producing and crafting overall messages. Each county could then use its resources for reaching local residents and businesses. DEQ can also help prioritize areas to focus on and to identify how barriers might differ across the state.
The other lessons learned, according to the interviewee, included that haulers do not want to do any more paperwork. The County should seek to incorporate input from haulers, however, as they bring on-the-ground, daily experience with wastes. Additionally, getting people to stop buying things that they want is not a viable approach, so messages should focus on reducing waste they do not want (e.g., junk mail) and increasing things they do want (e.g., lower garbage bills, tax deductions for thrift donations).
Metro Regional Government
The tri-county Metro area received 2% credits for a multitude of programs, including:
Public- and school-based education campaigns on waste prevention, reuse, and composting;
A C&D salvage campaign;
A junk mail campaign;
A packing peanut reuse promotion;
Internet-based materials exchanges;
The Waste Reduction Action Information Network (WRAIN) regional business-to-business information-sharing group (now defunct);
Neighborhood cleanups with reuse areas;
Waste Prevention Strategy 31 Background Paper #4 Local Government Efforts December 2006

Internal and business waste prevention assessments and outreach (see City of Gresham example below); and
The Fork It Over! food rescue campaign (see discussion below).
Lessons Learned
The Metro region has many model waste prevention programs underway, though its examples may not translate easily to other, less developed and economically weaker areas of the state.
Examples of several programs in the Metro region appear below.
Fork It Over! Food Rescue Program
Fork It Over! is Metro’s Food Donation program that focuses on perishable food such as unserved menu items, produce, dairy, and deli items. Fork It Over! does not operate its own collection or distribution infrastructure but instead helps link donors with existing service providers.
Reported Barriers
This program has faced several barriers including potential donors that, due to small margins, do not make this a priority and so have little time to devote to food rescue. Some donors have lingering, though potentially unfounded, concerns about liability. Additionally, Safeway, a large potential donor, is not donating food and encouraging it to do so is challenging.
Reported Opportunities
This program has the potential to expand its target to several new areas. Dairy and deli items remain a major opportunity; the Oregon Food Bank, an umbrella organization and Fork It Over! partner, is working on recovering more of these items. Restaurants and caterers offer more potential food sources, but supply is not steady, and it can be difficult for both the donor and rescue agency to implement an efficient collection system. The industry trend for wholesalers to provide pre-processed produce has created an opportunity to rescue edible food from centralized preparation kitchens, where these kitchens are located in-state.
Lessons Learned
Building strong one-on-one relationships is key to the success of edible food rescue. Grocers and other donors need rescue agencies to be reliable, on-time, clean, professional, and to act like a regular supplier. Providing containers also helps.
Attending meetings of food industry professional organizations is an effective way to get in the door. Some potential donors do not see organizations as “real” unless they attend these meetings.
North Portland Tool Library
The North Portland Tool Library lends tools free of charge to residents of North Portland. It is supported by grants (including funds from Metro) and donations. The library has over 125 different types of garden, carpentry, plumbing and electrical power and hand tools. It also offers basic and advanced workshops on using the tools.
Waste Prevention Strategy 32 Background Paper #4 Local Government Efforts December 2006

Barriers
Programs such as the North Portland Tool Library face several primary barriers. Funding shortages limit their hours of operations (the NPTL is only open once a week, on Saturdays from 9:00 a.m. to 2:00 p.m.). Additionally, liability may be a concern, especially for the use of power tools. Finally, hiring and retaining staff members who are skilled in tool maintenance and repair (and willing to work part-time at nonprofit wages) is difficult.
Opportunities
General opportunities for tool-sharing programs include tool sharing for low-income areas to help with home maintenance; in rural areas to let farmers share equipment like tractors; as hobby libraries that let people try out specialized equipment like pasta makers or art easels before they buy something that they may not actually use; and to support annual neighborhood clean-up efforts.
Lessons Learned
Lessons learned that could be applied to other similar programs include the need for diligent tracking to keep tools in circulation. Sturdy, simple tools are best, since complex tools often need frequent repair and may not be practical for small programs with low budgets and limited staff resources.
City of Gresham
Programs used to earn the 2% credits included small grants to individual schools ($250-$350) for resource conservation activities, the GREAT Businesses program (Gresham Resource Efficiency Assistance to Businesses), and backyard composting incentives.
Reported Barriers
The largest barrier found for the City of Gresham has been getting businesses to change (especially in the retail sector), unless clear cost savings can be demonstrated. Additionally, the difficulties of creating and measuring behavior change are significant barriers.
Reported Opportunities
The following opportunities were recommended to expand waste prevention programs in Gresham.
While new potential for home composting is relatively low, the City needs to keep pace with growing development in the area in order to maintain the current level of home composting activity.
Increased waste prevention is possible because Gresham’s population is becoming more and more receptive to being “green.”
Reuse and product manufacturing changes, which need to be initiated at the State level, may offer the greatest opportunities for waste prevention.
Lessons Learned
The interviewee reported that State initiatives and support have played a large role in Gresham’s waste prevention programs. In general, the main drivers for waste prevention are local governments’ obligation to meet the State’s recovery goals, as well as recognition of the value of waste prevention. The most important role of the State should be to work on initiatives (e.g., producer responsibility,
Waste Prevention Strategy 33 Background Paper #4 Local Government Efforts December 2006

product take-back), while education programs and campaigns should be left to the local jurisdictions. Another vital role is to provide funding, such as through DEQ’s solid waste grant program, which has been helpful getting programs started. For example, the GREAT Businesses program likely would not have begun without the initial grant support of DEQ.
Yamhill County
Programs used to earn the 2% credits in Yamhill County included brochures on grasscycling, composting, and junk mail reduction; a resource guide with alternatives to landfilling items, such as resale shops, home gardening and composting ideas, and reuse ideas; promotion of composting at two colleges, at one high school, and to residents; and compost and food waste demonstration sites at several schools.
Reported Barriers
Education and awareness-building programs in Yamhill County appear to integrate waste prevention messages into other efforts that are more focused on recycling. This mixing makes it difficult to assess the content and reach of its waste prevention efforts. A reported barrier is that programs intended to reduce waste in some areas may inadvertently contribute to other waste generation. For example, the County distributed reusable mugs that coffee shops would fill for a discount. The program was not very successful, so ultimately the effort created more waste with unused mugs.
Reported Opportunities
Opportunities to increase waste prevention include distributing Earth Machines through haulers, especially to the new generation of families, and developing programs that are attractive to the school-age generation. The County also expressed interest in identifying a successful multifamily recycling program to use as a model, which may be more pertinent to recycling than waste prevention.
Lessons Learned
The State can help with advertising new generic programs, such as grasscycling, rather than focusing on programs specific to a location. Additionally, DEQ can provide needed support through its solid waste technical assistance staff as well as convening roundtable meetings for local government program managers to discuss waste prevention challenges and opportunities with their counterparts in other jurisdictions.
Waste Prevention Strategy 34 Background Paper #4 Local Government Efforts December 2006

Appendix B. Waste Prevention Interview Contacts
Ed Armstrong, Tillamook School District Darryl Barton, Hood River Health Department Mickey Beach, Heartwood Resources Chris Bekemeier, Rebuilding Center Dave Bennick, Reuse Consulting Shelly Bowe, CARE, Tillamook County Regional Food Bank Gordon Brown, Benton County Health Department Vern Brown, Salvation Army – Cascade Division (Portland) Susan Christensen, Oregon Department of Environmental Quality, Technical Assistant Carrie Clifton, CARE, Tillamook County Regional Food Bank Dianne Crocker, Habitat for Humanity ReStore (Bend) Julie Daniel, BRING Recycling Cathie Davidson, Oregon Department of Environmental Quality, Technical Assistant Ron Dettwiler, Food for Lane County Brett Dilley, Food Innovation Center (Oregon State University) Catherine England, eBay Jennifer Erickson, Metro, Waste Reduction and Outreach Scott Fairley, Oregon Department of Environmental Quality, Technical Assistant Richard Felly, CART'M Recycling John Fredrick, Goodwill Columbia-Willamette Brian Fuller, Oregon Department of Environmental Quality, Technical Assistant Sarah Grimm, Lane County Shari Harris-Dunning, Oregon Department of Environmental Quality, Technical Assistant Lorraine Kerwood, Computer Reuse and Recycling Center Leslie Kochan, Oregon Department of Environmental Quality, Technical Assistant Matt Korot, City of Gresham Bruce Lumper, Oregon Department of Environmental Quality, Technical Assistant Sherrie Mathison, Yamhill County Terry McDonald, St. Vincent de Paul of Lane County John McEvoy, Linn County Russ McMartin, Wallowa County Bob Morris, Oregon Food Bank Steve Murray, COCAAN (now NeighborImpact) Bailey Payne, Marion County Public Works Jim Primdahl, Deconstruction Management Group Mike Riley, reSource Martine Roberts-Pillon, Oregon Department of Environmental Quality George Rollings, Habitat for Humanity Bargain Building Supply (Albany) Michael Russo, Lundquist College of Business (University of Oregon) Jackie Saling, Habitat for Humanity Bargain Building Supply (Albany) Reverend Philip Sano, Free Geek Kathy Schwink, Tillamook County Belle Shepherd, Josephine County Health Department David Skakel, Gorge Rebuild-It Center Brian Smith, Northwest Demolition and Dismantle Max Stafford, Monitors and More Matt Tracy, Columbia County Laurie Triege, Food for Lane County Marty Willie, StRUT (Students Recycling Used Technology) Denise Wolgamott, Rogue Transfer and Recycling Philip Yates, ACCESS, Inc.
Waste Prevention Strategy 35 Background Paper #4 Local Government Efforts December 2006

Oregon Department of Environmental Quality
Waste Prevention Strategy – Background Paper #3
State of Oregon Efforts
A Summary of Oregon’s State-level Government Waste Prevention and Reuse Efforts
Conducted for
Oregon Department of Environmental Quality, Solid Waste Program
Prepared by
December 2006
Oregon Department of Environmental Quality 07-LQ-007

Acknowledgments
The authors of this background paper gratefully acknowledge the valuable contributions of the following individuals to the Waste Prevention Strategy research and development process.
Land Quality Solid Waste Policy and Program Development 811 SW 6th Avenue Portland, Oregon 97204 (503) 229-5913 (800) 452-4011 toll-free (503) 229-6977 fax www.deq.state.or.us David Allaway and Jan Whitworth, project managers Loretta Pickerell, solid waste policy and programs manager
DEQ Waste Prevention Strategy Steering Committee Members David Allaway, DEQ Julie Daniel, BRING Recycling Leslie Kochan, DEQ Meg Lynch, Metro Mike Riley, ReSource Jan Whitworth, DEQ
DEQ Technical Assistants Susan Christensen Cathie Davidson Scott Fairley Brian Fuller Shari Harris-Dunning Leslie Kochan Bruce Lumper
The authors particularly wish to thank all of the interviewees from nonprofits, businesses, local governments, state agencies, and educational institutions for their valuable and candid contributions and insights, without with these reports would not have been possible. Interviewees are listed separately.
Jessica Branom-Zwick, Marc Daudon, Peter Erickson, and Christy Shelton of Cascadia Consulting Group contributed to the research and preparation of several background papers supporting development of the Waste Prevention Strategy. Additional staff members assisted with interviews.
Anna Fleder, James Goldstein, and John Stutz of Tellus Institute and David Stitzhal of Full Circle Environmental also contributed to this research project.
In the interest of waste prevention, this background paper is intended for electronic distribution and viewing. If a hard copy is required, please print double-sided on recycled paper.
Oregon Department of Environmental Quality 07-LQ-007

Waste Prevention: State of Oregon Efforts
Executive Summary................................................................................................. 1
1 Introduction and Overview........................................................................... 4 1.1 Project Overview ......................................................................................................... 4 1.2 Waste Prevention Background.................................................................................... 4 1.3 Research Scope and Evaluation Methods .................................................................. 6 1.4 Report Outline ............................................................................................................. 7
2 Oregon’s State Government Waste Prevention Efforts ............................. 8 2.1 Overview and Key Findings......................................................................................... 8 2.2 Waste Prevention Statutes and Policy Direction ......................................................... 9 2.3 DEQ Solid Waste Grants........................................................................................... 10 2.4 2% Recovery Rate Credits ........................................................................................ 10 2.5 DEQ Technical Assistance and Outreach ................................................................. 12 2.6 Resource Efficiency Program.................................................................................... 16 2.7 Packaging Waste Prevention .................................................................................... 17 2.8 NW MaterialSmart Campaign.................................................................................... 18 2.9 Waste Prevention Resource Clearinghouse ............................................................. 19 2.10 Waste Reduction Awareness Program (WRAP) ....................................................... 19 2.11 InnerGreen and Internal Sustainability Efforts........................................................... 20 2.12 Other State of Oregon Efforts.................................................................................... 20
3 DEQ Solid Waste Grants............................................................................. 23 3.1 Key Findings.............................................................................................................. 23 3.2 Overview of DEQ Solid Waste Grants....................................................................... 24 3.3 Waste Prevention Focus ........................................................................................... 27 3.4 Waste Prevention and Reuse Grants by Type .......................................................... 28 3.5 Barriers and Opportunities for Waste Prevention...................................................... 35
4 Next Steps.................................................................................................... 38
Waste Prevention Strategy i Background Paper #3 State of Oregon Efforts December 2006

Appendix A. Sample DEQ Solid Waste Grant Descriptions .............................. 39
Appendix B. State Solid Waste Grants, by Type ................................................ 43
Appendix C. Waste Prevention Interview Contacts ........................................... 49
Figures
Figure 1. Waste Management Hierarchy .................................................................................. 5
Figure 2. Solid Waste Grants by County, 1991-2005..........................................................................25
Figure 3. Solid Waste Grant Dollars by Category, 1991-2005 ............................................................26
Figure 4. Solid Waste Grant Dollars by Category, 1991-1999 and 2000-2005...................................27
Figure 5. Waste Prevention, Reuse, and Home Composting Grant Dollars, 2000-2005....................28
Figure 6. Waste Prevention Grant Dollars by County, 1991-2005 ......................................................29
Figure 7. Reuse Grant Dollars by Category ........................................................................................31
Tables
Table 1. Program Options for 2% Recovery Rate Credits...................................................................11
Table 2. Solid Waste Grant Funding by Activity Type, 1991-2005......................................................26
Table 3. Waste Prevention Grants by Category, 1991-2005 ..............................................................28
Table 4. State Solid Waste Grants, by Type, 1991-2005....................................................................43
Waste Prevention Strategy ii Background Paper #3 State of Oregon Efforts December 2006

Executive Summary
Oregon’s 1995-2005 solid waste management plan identified waste prevention as a high priority and established a vision of Oregon citizens making a value shift from a “throw-away” society to a conservation society by 2005. From 1993 through 2005, however, Oregon’s total waste generation increased 70 percent, and per-capita generation increased 43 percent. DEQ is currently working to develop a statewide Waste Prevention Strategy to help the state meet its goals of stabilizing total and per-capita waste generation. To support development of this strategy, DEQ hired the Cascadia Consulting Group to evaluate previous efforts at waste prevention and to assess the connection between waste prevention and broader environmental benefits.
This background paper focuses on state-level government activities within Oregon. It is intended to provide DEQ, DEQ’s Waste Prevention Strategy Steering Committee, and other interested parties with a common understanding of waste prevention activities that Oregon’s state government is conducting or directly funding. The report summarizes both historic and existing activities and presents barriers and opportunities for continued progress, as described in project evaluation reports, other documentation, and interviews with DEQ staff members, other state-level contacts, and leaders of state-funded waste prevention projects.
State Government Waste Prevention Efforts in Oregon
The State of Oregon has implemented or supported a wide variety of waste prevention activities. Though particular efforts stand out, the overall package appears more ad hoc rather than guided by a master plan or design, although DEQ’s special projects have tended to focus on the non-residential sector. For many efforts, thorough evaluation and documentation of outcomes is insufficient; other efforts show clearer success, but their scope and impact are often limited to a small subset of organizations or communities. DEQ has awarded 65 solid waste grants, totaling more than $1.3 million, for projects intended to have a significant focus on reducing waste generation through prevention, reuse, and onsite composting. Measured outcomes of their overall waste prevention impacts remain elusive, and the distinction between grants for prevention and recovery is not always clear-cut; for example, some grant-funded programs in the “waste prevention and reuse” category also include recycling efforts. Oregon’s strong emphasis on sustainability initiatives offers a valuable opportunity for increased waste prevention efforts, but to date waste prevention has received little explicit emphasis among these sustainability activities. A statewide Waste Prevention Strategy to guide policies and programs will help ensure that future actions are aligned with top priorities. This background paper covers the various state programs designed to foster waste prevention, reuse, and home composting in Oregon, including the following efforts:
State law. Oregon has a strong history of progressive environmental legislation, including waste management and waste prevention, which provides a solid foundation for waste prevention and reuse activities. The statutes place waste prevention above all other methods as the first priority in managing solid waste, followed by reuse. The law also calls for per-capita municipal solid waste generation not to increase after 2005 and total MSW generation not to increase after 2009. Additionally, the 2% recovery rate credit program, established in legislation, provides recognition to local governments that offer waste prevention, reuse, and home composting programs and can help wastesheds meet their mandated recovery goals.
Assistance, funding, and recognition. DEQ provides direct assistance to local governments and others through its regional technical assistance program and its headquarters staff. One of DEQ’s most visible efforts for Oregon wastesheds is the solid waste grants program, which has provided more than $1.3 million for 65 grants in the waste prevention category (including reuse and home composting) since 1991, with the majority of those funds disbursed since the year 2000.
Waste Prevention Strategy 1 Background Paper #3 State of Oregon Efforts December 2006

Research, implementation, and promotion. DEQ has led research efforts to identify and document best practices for waste prevention, such as its Packaging Waste Prevention project that included the development of many case studies, informational resources, and a noteworthy assessment of mail-order packaging options. DEQ has also initiated and evaluated waste prevention activities targeted toward businesses in several communities around the state under the Resource Efficiency Program. In addition, DEQ’s support of the NW MaterialSmart campaign included research on effective strategies for promoting reuse through materials exchanges, promotion of online exchanges, and evaluation of results.
Internal efforts. DEQ’s InnerGreen and sustainability efforts have included efforts related to waste prevention, particular for reducing paper use and reusing office supplies. Other agency sustainability efforts relate to waste prevention, though the 20 agency sustainability plans rarely mention waste prevention directly. DEQ also established a Waste Prevention Resource Clearinghouse to support its waste prevention activities and outreach, though the collection is no longer current.
Other state government efforts. Other State activities with linkages to waste prevention include the Governor’s Global Warming Initiative, several Executive Orders on sustainability, and activities conducted with and across Oregon’s public universities, colleges, and other schools.
DEQ’s Solid Waste Grants and Waste Prevention
Since DEQ changed its evaluative criteria for awarding solid waste grants in 2000, the share of grants distributed to waste prevention, reuse, and home composting projects has increased from 13 percent to 61 percent of grant dollars awarded.
Solid waste grants have funded activities related to “pure” waste prevention (source reduction), reuse, and home composting or onsite management of organic materials. Reuse composes the largest portion of grants in the overall “waste prevention” category, and used building materials and edible food rescue programs represent the largest shares of the reuse subcategory.
Solid waste grants have been distributed throughout the state (in 35 of Oregon’s 36 counties), but western Oregon counties generally have received more grant funding for waste prevention, reuse, and onsite composting activities. This difference reflects the fact that DEQ’s grant process is application-based, and Oregon’s more populous counties, mainly located along the Interstate-5 corridor, have submitted more grant requests.
Few grant-funded programs have conducted thorough evaluations of their outcomes or submitted such results to DEQ. Reuse activities typically provide the most tangible form of waste prevention and accordingly better lend themselves to documentation of their results. For example, tracking pounds of materials sold or distributed for reuse is usually more straightforward than measuring how much waste city residents avoid generating as a result of a public education campaign. Grant-funded programs facilitate the reuse of thousands of tons of materials each year; education and outreach efforts may be making an impact, but Oregon’s per-capita waste generation continues to rise.
Waste Prevention Strategy 2 Background Paper #3 State of Oregon Efforts December 2006

Barriers and Opportunities for Waste Prevention in Oregon
Reported barriers that limit the success or more widespread adoption of waste prevention and reuse practices include resource constraints, negative perceptions, conflation with recycling, delayed or uncertain benefits, and imbalances between supply and demand for reuse markets. The State could use assistance, funding, and incentive strategies to help encourage expanded waste prevention and reuse activities throughout Oregon.
This background paper contains additional details on Oregon’s existing waste prevention and reuse activities, including barriers and opportunities reported over the course of many interviews with DEQ’s regional technical assistance staff members and with leaders of solid waste grant-funded waste prevention activities.
Waste Prevention Strategy 3 Background Paper #3 State of Oregon Efforts December 2006

1 Introduction and Overview
1.1 Project Overview
To support development of its statewide Waste Prevention Strategy, Oregon’s Department of Environmental Quality conducted or commissioned background research on existing waste prevention and reuse efforts and related topics. In 2006, DEQ hired a team led by Cascadia Consulting Group to conduct some of this background research, and department staff conducted other research efforts in-house. Eight background papers summarize research findings on the following topics:
1. Waste Generation (DEQ);
2. Environmental Considerations – The benefits of waste prevention and reuse as an environmental strategy and in the context of sustainability (Cascadia);
3. State of Oregon Efforts – State government waste prevention programs in Oregon, including but not limited to DEQ’s solid waste grants (Cascadia);
4. Local Government Efforts – Local government waste prevention programs in Oregon, particularly those covered in DEQ’s 2% recovery rate credit program (Cascadia);
5. Nongovernmental Organizations and Infrastructure – Nongovernmental organizations providing reuse and waste prevention infrastructure and services in Oregon, with an emphasis on food, building materials, electronics, and thrift stores (Cascadia);
6. Business (DEQ);
7. Other States and International Efforts – Waste prevention and reuse efforts outside of Oregon, including examples from around the U.S. and the world (Tellus Institute and Cascadia); and
8. Product Stewardship (DEQ).
This report, Background Paper #3, focuses on state-level government efforts within Oregon. Together, these eight reports compose the research and information-gathering phases designed to inform the development of Oregon’s strategy for waste prevention. This information has been developed to help the Department of Environmental Quality, DEQ’s Waste Prevention Strategy Steering Committee, external stakeholders, and agency managers to develop a statewide Waste Prevention Strategy. The Department will implement the Waste Prevention Strategy in 2007 and beyond.
1.2 Waste Prevention Background
Waste prevention sits at the top of the waste management hierarchy, followed by reuse, recycling, composting, energy recovery, and landfilling. Oregon’s 1995-2005 solid waste management plan identified waste prevention as a high priority. It also established a vision of Oregon citizens making a value shift from a “throw-away” society to a conservation society by 2005. Figure 1 illustrates Oregon’s waste management hierarchy. From 1993 through 2005, however, Oregon’s total solid waste generation increased 70 percent and per-capita generation increased 43 percent.
Waste Prevention Strategy 4 Background Paper #3 State of Oregon Efforts December 2006

DEQ’s statewide Waste Prevention Strategy will be designed to help Oregon meet its goals, established in 2001, to stabilize total and per-capita waste generation. Waste generation is defined as the sum of materials recovered (e.g., through recycling) and materials disposed (e.g., in a landfill). Many of DEQ’s past solid waste efforts have focused on recycling, while waste prevention and reuse, the preferred objectives in the waste management hierarchy, typically have received relatively less emphasis.
Stronger waste prevention programs are generally found in more developed, populous, western counties (e.g., the Metro region, Lane, Marion, Deschutes). Many excellent model programs exist, but they may not translate well to areas with fewer resources or differing levels of public awareness and concern. Waste prevention efforts are typically weaker in more rural areas, where local governments are already struggling to meet recycling requirements or have other priorities for their limited staff and financial resources, such as public health or road maintenance. At the same time, flagging economies in rural areas can contribute to the need and demand for reuse programs. For example, salvaged building materials and electronics reuse can provide needed resources at lower cost than new products. Edible food rescue prevents waste while reducing hunger and increasing food security in economically depressed areas. Such reuse efforts are often viewed as more tangible, effective, and successful than general waste prevention programs.
Figure 1. Waste Management Hierarchy
Waste Prevention
Reuse & Home Composting
Recycling
Energy Recovery
Disposal
Definitions
In this report, the broad category of waste prevention is defined as diminishing the amount of solid waste generated that is collected for recovery or for final disposal in landfills or waste incinerators. DEQ categorizes general waste prevention into three main types:
“Pure” waste prevention (also referred to in this report as source reduction) diminishes the amount of solid waste generated or resources used, without increasing toxicity, through changes in the design, manufacture, purchase, or use of products or packaging. Examples include buying and using less/fewer materials or products; purchasing and using durable, reusable materials instead of disposables; and improving packaging efficiency.
Reuse extends the life of a product or material by repairing, modifying, or finding new uses for it, in its original or a similar form – rather than changing its identity through recycling and making new products. Reuse activities include typical thrift store operations for used clothing and household goods as well as edible food rescue, used building materials, computer reuse, and other categories.
Home composting is defined broadly to mean managing organic materials onsite at homes, businesses, and institutions through composting, grasscycling, worm bins, and mobile chipping operations, which facilitate onsite management of yard debris. (Stockpiling and burning organics are not included as waste prevention. Curbside collection and centralized composting of organic materials are counted as recovery.)
Waste Prevention Strategy 5 Background Paper #3 State of Oregon Efforts December 2006
Jurisdictions within and beyond Oregon may use different definitions of waste reduction. DEQ defines waste reduction to mean any effort that diverts materials from disposal. Thus, waste reduction encompasses both waste prevention and recovery, which in turn includes recycling and off-site composting. This approach is consistent with the U.S. Environmental Protection Agency’s definition. Confusion may arise, however, because some other states and programs consider waste reduction to mean reducing the amount or toxicity of waste generated or reusing materials. In Oregon, local governments and solid waste program operators can be similarly inconsistent on this matter, contributing to the ambiguity. For the purposes of this report and the Waste Prevention Strategy, however, "waste reduction" means disposal avoidance and includes both waste prevention and recovery.
1.3 Research Scope and Evaluation Methods
This report focuses on State efforts to prevent waste, including solid waste grants, DEQ technical assistance, and other programs. It is intended to provide DEQ and interested parties with a common understanding of what the State has accomplished to date through both DEQ’s waste prevention work, including solid waste grants and many other activities, as well as other State-level efforts within Oregon. It is also designed to describe reported barriers and opportunities for continued progress, as identified by those active in the field.
Cascadia researched state government activities and compiled information through telephone interviews and personal communications with DEQ staff, contacts at other state agencies, leaders of grant-funded programs of local governments and nongovernmental organizations, existing program reports, websites and other sources, including solid waste grant reports and 2% recovery rate credit applications. The research project developed a database of more than 460 potentially relevant efforts in Oregon involving state government, local governments, nongovernmental organizations, and the private sector. Solid waste grants funded 187 activities, though some programs received multiple grants. We worked with DEQ and obtained input from Metro staff to identify a set of interviewees intended to target leading programs around the state. This report draws on existing data and interviews from a sampling of relevant organizations, programs, and activities, but it is not a comprehensive study.
Cascadia compiled information from existing reports as well as interviews, internet research, and other personal communication with DEQ, other state programs, Metro, and various grant recipients. Existing reports that provided information for this study included:
Solid waste grant reports from local governments, nonprofits, and other organizations (187 grants);
2% recovery rate credit applications from local governments and approval letters granted by DEQ (153 programs);
Business Packaging Waste Prevention Project (2002-2005): Project Evaluation Report (Oregon Department of Environmental Quality, February 2006);
2004 Oregon Material Recovery and Waste Generation Rates Report (Oregon Department of Environmental Quality, March 2006);
Oregon Strategy for Greenhouse Gas Reductions (Governor’s Advisory Group on Global Warming, December 2004);
NW MaterialSmart Campaign Evaluation Report (Oregon Department of Environmental Quality, prepared by David Allaway, August 2004);
Waste Prevention Strategy 6 Background Paper #3 State of Oregon Efforts December 2006

Oregon State Agency Sustainability Report: A Summary of State Sustainability Projects Initiated May 2000 through December 2002 (Oregon Economic and Community Development Department, prepared by Lynn Beaton, April 2003);
Waste Prevention Resource Clearinghouse Development Plan (Oregon Department of Environmental Quality, prepared by David Allaway, July 2001); and
Final Report: Oregon Resource Efficiency Program: Evaluation of Resource Efficiency Programs in Cannon Beach, Corvallis and Milwaukie, July 1996 – June 1998 (Oregon Department of Environmental Quality, prepared by Harding Lawson Associates, December 1998).
This assessment of Oregon’s state-level efforts on waste prevention and reuse provides an overview of a number of existing activities but is limited by available existing data. Waste prevention is often difficult to measure and quantify, and evaluation efforts for existing activities, such as those funded by many state grants, are frequently limited or absent. More quantitative data are generally available on material reuse than for pure waste prevention, though tracking and reporting remain incomplete. Much of the quantitative data cover activity measures, such as numbers of brochures distributed or event attendees, rather than baseline data and ongoing measurement of outcomes in terms of desired behavior change and waste prevention. Several of DEQ’s evaluation reports – for the Resource Efficiency Program, NW Materialsmart, and Packaging Waste Prevention project – include measurements of outcomes in their findings. These examples provide a notable exception, however, within the broader realm of waste prevention efforts in Oregon, many of which lack formal evaluation of their actual outcomes.
Conducting comprehensive, independent evaluations of even a subset of the 187 solid waste grants as well as the many other waste prevention activities underway through DEQ and elsewhere in Oregon’s state government is beyond the scope of this effort. Accordingly, we necessarily relied on self-reported data from interviews with program leaders, grant reports that funding recipients provided to DEQ, any existing evaluation reports, and other readily available data sources. As a result, many findings are more qualitative than quantitative, though our interviews provided valuable input on which programs appear more active and effective and which may offer potential models for further reuse and waste prevention efforts in Oregon.
1.4 Report Outline
This report on state-level activities to foster waste prevention and reuse in Oregon is organized into four sections:
1. Introduction and Overview
2. Oregon’s State Government Waste Prevention Efforts
3. DEQ Solid Waste Grants
4. Next Steps
Waste Prevention Strategy 7 Background Paper #3 State of Oregon Efforts December 2006

2 Oregon’s State Government Waste Prevention Efforts
2.1 Overview and Key Findings
In Oregon, strong legislative backing guides state-level waste prevention efforts through clearly defined waste generation goals. While the State’s waste prevention efforts include a wide variety of different activities, the overall package appears more ad hoc rather than guided by a master plan or design, although DEQ’s special projects have tended to focus on the non-residential sector. Technical assistance and DEQ programs like the Resource Efficiency Program and the Packaging Waste Prevention study appear most effective, but their scopes are limited. Solid waste grants have a mixed record on waste prevention, with only a few having measured outcomes. Other programs appear to have had less impact, though in-house efforts have improved some agency operations. Oregon’s strong emphasis on sustainability initiatives offers a valuable opportunity for increased waste prevention efforts, but to date waste prevention has not received significant emphasis among these sustainability activities. A statewide Waste Prevention Strategy to guide future policies and actions will help ensure that actions are aligned with top priorities. This chapter covers the various state programs designed to foster waste prevention, reuse, and home composting in Oregon, including the following efforts:
Waste prevention statutes and policy direction;
DEQ solid waste grants;
2% recovery rate credits;
DEQ technical assistance and outreach;
Resource Efficiency Program (REP);
Packaging Waste Prevention study;
NW MaterialSmart campaign;
Waste Prevention Resource Clearinghouse;
Waste Reduction Awareness Program (WRAP);
InnerGreen and other internal state government sustainability efforts;
Other State of Oregon efforts.
Waste Prevention Strategy 8 Background Paper #3 State of Oregon Efforts December 2006

2.2 Waste Prevention Statutes and Policy Direction
Oregon has passed a set of laws and regulations that provide a mandate for its strong waste prevention activities. Dating back to its 1971 bottle bill, land use laws, and other environmental bills of the 1960s and 1970s, Oregon has a long history of progressive environmental legislation, in the solid waste arena and beyond. In 2001, the state legislature adopted HB 3744, amending solid waste management statutes (ORS 459A) to reflect broader environmental harms from waste generation and to mandate waste prevention goals for the state. Oregon statutes place waste prevention above all other methods as the first priority in managing solid waste, followed by reuse, recycling, composting, energy recovery, and safe disposal. The law also sets goals that per-capita municipal solid waste generation not increase after 2005 and that total municipal solid waste generation not increase after 2009.
To achieve these goals, DEQ is required to provide technical assistance to local governments on solid waste reduction and reuse (459A.030). Statutes also establish a program by which wastesheds that implement specific waste prevention programs can receive 2% credits on their recovery rates (459A.010), described further in a subsequent section as well as in a separate background paper on local government efforts. Overall, Oregon’s progressive legislation provides a solid framework of support for waste prevention and reuse activities, though it could go further on provisions for implementation and enforcement as well as a goal to reduce future generation after 2009.
In 1994, Oregon’s Environmental Quality Commission adopted a comprehensive statewide plan for solid waste management over the next decade. This State Integrated Resource and Solid Waste Management Plan clearly specifies reducing the generation of solid waste as a top priority. The plan envisioned Oregonians transforming from a “throw-away” society to become a conservation society by 2005. This forward-looking solid waste plan has shaped DEQ’s focus on waste prevention since its adoption and helped set the stage for the State’s current effort to develop a Waste Prevention Strategy for Oregon.
More recently, the Department established an advisory group composed of external stakeholders to provide advice on solid waste policy. In 2000, the DEQ Waste Policy Leadership Group issued a set of recommendations regarding future solid waste management policies and program directions. The group called for a legislative proposal establishing aggressive goals for both waste prevention and recovery, which was successfully passed the following year. It also offered recommendations regarding persistent bioaccumulative toxics (PBTs) and product stewardship. The Leadership Group called on DEQ to increase its waste prevention efforts and target the commercial sector, toxicity and PBTs, greenhouse gas emissions, and large waste sources. It recommended that DEQ act as an information provider, encourage technology transfer and capacity building, monitor and evaluate progress in waste prevention, and provide statewide leadership. The recommendations from this stakeholder group have played an important role in guiding DEQ’s waste prevention efforts and underscore the need for the statewide Waste Prevention Strategy, now under development. For more than a decade, starting with the adoption of Oregon’s waste management plan in 1994, external policy directives have charged DEQ with focusing its work at the peak of the waste management hierarchy, prioritizing reductions in the generation of solid waste above recycling and disposal efforts.
Waste Prevention Strategy 9 Background Paper #3 State of Oregon Efforts December 2006

2.3 DEQ Solid Waste Grants
Since 1991, DEQ has provided solid waste grant funding to local governments around Oregon. Local governments can run the grant-funded programs themselves or can contract out for implementation. Between 1991 and 2005 DEQ funded 187 grants totaling $3.7 million dollars to all counties in Oregon except Gilliam.1 These grants can be generally be classified into three main categories, although exact classification is sometimes difficult as some grants cover both waste prevention and recovery:
Solid waste management plans – 28 grants;
Recovery (recycling and centralized composting) – 94 grants; and
Waste prevention grants, including “pure” waste prevention (source reduction), reuse, and onsite organics management – 65 grants. 2
DEQ solid waste grants fund a wide variety of project types and cover many different types of expenses. While some activities appear more successful than others, few projects have tracked and presented quantitative evaluation data documenting their waste prevention results. Chapter 3 of this report focuses on DEQ’s solid waste grants in greater detail.
2.4 2% Recovery Rate Credits
To recognize local governments that offer significant waste prevention and reuse programs and to provide wastesheds with options for meeting their recovery goals, state law under ORS 459A allows local governments to obtain 2% credits on their recovery rates. By applying to DEQ and obtaining department approval, a county can raise its reported “total recovery rate” above the rate calculated using actual tons recovered by implementing programs for waste prevention (source reduction), reuse, or home composting. Counties can receive a 2% credit for each category of these three categories, for up to six percent total credits.
To qualify for recognition, each 2% credit program must include:
An education or promotion campaign; and
At least two additional elements chosen from a list of four to ten options, depending on the 2% credit category, as detailed in the following table.
1 An additional $1 million was provided through 2004 for 55 solid waste grants for HHW-related activities and tire clean-ups and collection activities.
2 Chapter 3 explains in more detail the difficulty of clearly segregating grant funding devoted to waste prevention efforts from various recovery activities.
Waste Prevention Strategy 10 Background Paper #3 State of Oregon Efforts December 2006

Table 1. Program Options for 2% Recovery Rate Credits (in addition to mandatory education/promotion elements)
Waste Prevention Reuse Home Composting
Reduce the wasteshed annual per-capita waste generation by 2% each year
Conduct a waste prevention media promotion campaign targeted at residential generators
Expand the education program in primary and secondary schools to include waste prevention and reuse
Household hazardous waste (HHW) prevention education program
Local governments will conduct waste prevention assessments of their operations, or provide waste prevention assessments for businesses and institutions and document any waste prevention measures implemented
Conduct a material-specific waste prevention campaign for businesses throughout the wasteshed
Implement a Resource Efficiency Model City program
Material-specific waste prevention campaign focused on a toxic or energy-intensive material
Buy recycled-content products
Local government green building
Operate construction and demolition debris salvage programs with depots
Promote reuse programs offered by local resale businesses, thrift stores and equipment vendors, such as computer and photocopier refurbishers, to the public and businesses
Identify and promote local businesses that will take back white goods for refurbishing and resale to the public;
Develop and promote use of waste exchange programs for the public and private sectors
Site accommodation for recovery of reusable material at transfer stations and landfills
Sidewalk pickup or community fair program in cities over 4,000 population in the wasteshed
A program to encourage leaving grass clippings generated by lawn mowing onsite rather than bagging the clippings for disposal or composting;
A composting program for local schools;
An increase in availability of compost bins for residents
Another program increasing a household’s ability to manage yard trimmings or food wastes
Waste Prevention Strategy 11 Background Paper #3 State of Oregon Efforts December 2006

About half of the counties in Oregon offer approved 2% credit programs. These waste prevention activities are primarily located in western Oregon, mainly along the more populous and urbanized Interstate-5 corridor. Most 2% credit activities meet the State’s basic program requirements through such efforts as educational brochures and school programs. Many of these efforts appear fairly “standard,” while a handful of programs go further to offer more innovative programs. It is the hope that these innovative activities are also more effective than more generic educational efforts, though evaluative data are generally lacking to verify this impression. The background paper on local government efforts provides more information on waste prevention, reuse, and home composting activities at the local government level, including programs recognized with 2% recovery rate credits.
2.5 DEQ Technical Assistance and Outreach
DEQ has a mandate under ORS 459A.030 to provide technical assistance to local government entities regarding solid waste reduction, reuse, and recycling programs, with special emphasis on assisting rural and remote counties. This technical assistance and outreach is another tool to encourage waste prevention among local governments and aid counties in meeting their waste generation goals.
Regional Technical Assistance
Oregon statutes (ORS 459A.030) mandate DEQ to provide technical assistance with a special emphasis on assisting rural and remote counties. Seven regional Technical Assistants (TAs) work in three regions around the state to provide solid waste assistance to all 36 counties in Oregon:
Northwest region: six counties in northwestern Oregon, including the three-county Metro area (one Technical Assistant);
Eastern region: 18 counties composing central and eastern Oregon (four TAs); and
Western region: 12 counties in western Oregon, along the coast and I-5 corridor (two TAs).
DEQ’s regional technical assistance staff members provide valuable assistance to local governments on a range of solid waste topics, including fostering waste prevention and aiding counties in meeting their waste recovery goals. Their work is generally well received, but the seven TAs for the state are spread too thin, both geographically and in terms of the substantive issues they address. Waste prevention is only one among many solid waste concerns – including recycling, composting, household hazardous waste, facility permitting, inspections, and complaint response – that the TAs seek to cover. With more staff resources, the TAs could place more emphasis on waste prevention and work directly to assist local governments in developing and implementing their own effective programs (or adopting appropriate models from other locations).
Reported Barriers to Waste Prevention
We conducted extensive interviews with all seven DEQ regional technical assistants (TAs). In the interviews, the TAs identified a number of barriers to waste prevention and reuse in counties throughout Oregon. These barriers include the following concerns:
Resource constraints and competing priorities. Resource limitations in terms of staff, funding, and infrastructure all limit waste prevention and reuse activities. DEQ’s technical assistants have large portfolios and geographic areas to cover, so they cannot devote in-depth attention to any one issue or local area, for waste prevention or otherwise. Local government staff members also have competing demands on their time and resources. In some counties, almost no staff resources are assigned to solid waste management (let alone
Waste Prevention Strategy 12 Background Paper #3 State of Oregon Efforts December 2006
waste prevention), as most roles are contracted out to private haulers. In the face of these limitations, programs seen as non-essential, such as waste prevention, may be neglected unless staff have a clear mandate from leadership or are personally enthusiastic about the effort. Limited staff resources and funding shortfalls often go hand in hand, though some public entities have more funds available but are constrained in their hiring and staffing. Infrastructure limitations, related to insufficient funding for equipment and capital improvements as well as siting problems, can also hinder programs, particularly such reuse activities as building material salvage and resale; these efforts require significant space for their operations and may be viewed by neighbors as an undesirable land use, arousing NIMBY sentiments.
Negative perceptions. The technical assistants reported that some local governments see waste prevention as too vague, too difficult to accomplish, or ineffective, particularly in comparison with more tangible, familiar, and straightforward efforts like recycling.
Confusion or lack of understanding. In general, waste prevention is frequently confused or conflated with recycling or other waste reduction efforts. Although government staff members may understand the distinctions between waste prevention and waste reduction, they often combine waste prevention with recycling, reuse, composting, and other waste management topics in their communications. In such groupings, waste prevention often receives short shrift in relation to efforts like recycling. In some cases, local staff may identify their activities as waste prevention and classify their programs accordingly, when they are in fact primarily waste recovery efforts.
Delayed or uncertain benefits. Waste prevention may entail higher upfront costs, while savings accrue over longer time periods. Organizations may need to invest in different equipment or in creating new, less wasteful processes. For example, buying a dishwasher and reusable food service items is more expensive initially than using disposables, though it can pay off in the longer term, particularly when other costs, such as waste disposal, are included in the benefit-cost analysis. Quantifying the potential benefits of waste prevention programs is often difficult because it involves measuring something that is no longer present or will not occur, rather than a direct material flow, such as quantity of recyclables collected. Insufficient baseline information and lack of control groups make it difficult to measure outcomes of these programs. Reuse is more straightforward to quantify, in terms of pounds collected or reused, though some sectors and organization conduct more thorough tracking than others; tracking the ultimate disposition of materials collected – for reuse, recycling, or disposal – may also be lacking.
Market imbalances for used materials. Reuse programs and organizations require a critical mass of both materials and customers not only to increase the likelihood of successful matches between donors and customers, but also to make the reuse infrastructure of collection, sorting, and redistribution of materials cost-effective. Mismatches between supply and demand for particular materials, with respect to quantity or location, also hinder reuse. For example, the supply of used computers greatly exceeds demand for these low-value products in most parts of Oregon; accordingly, many computers are recycled or disposed rather than reused. In contrast, the need for edible food outstrips supply in many areas, and more food could be salvaged for beneficial use if potential suppliers were willing. Geographic imbalances may also occur, such as the case of used building materials, in which the greatest demand for materials may be located in different geographic locations than those that generate most of the supply. Such imbalances can create logistical challenges and raise transportation costs, particularly for edible food rescue which is both time- and temperature-sensitive, due to its perishable nature.
Waste Prevention Strategy 13 Background Paper #3 State of Oregon Efforts December 2006

Reported Opportunities for Waste Prevention
The technical assistants also identified a number of opportunities for addressing barriers and expanding waste prevention and reuse activities in Oregon, in these three categories: leadership, assistance, and incentives. (Subsequent interviews with leaders of solid waste grant-funded waste prevention activities reinforced a number of these recommendations.)
Leadership. The State could lead by example through reducing waste at the state level in agencies and through state contracts. It could establish waste prevention as a clear State priority and could support regional approaches to waste prevention programs. DEQ could develop and conduct a statewide public education campaign to raise awareness and understanding regarding the activities that constitute waste prevention as well as its benefits. Such a statewide campaign could help increase waste prevention activities in homes and businesses in the same way that recycling campaigns have worked in the past. DEQ and the State of Oregon could also promote product stewardship and packaging changes that would offer consumers better choices and increase manufacturer incentives to prevent waste in their products.
Assistance. Additionally, the State could offer increased and improved assistance and funding for waste prevention. Additional staff and resources would increase DEQ’s capacity to promote waste prevention, offer more technical assistance, and support local governments in planning and implementing programs. DEQ could offer more grants directed specifically at waste prevention and could expedite funding once grants are awarded. DEQ could fund more research and pilot projects to identify what works and present options that local governments can adopt. In light of its resources and ability to look across multiple jurisdictions, DEQ is better positioned than most local governments (particularly outside of the Metro area) to invest in researching and piloting new waste prevention projects. In the past, DEQ projects such as the Packaging Waste Prevention study and the Resource Efficiency Program generated models that local governments could implement relatively easily. DEQ could also take the lead role in facilitating information sharing through networking; a database of waste prevention programs and evaluations; and material resources such as fact sheets, case studies, and other program documents that can be easily adapted to local conditions.
Incentives. The State could foster waste prevention by better aligning incentives with desired environmentally preferable behaviors, products, and materials. Businesses and organizations with tight budgets respond to incentives. They would be more willing to undertake waste prevention activities if they could see demonstrated financial savings or were offered financial or regulatory incentives, such as advantages for early adopters. For example, the State could offer tax credits to support reuse projects and reuse of materials. Higher municipal solid waste and construction and demolition disposal fees would reduce some of the financial barriers to reuse and help encourage source reduction. Other legislation and regulations, such as a disposal ban on electronics or stronger implementation of the law (ORS 459A) that places prevention as the top waste management priority, could also increase waste prevention in Oregon.
Waste Prevention Strategy 14 Background Paper #3 State of Oregon Efforts December 2006

DEQ Headquarters Assistance
DEQ also offers assistance through its headquarters staff, the Solid Waste Program’s website, and its curriculum tools. Some of this assistance is narrowly and intensely focused only on waste prevention and reuse, as one Headquarters staff person’s job is focused on reducing waste generation. The Solid Waste Policy and Program Development office provides technical assistance and outreach on waste prevention issues, including:
Assistance to local governments to help build their capacity to undertake their own waste prevention programs;
Assistance to Technical Assistants and other DEQ staff to help build DEQ’s internal capacity for waste prevention activities;
Education, outreach, and information, such as presentations at business conferences and Master Recycler classes as well as responses to media inquiries; and
Direct technical assistance in response to business inquiries.
DEQ’s website also provides a wide array of information and resources, though navigating its many layers and files can be challenging. Developing user-friendly web resources for particular audiences, such as local governments, businesses, and residents, would help make DEQ’s wealth of resources more accessible and helpful for other potential users. (Please note that DEQ recently reorganized and revamped its website; this section of the background paper was prepared prior to the reorganization, and it is not yet clear if the new website structure addresses the navigational difficulties of the previous site.)
In addition to its online and technical assistance resources, DEQ also developed an educational curriculum that incorporates some waste prevention elements. DEQ’s curriculum for kindergarten through fifth grade, Rethinking Recycling: An Oregon Waste Reduction Curriculum, was first published in 1988 and most recently updated in 2001. The curriculum includes lessons on waste prevention, reuse, and home composting, though recycling and solid waste disposal are its primary topics. Waste prevention-related sample activities in the curriculum include school vermicomposting bins, compost piles, and a no-waste lunch display.
Overall, DEQ possesses fairly extensive information resources; however, these resources are not always readily accessible to potential users. Lack of awareness, user-friendly organization, and dedicated staff resources may hinder the dissemination of waste prevention information to local governments and others outside the Department of Environmental Quality.
Waste Prevention Strategy 15 Background Paper #3 State of Oregon Efforts December 2006

2.6 Resource Efficiency Program
In addition to providing general assistance and outreach to local governments, DEQ has also sponsored several pilot projects and major studies that local governments can learn from and adapt to their own jurisdictions. One such example is the Resource Efficiency Program.3 From 1996 to 2000, DEQ piloted this project to create community-based programs that work with businesses, schools, and public agencies to conserve materials, water, and energy while saving money. The pilot initially took place in three participating communities: Cannon Beach, Corvallis, and Milwaukie. It was later expanded to Deschutes and Yamhill counties. Each participating community hired a Resource Efficiency Coordinator to recruit participants, conduct baseline assessments, make recommendations, provide assistance with implementation, if needed, and track progress.
The concurrent focus on multiple resources (materials, water, and energy) was successful, and materials efficiency generated 50 percent of the financial savings. Smaller participating organizations, on average, implemented a higher percentage of recommendations. Of the 71 entities in the first three communities that joined the program in the first year, 61 percent saved materials, totaling at least 57,000 pounds and generating an estimated $41,000 in net annual savings. Total annual savings for these participants, including water and energy efficiency, were estimated at a net value of $82,000, after accounting for any costs. The Resource Efficiency Program provides an example of how DEQ can pilot a project and create a model that local jurisdictions can adopt and implement. The program contributed to several ongoing business waste prevention programs, including:
GetSmart Resource Efficiency Project (Benton County, DEQ solid waste grant #06201);
SMART business program (Jackson County, grants #06504 and #07301); and
WorkSmart, a project of reSource (Deschutes County, grant #08103).
While the Resource Efficiency Program produced results, it was resource-intensive and difficult to sustain. A primary lesson learned was that the start-up cost is relatively high (estimated at $43,000 to $70,000 per community), and program funding is unlikely to be supported by user fees. Although most participants would like the program to continue in their community, participants are usually unwilling to pay more than a fraction of the program’s cost. As a whole, however, a community might save $50,000 in the first year, $100,000 in the second year, and $150,000 in subsequent years.
The evaluation found that participating organizations were more likely to implement efficiency measures when they could save money, could easily implement recommendations, received diligent follow-up from the Resource Efficiency Coordinator (REC), and had a personal commitment to the environment. Barriers to implementation were staff turnover, competing demands on participants’ time, lack of management support or resistance to change, complacency about environmental responsibility, and the need for capital improvements to implement some recommendations.
Communities wishing to implement a Resource Efficiency Program should first establish a solid and diverse base of support of local sponsors who provide access to participants and contribute time and money. They should also make the Resource Efficiency Coordinator position full-time or be sure other responsibilities do not reduce the staff person’s focus on the program. The coordinator should work with both managers and with the employees who will actually be implementing the efficiency measures and should follow up with participants consistently and regularly.
3 Oregon Resource Efficiency Program: Evaluation of Resource Efficiency Programs in Cannon Beach, Corvallis, and Milwaukie, July 1996 – June 1998.
Waste Prevention Strategy 16 Background Paper #3 State of Oregon Efforts December 2006

If DEQ were to expand or offer future grants for the Resource Efficiency Program, it should develop new technical information, particularly on materials efficiency. DEQ should also consider funding the program for a longer time period (such as three years instead of two) and ensure that the Resource Efficiency Coordinator is at least a three-quarters time position (0.75 FTE). An alternative approach could be to partner with trade and business associations to present short workshops on resource efficiency instead of or in addition to working closely with individual businesses. ReSource in Bend has adopted a similar approach, though the change was recent and does not yet have a significant track record to evaluate.
2.7 Packaging Waste Prevention
Packaging represents an estimated 20 to 30 percent of Oregon’s generated municipal solid waste. To address this sizeable waste source, between 2002 and 2005 DEQ conducted a pilot program to reduce waste and environmental burdens associated with packaging for mail-order businesses.4
The Business Packaging Waste Prevention Project provided technical assistance directly to businesses, including facilitation, research assistance, identification and evaluation of baseline and alternative practices, and design of pilot test projects. The project also developed tools that can be used in the future, including case studies, checklists, best practices, and a lifecycle inventory analysis of 26 different packaging options for mail-order businesses. The project recruited six businesses, four of which made changes, saving at least $994,000 and preventing the generation of 44 to 50 tons of material per year in Oregon alone. The total savings were estimated at nearly 500 tons per year. The lifecycle analysis produced clear answers on the waste prevention benefits of lightweight packaging, particularly bags instead of boxes for shipping non-breakable items from a catalog order-fulfillment center. More follow-up dissemination of the study findings and broader implementation of resulting strategies would expand its waste prevention impact.
The program offers a good model that could be applied to additional companies or other sectors, with the following lessons in mind. First, focus on labor efficiency associated with packaging, or be able to justify additional labor effort. Second, engage packaging suppliers by using the purchasing leverage of the State or of the large business with whom you are working. Third, recognize the seasonal nature of mail-order businesses and the effect of business cycles on the ability to devote staff time to waste prevention. Fourth, businesses that have been environmental leaders in the past may have fewer potential areas for waste prevention, as they have already acted on the most promising opportunities for waste prevention.
The program also revealed that several participants did not understand the environmental preferability of waste prevention and reuse over recycling. Some participants seemed to place such a high value on recyclability, recycled content, or both that they were resistant to making changes to produce waste prevention benefits – even when those changes could reduce garbage and litter as well as impacts from “upstream” activities such as raw materials extraction, manufacturing, and transportation. For example, a paper or plastic bag, even one made from 100% virgin materials, was found to have lower lifecycle burdens, in almost all categories studied, than a comparable cardboard box. This distinction holds true even if the box and void fills contain recycled content, are readily recyclable, or both. More education and promotion may help disseminate the bottom-line results of the lifecycle analysis study: for the options studied, making changes to reduce packaging, even if the remaining packaging is virgin material, typically yields greater environmental benefits than simply increasing recycled content or choosing readily recyclable materials.
4 Business Packaging Waste Prevention Project (2002-2005), Project Evaluation Report, Oregon Department of Environmental Quality, David Allaway, Project Coordinator (February 2006).
Waste Prevention Strategy 17 Background Paper #3 State of Oregon Efforts December 2006

2.8 NW MaterialSmart Campaign
Materials exchanges at the local, statewide, or regional levels can reduce waste generation by increasing reuse. In 2002, a coalition of local governments, DEQ, and other partners worked together to promote materials exchanges to Oregon businesses and citizens. The coalition researched creating a new statewide exchange specifically for Oregon but concluded that effort would not be worth the cost and might, in fact, reduce the number of successful trades by further fragmenting the market for this type of service. Exchanges, especially online exchanges, are most efficient when they achieve a critical mass of users to increase the likelihood of matching buyers with sellers. Instead of creating a new exchange, the coalition created a web portal to the Industrial Materials Exchange (IMEX, a regional site run by King County, Washington) and to several smaller local- and micro-exchanges, such as Oregon SWAP in Central Oregon (managed by reSource), BRING’s materials exchange (BMEX) in Eugene, and Freecycle groups in dozens of communities around the state.
The coalition partners promoted the portal with direct mail, paid and unpaid advertisements, media coverage, and other approaches. IMEX listings from Oregon increased an average of 143 percent above pre-campaign levels, and the actual number of successful trades is estimated to have doubled. Local exchanges also saw more traffic, but the increase due to this campaign as opposed to their own separate campaigns is unclear. One exchange, Supply Our Schools, documented $31,000 worth of trades and estimates that the total value could be double that amount. More concretely, the web portal received nearly 3,500 unique visitors during the course of the campaign from January to November 2002, with spikes after promotional activities. Visitation to the site has continued even after campaign activities ended.
The program evaluation concluded that the materials exchange campaign accomplished its goals, though at a high financial cost that may not justify the level of effort. The evaluation also made several suggestions for next steps. One suggestion was to do more research to identify barriers to exchanges, other than lack of awareness. Potential barriers may include:
The value of potential exchanges does not justify the time or transportation costs;
Potential givers are not willing or able to store surplus materials until a taker can be found;
The need for improvements to existing exchange websites or confusion on how to use them; and
Importantly, existing private exchange services (e.g., eBay and Craigslist) may be more convenient or have a critical mass that makes publicly run exchanges superfluous.
Another suggestion was to attempt to link existing micro-exchanges, so that they can share data and cross-list items. This change would consolidate the market while maintaining a local feel and autonomy to the micro-exchanges, though geographic distances can pose transportation challenges.
In the time elapsed since the conclusion of the NW MaterialSmart campaign in 2002, private exchange services, primarily eBay and Craigslist, have strengthened their hold on the online marketplace. Craigslist in particular has a sizeable “free” area and has become a popular place for exchanging items, particularly in local markets. Public and NGO-sponsored materials exchanges may continue to play a role where they have established customer bases and in niche markets, but there does not appear to be a sufficient unmet need to justify future public investments in starting new materials exchanges. Such resources may be better spent encouraging use of existing services and otherwise promoting reuse.
Waste Prevention Strategy 18 Background Paper #3 State of Oregon Efforts December 2006

2.9 Waste Prevention Resource Clearinghouse
To make information on waste prevention more accessible, in 2001, the Department of Environmental Quality assembled the Waste Prevention Resources Clearinghouse for use by department staff. It was stocked with approximately 200 materials covering various topics.
Resources in the Clearinghouse include:
Reports and documents; Video tapes; and
Brochures, fact sheets, and memoranda;
Organizational contacts and website links;
Solid Waste Policy and Program Development (SWPPD) central files, electronic mail, and other electronic documents; and
A sample of waste prevention-related topics covered in the Clearinghouse include:
Business waste prevention/reuse; Organics management;
Life cycle analyses; Measurement practices; and
Materials exchanges; Frequently Asked Questions (FAQs).
Although the Waste Prevention Resources Clearinghouse was a helpful system, it was not used enough to justify the time and cost of its maintenance. Now that several years have passed since it was last modified, updating it would require a significant investment and would only be justified if its use were expanded, at least within DEQ and particularly beyond department staff. Alternatively, DEQ could focus on disseminating selected resources from the Clearinghouse that support priority messages of its waste prevention program.
2.10 Waste Reduction Awareness Program (WRAP)
In partnership with the Association of Oregon Recyclers, DEQ created the Waste Reduction Awareness Program (WRAP) in 1993 to recognize schools and individuals whose efforts have reduced waste around Oregon. WRAP awards $500 grants in four categories for different types of schools, groups, or individuals. Both waste prevention and recycling activities are eligible for WRAP awards, but most past awards appear to focus on recycling activities. A few sample projects involving waste prevention, reuse, or onsite composting include:
Corridor Elementary School in Eugene established a waste-free lunch program that gave reusable lunch bags and containers to participating students who pledged to pack waste-free lunches (2004 award).
The Students Recycling Used Technology (StRUT) Club at Winston-Dillard School District in Douglas County has collected 44 tons of used computers, monitors, and other electronics since 2001 for reuse and recycling (2003 award). The club refurbished the computers as feasible and sent the rest to Portland for recycling.
Colton Middle School in Molalla (Clackamas County) collected used clothing and accessories for its Clothes Closet, which helped more than 120 families annually (2001 award).
Waste Prevention Strategy 19 Background Paper #3 State of Oregon Efforts December 2006

Bright Beginnings Kindergarten in Hood River touted its “Reuse It!” motto, purchased materials in bulk, reused materials for class projects, and composted food waste onsite (2000 award).
Western View Middle School in Corvallis) switched to reusable cloth towels and reusable plastic lunch trays to cut waste (1999 award).
Overall, the waste prevention impact of the WRAP awards appears limited, especially because most awards recognize recycling efforts, which reduce rather than prevent waste. If waste prevention were given a larger focus, however, the award system could produce more results at individual schools. With more publicity and information-sharing, award-winning activities from leading schools could serve as valuable examples and models for other schools and organizations. The program could also be used to increase waste prevention awareness among students and their families.
2.11 InnerGreen and Internal Sustainability Efforts
The Department of Environmental Quality has led several internal programs focused on reducing its own environmental impacts and those of other agencies and departments within Oregon’s State government. InnerGreen, which ran from 1999 to 2001, was a sustainability effort intended to implement resource efficiency changes in DEQ and spread those practices to other State agencies. The program had six objectives, of which two are relevant to solid waste prevention:
Green Purchasing, which involved both purchasing more environmentally friendly products and implementing an internal web exchange for used office supplies; and
Reducing Virgin Wood Pulp. The goal of this effort was to reduce the purchase of virgin office paper by 50 percent, mainly through purchasing locally produced paper with high post-consumer recycled content. In addition, DEQ also encouraged electronic alternatives and other paper-saving behaviors designed to reduce paper purchases and use.
Currently, DEQ has a Sustainability Team in place. The group has included reducing net paper usage among its goals and is currently tracking DEQ’s paper usage. From fiscal year 1997-1998 to calendar year 2005, DEQ’s per-employee (FTE) purchases of copier/printer paper have decreased at least 20 percent. In this period, DEQ has expanded its distribution of documents using electronic means rather than printed hard copies. A share of this reduction in paper use has been offset as people who used to receive printed materials from DEQ now may print their own.5
A key lesson from these internal programs is that staff interest levels – high or low – correlate directly with program activities, and staff changes can adversely affect continuity of efforts as well as results.
2.12 Other State of Oregon Efforts
The Department of Environmental Quality is not the only state agency involved in waste prevention. The Governor’s office and State higher education institutions have also made efforts. Twenty state agencies have approved sustainability plans in place; few of these sustainability efforts directly reference waste prevention, though sustainability efforts may support waste prevention and vice versa. State initiatives have made some progress on waste prevention, but more follow-through efforts are needed.
5 Personal communication with David Allaway, Oregon Department of Environmental Quality, May through December 2006.
Waste Prevention Strategy 20 Background Paper #3 State of Oregon Efforts December 2006

Governor’s Sustainability Initiative
The Oregon State Agency Sustainability Report from 2003 summarized progress made since the Governor’s Executive Order from the year 2000 (E.O. 00-07) and the passage of the Sustainability Act by the Oregon State Legislature in 2001. Governor Kitzhaber’s goals were to 1) reduce state agencies’ ecological foot print; 2) stimulate healthy business activity; and 3) enrich and enhance local communities. A summary of agency reports on materials efficiency reveals many recycling efforts and a few waste prevention efforts. The most common waste prevention efforts involved paper-saving activities, such as double-sided printing, printing drafts on used paper, and dispensing information electronically. Redistributing surplus furniture and office supplies were also common approaches to waste prevention. Selected projects that went beyond saving paper and reusing surplus materials include:
The Oregon State Fair and Expo Center’s renovation and the Department of Forestry’s construction at its Salem compound involved minimizing deconstruction waste through salvage, recycling, and good planning. These remodeling and construction projects also sought to use durable materials and to use materials efficiently.
The Oregon Health Licensing Agency chose to purchase the computers that they had been leasing instead of buying new computers.
The Department of Transportation and Department of Revenue chose to repair broken items instead of throwing them away and replacing them.
In November 2003, Governor Kulongoski’s signed a new Executive Order outlining his call for “A Sustainable Oregon for the 21st Century” (E.O. 03-03). By June 2004, the State’s Sustainability Board had approved all 20 State Agency Sustainability Plans, and 17 agencies issued statements of progress on their sustainability plans by Fall 2004. The 2003 order does not include sections specific to waste prevention, though it does call for the development of state agency implementation plans intended to move Oregon toward being a more sustainable state.
In 2006, Governor Kulongoski signed a new Executive Order on “Sustainability for the 21st Century” (E.O. 06-02) that continues to emphasize improved performance with respect to sustainability in state government agencies, with particular efforts devoted to procurement; greenhouse gas emissions, energy efficiency, and renewable energy; and management of electronic wastes. Waste prevention and reuse can play a role in meeting the goals of the Executive Order and moving toward sustainable government operations and a more sustainable Oregon.
Governor’s Global Warming Initiative
In 2004, the Governor’s Advisory Group on Global Warming published the Oregon Strategy for Greenhouse Gas Reductions. The category of material use, recovery, and waste disposal was one of seven areas in which the Advisory Group’s Strategy recommended action. Within that category, waste prevention is one of the significant actions recommended for immediate State action. Achieving the waste generation goals listed in existing statutes is estimated to save nearly 5 million metric tons of carbon dioxide-equivalents by 2025. The study found that for materials used and discarded in Oregon in 2015, lifecycle estimates suggest that most of the greenhouse gas pollution occurs during upstream activities, including resource extraction, manufacturing, and transportation. Actions discussed in the materials section of the strategy, however, focused more on changes in downstream disposal – such as recycling, commercial composting, and landfill cover – rather than upstream waste prevention. The study also recommended increasing salvage of reusable building materials. Waste prevention and reuse offer significant opportunities for contributions to achieving Oregon’s goals for reducing greenhouse gases.
Waste Prevention Strategy 21 Background Paper #3 State of Oregon Efforts December 2006

Oregon’s Higher Education System
Oregon public colleges and universities are active in recycling and sustainability. While some waste prevention efforts are underway, they vary greatly across institutions. In 2004, the Oregon University System issued a Sustainability Plan covering its member institutions, seven four-year universities located around the state: Eastern Oregon University in La Grande, Oregon Institute of Technology in Klamath Falls, Oregon State University in Corvallis, Portland State University, Southern Oregon University in Ashland, University of Oregon in Eugene, and Western Oregon University in Monmouth. The OUS Sustainability Plan does not address waste prevention and reuse explicitly, though these activities could contribute to advancing several elements of the plan, such as lifecycle management of computers and reduction of greenhouse gas emissions.
Examples of selected Oregon university programs related to waste prevention and reuse include:
OSU Food Innovation Center’s Process and Packaging Technology program offers technical services in creating food packaging and can help evaluate alternative materials and packaging designed to maintain food quality.
University of Oregon’s Sustainable Supply Chain Management Center (SSCM), in the Lundquist College of Business, currently includes pollution prevention on its research agenda. Its research program is still under development and could expand to include more solid waste prevention and related supply-chain topics (e.g., how extended producer responsibility could affect total waste generation). MBA students have done outreach projects with businesses and may be available to conduct waste prevention research projects.
Portland State University has conducted campus-wide education and awareness campaign on waste prevention and recycling. The university also sponsors PSU Reuses! – an office supply exchange program that is available to student groups, staff, and faculty.
Lane Community College signed the Talloires Declaration, a 10-point action plan on environmental literacy and sustainability. LCC has pledged to create an institutional culture of sustainability, teach environmentally responsible citizenship, and practice institutional ecology, among other efforts. Waste prevention activities can contribute to progress on these broader sustainability goals.
To date, waste prevention efforts have garnered a relatively small amount of attention among Oregon’s multiple initiatives relating to sustainability. The state’s strong emphasis on sustainability within state agencies, the Governor’s office, and higher education, however, offers a significant opportunity for fostering waste prevention in the future. Clearly documenting and communicating the ways in which waste prevention helps cultivate sustainable workplaces and communities could help waste prevention earn increased support and make greater contributions to building a sustainable Oregon.
Waste Prevention Strategy 22 Background Paper #3 State of Oregon Efforts December 2006
3 DEQ Solid Waste Grants
3.1 Key Findings
This section discusses solid waste grants and provides a general assessment of their outcomes. It includes some basic statistics about the types of programs funded and describes grants for waste prevention, reuse, and onsite organics management projects in more detail. It also includes summary findings from interviews with grantees regarding barriers and opportunities for waste prevention and reuse, both by sector (e.g., used building materials) and overall. Key findings from the review of solid waste grants include:
Since 1991, DEQ’s solid waste grant program has funded 187 general solid waste grants totaling $3.7 million dollars and covering a wide variety of activities throughout the state of Oregon.6
Since DEQ added a “waste prevention” focus to its grant program in 2000, the share of grants devoted to waste prevention, reuse, and home composting has increased from 13 percent to 61 percent of grant dollars awarded.7 Waste prevention activities funded by DEQ grants are more prevalent in the more urban counties of western Oregon, primarily along the Interstate-5 corridor.
Reuse represents the largest share of grants in the overall “waste prevention” category, and edible food rescue and used building materials programs are the top recipients of reuse grants. Reuse activities are typically the most tangible form of waste prevention, and these efforts often have better reporting and evaluation than other program types. Typical grant-funded efforts include edible food rescue, building material reuse, and computer reuse.
“Pure” waste prevention represents a smaller share of the grant pool, and relevant projects include business waste prevention, school waste reduction projects with prevention elements, and public education campaigns.
Home composting, or onsite management of organic materials more broadly, composes the smallest share by dollar amount of the waste prevention category from 1991-2005, though it nearly tied with the general waste prevention (source reduction) subcategory for least grant funding. Typical grants related to onsite composting include demonstration sites, bin distribution events, promotion and outreach, and onsite composting projects at schools, grocery stores, and institutions.
6 These numbers do not include waste tire grants that are no longer available and other grants for household hazardous waste (HHW) projects, including a few projects focused on HHW prevention.
7 All analysis of grant projects in this report excludes HHW grants. As discussed further in the chapter, some grants include a mix of waste prevention and recovery activities, so definitively separating the two categories can be problematic. These figures cited herein are based on placing each grant in one category, rather than allowing the classification of a single grant as both waste prevention and recovery.
Waste Prevention Strategy 23 Background Paper #3 State of Oregon Efforts December 2006

The chapter concludes with a summary of interview findings related to waste prevention and reuse activities at the state level and conducted through solid waste grants in Oregon. Based on interviews with grantees and regional DEQ staff responsible for managing grant contracts, key barriers that limit waste prevention and reuse in Oregon include resource constraints, negative perceptions, conflation with recycling, delayed or uncertain benefits, and market imbalances between supply and demand.
3.2 Overview of DEQ Solid Waste Grants
For the past 15 years, DEQ has provided solid waste grant funding to local governments around Oregon for recycling and solid waste prevention projects. While the grants must go, by statute, to local governments, the local government recipients can contract with nonprofits, community groups, schools, businesses, and others to implement the actual programs. The solid waste grants are funded from fees paid for disposal of municipal solid waste and construction and demolition debris.
DEQ solid waste grants fund a variety of projects, including recycling depots; solid waste management plans; organics collection and centralized or onsite composting; household hazardous waste-related planning, education, and facilities; construction and demolition (C&D) material reuse; and public education programs on recycling, composting, waste prevention, and reuse. Within these projects, grants cover many different types of expenses, including salaries and benefits for project personnel (including contractors), publications or promotion costs, equipment (such as balers or compost bins), infrastructure or building costs, and the costs of collection and transport of recyclable or reusable materials.
Waste Prevention Strategy 24 Background Paper #3 State of Oregon Efforts December 2006

Between 1991 and 2005, DEQ funded 187 grants totaling $3.7 million dollars to all counties in Oregon except Gilliam.8 Grants are awarded based on DEQ’s scoring of applications from local governments, and the grants have not been distributed equally around the state. Figure 1 shows solid waste grant dollars received by county from the program’s inception in 1991 through 2005. Appendix B provides a list of the solid waste grants distributed through 2005.
Figure 1. Solid Waste Grants by County, 1991-2005
WheelerJefferson
Deschutes
GilliamSherman
Benton
ColumbiaClatsop
Multnomah
Yamhill
Marion
HoodRiver
Wasco
Lane
Douglas
JosephineCurry
Union
Lake
Klamath
UmatillaWallowa
MorrowTillamookWashington
Clackamas
Baker
Polk
LincolnGrantLinn
Crook
Malheur
HarneyCoos
Jackson
Metro*Metro*
Solid Waste Grant $ Received, 1991-2005
>$200,000
$100,000-200,000
$50,000-100,000
Less than $50,000
* Gilliam Co. received no grants*Average per-county amount for sum of grants for 3 Metro counties
DEQ’s solid waste grants can be classified into three main categories: recycling, solid waste management plans, and waste prevention. It is important to note that some overlap occurs between the waste prevention and recovery categories, as a number of “hybrid” grants include both prevention and recovery elements, such as reuse and recycling. For this analysis, each grant was assigned to a single category, in part because the solid waste grant reports typically shed little light on the question of resource allocation across different topic areas. As part of this research project, the consultant reviewed DEQ’s grant records, which placed all 187 grants into one of three categories: RECY (recycling or recovery), PLAN (solid waste management plan), and WP/R (waste prevention and reuse, defined to include onsite composting). We generally deferred to DEQ’s original category determinations, except where the grant-funded project appeared to focus primarily on onsite composting and organics management or material reuse. Based on the review of grant reports and discussions with DEQ staff, the project team agreed to recategorize five of the recycling/recovery grants as waste prevention and reuse. Overall, the reviewer should recognize that many grants do not fall neatly into a single category; for example, a number of grants classified as waste prevention also contain significant recycling and recovery efforts. Despite these caveats regarding exact figures,
8 An additional $1.1 million was provided through 2005 for 59 solid waste grants for HHW-related activities and waste tire clean-ups and collections. Gilliam County is home to Waste Management’s Columbia Ridge Landfill in Arlington, Oregon’s largest landfill and a significant source of economic activity in the rural county.
Waste Prevention Strategy 25 Background Paper #3 State of Oregon Efforts December 2006

some clear trends emerged regarding DEQ’s allocation of grant resources for waste prevention activities before and after the year 2000.
The general “waste prevention” category includes pure waste prevention (source reduction), reuse, and home composting, or more broadly, onsite management of organic materials. Between 1991 and 2005, most grant money was used for recovery, including recycling and centralized composting (42 percent), followed by the combined waste prevention categories (35 percent); solid waste planning contributed an additional 23 percent, as shown in Figure 2.
Figure 2. Solid Waste Grant Dollars by Category, 1991-2005
All Years, 1991-2005
Recovery42%
Reuse21%
HomeComposting
7%
WastePrevention
7%
Planning23%
Table 2. Solid Waste Grant Funding by Activity Type, 1991-2005
Grant Type # Total Minimum Maximum Median
Planning 28 $870,139 $9,000 $80,000 $25,000
Recovery 94 $1,562,422 $1,134 $75,000 $15,000
Waste Prevention, Reuse, and Home Composting
65 $1,310,436 $2,400 $44,309 $20,000
TOTAL 187 $3,742,997 $1,134 $80,000 $18,800
Waste Prevention Strategy 26 Background Paper #3 State of Oregon Efforts December 2006
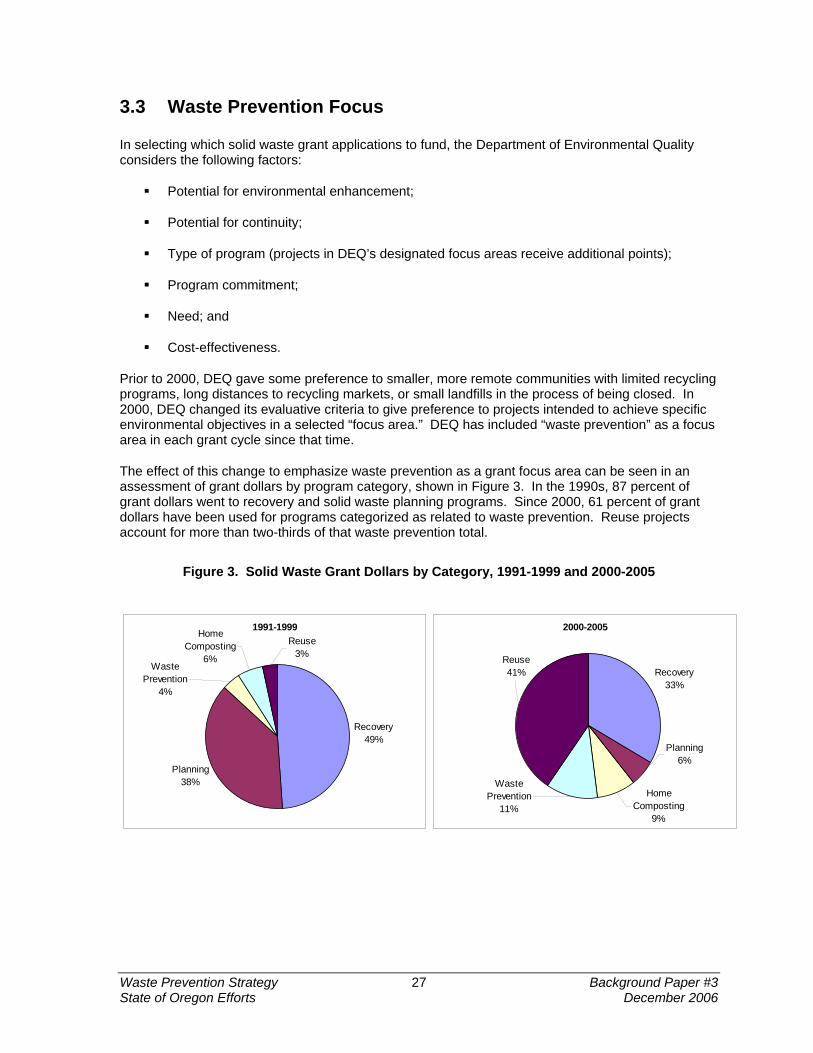
3.3 Waste Prevention Focus
In selecting which solid waste grant applications to fund, the Department of Environmental Quality considers the following factors:
Potential for environmental enhancement;
Potential for continuity;
Type of program (projects in DEQ’s designated focus areas receive additional points);
Program commitment;
Need; and
Cost-effectiveness.
Prior to 2000, DEQ gave some preference to smaller, more remote communities with limited recycling programs, long distances to recycling markets, or small landfills in the process of being closed. In 2000, DEQ changed its evaluative criteria to give preference to projects intended to achieve specific environmental objectives in a selected “focus area.” DEQ has included “waste prevention” as a focus area in each grant cycle since that time.
The effect of this change to emphasize waste prevention as a grant focus area can be seen in an assessment of grant dollars by program category, shown in Figure 3. In the 1990s, 87 percent of grant dollars went to recovery and solid waste planning programs. Since 2000, 61 percent of grant dollars have been used for programs categorized as related to waste prevention. Reuse projects account for more than two-thirds of that waste prevention total.
Figure 3. Solid Waste Grant Dollars by Category, 1991-1999 and 2000-2005
1991-1999
Recovery49%
Planning38%
Reuse3%
Waste Prevention
4%
Home Composting
6%
2000-2005
Recovery33%
Planning6%
Waste Prevention
11%Home
Composting9%
Reuse41%
Waste Prevention Strategy 27 Background Paper #3 State of Oregon Efforts December 2006

3.4 Waste Prevention and Reuse Grants by Type
Of the 187 solid waste grants that DEQ awarded between 1991 and 2005, 65 grants involved waste prevention, including source reduction, reuse, and onsite organics management, as detailed in Table 3. The following section covers each category in more detail with a brief description of the category, overview of key issues facing programs in that category, and examples of noteworthy grants.
Table 3. Waste Prevention Grants by Category, 1991-2005
Type # Total Minimum Maximum Median
Waste Prevention 13 $271,842 $5,000 $44,309 $15,314
Reuse 33 $771,349 $3,515 $41,070 $24,000
Home Composting 19 $267,245 $2,400 $30,000 $12,102
TOTAL 65 $1,310,436 $2,400 $44,309 $20,000
As shown above, starting in 2000, the focus of DEQ’s solid waste grants shifted to the broad category of “waste prevention,” or reducing waste generation. Of the solid waste grant dollars directed toward reducing waste generation since 2000, two-thirds of those funds went to promote or increase reuse, while less than 20 percent of those funds were used for grants categorized as pure waste prevention, as shown in Figure 4.
Figure 4. Waste Prevention, Reuse, and Home Composting Grant Dollars, 2000-2005
2000-2005
Home Composting
14%
Waste Prevention
19%
Reuse67%
Waste Prevention Strategy 28 Background Paper #3 State of Oregon Efforts December 2006

Solid waste grant dollars for waste prevention are not spread evenly around the state. Counties along or near the Interstate-5 corridor have received the most dollars, consistent with the fact that they submitted more applications for grant funding. The top recipient counties were Lane ($219,000), Jackson ($186,000), and Deschutes ($178,000) counties, with the three Metro counties (Clackamas, Multnomah, and Washington) in fourth place with an average of $96,000 per county. Many counties in central and eastern Oregon have received no waste prevention grants at all, as shown in Figure 5.
Figure 5. Waste Prevention Grant Dollars by County, 1991-2005
WheelerJefferson
Deschutes
GilliamSherman
Benton
ColumbiaClatsop
Multnomah
Yamhill
Marion
HoodRiver
Wasco
Lane
Douglas
JosephineCurry
Union
Lake
Klamath
UmatillaWallowa
MorrowTillamookWashington
Clackamas
Baker
Polk
LincolnGrantLinn
Crook
Malheur
HarneyCoos
Jackson
Metro*
WheelerJefferson
Deschutes
GilliamSherman
Benton
ColumbiaClatsop
Multnomah
Yamhill
Marion
HoodRiver
Wasco
Lane
Douglas
JosephineCurry
Union
Lake
Klamath
UmatillaWallowa
MorrowTillamookWashington
Clackamas
Baker
Polk
LincolnGrantLinn
Crook
Malheur
HarneyCoos
Jackson
Metro*Metro*
Waste Prevention Grant $ Received, 1991-2005
>$50,000
$5,000-50,000
No WP grants
*Average per-county amount for sum of grants for 3 Metro counties
Waste Prevention Grant $ Received, 1991-2005
>$50,000
$5,000-50,000
No WP grants
*Average per-county amount for sum of grants for 3 Metro counties
65 grants for waste prevention
Waste Prevention (Source Reduction) Grants
Although waste prevention is one of Oregon’s state goals established in statute, “pure” waste prevention itself accounted for only 19 percent of waste prevention, reuse, and onsite organics management grant dollars awarded between 2000 and 2005. Since the start of the solid waste grants in 1991, DEQ has funded 13 grants categorized as waste prevention (source reduction), for a total of $271,842. These grants have supported such programs as:
Business waste prevention projects, including business waste prevention videos, commercial and institutional waste audits, and business outreach and technical assistance for waste prevention and reducing resource use. (DEQ’s 1996-2000 Resource Efficiency Program helped initiate several local efforts to foster waste prevention at area businesses that were subsequently funded through the solid waste grant program.) However, while these projects have been classified as “waste prevention” for the sake of this report, they often have placed equal if not greater emphasis on recovery as well as energy and water conservation.
School waste reduction projects, including waste prevention elements such as purchasing a dishwasher and reusable food service items for a school cafeteria.
Waste Prevention Strategy 29 Background Paper #3 State of Oregon Efforts December 2006

Waste prevention for county government facilities.
Public education campaigns on waste prevention, including such activities as an award-winning video on home waste prevention, home waste prevention audits, a junk mail reduction campaign, and support for hiring education staff members. (Note that some of these waste prevention education campaigns also included educational elements on reuse and recycling, and the relative distribution of effort between prevention and recycling is unknown.)
Pure waste prevention grants have yielded mixed results. Some capital projects, such as the purchase of a school dishwasher for reusable lunch trays, produced measurable savings. For business outreach programs, waste prevention was often only one among several targeted activities. Recycling and other resource conservation activities, such as energy efficiency, received as much or more attention. While these programs produced some documented waste prevention results, they were difficult to measure and sustain funding and support for over time. Despite the benefits to participating businesses, private companies have generally not been willing to support the cost of these assistance programs. Other programs, namely public education campaigns, may have an impact but are very difficult to measure, as behavior change may accrue over long periods of time and may not be the result of a single promotion.
Overall, pure waste prevention represents a small fraction of the grants, and evaluation is often lacking. In the future, DEQ could pilot programs, evaluate their results, and seek to replicate successes around Oregon. The Resource Efficiency Program provides one example of such an effort, though it proved resource-intensive and difficult to sustain over time, despite the benefits it provided in the communities it served.
Reuse Grants
Between 1991 and 2005, DEQ funded 33 reuse grants totaling $771,349 – constituting well over half (59 percent) of all grant dollars used for waste prevention activities. The two largest categories, by dollar amount, of reuse grants between 2000 and 2005 were edible food rescue (39 percent) and reusable building materials (32 percent). Electronics was the third major category, with 24 percent of the reuse grant funds, as shown in Figure 6.9 Other reuse grants account for about 5 percent of the reuse category, including materials exchanges, material reuse for schools and artists, and reuse centers that include a broad array of materials.
9 Although thrift stores make an important contribution to reuse in Oregon, general thrift store operations typically did not apply for solid waste grants through their local governments. Thrift store activities are included in a separate background paper on nongovernmental infrastructure for reuse and waste prevention.
Waste Prevention Strategy 30 Background Paper #3 State of Oregon Efforts December 2006

Figure 6. Reuse Grant Dollars by Category
Reuse Categories, 2000-2005
Food Rescue39%
Electronics24%
Other5%
Building Materials
32%
Grants in the reuse sector provided support for:
Edible food rescue projects, typically run by nonprofit organizations; grant funding was often used for such efforts as purchasing freezer or refrigeration capacity for food storage.
Used building material stores, usually run by nongovernmental organizations; grants helped fund the purchase of trailers, equipment, and transportation and efforts to increase deconstruction and salvage through outreach and deconstruction pilot projects.
Collection and refurbishing of computers for reuse through sale or donation; NGOs lead many of these reuse activities, though many more computers are recycled than resold or otherwise reused.
Other projects, including a campus cleanup program in which furniture from students moving out was collected for later reuse; materials exchanges for schools, artists, and the public (both online exchanges and stores); and a reuse center at a transfer station. Only a small fraction of reuse grants were used for these other types of projects.
Reuse is by far the largest “waste prevention” activity funded by solid waste grants. These grants often help initiate or expand programs, though some have been used to cover operating expenses. In the reuse category, building materials and thrift stores appear most effective at supporting themselves through material sales, though they still often need additional support for start-up or expansion projects. Other types of reuse activities, such as electronics reuse and edible food rescue, usually need to support themselves through other means, such as donations to their social missions or funding for job-training activities.
Reuse is also the most tangible – and measurable – of the waste prevention categories. Many grant-funded reuse efforts can report literally tons of materials reused, particularly for edible food rescue and used building materials. These reuse efforts likely produce significant waste prevention and other benefits for the state of Oregon, though increased source reduction could yield even greater benefits associated with “upstream” environmental savings. Grants for food rescue, building material reuse, and computer reuse are summarized below, and more detail is provided in a separate paper on nongovernmental reuse and waste prevention services and infrastructure in Oregon.
Waste Prevention Strategy 31 Background Paper #3 State of Oregon Efforts December 2006

Food Rescue Food Rescue Highlights
Food for Lane County, the regional food bank for Lane County is the second largest food rescue program in Oregon and was frequently cited by interviewees as a model food rescue program.
As part of Oregon Food Bank’s Fresh Alliance program, Food for Lane County collects and distributes about 3.5 million pounds of perishable food each year, reducing food waste disposal and feeding about 80,000 individuals.
Food for Lane County has received two solid waste grants, which were used to:
Identify and quantify the food being disposed in Lane County.
Expand its cooler system to recover and manage more perishable food.
Edible food rescue operations collect usable food primarily from grocery stores and restaurants. The food is usually perishable and can include a range of items from produce and prepackaged meats nearing their expiration dates (but not yet expired) to fully cooked meals. Edible food rescue provides valuable social as well as solid waste benefits.
Although significant food rescue occurs in some counties in Oregon, not all reusable food is being collected even within those areas of the state. Two major grocery chains do not donate food, and many counties lack food rescue programs. Successful models exist, however, that could be replicated in counties currently without food rescue operations.
Solid waste grants appear best suited for capital expenditures and capacity upgrades, such as coolers or refrigerated trucks, or for special projects, such as marketing campaigns to increase donors. Most food rescue programs, however, also need ongoing operating support from financial donors because they are not self-supporting and provide their services for free to a needy population base.
The perishable nature of fresh food creates particular challenges for edible food rescue efforts. Program leaders noted in interviews that significant untapped food supplies exist in the marketplace, but soliciting new donors can be difficult. Certain store chains, such as Wal-Mart and Safeway, currently have policies that limit edible food rescue. Insufficient collection and cold storage capacity also hinder food recovery, as organizations often need more refrigerated trucks, coolers, freezers, and warehouse storage, all of which are costly. Food rescue organizations must also keep pace with a constantly evolving product mix and changing consumer habits, with an emphasis on convenience foods including more restaurant meals, deli items, and other packaged foods.
Building Material Reuse
When buildings are deconstructed for salvage, rather than simply destroyed as waste, many of their components can be reused in new buildings to prevent waste, reduce material costs for projects employing used building materials, and add character to remodeling and new construction projects. Building reuse stores sell a wide range of materials, from structural beams and dimensional lumber, to
Building Materials Highlights
Habitat for Humanity’s Bargain Building Supply has several used building material stores in Oregon. The Linn County store received a grant through the County to support and expand operations of its reuse warehouse for construction debris. Material collection increased 30 percent during the grant period.
Heartwood Resources in Douglas County received a grant to expand used building material collection at transfer stations and to provide trailers to expand its deconstruction salvage operations. Following this grant, the local construction and demolition waste stream was reduced by about 5 percent.
BRING in Lane County received two grants to increase its deconstruction and salvage operations and to expand its Planet Improvement Center for selling used building materials. In 2005, BRING received 520 tons of items at its store and obtained an additional 275 tons of material through deconstruction.
Waste Prevention Strategy 32 Background Paper #3 State of Oregon Efforts December 2006

flooring, moulding, siding, windows, plumbing, and light fixtures. Residents and businesses can often ble for reuse to a store for consignment or donation. Alternately, materials can be
sfer station or salvaged at the building site by de
requirolid
sucfrom
en significant vantaged groups, such as recovering addicts
ding to activ For
ney, but they can
captured
e it
Oregon currently lacks a regulatory preference or used computers,
action,
deliver items suitacollected at the tran construction crews.
Construction and demolition materials are bulky andstorage, which can be expensive to acquire or build. Sare primarily needed for start-up and expansion costs,Reuse stores may face siting or expansion difficulties aesthetics, or other NIMBY (not in my backyard) sentimif the organizations employ or train workers from disador previously incarcerated individuals.
e large covered areas for sorting and waste grants for building material reuse h as transportation, storage, and displays. neighbors concerned about noise, traffic, ts. This opposition may be more
In many cases, sales revenues provide enough funfact, some stores are used to raise money to supportexample, Habitat for Humanity uses the funds raised in its stores (as well as some of the used building materials themselves) to build houses for those in need. BRING in Eugene uses funds raised at its Planet Improvement Center to help support its
keep the reuse stores self-sustaining. In ities of a parent nonprofit organization.
Computer Reuse Highlights
Monitors and More in Douglas County used a grant for equipment to expand operations
s as part led and low-income residents. Many computers were
cyprov
FREE GEEK in Portland used one grant to support operating expenses to help voluntecompu ters
and computer reuse and
n
t to e
4-
to refurbish, resell, and recycle computer of its mission to help disab
re cled, however, and the company did not ide separate figures for reuse.
educational activities.
Demand for used building materials is solid, though markets for some materials are stronger than others. Some builders have a bias against used materials, and local building codes may restrict reuse of certain structural items, such as dimensional lumber for framing. Deconstruction, salvage, and reuse of materials can sometimes save moalso raise costs by increasing needed labor time. On the supply side, low tip fees make it easy and relatively inexpensive to throw used building materialsaway instead of reusing them. Raising the costs of landfill disposal might help increase supplies and increase reuse.
Computer Reuse
While Oregon, like other areas, generates a large supply of used computers, not all of them are for reuse or recycling. The ease of disposal in landfills, rapidly changing technology, and relatively weak market demand for used computers can makdifficult to facilitate computer reuse.
ers reuse and recycle used ters. Volunteers can earn compu
in return for their time donated to the organization, and computers are also available to nonprofits. Free Geek used a second grant to help expand their Community Technology Center.
The Computer Reuse and Recycling Center in Eugene received a grant via LaneCounty to exprecycling. About 2,300 computers have beereused since 2004, but the majority of computers received at CRRC are recycled.
StRUT (Students Recycling Used Technology) received support via a granWasco County to support operations of threborn StRUT organization. StRUT was previously located in the Portland area, but itserved many parts of the state with its computer collection and reuse activities. Students collect donated computers and upgrade them for reuse in schools. In 2002005, StRUT facilitated the reuse of 1,900computers.
requirement to reuse or recycle instead of disposing of them, and many potentially reusable computers wind up in the garbage. Even when computers are kept out of the disposed waste stream, reuse typically composes only a small frcompared to recycling. Rapid technological advancement reduces demand by making older equipment relatively undesirable when compared to new computers, which also continue to drop in price and rise in computing power. In addition, several
Waste Prevention Strategy 33 Background Paper #3 State of Oregon Efforts December 2006

interviewees reported that some companies and individuals avoid donating their computers to nonprofits because they view these electronics handlers as unreliable. Concerns that nonprofit reuseorganizations will not properly erase sensitive data from the computer’s memory or that th
ey will not
handle used electronics in an environmentally responsible manner may limit donations to some of
. In contrast with clothing, household goods, and used building materials, computer reuse is rarely profitable or self-supporting. The few private operations
onations.
ement includes composting, grasscycling, and worm bins located at homes,
promotion and mobile yard debris chippers; and
In-vessel and worm composting at schools,
onugh th
re o
m cur ewed s, it maye extra e
the trafits a
these groups.
Handling used computers can be costly, and many computer reuse programs need help with operating expenses as well as with capital expenditures for expansion. Many NGOs involved in electronics reuse have broader social missions, which their reuse activities help support. These social missions include providing job training to various disadvantaged groups as well as fostering technology access for residents in need
that remain active in this field tend to focus on more profitable products and services, including components and corporate contracts. Some nonprofits also are able to support their social missions by supplementing their computer sales with grants or d
Onsite Organics Management Grants
Onsite organics manag
schools, and businesses. Onsite organics management accounted for 20 percent of waste prevention grants, with 19 grants totaling $267,245 since 1991. Grants were used for the following activities:
Home composting demonstration sites and educational materials;
Home composting programs, including bin distribution and evaluation;
Grasscycling
grocery stores, and hospitals.
Although many grants were used for education, promotilittle evaluation was done to measure their effect, thoOnsite composting activities produced results but requiresource investments to maintain worm bins, in-vessel compoorganics management also faces stiff competition fro
Home Composting Highlights
In 2001, the City of La Grande sold 311 compost bins to residents at a reduced cost. In a follow-up survey, 82 percent of participating household claimed to be using
the
m 63 s
nde f the few
relevant programs with an extensive,
their bins more than a year later.
A survey of bin recipients found thatpercentage disposing of at least some of their yard debris in the garbage fell fropercent to 34 percent, while yard debriburning decreased from 27 percent to 14 percent of households. The La Grahome composting project is one o
quantified evaluation.
, and demonstration of home composting, e La Grande project was an exception. ngoing commitment, such as time and
sters, and demonstration sites. Onsite bside collection, which is generally vi be difficult (or of nominal benefit) to ffort to manage a compost or worm bin nsportation impacts of curbside yard waste re greater where the alternative would be
as easier. Where curbside collection already existconvince businesses and homeowners to make ththemselves. Onsite organics management reducescollection for composting, but the environmental beneburning or landfill disposal of organic materials.
Waste Prevention Strategy 34 Background Paper #3 State of Oregon Efforts December 2006

3.5 Barriers and Opportunities for Waste Prevention
The following section describes reported barriers and opportunities associated with waste preventionand reuse activities at the state level and conducted through solid waste grants in Oregon. Sector-specific barriers
were covered in the preceding sections, by topic (e.g., edible food rescue), and ere
ention activities. Staff turnover can also make it difficult to sustain programs over time. Disseminating coordinated messages regarding
portunities across multiple jurisdictions, and particularly in areas where haulers are contracted to manage waste programs, may also be
wees reported th ity rnments. Many p
for wste
g or climuch broader lifestyle changes and decisions
exa le ste at and mai ibattle in cou nsumption messages con of advlead to -packaginheren nments and organizat exh t essage Gen a ed that lit harde for waste prevention and reumeasuri rceptio or vag t umen nvironmental benefits
usable goods. Reuse organizations may need to ompete with waste haulers (both disposal and recycling) that may have lower collection costs and sually offer door-to-door pickup. In the electronics sector, rapid technological innovation can render
older computers obsolete quickly and reduce demand for used computers. Some types of used building materials may be considered inferior, while others may be seen as more desirable than present-day products, such as salvaged beams from old-growth timber or classic Craftsman-style doors and hardware. The non-standard nature of these products can make their use more difficult
barriers and opportunities as reported by DEQ’s regional technical assistance staff members wsummarized in Chapter 2.
Reported Barriers to Waste Prevention and Reuse
The interviews with recipients of solid waste grants as well as implementing organizations for grant-funded activities suggested a variety of barriers to waste prevention, primarily related to resource shortages and conflicting public perceptions. Interviewees frequently reported that they lack sufficient resources, including funding and staff time, to expand waste prev
desired waste prevention behaviors and reuse op
problematic.
In addition to resource constraints, many intervieamong the public, businesses, or some local govegeneral lack of public interest, knowledge, or support Even among more environmentally minded citizens, watangible or high-profile concerns, such as recyclincan involve m
at waste prevention is not a priorrograms felt challenged by a
aste prevention in some parts of the state. prevention often takes a backseat to more ate change. Because preventing waste than participating in curbside recycling, for the source can be difficult to instillmp , fostering behavior changes that reduce wa
nta n among many businesses and the general public. Waste preventntering the many pro-co
ion also faces an uphill in the media and a dominant culture of ertising. The desire for convenience often ed products. Though waste prevention is
ions may lack the support or political will tos may be viewed as bad for the economy. ow or non-existent waste tipping fees make se. The challenges of tracking and ns that such activities are too difficult ted cost savings and e
sumerism, supported by millions of dollars worths increased waste, with disposable and over
tly efficient, some local goverort heir citizenry to “buy less stuff,” and such mer ting waste is easy, and interviewees report
r to provide incentivesng waste prevention can contribute to mispe
ue o be worthwhile, in the absence of clearly doc data.
Unlike recycling, waste prevention lacks a support network of industries and jobs that could form a constituency for it. Reuse efforts generate jobs and economic activity, though the supporting infrastructure and constituency for reuse is also less established and cohesive than for recycling. Some reuse organizations may work together within their issue areas, such as edible food rescue, butthey typically have not joined across sectors to form a unified reuse movement, lobby, or trade association.
Interviewees also identified barriers specific to reuse efforts. Reuse organizations often have insufficient infrastructure and lack space for expanding their operations. They face high transportation costs and logistics for collecting recu
Waste Prevention Strategy 35 Background Paper #3 State of Oregon Efforts December 2006

and costly, however, limiting the breadth of their marketability. In light of the costs and limits on sale prices for used goods, reuse activities alone may not generate e
of their operations nough income to
n
Reported Opportunities for Waste Prevention and Reuse
s also exist for expansion. This
s
is n
and similar models could be developed for other sectors.
onths t was awarded, leaving them unable to start work or use staff and rented space
g
sustain an organization. Accordingly, many of the reuse organizations are nonprofits, and community service is often an important component of their organizational missions. Another challenge is that some nonprofits may lack the entrepreneurial spirit, strong leadership, and tolerance for risk that cafoster results, growth, and longevity.
Although waste prevention faces many barriers, many opportunitiesection presents potential opportunities for fostering increased waste prevention and reuse activities at the state level and through solid waste grants. This background paper is intended to provide information on existing programs, barriers, and opportunities to assist the work of DEQ and the Waste Prevention Steering Committee, which will develop its own strategic approaches and policy recommendations. Accordingly, the reported opportunities presented here are based primarily on input from interviews with grant recipients and implementing organizations. The DEQ team and the Waste Prevention Strategy Steering Committee may wish to consider these reported opportunities athey develop recommendations for inclusion in the statewide Waste Prevention Strategy.
The demand for edible food rescue and building material reuse is strong, and additional untapped supplies exist. Better access to supplies and improved infrastructure in these sectors could facilitate the reuse of more materials. Research is needed into how to capture more material, such as increased incentives for deconstruction or establishment of new depots to handle construction and demolition wastes suitable for reuse. Green building trends increase the focus on construction materials and practices. The current interest in green building generally supports opportunities for waste prevention and reuse, although many specific aspects of green building do not necessarily prevent waste. Education and outreach to contractors as well as grocery stores about reuse opportunities and their benefits could increase donations of food and building materials in areas where available supplies remain. Capital investments in more equipment and infrastructure could boost capacity needed to process such increased donations.
Programs could provide more outreach and assistance to businesses for conducting commercial waste prevention activities. Using schools as demonstration sites and increasing student education could teach waste prevention to the next generation, while also delivering the messages to parents. Partnerships with faith-based organizations could help promote waste prevention as a practice that in keeping with an ethic of stewardship and moderation. Umbrella organizations, such as the OregoFood Bank for edible food rescue, can help expand opportunities for other locally based organizations,
Interviewees also proposed several leadership roles for the State. They suggested that the state government should lead by example, with its own prominent activities in waste prevention, reuse, and onsite composting. DEQ should fund more pilot projects and offer more grants, while expediting grant funding to awardees. Several solid waste grant recipients reported that they were not able to complete their projects on time or in budget because the grant money was not disbursed until mafter the granefficiently.
The interviewees also suggested that the State should offer more support for infrastructure and other capital improvements, particularly through grant funding. Recommended efforts could include makinbrownfield funding available to nonprofits as well as local governments for reuse activities and providing low-cost bond financing for reuse efforts. Such a program could be akin to Alameda County’s bond financing program for users of recycled materials. The State should also provide support for public education and promotion of waste prevention by crafting and disseminating effective, coordinated messages and public service announcements (including ones that encourage sustainable and reduced consumption, along the lines of Lane County’s “Less is Best” campaign) and
Waste Prevention Strategy 36 Background Paper #3 State of Oregon Efforts December 2006

by promoting reusable materials (e.g., use of salvaged building materials). One interviewer discussed the linkages among waste prevention, reuse, and greenhouse gas reductions, noting that future carbon trading schemes to address climate change may help support waste prevention activities.
Interviewees also identified areas in which the State could provide more assistance to local governments and nongovernmental organizations. DEQ could provide additional technical assistance
ndividual counties ith them to adapt
successful models from other locales to their own situations. DEQ interns may be a possible way to
al
ld conduct waste audits and outreach to particularly large businesses. Several programs in reuse also
d
State could tax the less desirable products and activities (e.g., disposable products or waste disposal), directly fund and provide
ntractors, other reuse organizations.
The State could also support development of a more standardized system of (higher) tip fees to
and direct support, including grants, to local governments; tailor approaches to i(e.g., suggesting alternate options for urban or rural counties); and work w
provide additional staff support to help counties provide more education, outreach, and assistance during their busiest seasons for education and promotion activities (e.g., home composting promotions in spring and fall peak times for yard work).
Stakeholders also suggested that DEQ should prioritize areas to focus on and support regionapproaches to waste prevention and reuse. The Department should also facilitate networking and information sharing; DEQ could also help coordinate and collaborate with other jurisdictions to disseminate effective model programs for waste prevention and reuse. Although some local governments have implemented Resource Efficiency Programs of their own, the State cou
accomplish social service goals through training and employment. The State could increase both waste prevention and social benefits by supporting or facilitating the training and employment of disadvantaged populations (e.g., disabled persons, recovering addicts, or formerly incarcerateindividuals) in reuse industries; for example, the Jobs Plus program could help provide competent staff trained in computer repair. Reuse industries would also like logistical assistance through transportation improvements for reuse industries (e.g., better rail access) and assistance as needed with facility siting (e.g., zoning clarifications and overcoming neighborhood concerns) for reuse activities.
The State could align incentives with desired environmentally preferable behaviors, products, and materials to encourage prevention and reuse. For example, the
incentives for the “good” programs it desires (e.g., waste prevention and reuse activities), and structure waste fees and taxes accordingly. Additional legislative and regulatory mandates favoring waste prevention and reuse, while deterring increased generation and disposal, could establish clear priorities.
Specific to reuse, the State could encourage reuse by providing tax credits for grocers, coand others to donate to edible food rescue, building materials reuse, and
reduce one of the barriers to reuse, while encouraging source reduction. Finally, Oregon could evaluate its policies for permitting landfills for construction and demolition waste and be more proactive in fostering reuse, rather than perpetuating easy and inexpensive waste disposal.
Waste Prevention Strategy 37 Background Paper #3 State of Oregon Efforts December 2006

4 Next Steps
The research conducted for this background paper focused on the many efforts to date that the State
s nics, and
cts,
y
.,
ons include identifying priority materials or waste streams for waste prevention and reuse.
ter
ed in
eports are intended to provide information and help support that process.
of Oregon and its Department of Environmental Quality have conducted to encourage waste prevention and reuse, both in government operations and around the state. In addition, local governments and nongovernmental organizations have also undertaken many significant waste prevention and reuse efforts. Other background papers developed in this research project focus onthose sectors. Local government activities, particularly those earning credits under DEQ’s 2% recovery rate credit program, are covered in Background Paper #4. Nongovernmental organizations as well as some private companies providing reuse and waste prevention infrastructure and servicein Oregon – particularly in the reuse sectors of edible food rescue, building materials, electrothrift stores – are covered in Background Paper #5.
The findings presented here raise strategic questions that DEQ should address to decide how to balance its priorities and limited resources. First, DEQ could focus more on outreach efforts, including grants and technical support, or on DEQ-centered efforts, such as research, pilot projeor internal programs. Second, DEQ could offer outreach efforts and grant funding across Oregon using different criteria, such as: 1) equally across all counties, 2) focusing on counties that demonstrate the most need (e.g., not meeting generation goals), or 3) according to applications received for assistance or funding, which can serve as a proxy measure of how receptive and readthe areas are to work on these topics. Third, while some waste prevention projects are self-sustaining (e.g., building material reuse), others require ongoing funding (e.g., food rescue). DEQ should decide whether to spend grant money only on projects requiring special, one-time costs (e.gcapital investments and start-up costs) or whether some projects are effective enough to warrant establishing dedicated funding to support their ongoing operations.
Key questiSome materials may be much larger in quantity, while some streams may be relatively small but impose a disproportionately high environmental burden. Additionally, some sectors may offer greapotential and feasibility for waste prevention (e.g., “low-hanging fruit”), while others may need moreassistance in order to achieve waste prevention goals. Many reuse activities are well establishOregon, but DEQ may wish to consider ways to move efforts further up the waste management hierarchy to foster more “pure” waste prevention (source reduction). The effort to develop a statewide Waste Prevention Strategy will likely grapple with some of these issues, and these research r
Waste Prevention Strategy 38 Background Paper #3 State of Oregon Efforts December 2006

Appendix A. Sample DEQ Solid Waste Grants
Interview Topics for Solid Waste Grant Recipients
This appendix provides brief overviews of selected sample activities conducted with funding fromDEQ’s solid waste grant program. As part of preparing this background paper, Cascadia conducted follow-up interviews with 24 organizations to gather information on the barriers to and opportunifor waste prevention. The interviews covered:
Program background, starting with a description of waste prevention, reuse, and home/onsite composting activities involved,
ties
including solid waste grants. Cascadia also gathered basic program information on the population served, materials involved in waste
urs puts,
s/promotion,
tion nd
s covered cluding edible food rescue, building material reuse, computer reuse, and reuse of
lothing and household goods. Food rescue and building material salvage appear to offer strong opportunities for growth and expansion, while other reuse sectors have weaker demand. Onsite composting programs included educational programs, demonstration sites, bin distribution programs, and school-based programs for composting and worm bins.
Pure Waste Prevention (Source Reduction) – Sample Grants
St. Helens High School, Columbia County – Purchased a Hobart dishwasher, durable lunch trays, and flatware; the school phased out Styrofoam trays, reduced its waste, saved money, and became the first member of Oregon’s Green Schools program.
“Less Is Best” Campaign – Lane County hired an advertising firm to create ads for the public about waste reduction and waste prevention, which ran in 2002-2003. The program focused on holidays, junk mail, and reusable mugs and bags.
prevention, facility size, funding and resources, and local progress on waste recovery andwaste generation goals.
Program outcomes and effectiveness, including activity measures (e.g., participants, hoof operation, materials distributed, sites visited, audits, assistance provided); results, outand outcomes (e.g., amounts collected, reused, waste prevented); methods of evaluation; and perceived efficacy.
Barriers and opportunities, including the potential role of local or state government, opportunities for expanded waste prevention activities in region or elsewhere (including replicability of program model), barriers to increased waste prevention (e.g., resources, economics, supply, demand/customers, education/awarenesinfrastructure/space), and other lessons learned.
Overall assessment and other comments regarding existing conditions for waste prevention, reuse, and onsite composting; trends and drivers for future efforts; other model programs; and comments to DEQ for waste prevention strategy development.
The two dozen programs interviewed represented a range of waste prevention, reuse, and home composting activities, serving sizeable populations in many areas of the state. Waste prevenprogram activities included business waste audits and assistance, education and promotion, areusable materials in place of disposables (e.g., school lunch trays). Reuse programdiverse activities inc
Waste Prevention Strategy 39 Background Paper #3 State of Oregon Efforts December 2006

Get SMART (Save Money And Resources Today) Resource Efficiency Prograof energy use, water use, and solid waste to identify ways to reduce and prevent wa
m – Conducts audits ste and save
money; provides technical assistance for businesses, schools, and government offices in Benton
ess program to decrease
ACC S al food ba e Oregonwaste gFresh Alliance in 2004. ACCESS collects and distributes about 300,000 pounds of food each year to app i
CARE, food reshelp with o s and volunteer recruitment. In March 2006, the Oregon Food Bank as as the Tillamointerest
COCAA CAAN is the regional food schutes, Crook, and Jefferson counties. Des uope tioand a resuppleme
to
county. roject
County.
GREAT (Gresham Resource Efficiency Assistance To) Businesses – Businuse of natural resources, including focus on use of durables, office supply reuse; reached 450-500businesses in the City of Gresham.
Food Rescue – Sample Grants
E S, Inc. (Aging Community Coordinated Enterprises and Supportive Services) – The regionnk in Jackson County, ACCESS has an active food rescue program and is a participant in th Food Bank’s Fresh Alliance. Jackson County has worked with ACCESS on several solid rants to support its food rescue efforts and help the program join the Oregon Food Bank’s
rox mately 21,000 individuals.
Inc. (Community Action Resource Enterprises) – The Tillamook County organization began cue efforts in 2001 as part of its larger food bank program, and it received grant funding to
utreach to grocery storesumed management of CARE’s food bank, due to local budget shortfalls. Now known
ok County Regional Food Bank, it is not conducting much edible food rescue, but it is ed in joining OFB’s Fresh Alliance.
N/Feed the Need (Central Oregon Community Action Agency Network) – CObank in Deschutes County, and it serves De
ch tes County and COCAAN have received three DEQ grants to support its edible food recovery ra ns. COCAAN collected more than 25,000 pounds of perishable food each month from stores
staurant, serving about 10,000 people each month through its partner agencies and ntal programs.
Food for Lane County – FFLC is the regional food bank serving all of Lane County, and it is the second largest food bank in the state. The City of Eugene has partnered with FFLC on two grantsassist its food rescue operations, including a grant to help identify and quantify the food being disposed in the county and to expand FFLC’s cooler system to recover and manage more perishable food. FFLC was cited by most other food banks interviewed as a model program, and the group also is involved in the Oregon Food Bank’s Fresh Alliance program. FFLC collects and distributes an estimated 7 million pounds of food per year, half of which is perishable, and the group serves an estimated 80,000 individuals per year.
Oregon Food Bank – OFB is the umbrella organization for food banks throughout Oregon. The City of Ontario in Malheur County obtained two grants to work with OFB on onion recovery in theOFB has a reputation for finding creative ways to avoid having food go to waste, and in this pprison labor was used to “rescue” excess onions, which were used to make onion soup. DEQ grants have also helped other food banks around the state to join OFB’s Fresh Alliance program supporting edible food rescue.
Waste Prevention Strategy 40 Background Paper #3 State of Oregon Efforts December 2006

Building Materials – Sample Grants
Bargain Building Supply – This Habitat for Humanity reuse warehouse for construction debris started in 2004 and serves Linn County and the Corvallis area. It was the first program of its kind in
sing and offsetting wages for one person, which allowed the reuse store manager to give presentations and focus on outreach.
n dedicated to building material salvage and reuse,
ocated in Eugene, BRING offers a range of waste reduction, other
Q
wn
ost use sales, but the organization has relied on grants to help
the area, and it received a grant to support and expand its operations. During the grant period, the store collected an average of 18 tons of material per month over a 9-month period, which was 30 percent more than the initial amount. The grant was successful in helping to keep the program going because it provided funds for adverti
Heartwood Resources – A nonprofit organizatioHeartwood began in 2002 in Roseburg and currently enjoys strong community support. The organization and its partner Douglas County received a DEQ grant to purchase trailers in order to expand the collection of used building materials at transfer stations and to support the nonprofit’s deconstruction and salvage activities. Douglas County has reportedly estimated that Heartwood Resources has reduced the local flow of construction and demolition waste by about 5 percent.
BRING – A nonprofit organization lenvironmental education, and recycling services, including building material salvage and deconstruction. With its partners Lane County and the City of Eugene, BRING has received two DEgrants to help it increase the practice of deconstruction and building material salvage and to expandits new Planet Improvement Center for increased building material salvage. BRING recorded 30,000 transactions at its used building material store in 2005 for a total value of $430,000; received 520 tons of items at the store; and procured an additional 275 tons of material from the organization’s odeconstruction efforts.
Wallowa County – The County received a grant to develop a Reuse Center in 2004. The Reuse Center operates on weekends, accepting glassware, windows, chairs, TVs, VCRs, and other usable household goods from residents. The Reuse Center currently requires a 30 to 40 percent FTE for staffing its activities. Residents receive information about the program when they bring waste to the transfer station.
CART’M (Conservation Action Resource Team of Manzanita) – This nonprofit operates a facility inManzanita that serves as a transfer station, a recycling center, and a retail store for reused items collected at the facility. CART’M and partners City of Manzanita and Tillamook County have received four grants from DEQ to support the organization’s program and expansion costs, including start-up and operation of its reuse store. CART’M estimates that it resells about 100 tons per year of items, including building materials, kitchen and household goods, linens, electronics, furniture, and other items (but no clothing). The facility accepts about 700 tons per year of garbage, 400 tons of yard waste and wood debris, and 50-100 tons of recyclables. CART’M is nearly self-sustaining, with mrevenues coming from trash fees and rewith capital expenditures and expansion.
Waste Prevention Strategy 41 Background Paper #3 State of Oregon Efforts December 2006

Computer Reuse – Sample Grants
Monitors and More – Founded in 2003, this Roseburg nonprofit refurbishes, resells, and recyclecomputers as part of its mission to teach life and job skills to disabled and low-income residents. With its partner Douglas County, Monitors and More received a DEQ grant in 2005 to help expand itoperations by providing equipment. The organization serves 200 to 400 customers per year and recycles an estimated 200 tons of e-scrap, but the nonprofit was not able to report how many computers it refurbished or resold in the year. Monitors and More estimates that it receives the majority of the end-of-life computers from businesses and homes generated in th
s
s
e county.
rs he
3 due to
District, food waste “grinders” at two schools (George Fox and Chehalem Valley) that use the grounds in their onsite compost bins, and interest from McMinnville in building a compost
t
post. The City-provided bins are composting an estimated 40 to 78 tons of yard waste annually, though at least half of this material was likely already diverted from disposal through other methods, either onsite or offsite.
Computer Reuse and Recycling Center – CRRC, a nonprofit located in Eugene, accepts nearly all items that plug in or run on batteries, except televisions from homes. CRRC and Lane Countyreceived a DEQ grant to expand computer reuse and recycling. CRRC has placed 1,300 computewith recipients in the two-and-a-half years since 2004 and sold approximately 1,000 computers in tsame time period. The organization estimates that it is able to sell or refurbish 1 out of every 17 computers received, and CRRC recycles the rest.
StRUT (Students Recycling Used Technology) – StRuT was originally formed in 1995 by Intel and the Northwest Regional Educational Service District (NWRESD) of Hillsboro. It closed in 200state budget shortfalls but has re-formed as a local (but growing) program operated out of The Dalles by the Region 9 Education Service District. Since reforming, StRUT and partner Wasco County havereceived a DEQ grant to support its operations. Through StRUT, students collect donated computers and components and upgrade them for use in schools. StRUT currently serves 40 to 50 schools, and the organization distributed 1,900 refurbished computers in the 2004-2005 fiscal year.
Home Composting – Sample Grants
Yamhill County – The County has received one grant for Earth Tub home composting at schools. The County also has onsite composting projects including a compost demonstration site at the Newberg School
demonstration site there.
City of La Grande – Through a 2001 solid waste grant, the City of La Grande in Union County purchased 250 compost bins and sold them residents for $10 each; an additional 61 bins were purchased and sold later. A year later, bin recipients were surveyed regarding changes in their yard waste management behavior and their satisfaction with the compost bins. A remarkable 89 percenof bin buyers responded to the survey. Of the survey respondents, 82 percent reported that they were still using the compost bin more than a year after buying it, while 46 percent of bin users reported that they had already harvested and used some of their finished compost. Another 53 percent said they planned to use their com
Waste Prevention Strategy 42 Background Paper #3 State of Oregon Efforts December 2006

Appendix B. State Solid Waste Grants, by Type
Between 1991 and 2005, the Department of Environmental Quality’s solid waste grant program hasfunded 187 general solid waste grants totaling $3.7 million dollars and covering a wide variety of activities throughout the state of Oregon. These figures do not include waste tire grants or other grants for household hazardous waste (HHW) projects, including a few projects focused on HHW prevention. Table 4 shows DEQ’s 187 solid waste grants, listing the category, year, recipient jurisdiction or organization, dollar amount, and brief description.
Table 4. State Solid Waste Grants, by Type, 1991-2005
Year Organization Amount Description
Waste Prevention – General (Source Reduction)
2005 Klamath, City of $14,500 Recycling and waste prevention education coordinator 2005 Multnomah County $13,210 Waste prevention program for county facilities
2003 Florence, City of $6,410 RARE intern, Green Schools, Master Recycler, composting, business waste prevention
2003 Jackson County $10,000 SMART – business audits for waste prevention 2002 Deschutes County $15,000 ReSource – WorkSmart business waste prevention and reuse 2001 Gresham, City of $41,100 Business outreach on reducing resource use 2000 Benton County $44,309 GetSmart Resource Efficiency Project 2000 Jackson County $20,000 SMART – commercial/institutional waste audits
2000 Lane County $32,000 mail (included follow-up survey) Public education campaign on waste prevention, esp. junk
1999 Clackamas County $15,314 Business waste prevention videos
1999 Jackson County $32,500 Public education campaign on recycling, reuse, and waste prevention
1996 Eugene, City of $20,000 Home waste prevention video, waste audits, worm bins 1995 Columbia County $7,499 School cafeteria reusables and dishwasher
Reuse – Building Materials
2005 Springfield, City of $24,000 BRING Recycling – Planet Improvement Center for used building materials (Springfield)
2004 Benton County $38,695 Habitat for Humanity (Benton Co) – Discount Home BuildinSupply (Corvallis)
g
2003 Deschutes County $19,750 Habitat for Humanity (Deschutes Co) – ReStore (Bend) 2002 Linn County $24,000 Habitat for Humanity (Linn Co) – Bargain Building Supply
2001 Douglas County $30,000 Heartwood ReSources – trailers for used building material collection at transfer stations, deconstruction salvage for UBM store
2001 Eugene, City of $28,360 BRING Recycling – outreach to increase deconstruction salvage
2000 Portland, City of $31,000 ReBuild – furniture salvage/rebuilding
2000 Portland, City of $30,000 ReBuilding Center – trailers/trucks for hauling salvaged building materials
1998 Tillamook County $30,000 CART'M – reuse/recycling nonprofit
Waste Prevention Strategy 43 Background Paper #3 State of Oregon Efforts December 2006

Year Organization Amount Description
Reuse – Electronics
2005 Douglas County $16,000 Monitors and More equipment to expand reuse/recycling operations
2004 Lane County $38,298 Computer Reuse and Recycling Center; previously MacRenewal
2004 Wasco County $27,000 StRUT – Students Recycling Used Technology 2002 Portland, City of $20,000 Free Geek – computer/TV reuse/recycling 2000 Marion County $25,203 Computer/TV reuse and recycling 2000 Portland, City of $41,070 Free Geek – computer/TV reuse/recycling
Reuse – escue Edible Food R
2004 Deschutes County $17,744 COCA e eAN – Fe d the N ed (Central Oregon Community Action Agency Network)
2004 Jackson County $30,000 ACCESS Food Rescue – Fresh Alliance Program 2004 Portland, Port of $6,774 Food waste collection from businesses
2003 Deschutes County $20,743 COCAAN – Feed the Need (Central Oregon Community Action Agency Network)
2003 Eugene, City of $26,000 Food for Lane County – Fresh Alliance 2002 Jackson County $25,000 ACCESS Inc. food recovery program (Jackson Co)
2001 Deschutes County gon Community $34,243 COCAAN – Feed the Need (Central OreAction Agency Network)
2001 Ontario, City of $15,190 Oregon Food Bank – onion recovery 2001 Tillamook, City of $23,000 CARE Inc. – edible food rescue 2000 Eugene, City of $24,110 Food for Lane County – food recovery 2000 Jackson County $29,168 ACCESS Food Rescue Program – Food on the Move! 2000 Ontario, City of $22,924 Oregon Food Bank – onion recovery
Reuse – Other
2003 Deschutes County $ exchange 13,100 ReSource – Oregon SWAP online materials 2003 Wallowa County e$13,552 Reus center at transfer station 2001 Benton County $3,515 Campus cleanup
2000 Milwaukie, City of $4,400 s.com waste exchange; City of e
Clackamas Co supplyourschoolMilwaukie Schoolhouse Office Supply internet waste exchang
1998 Metro $20,000 SCRAP – School and Community Reuse Action Project 1997 Metro $18,510 SCRAP – School and Community Reuse Action Project
Home Compos nsite Organics meting/O Manage nt
2005 Yamhill County $28,700 School composting with Earth Tubs 2004 Bend Parks and
ct $20,000 osting equipment
Recreation DistriComp
2004 Tillamook County $19,465 od waste reduction program School fo2002 Bend Parks and
Recreation District $30,000 Composting equipment
2001 Deschutes County $7,790 ng Team) – compost demonstration ReSource (Recycli2001 Springfield, City of $5,000 In-vessel composting at hospital
Waste Prevention Strategy 44 Background Paper #3 State of Oregon Efforts December 2006

Year Organization Amount Description
2001 Wilsonville, City of $23,087 Cafeteria food waste composting 2000 La Grande, City of $15,111 Home composting program 1999 Polk County $5,578 Community composting education sites 1998 Douglas County $20,000 Compost demonstration site and education 1998 Eugene, City of osting systems at local supermarket (plus $12,102 In-vessel comp
training/promotion) 1998 Medford, City of $5,297 Art pathway at compost demonstration site 1997 Corvallis, City of $5,891 Park display on composting options1997 Curry County $4,400 School food composting 1996 Linn County $4,644 Home composting demonstration site 1995 Eugene, City of $2,400 Compost demonstration site and grasscycling 1994 Ashland, City of $6,500 Backyard composting 1994 Sandy, City of $23,500 Mobile yard waste chipper 1993 Ashland, City of $27,780 Backyard composting
Plannin agemeng (Solid Waste Man t Plans)
2004 Wheeler County $10,000 gement Plan County Solid Waste Mana2003 Coos County $30,000 County Solid Waste Management Plan 2003 Klamath, City of $23,000 City Solid Waste Management Plan 2003 Lake County $25,000 County Solid Waste Management Plan 2002 Baker County $18,575 County Solid Waste Management Plan revision 1998 Union County $15,016 County Solid Waste Management Plan 1996 Columbia County $45,000 County Solid Waste Management Plan 1996 Umatilla County $25,000 County Solid Waste Management Plan update 1995 Klamath County $20,250 County Solid Waste Management Plan 1995 Lake County $20,575 County Solid Waste Management Plan 1995 Tillamook County $30,000 County Solid Waste Management Plan 1994 Crook County $23,000 County Solid Waste Management Plan 1994 Harney County $9,000 County Solid Waste Management Plan 1994 Sherman County $ e Management Plan 25,000 County Solid Wast1994 Wheeler County $25,000 County Solid Waste Management Plan 1993 Baker County $38,250 County Solid Waste Management Plan
1993 Crook, DescJeffers
hutes, on, Klamath
Counties $60,000 Four-county Solid Waste Management Plan
1993 Harney County $28,000 County Solid Waste Management Plan 1992 Clatsop County $10,000 County Solid Waste Management Plan 1992 Coos County $63,000 County Solid Waste Management Plan 1992 Grant County $27,000 County Solid Waste Management Plan
1992 Jackson/JosephinCounties
e agement Plan $80,000 County Solid Waste Man
1992 Malheur County $31,500 County Solid Waste Management Plan 1992 Wallowa County $ Plan 45,000 County Solid Waste Management
Waste Prevention Strategy 45 Background Paper #3 State of Oregon Efforts December 2006

Year Organization Amount Description
1991 Clatsop County $13,300 County Solid Waste Management Plan 1991 Curry County $75,000 County Solid Waste Management Plan 1991 Lake County $12,575 County Solid Waste Management Plan 1991 Lincoln County $42,098 County Solid Waste Management Plan
Recycling/Recovery
2005 Creswell, City of $15,660 Curbside recycling bins 2005 Eugene, City of $ ection, crusher 17,474 Saint Vincent de Paul – mattress coll2005 Jefferson County $ ycling center improvements 16,800 Recycling containers, rec2005 Lake County $3,000 Recycling bins 2005 Portland, City of $ ansion 28,500 Portland State University recycling program exp2005 Tillamook County $30,675 CART'M 2005 Wallowa County nter baler $40,000 City of Enterprise recycle ce2004 Curry County $15,000 Compost facility feasibility study 2004 Douglas County $27,000 Mobile/manufactured home deconstruction pilot project 2004 Portland, City of $5,470 Recycling program for Portland State University 2003 Crook County $7,836 Recycling bins at landfill 2003 Grants Pass, City of arthCycle) $20,000 Carpet padding collection partnership (E2003 Marion County $40,000 Commingled paper recycling equipment (grant terminated) 2002 Douglas County $6,000 Recycling bins for rural routes 2002 Marion County $25,000 Agricultural plastics recycling equipment 2002 Milwaukie, City of ospitals $20,238 Fluorescent tube collection program for h2002 Mosier, City of $9,280 Recycling containers for depot 2002 Portland, City of $20,000 Recycling containers for Portland State University program 2002 Stanfield, City of $12,916 Yard debris chipper 2001 Estacada, City of $19,778 Rural recycling depot
2001 Metro $18,000 Multnomah Co fluorescent tube recycling (Oregon Environmental Council)
2001 Umatilla, City of $5,000 South Hill recycling depot 2001 Union County $17,540 Recycling depot improvement, expanded collection 2001 Union, City of $4,000 Yard waste collection 2000 Cove, City of $11,721 Rural recycling program expansion 2000 $14,416 Commercial recycling program Douglas County 2000 Eugene, City of $10,000 Food collection for pathogen study 2000 Florence, City of $6,000 3 Rs education project 2000 Hood River County $13,920 Rural recycling depots 2000 Marion County $75,000 Agricultural plastics recycling equipment2000 Yamhill, City of $19,904 Rural recycling depots 1999 $15,000 Recycling promotion and education Columbia County
1999 ted Tribes of $10,035 Recycling collection ConfederaWarm Springs
1999 Douglas County $18,800 Recycling sheds for schools 1999 Hood River County $21,372 Recycling market development and public education
Waste Prevention Strategy 46 Background Paper #3 State of Oregon Efforts December 2006

Year Organization Amount Description
1999 Lane County $18,720 Master Recycler program development
1999 Rogue River, City of oice Experience $19,078 Rogue River High School Alternative Chcommunity recycling project
1998 Hood River County $30,000 Program coordinator for public education1998 Jordan Valley, City of $7,990 Recycling drop boxes 1998 Long Creek, City of $9,000 Baler and other recycling equipment 1998 Milton-Freewater, City of iners $25,200 Curbside collection conta
1998 Oregon International Port of Coos Bay $20,000 Sandblast grit recycling study
1997 Cannon Beach, City of udit and composting demonstration $5,000 Organic waste a1997 Canyon City, Mt. Vernon $13,668 Recycling containers 1997 Crook County $10,480 Recycling containers and signage 1997 Douglas County $35,000 Recycling sort line equipment and related 1997 Eugene, City of dresser equipment $22,700 Composting demonstration – top 1997 Gresham, City of $5,000 School waste reduction projects 1997 Portland, City of $ 24,958 Study on recyclability/marketability of street fines1997 Sherman County $ nage, bins 19,200 Recycling drop boxes, sig1997 Tillamook County $50,000 Baler and recycling bins 1997 Vale, City of $7,650 Recycling bins and related 1997 Wallowa County $ g area 27,543 Upgrade recyclables processin1996 Coquille, City of $2,682 Six recycling containers 1996 Dayville, City of $8,664 Recycling depot 1996 Halfway, City of $10,000 Recycling depot 1996 Josephine County $3,143 Student recycling event 1996 Manzanita, City of $4,000 CART'M 1996 Manzanita, City of xpansion $7,000 CART'M – recycling center e1996 Metro $11,000 Washington Co recycling markets for plastics
1996 Monument/Longcreek, $20,0Cities of 00 Recycling depot
1996 Rogue River, City of $7,275 Education and collection events 1996 Sherman County $ program 15,100 Office paper education1996 Wheeler County ion $23,000 Recycling system, education/promot1995 Butte Falls, City of $10,000 Recycling depot and education 1995 Coos, Curry Counties $1,134 Public education materials 1995 Huntington, City of $7,600 Recycling drop boxes 1995 Madras, City of $1,340 Bilingual recycling education 1995 Winston, City of nt $29,200 Recycling program activities/staff/equipme
1994 Confederated Tribes of Warm Springs $29,400 Recycling depot
1994 Gearhart, City of $39,800 Countywide wood waste recovery program 1994 Spray, City of $11,183 Wheeler Co recycling depot, education, trailer 1994 Union County $15,000 Imber and Cove recycling drop boxes 1993 Columbia County $4,110 Recycling bins for residents
Waste Prevention Strategy 47 Background Paper #3 State of Oregon Efforts December 2006

Year Organization Amount Description
1993 Culver, City of ducation $9,004 Jefferson Co recycling drop box, bilingual e1993 Grant County $10,000 Glass crusher for recycling 1993 Lincoln County $26,788 Commercial recycling program1993 Wallowa County $10,000 Education – depot signs, ads 1992 Athena, City of $1,434 Recycling depot and education program 1992 Coos Bay, City of $15,000 Recycling education and promotion 1992 Dufur, City of $16,352 Recycling dropoff center and baler 1992 Irrigon, City of $10,000 Recycling depot and promotion 1992 Pendleton, City of $15,000 Paper collection program with at-risk youth 1992 Powers, City of $11,990 Tree chipper, school recycling 1992 Umatilla, City of program $10,000 Recycling drop boxes, educational 1992 Union County $24,000 Union and Elgin recycling drop boxes 1991 Douglas County $29,182 Glassphalt demonstration project 1991 Echo, City of $ nter 15,675 Establish community recycling ce1991 Grant County $23,500 Recycling boxes and cardboard baler 1991 Rogue Valley CG $14,600 SPARC (nonprofit) – recycling equipment 1991 Tillamook County $6,744 Recycling education program 1991 Wallowa County $ les 20,000 Barn conversion for recyclab
Waste Prevention Strategy 48 Background Paper #3 State of Oregon Efforts December 2006

Appendix C. Waste Prevention Interview Contacts
Ed Arm ook School Dl B iver Health
d ResourceB ilding CentB Consulting mook Con ounty He a
n Army – Ca regon Depa ical Assistant Clifton, CARE, Tillamook C ge at for Huma t
cycling on Departme or Lane Cou
ation Centr ay e etro, Waste R F Department t rd cycling F Columbia-W tF artment o sistant G unty
Shari Harris-Dunning, Oregon Department of Environmental Quality, Technical Assistant Lorraine Kerwood, Computer Reuse and Recycling Center Leslie Kochan, Oregon Department of Environmental Quality, Technical Assistant Matt Korot, City of Gresham Bruce Lumper, Oregon Department of Environmental Quality, Technical Assistant Sherrie Mathison, Yamhill County Terry McDonald, St. Vincent de Paul of Lane County John McEvoy, Linn County Russ McMartin, Wallowa County Bob Morris, Oregon Food Bank Steve Murray, COCAAN (now NeighborImpact) Bailey Payne, Marion County Public Works Jim Primdahl, Deconstruction Management Group Mike Riley, reSource Martine Roberts-Pillon, Oregon Department of Environmental Quality George Rollings, Habitat for Humanity Bargain Building Supply (Albany) Michael Russo, Lundquist College of Business (University of Oregon) Jackie Saling, Habitat for Humanity Bargain Building Supply (Albany) Reverend Philip Sano, Free Geek Kathy Schwink, Tillamook County Belle Shepherd, Josephine County Health Department David Skakel, Gorge Rebuild-It Center Brian Smith, Northwest Demolition and Dismantle Max Stafford, Monitors and More Matt Tracy, Columbia County Laurie Triege, Food for Lane County Marty Willie, StRUT (Students Recycling Used Technology) Denise Wolgamott, Rogue Transfer and Recycling Philip Yates, ACCESS, Inc.
strong, Tillam istrict Darry arton, Hood R Department Mickey Beach, HChris
eartwooekemeier, Rebu
s er
Dave ennick, ReuseShelly Bowe, CARE, Tilla
on Cunty Regional Food Bank
GordoVern B
Brown, Bentrown, Salvatio
alth Depscade Div
rtment ision (Portland)
Susan Christensen, O rtment of Environmental Quality, TechnCarrie ounty Re ional Food Bank Diann Crocker, Habit nity ReS ore (Bend) Julie Daniel, BRING ReCathie Davidson, Oreg ent of Environmental Quality, Technical Assistant Ron D ttwiler, Food f nty Brett Dilley, Food Innov
eBer (Oregon State University)
CatheJennif
ine England, r Erickson, M eduction and Outreach
Scott airley, Oregon of Environmental Quality, Technical AssistanRicha Felly, CART'M ReJohn Brian
redrick, Goodwill uller, Oregon Dep
illamef Environ
te mental Quality, Technical As
Sarah rimm, Lane Co
Waste Prevention Strategy 49 Background Paper #3 State of Oregon Efforts December 2006

Oregon Department of Environmental Quality
Waste Prevention Strategy – Background Paper #2
Environmental Considerations
An Overview of the Benefits of Waste Prevention and Reuse
Conducted for
Oregon Department of Environmental Quality, Solid Waste Program
Prepared by
December 2006
Oregon Department of Environmental Quality 07-LQ-006

Acknowledgments
The authors of this background paper gratefully acknowledge the valuable contributions of the following individuals to the Waste Prevention Strategy research and development process.
Land Quality Solid Waste Policy and Program Development 811 SW 6th Avenue Portland, Oregon 97204 (503) 229-5913 (800) 452-4011 toll-free (503) 229-6977 fax www.deq.state.or.us David Allaway and Jan Whitworth, project managers Loretta Pickerell, solid waste policy and programs manager
DEQ Waste Prevention Strategy Steering Committee Members David Allaway, DEQ Julie Daniel, BRING Recycling Leslie Kochan, DEQ Meg Lynch, Metro Mike Riley, ReSource Jan Whitworth, DEQ
DEQ Technical Assistants Susan Christensen Cathie Davidson Scott Fairley Brian Fuller Shari Harris-Dunning Leslie Kochan Bruce Lumper
The authors particularly wish to thank all of the interviewees from nonprofits, businesses, local governments, state agencies, and educational institutions for their valuable and candid contributions and insights, without with these reports would not have been possible. Interviewees are listed separately.
Jessica Branom-Zwick, Marc Daudon, Peter Erickson, and Christy Shelton of Cascadia Consulting Group contributed to the research and preparation of several background papers supporting development of the Waste Prevention Strategy. Additional staff members assisted with interviews.
Anna Fleder, James Goldstein, and John Stutz of Tellus Institute and David Stitzhal of Full Circle Environmental also contributed to this research project.
In the interest of waste prevention, this background paper is intended for electronic distribution and viewing. If a hard copy is required, please print double-sided on recycled paper.
Oregon Department of Environmental Quality 07-LQ-006

Waste Prevention: Environmental Considerations
Executive Summary................................................................................................. 1
1 Introduction and Overview........................................................................... 7 1.1 Project Overview ....................................................................................................................... 7 1.2 Report Outline ........................................................................................................................... 8 1.3 Waste Prevention Background.................................................................................................. 7 1.4 Research Scope and Evaluation Methods ................................................................................ 9
2 The Case for Waste Prevention ................................................................. 11 2.1 Upstream Waste Generation................................................................................................... 11 2.2 Climate Change....................................................................................................................... 12 2.3 Toxic Chemical Releases ........................................................................................................ 13 2.4 Toxic Chemical Exposure........................................................................................................ 15 2.5 Biological Resources ............................................................................................................... 15 2.6 Non-renewable Resources ...................................................................................................... 16
3 Measurement Tools .................................................................................... 17 3.1 Oregon Strategy for Greenhouse Gas Reductions and EPA WARM Model........................... 17 3.2 Umberto Materials Flow Software: Germany’s Waste Prevention Accomplishments............ 19 3.3 Lifecycle Assessments (LCA).................................................................................................. 19 3.4 Carnegie Mellon University’s Economic Input-Output Life Cycle Assessment Model ............ 20 3.5 World Resources Institute’s Material Flow Accounts .............................................................. 21 3.6 Summary ................................................................................................................................. 22
4 Quantifying the Benefits of Waste Prevention ......................................... 23 4.1 Energy and Climate Change ................................................................................................... 23 4.2 Resource Consumption ........................................................................................................... 24 4.3 Pollution and Toxic Emissions................................................................................................. 25 4.4 Water Conservation................................................................................................................. 26 4.5 Quantifying the Benefits Summary.......................................................................................... 26
5 Relative Benefits of Waste Prevention...................................................... 27 5.1 Types of Waste Prevention ..................................................................................................... 27 5.2 Waste Prevention and Recycling............................................................................................. 28 5.3 Waste Prevention and Other Environmental Tools ................................................................. 29 5.4 Summary ................................................................................................................................. 30
Waste Prevention Strategy i Background Paper #2 Environmental Considerations December 2006

6 Waste Prevention Benefits Particular to Oregon ..................................... 31
7 Challenges and Opportunities for Waste Prevention .............................. 35 7.1 Opportunities: Innovation........................................................................................................ 35 7.2 Challenges: Counting Local and Global Impacts ................................................................... 36 7.3 Challenges: Measurement...................................................................................................... 36 7.4 Challenges: Inertia and Opposition ........................................................................................ 36 7.5 Challenges: Setting Clear Goals ............................................................................................ 37
Appendix A. Case Studies ................................................................................... 38
Appendix B. References....................................................................................... 44
Appendix C. Additional Resources ..................................................................... 46
Figures Figure 1. Atmospheric CO2 Concentration .......................................................................................... 13
Figure 2. Per Capita Biological Footprints........................................................................................... 16
Figure 3. Estimated Quantities of Waste and Material Outputs in Washington .................................. 25
Figure 4. PCB and PBDE Levels in Northwest Women ...................................................................... 31
Figure 5. PBDE Concentrations in Northwest Women........................................................................ 32
Figure 6. Environmental Impact of Tablecloths ................................................................................... 40
Tables Table 1. U.S. Waste Per Capita .......................................................................................................... 12
Table 2. Oregon Materials Life Cycle, 2015 (Baseline Scenario) ....................................................... 18
Table 3. Highest Impact Consumption Categories.............................................................................. 30
Waste Prevention Strategy ii Background Paper #2 Environmental Considerations December 2006

Executive Summary
Waste prevention has significant environmental benefits beyond saving space in landfills. This study describes those benefits qualitatively and, to the extent feasible, quantitatively. The report:
Summarizes existing literature that addresses the connections between waste prevention and sustainability issues;
Identifies potential measurement tools that could be incorporated into Oregon’s waste prevention strategy;
Compares the relative benefits of waste prevention to other environmental strategies, such as recycling;
Examines benefits of waste prevention that particularly affect Oregon; and
Discusses opportunities and challenges for promoting waste prevention in Oregon.
Waste Prevention Overview and Scope
In this study, waste prevention is defined as reducing the amount of solid waste that is generated and subsequently collected for recovery or for final disposal in landfills or waste incinerators. Methods of waste prevention include:
Reducing consumption of goods and materials outright, without substitution,
Extending the lifetime of products already in use/ownership (and by extension, delaying purchase of replacement items),
Shifting purchases from disposable goods to goods that are more durable, repairable, and/or reusable,
Purchasing used items in lieu of new items,
Shifting purchases and production methods from material-intensive goods to goods that are less material intensive (sometimes referred to as “dematerialization of consumption”), and
Shifting consumption from goods to services so that needs and wants are satisfied in a different manner.
The scope of this assessment of the broader environmental benefits of waste prevention is limited by the budget and the available data and reports. The consultant team conducted a literature review and internet search to find relevant existing reports, articles, and programs. Because it is very difficult to measure waste prevention itself and the environmental impacts of products that end up as waste, quantifying the environmental impacts of waste prevention is an enormous undertaking. As a result, many findings are more qualitative than quantitative, although case studies provide individual instances of quantified evidence.
Waste Prevention Strategy 1 Background Paper #2 Environmental Considerations December 2006

The Compelling Case for Waste Prevention
Although waste prevention has historically been promoted as a way to save space in landfills, it also produces many other benefits that address a host of environmental problems confronting Oregon, including climate change, natural resource depletion, pollution, and water use. By reducing material consumption, waste prevention avoids significant negative impacts upstream and downstream from the consumer at all lifecycle stages: resource extraction, manufacturing, use, and disposal.
Conserve Energy and Reduce Greenhouse Gas Emissions
Waste prevention saves energy and reduces greenhouse gas emissions in all phases of a product’s life cycle. The Oregon Governor’s Advisory Group on Global Warming estimated that most of the greenhouse gas emissions caused by material use in Oregon occur during the manufacturing phase.1 For example, the waste generated annually in Oregon is responsible for emissions of nearly 11 million metric tons of carbon dioxide equivalent (MMTCO2E) due to upstream activities such as manufacturing, while landfilling that waste is responsible for just over a tenth of that amount. Germany’s experience illustrates the potential of waste prevention to reduce carbon emissions. Between 1990 and 2005 through its Waste Management Act, Germany reduced household waste enough to save 30 MMTCO2E annually, statistically equivalent to the annual impact of 2.5 million German residents.
Waste prevention also saves energy. For example, Oregon-based catalog retailer Norm Thompson recently expanded its use of lightweight shipping bags, instead of boxes with void fill, for shipping non-breakable items to customers. This change reduced waste generation by an estimated 627 tons per year and yielded energy savings estimated at 21 billion British thermal units (Btus). Savings of non-renewable energy (fossil fuels and nuclear power) were estimated at 14 billion Btus per year, equivalent to the energy value of roughly 110,000 gallons of gasoline.2
Reduce Resource Consumption
Because a large percentage of resource and waste impacts of many products occurs upstream of the consumer during resource extraction and manufacturing, waste prevention reduces resource consumption and waste far beyond simply decreasing municipal solid waste. In Washington, for example, solid and hazardous waste is estimated to have amounted to less than 5% of the total upstream waste flows.3 If one assumes a constant ratio of downstream waste to upstream wastes, then preventing one pound of solid waste also prevents 19 pounds of waste upstream.
1 Governor’s Advisory Group on Global Warming, Oregon Strategy for Greenhouse Gas Reductions, State of Oregon, December 2004, page B-2. Accessed online August 2006. (http://www.oregon.gov/ENERGY/GBLWRM/Strategy.shtml) 2 Oregon Department of Environmental Quality, Packaging Waste Reduction Case Study: Norm Thompson Outfitters, July 2005, page 5. Accessed online December 2006. (http://www.deq.state.or.us/wmc/packaging/cs/csnormthompson.pdf) 3 Washington State Department of Ecology, Beyond Waste: Waste and Material Flows in Washington, prepared by Cascadia Consulting and Ross and Associates, 2003.
Waste Prevention Strategy 2 Background Paper #2 Environmental Considerations December 2006

Prevent Pollution and Toxic Releases
Waste prevention reduces pollution by avoiding emissions during manufacturing, transport, use, and disposal. For example, in 1996 the U.S. emitted 2,500 tons of arsenic and 18 million tons of synthetic chemicals directly into the environment.4 In addition, some toxic chemicals are not released immediately but are embedded in products and will be released later into homes and the environment. In that same year, the U.S. embedded an estimated 20,500 tons of arsenic and 48 million tons of synthetic chemicals in infrastructure, equipment, and consumer products. Preventing waste can also reduce conventional air pollutants. For example, between 1990 and 2005, Germany’s reduction in household waste disposal reduced emissions of particulate matter by 40,000 tons annually (statistically equivalent to the emissions impact of 1.3 million German residents).
Conserve Water
Waste prevention can also conserve water during resource extraction and manufacturing. Although the literature review found less information in this area, studies that evaluated water impacts generally found that reducing consumption and substituting durable products for disposable products reduces water use. For example, using a ceramic mug 1,000 times reduces water pollution discharges by 97% compared to using 1,000 disposable polystyrene cups.5 Similarly, using rechargeable batteries 200 times consumes 81 times less water than the equivalent services of disposable batteries.6
Measurement Tools
Several measurement tools are available that could be used to quantify the environmental benefits of waste prevention in Oregon and to help develop the Waste Prevention Strategy; however, none is ideal. Quantifying the impacts of an individual product (and thus the benefits of not producing it) depends heavily on the assumptions made about production methods, consumer use, and final disposal. Combining estimates of the impacts of many different products to quantify the benefits of reducing a given mass of municipal solid waste compounds the uncertainty. The available tools vary in their methodologies and applicability to this study and future projects. Some tools, such as lifecycle assessments, are complete analyses with summary impact calculations but are limited in scope and are often product-specific. Other more comprehensive tools, such as ones noted below, could be applied to Oregon as a state, but only with additional research and data collection.
Relevant studies and measurement tools include:
Oregon Strategy for Greenhouse Gas Reductions and EPA Waste Reduction Model (WARM);
Umberto material flows software;
Lifecycle Assessments (LCA);
4 World Resources Institute, The Weight of Nations: Material Outflows from Industrial Economies. Washington, D.C.: World Resources Institute 2000, page 115. Accessed online August 2006. (http://materials.wri.org/weightofnations-pub-3023.html) 5 Richard Denison, Environmental Comparison of Reusable Ceramic Mugs vs. Disposable Cups Made from Polystyrene or Virgin Bleached Paperboard, Alliance for Environmental Innovation (1998). 6 R.L. Lankey and F.C. McMichael, “Life-Cycle Methods for Comparing Primary and Rechargeable Batteries,” Environmental Science and Technology (2000) 34(11):2299-2304.
Waste Prevention Strategy 3 Background Paper #2 Environmental Considerations December 2006

Carnegie Mellon’s Economic Input-Output Life Cycle Assessment Model; and
World Resources Institute’s Material Flow Accounts.
These tools could be used to help identify sectors that have high environmental impacts and should be considered as targets for waste prevention programs or to evaluate the impact of waste prevention programs initiated under the Waste Prevention Strategy.
Relative Benefits of Waste Prevention
Although waste prevention provides benefits in many areas of environmental concern, research suggests that it may be more useful for achieving some environmental goals than others. This assessment of the environmental benefits of waste prevention supports the standard approach that ranks waste prevention as the top waste management priority, above recycling because waste prevention generally yields greater benefits per ton of a given material than recycling. In some cases, however, implementing recycling programs for a given material may be easier, and thus more cost effective, than implementing waste prevention programs.
Our review of the literature also suggests that while waste prevention is a useful environmental tool – likely the best way to conserve non-renewable resources and a good way to prevent pollution – it may not be the most effective way to accomplish other sustainability goals. Several strategies may be needed to achieve the full range of environmental benefits. For example, a recent review of 11 European studies on the impact of household consumption concluded that the greatest negative environmental impacts from households are caused by the consumption of food (especially animal products), housing and related energy use, and transportation.7 The latter product categories have significant impacts during use, not just during production, so in these cases more environmental impacts may be avoided by changing consumer use patterns (e.g., turning down thermostats) or increasing product efficiency than by trying to change purchasing patterns with the limited goal of reducing materials use and waste.
Waste Prevention Benefits Particular to Oregon
The benefits of waste prevention (and the costs of consumption) accrue on both the global and regional or local scale. Examples from the Pacific Northwest or the state of Oregon can highlight these benefits. For example, waste prevention could reduce air pollution in Portland by decreasing emissions from diesel trucks and trains that transport consumer goods. Waste prevention could also potentially decrease other pollution such as mercury deposition in Oregon from manufacturing activities in China and polybrominated diphenyl ethers (PBDEs) from household goods that have been found in Oregon women.
7 Arnold Tukker and Bart Jansen, “Environmental Impacts of Products: A Detailed Review of Studies,” Journal of Industrial Ecology (Summer 2006) 10(3):159-182.
Waste Prevention Strategy 4 Background Paper #2 Environmental Considerations December 2006

Challenges and Opportunities for Waste Prevention
Harnessing the private-sector goals of innovation and efficiency provides a key opportunity for promoting waste prevention in Oregon and achieving the public goal of waste prevention. Waste prevention can both coincide with sustainable economic growth and be driven by market forces of innovation and efficiency. Examples include:
Implementing new technology or better planning to reduce materials needs, saving both money and resources.
Using better planning and coordination to turn wastes from one industry into feedstock for other industrial processes.
Reducing organic or wood-based waste to create carbon emissions reductions that could be sold on the carbon trading market.
The main challenges in creating an effective waste prevention strategy include:
Winning local support (including budget and staffing) for local programs whose benefits are mainly global or otherwise non-local
Measuring the outcomes of waste prevention programs and estimating their resulting benefits
Overcoming social inertia and political opposition to waste prevention programs
Setting clear goals to guide waste prevention programs
Conclusion
Existing research and waste prevention programs show that waste prevention offers significant environmental benefits that could help Oregon achieve broad sustainability goals including greenhouse gas reductions, resource conservation, pollution prevention, and energy and water conservation.
Waste Prevention Strategy 5 Background Paper #2 Environmental Considerations December 2006

1 Introduction and Overview
1.1 Project Overview
To support development of its statewide Waste Prevention Strategy, Oregon’s Department of Environmental Quality conducted or commissioned background research on existing waste prevention and reuse efforts and related topics. In 2006, DEQ hired a team led by Cascadia Consulting Group to conduct some of this background research, and Department staff conducted other research efforts in-house. Eight background papers summarize research findings on the following topics:
1. Waste Generation (DEQ);
2. Environmental Considerations – The benefits of waste prevention and reuse as an environmental strategy and in the context of sustainability (Cascadia);
3. State of Oregon Efforts – State government waste prevention programs in Oregon, including but not limited to DEQ’s solid waste grants (Cascadia);
4. Local Government Efforts – Local government waste prevention programs in Oregon, particularly those covered in DEQ’s 2% recovery rate credit program (Cascadia);
5. Nongovernmental Organizations and Infrastructure – Nongovernmental organizations providing reuse and waste prevention infrastructure and services in Oregon, with an emphasis on food, building materials, electronics, and thrift stores (Cascadia);
6. Business (DEQ);
7. Other States and International Efforts – Waste prevention and reuse efforts outside of Oregon, including examples from around the U.S. and the world (Tellus Institute and Cascadia); and
8. Product Stewardship (DEQ).
This report, Background Paper #2, summarizes research connecting waste prevention to broader environmental benefits. Together, these eight reports compose the research and information-gathering phases designed to inform the development of Oregon’s strategy for waste prevention. This information has been developed to help the Department of Environmental Quality, DEQ’s Waste Prevention Strategy Steering Committee, external stakeholders, and agency managers to develop a statewide Waste Prevention Strategy. The Department will implement the Strategy in 2007 and beyond.
1.2 Waste Prevention Background
Waste prevention sits at the top of the waste management hierarchy, followed by reuse, recycling, composting, energy recovery, and landfilling. Oregon’s 1995-2005 solid waste management plan identified waste prevention as a high priority. It also established a vision of Oregon citizens making a value shift from a “throw-away” society to a conservation society by 2005. From 1993 through 2005, however, Oregon’s total solid waste generation increased 70 percent and per-capita generation increased 43 percent.
Waste Prevention Strategy 7 Background Paper #2 Environmental Considerations December 2006

DEQ’s statewide Waste Prevention Strategy will be designed to help Oregon meet its goals, established in 2001, to stabilize total and per-capita waste generation. Waste generation is defined as the sum of materials recovered (e.g., through recycling) and materials disposed (e.g., in a landfill). Many of DEQ’s past solid waste efforts have focused on recycling, while waste prevention and reuse, which rank higher in the waste management hierarchy, typically have received relatively less emphasis.
Definitions
In this report, waste prevention is defined as reducing the amount of solid waste that is generated and subsequently collected for recovery or for final disposal in landfills or waste incinerators. DEQ categorizes general waste prevention into three types: “pure” waste prevention (also called source reduction), reuse, and home composting (also called onsite organics management). This report focuses primarily on the first and second categories, using waste prevention to mean:
Reducing consumption of goods and materials outright, without substitution,
Extending the lifetime of products already in use/ownership (and by extension, delaying purchase of replacement items),
Shifting purchases from disposable goods to goods that are more durable, repairable, and/or reusable,
Purchasing used items in lieu of new items,
Shifting purchases and production methods from material-intensive goods to goods that are less material intensive (sometimes referred to as “dematerialization of consumption”), and
Shifting consumption from goods to services so that needs and wants are satisfied in a different manner.
Jurisdictions within and beyond Oregon may use different definitions of waste reduction. DEQ defines waste reduction to mean any effort that diverts materials from disposal. Thus, waste reduction encompasses both waste prevention and recovery, which in turn includes recycling and off-site composting. This approach is consistent with the U.S. Environmental Protection Agency’s definition. Confusion may arise, however, because some other states and programs consider waste reduction to mean reducing the amount or toxicity of waste generated or reusing materials. In Oregon, local governments and solid waste program operators can be similarly inconsistent on this matter, contributing to the ambiguity. For the purposes of this report and the Waste Prevention Strategy, however, "waste reduction" means disposal avoidance and includes both waste prevention and recovery.
1.3 Report Outline
Although waste prevention has been promoted predominately as a way to save space in landfills, it also offers many other environmental benefits, such as reducing resource consumption and greenhouse gas emissions. This report presents a summary of the available information on the links between waste prevention and other environmental issues and seeks to help answer the question, “How does waste prevention contribute to environmental sustainability?” It identifies relevant resources that can be used to demonstrate, quantify, and compare the environmental benefits of waste prevention, although quantification is difficult.
Waste Prevention Strategy 8 Background Paper #2 Environmental Considerations December 2006

This report is organized into seven chapters:
1. Introduction and overview.
2. The case for waste prevention describes how waste prevention addresses significant environmental problems.
3. Tools to measure waste prevention benefits examines and evaluates the metrics that could be used to measure broader environmental benefits.
4. Quantifying the benefits of waste prevention presents studies and data that can be used to quantify the environmental benefits of waste prevention and waste management activities.
5. Relative benefits of waste prevention explores the tradeoffs and relative benefits of waste prevention compared to other environmental behaviors.
6. Waste prevention benefits of particular interest to Oregon discusses studies and data that can be used to demonstrate benefits especially relevant to Oregon.
7. Challenges and opportunities identifies issues surrounding waste prevention that DEQ, the Waste Prevention Strategy Steering Committee, and interested parties could consider when planning and implementing the strategy.
1.4 Research Scope and Evaluation Methods
This report focuses on describing the broader environmental benefits of waste prevention qualitatively and, to the extent possible, quantitatively. It is intended to provide DEQ and interested parties with a common understanding and overview of the environmental benefits of waste prevention beyond reducing the burden on landfills. It is also designed to address several key issues, challenges, and opportunities surrounding waste prevention. The purpose of this report is to identify and summarize existing literature that addresses the connections between waste prevention and broader environmental and sustainability issues.
Sustainability is traditionally described as the intersection of three goals: economy, environment, and community. Since 2000, Oregon governors have issued three executive orders on sustainability (EO-00-07, EO-03-03, and EO-06-02), and the State legislature passed a Sustainability Act (HB 3948, 2001) to move Oregon toward more sustainable practices, using “innovative solutions to complex problems.” Waste prevention is one such innovative solution whose many benefits can be categorized according to the three sustainability goals. Waste prevention benefits the economy through financial savings from decreased material and disposal costs. Waste prevention benefits the environment through reduced need for landfills, reduced pollution, reduced consumption of biological and non-renewable resources, and more. Waste prevention benefits the community through reducing the scale of environmental justice problems, among other things. While all three sustainability goals are important, the scope of this report encompasses only the environmental benefits.
The results of this assessment of the broader environmental benefits of waste prevention are limited by the project budget, the scope, and the available data and reports. Conducting comprehensive, independent research and evaluations of the environmental benefits of reducing all types of waste using all different types of waste prevention is beyond the scope of this effort. Accordingly, we necessarily relied on existing data and studies from sources such as the EPA, DEQ, peer-reviewed journals, and industry websites.
Waste Prevention Strategy 9 Background Paper #2 Environmental Considerations December 2006

The consultant team worked with DEQ to identify the set of environmental issues to address. Subsequently, the consultant conducted a literature review and internet search to find relevant existing reports, articles, and programs. A bibliography of cited sources can be found at the end of this report; these sources included:
Six lifecycle analyses (LCA studies)
Oregon Department of Environmental Quality
Environmental Working Group’s Body Burden Report
Internet searches for LCAs and resource consumption tools
Journal of Industrial Ecology
Proquest and other journal databases
Union of Concerned Scientists
U.S. Environmental Protection Agency waste- and climate-related websites
Washington State Department of Ecology
World Resources Institute
Because it is very difficult to measure waste prevention itself and the environmental impacts of products that end up as waste, quantifying the environmental impacts of waste prevention is an enormous undertaking. More quantitative data are generally available on energy consumption and greenhouse gas emissions, but even those numbers are rough estimates when aggregated to the level of general “waste.” Shortages of quantitative data for broad product categories or for waste as a whole, rather than for individual products, hindered research efforts at the summary level. As a result, many findings are more qualitative than quantitative, though case studies provide individual instances of quantified evidence.
Waste Prevention Strategy 10 Background Paper #2 Environmental Considerations December 2006

2 The Case for Waste Prevention
Although waste prevention has historically been promoted as a way to save space in landfills, it also produces many other environmental benefits that address significant environmental problems confronting Oregon. Oregon faces constraints, including increasing pollution and climate change, as well as decreasing non-renewable resources and biological capacity. Material consumption has significant environmental impacts in these areas, both upstream and downstream of the waste generator, or consumer. By reducing material consumption, waste prevention avoids negative environmental impacts at all stages: resource extraction, manufacturing, use, and disposal. These impacts include:
Producing a significant amount of waste upstream from household waste
Consuming energy and producing CO2 and other greenhouse gas emissions that are linked to climate change
Generating pollution and toxic chemical releases
Reducing biological capacity such as native habitat and arable land
Consuming non-renewable resources such as metals and petroleum
Waste prevention goes far beyond reducing the amount of waste in landfills and produces a range of other environmental and economic benefits. The rest of this section will describe the environmental problems to which waste generation contributes and, thus, that waste prevention can help mitigate.
2.1 Upstream Waste Generation
Preventing the generation of municipal solid waste reduces waste both upstream and downstream of the consumer. Much of the waste produced in the United States occurs in the resource extraction and manufacturing sectors, rather than the household sector. The final products that consumers see (and eventually dispose) represent only a fraction of the total waste generated by household products.
The U.S. produced 23 billion metric tons of waste* in 1996, more than 85 tons per person.8 Industry produced the largest share of this waste (45%), while less than 3% of it came from households (see Table 1). If we assume that the amounts of household waste and industrial wastes are proportionally linked – because industry is ultimately producing goods primarily for households – then reducing household waste by 0.2 tons (10%) could reduce industrial waste by nearly 4 tons, almost a 20-fold impact. If energy and transportation impacts are also included, the reduction would be even greater.
8 World Resources Institute, The Weight of Nations: Material Outflows from Industrial Economies (Washington, D.C.: World Resources Institute, 2000). Accessed online August 2006. (http://materials.wri.org/weightofnations-pub-3023.html) * Note that waste in this example includes erosion, mining overburden, excavation, and carbon dioxide.
Waste Prevention Strategy 11 Background Paper #2 Environmental Considerations December 2006

Table 1. U.S. Waste Per Capita (from World Resources Institute)9
Waste by Sector Per capita, metric tons % of total waste
Agriculture 17 19%
Construction 14 16%
Energy Supply 8 10%
Industry (mining and manufacturing) 39 45%
Household 2 3%
Transport 7 8%
Total 86 100%
Note: This graphic was created using data in The Weight of Nations: Material Outflows from Industrial Economies, published by World Resources Institute, available via the internet.
2.2 Climate Change
Since the Industrial Revolution, the concentration of carbon dioxide in the atmosphere has increased 35%.10 This increase is primarily due to man-made sources such as fossil fuel burning for production and transportation; see Figure 1.
Scientists link the increase in atmospheric carbon dioxide to climate change and predict that it will affect Oregon in the following ways over the next 10-50 years:11
Hotter summers with a greater likelihood of summer droughts
More severe rain and snow storms, but a smaller snow pack to store water against summer droughts
Sea level rise that threatens coastal towns
Longer, more severe forest fire season due to drought stress, disease, and pest infestations
9 Waste in this table also includes erosion, mining overburden, excavation, and carbon dioxide. A waste is an undesirable byproduct or material that is released into the land, water or air. Waste is traditionally though of in terms of solid waste, but pollutants that have a negative impact on the environment also include carbon dioxide, the primary greenhouse gas associated with global warming. Over their lifecycle, products have a significant greenhouse gas impact. 10 Governor’s Initiative on Global Warming, “Climate Change and Oregon.” Accessed online August 2006. (http://www.oregon.gov/ENERGY/GBLWRM/climhme.shtml) 11 Oregon State University, Institute for Natural Resources, “Scientific Consensus Statement on the Likely Impacts of Climate Change in the Pacific Northwest,” Product of the Impacts of Climate Change on the Pacific Northwest scientific meeting, June 2004. Accessed online August 2006. (http://inr.oregonstate.edu/download/climate_change_consensus_statement_final.pdf)
Waste Prevention Strategy 12 Background Paper #2 Environmental Considerations December 2006
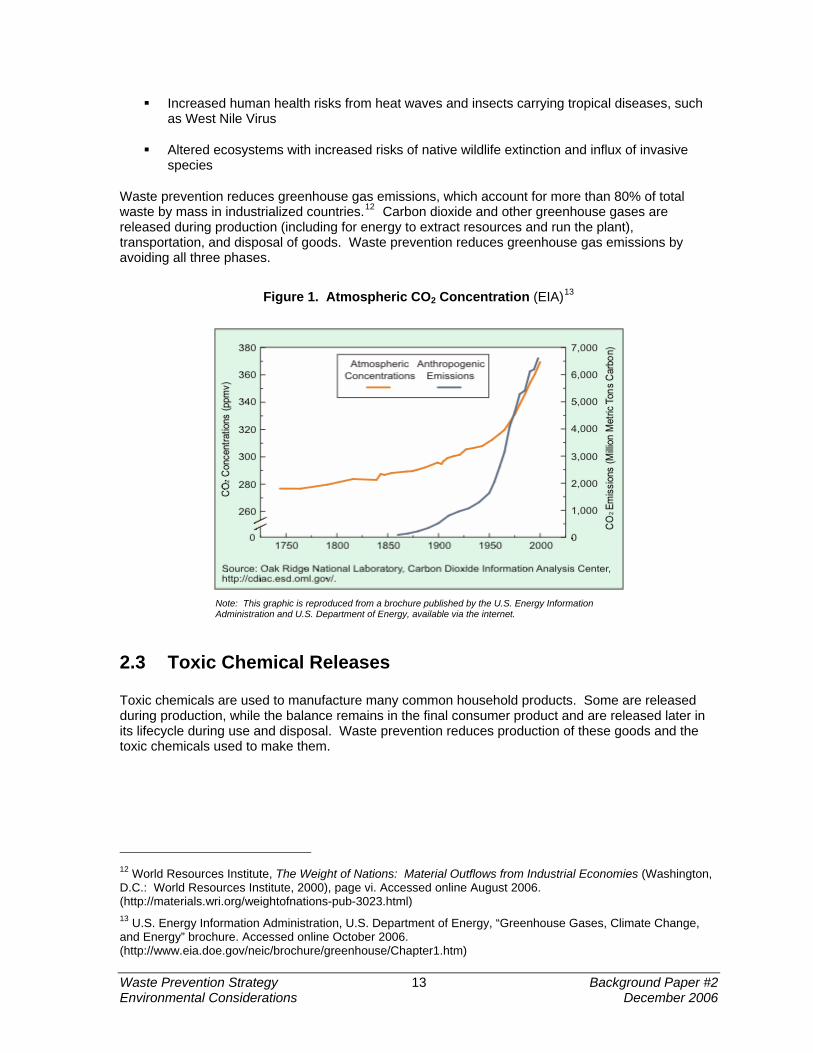
Increased human health risks from heat waves and insects carrying tropical diseases, such as West Nile Virus
Altered ecosystems with increased risks of native wildlife extinction and influx of invasive species
Waste prevention reduces greenhouse gas emissions, which account for more than 80% of total waste by mass in industrialized countries.12 Carbon dioxide and other greenhouse gases are released during production (including for energy to extract resources and run the plant), transportation, and disposal of goods. Waste prevention reduces greenhouse gas emissions by avoiding all three phases.
Figure 1. Atmospheric CO2 Concentration (EIA)13
Note: This graphic is reproduced from a brochure published by the U.S. Energy Information Administration and U.S. Department of Energy, available via the internet.
2.3 Toxic Chemical Releases
Toxic chemicals are used to manufacture many common household products. Some are released during production, while the balance remains in the final consumer product and are released later in its lifecycle during use and disposal. Waste prevention reduces production of these goods and the toxic chemicals used to make them.
12 World Resources Institute, The Weight of Nations: Material Outflows from Industrial Economies (Washington, D.C.: World Resources Institute, 2000), page vi. Accessed online August 2006. (http://materials.wri.org/weightofnations-pub-3023.html) 13 U.S. Energy Information Administration, U.S. Department of Energy, “Greenhouse Gases, Climate Change, and Energy” brochure. Accessed online October 2006. (http://www.eia.doe.gov/neic/brochure/greenhouse/Chapter1.htm)
Waste Prevention Strategy 13 Background Paper #2 Environmental Considerations December 2006

One immediate effect of the production of goods can be measured by the amount of chemicals released into the environment (air, water, soil) in a given year. According to DEQ estimates, 1,600 pounds of mercury are contained in products disposed of annually in Oregon.14 Nationally, in 1996 the U.S. emitted directly into the environment:15
2,500 tons of arsenic;
1,800 tons of cadmium;
128,000 tons of lead;
18 million tons of synthetic chemicals; and
100 tons of mercury.
A large amount of these and other chemicals are not released immediately but are embedded in infrastructure, equipment, and consumer goods. These chemicals will enter the environment in the future as the goods (e.g., tires, carpet) are used and disposed. Also in 1996, the U.S. embedded the following materials in infrastructure, equipment, and consumer products:16
20,500 tons of arsenic;
500 tons of cadmium;
469,000 tons of lead; and
48 million tons of synthetic chemicals.
Although mercury is still embedded in new consumer products such as analog thermometers and fluorescent light bulbs, it is also being removed from households and industry. Household hazardous waste programs can collect mercury and mercury-containing products, and redesign can reduce or eliminate mercury content in such products as thermostats, switches, pharmaceuticals, and fluorescent lamps. Such efforts are estimated to have reduced the total stock of mercury embedded in all products by a net amount of 200 tons, as older products with higher mercury content are phased out, collected, and replaced by those with lower mercury content. The study, however, did not provide an estimate of total mercury content embedded in all products.17
14 Oregon Department of Environmental Quality, Mercury Reduction Strategy, November 2002. Accessed online October 2006. (http://www.deq.state.or.us/programs/consumercorner/mercury/mercuryreduction.htm) 15 World Resources Institute, The Weight of Nations: Material Outflows from Industrial Economies (Washington, D.C.: World Resources Institute, 2000), page 115. Accessed online August 2006. (http://materials.wri.org/weightofnations-pub-3023.html) 16 World Resources Institute, The Weight of Nations: Material Outflows from Industrial Economies (Washington, D.C.: World Resources Institute, 2000), page 115. Accessed online August 2006. (http://materials.wri.org/weightofnations-pub-3023.html) 17 World Resources Institute, The Weight of Nations: Material Outflows from Industrial Economies (Washington, D.C.: World Resources Institute, 2000), page 115. Accessed online August 2006. (http://materials.wri.org/weightofnations-pub-3023.html)
Waste Prevention Strategy 14 Background Paper #2 Environmental Considerations December 2006

2.4 Toxic Chemical Exposure
Manmade chemicals have been found in the blood, urine, and breast milk of Americans. The Environmental Working Group recently tested 72 people around the U.S., finding their bodies contained a total of 455 different chemicals, including:18
Perfluorocarbons (PFCs);
Polybrominated diphenyl ethers (PBDEs);
Plasticizers/phthalates;
Metals (e.g., lead, mercury, arsenic);
Organophosphate Pesticide metabolites (OPs);
Brominated and chlorinated dioxins and furans;
Polycyclic aromatic hydrocarbons (PAHs);
Volatile and semi-volatile organic compounds (VOCs and SVOCs); and
Polychlorinated biphenyls (PCBs).
Many of these chemicals are linked to health problems including cancer, hormone disruption, immune system problems, liver and kidney damage, behavioral disorders, and developmental delays. In addition, the complete health effects of many of these chemicals are still unknown.
Material consumption increases exposure to chemicals, such as those mentioned previously, through product use and industrial releases. Waste prevention reduces exposure by reducing chemical production and releases.
2.5 Biological Resources
Material consumption uses land and biological resources in resource extraction, manufacturing, goods transportation, and disposal. Land is cleared and disturbed for mining, agriculture, and forestry, as well as paved for roads, factories, and stores. Waste prevention conserves biological resources by reducing the pressure to convert native habitat for developed uses.
The U.S. currently consumes one fourth of the world’s biological capacity.19 As measured by its global footprint (the average amount of land used to produce the goods and services consumed at current levels), the U.S. used 9.7 global hectares per person in 2000. By contrast, Canadians consumed 7.4 global hectares per person and residents of the European Union consumed 4.7. In that year, Earth could support its population sustainably only if people consumed an average of 1.8 global hectares per person. See Figure 2. If everyone on the planet consumed at the American rate,
18 Environmental Working Group, Body Burden: Pollution in People (2000-2006). Accessed online July 2006. (http://www.bodyburden.org) 19 European Environment Agency and Global Footprint Network, National Footprint and Biocapacity Accounts, 2005 Edition. Available at http://org.eea.europa.eu/news/Ann1132753060.
Waste Prevention Strategy 15 Background Paper #2 Environmental Considerations December 2006

we would need 5.4 Earths to sustain consumption.20 However, these estimates assume that all of the earth’s biological capacity is available for human use, with no land set aside for other biological uses, such as wildlife habitat, besides the production of goods or assimilation of wastes. In order to maintain biological diversity on Earth, the land available for human use is less than 1.8 global hectares per person.
Figure 2. Per Capita Biological Footprints21
Consumption of World Resource
0 1 2 3 4 5 6 7 8 9 10
US
Canada
EU
China
Earth's capacity
global hectares/person
Note: This graphic was created from data published by the European Environment Agency and Global Footprint Network, available via the internet.
2.6 Non-renewable Resources
Current over-consumption and landfill disposal of non-renewable resources threatens future consumption in a resource-constrained world. Some resources, such as fuel, cannot be recycled or reproduced once used. Others, such as metals, could conceivably be retrieved from landfills, but only at great cost and with technological advances.
As an example, Yale University researchers recently estimated that 26% of extractable copper and 19% of extractable zinc have been disposed in non-recyclable wastes. They lack data for other scarce metals but expect that they have been similarly rendered unusable.22 Although much of these materials have been deposited in known landfills, the researchers also report that without considerable technological advances, future retrieval of these metals from landfills is unlikely, making them essentially permanently unrecoverable. Waste prevention reduces the rate at which non-renewable resources are consumed, conserving a larger portion for future use.
20 European Environment Agency and Global Footprint Network, National Footprint and Biocapacity Accounts, 2005 Edition. Available at http://org.eea.europa.eu/news/Ann1132753060. 21 European Environment Agency and Global Footprint Network, National Footprint and Biocapacity Accounts, 2005 Edition. Available at http://org.eea.europa.eu/news/Ann1132753060. 22 Gordon, R.B. et al., “Metal Stocks and Sustainability,” Proceedings of the National Academy of Sciences (2006) 103(5):1209-1214.
Waste Prevention Strategy 16 Background Paper #2 Environmental Considerations December 2006

3 Measurement Tools
The preceding section made the case for why waste prevention is important. The following section will attempt to quantify the benefits of waste prevention. However, because municipal solid waste varies so much, quantifying the benefits of waste prevention is difficult. This section discusses tools commonly used to quantify those benefits and how DEQ could use them in developing and evaluating its Waste Prevention Strategy.
Quantifying the impacts of an individual product (and thus the benefits of not producing it) depends heavily on the assumptions made about production methods, consumer use, and final disposal. Combining estimates of the impacts of many different products to determine the benefits of reducing a given mass of municipal solid waste compounds the uncertainty. The literature review found only two studies (one from Oregon, one from Germany) that even attempted to estimate the broader impacts of waste management.
The available tools vary in their methodologies and applicability to this study and future projects. Some tools, such as lifecycle assessments, are complete analyses with summary calculations but are limited in scope and number.23 Other more comprehensive tools, such as the Economic Input-Output Life Cycle Assessment Model, could be applied to Oregon as a state, but only with additional research and data collection.
The rest of this section will describe the five main tools identified through this research and how they can be used:
Oregon Strategy for Greenhouse Gas Reductions and the EPA Waste Reduction Model (WARM)
Umberto materials flow software
Lifecycle assessments
Carnegie Mellon University’s Economic Input-Output Life Cycle Assessment (EIO-LCA) Model
World Resources Institute’s material flows accounting
3.1 Oregon Strategy for Greenhouse Gas Reductions and EPA Waste Reduction Model (WARM)
The Oregon Strategy for Greenhouse Gas Reductions (2004) used U.S. Environmental Protection Agency data and a customized model to estimate the greenhouse gas impact of materials used by Oregon households and businesses. The model counted impacts over the lifecycle of the materials from extraction and manufacturing to final disposal, finding that most greenhouse gas emissions occurred in the upstream phase of waste generation. See Table 2. The model could be used to estimate reductions in greenhouse gas emissions from reductions in waste generation for individual material categories.
23 Another limitation of LCA is that there appear to be far more data sets with raw lifecycle data than published reports with analysis.
Waste Prevention Strategy 17 Background Paper #2 Environmental Considerations December 2006

Table 2. Oregon Materials Life Cycle, 2015 (Baseline Scenario)24
(from Oregon Strategy for Greenhouse Gas Reduction)
Impact Phase MMTCO2E Waste Generation “Upstream” activities of resource extraction, product manufacturing, and transportation 10.92Recycling Material production and transportation -1.01Indirect carbon storage in forests -2.13Composting Production and transportation 0.02Carbon storage in soils treated with compost -0.1Combustion Open burning* 0.06Mass incineration of garbage (Marion, Coos counties) 0.1Emissions from combustion of other wastes for energy 0.22Energy recovery offset -0.58Landfilling** Pre-2003 waste 1.3Waste 2003-2015 0.04Total 8.94
MMTCO2E = million metric tons of carbon dioxide equivalent Negative numbers represent offsets. Positive numbers represent net emissions. * Agricultural and forestry open burning not included ** For pre-2003 waste, only methane emissions and energy recovery offsets are included. For waste disposed of in 2003 and subsequent years, the number shown includes methane emissions, energy recovery offsets, transportation/equipment emissions in 2015, and the sizeable carbon storage offsets for materials disposed of in landfills.
Note: This graphic is reproduced from the Oregon Strategy for Greenhouse Gas Reduction published by the State of Oregon, available via the internet.
The EPA WARM model, which is essentially a simpler version of Oregon’s model, calculates estimated changes in greenhouse gas emissions from changing the amount of material that is source reduced (through waste prevention), recycled, landfilled, combusted, and composted.25 Using the web-based calculator involves:
Estimating the baseline waste management scenario including tons of individual materials (newspaper, HDPE, grass, etc.) and current disposal method (landfill, recycling);
Describing an alternative management scenario that can include waste prevention; and
Describing basic characteristics about local landfills and transport distances.
24 Governor’s Advisory Group on Global Warming, State of Oregon, “Oregon Strategy for Greenhouse Gas Reductions,” December 2004. Accessed online August 2006. (http://www.oregon.gov/ENERGY/GBLWRM/Strategy.shtml) 25 U.S. Environmental Protection Agency, “Waste Reduction Model (WARM).” (http://yosemite.epa.gov/OAR/globalwarming.nsf/content/ActionsWasteWARM.html)
Waste Prevention Strategy 18 Background Paper #2 Environmental Considerations December 2006

The EPA model then calculates the resulting increase or decrease in net carbon-equivalent emissions, taking the entire lifecycle into account. The EPA also has an Excel-based version that calculates energy use.
Oregon’s Materials Life Cycle model and the EPA WARM model could be used to compare strategy alternatives by estimating reduced greenhouse gas emissions resulting from planned changes in generation and disposal of individual materials. The Oregon model could also be updated and maintained to track the benefits yielded by the Waste Prevention Strategy.
Both models require data on the quantities of individual materials generated, recycled, landfilled, etc., which may necessitate regular waste composition studies for accurate results. The EPA model cannot be used to estimate the actual carbon emissions of a given scenario (e.g., the baseline), only the change in emissions. In addition, the EPA model does not address impacts of the use phase or of transport from the producer to the consumer. Similarly, Oregon’s model does not account for emissions during the use phase, but it does include some rough estimates of emissions associated with transportation of goods.
3.2 Umberto Materials Flow Software: Germany’s Waste Prevention Accomplishments
In 1996, Germany’s Close Substance Cycle and Waste Management Act took effect, setting priorities for waste prevention and recycling and creating a legal requirement for product stewardship. Between 1990 and 2001, Germany’s GDP grew by 15% while household waste remained constant.26 Germany recently assessed the environmental impacts of that act using Umberto, a materials flow software.27
Umberto allows users to estimate the environmental impacts of individual products, companies, or government programs. For example, Germany estimated that the reduction in household waste resulting from waste prevention and recycling reduced over-fertilization of waterways by 23,000 tons of nutrient equivalent (statistically equivalent to the annual impact of 4 million German residents).
Germany’s Waste Management Act could be used as a model for waste management efforts in Oregon. Umberto or another materials flow software could be used to identify waste materials that have a high environmental impact and that may warrant targeting in the Waste Prevention Strategy.
3.3 Lifecycle Assessments (LCA)
Lifecycle assessments typically calculate or compare the material and/or energy requirements or the environmental impacts of individual products over their lifecycles, from manufacturing to disposal. There are two types of lifecycle assessments: inventory and impact. Inventory assessments calculate the material and energy inputs and the pollutant outputs associated with the production, use, and disposal of a product over all or part of its lifecycle (e.g., energy inputs, toxic emissions). In contrast, impact assessments combine the results of inventory assessments with other assumptions (e.g., the health effects of individual chemicals, prevailing wind patterns, and the number of people
26 Note that this may be an artifact of the producer responsibility requirement shifting waste disposal away from households and onto businesses. 27 Jurgen Giegrich and Regine Vogt, “The Contribution of Waste Management to Sustainable Development in Germany: Section on Municipal Waste,” published by the IFEU Institute Heidelberg. Accessed online July 2006. (http://www.bmu.de/english/waste_management/downloads/doc/35563.php)
Waste Prevention Strategy 19 Background Paper #2 Environmental Considerations December 2006

affected) to estimate the potential impacts of a product (e.g., the number of additional cancer cases or acres of contaminated soil).
Oregon DEQ’s Solid Waste Program has recently developed some experience with lifecycle assessments. In 2003, DEQ commissioned a groundbreaking inventory analysis of e-commerce packaging options for e-commerce products, which is summarized in Appendix A. Lifecycle analysis tools developed by EPA for estimating greenhouse gas emissions and energy conservation benefits of recycling have been used extensively by DEQ in recent years. DEQ is also participating in a national lifecycle impact analysis of management options for leftover latex paint. Although DEQ’s application of lifecycle assessment has been fairly limited to date, its use of lifecycle tools is more extensive than many other state government solid waste programs in the United States.
Lifecycle assessments can be used in the Waste Prevention Strategy as a body of literature from which to draw general conclusions about the benefits of waste prevention. This report uses LCAs as case studies to demonstrate the benefits of waste prevention, especially by illustrating the relative environmental burden of manufacturing compared to use and disposal. See Appendix A for case study summaries and Appendix C for a list of institutions engaged in LCA research.
Lifecycle assessments often rely on technical assumptions that can greatly influence their results, making them less robust to technological changes over time or to differing assumptions. They also frequently focus on very specific products, rather than general product categories or consumer products as a whole, so it may be difficult to generalize quantifiable benefits beyond the individual case studies. In addition, LCAs are often designed to compare two production processes for one product or to compare two similar products, and thus may quantify only relative rather than absolute impacts. While there are several databases with raw impact data that can be used to perform lifecycle assessments, complete LCAs of products are difficult to find, especially those that compare disposable vs. durable products.
3.4 Carnegie Mellon University’s Economic Input-Output Life Cycle Assessment Model
Carnegie Mellon’s Economic Input-Output Life Cycle Assessment (EIO-LCA) Model estimates the environmental impacts of producing goods or services based on a dollar amount of production in a particular sector. 28 The model calculates energy consumption and releases of greenhouse gases, conventional air pollutants, and toxic chemicals. To use the calculator:
Choose an industry sector and possibly a subsector
Choose the dollar value of output to be produced in 1997 prices. (This represents the producer price, not the consumer’s retail price.)
Choose the impact categories for analysis (e.g., energy, toxics)
If DEQ could obtain dollar values of the production or consumption of goods in individual sectors in Oregon, the model could be used to estimate the environmental impacts for each sector. Production values are likely easy to obtain from gross state product estimates. Consumption data are likely more difficult to obtain with precision; however, national consumption estimates could be scaled to Oregon’s population for a rough approximation.
28 Carnegie Mellon University, Green Design Institute. Economic Input-Output Life Cycle Assessment (EIO-LCA) model, 2006. (http://www.eiolca.net)
Waste Prevention Strategy 20 Background Paper #2 Environmental Considerations December 2006

Estimates of the environmental impacts of each economic sector could then be used to identify which sectors have relatively high impacts due to consumption in Oregon and that should, therefore, be considered for waste prevention efforts. DEQ, however, would also need to consider that regulatory, financial, education and outreach, or other types of interventions may be more effective in some sectors than in others. Accordingly, programs should be targeted toward sectors that not only impose high impacts but that are also most readily motivated to make changes.
Results for Oregon-specific consumption impacts could also be summed across sectors to yield state-wide estimates as a baseline measurement. California recently used the EIO-LCA model to estimate the global warming impact of 50 products manufactured in that state.29
The EIO-LCA model requires fairly detailed data on individual sectors and subsectors because it does not allow estimates by broad industries. While data on the production of goods by industrial sector in Oregon may be reasonably attainable through existing sources such as tax and gross state product databases, data on consumption in Oregon may prove more difficult and/or expensive to acquire.
The model is also limited to 1997 data, which do not capture recent technological advances or changes in production methods. The model continues to be cited and used in the literature, however, suggesting that it remains a relevant tool that DEQ could use.
3.5 World Resources Institute’s Material Flow Accounts
World Resources Institute’s (WRI) Material Flow Accounts categorize 190 basic materials flowing through the U.S. economy as raw inputs, commodities, and wastes.30 The summary data that are available include:
Total Material Requirements (the sum of all material inputs)
Total Domestic Output (the sum of all wastes released into the domestic (U.S.) environment)
Hidden Flows (the sum of materials that don’t enter the dollar economy; e.g., mining overburden, soil erosion)
The national sum of total domestic output and hidden flows could be scaled by Oregon’s population or sector size (e.g., agriculture) to estimate total waste generated by Oregon (beyond waste that is traditionally tracked) or to suggest which sectors (and thus which consumer products) to target for waste prevention.
Tailoring the material flows model to Oregon would be difficult and would yield only approximate estimates, as demonstrated by a similar attempt for Washington.
29 California Energy Commission, Public Interest Energy Research Program, “Optimization of Product Life Cycle to Reduce Greenhouse Gas Emissions in California,” prepared by Lawrence Berkeley National Laboratory (August 2005). 30 World Resources Institute, “Materials Flow Accounting Database” (1975-2000). (http://materials.wri.org/topic_data_trends.cfm)
Waste Prevention Strategy 21 Background Paper #2 Environmental Considerations December 2006

3.6 Summary
Each of the tools described in this section has a potential use in developing or implementing the Waste Prevention Strategy, but likely the most useful tools would be the model used in the Oregon Strategy for Greenhouse Gas Reductions and either the Umberto materials flow software (which could be expensive) or the Carnegie Mellon University’s EIO-LCA model because these tools take a whole-systems approach to calculating the benefits of waste prevention and could be used to model the effects of several different approaches. Lifecycle assessments may also be useful in evaluating specific, higher-priority options and identifying the environmental benefits of specific practices for promotional or other purposes.
Waste Prevention Strategy 22 Background Paper #2 Environmental Considerations December 2006

4 Quantifying the Benefits of Waste Prevention
This section discusses the evidence quantifying the benefits of waste prevention. Because of the challenges discussed previously, this report supports its conclusions by summarizing general findings from the literature and highlighting lifecycle assessment case studies. More details on the case studies can be found in Appendix A.
Before turning to the evidence, however, it is important to note that waste prevention sometimes has tradeoffs. While reducing consumption of a good without substitution avoids most of the impact caused by that product, frequently waste prevention occurs by substituting disposable products with reusable ones (such as paper vs. cloth tablecloths), physical goods with electronic substitutions (e.g., a newspaper vs. online media), or new goods with reused ones. This can trade impacts in one area for those in another. For example, online media reduce the forest destruction (thus carbon emissions) caused by newspapers, but generally require more hazardous materials to produce.31
In addition, some products, such as textiles, have significant impacts during use (e.g., laundering), not just during production. As a result, more lifecycle impacts may be avoided by changing consumer use patterns (e.g., washing with cold water) than by trying to change purchasing patterns.
4.1 Energy and Climate Change
Waste prevention saves energy and reduces greenhouse gas emissions in all phases of a product’s life cycle. First, energy use and emissions are reduced through less resource extraction, manufacturing, and transportation. The Oregon Strategy for Greenhouse Gas Reductions estimated that most of the greenhouse gas emissions caused by material use in Oregon occurred during the manufacturing phase. See Table 2 on page 18. Second, waste prevention reduces greenhouse gas emissions in the disposal phase from landfills, composting, and incineration facilities. The EPA has estimated materials-specific GHG emissions savings for various MSW management methods, finding that waste prevention reduces emissions during final disposal and manufacturing and avoids lost carbon sequestration (in the case of paper and wood products). In most cases, waste prevention yields greater environmental benefits than recycling or energy recovery.32
The impacts of waste management can be significant. Between 1990 and 2005, Germany reduced household waste through waste prevention and recycling to save 30 million tons of CO2-equivalent a year, statistically equivalent to the annual impact of 2.5 million German residents.
Most lifecycle analyses found in the literature review include measurements or comparisons of lifecycle energy use or greenhouse gas emissions. LCAs generally support the assertion that waste prevention can save a significant amount of energy and greenhouse gas emissions. For example, a Danish industry-sponsored study found that using cotton instead of paper tablecloths reduces energy
31 Hirschier, Roland and Inge Reichart “Multifunctioning Electronic Media – Traditional Media” International Journal of Life Cycle Assessments (2003) 8(4):201-208. 32 Waste Reduction Model (WARM) has calculators for comparing GHG emissions from source reduction, recycling, landfilling, combustion. (http://yosemite.epa.gov/OAR/globalwarming.nsf/content/ActionsWasteWARM.html) “Solid Waste Management and Greenhouse Gases: A Life-Cycle Assessment of Emissions and Sinks” explains the methodology and findings behind WARM.
It is interesting to note, however, that in a few cases increasing recycling yields a greater benefit on a ton-per-ton basis than reducing generation because the model assumes that recycling displaces virgin material while waste prevention displaces a mix of virgin and post-consumer material, given the current recycling rate. (See Section 5.2 Waste Prevention and Recycling on page 28 for more details.)
Waste Prevention Strategy 23 Background Paper #2 Environmental Considerations December 2006

use by 35% and greenhouse gas emissions by 55%.33 A U.S. study found that rechargeable batteries use 33 times less electricity to produce than disposables, if used 200 times.34 A Korean study of personal computers found that 85% of global warming impacts occur before the consumer receives the product, so waiting longer between computer upgrades can significantly reduce greenhouse gas emissions.35 Finally, an Oregon DEQ study found that “lightweighting” packaging by using a bag for mailing catalog orders requires 7 to 29% of the energy needed for a box over the packaging’s lifecycle.36
4.2 Resource Consumption
Waste prevention reduces resource consumption and waste generation beyond decreasing municipal solid waste. Between 1990 and 2005, German households reduced and recycled their production of waste enough to save 1 million tons of iron ore annually (statistically equivalent to the annual impact of 1.2 million German residents) and 26,000 tons of phosphate ore (equivalent to the impact of 3 million residents).
The literature review found that a large percentage of lifecycle waste occurs upstream during resource extraction and manufacturing for many products. In Washington, for example, solid and hazardous waste in 2000 (tracked by the Department of Ecology) is estimated to have amounted to less than 5% of the upstream waste flows (see Figure 3).37 If one assumes a constant ratio of solid waste to upstream wastes (barring technological advances in production or other changes in the relationship), then preventing one pound of solid waste also prevents 19 pounds of waste upstream.
The lifecycle analyses the consultant reviewed generally support the conclusion that upstream resource extraction, manufacturing, and transportation activities generate much more waste than end-of-life disposal. The numbers in these studies may be less dramatic, however, particularly if mining overburden or the weight of carbon emissions are not included. For example, roughly 95% of the non-renewable resource use to produce personal computers is estimated to occur during their manufacture and use, rather than disposal.38 In addition, LCAs offer examples of how switching from disposable products to reusable products can significantly reduce material inputs and waste generation. For example, a ceramic mug used 1,000 times requires 3 pounds of material inputs and creates 4.7 pounds of solid waste, while an equivalent 1,000 polystyrene disposable cups each used once requires 12 pounds of material inputs and creates 8.7 pounds of solid waste (not including the additional packaging or upstream solid waste associated with the disposable cups).39 Similarly, a steel spoon used 1,000 times requires 0.3 pounds of material inputs and creates 0.3 pounds of solid
33 LCA Center “LCA Used for Marketing Purposes” written by Jeppe Frydendal from an LCA prepared by the Danish Textile Service Association. Accessed online July 2006. (http://www.lca-center.dk/cms/site.asp?p=4025) 34 R.L. Lankey and F.C. McMichael, “Life-Cycle Methods for Comparing Primary and Rechargeable Batteries,” Environmental Science and Technology (2000) 34(11):2299-2304. 35 B-C Choi et al., “Life Cycle Assessment of a Personal Computer and its Effective Recycling Rate,” International Journal of Life Cycle Assessments (2006) 11(2):122-128. 36 Oregon Department of Environmental Quality, “Life Cycle Inventory of Packaging Options for Shipment of Retail Mail-Order Soft Goods,” prepared by Franklin Associates (April 2004). Accessed online July 2006. (http://www.deq.state.or.us/wmc/solwaste/data/LifeCycleReport.htm) 37 Washington State Department of Ecology, Beyond Waste: Waste and Material Flows in Washington, prepared by Cascadia Consulting and Ross and Associates (2003). 38 B-C Choi et al., “Life Cycle Assessment of a Personal Computer and its Effective Recycling Rate,” International Journal of Life Cycle Assessments (2006) 11(2):122-128. 39 Richard Denison, “Environmental Comparison of Reusable Ceramic Mugs vs. Disposable Cups Made from Polystyrene or Virgin Bleached Paperboard,” Alliance for Environmental Innovation (1998).
Waste Prevention Strategy 24 Background Paper #2 Environmental Considerations December 2006
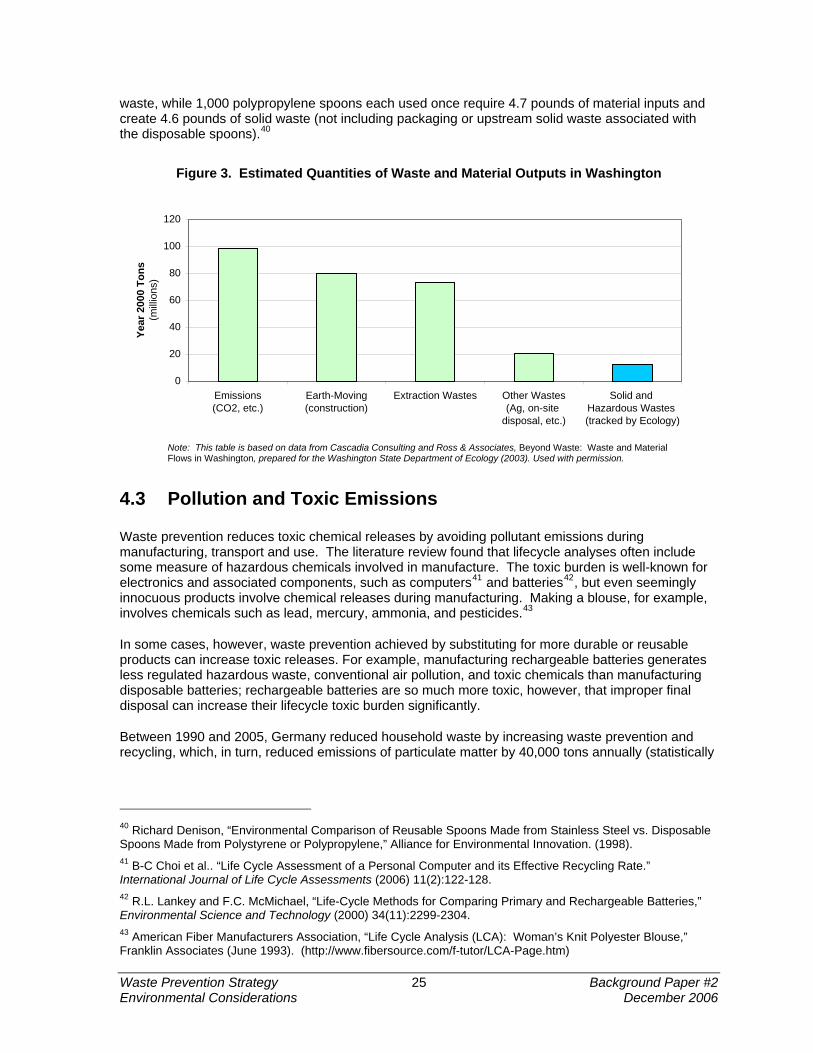
waste, while 1,000 polypropylene spoons each used once require 4.7 pounds of material inputs and create 4.6 pounds of solid waste (not including packaging or upstream solid waste associated with the disposable spoons).40
Figure 3. Estimated Quantities of Waste and Material Outputs in Washington
0
20
40
60
80
100
120
Emissions(CO2, etc.)
Earth-Moving(construction)
Extraction Wastes Other Wastes(Ag, on-site
disposal, etc.)
Solid and Hazardous Wastes (tracked by Ecology)
Year
200
0 To
ns
(milli
ons)
Note: This table is based on data from Cascadia Consulting and Ross & Associates, Beyond Waste: Waste and Material Flows in Washington, prepared for the Washington State Department of Ecology (2003). Used with permission.
4.3 Pollution and Toxic Emissions
Waste prevention reduces toxic chemical releases by avoiding pollutant emissions during manufacturing, transport and use. The literature review found that lifecycle analyses often include some measure of hazardous chemicals involved in manufacture. The toxic burden is well-known for electronics and associated components, such as computers41 and batteries42, but even seemingly innocuous products involve chemical releases during manufacturing. Making a blouse, for example, involves chemicals such as lead, mercury, ammonia, and pesticides.43
In some cases, however, waste prevention achieved by substituting for more durable or reusable products can increase toxic releases. For example, manufacturing rechargeable batteries generates less regulated hazardous waste, conventional air pollution, and toxic chemicals than manufacturing disposable batteries; rechargeable batteries are so much more toxic, however, that improper final disposal can increase their lifecycle toxic burden significantly.
Between 1990 and 2005, Germany reduced household waste by increasing waste prevention and recycling, which, in turn, reduced emissions of particulate matter by 40,000 tons annually (statistically
40 Richard Denison, “Environmental Comparison of Reusable Spoons Made from Stainless Steel vs. Disposable Spoons Made from Polystyrene or Polypropylene,” Alliance for Environmental Innovation. (1998). 41 B-C Choi et al.. “Life Cycle Assessment of a Personal Computer and its Effective Recycling Rate.” International Journal of Life Cycle Assessments (2006) 11(2):122-128. 42 R.L. Lankey and F.C. McMichael, “Life-Cycle Methods for Comparing Primary and Rechargeable Batteries,” Environmental Science and Technology (2000) 34(11):2299-2304. 43 American Fiber Manufacturers Association, “Life Cycle Analysis (LCA): Woman’s Knit Polyester Blouse,” Franklin Associates (June 1993). (http://www.fibersource.com/f-tutor/LCA-Page.htm)
Waste Prevention Strategy 25 Background Paper #2 Environmental Considerations December 2006

equivalent to the impact of 1.3 million German residents) and acidification by 60,000 tons of acid equivalent (equivalent to the impact of 1.5 million residents).
4.4 Water Conservation
Waste prevention can conserve water during resource extraction and manufacturing. Although the literature review found less information on water use, in the studies that mentioned water, the review generally found that reducing consumption and substituting durable products for disposable products reduces water use. However, in some cases, such as textiles and dishware, substitutions for disposable products require washing that can offset benefits. Nonetheless, examples of water saving associated with durable products include:
Rechargeable batteries, which when recharged 200 times, use 81 times less water than the equivalent services of disposable batteries.44
Polyester tablecloths, which use slightly less water than paper tablecloths over their lifetime, even with washing.45
4.5 Quantifying the Benefits Summary
Existing research shows that waste prevention offers significant environmental benefits that could help Oregon achieve broad sustainability goals including greenhouse gas reductions, resource conservation, pollution prevention, and water conservation. By reducing material consumption, waste prevention avoids significant negative impacts upstream and downstream from the consumer at all lifecycle stages: resource extraction, manufacturing, use, and disposal. This research offers DEQ information and analysis that can be used to help develop its Waste Prevention Strategy, inform and promote behavior change among the public, and evaluate the outcomes of the resulting strategy.
For example, the Waste Prevention Strategy Steering Committee can use data from the Oregon Strategy for Greenhouse Gas Reduction to demonstrate that preventing waste has overwhelming climate benefits beyond avoided disposal impacts. The Committee can also use this global warming report as a catalyst for partnering with climate groups on outreach projects.
Information on upstream waste generation and water conservation could primarily be used in education and outreach to demonstrate that waste prevention in Oregon has waste impacts far beyond landfills and incinerators in Oregon, although these benefits should be considered in a national or even global context because savings will likely occur where manufacturing takes place rather than where the products are used.
Regarding pollution, DEQ should bear in mind that because many consumer items require toxic chemicals in their production, preventing waste will reduce pollution that can affect the health of Oregon’s people and environment. When recommending methods for preventing waste, such as switching to more a durable or reusable good, however, DEQ should also consider whether precautions are needed to ensure that products containing harmful components (such as rechargeable batteries and fluorescent lamps) are properly handled during their use and at the end of their useful lives.
44 R.L. Lankey and F.C. McMichael, “Life-Cycle Methods for Comparing Primary and Rechargeable Batteries,” Environmental Science and Technology (2000) 34(11):2299-2304. 45 LCA Center, “LCA Used for Marketing Purposes,” written by Jeppe Frydendal from an LCA prepared by the Danish Textile Service Association. Accessed online July 2006. (http://www.lca-center.dk/cms/site.asp?p=4025)
Waste Prevention Strategy 26 Background Paper #2 Environmental Considerations December 2006

5 Relative Benefits of Waste Prevention
Although waste prevention provides benefits in many areas of environmental concern, it may not always be the best tool to accomplish certain environmental goals. This section discusses existing research on how waste prevention compares to other activities in achieving goals such as resource conservation, energy conservation, pollution prevention, etc. The intent is to provide context for the benefits that waste prevention has been shown to offer and to help prioritize when choosing where to focus scarce program resources.
This section will discuss:
Relative benefits of the different types of waste prevention
Relative benefits of waste prevention compared to recycling
Relative benefits of waste prevention in achieving environmental goals.
5.1 Types of Waste Prevention
Not all waste prevention methods provide the same benefits, and most have trade-offs.46 While it is clear that reducing consumption of goods outright without substitution prevents the environmental impacts of consumption at every stage of the lifecycle, our review of the literature did not find a clear ranking for other types of waste prevention. Following are descriptions of different types of waste prevention and the issues that should be taken into account when considering various waste prevention strategies:
Reducing consumption of goods outright without substitution. Reducing consumption of goods in general without substitution prevents environmental impacts at every stage of a products lifecycle without environmental trade-offs.
Shifting purchases from disposable goods to goods that are more durable, repairable, and reusable. Durable, repairable goods, when used enough times, typically have smaller per-use lifecycle impacts than disposable goods. Disposable goods, however, tend to be less energy- and resource-intensive to produce. As a result, in some cases when items are likely to be used only rarely or are likely to be broken, disposable alternatives may be the better choice at times. Disposable goods also do not generally require washing, which may use a significant amount of water and energy.
Extending the lifetime of products already in use/ownership (and by extension, delaying purchase of replacement items). Extending product lifetimes reduces total consumption, but delaying replacement may mean delaying switching to a more environmentally-friendly product, for example, to more efficient products, such as appliances, cars, or low-flow toilets, or to less toxic products such as to alcohol instead of mercury thermometers, to asbestos-free insulation, or to PBDE-free carpeting.
Purchasing used items in lieu of new items. Purchasing used instead of new items yields similar benefits and tradeoff to extending the lifetime of products already in use but with two potential drawbacks. First, for the benefits to accrue, the used item must be purchased instead of a new item, not in addition to it. The low price of used clothing, for example, may
46 A more detailed discussion can be found in Hertwich, Edgar G. “Consumption and the Rebound Effect,” Journal of Industrial Ecology 9(1-2):85-98.
Waste Prevention Strategy 27 Background Paper #2 Environmental Considerations December 2006

lead consumers to increase their wardrobes, offsetting the benefits. Second, reuse could increase transportation impacts. Fuel use increases as goods are transported to and from a reuse store.
Shifting purchases from material-intensive goods to goods that are less material-intensive. Purchasing less material-intensive products can reduce total material consumption as long as the less material-intensive goods are similarly durable to their more material-intensive counterparts. However, material reduction might come at the expense of reducing recycled content, making the product easily recyclable, or avoiding toxic materials. Also, dematerialization that makes a product cheaper might increase consumption of that good or of consumption in general, which could offset, though not necessarily overcome, the benefits of dematerialization.
Shifting consumption from goods to services so that needs and wants are satisfied in different manner. Purchasing services rather than goods can reduce the total quantity of goods in the world (e.g., car sharing means more people have transportation services with fewer cars), but it must be recognized that the service sector also have environmental impacts, albeit less than the manufacturing sector. An environmental assessment of the service sector using Carnegie Mellon’s EIO-LCA found that the indirect impacts of the service sector are considerably greater than the direct impacts and, therefore, warrant further consideration. For example, the service sector directly generates only 1.2 tons of hazardous waste per million dollars of economic output, but it indirectly generates 13 tons.47
5.2 Waste Prevention and Recycling
Our assessment of the environmental benefits of waste prevention supports the standard approach that ranks waste prevention as the top waste management priority. In addition, our review of the literature found many sources that qualitatively support the traditional waste management hierarchy of reduce-reuse-recycle, although few studies quantifiably evaluate it.
An Australian discussion paper on waste management and sustainability reaffirmed “pure” waste prevention as the top priority, using a qualitative matrix of the environmental, social, and economic impacts of the various waste management options. Waste prevention avoids the negative environmental impacts of materials consumption with the fewest tradeoffs. Recycling imposes environmental tradeoffs including the greenhouse gas emissions associated with transporting recyclable materials and the energy, water, chemicals, emissions, and wastes associated with reprocessing materials.48
A lifecycle analysis of personal computers provides an example of how waste prevention reduces toxic chemical use more than recycling does because some products require the application of additional chemicals in order to extract reusable materials.49 Recycling a computer requires nitric acid, sulfuric acid, and chloride, among others. The study estimated that increasing the computer recycling rate to 100% would, in fact, increase environmental toxic burdens unless recycling methods were improved.
47 Rosenblum, Jeffrey et al., “Environmental Implications of Service Industries,” Environmental Science and Technology (2000) 34(22):4669-4676. 48 Gertsakis, John and Helen Lewis, “Sustainability and the Waste Management Hierarchy: A discussion paper,” prepared for EcoRecycle Victoria, Australia (March 2003). Accessed online August 2006. (http://www.sustainability.vic.gov.au) 49 B-C Choi et al. “Life Cycle Assessment of a Personal Computer and its Effective Recycling Rate” International Journal of Life Cycle Assessments (2006) 11(2):122-128.
Waste Prevention Strategy 28 Background Paper #2 Environmental Considerations December 2006

In addition, “pure” waste prevention yields greater greenhouse gas reduction benefits than does recycling, for most materials. The EPA’s WARM model found that the greenhouse gas emission benefits of increasing source reduction are greater than those from increasing recycling for most materials.50 For a few materials, however, recycling yields greater benefits than waste prevention on a ton-for-ton basis. The model assumes that source reduction displaces both virgin and recycled materials in the ratio of the current mix of production, while recycling is assumed to displace only virgin materials.51
5.3 Waste Prevention and Other Environmental Tools
Waste prevention provides many environmental benefits and can be part of a suite of tools used to achieve sustainability goals beyond resource conservation. A review of the literature suggests that while waste prevention is a useful environmental tool – likely the best way to conserve non-renewable resources and a good way to prevent pollution – it may not be the most effective way to achieve other goals. Even within the categories of resource conservation and pollution prevention, the literature did not discuss whether it would be more efficient to focus activities on changing production methods or consumer habits
Although waste prevention has additional environmental benefits, resources intended solely for preventing global warming, pollution, and other specific problems may be better spent elsewhere. Several studies have examined which household activities and consumption categories have the most environmental impact, which indicates where efforts and resources should be targeted.
The Union of Concerned Scientists (UCS) estimated the impacts that total household consumption has on the environment, finding that consumption of personal items and services has a significant impact (at least 5% of the total household impact) on global warming, air pollution, water pollution, water use, and land use.52 It also has a very significant impact (at least 10%) on toxic water pollution. However, UCS concluded that seven other consumption categories (e.g., transportation) have the most environmental impact overall. Table 3 shows the seven consumption categories that have the most environmental impact (cars, meat, etc.) and the areas in which they have a “very significant” impact.
50 U.S. Environmental Protection Agency “Waste Reduction Model (WARM).” Accessed online July 2006. (http://yosemite.epa.gov/OAR/globalwarming.nsf/content/ActionsWasteWARM.html) 51 For more details and an example using aluminum, see: U.S. Environmental Protection Agency “Why Recycling Some Materials Reduces GHG Emissions More than Source Reduction.” Accessed online July 2006. (http://yosemite.epa.gov/OAR/globalwarming.nsf/content/ActionsWasteWarmSRvsRecycling.html) 52 Brower, Michael and Warren Leon, The Consumer’s Guide to Effective Environmental Choices: Practical Advice from the Union of Concerned Scientists (Three Rivers Press: New York, 1999). See Appendix A.
Waste Prevention Strategy 29 Background Paper #2 Environmental Considerations December 2006

Table 3. Highest Impact Consumption Categories (Union of Concerned Scientists)53
Global
warming Air pollution Water pollution Water use Land use
Cars and light trucks X X X X
Meat and poultry X X X
Fruit, vegetables, grains X
Home heating, hot water, A/C X X
Household appliances and lighting X X
Home construction X
Household water and sewage X
Note: This graphic is reproduced from data in Appendix A in Michael Brower and Warren Leon, The Consumer’s Guide to Effective Environmental Choices: Practical Advice from the Union of Concerned Scientists (New York: Three Rivers Press, 1999).
A recent review of 11 European studies on the impact of household consumption also concluded that the product categories with the most impact are food, housing and related energy use, and transportation.54 Together they are responsible for at least 70% of the lifecycle environmental impacts of household consumption. The major contributors to environmental impacts within these categories are:
Food: Animal products such as meat and dairy;
Housing: Heating, cooking, and hot water generation; and
Transportation: Private car travel and air travel.
5.4 Summary
A comparison of the relative benefits of waste prevention suggests several findings. First not all waste prevention strategies are created equal and some have significant tradeoffs. Second, even given potential tradeoffs, waste prevention generally yields greater benefits than recycling per ton of a given material; however, in some cases, implementing recycling programs for a given material may be easier, thus more cost effective, than implementing waste prevention programs. Third waste prevention is a useful tool but cannot address all environmental problems equally well. Different environmental strategies (e.g., energy efficiency) may be appropriate to achieve different broader sustainability goals. DEQ could use consumption impact studies to identify in which consumption categories households cause the most environmental impacts and could, therefore, be good potential targets for future waste prevention programs.
53 Brower, Michael and Warren Leon The Consumer’s Guide to Effective Environmental Choices: Practical Advice from the Union of Concerned Scientists (1999) Three Rivers Press: New York. See appendix A. 54 Arnold Tukker and Bart Jansen, “Environmental Impacts of Products: A Detailed Review of Studies,” Journal of Industrial Ecology (summer 2006) 10(3):159-182.
Waste Prevention Strategy 30 Background Paper #2 Environmental Considerations December 2006

6 Waste Prevention Benefits Particular to Oregon
The benefits of waste prevention (and the costs of consumption) can also be demonstrated using examples from Oregon, including the body burden of flame retardants, air pollution from the transport of goods, mercury deposition from China, and global warming impact of consumption in Oregon.
Toxic Flame Retardants in Oregon Women
Sightline Institute tested breast milk from 40 women in the Pacific Northwest, including 10 from Oregon, for PCBs and PBDEs.55 PCBs are a now-banned class of chemicals associated with developmental delays and other negative health effects. PBDEs, a chemical flame retardant commonly used in furniture and electronics, are structurally similar to PCBs and have also been shown to have negative health effects. Both chemicals are persistent and bioaccumulative, so they build up in the environment. While the primary exposure path for PCBs is believed to be through food, studies suggest that people are exposed to PBDE mainly through dust from consumer products in their homes and offices. See Figure 4 for PCB and PBDE levels in Oregonian and Norwthwest women.
Figure 4. PCB and PBDE Levels in Northwest Women
Note: This graphic is reproduced from a report published by Sightline Institute, available via the internet. Used with permission.
The study found that PBDE levels in Oregon women were the highest, on average, among the Northwest women tested, and that levels were 20 to 40 times higher than among women in Sweden and Japan. See Figure 5.
55 Sightline Institute (formerly Northwest Environment Watch), Flame Retardants in the Bodies of Pacific Northwest Residents: A Study of Toxic Body Burdens, September 2004. Accessed online October 2006. (http://www.sightline.org/research/pollution/res_pubs/report/PBDEs_in_NW.pdf)
Waste Prevention Strategy 31 Background Paper #2 Environmental Considerations December 2006

Figure 5. PBDE Concentrations in Northwest Women
Note: This graphic is reproduced from a report published by Sightline Institute, available via the internet. Used with permission.
Waste prevention on a wider scale, beyond just household consumption, can reduce exposure to toxic chemicals such as PBDEs through reducing their use in products. It is especially important to prevent the generation of consumer products containing persistent, bioaccumulative toxic chemicals because they build up in the environment, contaminating fish and other human food sources.
Air Toxics from Transporting Goods
The Portland Air Toxics Study (PATA) shows that mobile sources (including cars, trucks, railroads, commercial and marine vessels, and construction equipment) are the predominant source of certain air toxics in the greater Portland area.56 Among air toxics, the three top sources of adverse health effects and cancer risk in the Portland area are formaldehyde, diesel particulate matter, and benzene, all three of which are associated with on- and off-road mobile sources. These finding are similar to findings from air toxics studies in the Seattle area that found that diesel particulate matter contributes to 78% of the cancer risk from outdoor air toxics from all fine particulate matter, even though diesel particulate matter accounts for only 18% of fine particulate matter.57 Waste prevention would reduce
56 Oregon Department of Environmental Quality, Portland Air Toxics Assessment (August 2006) Accessed online October 2006. (http://www.deq.state.or.us/aq/HAP/pata.htm) 57 Keill, Leslie and Naydene Maykut, Final Report: Puget Sound Air Toxics Evaluation, Puget Sound Clean Air Agency and Washington State Department of Ecology (October 2003). Accessed online October 2006. (http://www.pscleanair.org/news/library/reports/psate_final.pdf)
Waste Prevention Strategy 32 Background Paper #2 Environmental Considerations December 2006

the burning of diesel from commercial trucking, railroads, and shipping, which would in turn reduce air pollution and adverse health effects.
Atmospheric Mercury Deposition from China
A recent study of the sources of mercury in the Willamette Basin estimates that 42% of mercury inputs are from atmospheric deposition.58 Of these atmospheric depositions, 83% come from global sources, including coal combustion in China, which is considered the dominant source of human-caused mercury in the atmosphere in the Pacific Basin. ,59 60 A study in China estimated that coal combustion accounted for 46% of atmospheric mercury in a particular city/province, while another 20% came from other industrial processes, mainly cement production The industrial sector accounts for roughly two-thirds of China’s final energy consumption, so we can estimate that over 50% China’s contribution to atmospheric mercury is due to the industrial sector. In sum, a lot of mercury deposition in Oregon comes from Chinese industry, which produces goods for U.S. consumers, including Oregonians. Thus, waste prevention could reduce mercury emissions in China and subsequent deposition in Oregon. Even though the U.S. can off-shore manufacturing, the environmental impacts, such as mercury and greenhouse gas emissions, are global and often return to affect the U.S. domestic environment. Manufacturing overseas in countries with less stringent environmental policies may, in fact, worsen global environmental problems that ultimately impact the U.S. and Oregon.
Global Warming in Oregon
Scientists predict that climate change will negatively impact Oregon in several ways over the next 10-50 years.61 Oregon is likely to experience more severe summer droughts and forest fire seasons along with warmer winters that reduce the snowpack used for water source year-round. Climate change may also cause a sea level rise that threatens Oregon coastal towns. Waste prevention helps prevent climate change by reducing the significant greenhouse gas emissions that occur during resource extraction, manufacturing, and transportation.
In Oregon, material use accounted for 8.94 MMTCO2E, or 13.2% of Oregon’s total annual greenhouse gas emissions in 2000.62 According to the Governor’s Advisory Group on Global Warming, achieving Oregon’s solid waste generation goals – namely no increase in per-capita generation after 2005 and no increase in total generation after 2009 – would decrease Oregon’s greenhouse gas emissions by 5 MMTCO2E in 2025.63 This significant potential reduction, which
58 Oregon Department of Environmental Quality, “Willamette Basin TMDL: Mercury” (September 2006), pp. 3-21. 59 Oregon Department of Environmental Quality “Willamette Basin TMDL: Mercury” (September 2006) Appendix B. Pages B-96 to B-97. 60 Steding, Douglas J. and A. Russell Flegal. “Mercury concentrations in coastal California precipitation: Evidence of local and trans-Pacific fluxes of mercury to North America.” Journal of Geophysical Research (Atmospheric) (December 2002) 107(D24):11-1 to 11-7. 61 Oregon State University, Institute for Natural Resources “Scientific Consensus Statement on the Likely Impacts of Climate Change in the Pacific Northwest” Product of the Impacts of Climate Change on the Pacific Northwest scientific meeting, June 2004. Accessed online August 2006. (http://inr.oregonstate.edu/download/climate_change_consensus_statement_final.pdf) 62 Governor’s Advisory Group on Global Warming “Oregon Strategy for Greenhouse Gas Reductions” State of Oregon. December 2004. Page B-2. Accessed online August 2006. (http://www.oregon.gov/ENERGY/GBLWRM/Strategy.shtml) 63 Governor’s Advisory Group on Global Warming, “Oregon Strategy for Greenhouse Gas Reductions,” State of Oregon. December 2004. Page B-2. Accessed online August 2006. (http://www.oregon.gov/ENERGY/GBLWRM/Strategy.shtml)
Waste Prevention Strategy 33 Background Paper #2 Environmental Considerations December 2006

represents more than 7% of year 2000 emissions, could be cited as a strong additional reason to fund waste prevention programs or as an opportunity to apply for other funding targeted toward achieving global warming goals.
Waste Prevention Strategy 34 Background Paper #2 Environmental Considerations December 2006

7 Challenges and Opportunities for Waste Prevention
A review of the literature combined with professional judgment and experience gained from other research supporting the development of the state’s Waste Prevention Strategy helped identify various opportunities and challenges to promoting waste prevention as an environmental strategy in Oregon. A key opportunity for promoting waste prevention in Oregon may be in harnessing private sector goals of innovation and efficiency to achieve waste prevention. The main challenges to creating an effective waste prevention strategy include:
Winning local support for local programs whose benefits are mainly global or otherwise non-local;
Measuring the outcomes of waste prevention programs and estimating their resulting benefits;
Overcoming social inertia as well as potential political and business opposition to waste prevention programs; and
Setting clear goals for waste prevention programs.
7.1 Opportunities: Innovation
Waste prevention can both coincide with sustainable economic growth and be driven by market forces of innovation and efficiency. In Germany, waste management practices focusing on materials flow management have kept the sum of total household waste fairly constant even as the economy grew by 15%.64 In addition, Germany’s packaging directive, known as “Green Dot,” assigns full collection and recycling costs to producers. Packaging marked with a green dot is collected in separate bins by material type. Between 1991 and 1997, Germany’s packaging waste decreased by 3% annually even as GDP grew.65 In the U.S., Wal-Mart has a green strategy to reduce packaging waste as well as to increase energy and transportation efficiency because a more efficient supply chain lowers their costs and prices for their customers.66 The environmental benefits of Wal-Mart’s strategy are secondary to their profit motive but will likely be significant.
By identifying the relationship between waste prevention and other forces of innovation and efficiency in the economy, Oregon could encourage similar initiatives of waste prevention. Examples include:
Reducing organic or wood-based waste to create carbon emissions reductions that could be sold on the carbon trading market.
Implementing new technology or better planning to reduce materials needs, saving both money and resources.
64 Giegrich, Jurgen and Regine Vogt “The Contribution of Waste Management to Sustainable Development in Germany: Section on Municipal Waste” Published by the IFEU Institute Heidelberg. Accessed online July 2006. (http://www.bmu.de/english/waste_management/downloads/doc/35563.php) 65 McKerlie, Kate et al., “Advancing Extended Producer Responsibility in Canada,” Journal of Cleaner Production (2006) 14:616-628. 66 Amanda Griscom Little, “The Writing on the Wal-Mart,” Grist Magazine (July 19, 2006). Accessed online August 2006. (http://www.grist.org/news/muck/2006/07/19/gore-walmart)
Waste Prevention Strategy 35 Background Paper #2 Environmental Considerations December 2006

Using better planning and coordination to turn wastes from one industry into feedstock for other industrial processes.
Encourage the use of information technology to reduce material requirements (e.g., using electronic documents instead of paper or telecommuting instead of driving) and to improve efficiency to reduce waste (e.g., just-in-time manufacturing could reduce the likelihood that products become obsolete before they can be used).
7.2 Challenges: Counting Local and Global Impacts
Many of the benefits of waste prevention occur upstream, beyond Oregon’s borders, posing a challenge to sustaining support for a local program. The environmental benefits of waste prevention often accrue elsewhere (e.g., pollution prevention overseas), while the costs (e.g., implementing a behavior change program) may accrue locally.
Most of the benefits of waste prevention activities, such as dematerializing products, accrue upstream, so local support may not be easily gained because the local impact may be unapparent, or even seemingly negative (as when a smaller, lighter component may cost more, at least initially, due to higher engineering). In contrast, the benefits of recycling are in some ways locally obvious in terms of job creation or material sourcing, making it easier to justify the costs of recycling, such as needing extra collection trucks.
Thus, developing support for waste prevention programs will require clear identification and communication of the local and global benefits to overcome the more visible costs and/or lack of localized benefits.
7.3 Challenges: Measurement
The lack of effective metrics for waste prevention poses challenges when trying to get program funding or other support and resources from state and local governments. Because it is difficult to measure what isn’t there, it can be hard to forecast the potential impact and feasibility of waste prevention programs. Even after completion, these programs frequently have trouble evaluating or quantifying their outcomes. Additionally, the challenges in quantifying the broader environmental benefits of waste prevention, even when the outcomes are known, compound the problem of renewing or expanding funding for future programs.
DEQ should consider including funding for developing and implementing effective metrics for measuring the amount of waste prevention that programs achieve. Ideally, DEQ could also create a standard methodology for estimating the resulting environmental impacts, such as the reduction in greenhouse gas emissions, toxic chemical releases, and energy consumption.
7.4 Challenges: Inertia and Opposition
Efforts to increase waste prevention through “doing without” (rather than technical solutions) face inertia and opposition in the U.S. consumption-oriented society and economy. While the general public can be made aware of the benefits of waste prevention, it is difficult to actually change consumer behavior. DEQ could consider basing education and outreach programs on tested social marketing principles and measuring quantified outcomes to determine and refine effective methods
Waste Prevention Strategy 36 Background Paper #2 Environmental Considerations December 2006

The business community may actively oppose programs targeted toward reducing consumption because the U.S. economy is currently so dependent on consumer purchasing. However, businesses might respond better to preventing waste themselves if suggestions are based on cost savings in materials, transportation, disposal, or potentially in labor. DEQ should be mindful of how it frames waste prevention in light of consumer culture.
7.5 Challenges: Setting Clear Goals
Behavior change programs can have two kinds of goals: increase awareness of the principles and benefits of waste prevention or change behavior regarding waste prevention. Outreach and education programs would benefit from being clear on whether their purpose is to focus on increasing awareness of the waste prevention ethic, achieving measurable changes in behavior, or both.
If the goal is to increase adoption and awareness of the waste prevention ethic, then education and outreach programs that directly address waste (and broader environmental considerations) are appropriate. On the other hand, if the goal is to affect outcomes in waste generation, then education and outreach programs that address the additional benefits of waste prevention (such as financial savings) could also be part of the message. In cases where there is extreme opposition to “environmental” campaigns, these additional benefits may constitute the entire message with no mention of waste prevention as a goal in and of itself.
Waste Prevention Strategy 37 Background Paper #2 Environmental Considerations December 2006

Appendix A. Case Studies
While raw lifecycle data are available in several online repositories (e.g., the EPA Life-Cycle Assessment page at http://www.epa.gov/ORD/NRMRL/lcaccess), completed lifecycle assessments are more difficult to find, especially for consumer products. Many lifecycle assessments are performed for businesses or industries to evaluate individual buildings or manufacturing processes. Though independent organizations often perform assessments, some LCAs may sponsored by a particular industry or association. For example, disposable diaper manufacturers and cloth diaper delivery services may choose different assumptions and arrive at different assessments of the lifecycle impact of their products and services. This section summarizes the findings of the seven lifecycle assessments cited in this report.
Women’s Polyester Blouse
The American Fiber Manufacturers Association estimated the relative contribution of the manufacture, use, and disposal phases of a polyester blouse to energy consumption, solid waste generation, and pollution.67 Most of the energy use and solid waste generation occur during the use phase because of laundering (likely with hot water and a hot dryer). This suggests that while reducing the size of one’s wardrobe certainly has benefits, it may be even more important to wash with cold water and line dry. The study estimated that 21% of energy use occurs during manufacturing and transportation, while 79% of energy use occurs during laundering at home, primarily for heating water and drying. The study estimated that 65% of the solid waste by volume comes from laundering, primarily from burning fuels to heat water and the dryer, while blouse disposal is only 10% of the solid waste by volume.
The study also found that producing even a seemingly innocuous product such as a blouse involves releasing hazardous pollutants, including lead, mercury, criteria air pollutants, ammonia, chromium, phosphates, and pesticides.
Mail-Order Packaging
Oregon’s Department of Environmental Quality compared the environmental burdens of shipping soft goods in bags versus boxes with different fill materials. DEQ found that using bags not only prevents waste on the post-consumer end (landfill) but also reduces waste generation, energy consumption, and air and water emissions during production and transportation.68
This study illustrates that material weight has a significant impact and can be a relevant, short-hand way to compare general environmental benefits, even across materials. The study also found that reducing material weight can be more important than increasing recycled content alone.
Although a light material may take more energy to produce per pound than a heavy material, the appropriate measurement for environmental burden is per-product rather than per-pound. With more weight, many environmental benefits can be lost, resulting in the more “environmentally friendly” material producing a less “environmentally friendly” product. For example, producing the highest impact bag material considered in the DEQ study (virgin LDPE film) uses four times more energy and
67 American Fiber Manufacturers Association, “Life Cycle Analysis (LCA): Woman’s Knit Polyester Blouse,” Franklin Associates (June 1993). (http://www.fibersource.com/f-tutor/LCA-Page.htm) 68 Oregon Department of Environmental Quality, “Life Cycle Inventory of Packaging Options for Shipment of Retail Mail-Order Soft Goods,” prepared by Franklin Associates (April 2004). Accessed online July 2006. (http://www.deq.state.or.us/wmc/solwaste/data/LifeCycleReport.htm)
Waste Prevention Strategy 38 Background Paper #2 Environmental Considerations December 2006

produces two times more solid waste and greenhouse gas emissions per ton of material than producing the lowest impact box material (80% post-consumer cardboard). However, the box weighs 20 times more than the bag, reversing many of the benefits.
Cloth vs. Paper Tablecloths
The Danish Textile Service Association compared the estimated environmental impacts from using four types of tablecloths:69
Disposable paper;
Reusable 100% cotton;
Reusable 100% polyester; and
Reusable cotton-polyester blend.
All three reusable tablecloths had less environmental impact than the disposable paper tablecloth within six categories: energy consumption, waste, global warming, nutrient enrichment, acidification, and smog. Only in water use (used for laundering and cotton irrigation) did some reusable tablecloths have more impact. The best alternative, polyester, generated 18% to 45% of the impact of paper in the six categories reviewed mentioned above and also used slightly less water. See Figure 6.
69 LCA Center, “LCA Used for Marketing Purposes,” written by Jeppe Frydendal from an LCA prepared by the Danish Textile Service Association. Accessed online July 2006. (http://www.lca-center.dk/cms/site.asp?p=4025)
Waste Prevention Strategy 39 Background Paper #2 Environmental Considerations December 2006

Figure 6. Environmental Impact of Tablecloths (Danish Textile Society)70
Note: This graphic is reproduced from a case study published by the Danish Textile Service Association and the LCA Center, available via the internet; the graphic is slightly revised and simplified from the original version, but the content shown above remains the same.
Single-use vs. Rechargeable Batteries
Researchers estimated the relative impacts of a rechargeable battery used 200 times versus 200 disposable batteries.71 The rechargeable battery required 81 times less water and almost 33 times less electricity (and 49 times less converted fuel equivalents) to produce than the 200 disposable batteries. These savings remained even when the electricity used in recharging was taken into account. The study also found that using rechargeable instead of disposable batteries also reduced emissions of conventional pollutants (e.g., sulfur dioxide, volatile organic compounds, lead), releases of chemicals tracked in the Toxic Release Inventory (TRI), generation of hazardous waste tracked by the Resource Conservation and Recovery Act (RCRA), and emissions of greenhouse and ozone-depleting gases.
70 LCA Center, “LCA Used for Marketing Purposes,” written by Jeppe Frydendal from an LCA prepared by the Danish Textile Service Association. Accessed online July 2006. (http://www.lca-center.dk/cms/site.asp?p=4025). 71 R.L. Lankey and F.C. McMichael, “Life-Cycle Methods for Comparing Primary and Rechargeable Batteries,” Environmental Science and Technology (2000) 34(11):2299-2304.
Waste Prevention Strategy 40 Background Paper #2 Environmental Considerations December 2006

However, as with many products, consumer behavior can negatively affect the net benefits of reusable products. For batteries, improper final disposal may reduce the benefit of rechargeables, especially in toxic emissions if heavy metals leach from NiCad batteries that were disposed in a landfill.
Personal Computers
A Korean study found that most impacts from personal computers occur during the pre-manufacturing and manufacturing stages. The percentages of impacts that occur before the product reaches the consumer are roughly: 72
55% of non-renewable resource use;
80% of acidification;
85% of global warming potential;
85% of ozone depletion;
65% of eutrophication;
65% of ecotoxicity; and
25% of human toxicity.
These findings suggest that reusing computers or increasing their lifespans can have significant benefits beyond solid waste reduction, even though non-renewable resource use (50%) and eutrophication (25%) were significant in the use phase, mostly from electricity use generated by fossil fuels. During the disposal phase human- and eco-toxicity were significant (70% and 25%, respectively), even when a portion of the computers are recycled. The study authors also noted that current recycling methods involve using hazardous chemicals to reclaim raw materials, potentially increasing lifecycle toxic releases.
Reusable vs. Disposable Cups and Spoons
A U.S. study by the Alliance for Environmental Innovation compared the environmental impacts of durable vs. disposable cups and spoons. 73 Using a ceramic mug 1000 times instead of using 1000 polystyrene cups once each saves:
27% of energy usage (MMBtus);
75% of material inputs (lbs);
51% of CO2 emissions (lbs);
72 B-C Choi et al. “Life Cycle Assessment of a Personal Computer and its Effective Recycling Rate” International Journal of Life Cycle Assessments (2006) 11(2):122-128. 73 Denison, Richard. “Environmental Comparison of Reusable Ceramic Mugs vs. Disposable Cups Made from Polystyrene or Virgin Bleached Paperboard” Alliance for Environmental Innovation. (1998) and Denison, Richard. “Environmental Comparison of Reusable Spoons Made from Stainless Steel vs. Disposable Spoons Made from Polystyrene or Polypropylene” Alliance for Environmental Innovation. (1998)
Waste Prevention Strategy 41 Background Paper #2 Environmental Considerations December 2006

45% of NOx emissions (lbs);
30% of SOx emissions (lbs);
81% of particulates emissions (lbs);
97% of water emissions (lbs of total suspended solids); and
46% of solid waste (lbs).
These impact estimates can be considered conservative for several reasons. First, the assessment did not estimate the impacts of disposable cup packaging or the generation of solid waste during disposable cup production. Second, the study assumed that the ceramic mug is washed at high temperatures after each use, a pattern that should apply in commercial settings but may not necessarily be representative of personal use in the home or workplace. Third, the assessment overestimated the energy required to wash mugs by a factor of 3, so energy savings are likely greater than reported.
Similarly, the impact of using a stainless steel spoon 1000 times instead of 1000 polypropylene spoons once saves 93% of energy usage (MMBtus), material inputs (lbs), and solid waste (lbs). The study also calculated a “break-even point,” meaning the number of reuses (i.e., one use followed by one washing) of the reusable spoon that result in energy use, materials consumption, or solid waste generation equal to that of the same number of disposable spoons. These break-even points show more variability across the three measures of environmental impact, with steel reaching the break-even point for energy use first, after only a few uses.
Again, these impact estimates can be considered conservative because the assessment did not include the packaging for disposable spoons, assumed that no solid waste results from disposable spoon production, and used the lightest weight measured for disposable spoons but also a steel spoon weight heavier than the heaviest steel spoon measured.
Germany’s Waste Management Accomplishments
In 1996, Germany’s Close Substance Cycle and Waste Management Act took effect, setting priorities for waste prevention and recycling and creating a legal requirement for product stewardship. The impacts of that act have recently been assessed.74 Between 1990 and 2001, Germany’s GDP grew by 15% while household waste remained constant.75
Using Umberto, a materials flow software, the report authors estimated the environmental benefits resulting from waste prevention and recycling, using both absolute values (tons) and a reference metric to the impact caused by the average German citizen. For example, the reduction in household waste from 1990 to 2005 saves 30 million tons of CO2-equivalent a year, statistically equivalent to the annual impact of 2.5 million German residents. Waste prevention and recycling also:
save 1 million tons of iron ore annually (1.2 million residents);
save 26,000 tons of phosphate ore annually (3 million residents);
74 Giegrich, Jurgen and Regine Vogt “The Contribution of Waste Management to Sustainable Development in Germany: Section on Municipal Waste” Published by the IFEU Institute Heidelberg. Accessed online July 2006. (http://www.bmu.de/english/waste_management/downloads/doc/35563.php) 75 Note that this may be an artifact of the producer responsibility requirement shifting waste disposal away from households and onto businesses.
Waste Prevention Strategy 42 Background Paper #2 Environmental Considerations December 2006

reduce acidification by 60,000 tons of acid equivalent annually (1.5 million residents);
reduce overfertilization of waterways by 23,000 tons of nutrient equivalent annually (4 million residents); and
reduce emissions of particulate matter by 40,000 tons annually (1.3 million residents).
Germany’s Waste Management Act could be used as a model for waste management efforts in Oregon. Umberto or another materials flow software could be considered for use in planning or evaluating the Waste Prevention Strategy.
Waste Prevention Strategy 43 Background Paper #2 Environmental Considerations December 2006

Appendix B. References American Fiber Manufacturers Association. “Life Cycle Analysis (LCA): Woman’s Knit Polyester
Blouse” Franklin Associates (June 1993) (http://www.fibersource.com/f-tutor/LCA-Page.htm)
Brower, Michael and Warren Leon. The Consumer’s Guide to Effective Environmental Choices: Practical Advice from the Union of Concerned Scientists. Three Rivers Press: New York, 1999. See Appendix A.
California Energy Commission, Public Interest Energy Research Program. “Optimization of Product Life Cycle to Reduce Greenhouse Gas Emissions in California,” prepared by Lawrence Berkeley National Laboratory (August 2005).
Choi, B-C et al. “Life Cycle Assessment of a Personal Computer and its Effective Recycling Rate,” International Journal of Life Cycle Assessments (2006) 11(2):122-128.
Environmental Working Group. Body Burden: Pollution in People (2000-2006). Accessed online July 2006. (http://www.bodyburden.org)
Gertsakis, John and Helen Lewis. “Sustainability and the Waste Management Hierarchy: A discussion paper,” prepared for EcoRecycle Victoria, Australia (March 2003). Accessed online August 2006. (http://www.sustainability.vic.gov.au)
Global Footprint Network, 2005. National Footprint and Biocapacity Accounts, 2005 Edition. Available at http://www.footprintnetwork.org.
Gordon, R.B. et al. “Metal Stocks and Sustainability,” Proceedings of the National Academy of Sciences (2006) 103(5):1209-1214.
Governor’s Initiative on Global Warming. “Climate Change and Oregon.” Accessed online August 2006. (http://www.oregon.gov/ENERGY/GBLWRM/climhme.shtml)
Governor’s Advisory Group on Global Warming. “Oregon Strategy for Greenhouse Gas Reductions.” State of Oregon (December 2004). Accessed online August 2006. (http://www.oregon.gov/ENERGY/GBLWRM/Strategy.shtml)
Hertwich, Edgar G. “Consumption and the Rebound Effect.” Journal of Industrial Ecology 9(1-2):85-98
Hirschier, Roland and Inge Reichart. “Multifunctioning Electronic Media – Traditional Media.” International Journal of Life Cycle Assessments (2003) 8(4):201-208.
Lankey, R.L. and F.C. McMichael. “Life-Cycle Methods for Comparing Primary and Rechargeable Batteries.” Environmental Science and Technology (2000) 34(11):2299-2304.
LCA Center. “LCA Used for Marketing Purposes,” written by Jeppe Frydendal from an LCA prepared by the Danish Textile Service Association. Accessed online July 2006. (http://www.lca-center.dk/cms/site.asp?p=4025)
McKerlie, Kate et al. “Advancing Extended Producer Responsibility in Canada.” Journal of Cleaner Production (2006) 14:616-628.
Waste Prevention Strategy 44 Background Paper #2 Environmental Considerations December 2006

Oregon Department of Environmental Quality. “Life Cycle Inventory of Packaging Options for Shipment of Retail Mail-Order Soft Goods,” prepared by Franklin Associates (April 2004). Accessed online July 2006. (http://www.deq.state.or.us/wmc/solwaste/data/LifeCycleReport.htm)
Oregon State University, Institute for Natural Resources. “Scientific Consensus Statement on the Likely Impacts of Climate Change in the Pacific Northwest,” a product of the Impacts of Climate Change on the Pacific Northwest scientific meeting, June 2004. Accessed online August 2006. (http://inr.oregonstate.edu/download/climate_change_consensus_statement_final.pdf)
Rosenblum, Jeffrey et al. “Environmental Implications of Service Industries.” Environmental Science and Technology (2000) 34(22):4669-4676.
Tukker, Arnold, and Bart Jansen. “Environmental Impacts of Products: A Detailed Review of Studies.” Journal of Industrial Ecology (summer 2006) 10(3):159-182.
U.S. Environmental Protection Agency. “Why Recycling Some Materials Reduces GHG Emissions More than Source Reduction.” Accessed online July 2006. (http://yosemite.epa.gov/OAR/globalwarming.nsf/content/ ActionsWasteWarmSRvsRecycling.html)
Washington State Department of Ecology. Beyond Waste: Waste and Material Flows in Washington, prepared by Cascadia Consulting and Ross and Associates (2003).
World Resources Institute. The Weight of Nations: Material Outflows from Industrial Economies. Washington, D.C.: World Resources Institute, 2000. Accessed online August 2006. (http://materials.wri.org/weightofnations-pub-3023.html)
Waste Prevention Strategy 45 Background Paper #2 Environmental Considerations December 2006

Appendix C. Additional Resources
Books, Studies, Articles, and Bibliographies
Bauman, H. and A-M. Tillman. The Hitch Hiker’s Guide to LCA: An Orientation in Life Cycle Assessment Methodology and Application. (2004) Studentlitteratur AB. (http://www.studentlitteratur.se/o.o.i.s?id=2362&artnr=31027-01&csid=102&mp=103)
Commission of the European Communities. Green Paper on Integrated Product Policy. Prepared by Ernst & Young and the University of Sussex. (2001) (http://ec.europa.eu/environment/ipp/2001developments.htm)
European Commission. Waste Prevention and Minimization. Prepared by the Öko-Institut (Germany) (1996) (http://ec.europa.eu/environment/waste/studies/prevention_minimisation.htm)
Environmental Impacts of Products: Analysis of the life cycle environmental impacts related to the total final consumption of the EU25; European Science and Technology Observatory; 2005.
MIT course: Industrial Ecology and Lifecycle Assessment: Transforming Industry through Engineering and Public Policies (Fall 2002) (http://web.mit.edu/11.369/www/11369schedule.html)
Nielson, PH et al. Environmental Impact of the Use of Natural Resources. European Commission. (2004) (Available at http://www.lca-net.com/publ)
Schenck, Rita. LCA for Mere Mortals. Institute for Environmental Research and Education. (http://www.iere.org/mortals.html)
Tukker, Arnold. “Integrated Product Policy and Waste: Deliberations about Priorities” Warmer Bulletin (April 2006) 104:10-11
Tukker, Arnold. “Life cycle assessment as a tool in environmental impact assessment” Environmental Impact Assessment Review. 2000.
Wackernagel, M. “Advancing Sustainable Resource Management: Using Ecological Footprint Analysis for Problem Formulation, Policy Development, and Communication.” Prepared for DGXI, Redefining Progress (2001) (http://europa.eu.int/comm/environment/enveco/studies2.htm#26)
Worldwatch Institute. Good Stuff: A Behind-the-Scenes Guide to the Things We Buy. 2004. (http://www.worldwatch.org/taxonomy/term/44)
Institutions Engaged in LCA Research
American Center for Life Cycle Assessment (http://www.lcacenter.org/)
Bainbridge Graduate Institute; Bainbridge, WA (http://www.bgiedu.org/)
The Centre for Design (Australia) (http://www.cfd.rmit.edu.au/programs/life_cycle_assessment)
The Green Design Initiative, Carnegie Mellon University (http://www.eiolca.net)
Institute for Environmental Research and Education (IERE) (Vashon) (http://www.iere.org)
National Risk Management Research Laboratory, LCA (http://www.epa.gov/ORD/NRMRL/lcaccess)
Waste Prevention Strategy 46 Background Paper #2 Environmental Considerations December 2006