soldotna - high school final industry, inc. soldotna high school energy audit report akwarm id no....
TRANSCRIPT

ENERGY AUDIT REPORT
Soldotna High School 425 W. Marydale Ave. Soldotna, AK 99669
CAEC Project No. CIRI‐SXQ‐CAEC‐11
May 2012
SUBMITTED BY: PRIMARY CONTACT:
22010 SE 51st Street 32266 Lakefront Drive Issaquah, WA 98029 Soldotna, Alaska 99669
Phone (425)281‐4706 Fax (425)507‐4350 Phone (907) 260‐5311 Fax (907) 260‐5312 Email: [email protected] Email: [email protected] CONTACT: Andrew Waymire, C.E.M. CONTACT: Jerry P. Herring, P.E., C.E.A.

REPORT DISCLAIMER
Privacy The information contained within this report, including any attachment(s), was produced under contract to Alaska Housing Finance Corporation (AHFC). IGAs are the property of the State of Alaska, and may be incorporated into AkWarm-C, the Alaska Retrofit Information System (ARIS), or other state and/or public information systems. AkWarm-C is a building energy modeling software developed under contract by AHFC. This material is based upon work supported by the Department of Energy under Award Number DE-EE0000095. This report was prepared as an account of work sponsored by an agency of the United States Government. Neither the United States Government nor any agency thereof, nor any of their employees, makes any warranty, express or implied, or assumes any legal liability or responsibility for the accuracy, completeness, or usefulness of any information, apparatus, product, or process disclosed, or represents that its use would not infringe privately owned rights. Reference herein to any specific commercial product, process, or service by trade name, trademark, manufacturer, or otherwise does not necessarily constitute or imply its endorsement, recommendation, or favoring by the United States Government or any agency thereof. The views and opinions of authors expressed herein do not necessarily state or reflect those of the United States Government or any agency thereof. Limitations of Study This energy audit is intended to identify and recommend potential areas of energy savings, estimate the value of the savings, and provide an opinion of the costs to implement the recommendations. This audit meets the criteria of a Level 2 Investment Grade Audit (IGA) per the American Society of Heating, Refrigeration, Air-conditioning Engineers (ASHRAE) and the Association of Energy Engineers (AEE), and is valid for one year. The life of the IGA may be extended on a case-by-case basis, at the discretion of AHFC. In preparing this report, the preparers acted with the standard of care prevalent in this region for this type of work. All results are dependent on the quality of input data provided. Not all data could be verified and no destructive testing or investigations were undertaken. Some data may have been incomplete. This report is not intended to be a final design document. Any modifications or changes made to a building to realize the savings must be designed and implemented by licensed, experienced professionals in their fields. Lighting upgrades should undergo a thorough lighting analysis to assure that the upgrades will comply with State of Alaska Statutes as well as Illuminating Engineering Society (IES) recommendations. All liabilities for upgrades, including but not limited to safety, design, and performance are incumbent upon the professional(s) who prepare the design. Siemens Industry, Inc (SII) and Central Alaska Engineering Company (CAEC) bear no responsibility for work performed as a result of this report. Financial ratios may vary from those forecasted due to the uncertainty of the final installed design, configuration, equipment selected, installation costs, related additional work, or the operating schedules and maintenance provided by the owner. Furthermore, many ECMs are interactive, so implementation of one ECM may impact the performance of another ECM. SII and CAEC accept no liability for financial loss due to ECMs that fail to meet the forecasted financial ratios.

The economic analyses for the ECMs relating to lighting improvements are based solely on energy savings. Additional benefits may be realized in reduced maintenance cost, deferred maintenance, and improved lighting quality. The new generation lighting systems have significantly longer life leading to long term labor savings, especially in high areas like Gyms and exterior parking lots. Lighting upgrades displace re-lamping costs for any fixtures whose lamps would otherwise be nearing the end of their lifecycle. This reduces maintenance costs for 3-10 years after the upgrade. An overall improvement in lighting quality, quantified by numerous studies, improves the performance of students and workers in the built environment. New lighting systems can be designed to address all of the above benefits.
Table of Contents REPORT DISCLAIMER.....................................................................................................................................2 1. EXECUTIVE SUMMARY ..............................................................................................................................5 2. AUDIT AND ANALYSIS BACKGROUND .......................................................................................................9 3. Soldotna High School ..............................................................................................................................12 4. ENERGY COST SAVING MEASURES..........................................................................................................22 Appendix A – Major Equipment List ...........................................................................................................37 Appendix B – Lighting Inventory .................................................................................................................39 Appendix C – IR Photos ...............................................................................................................................40 Appendix D – Utility Data............................................................................................................................41

Siemens Industry, Inc. Soldotna High School Energy Audit Report
AkWarm ID No. CIRI‐SXQ‐CAEC‐11 Page 5 of 47
1. EXECUTIVE SUMMARY This report was prepared for the Kenai Peninsula School District using ARRA funds as part of a contract for:
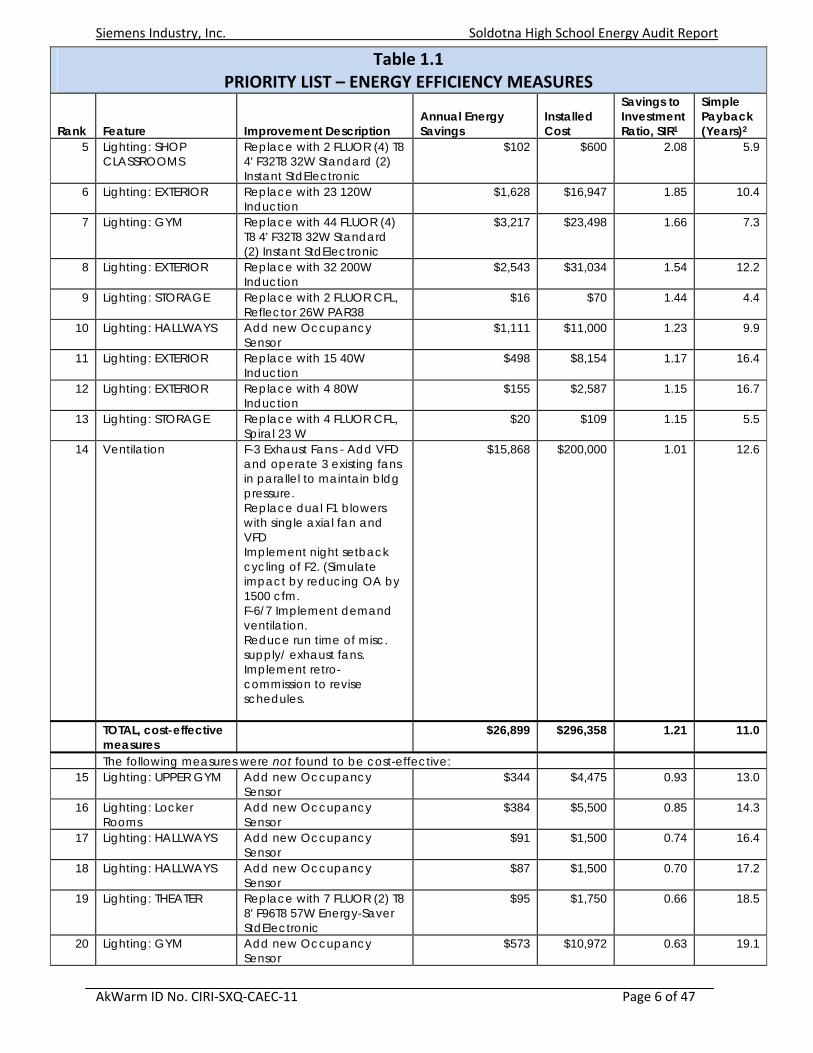
Kenai Peninsula Borough Alaska Housing Finance Corporation Contact: Kevin Lyon Contact: Rebekah Luhrs 47140 East Poppy Lane P.O. Box 10120 Soldotna, Alaska 99669 Anchorage, Alaska 99510 Phone (907) 262‐9657 Phone (907)330‐8141 Email: [email protected] Email: [email protected] The scope of the audit focused on Soldotna High School. The scope of this report is a comprehensive energy study, which included an analysis of building shell, interior and exterior lighting systems, HVAC systems, and plug loads. Based on electricity and fuel oil prices in effect at the time of the audit, the annual predicted energy costs for the buildings analyzed are as follows: $190,660 for Electricity $66,302 for Natural Gas The total energy costs are $256,962 per year. Table 1.1 below summarizes the energy efficiency measures analyzed for the Soldotna High School. Listed are the estimates of the annual savings, installed costs, and two different financial measures of investment return.
Table 1.1 PRIORITY LIST – ENERGY EFFICIENCY MEASURES
Rank
Feature
Improvement Description
Annual Energy Savings
Installed Cost
Savings to Investment Ratio, SIR1
Simple Payback (Years)2
1 Lighting: EXTERIOR Replace with 9 FLUOR CFL, Spiral 23 W
$332 $246 8.63 0.7
2 Lighting: CLASSROOMS
Replace with 13 FLUOR CFL, Reflector 26W PAR38
$300 $355 5.37 1.2
3 Lighting: OFFICES Replace with 5 FLUOR CFL, Reflector 26W PAR38
$145 $175 5.27 1.2
4 Lighting: THEATER - Overhead Emergency
Replace with 58 FLUOR CFL, Spiral 23 W
$964 $1,583 3.87 1.6
Siemens Industry, Inc. Soldotna High School Energy Audit Report
AkWarm ID No. CIRI‐SXQ‐CAEC‐11 Page 6 of 47
Table 1.1 PRIORITY LIST – ENERGY EFFICIENCY MEASURES
Rank
Feature
Improvement Description
Annual Energy Savings
Installed Cost
Savings to Investment Ratio, SIR1
Simple Payback (Years)2
5 Lighting: SHOP CLASSROOMS
Replace with 2 FLUOR (4) T8 4' F32T8 32W Standard (2) Instant StdElectronic
$102 $600 2.08 5.9
6 Lighting: EXTERIOR Replace with 23 120W Induction
$1,628 $16,947 1.85 10.4
7 Lighting: GYM Replace with 44 FLUOR (4) T8 4' F32T8 32W Standard (2) Instant StdElectronic
$3,217 $23,498 1.66 7.3
8 Lighting: EXTERIOR Replace with 32 200W Induction
$2,543 $31,034 1.54 12.2
9 Lighting: STORAGE Replace with 2 FLUOR CFL, Reflector 26W PAR38
$16 $70 1.44 4.4
10 Lighting: HALLWAYS Add new Occupancy Sensor
$1,111 $11,000 1.23 9.9
11 Lighting: EXTERIOR Replace with 15 40W Induction
$498 $8,154 1.17 16.4
12 Lighting: EXTERIOR Replace with 4 80W Induction
$155 $2,587 1.15 16.7
13 Lighting: STORAGE Replace with 4 FLUOR CFL, Spiral 23 W
$20 $109 1.15 5.5
14 Ventilation F-3 Exhaust Fans - Add VFD and operate 3 existing fans in parallel to maintain bldg pressure. Replace dual F1 blowers with single axial fan and VFD Implement night setback cycling of F2. (Simulate impact by reducing OA by 1500 cfm. F-6/7 Implement demand ventilation. Reduce run time of misc. supply/ exhaust fans. Implement retro-commission to revise schedules.
$15,868 $200,000 1.01 12.6
TOTAL, cost-effective measures
$26,899 $296,358 1.21 11.0
The following measures were not found to be cost-effective: 15 Lighting: UPPER GYM Add new Occupancy
Sensor $344 $4,475 0.93 13.0
16 Lighting: Locker Rooms
Add new Occupancy Sensor
$384 $5,500 0.85 14.3
17 Lighting: HALLWAYS Add new Occupancy Sensor
$91 $1,500 0.74 16.4
18 Lighting: HALLWAYS Add new Occupancy Sensor
$87 $1,500 0.70 17.2
19 Lighting: THEATER Replace with 7 FLUOR (2) T8 8' F96T8 57W Energy-Saver StdElectronic
$95 $1,750 0.66 18.5
20 Lighting: GYM Add new Occupancy Sensor
$573 $10,972 0.63 19.1

Siemens Industry, Inc. Soldotna High School Energy Audit Report
AkWarm ID No. CIRI‐SXQ‐CAEC‐11 Page 7 of 47
Table 1.1 PRIORITY LIST – ENERGY EFFICIENCY MEASURES
Rank
Feature
Improvement Description
Annual Energy Savings
Installed Cost
Savings to Investment Ratio, SIR1
Simple Payback (Years)2
21 Lighting: SHOP CLASSROOMS
Replace with 26 FLUOR (2) T8 8' F96T8 54W Energy-Saver StdElectronic
$273 $6,500 0.51 23.8
22 Lighting: UPPER GYM Replace with 18 FLUOR (4) T8 4' F32T8 32W Standard (2) Instant StdElectronic
$328 $9,613 0.41 29.3
23 Lighting: STORAGE Replace with 12 FLUOR (2) T8 4' F32T8 32W Standard Instant StdElectronic
$18 $1,238 0.18 68.8
24 HVAC And DHW Cycle Fan F-2 at night only when heat is needed. Simulate reduction with duty cycle at 50%. Add insulation to piping at kitchen and domestic HXs.
-$10,183 $45,000 -3.40 999.9
TOTAL, all measures $18,909 $384,406 0.60 20.3 Table Notes:
1 Savings to Investment Ratio (SIR) is a life‐cycle cost measure calculated by dividing the total savings over the life of a project (expressed in today’s dollars) by its investment costs. The SIR is an indication of the profitability of a measure; the higher the SIR, the more profitable the project. An SIR greater than 1.0 indicates a cost‐effective project (i.e. more savings than cost). Remember that this profitability is based on the position of that Energy Efficiency Measure (EEM) in the overall list and assumes that the measures above it are implemented first.
2 Simple Payback (SP) is a measure of the length of time required for the savings from an EEM to payback the investment cost, not counting interest on the investment and any future changes in energy prices. It is calculated by dividing the investment cost by the expected first‐year savings of the EEM.
With all of these energy efficiency measures in place, the annual utility cost can be reduced by $18,909 per year, or 7.4% of the buildings’ total energy costs. These measures are estimated to cost $384,406, for an overall simple payback period of 20.3 years. If only the cost‐effective measures are implemented, the annual utility cost can be reduced by $26,899 per year, or 10.5% of the buildings’ total energy costs. These measures are estimated to cost $296,358, for an overall simple payback period of 11.0 years. Table 1.2 below is a breakdown of the annual energy cost across various energy end use types, such as Space Heating and Water Heating. The first row in the table shows the breakdown for the building as it is now. The second row shows the expected breakdown of energy cost for the building assuming all of the retrofits in this report are implemented. Finally, the last row shows the annual energy savings that will be achieved from the retrofits.

Siemens Industry, Inc. Soldotna High School Energy Audit Report
AkWarm ID No. CIRI‐SXQ‐CAEC‐11 Page 8 of 47
Table 1.2 Annual Energy Cost Estimate
Description Space Heating
Space Cooling
Water Heating
Lighting Refrigera
tion Other
Electrical Cooking
Clothes Drying
Ventilation Fans
Service Fees
Total Cost
Existing Building
$185,124
$0 $453 $62,219
$0 $5,140 $0 $0 $912 $3,113 $256,962
With All Proposed Retrofits
$187,501
$0 $0 $42,487
$0 $4,952 $0 $0 $0 $3,113 $238,053
SAVINGS ‐$2,377 $0 $453 $19,733
$0 $188 $0 $0 $912 $0 $18,909

Siemens Industry, Inc. Soldotna High School Energy Audit Report
AkWarm ID No. CIRI‐SXQ‐CAEC‐11 Page 9 of 47
2. AUDIT AND ANALYSIS BACKGROUND
2.1 Program Description This audit included services to identify, develop, and evaluate energy efficiency measures at the Soldotna High School. The scope of this project included evaluating building shell, lighting and other electrical systems, and HVAC equipment, motors and pumps. Measures were analyzed based on life‐cycle‐cost techniques, which include the initial cost of the equipment, life of the equipment, annual energy cost, annual maintenance cost, and a discount rate of 3.0%/year in excess of general inflation.
2.2 Audit Description Preliminary audit information was gathered in preparation for the site survey. The site survey provides critical information in deciphering where energy is used and what opportunities exist within a building. The entire site was surveyed to inventory the following to gain an understanding of how each building operates:
• Building envelope (roof, windows, etc.) • Heating, ventilation, and air conditioning equipment (HVAC) • Lighting systems and controls • Building‐specific equipment • Water consumption, treatment (optional) & disposal
The building site visit was performed to survey all major building components and systems. The site visit included detailed inspection of energy consuming components. Summary of building occupancy schedules, operating and maintenance practices, and energy management programs provided by the building manager were collected along with the system and components to determine a more accurate impact on energy consumption. Details collected from Soldotna High School enable a model of the building’s energy usage to be developed, highlighting the building’s total energy consumption, energy consumption by specific building component, and equivalent energy cost. The analysis involves distinguishing the different fuels used on site, and analyzing their consumption in different activity areas of the building. Soldotna High School is classified as being made up of the following activity areas: 1) High School: 154,637 square feet

Siemens Industry, Inc. Soldotna High School Energy Audit Report
AkWarm ID No. CIRI‐SXQ‐CAEC‐11 Page 10 of 47
In addition, the methodology involves taking into account a wide range of factors specific to the building. These factors are used in the construction of the model of energy used. The factors include: • Occupancy hours • Local climate conditions • Prices paid for energy
2.3. Method of Analysis Data collected was processed using AkWarm© Energy Use Software to estimate energy savings for each of the proposed energy efficiency measures (EEMs). The recommendations focus on the building envelope; HVAC; lighting, plug load, and other electrical improvements; and motor and pump systems that will reduce annual energy consumption. EEMs are evaluated based on building use and processes, local climate conditions, building construction type, function, operational schedule, existing conditions, and foreseen future plans. Energy savings are calculated based on industry standard methods and engineering estimations. Our analysis provides a number of tools for assessing the cost effectiveness of various improvement options. These tools utilize Life‐Cycle Costing, which is defined in this context as a method of cost analysis that estimates the total cost of a project over the period of time that includes both the construction cost and ongoing maintenance and operating costs. Savings to Investment Ratio (SIR) = Savings divided by Investment Savings includes the total discounted dollar savings considered over the life of the improvement. When these savings are added up, changes in future fuel prices as projected by the Department of Energy are included. Future savings are discounted to the present to account for the time‐value of money (i.e. money’s ability to earn interest over time). The Investment in the SIR calculation includes the labor and materials required to install the measure. An SIR value of at least 1.0 indicates that the project is cost‐effective—total savings exceed the investment costs. Simple payback is a cost analysis method whereby the investment cost of a project is divided by the first year’s savings of the project to give the number of years required to recover the cost of the investment. This may be compared to the expected time before replacement of the system or component will be required. For example, if a boiler costs $12,000 and results in a savings of $1,000 in the first year, the payback time is 12 years. If the boiler has an expected life to replacement of 10 years, it would not be financially viable to make the investment since the payback period of 12 years is greater than the project life. The Simple Payback calculation does not consider likely increases in future annual savings due to energy price increases. As an offsetting simplification, simple payback does not consider the need to earn interest on the investment (i.e. it does not consider the time‐value of money). Because of these simplifications, the SIR figure is considered to be a better financial investment indicator than the Simple Payback measure.

Siemens Industry, Inc. Soldotna High School Energy Audit Report
AkWarm ID No. CIRI‐SXQ‐CAEC‐11 Page 11 of 47
Measures are implemented in order of cost‐effectiveness. The program first calculates individual SIRs, and ranks all measures by SIR, higher SIRs at the top of the list. An individual measure must have an individual SIR>=1 to make the cut. Next the building is modified and re‐simulated with the highest ranked measure included. Now all remaining measures are re‐evaluated and ranked, and the next most cost‐effective measure is implemented. AkWarm goes through this iterative process until all appropriate measures have been evaluated and installed. It is important to note that the savings for each recommendation is calculated based on implementing the most cost effective measure first, and then cycling through the list to find the next most cost effective measure. Implementation of more than one EEM often affects the savings of other EEMs. The savings may in some cases be relatively higher if an individual EEM is implemented in lieu of multiple recommended EEMs. For example implementing a reduced operating schedule for inefficient lighting will result in relatively high savings. Implementing a reduced operating schedule for newly installed efficient lighting will result in lower relative savings, because the efficient lighting system uses less energy during each hour of operation. If multiple EEM’s are recommended to be implemented, AkWarm calculates the combined savings appropriately. Cost savings are calculated based on estimated initial costs for each measure. Installation costs include labor and equipment to estimate the full up‐front investment required to implement a change. Costs are derived from Means Cost Data, industry publications, and local contractors and equipment suppliers.
2.4 Limitations of Study All results are dependent on the quality of input data provided, and can only act as an approximation. In some instances, several methods may achieve the identified savings. This report is not intended as a final design document. The design professional or other persons following the recommendations shall accept responsibility and liability for the results.
Siemens Industry, Inc. Soldotna High School Energy Audit Report
AkWarm ID No. CIRI‐SXQ‐CAEC‐11 Page 12 of 47
3. Soldotna High School
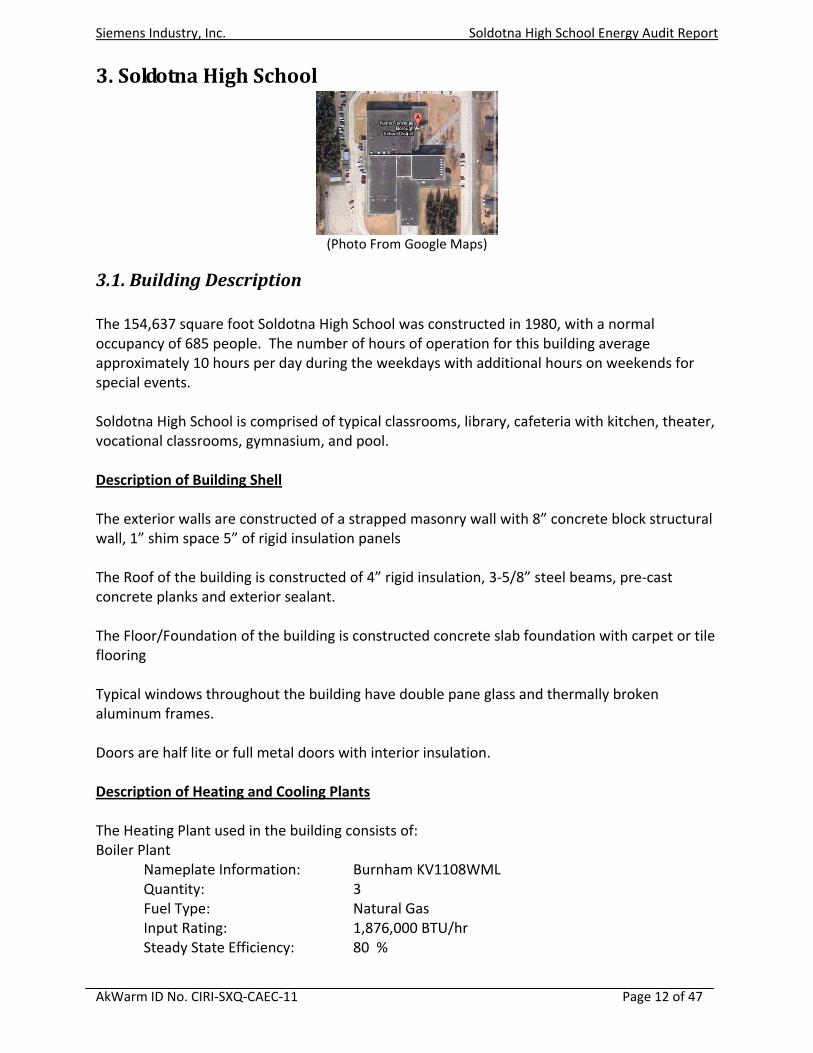
(Photo From Google Maps)
3.1. Building Description The 154,637 square foot Soldotna High School was constructed in 1980, with a normal occupancy of 685 people. The number of hours of operation for this building average approximately 10 hours per day during the weekdays with additional hours on weekends for special events. Soldotna High School is comprised of typical classrooms, library, cafeteria with kitchen, theater, vocational classrooms, gymnasium, and pool. Description of Building Shell The exterior walls are constructed of a strapped masonry wall with 8” concrete block structural wall, 1” shim space 5” of rigid insulation panels The Roof of the building is constructed of 4” rigid insulation, 3‐5/8” steel beams, pre‐cast concrete planks and exterior sealant. The Floor/Foundation of the building is constructed concrete slab foundation with carpet or tile flooring Typical windows throughout the building have double pane glass and thermally broken aluminum frames. Doors are half lite or full metal doors with interior insulation. Description of Heating and Cooling Plants The Heating Plant used in the building consists of: Boiler Plant Nameplate Information: Burnham KV1108WML Quantity: 3 Fuel Type: Natural Gas Input Rating: 1,876,000 BTU/hr Steady State Efficiency: 80 %

Siemens Industry, Inc. Soldotna High School Energy Audit Report
AkWarm ID No. CIRI‐SXQ‐CAEC‐11 Page 13 of 47
Idle Loss: 2 % Heat Distribution Type: Water Boiler Operation: All Year Notes: Dedicated burner blower 1.5hp and primary circulation pump 1.5hp Soldotna High School is served by three (3) 1,876 MBH Burnham boilers with 1.5 HP forced draft burners. Generally, only two boilers are used at one time and the third boiler is reported to be having circulation problems. Each boiler is equipped with a 2HP hot water circulation pump and a three‐way valve. Multiple other circulation pumps distributed hot water to terminal devices throughout the building, many of which are in parallel with identical pumps for redundancy. Space Heating and Cooling Distribution Systems Most heating is supplied by a variable air volume fan (F‐1) which in turn supplies VAV boxes located in the classroom areas. The fan is actually two separate fans in parallel powered by two separate (2) 50HP motors. These two fans were originally meant to operate separately as needed. Both fans are instead operated at the same time because short circuiting of air occurs when only one fan is operated. All VAV boxes have a pneumatically controlled damper actuator that is controlled by area thermostats. Some VAV boxes that serve the vocational classrooms and the theater workrooms have VAV boxes with reheat coils that are controlled by either two‐way or three‐way valves. Some vestibules, storage rooms, and mechanical rooms have either unit heaters or cabinet unit heaters. Fan‐2 and Fan‐4 deliver constant volume supply air to perimeter classrooms and the pool area, respectively. Fan‐3 consists of three separate 5HP exhaust fans that are meant to control building pressure. These fans are controlled by pneumatic differential pressure sensor and each fan has gravity dampers.
Fan‐6
delivers variable air volume supply air to the auditorium through VAV boxes with reheat coils.

Siemens Industry, Inc. Soldotna High School Energy Audit Report
AkWarm ID No. CIRI‐SXQ‐CAEC‐11 Page 14 of 47
The school has a building‐wide Honeywell pneumatic control system consisting of two compressors located in two mechanical rooms cross connected into a common supply loop. Pneumatic temperature control panels are distributed across a variety of locations typically adjacent to their respective fan systems.
Domestic Hot Water System Three (3) heat exchangers are fed hot water from the main boiler hot water loop. Heat Exchanger‐1, ‐2, and ‐3 are dedicated to the pool water, kitchen hot water, and general domestic hot water, respectively General domestic hot water is stored in two (2) 870 gal storage tanks. A 2HP circulation pumps distributes domestic hot water throughout the building and a fractional horsepower pump acts as a return pump. The heat exchangers for kitchen and domestic hot water were noted as having poor insulation and giving off a considerable amount of heat to the boiler room. Waste Heat Recovery Information The pool fan system (F‐4/F‐8) includes a heat recovery system consisting of a pair of coils interconnected by a closed glycol loop. Heat is captured from a heat recovery coil located in the exhaust air and transferred otherwise wasted energy to the outside air supply stream pre‐heat coil. A small 1/4hp pump circulates the glycol and is controlled by a local thermostat. Description of Building Ventilation System Fresh air is served by the main air handing units. Multiple constant volume exhaust fans serve restrooms, pool, kitchen, vocational classrooms, and locker rooms.

Siemens Industry, Inc. Soldotna High School Energy Audit Report
AkWarm ID No. CIRI‐SXQ‐CAEC‐11 Page 15 of 47
Lighting Lighting in the academic areas consist predominately of two, three, and four lamp 2x4 fixtures with 32W T8 linear fluorescent lamps and electronic ballasts. The pool and gymnasium lighting consist of 250W metal halide lamps. Most of these areas are controlled with local on/off switches. Exterior lighting consists of metal halide and high pressure sodium fixtures of varying wattages that are controlled by time clocks or photo sensors.
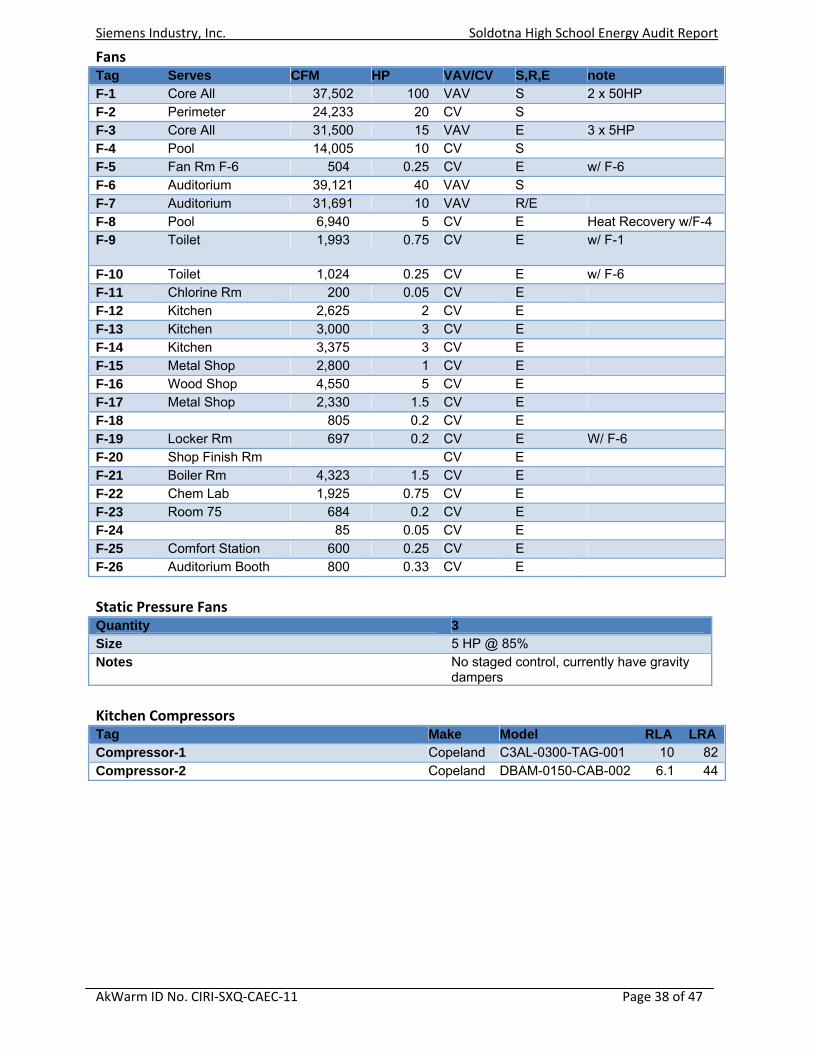
The theater workshop and some storage rooms still have T12 linear fluorescent lighting with magnetic ballasts. Plug Loads Classrooms and offices have typical plug loads that included computers, printers, and copy machines. The kitchen has numbers commercial sized kitchen appliances such as stove, heaters, warming table, dishwashers, as well as a walk‐in refrigerator and walk‐in freezer. The vocational classrooms have a variety of energy intensive tools such as table saws, drills and welders. However, these systems have a very brief operational run time. The pool has a 15HP pump that runs 24/7. There are a variety of remote buildings for sports related activities but many are unheated and all have limited hours of operation. Major Equipment The equipment list, available in Appendix A, is composed of major energy consuming equipment which through energy conservation measures could yield substantial energy savings. The list shows the major equipment in the building and pertinent information utilized in energy savings calculations.
Siemens Industry, Inc. Soldotna High School Energy Audit Report
AkWarm ID No. CIRI‐SXQ‐CAEC‐11 Page 16 of 47
3.2 Predicted Energy Use
3.2.1 Energy Usage / Tariffs
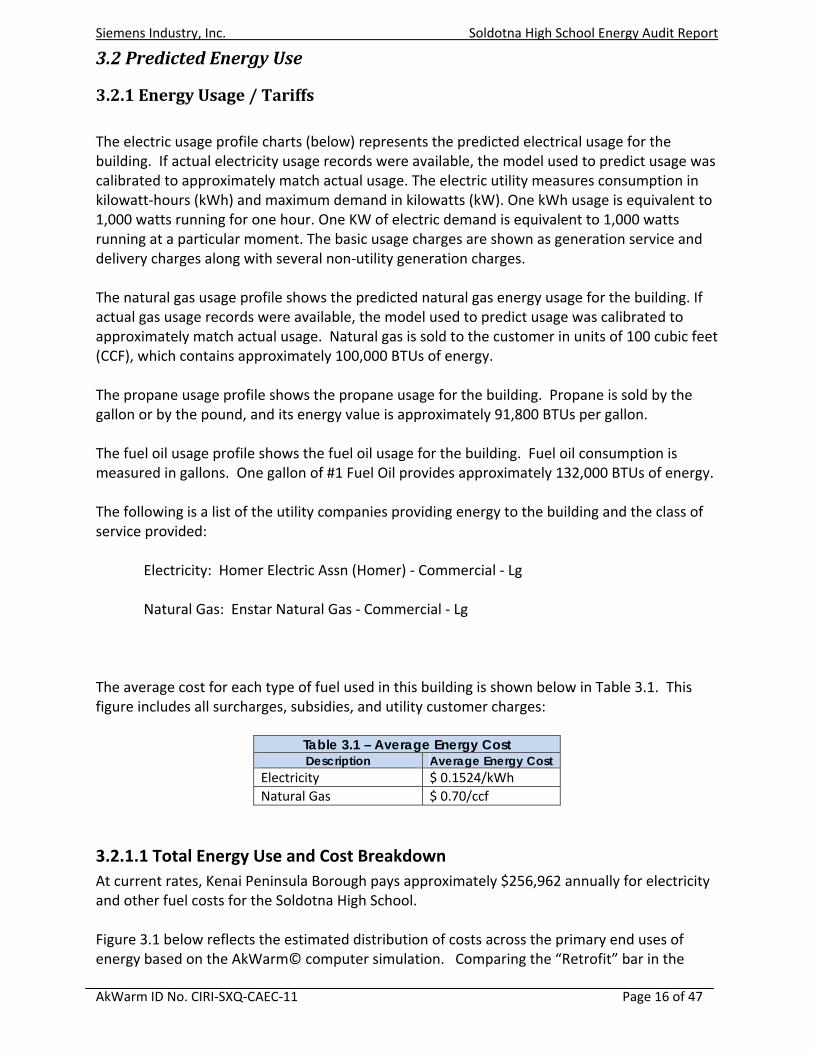
The electric usage profile charts (below) represents the predicted electrical usage for the building. If actual electricity usage records were available, the model used to predict usage was calibrated to approximately match actual usage. The electric utility measures consumption in kilowatt‐hours (kWh) and maximum demand in kilowatts (kW). One kWh usage is equivalent to 1,000 watts running for one hour. One KW of electric demand is equivalent to 1,000 watts running at a particular moment. The basic usage charges are shown as generation service and delivery charges along with several non‐utility generation charges. The natural gas usage profile shows the predicted natural gas energy usage for the building. If actual gas usage records were available, the model used to predict usage was calibrated to approximately match actual usage. Natural gas is sold to the customer in units of 100 cubic feet (CCF), which contains approximately 100,000 BTUs of energy. The propane usage profile shows the propane usage for the building. Propane is sold by the gallon or by the pound, and its energy value is approximately 91,800 BTUs per gallon. The fuel oil usage profile shows the fuel oil usage for the building. Fuel oil consumption is measured in gallons. One gallon of #1 Fuel Oil provides approximately 132,000 BTUs of energy. The following is a list of the utility companies providing energy to the building and the class of service provided: Electricity: Homer Electric Assn (Homer) ‐ Commercial ‐ Lg Natural Gas: Enstar Natural Gas ‐ Commercial ‐ Lg The average cost for each type of fuel used in this building is shown below in Table 3.1. This figure includes all surcharges, subsidies, and utility customer charges:
Table 3.1 – Average Energy Cost Description Average Energy Cost
Electricity $ 0.1524/kWh Natural Gas $ 0.70/ccf
3.2.1.1 Total Energy Use and Cost Breakdown At current rates, Kenai Peninsula Borough pays approximately $256,962 annually for electricity and other fuel costs for the Soldotna High School. Figure 3.1 below reflects the estimated distribution of costs across the primary end uses of energy based on the AkWarm© computer simulation. Comparing the “Retrofit” bar in the

Siemens Industry, Inc. Soldotna High School Energy Audit Report
AkWarm ID No. CIRI‐SXQ‐CAEC‐11 Page 17 of 47
figure to the “Existing” bar shows the potential savings from implementing all of the energy efficiency measures shown in this report.
Figure 3.1 Annual Energy Costs by End Use
Figure 3.2 below shows how the annual energy cost of the building splits between the different fuels used by the building. The “Existing” bar shows the breakdown for the building as it is now; the “Retrofit” bar shows the predicted costs if all of the energy efficiency measures in this report are implemented.
Figure 3.2 Annual Energy Costs by Fuel Type
Figure 3.3 below addresses only Space Heating costs. The figure shows how each heat loss component contributes to those costs; for example, the figure shows how much annual space heating cost is caused by the heat loss through the Walls/Doors. For each component, the space heating cost for the Existing building is shown (blue bar) and the space heating cost assuming all retrofits are implemented (yellow bar) are shown.

Siemens Industry, Inc. Soldotna High School Energy Audit Report
AkWarm ID No. CIRI‐SXQ‐CAEC‐11 Page 18 of 47
Figure 3.3 Annual Space Heating Cost by Component
$0 $20,000 $40,000 $60,000 $80,000 $100,000 $120,000 $140,000
Floor
Wall/Door
Window
Ceiling
Air
Existing Retrofit
Annual Space Heating Cost by Component
The tables below show AkWarm’s estimate of the monthly fuel use for each of the fuels used in the building. For each fuel, the fuel use is broken down across the energy end uses. Note, in the tables below “DHW” refers to Domestic Hot Water heating. Electrical Consumption (kWh) Jan Feb Mar Apr May Jun Jul Aug Sept Oct Nov Dec
Lighting 26925 35562 39024 37765 28934 26007 26874 36638 37699 39024 37765 39024 Other_Electrical 1392 3356 3683 3564 1329 1286 1329 3607 3564 3683 3564 3683 Ventilation_Fans 556 475 521 505 521 456 472 472 503 521 505 521
DHW 0 0 0 0 0 0 0 0 0 0 0 0 Space_Heating 81704 66831 73337 70971 68355 47507 49091 53912 70350 73337 70971 73337 Space_Cooling 0 0 0 0 0 0 0 0 0 0 0 0
Natural Gas Consumption (ccf) Jan Feb Mar Apr May Jun Jul Aug Sept Oct Nov Dec
DHW 54 49 54 53 55 55 59 61 56 56 53 54 Space_Heating 12215 13234 13290 9605 7961 4335 2626 2063 3269 5914 8306 10836

Siemens Industry, Inc. Soldotna High School Energy Audit Report
AkWarm ID No. CIRI‐SXQ‐CAEC‐11 Page 19 of 47
3.2.2 Energy Use Index (EUI) Energy Use Index (EUI) is a measure of a building’s annual energy utilization per square foot of building. This calculation is completed by converting all utility usage consumed by a building for one year, to British Thermal Units (Btu) or kBtu, and dividing this number by the building square footage. EUI is a good measure of a building’s energy use and is utilized regularly for comparison of energy performance for similar building types. The Oak Ridge National Laboratory (ORNL) Buildings Technology Center under a contract with the U.S. Department of Energy maintains a Benchmarking Building Energy Performance Program. The ORNL website determines how a building’s energy use compares with similar facilities throughout the U.S. and in a specific region or state. Source use differs from site usage when comparing a building’s energy consumption with the national average. Site energy use is the energy consumed by the building at the building site only. Source energy use includes the site energy use as well as all of the losses to create and distribute the energy to the building. Source energy represents the total amount of raw fuel that is required to operate the building. It incorporates all transmission, delivery, and production losses, which allows for a complete assessment of energy efficiency in a building. The type of utility purchased has a substantial impact on the source energy use of a building. The EPA has determined that source energy is the most comparable unit for evaluation purposes and overall global impact. Both the site and source EUI ratings for the building are provided to understand and compare the differences in energy use. The site and source EUIs for this building are calculated as follows. (See Table 3.4 for details): Building Site EUI = (Electric Usage in kBtu + Gas Usage in kBtu + similar for other fuels) Building Square Footage Building Source EUI = (Electric Usage in kBtu X SS Ratio + Gas Usage in kBtu X SS Ratio + similar for other fuels) Building Square Footage where “SS Ratio” is the Source Energy to Site Energy ratio for the particular fuel.
Table 3.4
Soldotna High School EUI Calculations
Energy Type Building Fuel Use per Year Site Energy Use per Year, kBTU
Source/Site Ratio
Source Energy Use per Year, kBTU
Electricity 1,251,012 kWh 4,269,704 3.340 14,260,810 Natural Gas 94,311 ccf 9,431,101 1.047 9,874,363 Total 13,700,805 24,135,174 BUILDING AREA 154,637 Square Feet BUILDING SITE EUI 89 kBTU/Ft²/Yr BUILDING SOURCE EUI 156 kBTU/Ft²/Yr * Site ‐ Source Ratio data is provided by the Energy Star Performance Rating Methodology for Incorporating Source Energy Use document issued March 2011.

Siemens Industry, Inc. Soldotna High School Energy Audit Report
AkWarm ID No. CIRI‐SXQ‐CAEC‐11 Page 20 of 47
3.3 AkWarm© Building Simulation An accurate model of the building performance can be created by simulating the thermal performance of the walls, roof, windows and floors of the building. The HVAC system and central plant are modeled as well, accounting for the outside air ventilation required by the building and the heat recovery equipment in place. The model uses local weather data and is trued up to historical energy use to ensure its accuracy. The model can be used now and in the future to measure the utility bill impact of all types of energy projects, including improving building insulation, modifying glazing, changing air handler schedules, increasing heat recovery, installing high efficiency boilers, using variable air volume air handlers, adjusting outside air ventilation and adding cogeneration systems. For the purposes of this study, the Soldotna High School was modeled using AkWarm© energy use software to establish a baseline space heating and cooling energy usage. Climate data from Soldotna was used for analysis. From this, the model was be calibrated to predict the impact of theoretical energy savings measures. Once annual energy savings from a particular measure were predicted and the initial capital cost was estimated, payback scenarios were approximated. Equipment cost estimate calculations are provided in Appendix D. Limitations of AkWarm© Models • The model is based on typical mean year weather data for Soldotna. This data represents the average ambient weather profile as observed over approximately 30 years. As such, the gas and electric profiles generated will not likely compare perfectly with actual energy billing information from any single year. This is especially true for years with extreme warm or cold periods, or even years with unexpectedly moderate weather.

Siemens Industry, Inc. Soldotna High School Energy Audit Report
AkWarm ID No. CIRI‐SXQ‐CAEC‐11 Page 21 of 47
Figure 3.4 Difference in Weather Data
• The heating and cooling load model is a simple two‐zone model consisting of the building’s core interior spaces and the building’s perimeter spaces. This simplified approach loses accuracy for buildings that have large variations in cooling/heating loads across different parts of the building. • The model does not model HVAC systems that simultaneously provide both heating and cooling to the same building space (typically done as a means of providing temperature control in the space). The energy balances shown in Section 3.1 were derived from the output generated by the AkWarm© simulations.
Soldotna, AK Weather Data
-20
-10
0
10
20
30
40
50
60
70
80
5/17/2009 7/6/2009 8/25/2009 10/14/2009 12/3/2009 1/22/2010 3/13/2010 5/2/2010 6/21/2010 8/10/2010
Date
Dry
Bul
b Te
mpe
ratu
re (F
)
Actual Dry Bulb (F) TMY3 Dry Bulb (F)

Siemens Industry, Inc. Soldotna High School Energy Audit Report
AkWarm ID No. CIRI‐SXQ‐CAEC‐11 Page 22 of 47
4. ENERGY COST SAVING MEASURES
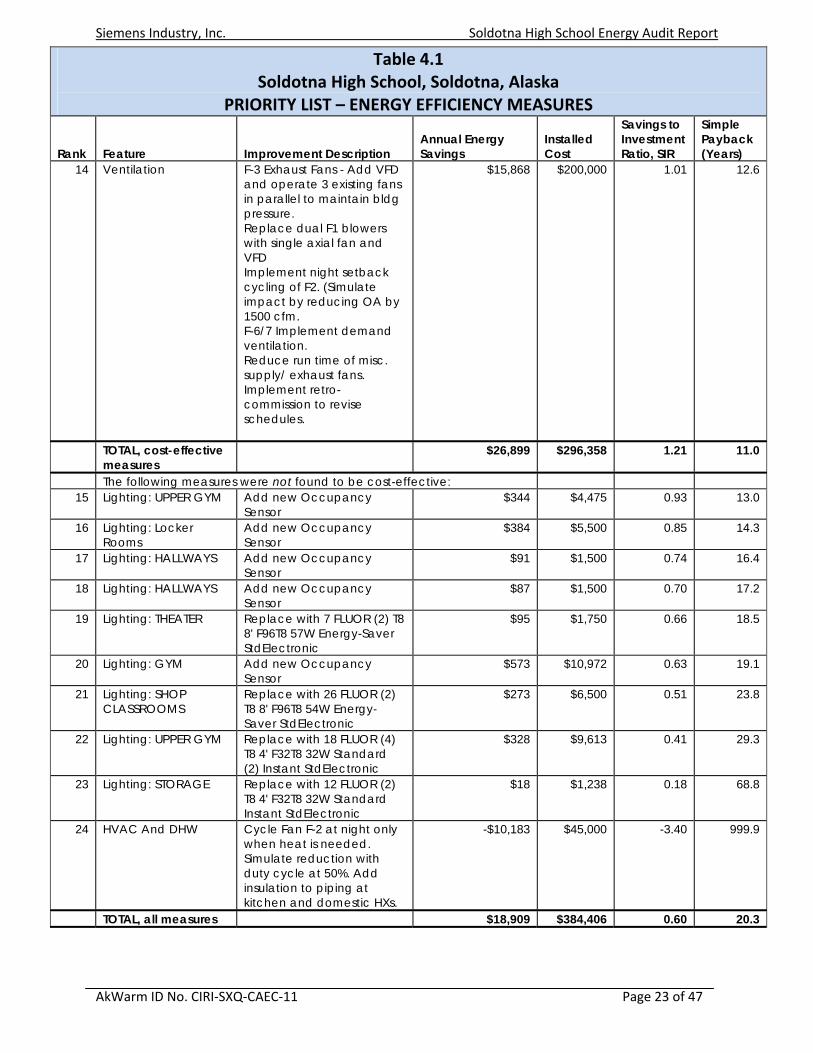
4.1 Summary of Results The energy saving measures are summarized in Table 4.1. Please refer to the individual measure descriptions later in this report for more detail. Calculations and cost estimates for analyzed measures are provided in Appendix C.
Table 4.1 Soldotna High School, Soldotna, Alaska
PRIORITY LIST – ENERGY EFFICIENCY MEASURES Rank
Feature
Improvement Description
Annual Energy Savings
Installed Cost
Savings to Investment Ratio, SIR
Simple Payback (Years)
1 Lighting: EXTERIOR Replace with 9 FLUOR CFL, Spiral 23 W
$332 $246 8.63 0.7
2 Lighting: CLASSROOMS
Replace with 13 FLUOR CFL, Reflector 26W PAR38
$300 $355 5.37 1.2
3 Lighting: OFFICES Replace with 5 FLUOR CFL, Reflector 26W PAR38
$145 $175 5.27 1.2
4 Lighting: THEATER - Overhead Emergency
Replace with 58 FLUOR CFL, Spiral 23 W
$964 $1,583 3.87 1.6
5 Lighting: SHOP CLASSROOMS
Replace with 2 FLUOR (4) T8 4' F32T8 32W Standard (2) Instant StdElectronic
$102 $600 2.08 5.9
6 Lighting: EXTERIOR Replace with 23 120W Induction
$1,628 $16,947 1.85 10.4
7 Lighting: GYM Replace with 44 FLUOR (4) T8 4' F32T8 32W Standard (2) Instant StdElectronic
$3,217 $23,498 1.66 7.3
8 Lighting: EXTERIOR Replace with 32 200W Induction
$2,543 $31,034 1.54 12.2
9 Lighting: STORAGE Replace with 2 FLUOR CFL, Reflector 26W PAR38
$16 $70 1.44 4.4
10 Lighting: HALLWAYS Add new Occupancy Sensor
$1,111 $11,000 1.23 9.9
11 Lighting: EXTERIOR Replace with 15 40W Induction
$498 $8,154 1.17 16.4
12 Lighting: EXTERIOR Replace with 4 80W Induction
$155 $2,587 1.15 16.7
13 Lighting: STORAGE Replace with 4 FLUOR CFL, Spiral 23 W
$20 $109 1.15 5.5
Siemens Industry, Inc. Soldotna High School Energy Audit Report
AkWarm ID No. CIRI‐SXQ‐CAEC‐11 Page 23 of 47
Table 4.1 Soldotna High School, Soldotna, Alaska
PRIORITY LIST – ENERGY EFFICIENCY MEASURES Rank
Feature
Improvement Description
Annual Energy Savings
Installed Cost
Savings to Investment Ratio, SIR
Simple Payback (Years)
14 Ventilation F-3 Exhaust Fans - Add VFD and operate 3 existing fans in parallel to maintain bldg pressure. Replace dual F1 blowers with single axial fan and VFD Implement night setback cycling of F2. (Simulate impact by reducing OA by 1500 cfm. F-6/7 Implement demand ventilation. Reduce run time of misc. supply/ exhaust fans. Implement retro-commission to revise schedules.
$15,868 $200,000 1.01 12.6
TOTAL, cost-effective measures
$26,899 $296,358 1.21 11.0
The following measures were not found to be cost-effective: 15 Lighting: UPPER GYM Add new Occupancy
Sensor $344 $4,475 0.93 13.0
16 Lighting: Locker Rooms
Add new Occupancy Sensor
$384 $5,500 0.85 14.3
17 Lighting: HALLWAYS Add new Occupancy Sensor
$91 $1,500 0.74 16.4
18 Lighting: HALLWAYS Add new Occupancy Sensor
$87 $1,500 0.70 17.2
19 Lighting: THEATER Replace with 7 FLUOR (2) T8 8' F96T8 57W Energy-Saver StdElectronic
$95 $1,750 0.66 18.5
20 Lighting: GYM Add new Occupancy Sensor
$573 $10,972 0.63 19.1
21 Lighting: SHOP CLASSROOMS
Replace with 26 FLUOR (2) T8 8' F96T8 54W Energy-Saver StdElectronic
$273 $6,500 0.51 23.8
22 Lighting: UPPER GYM Replace with 18 FLUOR (4) T8 4' F32T8 32W Standard (2) Instant StdElectronic
$328 $9,613 0.41 29.3
23 Lighting: STORAGE Replace with 12 FLUOR (2) T8 4' F32T8 32W Standard Instant StdElectronic
$18 $1,238 0.18 68.8
24 HVAC And DHW Cycle Fan F-2 at night only when heat is needed. Simulate reduction with duty cycle at 50%. Add insulation to piping at kitchen and domestic HXs.
-$10,183 $45,000 -3.40 999.9
TOTAL, all measures $18,909 $384,406 0.60 20.3

Siemens Industry, Inc. Soldotna High School Energy Audit Report
AkWarm ID No. CIRI‐SXQ‐CAEC‐11 Page 24 of 47
4.2 Interactive Effects of Projects The savings for a particular measure are calculated assuming all recommended EEMs coming before that measure in the list are implemented. If some EEMs are not implemented, savings for the remaining EEMs will be affected. For example, if ceiling insulation is not added, then savings from a project to replace the heating system will be increased, because the heating system for the building supplies a larger load. In general, all projects are evaluated sequentially so energy savings associated with one EEM would not also be attributed to another EEM. By modeling the recommended project sequentially, the analysis accounts for interactive affects among the EEMs and does not “double count” savings. Interior lighting, plug loads, facility equipment, and occupants generate heat within the building. When the building is in cooling mode, these items contribute to the overall cooling demands of the building; therefore, lighting efficiency improvements will reduce cooling requirements in air‐conditioned buildings. Conversely, lighting‐efficiency improvements are anticipated to slightly increase heating requirements. Heating penalties and cooling benefits were included in the lighting project analysis.

Siemens Industry, Inc. Soldotna High School Energy Audit Report
AkWarm ID No. CIRI‐SXQ‐CAEC‐11 Page 25 of 47
4.3 Building Shell Measures The exterior walls around the pool area were noted to be losing more heat through gaps in insulation than other areas of the building. While a complete insulation replacement in these walls would be expensive and is not recommended at this time, it is recommended that the insulation in this area be monitored as humidity in the pool area may start to degrade the wall insulation. Refer to Section C of the Appendix for infrared pictures of the area.

Siemens Industry, Inc. Soldotna High School Energy Audit Report
AkWarm ID No. CIRI‐SXQ‐CAEC‐11 Page 26 of 47
4.4 Mechanical Equipment Measures
4.4.1 Heating/Cooling/Domestic Hot Water Measure
Fan-2 Scheduling
Observation Fan‐2 currently delivers perimeter heating during the night when the building is not occupied. Traditionally, equipment serving the same building area (zone) is scheduled to turn off or scale down during unoccupied periods. The problem with this approach is that equipment schedules often do not match and equipment is left operating when it could be turned off.
Recommendations Fan‐2 should be programmed to run only when needed during the unoccupied periods. One of the most successful ways to control building energy is to schedule building systems and equipment based on building occupancy and special event schedules. Taking control of equipment scheduling is the quickest and simplest way to achieve an immediate reduction in energy usage. Air handler scheduling saves significant electrical energy for fans and/or pumps, heating energy for ventilation air and night temperature setback during hot seasons. This cost includes adding / upgrading DDC to major mechanical systems.
Heat Exchanger Insulation
Observations The kitchen and domestic hot water heat exchangers and the piping that feeds into them have poor insulation. These un‐insulated systems are continuously losing heat and energy to the mechanical room space, reducing the deliverable capacity. This energy waste reduces the overall system efficiency, unnecessarily increases the mechanical room ambient temperature and creates potential employee safety hazards due to exposed high temperature surfaces. Recommendations Install or reinstall glass fiber pipe insulation on specified HVAC water piping systems.
Rank Recommendation 24 Cycle Fan F‐2 at night only when heat is needed. Simulate reduction with duty cycle at 50%. Add insulation to piping at kitchen and
domestic HXs. Installation Cost $45,000 Estimated Life of Measure (yrs) 20 Energy Savings (/yr) ‐$10,183Breakeven Cost ‐$153,164 Savings‐to‐Investment Ratio ‐3.4 Simple Payback yrs 1000Auditors Notes:

Siemens Industry, Inc. Soldotna High School Energy Audit Report
AkWarm ID No. CIRI‐SXQ‐CAEC‐11 Page 27 of 47
4.4.2 Ventilation System Measures
Building Pressure Fan Modifications
Observation Fan‐3 consists of three separate 5HP exhaust fans that are meant to control building pressure. These fans are controlled by pneumatic differential pressure sensor.
Recommendations Siemens recommends installing a variable frequency drive (VFD) on each fan motor and installing a DDC pressure sensor to control the fans. VFDs control airflow by varying the speed of the motor based on the differential pressure set point between interior and the exterior environments. This form of control results in significant motor energy savings because the motor only uses the energy required to satisfy building pressure. In this case, energy would also be conserved by limiting the amount tempered air that is exhausted from the building.
Fan-1 Modifications
Observation Fan‐1 serves the academic area VAV boxes and has two motors that operate at the same time in parallel.
Recommendations Siemens recommends removing both fans and replacing them with a single axial fan and a single appropriately sized premium efficiency motor. High efficiency motors should be considered when installing variable frequency drives. Some standard duty motors may not function well with the VFD inverters. Siemens also recommends installing a variable frequency drive (VFD) Fan‐1. VFDs control airflow by varying the speed of the motor based on the differential pressure set point of the system. This form of control results in significant motor energy savings because the motor only uses the energy required to satisfy the load. A DDC system would be installed on this fan in order to make the necessary control sequence changes.
Rank Description Recommendation 14 F‐3 Exhaust Fans ‐ Add VFD and operate 3 existing fans in parallel
to maintain bldg pressure. Replace dual F1 blowers with single axial fan and VFD Implement night setback cycling of F2. (Simulate impact by reducing OA by 1500 cfm. F‐6/7 Implement demand ventilation. Reduce run time of misc. supply/ exhaust fans. Implement retro‐commission to revise schedules.
Installation Cost $200,000 Estimated Life of Measure (yrs) 15 Energy Savings (/yr) $15,868Breakeven Cost $201,566 Savings‐to‐Investment Ratio 1.0 Simple Payback yrs 13Auditors Notes:

Siemens Industry, Inc. Soldotna High School Energy Audit Report
AkWarm ID No. CIRI‐SXQ‐CAEC‐11 Page 28 of 47
Auditorium Demand Control Ventilation (Fan-6 and Fan-7)
Observation The auditorium air handling unit currently has two variable air volume fans. Fan‐6 delivers supply air to the area, while Fan‐7 handles return air. The existing auditorium fan systems supply air to the space and have minimum requirements of outside air. This amount of required outside air varies based on occupancy. The more people in the space, the more outside air should be delivered. The occupancy of these spaces varies throughout the day, but the minimum amount of outside air delivered to the space remains constant.
Recommendations Siemens recommends using carbon dioxide (CO2) sensors in the return air streams of the air handling unit to monitor the percentage of CO2 in auditorium. Based on that percentage the outside air, return air and exhaust air dampers can be more tightly controlled to supply the space with the proper amount of ventilation without conditioning outside air that is not required. This type of control, called demand ventilation, is a newer concept and offers a means of optimizing the amount of ventilation required for a building or space. Energy savings are achieved by limiting the volume of outside air that must be conditioned. Demand control ventilation (DCV) is a control strategy that adjusts the amount of outside air based on the number of occupants and the ventilation needs of those occupants. Not heating or cooling unnecessary quantities of outside air conserves energy. Ventilation is based on the needs of the occupants of the space rather than using a fixed strategy based on design occupancy. DCV modulates ventilation to maintain target cfm‐per‐person ventilation rates based on actual occupancy. CO2 is used as an occupancy indicator to modulate ventilation below the maximum total outdoor air intake rate while maintaining the required ventilation rate per person. DCV avoids excessive over‐ventilation while still maintaining good ventilation and providing required cfm‐per‐person outside air requirements specified by local codes and standards. To accomplish demand control ventilation, the pneumatic controls on the auditorium air handling unit would be replaced with a DDC system.
Retro-Commissioning
Recommendations The retro commissioning process would include analyzing major equipment throughout the building and identifying operational and equipment deficiencies. Over time, equipment set points and schedules may no longer fit the needs of the building or its occupants. Additionally, equipment deficiencies, such as dampers or actuators that are no longer properly operating, can be corrected at this time. Retro‐Commissioning would also include:
• Optimizing minimum outdoor air intake through air handling units.
Siemens Industry, Inc. Soldotna High School Energy Audit Report
AkWarm ID No. CIRI‐SXQ‐CAEC‐11 Page 29 of 47
• Program discharge air temperature (DAT) reset schedules to conserve heating, cooling, and fan energy of all air‐handling units
• Provide supply air static pressure reset schedules to conserve fan electric energy • Fix Boiler‐3 water circulation problems. (This is operational – no energy saving claimed) • Reduce runtime of exhaust fans – validate schedule and minimize operation to reduce both
electrical and outside air drawn into building. • Program mixed air temperature (MAT) reset schedules in accordance with DAT reset
schedules • Program return fan speeds to appropriately track supply fan speeds • Calibrate MAT and DAT sensors and feedback control loops • Calibrate economizer cycle operation of AHUs • Provide new control sequences for all AHUs and unit ventilators.
4.4.3 Night Setback Thermostat Measures ‐ See FIM for System F‐2

Siemens Industry, Inc. Soldotna High School Energy Audit Report
AkWarm ID No. CIRI‐SXQ‐CAEC‐11 Page 30 of 47
4.5 Electrical & Appliance Measures 4.5.1 Lighting Measures The goal of this section is to present any lighting energy conservation measures that may also be cost beneficial. It should be noted that replacing current bulbs with more energy‐efficient equivalents will have a small effect on the building heating and cooling loads. The building cooling load will see a small decrease from an upgrade to more efficient bulbs and the heating load will see a small increase, as the more energy efficient bulbs give off less heat. Occupancy Sensors Observations Currently, the lights in the gymnasiums, hallways, and locker rooms are controlled locally by wall switches. These switches allow the teachers, staff and students to turn the light fixtures on and off as required. However, there are times when lights are left on even though the rooms are unoccupied. Recommendations Siemens recommends installing motion/occupancy sensors to turn the lights on and off based on the use of the space. The sensors could be mounted on the ceiling in some areas so that the entire area is sensed. The sensing device would be a dual technology infrared and ultrasonic device that would sense both noise and motion. The sensors also have time and sensitivity adjustments. Exterior Lighting Observations Exterior building and parking lot lighting consists of metal halide fixtures of varying wattages. Recommendations It is recommended that the existing exterior metal halide fixtures be replaced with more energy efficient induction lighting fixtures. These systems offer superior light rendering and over 100,000 hours of useful life. This long operational equipment life considerably reduces necessary maintenance and equipment replacement. Metal Halide Lighting Observations The pool and the gymnasiums have metal halide lighting that is inefficient and requires lengthy start up times. Recommendations It is recommended that the metal halide fixtures in the gyms be replaced with more energy efficient T8 linear fluorescent lighting fixtures. Fixtures in the gymnasium would be enclosed in metal cages to prevent damage from balls and other projectiles. Occupancy Sensors should also be installed in these areas to limit the amount time that lights are left on during unoccupied periods. Metal halide fixtures in the natatorium should be retrofitted with induction fixtures designed for use in humid swimming pool environments. These fixtures consume much less energy, offer better light rendering, and offer the ability to turn the lights on and off instantly.
Siemens Industry, Inc. Soldotna High School Energy Audit Report
AkWarm ID No. CIRI‐SXQ‐CAEC‐11 Page 31 of 47
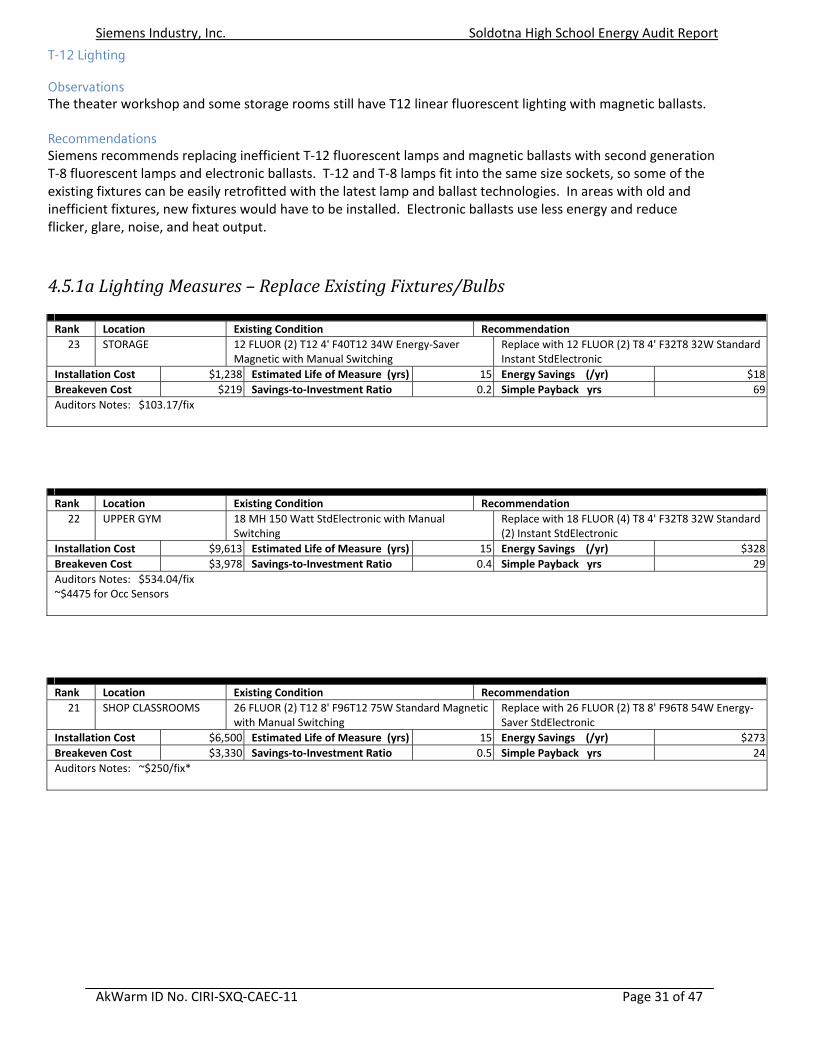
T-12 Lighting Observations The theater workshop and some storage rooms still have T12 linear fluorescent lighting with magnetic ballasts. Recommendations Siemens recommends replacing inefficient T‐12 fluorescent lamps and magnetic ballasts with second generation T‐8 fluorescent lamps and electronic ballasts. T‐12 and T‐8 lamps fit into the same size sockets, so some of the existing fixtures can be easily retrofitted with the latest lamp and ballast technologies. In areas with old and inefficient fixtures, new fixtures would have to be installed. Electronic ballasts use less energy and reduce flicker, glare, noise, and heat output.
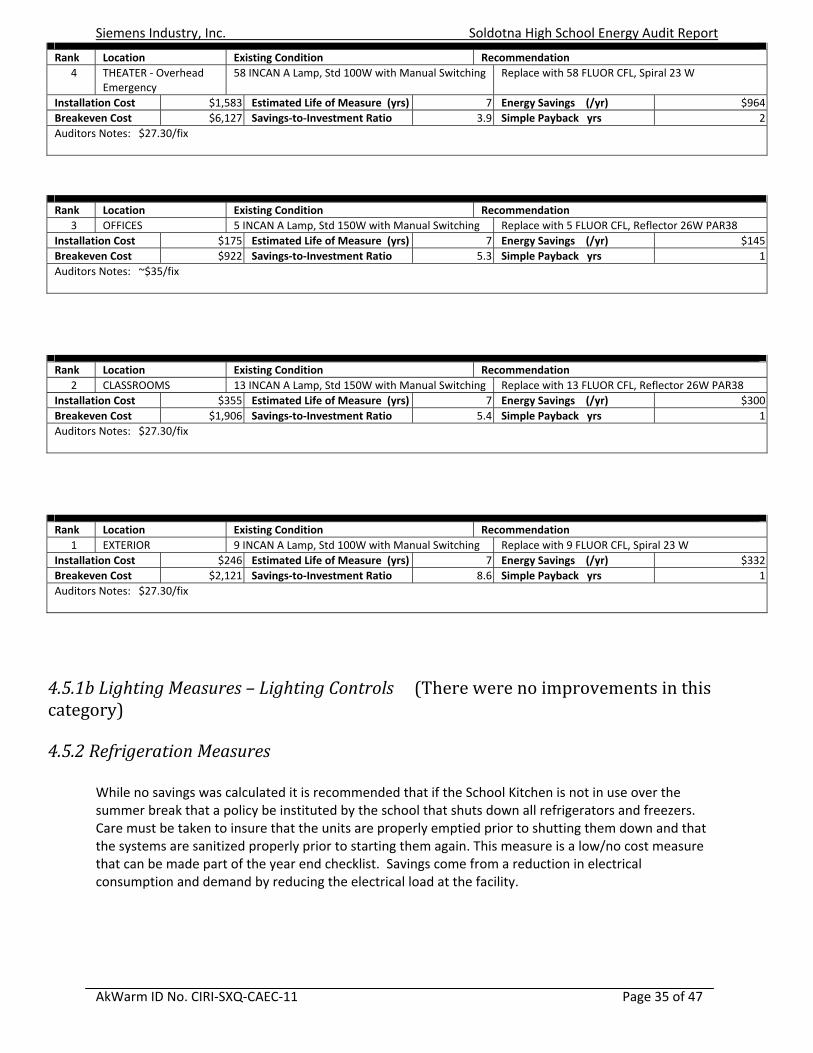
4.5.1a Lighting Measures – Replace Existing Fixtures/Bulbs
Rank Location Existing Condition Recommendation 23 STORAGE 12 FLUOR (2) T12 4' F40T12 34W Energy‐Saver
Magnetic with Manual Switching Replace with 12 FLUOR (2) T8 4' F32T8 32W Standard Instant StdElectronic
Installation Cost $1,238 Estimated Life of Measure (yrs) 15 Energy Savings (/yr) $18Breakeven Cost $219 Savings‐to‐Investment Ratio 0.2 Simple Payback yrs 69Auditors Notes: $103.17/fix
Rank Location Existing Condition Recommendation 22 UPPER GYM 18 MH 150 Watt StdElectronic with Manual
Switching Replace with 18 FLUOR (4) T8 4' F32T8 32W Standard (2) Instant StdElectronic
Installation Cost $9,613 Estimated Life of Measure (yrs) 15 Energy Savings (/yr) $328Breakeven Cost $3,978 Savings‐to‐Investment Ratio 0.4 Simple Payback yrs 29Auditors Notes: $534.04/fix ~$4475 for Occ Sensors
Rank Location Existing Condition Recommendation 21 SHOP CLASSROOMS 26 FLUOR (2) T12 8' F96T12 75W Standard Magnetic
with Manual Switching Replace with 26 FLUOR (2) T8 8' F96T8 54W Energy‐Saver StdElectronic
Installation Cost $6,500 Estimated Life of Measure (yrs) 15 Energy Savings (/yr) $273Breakeven Cost $3,330 Savings‐to‐Investment Ratio 0.5 Simple Payback yrs 24Auditors Notes: ~$250/fix*

Siemens Industry, Inc. Soldotna High School Energy Audit Report
AkWarm ID No. CIRI‐SXQ‐CAEC‐11 Page 32 of 47
Rank Location Existing Condition Recommendation 20 GYM 44 MH 250 Watt StdElectronic with Manual
Switching Add new Occupancy Sensor
Installation Cost $10,972 Estimated Life of Measure (yrs) 15 Energy Savings (/yr) $573Breakeven Cost $6,954 Savings‐to‐Investment Ratio 0.6 Simple Payback yrs 19Auditors Notes: $534.04/fix ~$10,972
Rank Location Existing Condition Recommendation 19 THEATER 7 FLUOR (2) T12 8' F96T12 75W Standard Magnetic
with Manual Switching Replace with 7 FLUOR (2) T8 8' F96T8 57W Energy‐Saver StdElectronic
Installation Cost $1,750 Estimated Life of Measure (yrs) 15 Energy Savings (/yr) $95Breakeven Cost $1,154 Savings‐to‐Investment Ratio 0.7 Simple Payback yrs 18Auditors Notes: ~$250/fix*
Rank Location Existing Condition Recommendation 18 HALLWAYS 20 FLUOR (2) T8 4' F32T8 32W Standard Instant
StdElectronic with Manual Switching Add new Occupancy Sensor
Installation Cost $1,500 Estimated Life of Measure (yrs) 15 Energy Savings (/yr) $87Breakeven Cost $1,057 Savings‐to‐Investment Ratio 0.7 Simple Payback yrs 17Auditors Notes: ~6 Fixtures/Sensor ~3 Sensors Needed $500/Sensor
Rank Location Existing Condition Recommendation 17 HALLWAYS 21 FLUOR (2) T8 4' F32T8 32W Standard Instant
StdElectronic with Manual Switching Add new Occupancy Sensor
Installation Cost $1,500 Estimated Life of Measure (yrs) 15 Energy Savings (/yr) $91Breakeven Cost $1,111 Savings‐to‐Investment Ratio 0.7 Simple Payback yrs 16Auditors Notes: ~6 Fixtures/Sensor ~3 Sensors Needed $500/Sensor
Rank Location Existing Condition Recommendation 16 Locker Rooms 59 FLUOR (2) T8 4' F32T8 32W Standard Instant
StdElectronic with Manual Switching Add new Occupancy Sensor
Installation Cost $5,500 Estimated Life of Measure (yrs) 15 Energy Savings (/yr) $384Breakeven Cost $4,664 Savings‐to‐Investment Ratio 0.8 Simple Payback yrs 14Auditors Notes: ~11 Sensors Needed $500/Sensor
Siemens Industry, Inc. Soldotna High School Energy Audit Report
AkWarm ID No. CIRI‐SXQ‐CAEC‐11 Page 33 of 47
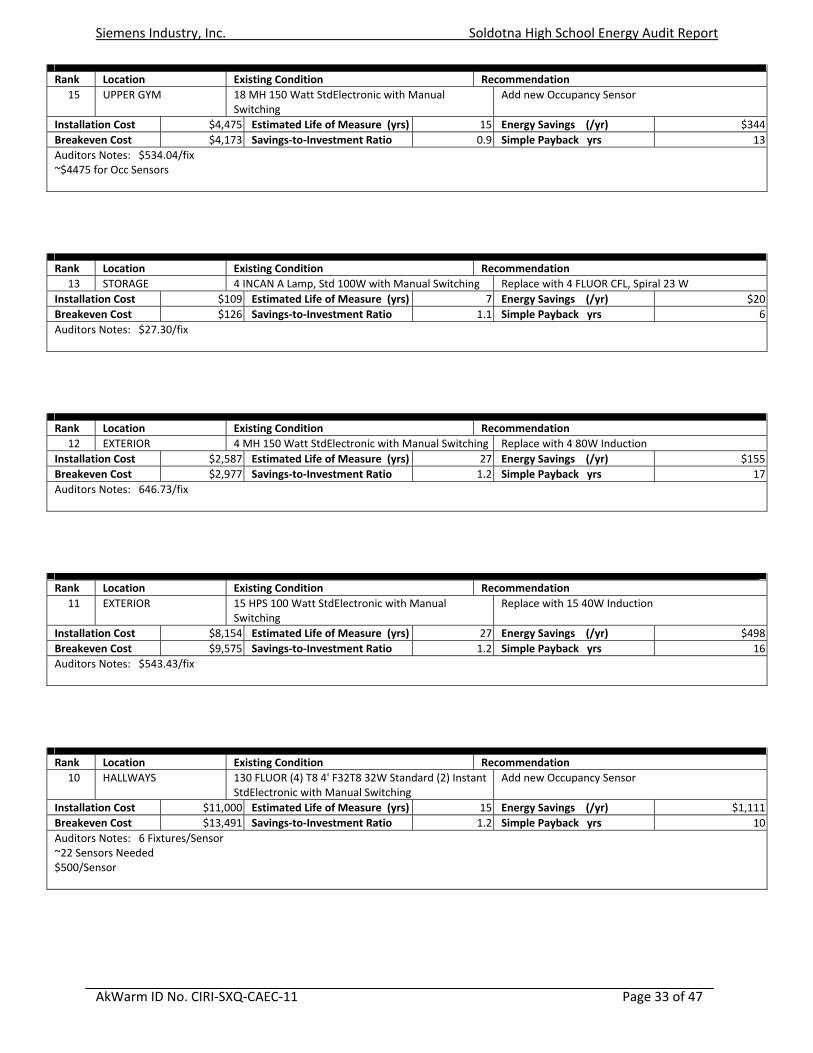
Rank Location Existing Condition Recommendation 15 UPPER GYM 18 MH 150 Watt StdElectronic with Manual
Switching Add new Occupancy Sensor
Installation Cost $4,475 Estimated Life of Measure (yrs) 15 Energy Savings (/yr) $344Breakeven Cost $4,173 Savings‐to‐Investment Ratio 0.9 Simple Payback yrs 13Auditors Notes: $534.04/fix ~$4475 for Occ Sensors
Rank Location Existing Condition Recommendation 13 STORAGE 4 INCAN A Lamp, Std 100W with Manual Switching Replace with 4 FLUOR CFL, Spiral 23 W
Installation Cost $109 Estimated Life of Measure (yrs) 7 Energy Savings (/yr) $20Breakeven Cost $126 Savings‐to‐Investment Ratio 1.1 Simple Payback yrs 6Auditors Notes: $27.30/fix
Rank Location Existing Condition Recommendation 12 EXTERIOR 4 MH 150 Watt StdElectronic with Manual Switching Replace with 4 80W Induction
Installation Cost $2,587 Estimated Life of Measure (yrs) 27 Energy Savings (/yr) $155Breakeven Cost $2,977 Savings‐to‐Investment Ratio 1.2 Simple Payback yrs 17Auditors Notes: 646.73/fix
Rank Location Existing Condition Recommendation 11 EXTERIOR 15 HPS 100 Watt StdElectronic with Manual
Switching Replace with 15 40W Induction
Installation Cost $8,154 Estimated Life of Measure (yrs) 27 Energy Savings (/yr) $498Breakeven Cost $9,575 Savings‐to‐Investment Ratio 1.2 Simple Payback yrs 16Auditors Notes: $543.43/fix
Rank Location Existing Condition Recommendation 10 HALLWAYS 130 FLUOR (4) T8 4' F32T8 32W Standard (2) Instant
StdElectronic with Manual Switching Add new Occupancy Sensor
Installation Cost $11,000 Estimated Life of Measure (yrs) 15 Energy Savings (/yr) $1,111Breakeven Cost $13,491 Savings‐to‐Investment Ratio 1.2 Simple Payback yrs 10Auditors Notes: 6 Fixtures/Sensor ~22 Sensors Needed $500/Sensor

Siemens Industry, Inc. Soldotna High School Energy Audit Report
AkWarm ID No. CIRI‐SXQ‐CAEC‐11 Page 34 of 47
Rank Location Existing Condition Recommendation 9 STORAGE 2 INCAN A Lamp, Std 150W with Manual Switching Replace with 2 FLUOR CFL, Reflector 26W PAR38
Installation Cost $70 Estimated Life of Measure (yrs) 7 Energy Savings (/yr) $16Breakeven Cost $101 Savings‐to‐Investment Ratio 1.4 Simple Payback yrs 4Auditors Notes: ~$35/fix
Rank Location Existing Condition Recommendation 8 EXTERIOR 32 MH 400 Watt StdElectronic with Manual
Switching Replace with 32 200W Induction
Installation Cost $31,034 Estimated Life of Measure (yrs) 27 Energy Savings (/yr) $2,543Breakeven Cost $47,883 Savings‐to‐Investment Ratio 1.5 Simple Payback yrs 12Auditors Notes: $969.80/fix
Rank Location Existing Condition Recommendation 7 GYM 44 MH 250 Watt StdElectronic with Manual
Switching Replace with 44 FLUOR (4) T8 4' F32T8 32W Standard (2) Instant StdElectronic
Installation Cost $23,498 Estimated Life of Measure (yrs) 15 Energy Savings (/yr) $3,217Breakeven Cost $39,010 Savings‐to‐Investment Ratio 1.7 Simple Payback yrs 7Auditors Notes: $534.04/fix ~$10,972
Rank Location Existing Condition Recommendation 6 EXTERIOR 23 MH 250 Watt StdElectronic with Manual
Switching Replace with 23 120W Induction
Installation Cost $16,947 Estimated Life of Measure (yrs) 27 Energy Savings (/yr) $1,628Breakeven Cost $31,318 Savings‐to‐Investment Ratio 1.8 Simple Payback yrs 10Auditors Notes: $736.84/fix
Rank Location Existing Condition Recommendation 5 SHOP CLASSROOMS 2 MH 400 Watt StdElectronic with Manual Switching Replace with 2 FLUOR (4) T8 4' F32T8 32W Standard
(2) Instant StdElectronic Installation Cost $600 Estimated Life of Measure (yrs) 15 Energy Savings (/yr) $102Breakeven Cost $1,248 Savings‐to‐Investment Ratio 2.1 Simple Payback yrs 6Auditors Notes: ~300/fix*
Siemens Industry, Inc. Soldotna High School Energy Audit Report
AkWarm ID No. CIRI‐SXQ‐CAEC‐11 Page 35 of 47
4.5.1b Lighting Measures – Lighting Controls (There were no improvements in this category) 4.5.2 Refrigeration Measures
While no savings was calculated it is recommended that if the School Kitchen is not in use over the summer break that a policy be instituted by the school that shuts down all refrigerators and freezers. Care must be taken to insure that the units are properly emptied prior to shutting them down and that the systems are sanitized properly prior to starting them again. This measure is a low/no cost measure that can be made part of the year end checklist. Savings come from a reduction in electrical consumption and demand by reducing the electrical load at the facility.
Rank Location Existing Condition Recommendation 4 THEATER ‐ Overhead
Emergency 58 INCAN A Lamp, Std 100W with Manual Switching Replace with 58 FLUOR CFL, Spiral 23 W
Installation Cost $1,583 Estimated Life of Measure (yrs) 7 Energy Savings (/yr) $964Breakeven Cost $6,127 Savings‐to‐Investment Ratio 3.9 Simple Payback yrs 2Auditors Notes: $27.30/fix
Rank Location Existing Condition Recommendation 3 OFFICES 5 INCAN A Lamp, Std 150W with Manual Switching Replace with 5 FLUOR CFL, Reflector 26W PAR38
Installation Cost $175 Estimated Life of Measure (yrs) 7 Energy Savings (/yr) $145Breakeven Cost $922 Savings‐to‐Investment Ratio 5.3 Simple Payback yrs 1Auditors Notes: ~$35/fix
Rank Location Existing Condition Recommendation 2 CLASSROOMS 13 INCAN A Lamp, Std 150W with Manual Switching Replace with 13 FLUOR CFL, Reflector 26W PAR38
Installation Cost $355 Estimated Life of Measure (yrs) 7 Energy Savings (/yr) $300Breakeven Cost $1,906 Savings‐to‐Investment Ratio 5.4 Simple Payback yrs 1Auditors Notes: $27.30/fix
Rank Location Existing Condition Recommendation 1 EXTERIOR 9 INCAN A Lamp, Std 100W with Manual Switching Replace with 9 FLUOR CFL, Spiral 23 W
Installation Cost $246 Estimated Life of Measure (yrs) 7 Energy Savings (/yr) $332Breakeven Cost $2,121 Savings‐to‐Investment Ratio 8.6 Simple Payback yrs 1Auditors Notes: $27.30/fix

Siemens Industry, Inc. Soldotna High School Energy Audit Report
AkWarm ID No. CIRI‐SXQ‐CAEC‐11 Page 36 of 47
4.5.3 Other Electrical Measures (There were no improvements in this category)
4.5.4 Cooking Measures (There were no improvements in this category) 4.5.5 Clothes Drying Measures (There were no improvements in this category)

Siemens Industry, Inc. Soldotna High School Energy Audit Report
AkWarm ID No. CIRI‐SXQ‐CAEC‐11 Page 37 of 47
Appendix A – Major Equipment List Boilers Quantity 3 Make Burnham Mod KV1108WML MBH out 1,517 MBH in 1,876 Hi/Lo Burner 1875 MBH max, 1125 MBH min, 1.5HP @ 80% Boiler Circulation Pumps Tag Size P-1A 1550/2050W P-1B 1440W P-1A Upper 1440W Circulation Pumps Tag Size % Eff Notes P-14 5HP 87.5%P-15 5HP 87.5%
One runs at a time
P-4 Upper 3HP 82.5%P-4 3HP 82.5%
One runs at a time
Pool, Voc Ed, Aud, Band
P-2 1400W 82.5% DHW, 24/7 P-3 2360W Coils to F-1&F-2 Domestic Hot Water Devices Number of DHW Tanks 2 Volume 870 gal Number of Heat Exchangers 3
Siemens Industry, Inc. Soldotna High School Energy Audit Report
AkWarm ID No. CIRI‐SXQ‐CAEC‐11 Page 38 of 47
Fans Tag Serves CFM HP VAV/CV S,R,E note F-1 Core All 37,502 100 VAV S 2 x 50HP F-2 Perimeter 24,233 20 CV S F-3 Core All 31,500 15 VAV E 3 x 5HP F-4 Pool 14,005 10 CV S F-5 Fan Rm F-6 504 0.25 CV E w/ F-6 F-6 Auditorium 39,121 40 VAV S F-7 Auditorium 31,691 10 VAV R/E F-8 Pool 6,940 5 CV E Heat Recovery w/F-4 F-9 Toilet 1,993 0.75 CV E w/ F-1
F-10 Toilet 1,024 0.25 CV E w/ F-6 F-11 Chlorine Rm 200 0.05 CV E F-12 Kitchen 2,625 2 CV E F-13 Kitchen 3,000 3 CV E F-14 Kitchen 3,375 3 CV E F-15 Metal Shop 2,800 1 CV E F-16 Wood Shop 4,550 5 CV E F-17 Metal Shop 2,330 1.5 CV E F-18 805 0.2 CV E F-19 Locker Rm 697 0.2 CV E W/ F-6 F-20 Shop Finish Rm CV E F-21 Boiler Rm 4,323 1.5 CV E F-22 Chem Lab 1,925 0.75 CV E F-23 Room 75 684 0.2 CV E F-24 85 0.05 CV E F-25 Comfort Station 600 0.25 CV E F-26 Auditorium Booth 800 0.33 CV E Static Pressure Fans Quantity 3 Size 5 HP @ 85% Notes No staged control, currently have gravity
dampers Kitchen Compressors Tag Make Model RLA LRA Compressor-1 Copeland C3AL-0300-TAG-001 10 82Compressor-2 Copeland DBAM-0150-CAB-002 6.1 44

Siemens Industry, Inc. Soldotna High School Energy Audit Report
AkWarm ID No. CIRI‐SXQ‐CAEC‐11 Page 39 of 47
Appendix B – Lighting Inventory 100W
HPS 100W Incandescent
150 W MH
150W Incandescent
1x4x2 T8
1x8x2 T12
250 W MH
2x4x2 T8
2x4x3 T8
2x4x4 T8
400W MH
1x4x2 T12 (34W)
Grand Total
Classrooms 13 132 100 292 249 786 Exterior 15 9 4 23 32 83 Gymnasium 18 44 62 Hallways 20 21 130 171 Offices 5 8 23 90 18 144 Pool Area 36 36 Restrooms / Locker Rooms
69 2 16 87
Storage 4 2 53 32 11 2 12 116 Shop Classrooms
26 2 28
Theater Area 58 26 7 11 15 117 Grand Total 15 71 22 20 308 33 122 178 404 430 34 12 1630

Siemens Industry, Inc. Soldotna High School Energy Audit Report
AkWarm ID No. CIRI‐SXQ‐CAEC‐11 Page 40 of 47
Appendix C – IR Photos
Exterior pool area walls show signs of heat loss through gaps in the insulation paneling and doors.
Exterior classroom walls on the west side of the building show heat loss through gaps in the insulation paneling and windows.
Some heat is also lost through the exposed foundation.
Siemens Industry, Inc. Soldotna High School Energy Audit Report
AkWarm ID No. CIRI‐SXQ‐CAEC‐11 Page 41 of 47
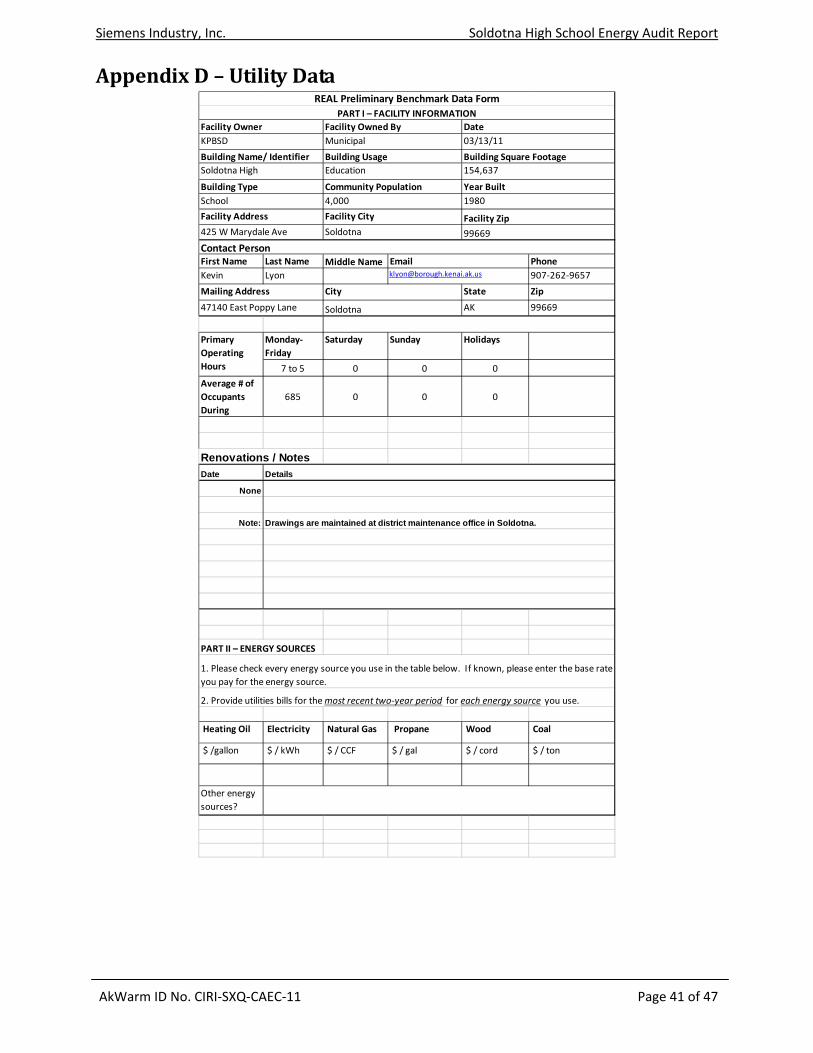
Appendix D – Utility Data
First Name Last Name Middle Name PhoneKevin Lyon 907‐262‐9657
State Zip
AK 99669
Monday‐Friday
Saturday Sunday Holidays
7 to 5 0 0 0
Average # of Occupants During
685 0 0 0
Renovations / NotesDate
None
Note:
PART II – ENERGY SOURCES
Heating Oil Electricity Natural Gas Propane Wood Coal
$ /gallon $ / kWh $ / CCF $ / gal $ / cord $ / ton
Other energy sources?
Primary Operating Hours
Contact Person
City
Soldotna47140 East Poppy Lane
Mailing Address
Details
425 W Marydale Ave Soldotna 99669
Drawings are maintained at district maintenance office in Soldotna.
1. Please check every energy source you use in the table below. If known, please enter the base rate you pay for the energy source.
2. Provide utilities bills for the most recent two‐year period for each energy source you use.
Facility Owned By Date03/13/11Municipal
Facility Zip
4,000 1980
REAL Preliminary Benchmark Data FormPART I – FACILITY INFORMATION
Facility OwnerKPBSD
Building Name/ Identifier Building Usage Building Square Footage
Facility Address
Building TypeSchool
Community Population
Facility City
Soldotna High Education 154,637
Year Built
Siemens Industry, Inc. Soldotna High School Energy Audit Report
AkWarm ID No. CIRI‐SXQ‐CAEC‐11 Page 42 of 47
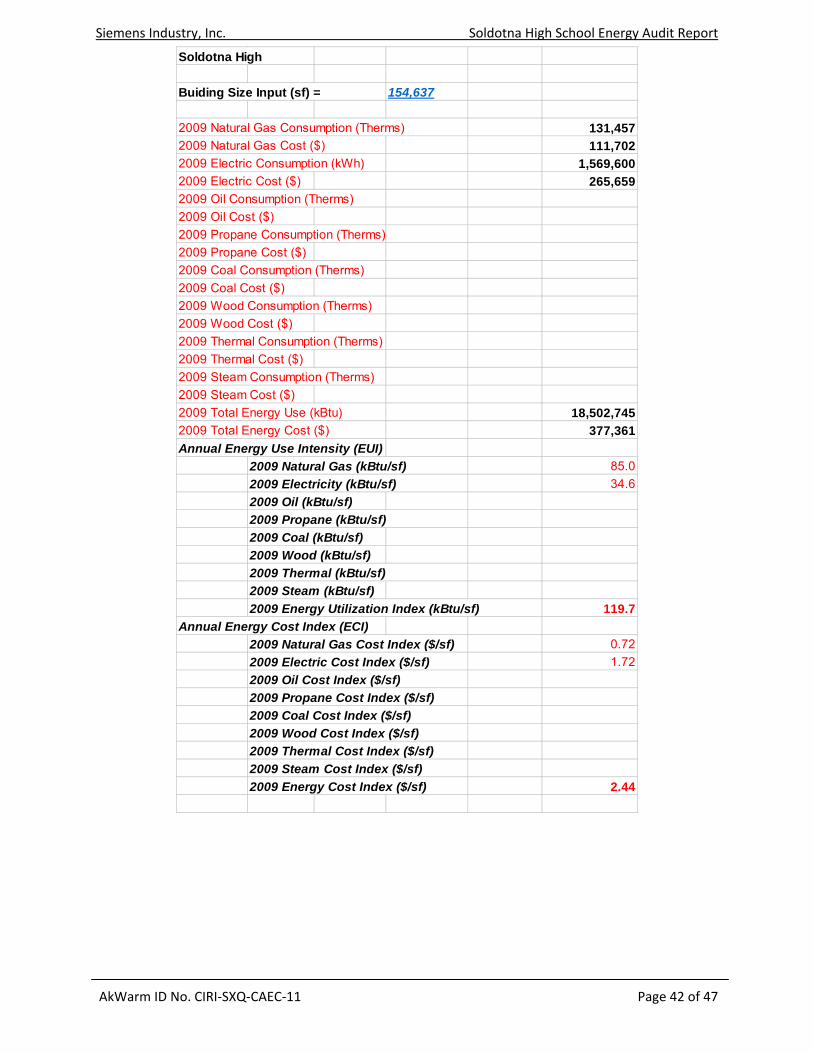
Soldotna High
Buiding Size Input (sf) = 154,637
2009 Natural Gas Consumption (Therms) 131,4572009 Natural Gas Cost ($) 111,7022009 Electric Consumption (kWh) 1,569,6002009 Electric Cost ($) 265,6592009 Oil Consumption (Therms)2009 Oil Cost ($)2009 Propane Consumption (Therms)2009 Propane Cost ($)2009 Coal Consumption (Therms)2009 Coal Cost ($)2009 Wood Consumption (Therms)2009 Wood Cost ($)2009 Thermal Consumption (Therms)2009 Thermal Cost ($)2009 Steam Consumption (Therms)2009 Steam Cost ($)2009 Total Energy Use (kBtu) 18,502,7452009 Total Energy Cost ($) 377,361Annual Energy Use Intensity (EUI)
2009 Natural Gas (kBtu/sf) 85.02009 Electricity (kBtu/sf) 34.62009 Oil (kBtu/sf) 2009 Propane (kBtu/sf) 2009 Coal (kBtu/sf) 2009 Wood (kBtu/sf) 2009 Thermal (kBtu/sf) 2009 Steam (kBtu/sf) 2009 Energy Utilization Index (kBtu/sf) 119.7
Annual Energy Cost Index (ECI)2009 Natural Gas Cost Index ($/sf) 0.722009 Electric Cost Index ($/sf) 1.722009 Oil Cost Index ($/sf)2009 Propane Cost Index ($/sf)2009 Coal Cost Index ($/sf)2009 Wood Cost Index ($/sf)2009 Thermal Cost Index ($/sf)2009 Steam Cost Index ($/sf)2009 Energy Cost Index ($/sf) 2.44

Siemens Industry, Inc. Soldotna High School Energy Audit Report
AkWarm ID No. CIRI‐SXQ‐CAEC‐11 Page 43 of 47
2010 Natural Gas Consumption (Therms) 109,0082010 Natural Gas Cost ($) 100,1042010 Electric Consumption (kWh) 1,402,4402010 Electric Cost ($) 201,7402010 Oil Consumption (Therms)2010 Oil Cost ($)2010 Propane Consumption (Therms)2010 Propane Cost ($)2010 Coal Consumption (Therms)2010 Coal Cost ($)2010 Wood Consumption (Therms)2010 Wood Cost ($)2010 Thermal Consumption (Therms)2010 Thermal Cost ($)2010 Steam Consumption (Therms)2010 Steam Cost ($)2010 Total Energy Use (kBtu) 15,687,3282010 Total Energy Cost ($) 301,844Annual Energy Use Intensity (EUI)
2010 Natural Gas (kBtu/sf) 70.52010 Electricity (kBtu/sf) 31.02010 Oil (kBtu/sf)2010 Propane (kBtu/sf)2010 Coal (kBtu/sf)2010 Wood (kBtu/sf)2010 Thermal (kBtu/sf)2010 Steam (kBtu/sf)2010 Energy Utilization Index (kBtu/sf) 101.4
Annual Energy Cost Index (ECI)2010 Natural Gas Cost Index ($/sf) 0.652010 Electric Cost Index ($/sf) 1.302010 Oil Cost Index ($/sf)2010 Propane Cost Index ($/sf)2010 Coal Cost Index ($/sf)2010 Wood Cost Index ($/sf)2010 Thermal Cost Index ($/sf)2010 Steam Cost Index ($/sf)20010 Energy Cost Index ($/sf) 1.95
Note:1 kWh = 3,413 Btu's1 Therm = 100,000 Btu's1 CF ≈ 1,000 Btu's
Siemens Industry, Inc. Soldotna High School Energy Audit Report
AkWarm ID No. CIRI‐SXQ‐CAEC‐11 Page 44 of 47
Soldotna High
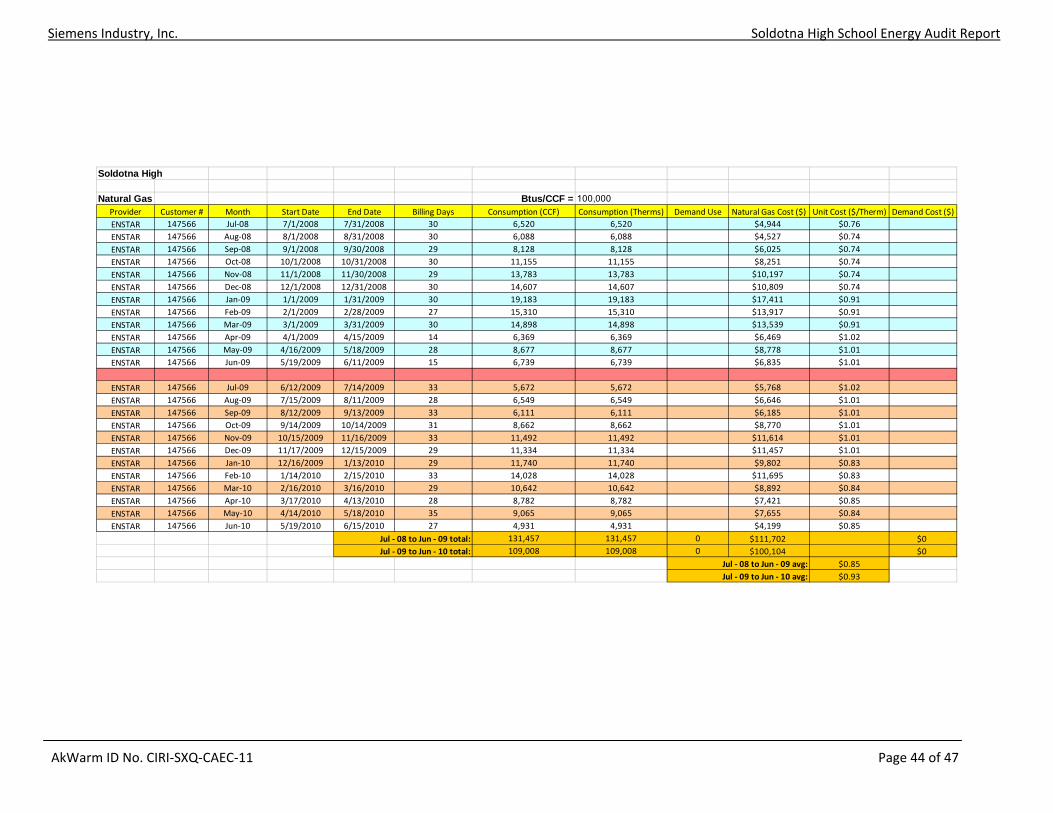
Natural Gas Btus/CCF = 100,000Provider Customer # Month Start Date End Date Billing Days Consumption (CCF) Consumption (Therms) Demand Use Natural Gas Cost ($) Unit Cost ($/Therm) Demand Cost ($)ENSTAR 147566 Jul‐08 7/1/2008 7/31/2008 30 6,520 6,520 $4,944 $0.76ENSTAR 147566 Aug‐08 8/1/2008 8/31/2008 30 6,088 6,088 $4,527 $0.74ENSTAR 147566 Sep‐08 9/1/2008 9/30/2008 29 8,128 8,128 $6,025 $0.74ENSTAR 147566 Oct‐08 10/1/2008 10/31/2008 30 11,155 11,155 $8,251 $0.74ENSTAR 147566 Nov‐08 11/1/2008 11/30/2008 29 13,783 13,783 $10,197 $0.74ENSTAR 147566 Dec‐08 12/1/2008 12/31/2008 30 14,607 14,607 $10,809 $0.74ENSTAR 147566 Jan‐09 1/1/2009 1/31/2009 30 19,183 19,183 $17,411 $0.91ENSTAR 147566 Feb‐09 2/1/2009 2/28/2009 27 15,310 15,310 $13,917 $0.91ENSTAR 147566 Mar‐09 3/1/2009 3/31/2009 30 14,898 14,898 $13,539 $0.91ENSTAR 147566 Apr‐09 4/1/2009 4/15/2009 14 6,369 6,369 $6,469 $1.02ENSTAR 147566 May‐09 4/16/2009 5/18/2009 28 8,677 8,677 $8,778 $1.01ENSTAR 147566 Jun‐09 5/19/2009 6/11/2009 15 6,739 6,739 $6,835 $1.01
ENSTAR 147566 Jul‐09 6/12/2009 7/14/2009 33 5,672 5,672 $5,768 $1.02ENSTAR 147566 Aug‐09 7/15/2009 8/11/2009 28 6,549 6,549 $6,646 $1.01ENSTAR 147566 Sep‐09 8/12/2009 9/13/2009 33 6,111 6,111 $6,185 $1.01ENSTAR 147566 Oct‐09 9/14/2009 10/14/2009 31 8,662 8,662 $8,770 $1.01ENSTAR 147566 Nov‐09 10/15/2009 11/16/2009 33 11,492 11,492 $11,614 $1.01ENSTAR 147566 Dec‐09 11/17/2009 12/15/2009 29 11,334 11,334 $11,457 $1.01ENSTAR 147566 Jan‐10 12/16/2009 1/13/2010 29 11,740 11,740 $9,802 $0.83ENSTAR 147566 Feb‐10 1/14/2010 2/15/2010 33 14,028 14,028 $11,695 $0.83ENSTAR 147566 Mar‐10 2/16/2010 3/16/2010 29 10,642 10,642 $8,892 $0.84ENSTAR 147566 Apr‐10 3/17/2010 4/13/2010 28 8,782 8,782 $7,421 $0.85ENSTAR 147566 May‐10 4/14/2010 5/18/2010 35 9,065 9,065 $7,655 $0.84ENSTAR 147566 Jun‐10 5/19/2010 6/15/2010 27 4,931 4,931 $4,199 $0.85
Jul ‐ 08 to Jun ‐ 09 total: 131,457 131,457 0 $111,702 $0Jul ‐ 09 to Jun ‐ 10 total: 109,008 109,008 0 $100,104 $0
Jul ‐ 08 to Jun ‐ 09 avg: $0.85Jul ‐ 09 to Jun ‐ 10 avg: $0.93

Siemens Industry, Inc. Soldotna High School Energy Audit Report
AkWarm ID No. CIRI‐SXQ‐CAEC‐11 Page 45 of 47
Soldotna High ‐ Natural Gas Consumption (Therms) vs. Natural Gas Cost ($)
0
5,000
10,000
15,000
20,000
25,000
Jul‐08
Aug‐08
Sep‐08
Oct‐08
Nov‐08
Dec‐08
Jan‐09
Feb‐09
Mar‐09
Apr‐09
May‐09
Jun‐09
Jul‐09
Aug‐09
Sep‐09
Oct‐09
Nov‐09
Dec‐09
Jan‐10
Feb‐10
Mar‐10
Apr‐10
May‐10
Jun‐10
Date (Mon ‐ Yr)
Natural Gas Con
sumption (The
rms)
$0
$2,000
$4,000
$6,000
$8,000
$10,000
$12,000
$14,000
$16,000
$18,000
$20,000
Natural Gas Cost ($)
Natural Gas Consumption(Therms)
Natural Gas Cost ($)
Siemens Industry, Inc. Soldotna High School Energy Audit Report
AkWarm ID No. CIRI‐SXQ‐CAEC‐11 Page 46 of 47
Soldotna High
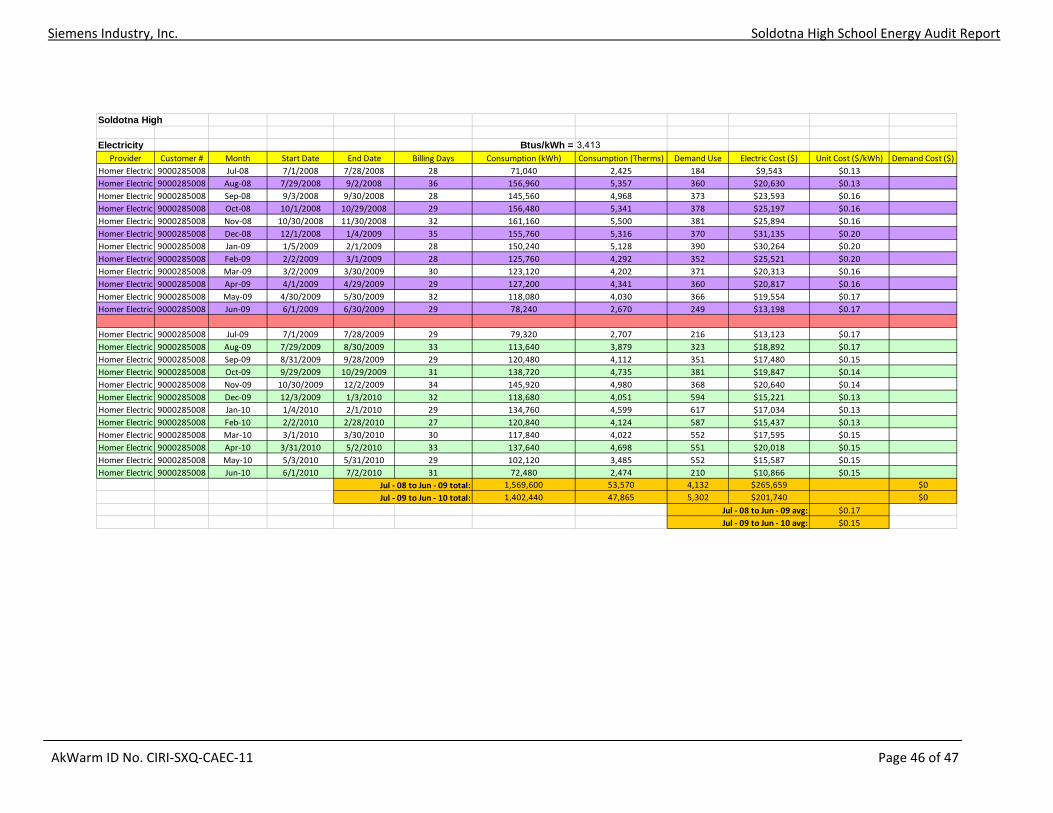
Electricity Btus/kWh = 3,413Provider Customer # Month Start Date End Date Billing Days Consumption (kWh) Consumption (Therms) Demand Use Electric Cost ($) Unit Cost ($/kWh) Demand Cost ($)
Homer Electric 9000285008 Jul‐08 7/1/2008 7/28/2008 28 71,040 2,425 184 $9,543 $0.13Homer Electric 9000285008 Aug‐08 7/29/2008 9/2/2008 36 156,960 5,357 360 $20,630 $0.13Homer Electric 9000285008 Sep‐08 9/3/2008 9/30/2008 28 145,560 4,968 373 $23,593 $0.16Homer Electric 9000285008 Oct‐08 10/1/2008 10/29/2008 29 156,480 5,341 378 $25,197 $0.16Homer Electric 9000285008 Nov‐08 10/30/2008 11/30/2008 32 161,160 5,500 381 $25,894 $0.16Homer Electric 9000285008 Dec‐08 12/1/2008 1/4/2009 35 155,760 5,316 370 $31,135 $0.20Homer Electric 9000285008 Jan‐09 1/5/2009 2/1/2009 28 150,240 5,128 390 $30,264 $0.20Homer Electric 9000285008 Feb‐09 2/2/2009 3/1/2009 28 125,760 4,292 352 $25,521 $0.20Homer Electric 9000285008 Mar‐09 3/2/2009 3/30/2009 30 123,120 4,202 371 $20,313 $0.16Homer Electric 9000285008 Apr‐09 4/1/2009 4/29/2009 29 127,200 4,341 360 $20,817 $0.16Homer Electric 9000285008 May‐09 4/30/2009 5/30/2009 32 118,080 4,030 366 $19,554 $0.17Homer Electric 9000285008 Jun‐09 6/1/2009 6/30/2009 29 78,240 2,670 249 $13,198 $0.17
Homer Electric 9000285008 Jul‐09 7/1/2009 7/28/2009 29 79,320 2,707 216 $13,123 $0.17Homer Electric 9000285008 Aug‐09 7/29/2009 8/30/2009 33 113,640 3,879 323 $18,892 $0.17Homer Electric 9000285008 Sep‐09 8/31/2009 9/28/2009 29 120,480 4,112 351 $17,480 $0.15Homer Electric 9000285008 Oct‐09 9/29/2009 10/29/2009 31 138,720 4,735 381 $19,847 $0.14Homer Electric 9000285008 Nov‐09 10/30/2009 12/2/2009 34 145,920 4,980 368 $20,640 $0.14Homer Electric 9000285008 Dec‐09 12/3/2009 1/3/2010 32 118,680 4,051 594 $15,221 $0.13Homer Electric 9000285008 Jan‐10 1/4/2010 2/1/2010 29 134,760 4,599 617 $17,034 $0.13Homer Electric 9000285008 Feb‐10 2/2/2010 2/28/2010 27 120,840 4,124 587 $15,437 $0.13Homer Electric 9000285008 Mar‐10 3/1/2010 3/30/2010 30 117,840 4,022 552 $17,595 $0.15Homer Electric 9000285008 Apr‐10 3/31/2010 5/2/2010 33 137,640 4,698 551 $20,018 $0.15Homer Electric 9000285008 May‐10 5/3/2010 5/31/2010 29 102,120 3,485 552 $15,587 $0.15Homer Electric 9000285008 Jun‐10 6/1/2010 7/2/2010 31 72,480 2,474 210 $10,866 $0.15
Jul ‐ 08 to Jun ‐ 09 total: 1,569,600 53,570 4,132 $265,659 $0Jul ‐ 09 to Jun ‐ 10 total: 1,402,440 47,865 5,302 $201,740 $0
Jul ‐ 08 to Jun ‐ 09 avg: $0.17Jul ‐ 09 to Jun ‐ 10 avg: $0.15

Siemens Industry, Inc. Soldotna High School Energy Audit Report
AkWarm ID No. CIRI‐SXQ‐CAEC‐11 Page 47 of 47
Soldotna High ‐ Electric Consumption (kWh) vs. Electric Cost ($)
0
20,000
40,000
60,000
80,000
100,000
120,000
140,000
160,000
180,000
Jul‐08
Aug‐08
Sep‐08
Oct‐08
Nov‐08
Dec‐08
Jan‐09
Feb‐09
Mar‐09
Apr‐09
May‐09
Jun‐09
Jul‐09
Aug‐09
Sep‐09
Oct‐09
Nov‐09
Dec‐09
Jan‐10
Feb‐10
Mar‐10
Apr‐10
May‐10
Jun‐10
Date (Mon ‐ Yr)
Electric Con
sumption (kWh)
$0
$5,000
$10,000
$15,000
$20,000
$25,000
$30,000
$35,000
Electric Cost ($)
Electric Consumption (kWh)
Electric Cost ($)