solar shading for low energy use and daylight quality … · solar shading for low energy use and...
TRANSCRIPT

XXX
1
Solar Shadingfor Low Energy Use and
Daylight Quality in Offices
Simulations, Measurements and Design Tools
Marie-Claude Dubois

Solar Shading for Low Energy Use and Daylight Quality in Offices
2
Keywords
Shading devices, solar protection, energy use, daylighting, visualcomfort, cooling, heating, solar-protective glass, computersimulations, measurements, design tools, awnings, venetianblinds, screens
© copyright Department of Construction and Architecture, Division of Energy and BuildingDesign. Lund University, Lund Institute of Technology, Lund 2001.Layout: Hans Follin, LTH, LundCover Illustration: Artville, Getty Images
Printed by KFS AB, Lund 2001
Report No TABK--01/1023Solar Shading for Low Energy Use and Daylight Quality in Offices. Simulations, Measurementsand Design Tools.Department of Construction and Architecture, Lund University, Lund
ISSN 1103-4467ISRN LUTADL/TABK--1023-SE
Lund University, Lund Institute of TechnologyDepartment of Construction and Architecture Telephone: +46 46 - 222 73 52P.O. Box 118 Telefax: +46 46 - 222 47 19SE-221 00 LUND E-mail: [email protected] Home page: www.byggark.lth.se
Research project home page: http://www.byggark.lth.se/shade/shade_home.htm

Contents
3
Contents
Keywords 2
Contents 3
Acknowledgements 5
Foreword 7
1 Introduction 11
2 Literature review 13
2.1 Thermal and optical properties 132.2 Impact on energy use 152.3 Calculation methods 16
3 Impact of shading devices on energy use 19
3.1 Impact of solar-protective glass on energy use 193.2 Impact of an awning on energy use 21
4 Design tools 23
4.1 Chart showing the solar angle-dependent properties of the window 234.2 Ideal total solar transmittance 244.3 Computer program ParaSol 25
5 Impact of shading devices on daylight quality 27
5.1 Measurements in experimental office rooms 275.2 Simulations with Radiance 295.3 Overall performance 32
6 Discussion and conclusions 35
6.1 Future research 37
References 39
Article I 43A Method to Define Shading Devices Considering the Ideal Total SolarEnergy Transmittance
Article II 53A Simple Chart to Design Shading Devices Considering the WindowSolar Angle Dependent Properties

Solar Shading for Low Energy Use and Daylight Quality in Offices
4
Article III 65The Design of Seasonal Awnings for Low Cooling and Heating Loadsin Offices
Article IV 75Awnings and Solar-protective Glazing for Efficient Energy Use in ColdClimates
Article V 83Parasol-LTH: A User-friendly Computer Tool to Predict the EnergyPerformance of Shading Devices

Acknowledgements
5
Acknowledgements
This thesis was carried out with the financial support of the NaturalSciences and Engineering Research Council of Canada (NSERC), the“Fonds pour la formation des chercheurs et l’aide à la recherche (FCAR,Québec)” and the Social Sciences and Humanities Research Council ofCanada (SSHRC). The Swedish National Energy Administration (StatensEnergimyndighet) and the Swedish Research Council for Environment,Agricultural Sciences and Spatial Planning (FORMAS: Forskningsrådetför miljö, areella näringar och samhällsbyggande) also provided substantialfunding during the last two years of my PhD project. I express my gratitudeto these councils for supporting my research.
This thesis forms a part of a larger research project on solar shadingdevices that was initiated at Lund University in 1997. I am grateful to allthe researchers involved in this project with whom I just completed fiveyears of interesting and stimulating work. I am especially grateful to mysupervisor, Maria Wall, for being so interested in our projects and forkeeping a positive attitude all along despite tremendous work loads. Ialso thank my second supervisor, Björn Karlsson for not letting me giveup, and my colleagues Helena Bülow-Hübe and Petter Wallentén for allthe discussions we’ve had, for all your help with Swedish customs andfriendship, and for reviewing many of my papers over the years. Finally,I thank Hans Follin, for his extreme patience while designing the layoutof all my reports, and Gunilla Kellgren for assistance with administrativematters and for constantly “stretching the money” and making it possiblefor me to complete my studies in Sweden.
Outside the Department, I must thank Joakim Karlsson from UppsalaUniversity, who contributed to many papers by measuring and discuss-ing solar angle dependent properties, Greg Ward, who provided tremen-dous support while working with Radiance, and people at the DanishBuilding and Urban Research Institute, especially, Steen Traberg-Borup,Jens Christoffersen and Kjeld Johnsen for their help with the measure-ments.

Solar Shading for Low Energy Use and Daylight Quality in Offices
6
Finally, I couldn’t close this thesis without mentioning the moral sup-port I’ve had over the years from my family in Canada, Holland andNorway and from all my good friends in Sweden. Special thanks to myparents for putting up with my long absence from home, and to myfriend Olivia for help with the English in many parts of this thesis andfor all the good moments spent together in Sweden.
Last but not least, I thank my husband, Andreas, for his true interestin my work, for his participation on all photographic related matters, forproviding the cover illustration of this report and for his constant andsolid support during the last three years.

Foreword
7
Foreword
This thesis includes the publications listed below:
Reports[I] Dubois, M.-C. (2001). Impact of Solar Shading Devices on Daylight
Quality: Measurements in Experimental Office Rooms. Report TABK--01/3061. Lund University, Dept. of Construction andArchitecture, Div. of Energy and Building Design. Lund (Sweden).
[II] Dubois, M.-C. (2001). Impact of Solar Shading Devices on Day-light Quality in Offices: Simulations with Radiance. Report TABK--01/3062. Lund University, Dept. of Construction and Architec-ture, Div. of Energy and Building Design. Lund (Sweden).
[III] Dubois, M.-C. (1998). Solar Protective Glazing for Cold Climates:A Parametric Study of Energy Use in Offices. Report TABK--98/3053. Lund University, Dept. of Building Science. Lund (Sweden).134 pages.
[IV] Dubois, M.-C. (1997). Solar Shading and Building Energy Use: ALiterature Review. Part I. Report TABK--97/3049. Lund University,Dept. of Building Science. Lund (Sweden). 118 pages.
Articles
[I] Dubois, M.-C. (2000). A Method to Define Shading Devices Con-sidering the Ideal Total Solar Energy Transmittance. Proc. of theEurosun 2000 Conference, June 19-22, Copenhagen (Denmark).(proceedings on CD-rom).
[II] Dubois, M.-C. (2000). A Simple Chart to Design Shading De-vices Considering the Window’s Solar Angle Dependent Proper-ties. Proc. of the Eurosun 2000 Conference, June 19-22, Copenha-gen (Denmark). (proceedings on CD-rom).

Solar Shading for Low Energy Use and Daylight Quality in Offices
8
[III] Dubois, M.-C. (1999). The Design of Seasonal Awnings for LowCooling and Heating Loads in Offices. Proc. of the 5th Symposiumon Building Physics in the Nordic Countries, August 24-26, Göteborg(Sweden). Vol. 2. Chalmers University of Technology, Göteborg.pp. 505-512.
[IV] Dubois, M.-C. (1998). Awnings and Solar-Protective Glazing forEfficient Energy Use in Cold Climates. Proc. of the InternationalConference on Renewable Energy Technologies in Cold Climates ’98,May 4-6, Montreal (Canada). Solar Energy Society of Canada Inc.Ottawa. pp. 380-385.
[V] Wallentén P., Kvist H. & Dubois, M.-C. (2000). ParaSol-LTH: AUser-friendly Computer Tool to Predict the Energy Performanceof Shading Devices. Proc. of the International Building Physics Con-ference, September 18-21, Eindhoven (The Netherlands). pp. 331-338.
This report contains a short summary of each publication listed aboveand a general discussion and conclusions. The conference articles includedin this thesis are presented in the Appendix.

Foreword
9
“And now in houses with a south aspect, thesun rays penetrate into the porticoes in winter,but in summer the path of the sun is right overour heads and above the roof, so that there isshade, if then, this is the best arrangement, weshould build the south side loftier to get thewinter sun and the north side lower to keepout the cold winds”
Socrates in Xenophon (c.430 to c.354 BC).Memorabilia. III. VIII.9-IX.

Solar Shading for Low Energy Use and Daylight Quality in Offices
10

Introduction
11
1 Introduction
Solar shading is a concern that has preoccupied human minds for a longperiod of time, aptly captured in Socrates’ citation. This concern has,however, never been so topical as it is at present as it pertains officebuildings, since many countries are faced with the necessity to reducetheir national energy consumption while the use of electrical appliancesand computers is constantly increasing. The necessity to reduce energyuse is further challenged by an international architectural trend that pro-motes the use of large glass facades. Large glass facades generate overheat-ing problems by creating a greenhouse effect and, in most situations,contribute to an increase in the cooling demand. Large glass facades arefurthermore liable to yield visual problems−direct and reflected glare thatis already exacerbated by the increasing use of computers in the modernoffice.
Solar shading is thus a necessity in office buildings, especially in of-fices with large glazing areas. Shading must therefore be carefully incor-porated and planned at an early stage in the design process. Notwith-standing, the designer must take both the energy use (heating, coolingand lighting) and the visual comfort aspect into consideration during thedesign.
This thesis contributes to research in the field through investigationsof the impact of solar shading devices on energy use and on daylightquality in office buildings. It forms a part of a larger research project onsolar shading devices (Solar Shading Project, see Wall & Bülow-Hübe,2001), that was initiated at Lund University in 1997. The Solar ShadingProject, which has involved eight researchers since its initiation, is still inprogress at the time of completing this thesis.
The research work presented in this thesis was mainly carried out be-tween September 1996 and September 2001. The work presented in thisthesis consists of four main parts:

Solar Shading for Low Energy Use and Daylight Quality in Offices
12
1. A literature review (state-of-the-art) of the research about solar shad-ing devices (Dubois, 1997);
2. Parametric studies of energy use for cooling/heating an office roomwith shading devices or solar-protective (tinted, reflective) glazing(Dubois, 1999, 1998a, 1998b);
3. The development of tools to define shading devices at an early andintermediate design stage (Dubois, 2000a, 2000b; Wallentén, Kvist& Dubois, 2000);
4. Studies of the impact of shading devices on daylight quality inoffice rooms (Dubois, 2001a, 2001b).
The following sections summarise briefly the main findings of each part.

Literature review
13
2 Literature review
At the beginning of the Solar Shading Project in 1997, it appeared neces-sary to review the literature about solar shading in order to get a clearunderstanding of the state-of-the-art knowledge in the field and orien-tate our research work towards the areas which had not been covered inthe past. A part of this literature review was reported in Dubois (1997).This review revealed that research on solar shading had been mainly fo-cused on three main issues:
1. the thermal and solar-optical properties of shading devices;2. the impact of shading devices on energy use for cooling, heating
and lighting buildings;3. the calculation methods to predict the impact of shading devices
on energy use.
2.1 Thermal and optical properties
Thermal propertiesThe literature review indicated that a large number of studies have beenperformed so far to determine the thermal properties (i.e. the impact onthe window U-value) of many types of shading devices. These studieshave shown that shading devices affect the heat losses through windowsin a significant manner. For example, it was shown that venetian blinds,draperies and roller shades inside single-pane, clear glass windows, re-duce heat losses by 25 to 40 % and that metallic coated shades mayfurther reduce heat losses by 45 to 58 % depending on the material andmounting method used.
The results of these studies generally show that the thermal resistanceof the window-shade assembly can be greatly improved if:

Solar Shading for Low Energy Use and Daylight Quality in Offices
14
• the shading device traps an air layer next to the window (edges aresealed);
• airtight fabrics are used;• the shading device is close to the window pane;• low-emissivity and light-coloured backings are used;• multiple layers are used and the distance between the layers is small.
The reductions reported in the literature review are quite impressive.However, most studies were carried out with ordinary, single-pane clearglass windows, which explains why the relative heat loss reduction ap-pears so high. Few studies have been carried out with double-pane glaz-ing and no studies with triple-pane or special (low-e) coated glazing havebeen reported in the literature review. The determination of the relativeimprovement in the window U-value for triple-pane assemblies and spe-cial (low-e) coated glazing has been identified as an area of future re-search.
Solar-optical propertiesA few studies about the solar-optical properties of shading devices werereported but the review suggests that work about thermal properties hasbeen more abundant. The review shows that prismatic panes, interiorvenetian blinds, net and light curtains, and exterior vegetal sunscreenhave been studied and thus have a characterised solar transmittance. Thereview further indicates that it is generally acknowledged that exteriordevices are more effective (by about 35 %) than interior devices sinceexterior devices block solar radiation before it comes into contact withthe building and a large part of the radiation absorbed in the exteriordevice is reflected and convected to the outdoor air. Light-coloured shadesare also more effective (by 20-40 %) than dark-coloured ones, accordingto the literature1 .
The review thus suggests that much work remains to determine thesolar transmittance (reflectance and absorptance) of many shading de-vices. Especially, much research is needed to obtain the total solar trans-mittance (i.e. including secondary heat transmission effects), and the so-lar angle-dependent values, since most studies only provided the solartransmittance for normal incidence.
1. Measurements carried out within the Solar Shading Project at Lund University,later showed that this is not necessarily true. For example, light-coloured translucentfabric awnings were found to have a higher g value (higher total solar transmittance)than identical awnings made of a similar fabric in a dark blue colour (see Wall & Bülow-Hübe, 2001).

Literature review
15
Tremendous progress has been made in this area since the literaturereview was achieved in 1997. The total solar transmittance (g value) ofmany exterior shading devices and devices between panes has been deter-mined within the Solar Shading Project at Lund University. This wasachieved through outdoor measurements in twin hot boxes exposed tothe natural climate and, more recently, through measurements in a solarsimulator (see Wallentén & Wall, 1999; Wall & Bülow-Hübe, 2001 andthe website of the Solar Shading Project, 2001). Moreover, measurementsto determine the g value of many interior shading devices are presently inprogress at Lund University and a standard procedure for carrying outthese measurements is being developed.
2.2 Impact on energy useThe literature review showed that there are abundant studies about theimpact of shading devices on energy use, with the first work on the sub-ject reported as early as 1940. Research in this area first focused on theimpact of shading devices on the cooling loads. As expected, all the stud-ies showed that shading reduces the cooling load of buildings (by 23-89%), with the highest savings obtained with devices with a low shadingcoefficient (i.e. low solar transmittance).
As time developed, experts noticed that shading devices may have anegative impact on heating loads since they reduce the useful solar gainsduring the winter. It was shown by many studies that, in heating-domi-nated climates, the most energy efficient shading strategy consisted ofusing shading devices with a high shading coefficient (high solar trans-mittance) because they allow some passive solar utilisation during thewinter. Note, however, that this is only true for fixed shading devices andthat the optimal alternative in heating-dominated climates is to use mov-able shading devices (with a low shading coefficient), which can be re-moved when free solar heat gains are available and useful. Many studiesalso showed that shading devices which reduce the heat losses throughthe window provide substantial additional energy savings in heating-domi-nated climates.
Since the middle of the 1980s, consideration has also been given tothe impact of shading devices on daylighting and on the energy use forartificial lighting. Many investigations have shown that energy use forlights is an important part of the total energy use, especially in officebuildings. Artificial lighting also produces additional internal heat gains,which must be removed through mechanical ventilation and cooling.

Solar Shading for Low Energy Use and Daylight Quality in Offices
16
Daylight utilisation (instead of using artificial lights) thus has two ad-vantages: it reduces the direct consumption of electricity for lights andindirectly reduces the cooling demand through a reduction of the inter-nal heat load from lights. All the studies reported but one showed thatdaylight utilisation may reduce the total energy use and that increasingthe window-to-wall area ratio results in overall energy savings in build-ings with daylight utilisation. The potential for overall energy saving seemsto depend on the climate.
The literature review indicated that many studies of the impact ofshading devices on energy use for cooling and heating, and even lighting,have been performed so far. However, most of these studies were carriedout using computer simulations with relatively simple algorithms usingshading coefficients for the normal incidence or steady-state calculations.Moreover, most studies have only considered fixed shading devices andfew studies have taken into consideration the daylighting/lighting aspect.The review thus suggested that future research in the field should includemovable shading devices and impacts on daylight utilisation while en-ergy simulation programs should be further developed (to include e.g.solar-angle dependent effects, impact on diffuse radiation, secondary heattransmission effects) and validated experimentally.
2.3 Calculation methodsThe literature review indicated that many computer programs have beendeveloped so far to calculate the impact of a shading device on the shad-ing pattern on the building or to determine the optimum shape of ashading device to shade the entire window area. These programs are mainlybased on geometrical considerations and are not designed for the predic-tion or minimisation of energy use in buildings.
A few advanced algorithms that predict the impact of shading devices(venetian blinds, vertical planar shades, awnings) on solar gains have beenreported. This review indicated that work remains in this area to:
• include solar-angle dependent effects for all types of shading de-vices;
• include the effect of the shading device on diffuse radiation;• include secondary heat transmission effects;• validate the computer models against experimental data;• connect these advanced shading algorithms to whole building en-
ergy simulation programs.

Literature review
17
The Solar Shading Project at Lund University allowed major progress inthis area. Advanced algorithms for windows and shading devices of arbi-trary shape have been developed in the course of this project and imple-mented in the dynamic , whole building energy simulation program Derob-LTH (see Källblad, 1998). These models have also been validated againstexperimental data (Wallentén & Wall, 1999; Wall & Bülow-Hübe, 2001).The work which remains to be done within this area is summarised bythe following points:
• Develop programs that calculate the impact of shading devices ondaylighting and allow the prediction of the impact of heating, cool-ing and lighting in an interactive way;
• Develop computer models allowing the modelling of movable shad-ing devices;
• Validate these programs with more global experimental data (i.e.including energy use of a whole building).
Note that some work to include daylighting in the energy simulationprogram Derob-LTH has been initiated by Bülow-Hübe and Källblad (inBülow-Hübe, 2001). This work needs to be further developed to allowmodelling of movable shading devices and it must be validated againstexperimental data.

Solar Shading for Low Energy Use and Daylight Quality in Offices
18

Impact of shading devices on energy use
19
3 Impact of shading deviceson energy use
Two studies about the impact of solar shading on energy use were carriedout. The first study (Dubois, 1998a, 1998b) investigated the impact ofsolar-protective (reflecting, absorbing) glazing on energy use, peak loadsand indoor temperatures in a standard office room while the second study(Dubois, 1999) examined the impact of a seasonal awning on energy usein a south-oriented office room located in Stockholm.
3.1 Impact of solar-protective glass onenergy use
In this study (Dubois, 1998a, 1998b), the annual energy use for coolingand heating a standard, rectangular office room was studied for varioustypes of solar-protective glazing assemblies, various orientations (N, NE,E, SE, S, SW, W, NW), glazing-to-wall area ratios (GWAR = 0, 10, 20,30, 50, 70 %) and climates (Lund, Stockholm, Luleå, Oslo, Montreal).The aim of this study was to identify the glazing properties (solar trans-mittance) which resulted in a low annual energy use. The effect of theglazing U-value on thermal losses was thus artificially controlled by in-creasing or reducing the insulation thickness in the opaque wall surround-ing the window. This permitted isolation of the energy effects of interesti.e. the impact of the glazing solar transmittance on energy use.
The glazing assemblies studied included :
A. a double-pane window with a bronze reflecting glass (g value = 0.14)B. a double-pane window with a blue reflecting glass (g value = 0.27)C. a triple-pane window with a silver reflecting glass (g value = 0.38)D. a triple-pane window with a blue absorbing glass (g value = 0.41)E. a double-pane window with a blue absorbing glass (g value = 0.48)F. a triple-pane window with two low-emissivity coatings (g value = 0.58)G. a triple-pane, clear glass window (g value = 0.65)H. a double-pane, clear glass window (g-value = 0.74).

Solar Shading for Low Energy Use and Daylight Quality in Offices
20
The study was carried out through computer simulations using the dy-namic energy program Derob-LTH (Källblad, 1998; Kvist, 1997). Theprogram Window-4.1 (LBL, 1994) was also used to calculate the solarangle-dependent optical properties of the glazing and steady-state (manual)calculations were used to determine the insulation thickness around thewindow, which made it possible to maintain a constant U-value (thermallosses) for all the cases.
The study showed that the optimum glazing transmittance (g value)and glazing-to-wall area ratio (GWAR) were orientation- and climate-dependent. With a GWAR of 30 %, south and north oriented rooms hada lower annual energy use with clear and low-e coated glazing assemblies(F, G, H above). For east and west orientations, glazing assemblies withan average transmittance (C, D, E) yielded a lower annual energy use.Similarly, the study showed that larger glazing areas were preferable onsouth and north than on east and west facades2 .
On the south facade, there is a larger potential for passive solar utilisa-tion in the winter. Increases in the cooling demand due to increases inthe glazing transmittance or area are easily offset by the large reductionsin heating provided by useful solar heat gains during the winter. On theeast and west facades, the increase in cooling due to higher glazing trans-mittance or larger glazing areas is not offset by reductions in the heatingdemand, since there is not enough solar radiation on these facades duringthe winter. On the north facade, glazing assemblies with high transmit-tance or larger glazing areas performed better because they produced arelatively small increase in cooling compared with the reduction in heat-ing load provided in the winter by the diffuse sky radiation.
The study also showed that in cold sunny cities like Montreal andLuleå, glazing assemblies with a higher solar transmittance or larger glaz-ing areas resulted in lower annual energy use compared with more tem-perate and cloudy cities like Lund, Stockholm and Oslo. This occurredbecause there is a larger potential for passive solar utilisation during thewinter in cities with a cold and sunny winter. Note that this conclusionis, again, only valid if larger glazing areas are compensated for by an in-crease in the insulation of the opaque parts of the building envelope.
2. Note, however, that this is only true on condition that constant total heat lossesamong all the cases studied (small and large window areas) prevail. It is possible toachieve this in reality by increasing the insulation thickness in the wall surrounding thewindow, to compensate for the extra heat losses due to the increase in window area. Thisis what is normally done with a performance based building code, as e. g. the SwedishBuilding Code (Boverket, 1999).

Impact of shading devices on energy use
21
This study generally showed that solar-protective glazing may be anenergy-efficient solution only on the east and west facades, where thepotential for passive solar utilisation in the winter is relatively low incomparison with the south facade. However, the annual energy use inthis study was simply calculated as the sum of space loads for cooling andheating. No account was taken of the relative performance of heating andcooling systems or the costs of heating versus cooling. In a scenario wherecooling is more expensive or less efficient than heating, we may find thatit is more economical to use tinted or reflective glass on all facades.
Subsequently, it was shown that the potential for energy savings ismuch greater if a simple movable awning is used in combination withclear glazing as shown in Dubois (1998b). In this case, the cooling de-mand obtained is approximately the same as the one obtained with thelow transmittance glazing (A) and the heating demand is the same as thatobtained with clear glazing. This solution is thus optimum, no matterwhat weight is attributed to heating and cooling demands in the calcula-tion of the total energy use. The real potential for energy savings mayeven be much higher than what is shown in Dubois (1998b) since thepotential for daylight utilisation is greater with clear glazing than withsolar-protective glazing.
3.2 Impact of an awning on energy useAnother parametric study (Dubois, 1999) was carried out to investigatethe impact of a seasonal awning’s colour, geometry (length, width, slope)and seasonal management strategy on energy use for heating and coolingthe same office room. In this case, the office room had a glazing-to-wallarea ratio (GWAR) of 30 %; it was oriented towards the south directionand located in Stockholm (Sweden). This study was also carried outthrough computer simulations using the program Derob-LTH. Only sea-sonal awnings were tested in this case.
This study showed that large energy savings (around 12 kWh/m2yr)could be obtained by using a simple seasonal awning but that equivalentadditional energy use (around 11 kWh/m2yr ) may result if the awningremained in the window year-round (fixed awning). This demonstratedthe necessity to remove shading devices during the heating season. Thestudy also showed that it is essential that the awning’s length be sufficientso that the entire window area is shaded when the sun is facing the win-dow. This parameter had a significant impact on cooling loads.

Solar Shading for Low Energy Use and Daylight Quality in Offices
22
The study further showed that a variation of the awning’s colour hada moderate effect on the cooling demand (± 2.5 kWh/m2yr) and it wasfound that light-coloured fabrics resulted in higher cooling loads thandark-coloured ones. This is due to the fact that the light-coloured fabricsin the study had a higher transmittance (g value) and this property wasdominant. Note that most of the time, light-coloured fabrics have a highertransmittance than dark-coloured ones and it is thus an oversimplifica-tion to say that shading devices should have light colours. In this case weshowed that the awning with dark colours reduced cooling loads moredramatically.
The study also showed that the awning’s width had a negligible im-pact on cooling loads, as long as the awning overlapped the window by atleast 30 cm on each side. Negligible additional energy savings were ob-tained with wider awnings. This is due to the fact that the solar raysleaking on the sides of the awning are insignificant with respect to annualcooling loads since both the incident and transmitted radiation are dra-matically reduced as the angle between the sun and the normal to thewindow increases. This study thus showed that it may not be necessary toproduce very large awnings or awnings with sides. In fact the diffuseradiation leaking on the sides of the awning may provide beneficial dif-fuse daylighting during the day.
Finally, a variation of the awning’s slope−keeping the shading patternon the window constant−showed that this parameter had a negligibleimpact on energy use. The main effect observed in this study was prob-ably due to a change in the shading of the diffuse sky (due to a change inthe awning’s size).

Design tools
23
4 Design tools
While carrying out the parametric studies described in the previous sec-tions, we realised that parametric studies were very time-consuming be-cause so many variations had to be modelled and studied before the mostenergy-efficient solution was identified. For example, in the study aboutseasonal awnings (Dubois, 1999), 31 simulations had to be performedbefore the optimum solution was reached. This is unrealistic, especially ifwe consider that solar shading is only one aspect to consider in the designof a whole building.
The reason why so many simulations had to be made was that theinformation available at the beginning of the study was not detailedenough. Using traditional design tools, e.g. sunpath diagrams, providedinformation about solar angles and incident solar radiation but failed toprovide detailed information about specific energy needs in the buildingand the transmitted solar radiation according to specific times. Based onthis experience, simple design tools were devised and proposed.
The first design tool (Dubois, 2000b) is a simple chart which providessome information about the solar angle dependent transmittance of thewindow as a function of solar position (sunpath). The second tool (Dubois,2000a) consists of a few mathematical formulas which allow determina-tion of the ideal (optimum) g value of the shading device based on theinformation provided by a single energy simulation with the bare win-dow. Finally, a third tool, which is a simplified interface to the programDerob-LTH, was developed (Wallentén, Kvist & Dubois, 2000).
4.1 Chart showing the solar angle-dependent properties of the window
Traditional design tools like sunpath diagrams and shading masks pro-posed by e.g. Olgyay & Olgyay (1957) and Mazria (1979) are useful todetermine the period when the window receives solar radiation and theappropriate shading mask to prevent insolation during this period. How-
Solar Shading for Low Energy Use and Daylight Quality in Offices
24
ever, one limitation of these tools is that they only consider the solarradiation incident on the window and fail to indicate the amount of ra-diation transmitted through the window. Since the intensity of both theincident and transmitted solar beam varies as a function of the incidenceangle of the sun with respect to the window, it is obvious that informa-tion about the total transmitted radiation should be provided, even at anearly design stage.
An overlay showing the relationship between the sunpath and the win-dow angular properties (solar transmittance) was developed and presentedin Dubois (2000b). Once superposed on a sunpath diagram, this overlayshows the solar time for which the window g value (total solar transmit-tance) is the highest and the corresponding solar radiation at that time.This allows identification of the critical insolation periods on the win-dow.
A design example was presented and it was shown that the new overlayallows identification of the optimum shading solution more preciselythan the traditional methods. The chart is thus useful at an early designstage to identify the optimum shading masks rapidly, which avoids manyiterations in the computer simulations performed at a later design stagein the design process.
4.2 Ideal total solar transmittanceThis second design method was devised after it was observed that theideal (i.e. yielding the lowest energy use) g value (gi) of a shading device isa function of the total solar heat gains for each hour and the cooling loadfor that hour in the room. If the cooling loads are larger than the totalsolar contribution (total solar gains), then all solar radiation should beeliminated to yield the lowest cooling load and gi is thus 0 %. On theother hand, if the cooling load is smaller than the solar contribution, itmeans that a part of the solar gains are being used in the building tooffset losses through the envelope. This occurs in the spring and autumnwhen the intensity of solar radiation is high and the outdoor temperatureis low. In this case, gi is that proportion of the total solar gains which isutilised in the building (see Dubois, 2000a). Finally, if there are no cool-ing loads or no solar gains, gi is 100 % since no shading is required.
The ideal g value gi thus varies constantly over the year and day and itcan be calculated for each hour of the year using the hourly values ofcooling load and solar gains obtained through a single energy simulationfor a year, for the bare window case. Average gi values can then be calcu-

Design tools
25
lated from the hourly values by using weighted averages as shown in Dubois(2000a). This makes it possible to identify the monthly and annual givalues which yield the lowest energy use in the building. In the case ofsimple shading devices like screens, these average gi values indicate theoptimum screen transmittance. For more complex shading devices likeawnings, the average gi values can be used to estimate the portion of thewindow which must be shaded during each month, and the geometry ofthe shading device providing this shading pattern can be deduced.
4.3 Computer program ParaSolAdvanced energy simulation programs like Derob-LTH allow a detailedanalysis of energy use as a function of shading alternative. The advantageof such programs is that the complex energy interactions between theshading device and the window (e.g. secondary heat transmission effects),the shading of the diffuse radiation and the solar-angle dependent prop-erties are taken into consideration in the calculation in a dynamic way(hour by hour). However, this type of computer program is far too spe-cialised and complex for many groups of professionals involved in thedesign process and simpler design tools are needed.
A simple, user-friendly interface to Derob-LTH called ParaSol was thusdeveloped within the Solar Shading Project at Lund University (seeWallentén, Kvist & Dubois, 2000). ParaSol is a Windows 95/98/NT pro-gram written in Visual Basics. The main advantage of this program overthe original calculation engine (Derob-LTH) is that both the input andoutput are greatly simplified. The input is made through a series of dialogboxes where the size of the room to analyse, the window geometry andwindow type, the building materials, the type of shading device and ge-ometry are defined in a simple way. Once the input dialog boxes havebeen filled, the input data is “sent” to Derob-LTH to perform either a“simple” or “detailed” calculation. The simple calculation returns themonthly average and minimum “g” or “t” (for primary transmittance)values while the detailed calculation returns energy totals in the form ofmonthly and annual cooling and heating demands and peaks loads withand without the shading device as well as diagrams showing the frequencyof overheating temperatures, etc. ParaSol can be used at a more advanceddesign stage to verify the hypotheses made at an earlier design stage usingsimpler tools like the ones proposed in Dubois (2000a, 2000b).

Solar Shading for Low Energy Use and Daylight Quality in Offices
26

Impact of shading devices on daylighting quality
27
5 Impact of shading deviceson daylight quality
The impact of shading devices on daylight quality in offices wasinvestigated through measurements in experimental office rooms (Dubois,2001a) and through computer simulations using the advanced lightingsimulation program Radiance (Dubois, 2001b).
5.1 Measurements in experimental officerooms
The impact of shading devices on daylight quality in offices was studiedthrough measurements in two south-oriented, experimental rooms locatedin the Daylight Laboratory of the Danish Building and Urban ResearchInstitute, in Hørsholm, Denmark. These rooms are 3.5 m-wide by 6.0m-deep and have a 1.78 m-wide by 1.42 m-high window. The daylightquality was assessed by considering five performance indicators: thedaylight factor, the work plane illuminance, the illuminance uniformityon the work plane, the absolute luminance in the field of view and theluminance ratios between the work plane (paper task), the walls and theVDT screen.
The shading systems studied included ten interior shading (roller)screens and one standard venetian blind with 25 mm-wide, curved, whitealuminium slats placed on the interior side of the window. Among theinterior screens studied, three were black, one was dark brown, two werebrown, two were medium brown and two were white. The venetian blindwas studied with the slats in the horizontal position and in a closed posi-tion where the view to the outside was totally blocked.
The measurements were carried out under perfectly sunny and over-cast conditions. The sunny day measurements were performed three timesa day (i.e. in the morning, noon and afternoon) between July 2-19, 2001while the overcast measurements were carried out between the end of

Solar Shading for Low Energy Use and Daylight Quality in Offices
28
July and the end of August 2001. The measurements were carried outsimultaneously in two rooms. One room was totally empty while theother room was furnished as a typical office room. In each room, thework plane illuminance and the illuminance on lateral walls was recordedby lux meters, while the luminance of the walls and window-shade com-bination was measured using a calibrated CCD camera and two lumi-nance meters.
The results of the measurements show that the shading devices stud-ied can be divided into three distinct groups:
Group 1: Group 2: Group 3:
Black screens Closed V. B. (white) Horiz. V. B. (white)Brown screens White screens
Group 1 consists of all dark-coloured (black and brown) screens; Group2 includes the closed venetian blind while Group 3 includes the whitescreens and the horizontal venetian blind. The devices of Group 1 pro-duced unacceptably low work plane illuminance and vertical luminancevalues which resulted in unsuitable luminance ratios between the task,the walls and the VDT screen. However, these devices reduced the lumi-nance of the window (sky) to acceptable levels i.e. below 500 cd/m2,most of the time. The devices of Group 3 did not prevent high windowluminance but resulted in higher levels of work plane illuminance andwall luminance, which makes them suitable for traditional paper tasks.They also yielded high wall luminance values which resulted in someunacceptable luminance ratios between the task, the walls and the VDTscreen. In this case, the wall behind the VDT screen and the task (paper)was more than three times brighter than the VDT screen.
The closed venetian blind (Group 2) was the only device which scoredwell on all performance indicators considered. It provided ideal illuminancelevels for a combination of paper and computer work, a high degree ofilluminance uniformity, prevented extreme luminance values and resultedin favourable wall luminance levels compared with the luminance of astandard VDT screen. However, the view to the outside was totally blockedin this case.
The study showed that none of the shading screens studied met all therequirements of all the performance indicators considered. The dark-col-oured screens met the requirement regarding the maximum luminancein the field of view but failed to meet the requirements regarding mini-mum work plane illuminance and wall luminance levels. This resulted inunacceptable luminance ratios between the VDT screen and the wall be-hind the screen and between the VDT screen and the task. On the other
Impact of shading devices on daylighting quality
29
hand, the white screens did meet the requirements regarding minimumwork plane illuminance and wall luminance levels. However, they oftenproduced illuminance values which may be too high for computer workand which resulted in some unacceptable luminance ratios between theVDT screen and the wall behind.
The study thus generally indicated that dark-coloured screens shouldpreferably be used in offices where the window occupies the central fieldof view of the office worker and where most of the tasks are carried outon the computer. However, artificial lighting should be provided in thiscase (on the walls and task) and it should also be possible to pull theshading screens up when the outdoor illuminance levels are low. Thewhite screens should be used in offices where the occupant is sitting sothat the window is not in the field of view and traditional office tasks arestill performed. These shading screens do prevent direct sunlight patchesand provide a pleasant and evenly distributed light in the room but theview through the window is completely blocked.
5.2 Simulations with RadianceThe impact of six shading devices on daylight quality and on the poten-tial for daylight utilisation in a standard, south-oriented office room wasinvestigated using the simulation program Radiance. The daylight qual-ity was evaluated by considering four performance indicators: the abso-lute work plane illuminance, the illuminance uniformity on the workplane, the absolute luminance values in the room, and the luminanceratios between the work plane (paper task), VDT screen and surround-ings. The potential for daylight utilisation was assessed by studying thedaylight factors and the manual switch-on probability according to a for-mula introduced by Hunt (1980).
The shading devices studied, which were all located on the exteriorside of the window, included:
• a white awning;• a dark blue awning;• a fixed overhang with slats;• an aluminium venetian blind with horizontal and 45º slats;• a white diffusing screen;• a grey screen with a dominant specular (direct) transmittance.

Solar Shading for Low Energy Use and Daylight Quality in Offices
30
The analysis was based on simulations under perfectly (CIE) sunny skyconditions (on June 21, September 21 and December 21, at 09.00, 12.00and 15.00 hours) and under a (CIE) overcast sky. The simulated officeroom was identical to the experimental rooms of the Daylight Labora-tory at the Danish Building and Urban Research Institute in Hørsholm,Denmark.
The results of the study indicated that the shading devices studiedmay be divided into three groups:
Group 1: Group 2: Group 3:
Grey screen 45º V. B. (alum.) Horiz. V. B. (alum.)White screen OverhangBlue awning White awning
The devices of Group 3 provided relatively high work plane illuminancelevels, acceptable illuminance uniformity on the work plane, and anacceptable daylight factor (> 1 %). They also had a very low manualswitch-on probability, which suggests that they offer a high potential fordaylight utilisation. Moreover, these devices produced acceptableluminance ratios between the paper task, VDT screen and surroundings,although there was a small percentage of ratios for which the task was toobright compared with the VDT screen, especially in the cases of the whiteawning and overhang. However, the shading devices of Group 3 generateda significantly higher percentage of high luminance values (> 500 cd/m2)in the room and at the window compared with the other devices studied,which makes them unsuitable as daylight control devices.
The results further indicated that the grey screen (Group 1) producedunacceptably low work plane illuminance levels and a poorer illuminanceuniformity on the work plane compared with the other devices studied.The average daylight factor was also unacceptably low (0.1 %) and themanual switch-on probability very high (94 %), which suggests that thisdevice yields marginal energy savings through daylight utilisation. Moreo-ver, the grey screen yielded a high percentage of unacceptable luminanceratios between the VDT screen and the surroundings and between theVDT screen and the task (paper). The task and surroundings were toodark compared with the VDT screen. However, the grey screen was theonly device which prevented luminances above 500 cd/m2.
Finally, the results indicated that the shading devices of Group 2 (45°venetian blind, white screen, blue awning) produced acceptable work planeilluminance levels for a combination of work and computer work; theyyielded acceptable illuminance uniformity on the work plane and a lowpercentage of luminance values above 500 cd/m2. Moreover, they also

Impact of shading devices on daylighting quality
31
provided acceptable luminance ratios between the task (paper), VDTscreen and surroundings but the performance of the white screen was thebest among all devices studied for this performance indicator. However,these devices resulted in a low average daylight factor (0.5 %) and a mod-erate manual switch-on probability, which suggests that some mecha-nism should be provided to ensure that these devices can be removed(pulled-up) on overcast days. Moreover, note that the blue awning had amuch poorer performance in December and did not prevent direct sun-light patches in the room. Also, the white screen resulted in a brightluminous veil at the window, with a luminance above 500 cd/m2, mostof the time. The best performing device was thus the 45° venetian blind.
The results thus suggest that the overhang, white awning and horizon-tal venetian blind should preferably be used in offices where traditional(paper) tasks are carried out while all the other devices except the greyscreen should be used in offices where a combination of paper and com-puter work is performed. However, since none of these devices but thegrey screen totally avoided high luminance values (500 cd/m2), specialcare should be taken to avoid placing the workstation in such a way thatthe window is directly in the field of view of the occupant, especially inthe case of the overhang, white awning and white screen. The venetianblind might be the only device which may avoid luminance values above500 cd/m2 when the slats are totally closed (but this alternative was nottested here).
Finally, the results of this study indicated that it was much more diffi-cult to obtain acceptable levels of daylight quality in December than inJune and September. This is due to the low solar altitudes in the winter,which make it difficult to shade the entire window area and avoid brightsunlight patches in the room. These bright sunlight patches produce highcontrasts, poor illuminance uniformity, and poorer luminance ratios be-tween the VDT screen and the surroundings, and there is a risk for dis-turbing reflections in the VDT screen. This is a special problem inScandinavian countries and other countries at high latitudes.
Thus, shading devices like overhangs and even awnings are not appro-priate as daylight control devices in countries at high latitudes. Deviceswhich can shade the entire window area like screens and venetian blindsare more suitable, especially in offices where the work is mostly compu-ter-based. However, the study showed that not all types of screens providedaylight quality. In this case, an extremely poor performance was obtainedwith a specular screen (grey screen) while an extremely good perform-ance was obtained with a diffusing screen (white screen). The study thusalso indicates that it is essential that the shading device changes the direc-tion of the incoming light rays, by pure diffusion or by redirection (pref-

Solar Shading for Low Energy Use and Daylight Quality in Offices
32
erably towards the ceiling) of the direct incident light as in the case of thevenetian blind. Venetian blinds are perhaps even preferable to screensbecause they are more flexible since the slat angle can be changed as afunction of specific daylight conditions while the view out can be main-tained for many slat angle positions. In the case of a white diffusing screen,the view out is totally lost as soon as the sun hits the screen because thescreen becomes self luminous and brighter than the outside scene and allcontrast in the outside scene is lost.
5.3 Overall performanceAlthough the shading devices evaluated in the Daylight Laboratory werenot the same as the ones modelled in Radiance, the results of thesimulations seem reasonable compared with the results from the meas-urements. For example, the Grey screen modelled in Radiance was similarto the Plastic screen evaluated in the laboratory and the results from meas-urements and simulations yielded equivalent conclusions: these screensresult in unacceptably low illuminance values and poor uniformity; theydo not prevent direct light patches and create unacceptable luminanceratios between the VDT, work plane and surrounding surfaces. Also, thevalues obtained with simulations for the White screen (with a transmit-tance of 15 %) were generally lower than the values obtained with meas-urements for similar diffusing white screens, but the screens evaluated inthe laboratory had a higher transmittance (27 and 59 %). They thusyielded much higher illuminance and luminance values in the room. Fi-nally, both studies came to the conclusion that the venetian blind (closedor 45º slats) resulted in the best overall performance for offices with com-puters.
The results of both studies indicate that the shading systems studiedmay be divided into three groups as follows (the screen's transmittance isindicated in parentheses; italics indicate that the shading system was evalu-ated using simulations with Radiance):
Group 1: Group 2: Group 3:
Black and brown 45º V. B. (alum.) Horiz. V. B. (alum.)screens (3-13 %) Closed V. B. (white) Horiz. V. B. (white)Grey screen (4 %) White screen (15 %) Overhang
Blue awning White awningWh. screens (27-59 %)

Impact of shading devices on daylighting quality
33
Group 1 includes all black and brown screens, which had a transmit-tance between 3 and 13 %. These screens resulted in unacceptably lowilluminance and luminance values in the room and unacceptable lumi-nance ratios between the VDT screen, work plane and surrounding sur-faces. Note that the black screen with the highest transmittance (13 %)performed significantly better than the other screens in that group, whichall had a transmittance below 9 %. Group 2 includes the venetian blindwith closed slats (white) or with the 45º slats (aluminium) as well as thewhite screen with a transmittance of 15 % and the blue awning. Thesedevices generally provided illuminance and luminance levels which arecompatible with work on computer. They also provided a better illumi-nance uniformity in the room. Note, however, that the blue awning hada very variable performance over the year and failed to prevent directsunlight patches in the room, especially with low sun angles. Group 3includes the horizontal venetian blind (white and aluminium), overhang,white awning and white screens with a higher transmittance (27-59 %).These devices yielded high illuminance levels, which make them less suit-able for office work with computers. They also failed to prevent directsunlight patches in the room or the direct view of the bright sky. Thewhite screens and awning exacerbated the glare problem since they turnedinto a bright luminous veil under direct sunlight, which also completelyblocked the view out.
The results thus generally indicate that the venetian blind may be thebest daylight control device. Also, a screen with a transmittance of atleast 15 % may also be acceptable but the transmittance should not behigher than around 25 % and not lower than 10 %, especially in officeswhere the work is mostly computer-based.

Solar Shading for Low Energy Use and Daylight Quality in Offices
34

Discussion and conlusions
35
6 Discussion and conclusions
A few studies about solar shading devices have been presented in thisthesis. These studies include a literature review, parametric studies of en-ergy use, the development of design tools, measurements as well assimulations of daylighting in rooms with shading devices. The followingconclusions can be drawn from the results of these studies:
1) Shading devices can reduce thermal losses through the windowsignificantly, especially if the device is airtight, sealed around thewindow, close to the windowpane, has light-coloured or low-ebackings and is made of multiple layers.
2) Knowledge about the solar-optical properties of shading deviceswas still rather scant in 1997 and there was a shortage of models toaccurately predict the impact of shading devices on energy use.Great progress has been made in this area since then. Within theSolar Shading Project at Lund University, the total solar transmit-tance of a large number of common shading systems has been char-acterised through measurements, and detailed algorithms to accu-rately predict the impact of most of these devices on energy usehave been developed, validated and integrated into a whole build-ing energy simulation program (Derob-LTH).
3) Solar-protective (absorbing, reflecting) glazing might be energy-efficient but the relative potential for energy savings depends onthe orientation of the facade and on the climate. In general, fororientations and climates which have a significant amount of solarradiation during the winter, higher transmittance glazing or largerglazing areas provide larger energy savings (compared with otherfacades and climates) because the potential for passive solar utili-sation during the winter offsets increases in the cooling demand.This conclusion can only be drawn on condition that larger ther-mal losses resulting from larger glazing areas or poorer window U-values are compensated for by an increase in the thickness of theinsulation around the window or elsewhere in the building.

Solar Shading for Low Energy Use and Daylight Quality in Offices
36
4) The potential for energy savings is much greater with a simpleexterior shading device with a low g value, e.g. a dark blue awning,than with any solar-protective glazing assembly because the shad-ing device can be removed during the winter and the free solarheat gains can be utilised to offset the heating demand. This is asignificant factor to consider in Scandinavia and Canada wherethe heating demand is dominant.
5) It is not necessary that exterior shades provide 100 % shading forsteep angles of incidence. The most important is to provide shad-ing when the sun is in front of the window i.e. when the windowtransmittance and the intensity of the incident beam are highest.For example, in the case of awnings, it was shown that it is notnecessary to have very large awnings or awnings with sides sincethe solar radiation leaking on the side of the awning (at steep an-gles of incidence) was insignificant with respect to annual coolingloads. The advantage of smaller awnings is that light leakage fromthe sides of the awning may provide beneficial diffuse daylighting.
6) Simple tools for early design stages must provide detailed infor-mation about the solar angle dependent properties of the windowand the heating and cooling demand in the building. A simplechart showing the total solar angle dependent transmittance of thewindow greatly simplifies the design problem and reduces thenumber of variations which must be studied through computersimulations.
7) Shading devices which project from the exterior facade of the build-ing like awnings and overhangs are not suitable daylight controldevices in offices where the work is mostly computer-based be-cause they do not prevent direct sunlight patches in the room andthey produce illumination levels which may be too high for com-puter work. The problem is exacerbated at high latitudes wherethe sun is just above the horizon in the winter. Vertical devices,which can shade the entire window area like screens and venetianblinds, are preferable and should always be provided in additionto exterior devices like awnings and overhangs.
An optimum solution might be to combine a very efficient (lowg value) exterior shading device like an awning to prevent over-heating in the summer, spring and autumn, with an interior de-vice with a high g value like an interior venetian blind or curtain,to control daylighting, even in December. The advantage of usingan interior device for daylight control is that interior devices have

Discussion and conlusions
37
a higher g value and thus have a smaller impact on the useful win-ter solar heat gains. Moreover, interior devices can be manuallycontrolled and may thus provide higher levels of user-satisfaction.Note also that interior shading devices like curtains are often usedfor aesthetic reasons.
8) Shading devices should change the direction of the incident lightrays, either by pure diffusion or by redirection (preferably towardsthe ceiling) as in the case of a venetian blind. The best shadingdevices are the ones which block or redirect direct light and letdiffuse lighting come into the building. Shading devices with astrong direct transmittance component like screens with holes,should be avoided. These devices block the diffuse daylighting andlet some direct sunlight in, which results in low interior luminanceand illuminance levels and bright sunlight patches in the room.This generates high contrasts (poor uniformity), poor visibilityand high levels of discomfort.
9) Screens which have an extremely low transmittance (lower thanaround 10 %) may reduce the daylighting in the room to unac-ceptably low levels, even if they diffuse light properly. This resultsin unacceptable illuminance and luminance levels and unaccept-able luminance ratios between the VDT screen, the paper task andsurroundings. On the other hand, white screens with a fairly hightransmittance (higher than around 25 %) may yield light levelsthan are unsuitable for work on computer. A screen transmittanceof around 15 % appears to be optimum for a south-oriented roomwith a medium window size (24 % of exterior wall area; 12 % offloor area).
6.1 Future researchAlthough large research projects like the Solar Shading Project at LundUniversity have greatly increased and deepened knowledge about solarshading devices and their impact on energy use, much research remainsin this field. Some of the most important areas that need to be exploredfurther are summarised below:
1) More research is needed to assess the impact of shading devices onthe window U-value with double-, triple-pane and (low-e) coatedwindows. These effects need to be included in energy simulationprograms.

Solar Shading for Low Energy Use and Daylight Quality in Offices
38
2) Algorithms that predict the impact of shading devices on the in-door daylighting levels need to be developed further and includedwithin whole building energy simulation programs so that theimpact of daylighting on energy use for lights can be studied aswell. Some work in this direction has already been initiated byBülow-Hübe and Källblad (Bülow-Hübe, 2001) within the SolarShading Project. These algorithms need to be further developedand validated and the whole building energy simulation programneeds to be further developed to allow modelling of movable de-vices i.e. devices which go up or down as a function of overheatingor daylighting in the room.
3) More parametric studies of energy use in buildings including en-ergy use for heating, cooling and lighting need to be carried out,for a variety of climates, orientations and building types. Combi-nations of shading devices (interior and exterior), movable shad-ing devices and shading devices combined with special (solar-pro-tective, low-e) glazing should also be studied. The parametric studiespresented in this thesis are much too limited as a background fordesign guidelines. Much work remains in this area.
4) Control strategies for shading devices and artificial lighting needto be studied through measurements and through computersimulations.
5) The simple design tools presented in this thesis should be includedin a computer program such as Parasol-LTH. They should also beextended so that the optimal geometry of the shading device meet-ing a specific shading mask or monthly g value could be generatedautomatically. These tools also need to be tested further to see ifthey are really useful in a real design situation and if they can beaccepted by the design professionals.
6) The daylight studies should be supplemented with behaviouralstudies (i.e. with real human subjects). This would make it possi-ble to verify whether the protocol for evaluating daylighting qual-ity is adequate. Behavioural studies might show, for example, thatother performance indicators need to be included in the analysisor that the requirements used in this study were too severe forsituations with daylighting.
References
39
References
Boverket (1999). Building Regulations BBR 94. BFS 1993:57 with amend-ments up to BFS 1998:38. Boverket. Karlskrona (Sweden). (in Swed-ish).
Bülow-Hübe, H. (2001). Validation of a Daylight Module in Derob-LTH. in Energy Efficient Window Systems: Effects on Energy Use andDaylight in Buildings. Report TABK--01/1022. Lund University, Dept.of Construction and Architecture, Div. of Energy and Building De-sign. Lund (Sweden).
Dubois, M.-C. (2001a). Impact of Solar Shading Devices on Daylight Qual-ity: Measurements in Experimental Office Rooms. Report TABK--01/3061. Lund University, Dept. of Construction and Architecture, Div.of Energy and Building Design. Lund (Sweden).
Dubois, M.-C. (2001b). Impact of Shading Devices on Daylight Quality inOffices: Simulations with Radiance. Report TABK--01/3062. LundUniversity, Dept. of Construction and Architecture, Div. of Energyand Building Design. Lund (Sweden).
Dubois, M.-C. (2000a). A Method to Define Shading Devices Consid-ering the Ideal Total Solar Energy Transmittance. Proc. of the Eurosun2000 Conference, June 19-22, Copenhagen (Denmark). (proceedingson CD-rom).
Dubois, M.-C. (2000b). A Simple Chart to Design Shading DevicesConsidering the Window’s Solar Angle Dependent Properties. Proc.of the Eurosun 2000 Conference, June 19-22, Copenhagen (Denmark).(proceedings on CD-rom).
Dubois, M.-C. (1999). The Design of Seasonal Awnings for Low Cool-ing and Heating Loads in Offices. Proc. of the 5th Symposium on Build-ing Physics in the Nordic Countries, August 24-26, Göteborg (Swe-den). Vol. 2. Chalmers University of Technology, Göteborg. pp. 505-512.

Solar Shading for Low Energy Use and Daylight Quality in Offices
40
Dubois, M.-C. (1998a). Solar-Protective Glazing for Cold Climates: A Para-metric Study of Energy Use in Offices. Report TABK--98/3053. LundUniversity, Dept. of Building Science. Lund (Sweden). 134 pages.
Dubois, M.-C. (1998b). Awnings and Solar-Protective Glazing for Effi-cient Energy Use in Cold Climates. Proc. of the International Confer-ence on Renewable Energy Technologies in Cold Climates ’98, May 4-6,Montreal (Canada). Solar Energy Society of Canada Inc., Ottawa(Canada). pp. 380-385.
Dubois, M.-C. (1997). Solar Shading and Building Energy Use: A Litera-ture Review. Part I. Report TABK--97/3049. Lund University, Dept.of Building Science. Lund (Sweden). 118 pages.
Hunt, D. R. G. (1980). Predicting Artificial Lighting Use - A MethodBased upon Observed Patterns of Behaviour. Lighting Research & Tech-nology. Vol. 12. No. 1. pp. 7-14.
Kvist, H. (1997). Derob-LTH for MS Windows. User Manual Version 97.01.Report TABK--95/7019. Lund University, Dept. of Building Science.Lund (Sweden).
Källblad, K. G. (1998). Thermal Models of Buildings. Determination ofTemperatures, Heating and Coolings Loads. Theories, Models and Com-puter Programs. Report TABK--98/1015. Lund University, Dept. ofBuilding Science. Lund (Sweden).
LBL (1994). WINDOW 4.0: A PC Program for Analysing Window Ther-mal Performance of Fenestration Products. Report LBL-35298. Law-rence Berkeley National Laboratory, Windows and Daylight Group.Berkeley, California (USA).
Mazria, E. (1979). The Passive Solar Energy Book. Rodale Press. Emmaus,Pa (USA).
Olgyay, A. & Olgyay, V. (1957). Solar Control and Shading Devices.Princeton University Press. New Jersey (USA).
Solar Shading Project (2001). http://www.byggark.lth.se/shade/shade_home.htm.
Wall, M. & Bülow-Hübe, H. (eds.) (2001). Solar Protection in Buildings.Report TABK--01/3060. Lund University, Dept. of Construction andArchitecture, Div. of Energy and Building Design. Lund (Sweden).

References
41
Wallentén, P., Kvist, H. & Dubois, M.-C. (2000). ParaSol-LTH: A User-friendly Computer Tool to Predict the Energy Performance of Shad-ing Devices. Proc. of the International Building Physics Conference,September 18-21, Eindhoven (The Netherlands). pp. 331-338.
Wallentén P. & Wall, M. (1999). Performance of shading devices in build-ings – A collaboration between Lund University and Nordic manu-facturers. Proc. of the 5th Symposium on Building Physics in the NordicCountries, August 24-26, Göteborg (Sweden). Vol. 2. Chalmers Uni-versity of Technology, Göteborg. pp. 521-528.
Solar Shading for Low Energy Use and Daylight Quality in Offices
42

Article I
43
Article I

Solar Shading for Low Energy Use and Daylight Quality in Offices
44
Article I
45
A METHOD TO DEFINE SHADING DEVICESCONSIDERING THE IDEAL TOTAL SOLAR ENERGY TRANSMITTANCE
Marie-Claude DuboisDepartment of Construction & Architecture, Lund University
P.O. Box 118, 221 00 Lund, Sweden, tel. +46 46 222 7347, fax +46 46 222 4719, [email protected]
Abstract – A method to determine the optimum total solar energy transmittance (G value) of a shadingdevice is presented. The method consists in determining the ideal hourly G value of the shading devicefrom the results of one energy simulation for the room or building with a bare window (no shading de-vice). These hourly G values are then converted to monthly and annual values using weighted averages.One example is provided where the method is used to determine the optimum properties of a screen to beinstalled on a south-oriented office room in Stockholm (Sweden). It is shown that the method allows topredict the optimum monthly and annual G values with a relative accuracy. The method is therefore use-ful to identify the optimum shading device properties rapidly, avoiding many iterations in the simulations.
1. INTRODUCTION
In buildings with artificial cooling installations, largeenergy savings can be achieved by installing solarshading devices above windows. According to a recentliterature review (Dubois, 1997), solar shading can reducea building’s cooling demand by up to 89%. Shadingdevices are also useful for controlling daylighting levels,privacy and avoid glare from windows (Littlefair, 1999).
In cold countries, one drawback of using shadingdevices is the risk to reduce useful solar gains during thewinter and increase the heating demand. One study(Dubois, 1999) showed that a fixed (i.e. in place yearround) awning can increase a room’s heating demand by31% (28 kWh/m2year) in Stockholm (Sweden). Thisstudy concluded that it is essential to use shading devicesthat can be removed (or pulled up) during the heatingseason. This is unfortunately not always possible due tothe costs and maintenance associated with movableshades and fixed shading devices are still very commonin cold countries.
One way to take into consideration both heating andcooling loads in the design of shading devices is to studytheir impact on energy use or indoor temperatures using adynamic energy simulation program. The advantage ofusing energy simulations is that most of the complexthermal and radiative processes between the building, theshading device and the outdoor environment areconsidered in the calculations. The most advancedprograms take into consideration both direct and diffusesolar radiation, the window’s solar angle dependentproperties and longwave sky radiation. Some programse.g. Derob-LTH (Källblad & Wallentén, 1999) can evenmodel the thermal exchanges between the window andthe shading device. It follows that the building’s hourlyheating and cooling demand is predicted very accurately.
The normal procedure with energy simulationprograms consists in
1) building a base model and perform an energysimulation;
2) modify the base model and repeat the energysimulation to investigate the impact of thismodification on energy use or indoor temperatures;
3) repeat the last step until a satifactory solution isreached.
Although this procedure normally yields an accuratesolution, it is quite laborious since a large number ofsimulations are needed before the optimum solution isreached. For example, in a study about awnings (Dubois,1999), 31 simulations had to be performed to identify theoptimum shading solution for one single room andorientation. In a real building, which usually has a varietyof window types and orientations, many more simulationsare required.
This paper presents a more rapid method to identifythe optimum shading device using energy simulations.The method consists in determining the ideal hourly totalsolar energy transmittance (G value) of the shadingdevice from the output data provided by one simulationfor the room or building with a bare window (no shadingdevice). These hourly G values are then converted intomonthly and annual values using weighted averages. Thispaper presents this method and shows, through oneexample, that it predicts the optimum shading device’smonthly and annual G values with an acceptableaccuracy.
2. METHOD
2.1 Description of the methodOne factor which characterises a window and shadingdevice assembly is the total solar energy transmittance ofthe system, which is also called the G value. The G valueexpresses how much solar radiation is absorbed andtransmitted through the system (window plus shadingdevice) and becomes heat in the building. It includes both

Solar Shading for Low Energy Use and Daylight Quality in Offices
46
the primary and secondary transmittance and can thus beexpressed as follows:
wG
sunsys AI
QG
⋅=
(1)
where Gsys is the system’s (window plus shading device)total solar energy transmittance, Qsun is the total solargain in the building, IG is the global solar radiation on thefacade and Aw is the window area.
Since the total transmittance of a system is the pro-duct of the transmittance of each part of the system, the Gvalue of the shading device (Gsh) can be determined asfollows:
win
syssh G
GG =
(2)
where Gwin is the G value of the window, which can bedetermined from measurements or using “exact” calcula-tions, semi physical models, empirical models or tem-plate models (Karlsson et al., 1999).
Similarly to the shading coefficient, the shading de-vice’s G value (Gsh) is a measure of the effectiveness ofthe shading device “to shade windows”. A “good” shad-ing device has a low G value since only a small portion ofthe incident radiation is absorbed and transmitted by theshading device and becomes heat in the building. A“poor” shading device has a high G value since it letsmost of the incident radiation reach the window. Thus, inthe middle of the summer, a low G value (∼0) is usuallydesirable to avoid overheating while during the winter, ahigh G value (∼1) is preferable because solar heat gainsare useful to offset heating loads. During the spring andautumn when outdoor temperatures are low but solarradiation is high, some solar energy might be desirable tomaintain the indoor comfort temperature without havingto artificially heat the building. On the other hand, toomuch solar radiation might result in the need for artificialcooling. During these periods, the optimum G value is theone which maintains the indoor comfort temperature withas little as possible energy expenditures. The ideal Gvalue to achieve a low energy use is therefore variablethroughout the day and the year and depends on the out-door climate (temperature and solar radiation) and on thedesired indoor temperature and internal loads.
One simple way to determine the ideal G value (Gi)for the shading device is to analyse the output data ob-tained from one energy simulation for the room or build-ing with a bare window (no shading device) in the fol-lowing way:
Given that IG > 0 (daytime),
if Qcool ≥ Qsun then Gi = 0 (3)
if Qcool < Qsun then
−=
Q
Q
Gisun
cool1(4)
if Qsun = 0 then Gi = 1 (5)
if Qcool = 0 then Gi = 1 (6)
where Qcool is the hourly cooling load. Thus, if the cool-ing demand (Qcool) is equal to or larger than the solar heatgain (Qsun), all the heat from the sun should be avoidedand the ideal G value for the shading device (Gi) is 0. Onthe other hand, if Qcool is smaller than Qsun, it means that apart of Qsun is lost through the building envelope. Thisoccurs most often during the spring and autumn when theoutdoor temperature is low and solar radiation is high. Inthat case, Gi corresponds to the portion of Qsun lostthrough the building envelope, which is the differencebetween Qsun and Qcool. If Qsun is equal to 0, there are nosolar heat gains and no shading device is required; Gi isthus equal to 1. Finally, if Qcool is equal to 0, there is nocooling load and Gi is 1 since the solar gains are usefuleither to maintain the comfort temperature or to offset theheating demand.
Since the values (Qsun, Qcool, IG) necessary to deter-mine Gi are normally provided by energy simulations, itis possible to calculate the Gi values at each hour of oneyear from the output data provided by a single energysimulation for the room or building with a bare window(no shading device). As an example, these hourly valueshave been determined for a south-oriented office room inStockholm on a typical day in April. These values arereported in Table 1 and illustrated in Fig. 1. Fig. 1 showsthat Gi varies throughout the day with maximum values atnight and minimum values in the afternoon. The idealshading device is thus different at each hour, which is inpractice impossible to achieve with a flat shading device(screen) unless a switchable material is used.
The hourly Gi values obtained can be converted intomonthly or annual values depending on the type of shad-ing device to be installed (seasonal, fixed). A simple wayto convert hourly Gi values into monthly or annual valuesis to use weighted averages. In this article, the total en-ergy use (Qtot), which in this case is the sum of heatingand cooling loads, and the solar heat gains (Qsun) werealternately used as weighting factors and the impact ofusing each factor on predicted monthly and annual Gi
values is discussed. With Qtot as weighting factor, thefollowing equations were used to determine the monthly(mth) and annual (year) Gi values:

Article I
47
)()()(
1)( hourGhourQ
hourQmthG itot
tot
imth
mth
⋅∑⋅∑
=(7)
)()()(
1)( mthGmthQ
mthQyearG itot
tot
iyear
year
⋅∑⋅∑
= (8)
The same equations were used with Qsun instead of Qtot asweighting factor.
Table 1 Gi values for a south-oriented office room inStockholm on a typical day in April.
Hr Tout
(°C)IG*Aw
(W)Qsun
(W)Qheat
(W)Qcool
(W)Gi
1 -1.5 0 0 194 0 ..2 -2.4 0 0 212 0 ..3 -2.7 0 0 223 0 ..4 -2.4 0 0 226 0 ..5 -3.5 0 0 244 0 ..6 -3.6 51 21 247 0 1.007 -1.3 172 68 218 0 1.008 -0.8 607 258 170 0 1.009 1.1 1081 476 0 115 0.76
10 2.5 1500 669 0 228 0.6611 3.2 1482 666 0 280 0.5812 4.2 1864 840 0 388 0.5413 4.9 1925 870 0 454 0.4814 5.4 1716 782 0 472 0.4015 5.5 1330 606 0 449 0.2616 5.3 909 418 0 393 0.0617 4.9 397 195 0 313 0.0018 4.3 88 59 0 16 0.7319 4.3 22 27 21 0 1.0020 3.5 0 4 56 0 ..21 2.3 0 2 87 0 ..22 2.2 0 2 105 0 ..23 2.1 0 1 120 0 ..24 2.3 0 0 131 0 ..
0.00.10.20.30.40.50.60.70.80.91.0
6 7 8 9 10 11 12 13 14 15 16 17 18 19 20
Time (hour)
G i
Fig. 1 Gi values for a south-oriented office room inStockholm on a typical day in April.
2.2 ExampleThe method presented in the previous section was used todetermine the monthly and annual Gi values for an exte-rior screen to be installed on a south-oriented office roomin Stockholm. A parametric study was then carried out todetermine if the proposed method yielded the optimumscreen properties. In the parametric study, the G value ofthe screen was varied by 0.1 increments between 0 and 1and the impact of these variations on monthly and annualenergy use were investigated.
The computer program used for the energy simula-tions as well as the office room where the screen wasinstalled are described in the following sections.
2.2.1 Energy simulation programThe energy simulation program Derob-LTH was used tocarry out the parametric study and to determine thehourly Gi values according to the proposed method.Derob-LTH, which is an acronym for Dynamic EnergyResponse of Buildings, originates from the University ofTexas (Arumi-Noé, 1979) but has been under continuousdevelopment at Lund University’s Department of Build-ing Science (Kvist, 1998; Källblad, 1999). The programuses hourly data for the exterior temperature and the solarradiation intensity and updates the solar position fourtimes every month. It has been recently supplementedwith advanced algorithms for windows and exteriorshading devices (Källblad & Wallentén, 1999). Thesewindow and shading algorithms have the following char-acteristics:
• Coarse ray tracing and Fresnel calculation of the directradiation;
• View factor and Fresnel calculation of the diffuseradiation;
• One thermal node for each pane;• Shading device transmits and reflects diffusely;• One thermal node approximating the thermal balance
for all shading devices;• Long wave sky radiation included.
The shading and window models in Derob-LTH havebeen validated experimentally using two full-scaleguarded hot boxes exposed to the natural climate. Acomparison between measured and simulated energy for adark and a light awning has shown a maximum error of3% with respect to the incident solar radiation (Källblad& Wallentén, 1999).
2.2.2 Office roomThe screen was installed on the exterior side of the win-dow of a standard office room. The office room was a2.9-m wide by 4.2-m deep rectangular space with a 1.8-mwide by 1.3-m high, triple-pane, clear glass window (Fig.2).

Solar Shading for Low Energy Use and Daylight Quality in Offices
48
2.9 m
4.2 m
SOUTH
EAST
screen
1.0
m2.
7 m
wall facing the exterior (heat transfer)
Adiabatic surface(no heat transfer)
Fig. 2 Office room.
The window had a U-value of 1.88 W/m2°C and a G valueof 0.67 at normal incidence. The exterior wall was a stan-dard construction with respect to Swedish norms with a U-value of 0.18 W/m2°C. The room was assumed to be sur-rounded by office space at the same temperature. Thus, all“interior” walls were modelled as adiabatic surfaces. A freehorizon with no obstruction and a ground reflectance of20% were assumed.
The room had a constant infiltration rate of 0.1 ach anda ventilation rate of 10 l/s during weekdays at normal officehours (8-17) and 5 l/s the rest of the time. Internal heatgains from one occupant (90 W), a computer and monitor(120 W) and energy-efficient lighting (10 W/m2) wereassumed during work hours. A constant indoor temperatureof 22°C was assumed throughout the year to simplify thestudy.
3. RESULTS
3.1 Determination of the Gi valuesThe Gi values were determined from the energy simula-tion for the screenless office room using the method de-scribed in Section 2.1. These hourly Gi values (Qtot
weighted) are presented in Table 2 and in Fig. 3. In Fig. 3,the cooling months (May-September) are presented sepa-rately to facilitate the reading of the diagrams.
The values in Table 2 show that complete shading (Gi
= 0) is only required during some hours in the afternoonfrom May to September. The rest of the time, either noshading (Gi = 1) or partial shading (Gi = 0-1) is desira-ble.The lowest hourly Gi values are “displaced” towardsthe right and bottom of Table 2. The displacement to-wards the right is due to the Earth’s thermal inertia,which yields an asymmetrical cooling season with respectto the summer solstice while the displacement towards
Table 2 Hourly Gi values (Qtot weighted) for each month.Hour Jan Feb Mar Apr May June July Aug Sept Oct Nov Dec
1 .. .. .. .. .. .. .. .. .. .. .. ..2 .. .. .. .. .. .. .. .. .. .. .. ..3 .. .. .. .. .. 0.99 0.99 .. .. .. .. ..4 .. .. .. .. 1.00 0.98 0.97 1.00 .. .. .. ..5 .. .. .. 1.00 1.00 0.95 0.97 1.00 .. .. .. ..6 .. .. 1.00 1.00 1.00 0.93 0.93 1.00 1.00 .. .. ..7 .. .. 1.00 1.00 0.99 0.88 0.83 1.00 1.00 1.00 .. ..8 .. 1.00 1.00 1.00 0.95 0.81 0.73 0.99 1.00 1.00 1.00 ..9 1.00 1.00 1.00 0.55 0.10 0.02 0.01 0.02 0.13 0.42 1.00 1.00
10 1.00 1.00 0.99 0.55 0.15 0.03 0.01 0.08 0.17 0.40 0.97 1.0011 1.00 1.00 0.94 0.50 0.15 0.04 0.02 0.08 0.17 0.39 0.92 1.0012 1.00 1.00 0.85 0.43 0.13 0.04 0.01 0.06 0.16 0.34 0.86 0.9913 1.00 0.99 0.80 0.39 0.08 0.02 0.01 0.04 0.10 0.31 0.80 0.9914 1.00 0.99 0.74 0.31 0.04 0.01 0.00 0.01 0.04 0.23 0.77 0.9915 1.00 0.99 0.71 0.21 0.01 0.00 0.00 0.00 0.02 0.10 0.75 1.0016 1.00 1.00 0.70 0.09 0.00 0.00 0.00 0.00 0.00 0.05 0.82 1.0017 .. 1.00 0.69 0.06 0.00 0.00 0.00 0.00 0.00 0.04 1.00 ..18 .. .. 1.00 0.92 0.18 0.14 0.05 0.15 0.27 0.94 .. ..19 .. .. 1.00 0.97 0.25 0.16 0.04 0.25 0.64 .. .. ..20 .. .. .. 0.99 0.40 0.22 0.05 0.44 .. .. .. ..21 .. .. .. .. 0.70 0.33 0.10 0.60 .. .. .. ..22 .. .. .. .. .. 0.56 0.55 .. .. .. .. ..23 .. .. .. .. .. .. .. .. .. .. .. ..24 .. .. .. .. .. .. .. .. .. .. .. ..

Article I
49
the bottom of Table 2 is due to the building’s thermalinertia.
Fig. 3 shows that the Gi value is dependent both onthe outdoor climate (solar radiation and temperature)and the interior conditions (internal heat loads and ven-tilation) since daily and monthly variations can be ob-served. The Gi value is 1 most of the time outside workhours but decreases dramatically at the beginning of thework day (08.00 hours) due to a rise in internal heatgains which contribute to an increase in the coolingdemand. Shading is then required to take away someheat from the sun. The Gi value continues to decrease asthe day progresses and reaches a minimum at the end ofthe work day i.e. around 17.00 hours. At 18.00 hours, itsuddenly increases due to the removal of internal loadsand remains high after work hours for most months.
0.00.10.20.30.40.50.60.70.80.91.0
0 2 4 6 8 10 12 14 16 18 20 22 24
Time (hour)
JanFebMarAprOctNovDec
G i (Q tot )
a)
0.00.10.20.30.40.50.60.70.80.91.0
0 2 4 6 8 10 12 14 16 18 20 22 24
Time (hour)
MayJuneJulyAugSept
G i (Q tot )
b)Fig. 3 Gi values predicted for each hour of a) theautumn, winter and spring and b) the summer months.
The monthly Gi values obtained using Qtot and Qsun asweighting factors are presented in Table 3. Table 3shows that no shading (∼1) is preferable in December,January and February and that close to complete shad-ing (∼0) is required in June, July and August. A low Gvalue is desirable between May and September while ahigh G value is required in March and November. Table3 also shows that the two weighting factors yield ratherclose values. Using Qtot as the weighting factor yieldsslightly higher values during the winter and slightlylower values during the summer.
Table 3 Monthly Gi values as a function of weightingfactor (Qtot or Qsun).
Weighting factorMonth Qtot Qsun
Jan 1.00 0.99Feb 1.00 0.98Mar 0.92 0.81Apr 0.57 0.50May 0.17 0.17June 0.11 0.12July 0.04 0.10Aug 0.11 0.13Sept 0.14 0.19Oct 0.35 0.45Nov 0.88 0.84Dec 1.00 0.98Annual 0.31 0.35
The annual Gi value obtained is 0.31 using Qtot asthe weighting factor and 0.35 with Qsun. Using Qsun thusyields a slightly higher annual Gi value than using Qtot.
3.2 Parametric studyThe results of the parametric study are summarised inFig. 4, which shows the total energy use (sum of heatingand cooling loads) for each month as a function of thescreen’s G value. Fig. 4 shows that total energy use wasminimum with a G value of 1 in January, February,March, November and December. In May, June, July,August and September, the total energy use was mini-mum with a G value of 0, while in April and October, aG value of 0.4-0.6 yielded the lowest total energy use.However, note that in January, April and October, avariation of the G value had a very small influence ontotal energy use.
The monthly optimum G values obtained in theparametric study are compared in Fig. 5 with themonthly Gi values predicted by using the method. Fig. 5shows that the method allows to predict the optimummonthly G value with an acceptable accuracy, espe-cially for Gi values weighted according to Qtot. Thelargest discrepancies between predicted and simulatedvalues are for the summer months (May-September).However, Fig. 4 shows that a G value of 0-0.1 yieldedapproximately the same total (lowest) energy use (lessthan 0.01% difference). The Gi values (Qtot weighted) ofFig. 5 are thus within a region of very low total energyuse and are acceptable. Some discrepancies between thepredicted and simulated values are also found in March,October and November, even with Qtot as weightingfactor. Again, Fig. 4 shows that a G value of 0.9-1.0yielded approximately the same total (lowest) energyuse (less than 0.01% difference), which means that theGi values (Qtot weighted) of Fig. 5 are of acceptableaccuracy.

Solar Shading for Low Energy Use and Daylight Quality in Offices
50
8
9
10
11
12
13
14
15
16
17
18
Jan Feb Mar Apr May June July Aug Sept Oct Nov Dec
0.0
0.1
0.2
0.3
0.4
0.5
0.6
0.7
0.8
0.9
1.0
Total energy use (kWh/m2 year)
G value
Fig. 4 Total monthly energy use (sum of heating and cooling loads) (kWh/m2year) as a function of the screen’s G valueobtained with the parametric study.
00.10.20.30.40.50.60.70.80.9
1
Jan Feb Mar Apr May June July Aug Sept Oct Nov Dec
G (param.)Gi (Qtot)Gi (Qsun)
G value
Fig. 5 Optimum G value obtained in the parametric studycompared with the Gi values weighted according to Qtot
and Qsun.
The incremental annual energy use as a function ofthe screen’s G value is shown in Fig. 6. This Figure alsoshows the annual Gi values obtained using the twoweighting methods (Qtot and Qsun).
Fig. 6 shows that the parametric study indicated aminimum annual energy use with a G value of 0.4. Thisvalue is slightly higher than the ones (0.31-0.35) pre-dicted by using the method described in Section 2.1.However, Fig. 6 shows that a G value of 0.3 yielded littleadditional annual energy use (less than 0.01%) than a G
value of 0.4. The values predicted by the method are thusof acceptable accuracy.
0
1
2
3
4
5
6
7
8
0 0.1 0.2 0.3 0.4 0.5 0.6 0.7 0.8 0.9 1
G value
G (param.)Gi (Qtot)Gi (Qsun)
Incr. annual energy use (kWh/m2 year)
Fig. 6 Total incremental annual energy use as a functionof the screen’s G value obtained with the parametricstudy compared with the Gi values predicted with themethod.
4. DISCUSSION
The comparison between predicted and simulated G val-ues (Fig. 5 and 6) shows that the proposed method allowsto predict the optimum G value for the shading devicewith an acceptable accuracy, both on a monthly and anannual basis.

Article I
51
On an annual basis, using Qsun as weighting factorpredicted the optimum G value more accurately thanusing Qtot. However, the difference in annual energy usebetween both predicted Gi values and the simulated Gvalues was negligible (less than 0.01%), which meansthat both weighting methods allowed to predict the opti-mum annual G value with an acceptable accuracy.
On a monthly basis, a better fit between predicted andsimulated values was obtained by using Qtot instead ofQsun as the weighting factor. This is due to the fact thatduring the winter, the highest heating load occurs at hourswhen there is little solar radiation. Weighting the hourlyGi values according to Qsun thus results in a poor fit (espe-cially in March and November). During the summer, abetter fit between predicted and simulated values wasalso obtained by weighting the Gi values according to Qtot
instead of Qsun. This occurs because the peak coolingdemand is somewhat delayed with respect to the peaksolar gains. Weighting the Gi values according to Qsun
thus also results in a poor fit.
5. CONCLUSIONS
A simple method to determine the optimum total solartransmittance (G value) of a shading device was pre-sented. The method consists in determining the idealhourly G value of the shading device from the output dataprovided by one energy simulation for a room or buildingwith a bare window (no shading device). These hourly Gvalues are then converted into monthly and annual valuesusing weighted averages.
The proposed method was used to determine the op-timum G value of a screen to be installed on a south-oriented office room in Stockholm. A parametric studywas then carried out to verify whether the method al-lowed to predict the optimum G value with sufficientaccuracy.
It was found that the method did predict the optimumG value both on an annual and monthly basis with anacceptable accuracy. The annual G value was predictedwith more accuracy using the solar heat gains (Qsun) asthe weighting factor while the monthly values were pre-dicted more accurately using the total energy use (Qtot) asweighting factor in the calculations. However, the dis-crepancies between predicted and simulated values werenot significant because both predicted and simulated Gvalues yielded approximately the same total energy use(less than 0.01% difference).
The proposed method is simple and could easily beimplemented in an energy simulation program as a diag-nosis tool to use prior to simulations. This would reducethe amount of simulations needed to determine an opti-mum shading device. The method can also be used toselect shading devices which have documented monthlyand annual G values. This is the case for some types ofawnings, overhangs, exterior venetian blinds and screens,which have been monitored by Wallentén (1999).
The method could be extended to include the lightingenergy use in the calculation of the optimum G value.Energy costs for lighting usually account for a large partof the total energy costs in office buildings (40% accord-ing to Slater, 1997) and the use of shading devices islikely to result in an increase in the use of artificial light-ing. This aspect should thus be considered.
Finally, the method could also be supplemented withalgorithms that calculate the optimum geometry of theshading device as a function of the ideal G value. In thispaper, a simple screen was assumed since it produces aconstant shading pattern on the window. In a real build-ing, other types of shading devices like awnings or over-hangs might be preferred because they allow a view outthrough the window. Another advantage of using thesetypes of devices is that their geometry can be defined sothat their G value closely matches the monthly and hourlyG values defined by using the method.
ACKNOWLEDGEMENTS
The author is grateful to Dr Petter Wallentén and HelenaBülow-Hübe for help and contributing discussions and toDr Maria Wall for reviewing the final draft. Funding wasprovided by Lund University and by the Social Sciencesand Humanities Research Council of Canada.
REFERENCES
Arumi-Noé F. (1979). The DEROB System Volume II.Explanatory Notes and Theory. Numerical SimulationLaboratory, University of Texas, Austin (Texas).
Dubois M.-C. (1999). The design of seasonal awnings forlow cooling and heating loads in offices. In Proceed-ings of the 5th Symposium on Building Physics in theNordic Countries, 24-26 August, Göteborg (Sweden),pp. 505-512, Chalmers University of Technology,Göteborg.
Dubois M.-C. (1997). Solar shading and building energyuse: A literature review, part I. Report TABK—97/3049. Lund Inst. of Technology, Dept. of BuildingScience, Lund (Sweden).
Karlsson J., Rubin M. and Roos A. (1999). Models forthe Angle Dependent Optical Properties of the TotalSolar Energy Transmittance. Communicated directly tothe author.
Kvist H. (1998). DEROB-LTH for MS Windows. V-98.04.User Manual. Lund Inst. of Technology, Dept. ofBuilding Science, Lund (Sweden).
Källblad K. (1999). A Method to Estimate the Shading ofSolar Radiation: Theory and Implementation in a Com-puter Program. In Proceedings of the 6th InternationalIBPSA Conference: Building Simulation ’99, 13-15September, Kyoto, pp. 595-601, International BuildingPerformance Simulation Association.
Källblad K. and Wallentén P. (1999). Beräknings-modeller. In Solskydd i byggnader (Solar shading in

Solar Shading for Low Energy Use and Daylight Quality in Offices
52
buildings), Wall M. and Fredlund B. (eds). ReportTABK—99/3057, pp 67-94, Lund Inst. of Technology,Dept. of Building Science, Lund (Sweden).
Littlefair P. (1999). Solar shading of buildings. BuildingResearch Establishment (BRE). CRC ltd, London.
Slater A. I. (1997). Energy Efficient Lighting in Build-ings. In Proceedings of the Right Light 4 Conference,19-21 November, Copenhagen, p. 7, Vol. 1.
Wallentén P. (1999). Egenskaper hos sol-skyddgeneraliserade mätresultat. In Solskydd i bygg-nader (Solar shading in buildings), Wall M. and Fred-lund B. (eds). Report TABK—99/3057, pp 97-121,Lund Inst. of Technology, Dept. of Building Science,Lund (Sweden).

Article II
53
Article II

Solar Shading for Low Energy Use and Daylight Quality in Offices
54

Article II
55
A SIMPLE CHART TO DESIGN SHADING DEVICESCONSIDERING THE WINDOW SOLAR ANGLE DEPENDENT PROPERTIES
Marie-Claude DuboisDepartment of Construction & Architecture, Lund University
P.O. Box 118, 221 00 Lund, Sweden, tel. +46 46 222 7347, fax +46 46 222 4719, [email protected]
Abstract – A simple chart useful to design shading devices is presented. The chart, which is complementaryto existing solar path diagrams, provides additional information about the window’s solar angle dependentproperties and its geometrical relationship to the sunbeam. This information allows to make meaningfulhypotheses about the optimum geometry of the shading device. Two examples are provided where the chartis used to define the geometry of an awning on a south- and west-oriented office room in Stockholm. Theexamples show that the chart is useful to restrict the early design hypotheses and identify the optimumawning geometry at an early design stage.
1. INTRODUCTION
Solar shading devices can substantially reduce thecooling load of buildings. According to a recent literaturereview (Dubois, 1997), this reduction is between 23-89%depending on the type of shading device used, thebuilding orientation, the climate, etc. In order to save energy, shading devices should beintegrated to a building’s facade at an early design stage.This can be achieved using ”traditional” design tools likesolar path diagrams and shading masks or specialcomputer programs that automatically ”generate” theoptimum shading device geometry as a function of a setof input parameters (e.g. orientation, latitude).
1.1 Traditional toolsAlthough there exist numerous design methods based onsolar path diagrams (Dourgnon, 1965; Van den Eijk,1965; Markus & Morris, 1980; Etzion, 1992), theOlgyays’ (1957) and Mazria’s (1979) methods areprobably the most popular ones. In both the Olgyays andMazria’s design methods the building’s overheatingperiod is plotted onto the solar path diagram and ashading ”mask” that avoids direct sun during theoverheating period is defined. The main difference between the two methods is thekind of solar projection used. The Olgyays used aprojection of the sun onto a horizontal plane parallel tothe ground (Fig. 1) while Mazria used a projection onto avertical cylinder (with the long axis perpendicular to theground). By “unfolding” the cylinder, a two-dimensionaldiagram is obtained, where the abscissa and ordinaterepresent the solar azimuths and altitudes and where thecurves radiating away from the south represent the solartime (Fig. 2). This projection is advantageous for studiesof facade elements like windows and shading devicessince the sun’s projection is viewed “parallel” to thebuilding facade.
Traditional methods have some limitations: theiraccuracy is limited by the size of the charts and they yieldshading devices that are larger than necessary since they
are only capable of returning a “binary” answer (Etzion,1992). This is due to the fact that they indicate an“unshaded” condition even when a small area of theopening is lit by direct sun and a “shaded” condition therest of the time.
Fig. 1 Solar path diagram used by the Olgyays (1957).
Fig. 2 Solar path diagram used by Mazria (1979).

Solar Shading for Low Energy Use and Daylight Quality in Offices
56
Despite these limitations, traditional methods are stillused and taught in many schools of architecture and anumber of computer programs based on these methodshave been developed recently (Bouchlaghem, 1996; Ohand Haberl, 1997; Kensek et al., 1996). Methods based oncharts have the advantage of being simple andstraightforward: they show the relationship between thesolar path, the overheating period and the required shadein one single picture.
1.2 Computer toolsMany computer design tools for shading have beendeveloped during the past decades. These tools are inessence similar to traditional tools but have the mainadvantage that the shading device geometry isautomatically ”generated” by the program.
One of the first computer design tools for shading wasproposed by Shaviv (1975, 1984). This program indicatesthe shape of the shading device that prevents directradiation from reaching the window during each month.A similar program, which provides one annual solutionby subtracting a summer from a winter design day funnel,was later proposed by Arumi-Noé (1996). More recently,a program combining simulation, generation andoptimisation routines was developed by Kabre (1999).This program provides a 3D image of the optimumexterior fixed shading device, which is determined byweighting the ”shading” versus ”heating” efficiency ofthe window-shade combination. The optimum solution isdetermined from the results of energy simulations and aPareto optimisation.
1.3 Limitations of the existing toolsOne limitation of most existing design tools is that theyare based on the incident (not transmitted) solar radiationon the window. The only one who considered the windowtransmission and absorption properties is Petherbridge(1965). However, he used horizontal projections of thesolar path (similar to the Olgyays) and presented thewindow transmittance and absorptance separately, whichmake it difficult to use his charts in practice. Kabre(1999) also considered the window transmittance.However, his program takes this parameter intoconsideration in the simulation routine after the shadingdevices have been generated based on the incident sun.
Considering incident instead of transmitted radiationis equivalent to attributing an equal “weight” to all anglesof incidence. This will invariably yield shading deviceslarger than necessary since all angles of incidence mustbe covered. In reality, incidence angles close to thewindow normal usually have more impact on thebuilding’s annual energy use since a surfaceperpendicular to the sun receives the maximum amountof solar radiation and since the window total solartransmittance is maximum around the window normal.
Oversized shading devices are less economical andreduce both the view out through the window and the
daylighting in the building. It is well known that areduction in interior daylighting levels usually yields anincrease in the use of artificial lighting, which results inan increase in the cooling load to remove the internal heatgains from lights.
In this article, a simple chart relating the solar path tothe window solar angle dependent properties is presented.The chart, which is based on Mazria’s (1979) solar pathprojections, can be used at an early design stage toidentify the hours during the day and year when solarradiation is likely to cause overheating in the building.
This article presents the new chart and shows how itcan be used in practice by providing an example wherethe geometry of an awning is defined for a south- andwest-oriented office room in Stockholm (Sweden). In thisexample, the awning’s geometry is further studied usingdynamic energy simulations. The aim of the simulationsis to identify with precision the optimum awninggeometry and compare it with the geometry suggested bythe chart.
2. METHOD
This section is divided in two parts. The first partexplains how the new chart was developed while thesecond part describes the method and simulations used inthe example.
2.1 A new chart for the design of shading devicesAlthough both direct and diffuse solar radiation areresponsible for solar heat gains through windows, in mostcold and temperate climates, it is preferable to defineshading devices according to direct radiation since1) diffuse radiation is desirable most of time as a source
of daylighting in the building;2) direct radiation is dominant on clear days when
shading is needed.The chart proposed in this paper is therefore based ondirect solar radiation. However, in more extreme climates(hot humid), shading from diffuse radiation might also bedesirable and should be considered in the design ofshading devices. The diffuse component should also beconsidered when the shading device is mainly used forglare control.
When direct solar radiation hits a window, two factorscontribute in reducing the amount of energy admitted intothe building: the incidence angle between the sun beamand the window surface and the window total solarenergy transmittance (also called the g-value or solar heatgain coefficient), which is also a solar angle dependentproperty.
2.1.1 The incidence angleA surface perpendicular to the sun beam receives thegreatest amount of energy. As the sun beam moves awayfrom the window normal, the energy received by thesurface decreases. The intensity (Iθ) of solar radiation on

Article II
57
the window surface can be determined from the intensityof the direct normal radiation (IDN) according to:
Iθ = IDN cosθ (1)
where θ is the angle of incidence of the sun beam. Sincethe relationship between Iθ and IDN is a constant (kθ) for agiven angle of incidence (θ), the following can bewritten:
kθ = Iθ / IDN = cosθ (2)
Note that this relationship holds for all directions withrespect to the window surface.
2.1.2 The window g-valueThe window g-value indicates which portion of theincident solar radiation is absorbed and transmitted by thewindow and becomes heat in the building. It includesboth the primary and secondary transmittance i.e. theenergy absorbed by the glazing and reradiated to thebuilding interior.
The g-value varies according to the sun’s incidenceangle with respect to the window normal. For mostordinary glazings, the transmittance is maximum aroundthe normal, starts declining at 50° and reaches aminimum at 90° as shown in Fig. 3.
0.0
0.1
0.2
0.3
0.4
0.5
0.6
0.7
0.8
0.9
1.0
0 10 20 30 40 50 60 70 80 90
Angle of incidence (o)
1-pane2-pane3-pane
g-value
Fig. 3 The g-value (gθ) for single-, double- and triple-pane clear glass windows as a function of the angle ofincidence (calculated according to Karlsson & Roos,1999).
The solar angle dependent g-value can be imagined asa cone valid for each point of the window (Fig. 4). Sincefor each cone or angle of incidence (θ) corresponds aspecific g-value (gθ), the set of solar altitudes (ALT) andazimuths (AZ) corresponding to a specific gθ can becalculated using the fundamental geometricalrelationship:
cos(ALT) ⋅ cos(AZ - φ) = cos(θ) (3)
where φ is the orientation of the facade (or facadenormal) from the same reference direction as the solarazimuth (AZ). Note that the sun is behind the facadewhen |AZ - φ| > 90.
The set of solar altitudes and azimuths obtained foreach specific gθ can be plotted according to Mazria’ssolar projection and superimposed on the solar pathdiagram. This superposition is shown in Fig. 5 for avertical, south-oriented, triple-pane, clear glass window.Fig. 5 shows a set of concentric, distorted circles, wherethe centre represents any point at the surface of thewindow. If the g-value is normalised using g=gθ/g0, theinner circle delimits the solar positions for which g > 0.9;the second circle includes g > 0.8; the third circle is for g> 0.7, etc.
. window
cone where g-value is reduced by 10% from g0. .
cone of highest g-value valid for each point of the window. .
Fig. 4 The window’s solar angle dependent g-value(gθ) can be imagined as a series of cones valid for eachpoint of the window surface.
2.1.3 A cosine weighted g-valueFor convenience, the k- and g-values introduced in theprevious sections can be combined into one single value,which we will call the Gcos-value or cosine weightedsolar angle-dependent g-value. The Gcos-value (Gcosθ) atincidence angle θ can be calculated as follows:
Gcosθ = kθ ⋅ gθ (4)
Since Gcosθ is a constant for a given angle ofincidence (θ), it can thus also be imagined as a series ofcones pointing towards the window. The projection ofthese cones onto Mazria’s solar path diagram yields Fig.6. Assuming that the Gcos-value is normalised usingGcos=Gcosθ/Gcos0, the inner circle encompasses theregion of maximum values (Gcos > 0.9); the next circle isfor Gcos > 0.8; the third circle is for Gcos > 0.7, etc.

Solar Shading for Low Energy Use and Daylight Quality in Offices
58
���
���
���
���
���
��
�
�
��
��
��
��
��
����� ��� ��� ��� ��� ��� �� � � �� �� �� �� �� �� �
�� ��������
��� ��������
����
56
78
910
11 12 1314
1516
1718
19
g > 0.9
0.8
0.7
0.6
0.5
0.4 0.3
0.2 0.1
June 21
May 21
Apr 21
Mar 21
Feb 21
Jan 21
Dec 21
July 21Aug 21Sept 21
Oct 21Nov 21
Fig. 5 Chart showing the normalised g-values for a vertical, south-oriented, triple-pane, clear glass window. The chartis superimposed on the solar path diagram for latitude 59°N.
���
���
���
���
���
��
�
�
��
��
��
��
��
����� ��� ��� ��� ��� ��� �� � � �� �� �� �� �� �� �
�� ��������
��� ��������
����
56
78
910
11 12 1314
1516
1718
19
Gcos > 0.9
0.8
0.7
0.6 0.5 0.4 0.3 0.2 0.1
June 21
May 21
Apr 21
Mar 21
Feb 21
Jan 21
Dec 21
July 21Aug 21
Sept 21Oct 21
Nov 21
Fig. 6 Chart showing the normalised Gcos-values for a vertical, south-oriented, triple-pane, clear glass window. Thechart is superimposed on the solar path diagram for latitude 59°N.
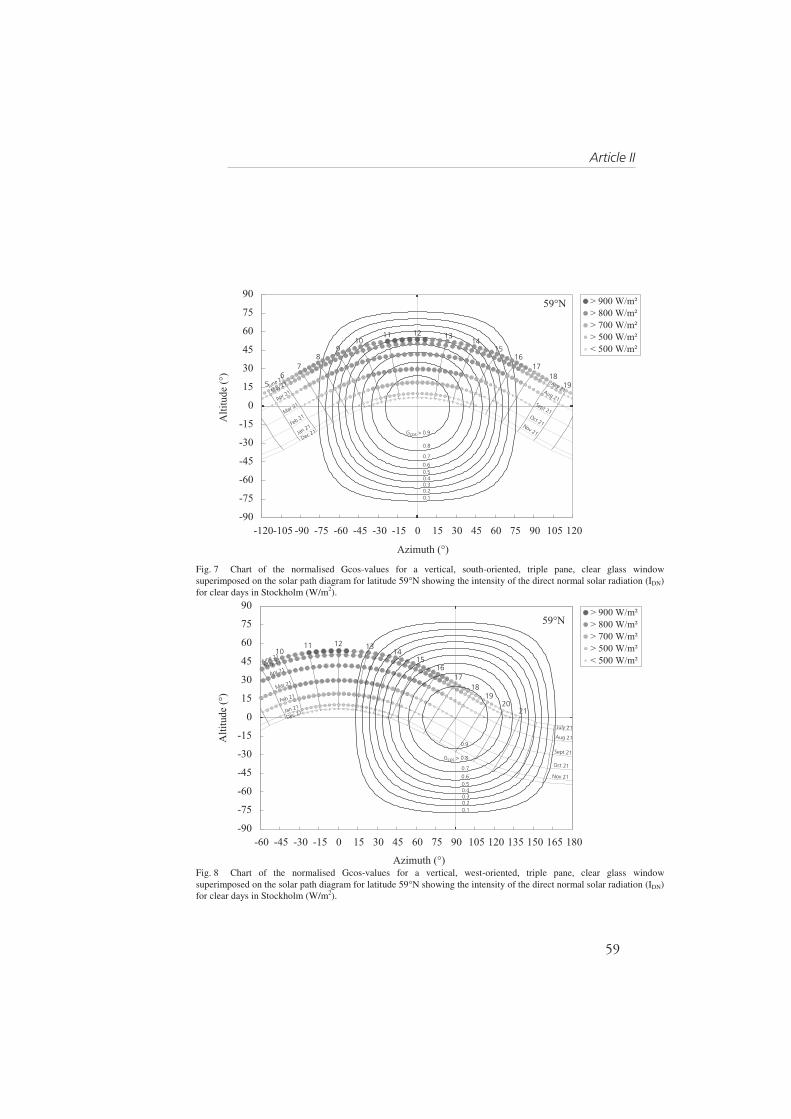
Article II
59
���
���
���
���
���
��
�
�
��
��
��
��
��
����� ��� ��� ��� ��� ��� �� � � �� �� �� �� �� �� �
�� ��������
��� ��������
���� ��������������������������������������������������
56
78
910
11 12 1314
1516
1718
19June 21
May 21
Apr 21
Mar 21
Feb 21
Jan 21
Dec 21
Aug 21Sept 21
Oct 21Nov 21
July 21
Gcos > 0.9
0.8
0.7
0.6 0.5 0.4 0.3 0.2 0.1
Fig. 7 Chart of the normalised Gcos-values for a vertical, south-oriented, triple pane, clear glass windowsuperimposed on the solar path diagram for latitude 59°N showing the intensity of the direct normal solar radiation (IDN)for clear days in Stockholm (W/m2).
���
���
���
���
���
��
�
�
��
��
��
��
��
��� ��� ��� �� � � �� �� �� �� �� �� � �� �� �� ��
�� ��������
��� ��������
����
1011 12 13
1415
1617
1819
2021
0.7
0.6 0.5 0.4 0.3 0.2 0.1
Aug 21
Sept 21
Oct 21
Nov 21
June 21
May 21
Apr 21
Mar 21
Feb 21
Jan 21
Dec 21
July 21
0.9
��������������������������������������������������
Gcos > 0.8
Fig. 8 Chart of the normalised Gcos-values for a vertical, west-oriented, triple pane, clear glass windowsuperimposed on the solar path diagram for latitude 59°N showing the intensity of the direct normal solar radiation (IDN)for clear days in Stockholm (W/m2).

Solar Shading for Low Energy Use and Daylight Quality in Offices
60
2.1.4 The intensity of solar radiationThe intensity of solar radiation varies throughout the dayand the year. This parameter can also be included in theprevious figures using points of different sizes as shownin Fig. 7-8. These figures show the relationship betweenthe solar position (and time), the intensity of the directnormal radiation on clear days (calculated according toBrown & Isfält, 1969) and the window Gcos-values. Fig.7 shows the correct superposition for a vertical, south-oriented, triple pane, clear glass window. Fig. 8 is for thesame window oriented towards the west direction.
These charts can be used to calculate the solar gain(Qsol) in the building due to direct solar radiation using:
Qsol = IDN ⋅ Gcos ⋅ A (5)
where A is the window area.Note that since the intensity of the direct normal solar
radiation is not symmetrical about the solstice, each pointin Fig. 7-8 is an average of the values for twosymmetrical months. A more precise approach wouldconsist of having two charts, one for each half year.
2.2 Examples: Design of an awningIn order to show how the charts introduced in theprevious sections can be used in practice, we present twospecific examples where an awning must be defined for asouth- and west-oriented office room in Stockholm(latitude 59.35°N, longitude 18.07°E). In these examples,the awning is to be used continuously only during thecooling season, which is from early May to the end ofSeptember according to a previous analysis of annualcooling loads for the same room (Dubois, 1999). A darkblue (85% absorpt., 1% transm.) awning with a slope of30° with respect to the building facade is assumed forboth orientations.
The following procedure was used to determine theoptimum awning geometry:
Step 1 Charts were produced for the relevant latitude(59.35°N) and window type (triple pane, clearglass).
Step 2 From the charts produced in step 1, the criticalsolar angles were identified and some shadinghypotheses were made.
Step 3 The shading device geometry was determinedfor each shading hypothesis identified in step 2.
Step 4 Energy simulations were carried out todetermine which of the shading hypothesesdefined in step 3 was optimum in terms ofannual energy use.
2.2.1 Energy simulationsThe energy simulation program Derob-LTH was used inthe examples to determine which of the shadinghypotheses was optimum in terms of annual energy use
(step 4). Derob-LTH, which is an acronym for DynamicEnergy Response of Buildings, originates from theUniversity of Texas (Arumi-Noé, 1979) but has beenunder continuous development at Lund University’sDepartment of Building Science (Kvist, 1998; Källblad,1999). The program uses hourly data for the exteriortemperature and solar radiation intensity and updates thesolar position four times every month. The window andshading models have the following characteristics:
• Coarse ray tracing and Fresnel calculation of the directradiation.
• View factor and Fresnel calculation of the diffuseradiation.
• One thermal node for each pane.• Shading device transmits and reflects diffusely.• One thermal node approximating the thermal balance
for all shading devices.• Long wave sky radiation included.
The shading and window models in Derob-LTH havebeen validated experimentally using two full-scaleguarded hot boxes exposed to the natural climate. Acomparison between measured and simulated energy for adark and a light awning has shown a maximum error of3% with respect to the incident solar radiation (Källblad& Wallentén, 1999).
2.2.2 Office roomThe Stockholm office was a 2.9-m wide by 4.2-m deeprectangular room (Fig. 9). The room had a 1.8-m wide by1.3-m high, triple-pane, clear glass window with a U-valueof 1.88 W/m2K and a normal g-value (g0) of 0.67.
2.9 m
4.2 m
SOUTH
EAST
awning
1.0
m2.
7 m
glazing wall facing the exterior
(heat transfer)
Adiabatic wall(no heat transfer)
Fig. 9 Office room.
The exterior wall was a standard construction with respectto Swedish norms with a U-value of 0.18 W/m2K. Theroom was assumed to be surrounded by office space at the

Article II
61
same temperature. Thus, all “interior” walls were modelledas adiabatic surfaces. A free horizon with no obstructionand a ground reflectance of 20% were assumed.
The room had constant infiltration (0.1 ach) andventilation (10 l/s) rates and internal heat gains from oneoccupant (90 W), a computer and monitor (120 W) andenergy-efficient lighting (10 W/m2). These gains were onlyassumed during weekdays at normal office hours (8-17).The temperature set points were 20°C (heating) or 24°C(cooling) during work hours and 18°C (heating) or 28°C(cooling) the rest of the time.
3. RESULTS
3.1 Optimum awning geometry, south orientationThe solar path diagram for Stockholm and the chart ofGcos-values for a south-oriented, triple-pane, clear glasswindow were produced and are shown in Fig. 7. Thisfigure shows that September is the month with the lowestsolar altitudes among the cooling months (May, June,July, August, September). It is also the month when thesolar path is within a region of high Gcos-values (> 0.8)around noon when the intensity of solar radiation is high(> 800 W/m2). For other months with high solar radiationintensity (May, June and July), the Gcos-value is neverhigher than 0.6, which means that the window itselfreduces the intensity of the incident radiation by at least60% (100(1-Gcos⋅g0)) during these months.
While the awning’s length can be defined accordingto the solar altitude in September, its width will dependon the required period of shading during the day. Thebuilding is only occupied from 08.00-17.00 and thisperiod can thus be accepted as the maximum period ofshading required. Since the work hours are asymmetricalwith respect to the solar path1, and since a symmetricalawning (about the window) is assumed, 17.00 hoursbecomes the design hour. The minimum shading period is11.00-13.00 hours, which falls within the region ofhighest Gcos-values and high solar radiation intensity.
Considering the solar path and awning symmetryabout the window, there are thus 5 shading schemes to beconsidered: 07.00-17.00, 08.00-16.00, 09.00-15.00,10.00-14.00 and 11.00-13.00 hours. The awning’sdimensions (assuming a slope of 30°) were calculated forthese 5 shading schemes and are presented in Table 1.
Table 1 shows that the definition of the shadingperiod over one day significantly affects the size of theawning. Shading schemes 1-3 yield unrealistically wideawnings. Since the Gcos-values and the intensity of solarradiation are lower before 10.00 hours and after 14.00hours (Fig. 7), and since partial shading will be providedeven for hours falling outside each shading scheme,shading schemes 1-3 can be eliminated. The design
1 In this study, daylight savings time was not used.
problem then consists of choosing between twoalternatives: shading schemes 4 or 5.
Table 1 Awning dimensions according to 5 shadingschemes, south orientation.
Shadingscheme
Shading period,Sept. 21 (hours)
LengthL (m)
WidthW (m)
1 07.00-17.00 1.13 6.652 08.00-16.00 1.12 4.053 09.00-15.00 1.12 3.104 10.00-14.00 1.12 2.555 11.00-13.00 1.12 2.15
The impact on energy use of the shading schemesdefined using the chart was studied using energysimulations. Although only 2 schemes were proposed, atotal of 8 simulations were carried out in order to showthe impact of various alternatives. The awning’s lengthwas 1.12 m for all the cases studied (from Table 1) andthe width was varied from 0 to 5 m. The incrementalannual energy use for cooling and heating the room aswell as the annual peak heating and cooling loads arepresented in Fig. 10.
-20
-15
-10
-5
0
5
10
0.0 0.5 1.0 1.5 2.0 2.5 3.0 3.5 4.0 4.5 5.0Awning’s width (m)
HeatingAnnualCooling
Incr. annual energy (kWh/m2yr)
a)
0
10
20
30
40
50
60
70Peak HeatingPeak Cooling
Peak load (W/m2)
0.0 0.90 1.80 2.15 2.55 3.10 4.05 5.00Awning’s width (m)
b)Fig. 10 a) Incremental annual energy use (kWh/m2yr)and b) peak heating and cooling loads (W/m2) for thesouth-oriented office room.

Solar Shading for Low Energy Use and Daylight Quality in Offices
62
Fig. 10a shows that the annual cooling demanddecreased almost linearly as the awning’s width increasedfrom 0 to 1.8 m. However, little additional coolingsavings were obtained over 2.15 m. The curve stabilisedinto a straight horizontal line from this point. The sameoccurred with heating loads although the increase in theheating demand was not as steep as the reduction incooling between 0 and 1.8 m.
Fig. 10b shows that the peak cooling demand wasreduced by almost 50% with the 1.8-m wide awning butthat no significant reductions occurred over 1.8 m. Thepeak heating load was unaffected by the awning’s size,which is normal since the highest heating loads occur atnight and outside the cooling season.
According to Fig. 10, the optimal awning dimensionwas thus around 2 m considering the cooling demand andannual energy use2. This solution corresponds to shadingscheme 5, which was the one covering only the region ofhighest Gcos-values (> 0.8).
3.3 Optimum awning geometry, west orientationFig. 8 shows the correct superposition of the Gcos-valuesand the solar path diagram for the west orientation. Thisfigure shows that:1) September has the lowest solar altitudes among the
overheating months;2) the sun is within the region of highest Gcos-values at
the end of the day i.e. around 17.00 hours but theintensity of solar radiation is lower at this time;
3) the period 12.00-13.00 hours can be neglected sincethe sun is within a region of low Gcos-values (< 0.1).
As for the south orientation, 5 shading schemesremain after the periods before 13.00 hours and after17.00 hours are eliminated. Table 2 shows the awningdimensions for these 5 shading schemes assuming anawning’s slope of 30° for all the cases. Note that theawning’s length was determined according to the solaraltitude at 17.00 hours while the width was determinedaccording to the beginning of the shading period.
Table 2 Awning dimensions according to 5 shadingschemes, west orientation.
Shadingscheme
Shading period,Sept. 21 (hours)
LengthL (m)
WidthW (m)
1 13.00-17.00 1.39 4.112 14.00-17.00 1.39 3.293 15.00-17.00 1.39 2.804 16.00-17.00 1.39 2.445 17.00-17.00 1.39 2.12
Table 2 shows that shading schemes 1-2 yieldunrealistically wide awnings. Since partial shading willbe provided even for hours falling outside each shading
2 Heating and cooling loads were added up in a 1:1 ratio.
scheme and since shading schemes 1-2 cover Gcos-valueslower than 0.7 (which means that the window itself willreduce the incident radiation by at least 53%), theseshading schemes can be eliminated. The design problemthen consists of choosing between three alternatives:shading schemes 3, 4 or 5.
The impact on energy use of these shading schemeswas studied using computer simulations. The awning’slength was 1.39 m (from Table 2) for all the cases and thewidth was varied from 0 to 4.11 m. The incrementalannual energy use for cooling and heating the room aswell as the annual peak heating and cooling loads arepresented in Fig. 11.
-20
-15
-10
-5
0
5
10
0.0 0.5 1.0 1.5 2.0 2.5 3.0 3.5 4.0Awning’s width (m)
HeatingAnnualCooling
Incr. annual energy (kWh/m2yr)
a)
0
10
20
30
40
50
60
70
80Peak HeatingPeak Cooling
Peak load (W/m2)
Awning’s width (m)0.90 1.80 2.12 2.44 2.80 3.29 4.110.0
b)Fig. 11 a) Incremental annual energy use (kWh/m2yr)and b) peak heating and cooling loads (W/m2) for thewest-oriented office room.
Fig. 11a shows that the cooling demand decreased asthe awning’s width increased from 0 to 2.12 m. However,little additional cooling savings were obtained over 2.12m. As for the south orientation, the heating loadsincreased linearly as the awning’s width increased from 0to 1.8 m but little change occurred over 2.12 m.
As for the south orientation, the peak cooling load(Fig 11b) was reduced by almost 50% when the awning’swidth increased from 0 to 1.8 m but increasing the widthover 1.8 m had little effect on the peak cooling load. The

Article II
63
peak heating load was unaffected by an increase in theawning’s width.
Fig 11 thus shows that the optimum width was around2 m, as for the south orientation. This corresponds toshading scheme 5, which only provides complete shadingat 17.00 hours. Note that it is the time when the sun iswithin the region of highest Gcos-values (> 0.9).
4. DISCUSSION
The example shows that the chart provides meaningfulinformation about the window properties. Thisinformation can be used to restrict the early designhypotheses for the shading device. In this case, manyshading schemes were included in the analysis althoughsome of them covered regions with low Gcos-values.However, the energy simulations indicated that theoptimum awning dimensions corresponded to the lessstrict shading scheme i.e. the one that only coveredregions with the highest Gcos-values. This suggests thatthe initial shading hypotheses could have been even morerestrictive.
It was shown that relatively narrow awnings (∼ 2 m)could provide efficient shading both for a south- and awest-oriented office in Stockholm. This indicates thatsolar radiation coming from the sides of the awning has arelatively negligible importance with respect to annualenergy use. The most important is to shade the windowwhen the sun is within a region of high Gcos-values i.e.around the window normal.
However, since narrow awnings will let the directradiation hit the window at certain hours, it is essential toprovide the building occupant with an extra shadingdevice like a curtain, an interior screen or a venetianblind. A shading device will in any case be necessaryduring the winter to avoid glare problems. This extrashading device should be manually adjustable andpreferably located on the interior side of the window.Interior shading devices have a poor shading coefficient,which means that they will only affect the solar heatgains in a negligible way during the heating season.Littlefair (1999) also suggested to use a hybridapproachwith an exterior device to control summerheat and internal blinds for glarein buildings whereboth heat and glare control are important. He observedthat while external shading systems are very efficient atpreventing overheating, only sophisticated externallouver systems are really effective at controlling bothsolar gains and sun glare.
5. CONCLUSIONS
A simple chart to define the optimum geometry ofshading devices was presented. The chart, which iscomplementary to Mazria’s (1979) solar path diagram,provides additional information about the window solar
angle dependent properties and the window’s geometricalrelationship to the sun beam. This additional informationallows to identify the periods when solar radiation is mostlikely to cause overheating in the building
The main advantage of the proposed chart is itssimplicity. One figure shows the relationship between thesolar position, the intensity of the direct normal radiationand the window angular properties.
Another advantage of the chart is its generality. For agiven window type, the shape of the overlay describingthe window properties (Gcos-values) is the same for anyorientation or latitude.
Two examples were provided where the chart wasused to define the geometry of an awning installed on asouth- and west-oriented office room in Stockholm. Thedimensions of the awning obtained using the chart andfurther specified with the energy simulations were smallcompared to the ones obtained if we had only consideredthe incident sun and the hours of occupation of thebuilding. Such an approach yielded an awning three timeswider than necessary on the south facade and double aswide as necessary on the west facade.
This study shows that, even at an early design stageand with simple tools, it is possible to define the optimumgeometry of a shading device quite accurately just byconsidering the window properties. This will permit torestrict the number of iterations in the computersimulations used at a later stage in the design process.When computer simulations are not available, theproposed method will avoid oversizing shading devices,which is not economical, reduces daylighting and blocksa larger portion of the window view.
The proposed chart is solely based on considerationsof energy use for heating and cooling buildings. In a realcontext, it is paramount to also consider the relationshipbetween the shading device, daylighting and visualcomfort.
ACKNOWLEDGEMENTS
The author expresses her gratitude to Dr Petter Wallenténand professor Björn Karlsson for contributing discussionsand to Dr Maria Wall and Helena Bülow-Hübe forreviewing the final draft. Funding was provided by LundUniversity and by the Social Sciences and HumanitiesResearch Council of Canada.
REFERENCES
Arumi-Noé F. (1996). Algorithm for the geometricconstruction of an optimum shading device. Automationin Construction. 5, 211-217.
Arumi-Noé F. (1979). The DEROB System Volume II.Explanatory Notes and Theory. Numerical SimulationLaboratory, University of Texas, Austin (Texas).

Solar Shading for Low Energy Use and Daylight Quality in Offices
64
Bouchlaghem N. M. (1996). A computer model for thedesign of window shading devices. Building Researchand Information. 24(2), 104-107.
Brown G. and Isfält E. (1969). Instrålning från sol ochhimmel i Sverige under klara dagar. (Solar and skyradiation in Sweden under clear days). Report R19/69.Byggforskningsrådet, Stockholm.
Dourgnon J. (1965). La géométrie de l’ensoleilllement. InProceedings of the CIE Intersessional Conference:Sunlight in Buildings, 5-9 April, Newcastle-upon-Tyne,Hopkinson R. G. (Ed), pp 217-230.
Dubois M.-C. (1999). The design of seasonal awnings forlow cooling and heating loads in offices. InProceedings of the 5th Symposium on Building Physicsin the Nordic Countries, 24-26 August, Göteborg(Sweden), pp. 505-512, Chalmers University ofTechnology, Göteborg.
Dubois M.-C. (1997). Solar shading and building energyuse: A literature review, part I. Report TABK—97/3049. Lund Inst. of Technology, Dept. of BuildingScience, Lund (Sweden).
Etzion Y. (1992). An improved solar shading design tool.Building and Environment. 27(3), 297-303.
Etzion Y. (1985). Design of shading devices using a one-point method. A technical communication. Energy andBuildings. 8, 287-290.
Kabre C. (1999). WINSHADE: A computer design toolfor solar control. Building and Environment. 34, 263-274.
Karlsson J. and Roos A. (1999). Modelling the angularbehaviour of the total solar energy transmittance ofwindows. submitted to Solar Energy. December 1999.
Kensek K., Noble D., Schiler M. and Setiadarma E.(1996). Shading mask: A teaching tool for sun shadingdevices. Automation in Construction. 5, 219-231.
Kvist H. (1998). DEROB-LTH for MS Windows. V-98.04.User Manual. Lund Inst. of Technology, Dept. ofBuilding Science, Lund (Sweden).
Källblad K. (1999). A Method to Estimate the Shading ofSolar Radiation: Theory and Implementation in aComputer Program. In Proceedings of the 6thInternational IBPSA Conference: Building Simulation’99, 13-15 September, Kyoto, pp. 595-601,International Building Performance SimulationAssociation.
Littlefair P. (1999). Solar shading of buildings. BuildingResearch Establishment (BRE). CRC ltd, London.
Oh J. K. W. and Haberl J. S. (1997). New educationalsoftware for teaching the sunpath diagram and shadingmask protractor. In Proceedings of the 5th InternationalIBPSA Conference: Building Simulation ’97, 8-10Sept., Prag, Vol III-9.
Olgyay A. and Olgyay V. (1957). Solar control andshading devices. Princeton University Press, NewJersey.
Markus T. A. and Morris E. N. (1980). Buildings,Climate and Energy. Pitman, London.
Mazria E. (1979). The Passive Solar Energy Book.Rodale Press, Emmaus, Pa.
Petherbridge P. (1965). Sunpath diagrams and overlaysfor solar heat gain calculations. Building ResearchStation Current Paper. 39/65.
Shaviv E. (1984). A design tool for determining the formof fixed and movable sunshades. ASHRAETransactions. 90 AT-84-18 (4), 948-961.
Shaviv E. (1975). A method for the design of fixedexternal sun-shades. Build. International. 8, 121-150.
Van den Eijk J. (1965). Instrumentation for solar studies.Proceedings of the CIE Intersessional Conference:Sunlight in Buildings, 5-9 April, Newcastle-upon-Tyne,Hopkinson R. G. (Ed), pp. 251-264.
Källblad K. and Wallentén P. (1999). Beräknings-modeller. In Solskydd i byggnader (Solar shading inbuildings), Wall M. and Fredlund B. (eds). ReportTABK—99/3057, pp 67-94, Lund Inst. of Technology,Dept. of Building Science, Lund (Sweden).

Article III
65
Article III

Solar Shading for Low Energy Use and Daylight Quality in Offices
66

Article III
67
The Design of Seasonal Awningsfor Low Cooling and Heating Loads in Offices
Marie-Claude Dubois, M. Arch., Tech. Lic.*
1. INTRODUCTION
In cold climates, exterior shading devices can provide larger annual energy savings than tinted
and reflective glass since they can be used seasonally thus allowing for a passive utilisation of
solar gains during the winter (Dubois 1998). Awnings and similar types of shading devices are
of particular interest because they have a low shading coefficient since 1) they reject solar energy
before it reaches the building and 2) most of the heat absorbed in the shade is convected to the
outdoor air. Awnings also leave some part of the window view unobstructed, which is positive
both in terms of occupant satisfaction and daylighting availability. However, awnings are
particularly susceptible to mechanical failure and wind damage. Another problem is that little is
known about the relationships between energy use and an awning’s geometry and attributes such
as colour (absorptance, reflectance) and transmittance. In an attempt to elucidate these complex
relationships, a parametric study of energy use for heating and cooling an office room located in
Stockholm was initiated as part of a large project on solar shading devices at Lund Institute of
Technology (Wall & Wallentén 1999).
2. METHOD
2.1 Computer program
The dynamic calculation program DEROB-LTH (Arumi-Noé 1979; Källblad 1999) was
used to predict the energy performance of the office room. DEROB-LTH uses a geometrical
description of the building where direct and diffuse solar radiation is distributed to various
surfaces in the space. The program has recently been supplemented with advanced algorithms
for windows and exterior shades (Källblad 1999). The new shading algorithm calculates the
impact of shades on both direct and diffuse solar radiation at each hour assuming that all
radiation incident on the shade is transmitted or reflected as pure diffuse radiation. The impact of
* Lund Institute of Technology, Dept. of Building Science, PO Box 118, SE-221 00,Lund, Sweden. Fax: +46 46 222 4719. E-mail: [email protected].

Solar Shading for Low Energy Use and Daylight Quality in Offices
68
the shade’s temperature on thermal radiation exchanges to the window is also taken into account
using a simplified calculation method (Wall & Wallentén 1999). This new shading module has
been validated experimentally using two full-scale guarded hot boxes exposed to the natural
climate. It was found that the program predicts the primary and total solar transmittance through
the window-shade system very accurately and that heating and cooling loads are predicted with a
maximum error of 10% with respect to the experiment (Wall & Wallentén 1999).
2.2 Office room
The south-orientated office room modeled in DEROB-LTH was a 2.9-m wide, 4.2-m
deep and 2.7-m high (interior dimension) rectangular space (Fig. 1). The triple-pane, clear glass
window, which measured 1.8 m (width) by 1.3 m (height), had a U-value of 1.88 W/m2K and a
shading coefficient of 0.76. A 0.1-m wide frame with a 0.1-m recess with respect to the glazing
was assumed. The exterior wall was a standard construction with respect to Swedish norms with
a U-value of 0.18 W/m2K. The room was assumed to be surrounded by office space at the same
temperature. Thus, all “interior” walls were modeled as adiabatic surfaces. A free horizon with
no obstruction and a ground reflectance of 20% were assumed.
2.9 m
4.2 m
SOUTH
EAST
awning
1.0
m2.
7 m
glazing wall facing the exterior
(heat transfer)
Adiabatic wall(no heat transfer)
Figure 1 Office room.
The room had constant infiltration (0.1 ach) and ventilation (10 L/s) rates and internal
heat gains from one occupant (90 W), a computer and monitor (120 W) and energy-efficient
lighting (10 W/m2). These gains were only assumed during weekdays and normal office hours

Article III
69
(8-17). The temperature set points were 20°C (heating) or 24°C (cooling) during work hours (8-
17) and 18°C (heating) or 28°C (cooling) the rest of the time and during weekends.
2.3 Base case awning
Initially, a dark blue awning with an arbitrary slope (θ = 30°) was built in the model. The
awning’s geometry was determined so that the window would be completely shaded during the
“typical” cooling season i.e. from May 1st to September 30th for incidence angles comprised
within an angle of 120° with respect to the glazing surface (in all directions) (Fig. 2). The
glazing transmittance drops dramatically beyond this angle making it unnecessary to provide
additional shading to the window. Note also that, during the cooling season, the sun’s azimuth
was within the 120° angle during most work hours. The initial awning’s length (L) and width
(W) were determined as a function of the lowest solar altitude (α) within the 120° angle during
the May-September period using the following relationships (see appendix):
( )[ ] θαθ cos60costantan
60cos3.1
°+⋅°⋅=L (1)
8.1)60tansin(2 +°⋅⋅= θLW (2)
Figure 2 Determination of the base case awning length (L) and width (W).
3. RESULTS
The plan of the parametric study and the results obtained are presented in Figure 3.
3.1 Seasonal Management Strategy
Keeping the base case attributes constant, the seasonal management strategy was
varied so that the awning was installed from the first to the last cooling day (Apr-Nov) and

Solar Shading for Low Energy Use and Daylight Quality in Offices
70
BASE AWNINGMay-SeptDark blueSlope = 30˚Length = 1.25 mWidth = 3.96 m
H: 95.9 kWh/m²yrC: 4.1 kWh/m²yr
LENGTH (m) H: C:0.00 -4.5 +16.40.33 -3.8 +9.00.65 -2.6 +3.30.98 -0.8 +0.61.25 +0.0 +0.01.50 +0.2 -0.2
MANAGEMENT H: C:No awn -4.5 +16.4Fixed +23.7 -0.7Apr-Nov +11.7 -0.7May-Sept +0.0 +0.0June-Sept -3.1 +3.1
WIDTH (m) H: C:1.80 -1.2 +1.02.10 -0.6 +0.42.43 -0.3 +0.22.75 -0.1 +0.13.08 -0.1 +0.03.40 +0.0 +0.03.73 +0.0 +0.03.96 +0.0 +0.0
SLOPE (˚) L (m) W (m) H: C:0 1.30 1.80 +0.3 -0.515 1.23 2.90 +0.2 -0.330 1.25 3.96 +0.0 +0.045 1.36 5.13 -0.2 +0.360 1.61 6.64 -0.4 +0.575 2.17 9.06 -0.5 +0.7
COLOUR T (%) A (%) H: C:Dark blue 1 85 +0.0 +0.0Dark green 3 90 -0.1 +0.1Theoretical 1 4 31 -0.5 +0.5Bright green 5 73 -0.4 +0.4Light grey 7 51 -0.6 +0.7Medium grey 8 59 -0.6 +0.7Dark red 13 45 -1.0 +1.3Bright yellow 19 20 -1.5 +2.1Theoretical 2 21 65 -1.4 +2.0White 23 10 -1.8 +2.6
Figure 3 Plan of the parametric study and incremental heating (H:) and cooling (C:) loads(kWh/m2yr) with respect to the base case awning. (Negative values mean thatenergy was saved). Heating and cooling loads are presented in a 1:1 ratio.
from the last to the first heating day (June-Sept) of the year. Figure 4a shows that the seasonal
schedule had a large impact on both annual energy use and peak loads for cooling.
The use of a seasonal awning reduced annual cooling by up to 17.1 kWh/m2yr (80%)
while using an awning year-round (Fixed) increased heating by 28.1 kWh/m2yr (31%) compared
to a case without awning (No awn). Figure 4a also shows that the use of a seasonal awning had a
large impact on the cooling peak load, which was reduced by up to 35 W/m2 (55%), and no
impact on heating peak loads (occurred at night). Overall, the May-Sept schedule was optimal: it
yielded one of the lowest annual heating and cooling loads combined with the lowest peak
cooling load.
3.2 Colour
It was found that the annual energy use varied mainly as a function of the awning’s
transmittance. Increasing the transmittance from 1-23% yielded a reduction in annual heating
loads by 1.8 kWh/m2yr (1.9%) and an increase in cooling by 2.6 kWh/m2yr (63%) (Fig. 4b).
Note that although this relative increase in cooling seems large, the absolute additional load was

Article III
71
marginal compared to the total annual energy use for the base case (100 kWh/m2yr). Since the
transmittance had a larger impact on cooling than on heating loads, dark-coloured awnings (low
transmittance) yielded a lower annual energy use than light-coloured ones. However, it should
be noted that the optimal solution depends on the relative efficiency of the cooling and heating
systems. (In this study, the space loads were not adjusted to a specific system’s efficiency i.e.
heating and cooling loads are in a 1:1 ratio). Note also that increasing the transmittance affected
cooling peak loads moderately (+7 W/m2, 23%) and had no effect on peak heating loads.
3.3 Width
Figure 4c shows that a reduction in the awning’s width from 3.96 m (base case) to 1.8 m
(window width) yielded a reduction in annual heating by 1.2 kWh/m2yr (1%) and an increase in
cooling by 1 kWh/m2yr (24%). Most of the impact of the width was between 1.8 m and 2.4 m
and, thus, negligible additional cooling savings were obtained with awnings larger than 2.4 m
(0.3 m on each side of the window). Note also that the awning’s width had a negligible impact
on peak cooling loads and no impact on peak heating loads.
3.4 Length
Figure 4d shows that a reduction in the awning’s length from 1.25 m (base case) to 0.33
m (25% of the base case) more than tripled the cooling demand (+9.0 kWh/m2yr) and reduced
the heating demand by 3.8 kWh/m2yr (4 %). The length thus generally had a larger impact on the
cooling than on the heating demand. Note also that above 0.9 m, the awning’s length had a
negligible impact on annual energy use. Figure 4d also shows that the awning’s length had a
large impact on the peak cooling load, which was reduced by around 32 W/m2 (52%) through an
increase in length from 0-1.5 m.
3.5 Slope
In order to study the impact of the slope on diffuse and reflected radiation (from the
backside of the awning), the awning’s length and width were adjusted for each slope angle
studied so that an equivalent shade from direct radiation was produced on the window. Figure 4e
shows that increasing the awning’s slope from 0-75° reduced the annual heating demand by 0.8
kWh/m2yr (0.8%) and increased the annual cooling demand by 1.2 kWh/m2yr (33%).
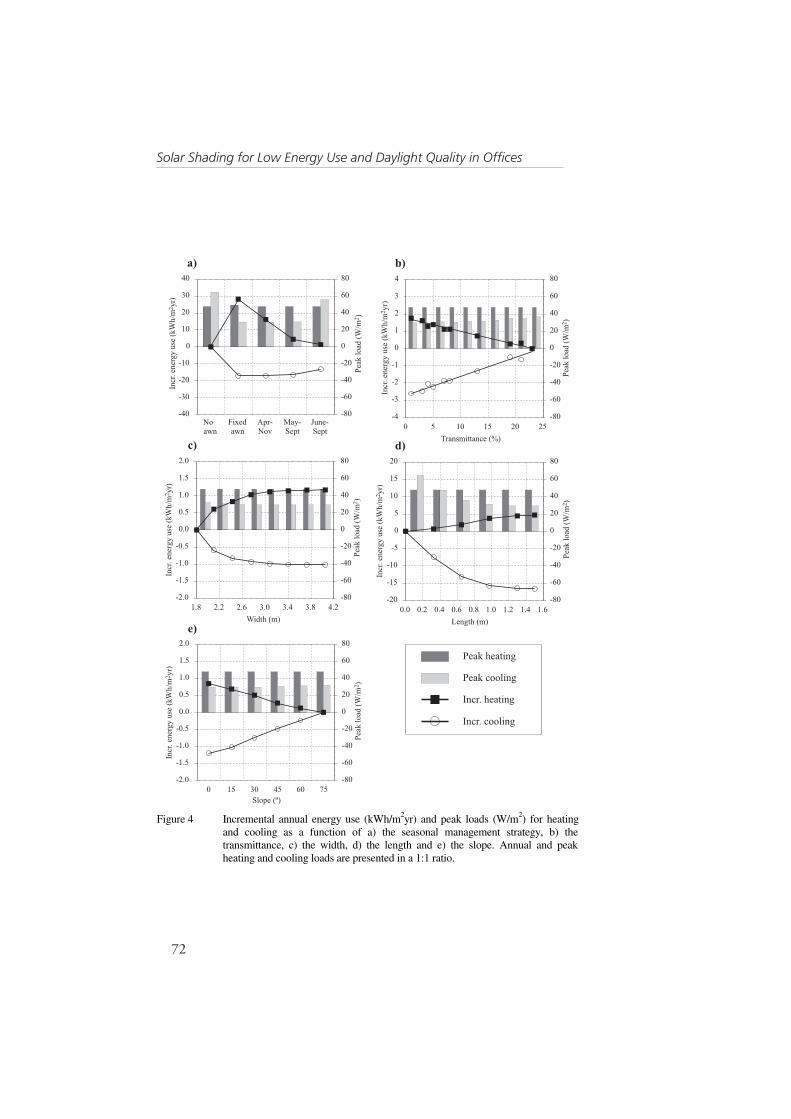
Solar Shading for Low Energy Use and Daylight Quality in Offices
72
�� ��
��
���
���
��
��
�
�
�
��
��
� !"#
$ %��!"#
�&'�� (
)!*�+�&�
,�#��+�&�
-#.'/��#�'0*��1���2����
*'�
���
���
���
��
�
�
��
��
��
3�!2��
!����
�� �
��
��
��
�
�
�
�
�
� � � � � �
4'!#1� ��!#.���5�
-#.'/��#�'0*��1���2����
*'�
���
���
���
��
�
�
��
��
��
3�!2��
!����
�� �
��
�/�
�/�
�/�
��/�
�/�
�/�
/�
/�
/�
/� / /� �/� �/� �/� �/� �������
-#.'/��#�'0*��1���2����
*'�
���
���
���
��
�
�
��
��
��
3�!2��
!����
�� �
��
��
��
��
�
�
�
�
�
�/� �/ �/� �/� �/� /� / /� /�6�#0������
-#.'/��#�'0*��1���2����
*'�
���
���
���
��
�
�
��
��
��
3�!2��
!����
�� �
�/�
�/�
�/�
��/�
�/�
�/�
/�
/�
/�
+� &���7�
-#.'/��#�'0*��1���2����
*'�
���
���
���
��
�
�
��
��
��
3�!2��
!����
�� �
� � �� �� �� ��
3�!2���!� #0
3�!2�. � #0
-#.'/���!� #0
-#.'/�. � #0
Figure 4 Incremental annual energy use (kWh/m2yr) and peak loads (W/m2) for heatingand cooling as a function of a) the seasonal management strategy, b) thetransmittance, c) the width, d) the length and e) the slope. Annual and peakheating and cooling loads are presented in a 1:1 ratio.

Article III
73
The relationship between the slope and the annual heating and cooling loads was roughly linear
and the slope generally had a larger impact on cooling than on heating loads. Steeper slopes (0-
30°) yielded a lower annual cooling demand resulting in a lower annual energy use than shallow
slopes. Overall, the impact of the slope on peak loads was negligible.
4. DISCUSSION AND CONCLUSIONS
A parametric study of energy use for heating and cooling an office room equipped with a
seasonal awning was presented. The study indicated that the seasonal management strategy and
the awning’s length were factors affecting energy use and peak cooling loads in a significant
way. The large impact of the seasonal management strategy suggests that larger energy savings
could be obtained with dynamic shades that constantly adjust to environmental conditions. A
variation of the awning’s colour also indicated that the annual energy use varies as a function of
the transmittance of the awning’s fabric. Overall, this property had a moderate impact on annual
energy use and peak cooling loads and it was found that darker awnings yielded a lower annual
cooling demand because dark-coloured fabrics have a lower transmittance than light-coloured
ones. This finding suggests that opaque awnings should yield lower cooling loads. Finally, the
study indicated that the awning’s width and slope had a relatively small impact on annual energy
use and a negligible impact on peak loads. It was found that over a certain width, little additional
cooling savings were obtained suggesting that awnings should be slightly larger than the window
but that extremely large awnings are a waste of material.
Overall, the results obtained for the width and the length generally indicate that the base
case awning was oversized. There is a possible relationship between the total awning area (width
and length) and energy use that has not been thoroughly investigated here. However, it should be
noted that a simulation (not presented) with reduced awning dimensions (L = 0.9 m; W = 2.1 m)
yielded results similar to the ones obtained for the base case (-1.4 kWh/m2yr for heating; +1.3
kWh/m2yr for cooling). Note that there are clear advantages to reducing the awning’s
dimensions such as a reduction of production costs, an improvement of the view out from the
interior, and an increase in daylighting availability in the space, which can provide additional
energy savings for lights and cooling.
Finally, it should be mentioned that the conclusions of this study are solely drawn from
results of computer simulations. Although the computer program used (DEROB-LTH) has been
validated experimentally and it has been shown (Wall & Wallentén 1999) that it predicts heating

Solar Shading for Low Energy Use and Daylight Quality in Offices
74
and cooling loads with a maximum error of 10%, investigations and measurements in real
buildings should be made to confirm the findings described in this paper.
5. APPENDIX
Equations (1) and (2) were derived from the following equations:
( ) 1cos −= θvL (3)
αtan3.1 dv −= (4)
( ) 160cos −°= hd (5)
θsinLh = (6)
°= 60tansin θLs (7)
L is the awning’s length (m); v and h are respectively the vertical and horizontal projection of the
awning (m); θ is the awning’s slope (°); d is the horizontal projection of the distance between the
awning’s lower corner and its shadow on the vertical wall (m); α is the lowest solar altitude for
the period considered (°); and s is the awning’s width exceeding the window width on each side
(m) (Fig. 2).
6. ACKOWLEDGEMENT
This research was funded by the Natural Sciences and Engineering Research Council of Canada
(NSERC) and the “Fonds pour la formation des chercheurs et l’aide à la recherche” (FCAR).
7. REFERENCES
Arumi-Noé, F. 1979. The DEROB System Volume II. Explanatory Notes and Theory. NumericalSimulation Laboratory, University of Texas, Austin (Texas).
Dubois, M.-C. 1998. Solar-protective Glazing for Cold Climates. A Parametric Study of EnergyUse in Offices. Report TABK—98/3053. Dept. of Building Science, Lund Institute ofTechnology, Lund (Sweden).
Källblad, K. 1999. A New Approach on Shading of Solar Radiation. 5th Symposium on BuildingPhysics in the Nordic Countries. Chalmers University of Technology, Göteborg (Sweden).
Wall, M. and P. Wallentén 1999. Performance of Shading Devices in Buildings. ACollaboration between Lund University and Nordic Manufacturers. 5th Symposium on BuildingPhysics in the Nordic Countries. Chalmers University of Technology, Göteborg (Sweden).

Article IV
75
Article IV

Solar Shading for Low Energy Use and Daylight Quality in Offices
76

Article IV
77
AWNINGS AND SOLAR-PROTECTIVE GLAZINGFOR EFFICIENT ENERGY USE IN COLD CLIMATES
Marie-Claude Dubois, M. Arch.Lund University, Lund Institute of Technology, Dept. of Building Science
PO Box 118, S-221 00 Lund, Sweden. Fax: +46 46 222 47 19. E-mail: [email protected]
ABSTRACT
Annual energy use for heating and cooling of a single-occupant office room located in Lund (Sweden) wasanalysed for eight solar-protective glazing options and oneshading system. Various glazing-to-wall area ratios(GWAR) and orientations were studied. The energyperformance was assessed through computer simulationswith the program DEROB-LTH recently supplemented withimproved algorithms for windows and exterior shadingsystems. The study showed that the most energy-efficientglazing option was orientation-dependent: south and northorientations required higher solar transmittance or GWARthan east and west, assuming similar coefficients ofperformance (COP) for heating and cooling systems andequivalent thermal losses among all cases. The study alsodemonstrated that a removable awning coupled with clearglazing performed better in terms of annual energy use thanall solar-protective glazing options tested. However, it wasalso demonstrated that the fixed awning resulted in higherannual energy use compared with solar-protective glazingfor all orientations. This study generally shows that glazingand shading strategies should be flexible in cold climatesand allow the use of solar gains during the heating seasonwhile limiting those gains during the cooling season.Removable or dynamic shading systems offer largerpotential energy savings than fixed systems or solar-protective glazing.
1 INTRODUCTION
In spite of developments in the area of switchable glazingtechnologies, there is still an interest to study shadingdevices and their impact on building energy use because
shading systems represent a great retrofit opportunity atrelatively low investment costs. In addition, most shadingdevices have the advantage over low solar transmittance orelectrochromic glazing to leave the view to the exterioralmost unchanged even when direct solar radiation iscompletely blocked. Shading can also provide additionalinsulation to the windowpanes. Most importantly, shadingsystems are already commonly used in buildings, even incold climates, because they allow the control of solar gains,daylighting levels and privacy. Thus, the impact of shadingsystems on energy use in buildings must be assessed todevelop energy-efficient strategies, to identify bad shadingpractices yielding a wastage of energy and to compare theenergy savings accomplished with shading systems withthe ones obtained with advanced glazing technologiesavailable today.
Studies of the impact of shading on annual energy use haveshown that shading reduces cooling loads substantially,thus reducing annual energy use in a building. However,most of these studies have been aimed at warm climates[3]. Little work has been done to assess the impact ofshading devices on annual energy use in heating-dominatedclimates. One study [5] showed that exterior shadingdevices and absorbing glass are net energy losers inheating-dominated climates and that interior devicesperform better than exterior fixed devices because theyshade the entire window while providing additionalinsulation to the windowpanes. Another study [14]demonstrated that window films provide no savings at all inheating-dominated climates. A third study [13] showed thatan energy-efficient shading strategy is climate dependent:in cooling-dominated climates, lower annual energy use is

Solar Shading for Low Energy Use and Daylight Quality in Offices
78
obtained with lower shading coefficients (better shade)while heating-dominated climates require higher shadingcoefficients. However, these studies were achieved throughcomputer simulations using a shading coefficient basedapproach. This approach is no longer valid with dynamicenergy calculation models. For energy analyses includinghourly building performance calculations, angulardependent values of the solar heat gain coefficient shouldbe used instead [8, 10].
In this research, the impact of one awning and of solar-protective (reflective, absorbing) and low-emissivity coatedglazing on heating and cooling loads is analysed for oneoffice room located in Lund (southern Sweden). Eightglazing options and three shading strategies are studied.The glazing-to-wall area ratio (GWAR) is varied 0-70%and the office room is alternatively orientated N, NE, E,SE, S, SW, W and NW.
2 METHOD
2.1 Computer simulations
2.1.1 Energy performance
The building energy performance was assessed with thedynamic program DEROB-LTH developed at theUniversity of Texas [2]. This program has been constantlyimproved at Lund University’s Department of BuildingScience, Lund, Sweden. It runs on a PC in the MSWindows environment [6]. The program was recentlyprovided with an improved window module that treats thewindow in the same way, generally, as the programWINDOW 4.1 [1]. DEROB-LTH was also recentlysupplemented with an algorithm that calculates the effectof exterior shades like awnings on direct and diffuse solarradiation at each hour interval. This new algorithm assumesthat all direct and diffuse radiation reaching the exteriorshade is either reflected or transmitted as pure diffuseradiation [7].
2.1.2 Windows thermal-optical properties
The program WINDOW 4.1 was used to calculate thewindows’ thermal and optical properties (at 10o
increments). The solar angle dependent optical propertieswere calculated from a manufacturer’s measurements fornormal incidence. WINDOW 4.1 gives accurate angularproperties for homogeneous glasses (uncoated) by applyingFresnel equations and Snell’s law [4]. This procedure isvalid for most clear, low-iron and absorbing glasses butmay induce inaccuracies for coated glazing as in the caseof reflective and low-emissivity coated glass tested in thisstudy. A recent study [11], however, indicates that theseinaccuracies are within a few percent.
2.2 Constant parameters
2.2.1 Office module
The office module was a 4.2 m deep, 2.9 m wide and 2.7 mhigh (floor to ceiling) single-occupant room (Fig. 1). Theroom was constructed according to ordinary buildingpractices for commercial offices in Sweden. Heat transferthrough the room’s walls, floor and ceiling were, however,selectively constrained in order to isolate the energy effectsdue to the window and/or shade system solar properties.The room’s floor, ceiling and all walls except the wallfacing the “exterior” were thus wrapped in a thickinsulation layer to make all walls adiabiatic (i.e. having noheat transfer). The insulation thickness in the wall facingthe “exterior” (surrounding the window) was adjusted toyield equivalent thermal losses through the window-wallsystem for all cases studied. This procedure made itpossible to compare windows with different thermalproperties (U-value).
2900
west 4200
north
south
east
awning
1000
2700
glazing
wall facing the "exterior"(heat transfer)
Adiabatic surface(no heat transfer)
Figure 1: Office module.
2.2.2 Internal loads, heating and cooling thermostatsettings, ventilation and infiltration rates
The internal loads in the office room consisted of the heatgenerated by the occupant (90 W), a computer and monitor(120 W) and energy-efficient lighting (120 W). Nodaylighting utilisation (dimming system) was assumed. Thethermostat settings for heating were 20ºC during workinghours (8-17), with a night setback temperature of 18ºC. Forcooling, the thermostat settings were 24ºC (8-17), with anight setback of 28ºC. The ventilation rate was 10 l/s andthe infiltration was 0.1 ach. No heat recovery of exhaust airwas assumed.
2.2.3 Climate
The office room was located in Lund in the south ofSweden (latitude 55.72 N). The climate file used was for1988, which is considered a normal year [15]. During thatyear, the average annual temperature was 8.2ºC, theaverage minimum temperature was 0.4ºC and the averagemaximum temperature was 16.7 ºC. The average global
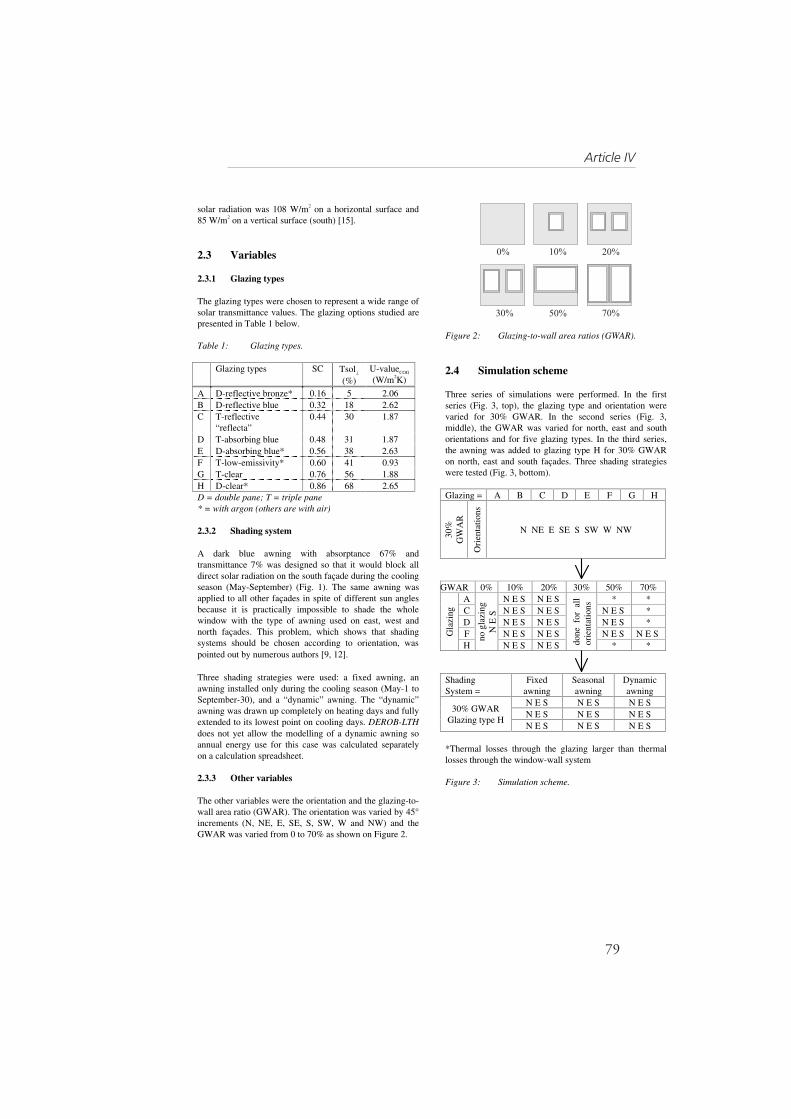
Article IV
79
solar radiation was 108 W/m2 on a horizontal surface and85 W/m2 on a vertical surface (south) [15].
2.3 Variables
2.3.1 Glazing types
The glazing types were chosen to represent a wide range ofsolar transmittance values. The glazing options studied arepresented in Table 1 below.
Table 1: Glazing types.
Glazing types SC Tsol⊥
(%)U-valueCOG
(W/m2K)
A D-reflective bronze* 0.16 5 2.06B D-reflective blue 0.32 18 2.62C T-reflective
“reflecta”0.44 30 1.87
D T-absorbing blue 0.48 31 1.87E D-absorbing blue* 0.56 38 2.63F T-low-emissivity* 0.60 41 0.93G T-clear 0.76 56 1.88H D-clear* 0.86 68 2.65D = double pane; T = triple pane* = with argon (others are with air)
2.3.2 Shading system
A dark blue awning with absorptance 67% andtransmittance 7% was designed so that it would block alldirect solar radiation on the south façade during the coolingseason (May-September) (Fig. 1). The same awning wasapplied to all other façades in spite of different sun anglesbecause it is practically impossible to shade the wholewindow with the type of awning used on east, west andnorth façades. This problem, which shows that shadingsystems should be chosen according to orientation, waspointed out by numerous authors [9, 12].
Three shading strategies were used: a fixed awning, anawning installed only during the cooling season (May-1 toSeptember-30), and a “dynamic” awning. The “dynamic”awning was drawn up completely on heating days and fullyextended to its lowest point on cooling days. DEROB-LTHdoes not yet allow the modelling of a dynamic awning soannual energy use for this case was calculated separatelyon a calculation spreadsheet.
2.3.3 Other variables
The other variables were the orientation and the glazing-to-wall area ratio (GWAR). The orientation was varied by 45°increments (N, NE, E, SE, S, SW, W and NW) and theGWAR was varied from 0 to 70% as shown on Figure 2.
Figure 2: Glazing-to-wall area ratios (GWAR).
2.4 Simulation scheme
Three series of simulations were performed. In the firstseries (Fig. 3, top), the glazing type and orientation werevaried for 30% GWAR. In the second series (Fig. 3,middle), the GWAR was varied for north, east and southorientations and for five glazing types. In the third series,the awning was added to glazing type H for 30% GWARon north, east and south façades. Three shading strategieswere tested (Fig. 3, bottom).
Glazing = A B C D E F G H
30%
GW
AR
Ori
enta
tions
N NE E SE S SW W NW
GWAR 0% 10% 20% 30% 50% 70%A N E S N E S * *C N E S N E S N E S *D N E S N E S N E S *F N E S N E S N E S N E SG
lazi
ng
H
no g
lazi
ngN
E S
N E S N E S done
for
all
orie
ntat
ions
* *
ShadingSystem =
Fixedawning
Seasonalawning
Dynamicawning
N E S N E S N E SN E S N E S N E S
30% GWARGlazing type H
N E S N E S N E S
*Thermal losses through the glazing larger than thermallosses through the window-wall system
Figure 3: Simulation scheme.

Solar Shading for Low Energy Use and Daylight Quality in Offices
80
3 RESULTS AND DISCUSSION
3.1 Variation of the glazing type andorientation
In the first series of simulations, energy use was analysedfor the office room with 30% GWAR, for eight glazingtypes and eight orientations. Results showed that low solartransmittance glazing (type A) yielded the lowest annualcooling load and the highest annual heating load. Hightransmittance glazing (types G, H) exhibited oppositetrends. Results also indicate that the south facing room hadthe lowest annual heating load while the north facing roomhad the highest. For cooling, the southeast orientationyielded the highest annual cooling load while north yieldedthe lowest. East and west orientations yielded similar loadsboth for heating and cooling.
In absolute values, heating was more affected by a changein orientation than cooling. This is clearly shown in Figure4: the maximal reduction in heating load due to a change inorientation was about 23 kWh/m2yr while it was only 15kWh/m2yr for cooling. In percent, however, cooling wasreduced by up to 58% while heating was reduced by up to23%. The absolute maximal reduction in heating load dueto a change in glazing type was about 29 kWh/m2yr while,for cooling, it was about 22 kWh/m2yr. In percent, coolingwas reduced by at most 86% while heating was reduced byat most 27%. The glazing type was thus a more significantfactor affecting energy use than the orientation, especiallywith respect to cooling loads.
-40
-30
-20
-10
0
10
20
30
N NE E SE S SW W NW N
Orientation
ABCDEFGH
HEATING
COOLING
Incr
. ann
. ene
rgy
use
(kW
h/m
2 yr)
Figure 4: Incremental annual energy use (kWh/m2yr)for eight glazing types and eight orientations,GWAR = 30%, in Lund.
Assuming that the heating and cooling systems had asimilar COP and that energy distribution systems requiredthe same amount of energy both for heating and cooling,heating and cooling loads were added up for the analysis ofannual energy use as a function of orientation and glazingtype. As shown in Figure 5, the optimal glazing strategywas orientation-dependent: on south and north façades,higher transmittance glazing (types F, G, H) yielded lower
annual energy use while on east and west façades, averagetransmittance glazing (types C, D) performed better.Surprisingly, the low-emissivity coated glazing (type F)always yielded the lowest annual energy use for allorientations while the low solar transmittance glazing (typeA) almost always yielded the highest annual energy use.Note that since thermal losses are constant for all cases, theperformance of the low-emissivity coated glazing cannotbe attributed to its thermal behaviour.
95
100
105
110
115
N NE E SE S SW W NW N
Orientation
ABCDEFGH
Ann
. ene
rgy
use
(kW
h/m
2 yr)
Figure 5: Annual energy use (kWh/m2yr) for eightglazing types and eight orientations,GWAR = 30%, in Lund.
3.2 Variation of the GWAR, glazing typeand orientation
In the second series of simulations, the GWAR was variedfor north, east and south orientations and glazing types A,C, D, F and H. Results of these simulations indicated thatthe cooling load increased with increasing solar aperture1
(SA). The opposite trend was observed for heating loads(Fig. 6). In general, the south orientation was more affectedby a change in SA than other orientations. A significantfeature of Figure 6 is that for east and south orientations,the cooling load increased in a similar way with an increasein SA. For south, however, the heating load decreasedmuch more with increasing SA than for east. In otherwords, for the east orientation, increasing the SA (SC orGWAR) yielded increases in cooling loads larger than thereductions in heating load. This was especially true for SAlarger than 0.3. This finding indicates that the optimal SA(hence the glazing SC or GWAR) on east (and west)orientations is determined by cooling rather than heatingloads for large SA.
Assuming, again, equivalent COP for heating and coolingsystems, annual energy use was analysed as a function ofSA. It was found that for south, the annual energy use wasminimised at SA around 0.2 while for east, annual energyuse was minimised at lower SA e. g. approximately 0.12.This means that, for the south orientation, high solar 1 The solar aperture is the product of the SC and GWAR.

Article IV
81
transmittance glazing (type H) yielded minimal annualenergy use with GWAR around 20% while glazing type Fwas optimal with GWAR around 30% and glazing types Cand D were optimal with GWAR around 40%. On the eastfaçade, high solar transmittance glazing (type H) yieldedlower annual energy use with GWAR around 15% whileaverage transmittance glazing (types C, D) and glazingtype F yielded lower annual energy use with GWARaround 20-30%. For the north orientation, the flathorizontal curve shown in Figure 7 indicates that theimpact of the SC or GWAR on annual energy use wassmall. In general, the results indicate that annual energy usewas minimised at lower GWAR or SC on east (and west)façades than on the south façade.
-60
-40
-20
0
20
40
60
0.0 0.1 0.2 0.3 0.4 0.5Solar aperture (GWAR*SC)
North East South
Incr
. ann
. ene
rgy
use
(kW
h/m
2 yr)
COOLING
HEATING
Figure 6: Incremental annual energy use (kWh/m2yr)as a function of solar aperture for threeorientations, in Lund.
y = 335.63x2 - 137.73x + 113.27
y = 229.86x2 - 59.141x + 113.19
y = 53.338x2 - 25.813x + 113.54
90
100
110
120
130
140
0.0 0.1 0.2 0.3 0.4 0.5
Solar aperture (GWAR*SC)
North East South
Ann
. ene
rgy
use
(kW
h/m
2 yr)
Figure 7: Annual energy use (kWh/m2yr) as a functionof solar aperture for three orientations, inLund.
3.3 Introduction of a shading system
In the last series of simulations, an awning was added tothe high solar transmittance glazing (type H) with 30%GWAR for three orientations and three shading strategies.Results of these simulations indicate that the fixed awningresulted in increased annual energy use due to increasedheating loads for all orientations (Fig. 8). These results
agree with results found by Hunn et al. [5] and Treado etal. [13, 14].
60
70
80
90
100
110
120
A B C D E F G H Awn1
Awn2
Awn3
Glazing-shading option
Ann
. ene
rgy
use
(kW
h/m
2 yr) Heating Cooling
a) north
60
70
80
90
100
110
120
A B C D E F G H Awn1
Awn2
Awn3
Glazing-shading option
Ann
. ene
rgy
use
(kW
h/m
2 yr) Heating Cooling
b) east
60
70
80
90
100
110
120
A B C D E F G H Awn1
Awn2
Awn3
Glazing-shading option
Ann
. ene
rgy
use
(kW
h/m
2 yr) Heating Cooling
c) south
Figure 8: Annual energy use (kWh/m2yr) as afunction of glazing-shading option for a)north, b) east, c) south and GWAR =30%, in Lund (Awn 1 = fixed, Awn 2 =seasonal, Awn 3 = dynamic).
The study also showed that the seasonal and “dynamic”awnings reduced the annual energy use significantly,especially on the south façade. The seasonal awningreduced the cooling load by 18.8 kWh/m2yr (81%) andincreased heating loads by 4.8 kWh/m2yr (6%), decreasingannual energy use by 13.9 kWh/m2yr (14%) compared with

Solar Shading for Low Energy Use and Daylight Quality in Offices
82
the clear glazing option (type H), which was one of the bestglazing strategies for the south façade. The “dynamic”awning performed even better with an annual energy usereduction of 19.8 kWh/m2yr (20%) compared with glazingtype H.
For north and east orientations, the seasonal and “dynamic”awnings also resulted in lower annual energy use althoughsavings were smaller than for south. Even on the northfaçade, the seasonal awning resulted in annual energysavings compared with all solar-protective glazing optionstested. Since this façade is in the shade most of the time,the savings achieved can be attributed to the reduction indiffuse solar radiation reaching the window.
4 CONCLUSIONS
In this study, optimal transmittance properties for glazingin a heating-dominated city were identified by varying theglazing type, the GWAR and the orientation. Onesignificant finding is that the most energy-efficient glazingoption is orientation-dependent: south and north façadesrequire higher solar transmittance or higher SA (GWAR orSC) than east and west façades. This conclusion is drawnassuming equivalent COP for cooling and heating systemsand constant thermal losses among all cases. Anotherimportant finding is that a high solar transmittance glazingcombined with a removable awning, either on a seasonal oron a daily basis, results in lower annual energy use than allsolar-protective glazing options tested for any orientation,including north. These results are promising since theimpact of the glazing-shading strategy on electricity use forlighting was not assessed. The potential to replace artificiallighting by daylighting is much higher with high than withlow solar transmittance glazing. The clear glazing plusremovable awning option may thus result in much largeroverall energy savings than those reported here.
Although a detailed calculation method was used to obtainheating and cooling loads, the window module and shadingalgorithm recently implemented in DEROB-LTH have notbeen fully validated yet. Measurement work is on the wayat Lund University’s Department of Building Science forvalidation of the computer program. Future plans alsoinclude the implementation of dynamic algorithms forother types of shading devices like venetian blinds, rollershades, screens, etc. These algorithms will allow anextended study of energy patterns with different kinds ofshading systems and strategies in cold climates.
REFERENCES
[1] Arasteh, D., Reilly, S. & Rubin, M. (1989). AVersatile Procedure for Calculating Heat TransferThrough Windows. ASHRAE Trans. Vol. 95. Pt. 2.
[2] Arumi-Noé, F. (1979). The DEROB System VolumeII. Explanatory Notes and Theory. Austin (Texas):Numerical Simulation Laboratory, Univ. of Texas.
[3] Dubois, M.-C. (1997). Solar Shading and BuildingEnergy Use. Report TABK—97/3049. Lund(Sweden): Dept. of Building Science. Lund Univ.
[4] Furler, R. A. (1991). Angular Dependence of OpticalProperties of Homogeneous Glasses. ASHRAE Trans.Vol. 97. No. 2. pp. 1129-1133.
[5] Hunn, B.D., Grasso, M.M., Jones, J.W. & Hitzfelder,J.D. (1993). Effectiveness of Shading Devices onBuildings in Heating-Dominated Climates. ASHRAETrans. Vol. 99. Pt. 1. pp. 207-222.
[6] Kvist, H. (1995). DEROB−LTH for Windows. UserManual. Report TABK−−95/7019. Lund (Sweden):Dept. of Building Science. Lund Univ.
[7] Källblad, K. (1998). Pers. comm. Lund (Sweden):Dept. of Building Science. Lund Univ.
[8] Mc Cluney, R. (1991). The Death of the ShadingCoefficient ? ASHRAE J. Vol. 33. No. 3. pp. 36-45.
[9] Olgyay, V. (1963). Solar Control (Chapter VII).Design with Climate. New Jersey: Princeton .
[10] Prassard, D.K., Ballinger, J.A. & Morrison, G.L.(1992). Advanced Glazing Development and PotentialEnergy Impact. Austr. Refr., Air Cond. and Heating.Vol. 46. No. 1. pp. 15-18.
[11] Roos, A. (1997). Optical Characterization of CoatedGlazings at Oblique Angles of Incidence:Measurements versus Model Calculations. J. of Non-Crystalline Solids. 218 (1997). pp. 247-255.
[12] Steemers, K. (1989). External Shading Devices.Building Technical File. No. 27. Cambridge (UK):Martin Centre for Arch. and Urban Studies. pp. 9-16.
[13] Treado, S., Barnett, J. & Remmert, W. (1984).Effectiveness of Solar Shading for an Office Building.NBS Building Science Series 161. Washington:National Bureau of Standards.
[14] Treado, S., Barnett, J. & Kusuda, T. (1983). Energyand Cost Evaluation of Solar Window Film Use in anOffice Building. NBS Technical Note 1174.Washington: National Bureau of Standards.
[15] Wall, M. (1994). Projekteringshjälpmedel för ingla-sade rum. Report TABK—94/3023. Lund (Sweden):Dept. of Building Science. Lund Univ.

Article V
83
Article V

Solar Shading for Low Energy Use and Daylight Quality in Offices
84
Article V
85
Parasol-LTH: A User-friendly Computer Tool to Predict the Energy Performance of Shading Devices
Petter Wallentén, M.Sc. in Physics, PhD Hasse Kvist, M. Sc., Tech. Lic. Marie-Claude Dubois, M. Sc. in Architecture, Tech. Lic.* 1. INTRODUCTION
The shading of windows can significantly affect energy use for cooling, heating and lighting a
building. Dubois (1999) found that a seasonal awning could reduce the annual cooling
demand of a south-oriented office room by up to 80% in Stockholm (Sweden). Such an
impact on energy use needs to be taken into consideration during the design of the building
since it will affect the size and cost of the installations and could justify investing in energy-
efficient shading devices. One problem is that few of the computer models that handle the
complex physical interactions between the direct and diffuse sky radiation, the shade and the
window have been validated experimentally (Dubois, 1997). Another problem is that most of
these models are too complex to be used in conventional architectural or engineering
practices. In order to overcome these limits, a computer tool called Parasol-LTH has been
developed at Lund University as part of a large project on solar shading (Wallentén & Wall,
1999) achieved in collaboration with Nordic shading manufacturers. Parasol-LTH is a user-
friendly interface to the energy simulation program Derob-LTH, which has been validated
experimentally (Källblad & Wallentén in Wall & Fredlund, 1999). This paper briefly
describes the computer model Derob-LTH, its experimental validation and the user-friendly
interface, Parasol-LTH. An example of an application of the computer tool in a study of
seasonal awnings is also presented.
2. COMPUTER MODELS
2.1 Derob-LTH
Derob-LTH, which is an acronym for Dynamic Energy Response of Buildings, originates
from the University of Texas (Arumi-Noé, 1979) and has been under continuous development at
Lund University’s Department of Building Science (Källblad 1999, 1998). The program uses
* Lund Institute of Technology, Dept. of Building Science, PO Box 118, SE-221 00, Lund, Sweden. Fax: +46 46 222 4719. E-mail: [email protected].

Solar Shading for Low Energy Use and Daylight Quality in Offices
86
hourly data for the exterior temperature and the solar radiation intensity and updates the hourly
solar position four times every month. The window and shading model has the following main
characteristics:
• Coarse ray tracing and Fresnel calculation of the direct radiation.
• View factor and Fresnel calculation of the diffuse radiation.
• One thermal node for each pane.
• Shading device transmits and reflects diffusely.
• One thermal node approximating the thermal balance for all shadings.
• Long wave sky radiation included.
2.2 Experimental validation
The shading and window models in Derob-LTH have been validated experimentally
using two full-scale guarded hot boxes exposed to the natural climate (Wallentén & Håkansson
in Wall & Fredlund, 1999). A comparison between measured and simulated energy balance for a
dark (box 1) and a light (box 2) awning is shown in Fig. 1. This figure shows that the computer
models are accurate since the error with respect to the incident solar radiation is less than 3%.
The light awning model slightly underestimates the cooling demand, especially with high solar
radiation intensity. Wallénten & Wall (1999) suggest that this is due to the fact that the shading
model assumes all transmitted radiation to be purely diffuse.
-100
0
100
200
300
400
500
06/06 07/06 08/06 09/06 10/06
Day/Month (1997)
Cool -Heat (W)
Measured box 1
Measured box 2
Calculated light(7/6 - 9/6)
Calculated noawning
Calculated dark(6/6)
Figure 1 Comparison between the measured and calculated energy balance for the test boxes. The shadings tested were a dark awning on box 1 (drawn down on 97-06-06 and up on 97-06-07) and a light awning on box 2 (up on 97-06-06 and down on 97-06-07).

Article V
87
Similar measurements and tests were performed for external venetian blinds, Italian
awnings, fixed overhangs and screens. A comparison between measurements and simulations
for blinds and Italian awnings showed that the computer model yields accurate results (Källblad
& Wallentén in Wall & Fredlund, 1999).
2.3 Parasol-LTH
Since professionals in the building sector have a variable technical background, it was
judged necessary to provide them with a user-friendly tool for shading calculations. An interface
to Derob-LTH called Parasol-LTH has thus been written with architects and building
consultants as intended user group. Parasol-LTH, which is a Windows 95/98/NT program
written in Visual Basic, contains a set of simple dialog boxes (Fig. 2, 3a, 3b) where input
information is entered and “sent” to Derob-LTH, which performs the calculations. The results of
the calculations, which are directly accessible through output boxes in Parasol-LTH, are either
simple or detailed depending on the input information provided. The current version of the
program is in Swedish but future plans include a translation of the interface to English.
2.3.1 Input data. Figure 2 shows the ”start” dialog box where the room and window
geometry, the climate (location), type of construction, window and shading type as well as
level of calculation (simple or detailed) are defined. The dialog box also contains a 3D
graphical representation of the room (upper right corner), which is interactively modified as
the room geometry and shading device are defined.
The input box defining the room geometry is shown in Fig. 3a. Only one geometry
consisting of a rectangular room with one wall and one window facing the exterior is allowed
in the current version of the program. Future versions will include a set of more complex
room geometries.
Figure 3b shows the dialog box where an awning’s width, arm length and slope,
horizontal and vertical position as well as optical properties (transmittance, absorptance,
emittance) are defined. Input boxes for other types of shades like exterior venetian blinds,
Italian awnings, overhangs and screens will also be available in the first program version.

Solar Shading for Low Energy Use and Daylight Quality in Offices
88
Figure 2 The “start” dialog box.
a)
b)
Figure 3 Dialog boxes to define a) the room geometry and b) the shade type, geometry and properties (transmittance, absorptance and emittance).
Other input information includes descriptions of the window, orientation, climate,
walls, etc. For the window, the input box specifies the glazing type and thickness, spacing

Article V
89
between panes, gas fills and coatings. The window can either be selected from a predefined
library or built up from a choice of glazings, gas fills and coatings. Moreover, the geometry of
the window niche can be defined by entering the window offset with respect to the facade and
the thickness of the window frame. The walls are defined either as ”light” or ”heavy”
construction both for outer and inner walls. For outer walls, the thermal transmission is
defined by the U-value (W/m2°C).
2.3.2 Output data. The output data is either simple or detailed. The simple output
data (Fig. 4) consists of either primary (T-value) or total (G-value) transmittance for the
shading device or for the shade plus window assembly. In both cases, the transmittance values
useful for total energy and peak loads calculations are given in a diagram (right). These
calculated values can be saved on a file and exported to another energy simulation program.
Figure 4 Dialog box showing the output data of a simple calculation. The result of the simple calculation (diagram, right) is the primary (T-value) and total (G-value) transmittance of the shade or shade plus window assembly.
The detailed output data (Fig. 5) consists of total and peak cooling and heating loads
and indoor temperature fluctuations. The total transmitted solar radiation, the cooling and
heating demand for a non-shaded room as well as the difference between a shaded and a non-
shaded room are also given (top right). These values can also be saved on a file and exported
to another program.

Solar Shading for Low Energy Use and Daylight Quality in Offices
90
Figure 5 Dialog box showing the output data of a detailed calculation. The detailed output data consists of a diagram (right) of monthly, daily or time related energy consumption and peak and total cooling and heating loads (top right).
3. APPLICATION
Parasol-LTH was used to study the geometry and properties (transmittance, reflectance) of a
seasonal awning installed in front of an office room under the cooling season (May-Sept.). The
room was a 2.9-m wide, 4.2-m deep and 2.7-m high (interior dimensions), south-orientated
rectangular space (Fig. 6a) located in Stockholm. The room’s triple-pane, clear glass window
measured 1.8 m (width) by 1.3 m (height), had a U-value of 1.88 W/m2°C and a shading
coefficient of 0.76. The exterior wall was a standard construction with respect to Swedish norms
with a U-value of 0.18 W/ m2°C. The room had constant infiltration (0.1 ach) and ventilation (10
L/s) rates, internal heat gains from one occupant (90 W), a computer and monitor (120 W) and
energy-efficient lighting (10 W/m2) (assumed under normal work hours). The temperature set
points were 20°C (heating) or 24°C (cooling) during work hours (8-17) and 18°C (heating) or
28°C (cooling) the rest of the time.
Fig. 6b presents the incremental annual heating and cooling loads and peak cooling
demand as a function of the awning’s length. The figure shows that increasing the awning’s
length significantly reduced the annual cooling demand. However, over a certain length (1.0 m),

Article V
91
little additional cooling savings were obtained. The length also had a large impact on peak
cooling loads and a moderate impact on the annual heating demand.
Other parameters such as the awning’s width, slope, transmittance, reflectance (colour)
and seasonal management strategy were also varied in this study. It was found that using a
seasonal awning could reduce the annual cooling demand by up to 80% while a fixed awning (in
place year-round) increased the annual heating loads by 31%. Both the seasonal management
strategy and the length were the factors affecting energy use most significantly while the
awning’s width, slope, reflectance and transmittance only had a small impact on annual energy
use.
2.9 m
4.2 m
SOUTH
awning
1.0
m2.
7 m
glazing
wall facing the "exterior"(heat transfer)
Adiabatic surface(no heat transfer)
-20
-15
-10
-5
0
5
10
15
20
0.0 0.2 0.4 0.6 0.8 1.0 1.2 1.4 1.6
Length (m)
Incr
. Ene
rgy
Use
(kW
h/m
2 yr)
-80
-60
-40
-20
0
20
40
60
80
Peak
Loa
d (W
/m2 )
Peak Cool. Heating Cooling
Figure 6 a) Office room and b) incremental annual heating and cooling loads (kWh/m2yr) and annual peak cooling load (W/m2) as a function of the awning’s length.
4. CONCLUSIONS AND FUTURE WORK
A user-friendly computer tool called Parasol-LTH has been developed at Lund University’s
Department of Building Science. The model has been validated experimentally and it has been
found that it predicts heating and cooling loads very accurately for exterior shades like
conventional and Italian awnings, venetian blinds, screens and overhangs. The model has also
been used to study the impact of the design and seasonal management of an awning on energy
use in an office room and yielded a set of practical results and recommendations.

Solar Shading for Low Energy Use and Daylight Quality in Offices
92
The first version of the program is planned to be released in March 2000 and will allow
the modeling of exterior shading devices of arbitrary shape and optical properties. The second
version will allow the modeling of shading devices between panes, and the third version will
handle interior shading devices. Future plans also include translating the interface to English as
well as developing control algorithms for shading systems.
5. ACKNOWLEDGEMENT
The authors thank the Swedish Solar Protection Agency (Svenska Solskyddsförbundet) and the
Swedish Council for Building Research (Byggforskningsrådet) who funded this project.
6. REFERENCES
Arumi-Noé, F. 1979. The DEROB System Volume II. Explanatory Notes and Theory. Numerical Simulation Laboratory, University of Texas, Austin (Texas). Dubois, M.-C. 1999. The design of seasonal awnings for low cooling and heating loads in offices. Proceedings of the 5th Symposium on Building Physics in the Nordic Countries (Göteborg, August 24-26, 1999). Vol. 2, Chalmers University of Technology, Göteborg (Sweden), pp. 505-512. Dubois, M.-C. 1997. Solar Shading and Building Energy Use: A Literature Review, Part I. Report TABK—97/3049. Dept. of Building Science, Lund University, Lund (Sweden). Källblad, K. 1999. A Method to Estimate the Shading of Solar Radiation: Theory and Implementation in a Computer Program. Proceedings of the Sixth International IBPSA Conference (Building Simulation ’99, September 13-15, 1999, Kyoto, Japan). International Building Performance Simulation Association. pp. 595-601. Källblad, K. 1998. Thermal Models of Buildings. Determination of temperatures, heating and cooling loads. Theories, models and computer programs. Report TABK—98/1015. Lund Institute of Technology, Lund University, Lund (Sweden). Wall, M. and B. Fredlund (eds.) 1999. Solskydd I byggnader, verksamhet 1997-1999. Report TABK—99/3057, Dept. of Construction and Architecture, Lund Institute of Technology, Lund University, Lund (Sweden). Wallentén, P. and M. Wall. 1999. Performance of shading devices in buildingsA collaboration between Lund University and Nordic manufacturers. Proceedings of the 5th Symposium on Building Physics in the Nordic Countries (Göteborg, August 24-26, 1999). Vol. 2, Chalmers University of Technology, Göteborg, Sweden, pp. 521-528.

Article V
93

Solar Shading for Low Energy Use and Daylight Quality in Offices
94