solar probe plus mag sensor thermal design for low heater
TRANSCRIPT

45th International Conference on Environmental Systems ICES-2015-194 12-16 July 2015, Bellevue, Washington
1
International Conference on Environmental Systems
Solar Probe Plus MAG Sensor Thermal Design for Low
Heater Power and Extreme Thermal Environment
Michael K. Choi NASA Goddard Space Flight Center, Greenbelt, MD 20771
The heater power available for the Solar Probe Plus FIELDS MAG sensor is less than
half of the heritage value for other missions. Nominally the MAG sensors are in the
spacecraft’s umbra. In the worst hot case, approximately 200 spacecraft communication
downlinks, up to 10 hours each, are required at 0.7 AU. These downlinks require the
spacecraft to slew 45˚about the Y-axis, exposing the MAG sensors and boom to sunlight.
This paper presents the thermal design to meet the MAG sensor thermal requirements in the
extreme thermal environment and with low heater power. A thermal balance test on the
MAG sensor engineering model has verified the thermal design and correlated the thermal
model for flight temperature predictions.
Nomenclature
α = solar absorptance
AC = alternating current
AFT = allowable flight temperature
AU = astronomical unit
CTE = coefficient of thermal expansion
DC = direct current
CDR = Critical Design Review
Comm = communication
ε = hemispherical emittance
e* = effective emittance
EM = engineering model
ESA = European Space Agency
GSE = ground support equipment
ISAS = Institute of Space and Astronautical Science
ITO = indium tin oxide
Rs = solar radii
MAG = Magnetometer
MLI = multilayer insulation
SiOx = silicon oxide
SPP = Solar Probe Plus
TC = thermocouple
VDA = vacuum deposited aluminum
I. Introduction
OLAR Probe Plus (SPP) is a NASA’s Living with a Star mission. It is scheduled for launch from Cape
Canaveral in July 2018. The primary scientific goal of the SPP mission is to understand how the Sun's corona is
heated and how the solar wind is accelerated. A combination of in situ measurements and imaging will be used to
achieve this goal. The spacecraft is three-axis stabilized. It uses guidance and control sensors and attitude control
thrusters to maintain the thermal protection system primary sunshield pointing toward the Sun. Fig. 1 shows the
spacecraft. Fig. 2 shows the baseline SPP trajectory. It uses Venus flybys to reach a minimum perihelion of 8.5 solar
radii (Rs) or about 6 x 10⁶ km of the Sun's "surface" in approximately 6.5 years.
The Magnetometer (MAG) is a unit of the SPP FIELDS instrument which will make direct measurements of
electric and magnetic fields, radio emissions, and shock waves that course through the Sun's atmospheric plasma. It
S

International Conference on Environmental Systems
2
includes two sensors, inboard unit and outboard unit, which are mounted to a deployable boom (Fig. 1 and Fig. 3),
and two circuit cards which are part of the FIELDS electronics box mounted to a spacecraft equipment panel. The
MAG is provided by NASA’s Goddard Space Flight Center (GSFC). This paper is in conjunction with the MAG
sensors.
The two MAG sensors are separated by a distance of 0.8 m. The inboard sensor is approximately 1.9 m from the
spacecraft aft end. The MAG boom is made of M55J composite that has a very low coefficient of thermal expansion
(CTE), and is hollow. There is a connector plate about half way between the MAG sensors. Each MAG sensor has a
pigtail harness that connects it to the connector plate. A spacecraft-provided harness connects the connector plate to
the FIELDS electronics box.
Figure 1. SPP with Solar Array Panels Stowed (Left) and Deployed (Right) (credit: JHU APL and NASA).
Figure 2. SPP Trajectory (credit: JHU APL and NASA).
Earth
Mercury
Venus
MAG Boom
Thermal Protection System Primary Heat Shield
Z
X
MAG Sensors

International Conference on Environmental Systems
3
Figure 3. Location of MAG Sensors (credit: JHU APL and NASA).
II. SPP MAG Sensor Thermal Characteristics
For a MAG sensor that measures weak interplanetary fields, the in-flight determination of zero levels is a crucial
step of the overall calibration procedure1. Post-launch spacecraft MAG sensor zero levels can differ from their pre-
launch values for many reasons. One of the most common issues is temperature changes of the sensor. A general
review on space-based MAGs presented by Mario Acuna2 also discussed this. To maintain the fluxgate MAG
sensors within their optimum operating temperature range, it is necessary to provide heater power to the sensor
assemblies3.
Since it is extremely difficult to reduce the stray magnetic field associated with the operation of DC powered
heater to acceptable levels for the MAG sensor, a magnetic amplifier operating at 50 kHz is used to obtain
automatic, proportional control of AC power supplied to the heating elements3. The proportional heater controller
temperature range of -15°C to 23°C used for the Juno MAG sensor is a reasonable choice for the SPP MAG sensors. A
temperature range like -15°C to 23°C allows the MAG sensor heater to function as temperatures vary in the operating
range without turning on and off abruptly. The approximately 40°C range also allows for possible in-flight deviations
from predicted temperatures.
The GSFC fluxgate MAG sensor is a high-heritage instrument. It has been or being flown on numerous NASA,
ESA and ISAS missions, such as Voyager, AMPTE, MAGSAT, GIOTTO, DMSP, WIND, CLUSTER, MGS,
GEOTAIL, Lunar Prospector, MESSENGER, STEREO, Juno and MAVEN. The MAG sensor is calibrated in the laboratory. Its minimum operating allowable flight temperature limit (AFT) is -20˚C. It is a heritage value from
those missions. It is to optimize the MAG performance capabilities by ensuring in-flight calibration stays at nominal value
4. The MESSENGER MAG sensor, for example, is maintained at no colder than -15˚C by heater during
normal operations5. The Juno MAG sensor is also maintained at no colder than -15˚C by heater during normal
operations. The maximum operating AFT limit is 40˚C. It is also to optimize the MAG performance. The maximum
non-operating AFT limit is 60˚C. Table 1 is a summary of the AFT limits.
Table 1. AFT Limits (˚C).
Operating Non-Operating
Minimum Maximum Minimum Maximum
-20 40 -40 60
Fig. 4 shows the SPP FIELDS MAG sensor engineering model (EM). Its enclosure consists of a base plate and a
cover; both are made of carbon composite which has low thermal conductivity, low CTE and high emittance. The
sensor size is 12.471 cm x 7.62 cm x 7.62 cm. Two bobbins, one horizontal and one vertical, are attached to the
carbon composite. A heater, which consists of strips, is attached to the carbon composite underneath the bobbins.
Inboard and Outboard MAG Sensors
Boom Deployed

International Conference on Environmental Systems
4
There is no contact between the heater and bobbins. The MAG sensor pigtail harness is 0.3556 m (14 inch) long.
Two heater controller thermistors are attached to a phenolic strip which has heat radiation exchange with its
surrounding.
Figure 4. SPP Fields MAG Sensor EM.
III. SPP Mission Extreme Thermal Environment for MAG Sensors
The power dissipation of each MAG sensor is only 0.05 W or less. It is an order of magnitude smaller than the
heat leak of the sensor. The thermal environment drives the temperatures of the MAG sensor. Since the same heater
and heater controller set-point are used for both the operating and non-operating (survival) modes, in the same cold case thermal environment the temperature difference between operating and non-operating is less than 5˚C. The
worst hot case and worst cold case extreme thermal environment of the SPP mission for the MAG sensors is as
follows.
A. Worst Hot Non-operating Case
The Comm Slew (Downlink) at 0.7 AU is the worst hot case for the SPP MAG sensors. The solar irradiance is
2790 Wm-2
(2.04 suns). The spacecraft slews 45° about the Y-axis for approximately 200 times for downlinks (Fig.
5). Each Downlink is up to 10 hours. The MAG is non-operating in this case. During each Downlink, the MAG
sensors and boom are exposed to the sun. Due to solar exposure, the MAG sensor temperature will increase. When
the spacecraft slews back to its nominal attitude, the MAG sensos and boom are in the umbra, and will cool down.
The temperature cycling of the MAG sensors will repeat for approximately 200 times.
Figure 5. View from Sun during Comm Slew (Downlink) at 0.7 AU.
12.471 cm
7.62 cm
7.62 cm Heater
Bobbins
Base Plate Cover Adaptor Plate
Pigtail
MAG Sensors
Thermistors

International Conference on Environmental Systems
5
B. Worst Cold Operating Case
The spacecraft is at its nominal attitude during instrument checkout, cruise, fanbeam and solid state recorder
playbacks at 0.82 AU (Fig. 6). Instruments are powered on. The MAG sensors are in the spacecraft’s umbra.
Figure 6. View from Sun during Instrument Operation at 0.82 AU.
C. Worst Cold Non-operating Case
The Comm Slew (Downlink) at 0.76 to 0.28 AU is the worst cold non-operating case. The spacecraft does not
slew for approximately 700 Downlinks (Fig. 7). Each Downlink is up to 10 hours. Instruments are powered off. The
MAG sensors are in the spacecraft’s umbra.
Figure 7. View from Sun during Downlink at 0.76 to 0.26 AU.
IV. SPP Heater Power Budget for MAG Sensors
The SPP heater power budget for the MAG sensors is limited. The allocation at the FIELDS instrument Critical
Design Review (CDR) is 1.86 W orbital average per sensor. Only 1.3 W (or 70%) goes to the heater because 0.56 W
(or 30%) is consumed by the heater controller which is within the MAG circuit cards. The heater power is much
smaller than the flight heritage value.

International Conference on Environmental Systems
6
V. Objective
The objective of this paper is to present the thermal design of the SPP FIELDS MAG sensors to meet the thermal
requirement with extreme thermal environment and low heater power budget.
VI. SPP FIELDS MAG Sensor Thermal Design and Analysis
In the worst cold case thermal environment, the SPP FIELDS MAG sensors lose heat by a) radiation to cold
space, b) conduction through the mounts to the boom, and c) conduction through the pigtail harness which radiates
heat to space and conducts heat to the connector plate. As a flight heritage thermal design, the MAG sensor
enclosure and pigtail harness are insulated with multi-layer insulation (MLI) blankets. The sensor base plate is
thermally isolated from the boom mounting interface. A boom interface Ti-6Al-4V bracket has been designed by the
SPP spacecraft contractor. It wraps around the boom tube. Fig. 8 illustrates the heat leak paths from the MAG sensor
by conduction and radiation.
Figure 8. SPP FIELDS MAG Sensor Heat Leak Paths.
A. Issue with Heritage Thermal Design for SPP MAG
The results of the MAVEN MAG sensor cold thermal balance test at GSFC provided an implication for the
thermal issue of low heater power for the SPP MAG sensors if the heritage thermal design is used. With a 2.2 W heater power, a -50˚C mounting interface temperature and a liquid nitrogen cooled chamber shroud, the steady state
sensor temperature was -22˚C in the test. If same thermal design is used for SPP MAG sensors, with 1.3 W heater
power the sensor temperature will be much colder than the heritage minimum limit of -20˚C. The low heater power
allocation drives changes to the heritage thermal design for the SPP MAG sensors.
B. Thermal Design Changes
To reduce heat leak by conduction, the following design changes have been made:
Neptape 1526 replaces copper over-braid for magnetic shielding of pigtail harness.
Kinematic mounts (3) replace G-10 standoffs (4) and fasteners (4) used on MAVEN and other missions.
26 AWG, instead of 24 AWG, twisted pair shielded wires are used for heaters.
0.635 cm thick G-10 spacers thermally isolate sensor adaptor plate from boom mounting interface.
0.3175 cm thick G-10 washers thermally isolate fastener heads from boom mounting interface.
The kinematic mounts consist of six 0.1524 cm diameter Ti-6Al-4V screws and six equivalent point-contacts
with 0.635 cm diameter silicon nitride (SiN) spheres. They thermally isolate the sensor base plate from the adaptor
plate (Fig. 9). They have Juno MAG flight heritage, but are not identical (e.g., screws are longer and smaller in
diameter).
The MAG sensor thermal (and mechanical) interface with the spacecraft is at the boom Ti-6Al-4V bracket and
not at the boom tube. The thermal interface temperature only applies to the four mounting points of the boom Ti-
6Al-4V bracket for the MAG sensor (Fig. 10) . On the spacecraft side of the interface, thermal isolation between the
boom Ti-6Al-4V bracket and boom tube is recommended to the spacecraft contractor to reduce heat conduction
from the sensor to the boom tube. An option of thermal isolation is to minimize the contact area between the boom
bracket and boom tube, and to add low emittance (e.g., aluminized Kapton tape) to the boom bracket interior and
boom tube exterior underneath the boom bracket.

International Conference on Environmental Systems
7
Figure 9. Kinematic Mounts.
Figure 10. Thermal and Mechanical Interface (4 Places) in EM Thermal Balance Test.
To reduce heat leak by radiation, the following design changes have been made. Due to the low heater power
budget, a key thermal design parameter for the SPP MAG sensors is the MLI effective emittance (e*). To minimize
the thermal effect of 3K space in the worst cold case and solar flux at 0.7 AU (Downlink) in the worst hot case, 40
layers of MLI (a 15-layer MLI blanket on top of a 25-layer MLI blanket to allow flexibility) for the MAG sensor are
used. Also 35 layers of MLI (a 15-layer MLI blanket on top of a 20-layer MLI blanket to allow flexibility) for the
MAG pigtail are used. Note that a 20-layer or 25-layer MLI blanket on MAG sensors has high flight heritage.
Therefore each individual MLI blanket in the EM thermal balance test had flight heritage number of layers, despite
that the total number of layers of the two MLI blankets is larger than heritage.
On the spacecraft side, the boom tube and boom Ti-6Al-4V brackets are also insulated with MLI blankets. The
boom MLI is attached to the MAG sensor MLI in the vicinity of the adaptor plate (Fig. 11).

International Conference on Environmental Systems
8
Figure 11. MLI Interface in EM Thermal Balance Test.
C. Thermal Analysis
The total thermal conductance from the sensor base plate to the adaptor plate was estimated to be 0.0104 W
˚C-1
, which includes 0.006 W˚C
-1 for six equivalent point-contacts and 0.00444 W˚C
-1 for six Ti-6AL-4V screws.
6
The total thermal conductance between the sensor adaptor plate and boom bracket was estimated to be 0.02 W˚C-1
.
The sensor enclosure and adaptor plate MLI e* was assumed to be 0.05, since the MLI is very small. The lengths of
the outboard and inboard pigtail harness are assumed to be 0.3556 m long. Each harness has 16 nodes for conductors
and 32 nodes for MLI blankets. The conductors include 16 copper wires (26 AWG) and Neptape aluminum (2 layers
0.00889 mm each). The conductor’s node-to-node thermal conductances are 0.041 W˚C-1
. The harness MLI e* was
assumed to be 0.1 by using a tubular MLI design.
On the spacecraft side, with thermal isolation, a 0.16 W˚C-1
conductance between the boom tube and boom
bracket was assumed. The boom tube and boom bracket are assumed to be insulated with MLI blankets that have an
e* of 0.05 because they are very small in size. An Ultem spacer between the pigtail and boom tube was assumed.
The connector bracket is assumed to be conductively isolated from the boom by Ultem stansoffs and radiatively
isolated from space by MLI.
The boom is a hollow M55J tube with a 3.8 cm diameter and 1.5 mm thick wall. Heat conduction along the
boom’s longitudinal (Z) axis is negligible (Fig. 12 and Fig. 13). However, its interior is black and has a high
emittance and is non-specular. The boom segment under the boom bracket has no view to space. The interior of this
segment can only radiate heat to the interior of the other boom segments. As the distance from the mounting
interface increases, the view factor from the boom segment under the boom bracket to other boom segments
decreases. Since the boom interior is non-specular, the heat radiation from the boom segment under the boom
bracket to other boom segments decreases as the distance from the mounting interface increases (Fig. 12 and Fig.
13). In the worst cold case, the majority of the heat leaked to the spacecraft mounting interface from the MAG
sensor is radiated to space through the MLI over the boom bracket and boom segments adjacent to the mounting
interface. A minority of it is radiated to space through the MLI over the other boom segments.
Figure 12. Heat Leak from MAG Sensor to Boom.

International Conference on Environmental Systems
9
Figure 13. Thermal Resistance Network.
Fig. 14 and Fig. 15 show the SPP MAG sensor and boom integrated thermal model. The thermal nodes are as
follows:
90 nodes for each sensor.
10 nodes for each boom bracket.
2 nodes for the connector bracket.
64 nodes for the outboard boom.
64 nodes for the inboard boom.
96 nodes for the spacecraft harness from the connector bracket to the Fields electronics box.
24 nodes (boundary temperatures) for the spacecraft.
Figure 14. MAG Sensor and Boom Integrated Thermal Model.

International Conference on Environmental Systems
10
Figure 15. Thermal Model in Worst Hot Case.
StaMet black Kapton is used as the outer cover of all spacecraft MLI blankets. The worst hot case thermal
analysis results show that if this coating is used for the MAG, the MLI outer cover is very hot (>133˚C) in the
Comm Slew Downlink mission phase. A high temperature MLI layup with embossed Kapton as inner layers is
needed. Testing at Jet Propulsion Laboratory showed that the e* of this type of MLI is 19% larger than that with
Dacron or Polyester netting spacers7. Also it would require a high temperature bakeout at 143˚C or warmer.
Therefore StaMet black Kapton is not used for the MAG sensor MLI outer cover. Instead, the GSFC flight heritage
ITO/SiOx/VDA/Kapton coating, which has a much lower ratio of absorptance to hemispherical emittance (0.42
versus 0.75 at EOL; Table 2), is used. It reduces the MLI outer cover temperature by nearly 60˚C in the worst hot
case. Note that the BOL optical properties of ITO/SiOx/VDA/Kapton were recently measured at GSFC. The worst
hot case maximum temperature prediction of ITO/SiOx/VDA/Kapton meets Dacron netting maximum temperature
limits, intermittent or continuous, with adequate margin. Also ITO/SiOx/VDA/Kapton is electrically conductive,
and meets the 105 Ω per square mission requirement.
To prevent the ITO/SiOx coating from damaged by folding or sharp bending radii, ITO/SiOx/VDA/Kapton is
attached to the aluminized Kapton MLI outer cover by transfer adhesive after the MLI is installed.
Table 2. Comparison of Absorptance and Emittance between StaMet and ITO/SiOx/VDA/Kapton.
Cold Case Hot Case
BOL α BOL ε EOL α EOL ε
StaMet black Kapton 0.49 0.84 0.56 0.75
ITO/SiOx/VDA/Kapton 0.13 0.52 0.20 0.48
Fig. 16 presents worst cold case sink temperatures at 0.82 AU. Fig. 17 presents worst hot case sink temperatures
at 0.7 AU during the Comm Slew Downlink.

45th International Conference on Environmental Systems ICES-2015-194 12-16 July 2015, Bellevue, Washington
11
International Conference on Environmental Systems
Figure 16. Worst Cold Case Sink Temperature Predictions.

International Conference on Environmental Systems
12
Figure 17. Worst Hot Case Sink Temperature Predictions.
StaMet (boom MLI coating) and Germanium black Kapton (GBK) basically have the same optical properties.
GSFC measured the specularity of GBK to be 0.69. The specularity of StaMet should be the same. The solar
absorptance of ITO/SiOx/VDA/Kapton is significantly lower than that of StaMet (0.42 versus 0.75). Therefore if
sunlight is incident on the MAG sensor MLI (in the Downlink worst hot case at 0.7 AU), 80% of it is reflected to the
boom. Also the specularity of ITO/SiOx/VDA/Kapton is higher than that of StaMet (0.9 versus 0.69). The specular
reflection of sunlight from the MAG sensor MLI blanket to the boom is 90% of the reflection. Also there is sunlight
reflected between the boom bracket MLI and boom tube MLI.
The MAG sensor thermal effort has emphasized on the sensor, boom bracket and boom tube integrated thermal
analysis by using the optical properties of ITO/SiOx/VDA/Kapton for the MAG sensor MLI and StaMet for the
boom MLI. The results of the integrated thermal analysis show that in the worst hot case (Downlink at 0.7 AU), due
to highly specular reflection of sunlight between the MAG sensor MLI blanket and boom MLI blanket, and between
the boom bracket MLI blanket and boom MLI blanket, the maximum temperature prediction of the boom MLI
blanket is close to 180˚C (Fig. 17). Also the results of integrated thermal analysis show that the temperature prediction of the boom MLI blanket that is shaded from the sun by the MAG sensor (Fig. 17) is -160˚C or colder.
The optical properties of the coating on the exterior MLI outer cover over the boom bracket and boom segments
adjacent to the boom bracket have a large impact on the boom bracket temperature. A coating, such as ITO/SiOx,
that has a lower ratio of absorptance to emittance, for these surfaces will reduce the MLI outer cover (or exposed
M55J) temperature and was recommended to the spacecraft contractor. This will also assure even if the MLI is
shorted, it won’t cause overheating on the boom bracket.
The results of worst cold case thermal analysis showed that with 1.3 W heater power per sensor, the temperature prediction of the sensor is above the minimum operating AFT limit of -20˚C or the minimum non-operating AFT

International Conference on Environmental Systems
13
limit of -40˚C. The results of worst hot case thermal analysis showed that the sensor temperature prediction is about
40˚C below the maximum non-operating AFT limit of 60˚C.
VII. Verification of SPP Fields MAG Sensor Thermal Design
Generally a thermal balance test for an instrument or spacecraft cannot be performed until the flight hardware (or
at least an EM for an instrument) is built after the CDR. Without a correlated thermal model (i.e., model correlated
to thermal balance test results), a common practice is to use a range of MLI e* to bias the flight hardware colder in
the worst cold case and warmer in the worst hot case.
A main goal of the EM MAG sensor thermal balance test before the CDR was to verify that 1.3 W heater power
per MAG sensor achieves a sensor operating temperature within the heritage temperature range (no colder than -20˚C and preferably 0˚C). The test was performed in the Electrostatic Vacuum Chamber, which is a small vacuum
chamber with a usable volume of 0.5 m diameter x 0.6 m height, located in the Solar Wind Facility at GSFC.
A. Test Setup
In flight, the inboard and outboard MAG sensors are 0.8 m apart on the outboard boom (Fig. 18), and the
connector bracket is approximately half way between them. The heat conduction paths from the sensors to the boom
are also shown in Fig. 18. Only one EM MAG sensor was available for the thermal balance test. For the thermal
balance test to be conservative, a 0.406 m long M55J carbon composite tube was used as the boom simulator (Fig.
19). Its diameter and wall thickness are the same as in flight. Also a boom Ti-6Al-4V bracket simulator was used. It
was clamped to the boom tube simulator at a location to simulate the heat conduction paths from the sensor to the
boom tube (Fig. 19). To reduce thermal contact between the boom Ti-6Al-4V bracket and boom tube simulators, 15-
layers of Dacron netting were inserted at the interface between them. It was a quick, effective and no cost technique
to separate the boom bracket from the boom tube. It also satisfied EM MAG mechanical mounting. Better and more
effective techniques of thermal isolation are available for the flight hardware. An option was presented earlier.
At least two grounding straps are required for each thermal blanket to meet observatory-level electrostatic
requirements. They were included in the thermal balance test to simulate heat leak by conduction.
The lower end of the boom tube simulator was thermally isolated from the test fixture by G-10 spacers. A
connector plate simulator was thermally isolated from the test fixture. A GSE harness was used to supply voltage to
the MAG sensor. It simulated the spacecraft harness between the connector plate and FIELDS electronics box in
flight. The test fixture, connector bracket simulator and GSE harness were shielded from the chamber shroud wall
by MLI.
A total of ten thermocouples were used. It is the maximum number that the vacuum chamber feedthrough can
accommodate. Fig. 20 shows the locations of the thermocouples. Fig. 21 displays photographs of the test setup in the
vacuum chamber prior to pumpdown. The chamber shroud was cooled by liquid nitrogen in the test. The chamber
pressure was maintained at 1 x 10⁻⁶
torr or lower for the entire thermal balance test.
Figure 18. In-Flight MAG Sensors on Boom and
Conduction Paths.
Figure 19. Boom Tube, Boom Bracket and
Conduction Paths in Thermal Balance Test.
2.7 m
1.9 m

45th International Conference on Environmental Systems ICES-2015-194 12-16 July 2015, Bellevue, Washington
14
International Conference on Environmental Systems
Figure 20. Thermocouple Locations in Thermal Balance Test.
Figure 21. Thermal Balance Test Setup before Pumpdown.
B. Thermal Balance Stabilization Criteria
Thermal balance stabilization occurs when the rates of change of the control thermocouples (TC1 and TC2) are
0.1oC/hr for two hours over a period of six consecutive hours, with a decreasing trend over the six-hour period.
C. Test Results
Fig. 22 presents the temperatures of the thermocouples in the cold non-operating thermal balance test with 1.3 W heater power for the EM MAG sensor. TC4, which was next to the heater, on the base plate was at 11˚C. TC2 and
TC3, which were on the cover, were at -4˚C. TC1, which was on the base plate and not next to the heater, was at -
3˚C. From the thermal model, the temperatures of the bobbins are approximately the average (0˚C) of TC1, TC2,
TC3 and TC4. It agrees with the internal flight telemetry thermistor temperature. It meets the thermal requirement.
The thermal balance test results show that 1.3 W is a reasonable heater power allocation. TC7 and TC8, which were on the spacecraft boom bracket side of the mounting interface, were at -65˚C. The boom tube temperature, which
was adjacent to the boom bracket, was at -78˚C. The large temperature gradient (>70˚C) between the sensor base
plate and boom tube verifies adequate thermal isolation.
Chamber Shroud
MAG Sensor
Simulated Solar Flux Transmitted through
View Port

International Conference on Environmental Systems
15
Figure 22. Cold Case Non-Operating Thermal Balance Test Results for 1.3 W Heater Power.
Fig. 23 presents the temperatures of the thermocouples in the cold non-operating thermal balance test with 1.12
W heater power for the EM MAG sensor. The purpose was to determine the sensitivity of the sensor temperature to a reduction in heater power. TC4 was at -2˚C. TC2 and TC3 were at -19˚C. TC1 was at -20˚C. The temperatures of
the bobbins are approximately the average (-14˚C) of TC1, TC2, TC3 and TC4. It agrees with the internal flight
telemetry thermistor temperature. It meets the thermal requirement with a smaller margin. A 0.18 W heater power reduction led to a 15˚C sensor temperature decrease. Therefore heater power has a large impact on the sensor
temperature (approximately 78˚C per watt). TC7 and TC8 were at -73˚C. The boom tube temperature was at -83˚C.
It shows that as heater power is reduced, the heat leak from the sensor to the boom bracket and boom tube decreases.
Figure 23. Cold Case Non-Operating Thermal Balance Test Results for 1.12 W Heater Power.
Test Date: November 24, 2014
Test Date: November 20, 2014
72 hours
58 hours
0 hour
0 hour

International Conference on Environmental Systems
16
The EM cold case non-operating thermal balance test results show that the temperature gradient between the
boom bracket and boom is 12˚C for the 1.3 W heater power case, or 11˚C for the 1.12 W heater power test case. It
verified that the adding thermal isolation between the boom bracket and boom tube reduces the heat leak from the
MAG sensor to the boom. As discussed earlier, low emittance tape is also recommended for the boom segment
under the boom bracket to minimize heat radiation between the boom bracket and boom tube in flight.
Fig. 24 presents the temperatures of the thermocouples in the hot non-operating thermal balance test with 1.12 W
heater power for the EM MAG sensor and simulated solar flux of 2 suns incident on the MAG MLI. The purpose
was to determine the sensitivity of the sensor temperature to solar exposure at 0.7 AU. The temperatures of the bobbins are approximately the average (9˚C) of TC1, TC2, TC3 and TC4. It agrees with the internal flight telemetry
thermistor temperature. The results of this test show that solar heating with 2 suns at 0.7 AU increases the MAG sensor bobbin temperature by only about 23˚C. This is due to the use of ITO/SiOx/VDA/Kapton as the coating for
the sensor MLI outer cover. If StaMet black Kapton were used, the temperature increase will be much larger.
Figure 24. Hot Case Non-Operating Thermal Balance Test Results for 1.12 W Heater Power and 2 Suns.
Fig. 25 presents the temperatures of the thermocouples in a 3-hour transient cooldown with no heater power for
the EM MAG sensor and simulated solar flux of 2 suns incident on the MAG MLI. With 1.3 W heater power, the
sensor temperature was allowed to reach thermal stabilization first (Fig. 22). Then the heater was turned off, and the
solar simulator was turned on. The purpose was to determine the thermal capacitance of the sensor. The temperatures of the bobbins at the end of the cooldown are approximately the average (-42.2˚C) of TC1, TC2, TC3
and TC4. It agrees with the internal flight telemetry thermistor temperature. The results of the transient cooldown test show that without heater power the MAG sensor decreased by about 47.6˚C in 3 hours, despite that solar flux of
2 suns was incident on the sensor MLI. It was decreasing at 17˚C per hour after 3 hours.
66 hours 0 hour

International Conference on Environmental Systems
17
Figure 25. Transient Cooldown Test Results for No Heater Power and 2 Suns On.
D. Correlated Thermal Model
The second EM thermal balance test goal was to correlate the MAG sensor thermal model to the thermal balance
test data for use in flight temperature predictions. Based on the flight thermal model, an in-chamber thermal model
was developed (Fig. 26).
Figure 26. In-Chamber Thermal Model.
Correlating the in-chamber thermal model to the thermal balance test results revealed that the MLI e* is 0.075
for the sensor and 0.1 for the pigtail. If the MLI e* values are significantly different from the correlated values, the
thermal model won’t correlate to within 5˚C (maximum allowable at GSFC) of the thermal balance test data.
Therefore, these MLI e* values are used in the correlated thermal model for in-flight worst cold case and worst hot
case thermal analysis. Removing and re-installing a MLI could change the MLI e* due to workmanship. This was
practiced during the one-month long EM sensor thermal balance test. Test results show that it has no observable
75 hours 72 hours 0 hour

International Conference on Environmental Systems
18
effect on the thermocouple temperatures. The MLI e* values of 0.075 for the sensor and 0.1 for the pigtail are
expected to be repeatable for the flight MAG sensor MLI. A thermal balance test is planned for the MAG sensor
flight unit to re-verify the thermal design, including the MLI e*. Also the Fields instrument level or spacecraft flight
system level thermal balance test will re-verify the flight MLI e* at the integrated MAG sensor and boom level.
Correlating the thermal model to the thermal balance test results also revealed the following:
The total thermal conductance for the kinematic mounts between the sensor base plate and adaptor plate is 0.0104
W˚C-1
.
The total thermal conductance for the G-10 spacers and Ti-6Al-4V screws between the adaptor plate and boom
bracket is 0.016 W˚C-1
.
The thermal conductance between the boom bracket and boom tube is 0.8 W˚C-1
.
The thermal conductance between the connector bracket and test fixture is 0.002 W˚C-1
.
The MLI e* for the boom and connector bracket MLI is 0.075.
The total thermal capacitance of the MAG sensor, including the cover, base plate, bobbins, pigtail, adaptor plate
and kinematic mounts, is approximately 264 J˚g-1
˚C-1
.
Fig. 27 presents the thermal balance test temperature predictions by the correlated thermal model for 1.3 W
heater power. Table 3 compares the correlated thermal model temperature predictions to the test data for the four
thermal balance test cases. The correlated thermal model predicts temperatures within 5˚C of the test data.
Figure 27. Correlated Thermal Model Predictions for Thermal Balance Test.
Table 3. Comparison of Correlated Thermal Model Predictions and T/B Test Data.
TC # 1.3 W Heater
Power
1.12 Heater
Power
1.12 W Heater
Power and 2
Suns On
3 Hour Cooldown with
Heater Off and 2 Suns
On
Test
Data
Predict Test
Data
Predict Test
Data
Predict Initial
(Test)
Test
Data (3
Hr)
Predict
(3 Hr)
Sensor Cover 1, 2, 3 -5.4 -1.9 -18.1 -13.7 5.9 7.0 -5.4 -42.2 -38.4
Sensor
Adaptor Plate
5, 6 -52.5 -49.0 -58.7 -56.3 -43.3 -45.2 -52.5 -66.0 -63.6
Boom Bracket
Interface
7, 8 -65.8 -60.9 -69.7 -67.0 -56.7 -57.6 -65.8 -73.8 -69.7
Boom
Adjacent to
Boom Bracket
9 -77.8 -77.8 -79.3 -83.1 -69.5 -74.6 -77.8 -81.5 -79.9

International Conference on Environmental Systems
19
VIII. Flight Temperature Predictions by Correlated Thermal Model
The correlated thermal model is used to predict in-flight worst cold case and worst hot case temperatures for the
MAG sensors. Fig. 28 presents the MAG sensor non-operating cold case predictions. Table 4 is a summary of the
temperature predictions for selected components. The sensor bobbin and cover temperature predictions are well within the -40˚C to 60˚C non-operating AFT limits. As mentioned earlier, due to low power dissipation (0.05 W or
less), the sensor operating temperature is no more than 5˚C warmer than its non-operating temperature. It will be
well within the -20˚C to 40˚C operating AFT limits.
Figure 28. Correlated Thermal Model Predictions for Worst Cold Non-Operating Case Flight Temperatures.
Table 4. Correlated Thermal Model Predictions for Worst Cold Non-Operating Case Flight Temperatures (˚C).
Inboard MAG Outboard MAG
Sensor Cover 4.2 3.6
Sensor Bobbins 6.8 6.1
Sensor Adaptor Plate -49.4 -49.9
Boom Bracket I/F -63.9 -63.4
Boom Adjacent to Boom Bracket -87.2 -86.4
At the CDR, it was necessary to show the MAG thermal detailed design has adequate margins (at least 5˚C
margin except for heater controlled elements which have a maximum 70% heater duty cycle per GSFC GOLD Rule
4.25). The EM sensor thermal balance test has successfully helped to achieve this goal. Using the correlated thermal
model, with 1.3 W heater power the MAG sensor has a maximum heater duty cycle of 67.5% to maintain its operating temperature prediction at -20˚C in the worst cold case when the MAG sensors are in the spacecraft’s

International Conference on Environmental Systems
20
umbra. In terms of temperature, the 32.5% (or 0.423 W) heater power margin provides a temperature margin of at least 24˚C for the sensor bobbin and cover. The ratio of delta temperature to delta heater power is 7.3˚C per 100
mW, which is consistent with the EM thermal balance test results which show a 14˚C sensor temperature increase
when the heater power was increased from 1.12 W to 1.3 W.
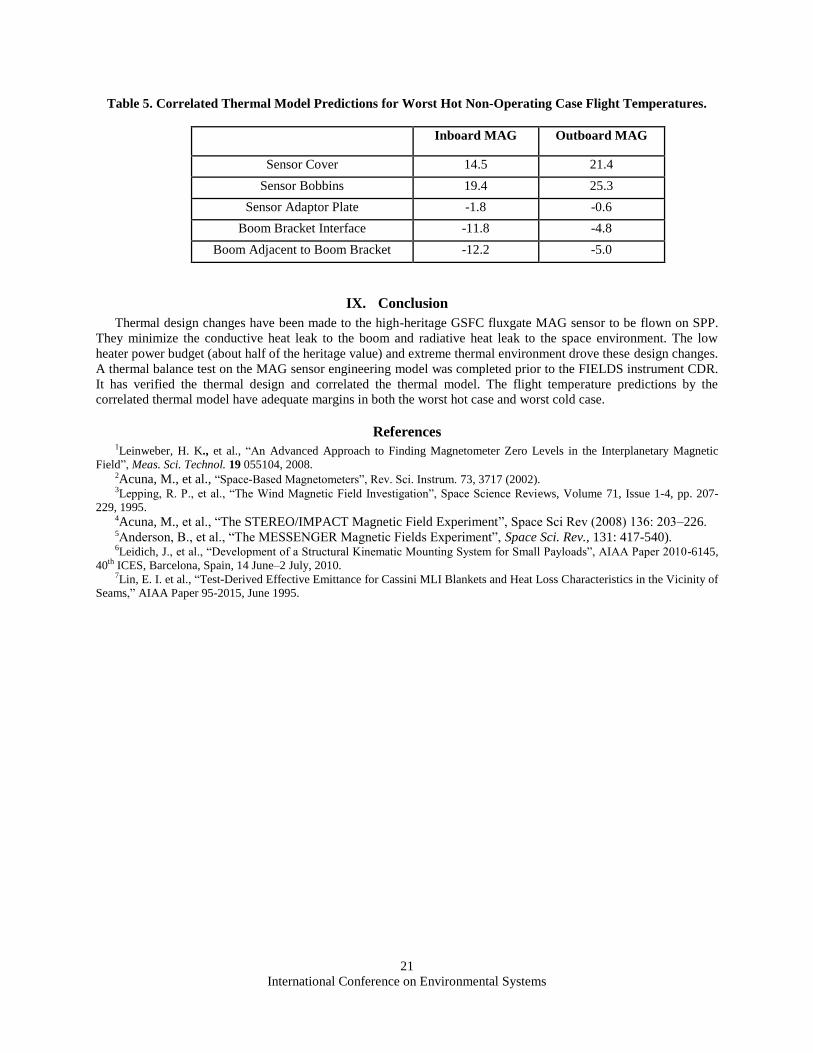
Fig. 29 presents the MAG sensor non-operating worst hot case predictions at 0.7 AU. Table 5 is a summary of
the temperature predictions for selected components. A small amount of heater power (0.12 W) maintains the sensor
temperature close to that in the worst cold case to minimize the temperature swing during the Comm Slew Downlink. The sensor bobbin and cover temperature predictions have a margin of at least 35˚C when compared to
the 60˚C non-operating maximum AFT limit. Therefore the MAG sensor thermal design adequately satisfies GOLD
Rule 4.25.
Figure 29. Correlated Thermal Model Predictions for Worst Hot Non-Operating Case Flight Temperatures.
International Conference on Environmental Systems
21
Table 5. Correlated Thermal Model Predictions for Worst Hot Non-Operating Case Flight Temperatures.
Inboard MAG Outboard MAG
Sensor Cover 14.5 21.4
Sensor Bobbins 19.4 25.3
Sensor Adaptor Plate -1.8 -0.6
Boom Bracket Interface -11.8 -4.8
Boom Adjacent to Boom Bracket -12.2 -5.0
IX. Conclusion
Thermal design changes have been made to the high-heritage GSFC fluxgate MAG sensor to be flown on SPP.
They minimize the conductive heat leak to the boom and radiative heat leak to the space environment. The low
heater power budget (about half of the heritage value) and extreme thermal environment drove these design changes.
A thermal balance test on the MAG sensor engineering model was completed prior to the FIELDS instrument CDR.
It has verified the thermal design and correlated the thermal model. The flight temperature predictions by the
correlated thermal model have adequate margins in both the worst hot case and worst cold case.
References 1Leinweber, H. K., et al., “An Advanced Approach to Finding Magnetometer Zero Levels in the Interplanetary Magnetic
Field”, Meas. Sci. Technol. 19 055104, 2008. 2Acuna, M., et al., “Space-Based Magnetometers”, Rev. Sci. Instrum. 73, 3717 (2002). 3Lepping, R. P., et al., “The Wind Magnetic Field Investigation”, Space Science Reviews, Volume 71, Issue 1-4, pp. 207-
229, 1995. 4Acuna, M., et al., “The STEREO/IMPACT Magnetic Field Experiment”, Space Sci Rev (2008) 136: 203–226. 5Anderson, B., et al., “The MESSENGER Magnetic Fields Experiment”, Space Sci. Rev., 131: 417-540). 6Leidich, J., et al., “Development of a Structural Kinematic Mounting System for Small Payloads”, AIAA Paper 2010-6145,
40th ICES, Barcelona, Spain, 14 June–2 July, 2010. 7Lin, E. I. et al., “Test-Derived Effective Emittance for Cassini MLI Blankets and Heat Loss Characteristics in the Vicinity of
Seams,” AIAA Paper 95-2015, June 1995.