solar power initiatives at st james’ anglican church hall, toowoomba, a community building. the...
TRANSCRIPT

Solar power initiatives at St James’ Anglican Church
Hall, Toowoomba, a community building.
The Ven Gary Harch
Archdeacon & Rector ©

Gary’s nine R’s
• Reverence for creation• Refuse to use resources unnecessarily• Reduce consumption and waste• Re-use resources where appropriate• Recycle materials where possible• Repair rather than throw away• Restore habitat and eco-systems• Renovate - rebuild rather than start from scratch• Record! Keep good records

For the most effective use of Solar power generation you also have to work
out how you will reduce power.
Reducing power is often the best way to make use of your money!
Try light reflectors, timers, low energy lights and many other ideas.
Solar hot water is different technology and more efficient than solar power.

The quadruple bottom line
Spiritual –
Environmental -
Economic -
Social –
Because of our beliefs we will address the greatest environmental needs first, if possible in the most economic way and to do it with the community. cf property planning. Not yet sub-catchment, but what if we do it with buildings next door?

Solar Power Generation
How? Power is generated by the solar cells and fed directly into the building; with excess power, not being used by the building, being fed back into the grid. The cells sit flat on the sloping, north facing roof. There is no storage of power.
• For a variety of safety and other reasons, when there is a blackout, the cells are isolated and no power is produced.
This grid connected solar power system can not work as a backup power system.
• It minimises capital expense, no batteries to make or buy.• This presentation doesn’t deal with the different types of
solar cells and their efficiencies. That depends on many factors: colour, temperature, sun spectrum, material the cell is made from, efficiency of the inverter, etc.

Power usage at St James’ CentreFor the three months Total Kwatt hrs Av kwatt hrs
(90-93 days) used in this period used per day
Up to 1/2/2007 3,415 kwatt hrs 37.1
Up to 1/5/2007 3,406 kwatt hrs 37.8
Up to 1/8/2007 3,370 kwatt hrs 36.6
Up to 1/11/2007 3,178 kwatt hrs 34.9
Up to 1/2/2008 3,298 kwatt hrs 35.5
Up to 1/5/2008 3,377 kwatt hrs 37.5
Up to 1/8/2008 3,536 kwatt hrs 38.4
Up to 1/11/2008 3,712 kwatt hrs 39.5
Up to 2/2/2009 3,202 kwatt hrs 35.2

RECORD
• Go back through your old power bills and record what you have actually used.
• When you start using new devices keep good records.
• At St James we keep a daily log and all our records are on computer for easy reference,
• If you haven’t measured it how do you know it has happened?

Comparing solar powered systems.
1. A solar system is given a rating in kilowatts eg at St James we installed 2.15 kwatts system (At St James there are 10 cells each with a .215 kwatt rating) To work out how much power your system on average will generate, multiply the system rating by Effective Sunlight Hours at place of installation. Toowoomba has a rating of 5. This is dependent on your latitude, smog & cloud cover. See next slide.Need to convert actual to Effective Sunlight Hrs.
Therefore on an average day over a year the present system at St James should generate 10.75 kwatt hours/day. Note your system rating can be changed by the size of your inverter and whether it is tracked and other factors.
Average actually generated for 10/5/08 to 12/2/2009 was 10 kwatt hrs/day.Our inverter at St James will become more efficient when we add a further 5
cells. Our system was designed to grow. Work out what you want now and in the future.
Use the above to compare your quotes at your site.Average power use in St James’ centre from over 2 years was
Was 37.3 kwatt hrs /day. (From the bills & inverter)


Conversion
Note average Daily sunshine hrs are not the same as effective daily sunshine hours.
In Toowoomba for the year June 2008 to June 2009 We have measured/calculated for our system an average of 4.6 effective sunlight hrs /day for our system.
Use this number with some caution as it is dependent on the efficiency of each system and where you live. There will be differences within a town and around the state.
Solar Energy Credits
Every system will also have RECs – Renewable Energy Credits
This is what you can sell.
It is a form of carbon emission trading.
These credits sell at different prices and for different lengths of time.
The system at St James had 44 solar RECs
(see slide on Rebates and RECs)

Costs of power
You pay a connection fee & a supply fee: For our supply at March 2009 the cost to the
parish of purchasing a kwatt hr of electricity from Ergon was either 22.1c (day time) or 7.8c (night and weekends).We sell excess power for 44c/kwatt hr.
This is a Qld trial initiative and the excess is not available at all locations.

What to read on the inverter and the bill
• Solar power was connected to St James’ on the 9th May 2008. The first bill after this, (1/8/08), was based on buying and selling power at the same rate.
• During the billing period of 92 days, with 83 days of solar generation, the cells generated a total of 741 kwatt hrs, (read from the inverter.) 141 kwatt hrs excess was fed back into the grid, (read from the bill); meaning 600 kwatt hrs went straight into the building.

• The Ergon electricity bill does not show the amount of solar power generated that is used directly by the building. It only shows net power into the building and excess solar power that is generated and fed back into the grid.You need to read the inverter to know the total amount that has been generated by the system; to work out:– 1. the true costs; – 2. the total amount of energy used by the building; – 3. to ensure your solar power is still working.
• For St James’. 2,795 + 741 = 3,536 kwatt hrs used by building in the 3 months to 1/8/2008 (see next slide)
The St James’ solar system is generating an average of 26% of total power used in the building.


Optimal usePower is used in the centre all day & night; and solar power is
generated during the day. Take note when most power is generated at different times of year
As noted the parish has now signed to buy power at 20c/kilowatt hour and to sell excess power generated at any one time for 44c/kilowatt hr.
It is optimal to minimise power used during peak daylight hours and maximise solar generation at that time.
Placement of cells has to be optimal. Correct elevation. Perhaps consider the cost of tracking devices and cf how much more power is generated. No shade!
Ensure you have the optimal size inverter. This is very important especially if you want to expand the system. Discuss this before installation.
Minimise Appliances: e.g Our Refrigerators Freezers are rated at using on average 7kilowatt hrs /day.

Solar power generation by monthExpected average at St James’ over a year
is 10.75 kwatt hrs /day Average solar kwatt hrs generated per day
at St James’ to date has been 10.1 kwatt hrs /day• May 2008 9.5 kwatt hrs/day• June 2008 9.0 kwatt hrs/day• July 2008 8.5 kwatt hrs/day• August 2008 10.9 kwatt hrs/day• Sept 2008 10.8 kwatt hrs/day • Oct 2008 11.5 kwatt hrs/day• Nov 2008 9.2 kwatt hrs/day• Dec 2008 10.4 kwatt hrs/day• Jan 2009 9.9 kwatt hrs/day• Feb 2009 9.8 kwatt hrs/day • March 2009 11.1 kwatt hrs/day
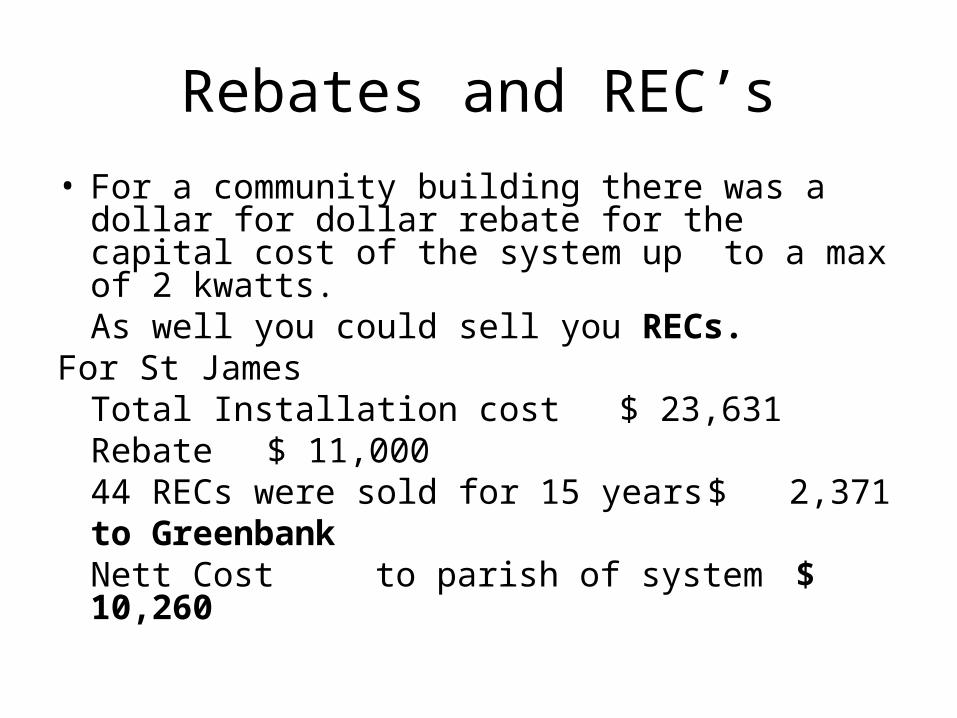
Rebates and REC’s
• For a community building there was a dollar for dollar rebate for the capital cost of the system up to a max of 2 kwatts.As well you could sell you RECs.
For St JamesTotal Installation cost $ 23,631Rebate $ 11,00044 RECs were sold for 15 years $ 2,371
to Greenbank Nett Cost to parish of system $ 10,260

Should I sell my renewable energy credits (REC’s)?
• The trading in carbon of which REC’s are one aspect is quite volatile. At present there is a voluntary market. It also depends on Federal Government policy.
• Do you need to have renewable credits you may want to use in your own industry in the future?
• If not you may be better off by selling them now, especially if you want to minimise your capital costs.

Profit/return
• For the first three months when everything was bought or sold at the same rate of 20c/kwatt hr the parish made a 5.8% return on the net capital investment of $10,260. (741 * $0.2*365/83)/$9327 = 7.1%
• This improved because since middle 2008 we are getting the larger rebate for selling excess power.
• The parish has signed up to sell excess power at 44c /kwatt hr.• On our last bill we would have made a 8.5% return. • That was in winter. Spring generation figures are better & the
building will also have a new tariff. Return was approx 10% over the 3 months. To 2/11/2008. For the 3 months to 2/2/09 the return was approx 7%. % return has dropped a bit since we have gone to a lower tariff – but so has the bill!
• A spreadsheet is available showing daily generation log.• When electricity prices go up, so does the return on the investment.
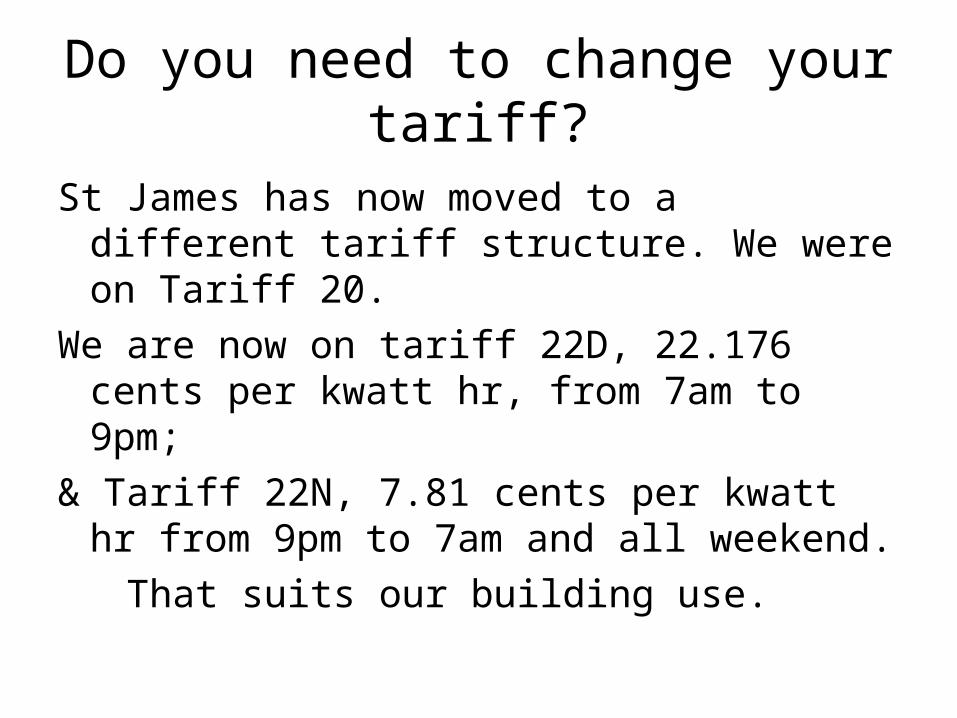
Do you need to change your tariff?
St James has now moved to a different tariff structure. We were on Tariff 20.
We are now on tariff 22D, 22.176 cents per kwatt hr, from 7am to 9pm;
& Tariff 22N, 7.81 cents per kwatt hr from 9pm to 7am and all weekend.
That suits our building use.

Current estimated return
Estimate ((590* $0.2176+ 236*.0781)+$92.4))*365/94)/$9,327 is a 10% return for the three months ending3rd Nov 2008.
Therefore across the whole year a return of 9% seems reasonable.

Barriers to change to renewable energy?
Australian Financial Review 24 September 2007

Estimated cost over lifetime Going on what has happened so far in 2008 - over the lifetime of the
system (without adding in interest or allowing for price rises)1 year estimate 3,644 kwatts
This is based on the production so far May to OctoberFor 20 years estimate 72 megawatts $9,327 cost of installationCost over lifetime - say $ 130/megawatt hrPresently buying at $200/megawatt hr.We are also selling some of the power at $440/megawatt hr.
What will electricity cost to buy over the next 20 years?
Note: So far 41 pieces of correspondence/forms be prepared for the paperwork.

How accurate is the effective sunlight hours rating?
• Our daily log shows that at present, if our system rating is accurate, then for the 175 days from 1/5/08 to 30/11/08 the average no of effective sunlight hours in Toowoomba has been 4.6.
• It will be interesting to track this for a year, or several years, to see how close it gets to 5. An accurate number for where you live is necessary in estimating your return.
• Our system may not be most efficient and this might be one reason the average is not 5. 2008 may also have been a more cloudy year than usual?

Where next?
• The parish can increase its system to a max 5 kwatt system and still sell the excess power at 44c/kwatt hr.
Cells will be bought at full price, but will be more efficient. Assuming we have to spend $24,000 to get another 2.75 kwatts; and assuming 80% generates excess power, then we will get 8% return on that extra investment.
• Go to solar or gas hot water, thus reducing power consumption and increasing return on power; esp seeing at the moment we don’t have off peak hot water power.
• There is an offer with a State Gov’t sponsored company of much cheaper capital costs for a 1.5 kwatt system. (Households). Do your own research on that.

Future Solar plant at St James’ Anglican Church Toowoomba?
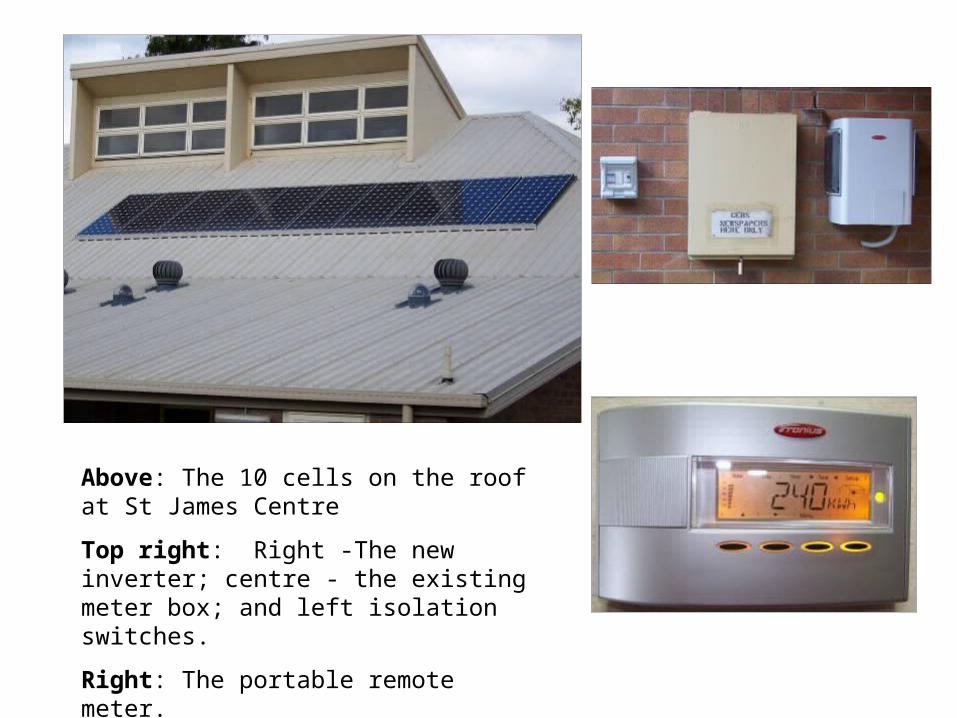
Above: The 10 cells on the roof at St James Centre
Top right: Right -The new inverter; centre - the existing meter box; and left isolation switches.
Right: The portable remote meter.

Need some help in applying for the Photovoltaic Rebate from the Federal Government for a community building?
Why do you want to install solar power? Financial ? Environmental ? Both?Do you have a community building with a north facing roof free of shade?What is the slope of the roof? This will help determine the installation costs.The Federal Government rebate is dollar for dollar up to $12,000.(with conditions)How much money is your organisation prepared to spend?We have estimated that the return on the capital spent at St James is 5-8%.
Download the community guidelines from the web or get a copy from your Federal Member. See www.greenhouse.gov.au/rebates. These rebates may have changed since this presentation was produced.
Get a copy of your most recent power bill. Get a copy of your rates notice.You will need these to help work out the design of your system, your return and to hand in
with the application.
Talk about the installation of solar power with whoever makes the decisions in your organisation.
Try to arrange some agreements in principle to proceed.Do you think you can meet the guidelines? Others can help you with what they have
done.

Talk with a solar power company. Get recommendations. They will help you design a system around how much you want to spend and/or your building needs and give you a quote. Ask them about all the conditions you will have to meet e.g. selling power for a minimum time etc.
Discuss with your organisation the quote.Make a decision.Your application for the rebate will probably have to be submitted through the
solar power company along with some technical information.You will get a response from the Federal Government either asking for more
information or approval. The rebate will be given when you have shown substantial commitment to the public education.
There is a process to the installation. Certain components have to be placed in order to meet safety requirements etc. Make sure you continue to meet your agreed obligations to get the rebate.
More information? Contact: Fr Gary at St James Parish Office (07 4639 1858 Parish website: www.stjames.org.au Parish email: [email protected] Rebates are also available for owner occupied houses. (means tested)The above website will give details and see back page.
