solar photovoltaic (pv) program testimony · solar photovoltaic (pv) ... table iv-4 estimated...
TRANSCRIPT

1469812
Application No: A.08.03.015 Exhibit No. SCE-1 Witnesses: R. Fisher
D. Klun M. Nelson
R. Perez G. Rodrigues
D. Snow
(U 338-E)
Solar Photovoltaic (PV) Program Testimony
Before the
Public Utilities Commission of the State of California
March 27, 2008
Rosemead, California

Solar Photovoltaic (PV) Program Table Of Contents
Section Page Witness
-i-
I. INTRODUCTION AND OVERVIEW .............................................................1 M. Nelson
II. NEED FOR PROGRAM ...................................................................................3
A. Implementation Of SCE’s Proposed Large Solar PV Program Will Contribute To State Goals To Promote Both Solar PV and Renewable Power ............................................................3
B. SCE Can Best Develop Solar PV Program............................................7
1. System Operation And Integration Into The CAISO System........................................................................................7
2. Customers Receive Credit For Solar PV Output .......................7
3. Existing Business Relationships And Resources Can Be Leveraged......................................................................8
4. SCE’s Extensive History And Experience With Solar Generation ........................................................................9
C. SCE’s Solar PV Program Will Increase The Probability That The Million Solar Roofs Goal Will Be Met ................................11
D. Solar PV Program Can Improve Efficiencies of Elements Of The California Solar PV Market To Reduce Costs ........................12
E. The Solar PV Program Will Provide Unique Benefits And Challenges From the Addition Of Large Amounts of Solar PV To SCE’s System...........................................................................15
F. The Solar PV Program Will Provide Valuable Information To The State.........................................................................................17
1. Information On Interaction Of Solar PV With The Distribution System .................................................................18
2. Information And Experience Forecasting Solar PV Output ......................................................................................19
3. Information On Workforce Training .......................................19
4. Information On Streamlining Of Tariff Applications For Solar PV ............................................................................19

Solar Photovoltaic (PV) Program Table Of Contents (Continued)
Section Page Witness
-ii-
III. PROGRAM DESCRIPTION...........................................................................20 R. Perez
A. Size of Program....................................................................................20
B. Length of Program ...............................................................................20
C. Description of Facilities.......................................................................22
1. Type of Facilities .....................................................................22
a) Crystalline Technology................................................22
b) Thin Film Technology .................................................24
c) Technology Comparison..............................................26
d) Inverters and Balance of System..................................27
e) PV Module Mounting Systems....................................28
f) Building Integrated PV ................................................30 G. Rodrigues
2. Size of Facilities.......................................................................32 R. Perez
3. Location and Configuration of Facilities .................................33
4. Interconnection Facilities.........................................................35
5. Data Acquisition System (DAS)..............................................37
6. Leasing Rooftop Space For Facilities ......................................38
IV. PROGRAM COST ESTIMATE......................................................................40
A. Capital ..................................................................................................40
1. Generating Facilities Cost........................................................40
2. Installation Cost .......................................................................40
3. Interconnection Costs...............................................................42
4. Total Program Capital Costs....................................................42
B. Operation & Maintenance Cost ...........................................................44
1. Roof Lease Payments...............................................................44

Solar Photovoltaic (PV) Program Table Of Contents (Continued)
Section Page Witness
-iii-
2. Maintenance Cost.....................................................................45
3. Staffing.....................................................................................45
V. RATEMAKING...............................................................................................48 D. Snow
A. Introduction..........................................................................................48
B. Forecast of SCE’s Solar PV Program Revenue Requirements .......................................................................................48
1. Capital Expenditures/Additions ...............................................50
2. Depreciation Expense ..............................................................51 R. Fisher
a) Generating Facilities Plant...........................................51
(i) PV Modules and Balance of System Components .....................................................51
(ii) PV Rack ...........................................................53
b) General Plant................................................................53
c) Distribution Plant .........................................................53
3. Rate of Return ..........................................................................54 D. Snow
4. O&M Expense .........................................................................54
5. Income Taxes ...........................................................................55 D. Klun
C. Description of Solar PV Program Balancing Account (SPVPBA)............................................................................................56 D. Snow
D. Proposed Reasonableness Review and Standard for Reasonableness Review.......................................................................57
1. Inflation Adjustment ................................................................58 P. Hunt
2. Reasonableness Review Procedure..........................................58 D. Snow
Appendix A Witness Qualifications .....................................................................................60
Solar Photovoltaic (PV) Program List of Tables
Section Page
-iv-
Table II-1 Typical Residential Solar PV Installation (3 kW +/- 0.05).........................................................9
Table II-2 Typical Large Residential Solar PV Installations (900 kW – 1MW) .........................................9
Table III-3 Estimated Solar PV Program Schedule ...................................................................................22
Table IV-4 Estimated Hardware Cost for 1 MW Solar PV Project (2008$) ............................................40
Table IV-5 Estimated Installation Cost for 1 MW Solar PV Project (2008$) ...........................................41
Table IV-6 Summary of Capital Costs of Solar PV Program (2008$) ......................................................43
Table IV-7 Estimated Yearly O&M Costs for a 1 MW Solar PV Project (2008$) ..................................45
Table IV-8 Solar PV Program Management Labor Forecast Increase For New Employees
(2008$).................................................................................................................................................46
Table IV-9 Forecast Summary of Staffing Costs of Solar PV Program....................................................47
Table V-10 Summary of Solar PV Program Estimated Revenue Requirements (O&M
and Capital Costs) Thousands of Dollars............................................................................................49
Table V-11 Summary of Solar PV Program Calendar Year Capital Expenditures
$millions ..............................................................................................................................................51
Table V-12 Summary of Future Decommissioning Expenses (included in Depr. Expense)
thousands of dollars .............................................................................................................................52
Table V-13 Summary of Solar PV Program Calendar Year Estimated O&M Expenditures
$millions ..............................................................................................................................................55
Table V-14 Reasonableness Review Threshold For Direct Solar PV Program Capital
Costs (2008$) .......................................................................................................................................58
Solar Photovoltaic (PV) Program List of Figures
Section Page
-v-
Figure II-1 Chart of Solar PV Output vs. Time of Day Center for the Study of Energy
Markets, 2005 ......................................................................................................................................16
Figure III-2 Typical Crystalline Solar PV Module 175 watts measuring approximately
64”x 32” x 1.75” and weighing 33 pounds ..........................................................................................23
Figure III-3 Typical Amorphous Thin Film Module Measuring 18 feet long by 15.5”
wide and Weighing_17 lbs...................................................................................................................25
Figure III-4 Typical Rigid Thin Film PV Module Measuring 4 feet long by 2 feet wide
and Weighing 26.5 lbs. ........................................................................................................................26
Figure III-5 500kW ac Inverter and Transformer Inverter measuring 7.6”x9.6’x3’6”
(HxWxD) transform measuring 5’x4’x4’ (HxWxD) and weighing combined
approximately 9,800 pounds................................................................................................................28
Figure III-6 1.2 MW Non-Penetrating Solar PV System on Commercial Rooftop in
Sacramento, CA ...................................................................................................................................30
Figure III-7 Photograph of the Long Beach Convention and Entertainment Center
illustrating the solar PV array is not visible from street level..............................................................33
Figure III-8 Proposed System Single Line Simplified Interconnection ....................................................37
Figure III-9 Proposed System Single Line Complex Interconnection......................................................37

1
I. 1
INTRODUCTION AND OVERVIEW 2
California is endowed with abundant solar resources. In recent years, the State has taken bold 3
steps to develop this resource, but more can be done. In this application, Southern California Edison 4
Company (SCE) proposes the Solar Photovoltaic (PV) Program, an aggressive program to develop up to 5
250 megawatts (MW)1 of utility-owned Solar PV generating facilities ranging in size from 1 to 2 MW2 6
each. This program is targeted at the vast untapped resource of commercial and industrial rooftop space 7
in SCE’s service territory.3 It will aggressively bridge the gap between small and large scale solar 8
installations. It will also use rooftop space from entities that would not otherwise be typical candidates 9
for the net energy metering tariff.4 SCE proposes to develop these projects at a rate of approximately 50 10
MW per year at an average cost of $3.50/Watt (W). If the program is successful, SCE may seek 11
additional authority to expand the program to 500 MW. An expansion to 500 MW would seek to 12
maintain the momentum of that success. So, there is no hiatus in installing new systems. SCE’s 13
proposed Solar PV Program is a near-term bold step to further develop California’s solar resources 14
independent of the need for major new transmission facilities. 15
California has implemented an aggressive program, the California Solar Initiative (CSI), to 16
facilitate the development of solar projects. The Renewable Portfolio Standard (RPS) also facilitates 17
development of solar projects, along with other renewable resources. But these programs have left a 18
large solar gap. As described in detail below, SCE’s Solar PV Program is uniquely qualified to fill this 19
1 Unless otherwise specified, any reference to energy output in this filing follows the common convention within the PV
industry, which is to refer to output as PV panel direct current (dc) output. Additionally, SCE proposes using installed dc output in reasonableness reviews because installation occurs in dc panels. Based on sample calculations, the conversion factor of 0.90 will convert from MW dc to MW alternating current (ac) using the California Energy Commission’s ac MW conversion (i.e., multiply MW dc by 0.90 to obtain MW CEC-ac Rating).
2 SCE envisioned the individual Solar PV Program installations to range from 1 to 2 MW. As the program proceeds, however, some installations may be larger or smaller than this range due to roof size, circuit loading, optimal use of inverters or other considerations.
3 While SCE presently intends the program for rooftops, SCE may pursue other locations and opportunities for placement of Solar PV facilities.
4 Net energy metering installations, which are limited to 1 MW, allow utility customers to receive California Solar Initiative (CSI) incentives and off-set their energy usage by their solar PV system output over a 12-month period.

2
gap, because this bandwidth (1 to 2 MW facilities) of the solar resource is going untapped. There is 1
currently no program in place to develop this market segment. By further developing this aspect of the 2
solar market, the Solar PV Program will contribute in the near term to achieving the State’s CSI million 3
solar rooftop goals. It will also contribute to meet renewable goals. 4
Furthermore, SCE anticipates that the aggressive development of this “middle market” for solar 5
PV in southern California will attract investment, manufacturing, and expertise to California’s solar 6
industry. This will increase supply options and should reduce the cost for all solar PV products and 7
services. In turn, broadening and deepening the local solar PV market will produce savings in the 8
State’s CSI program. Simply stated, reducing the installed cost of solar PV will leverage the subsidy 9
dollars already allocated to the CSI program and produce more capacity and energy deliveries for 10
California’s investment in solar PV. 11
Finally, SCE is uniquely qualified to develop this market sector. These facilities will 12
interconnect at the utility distribution level and will be sited at SCE retail customer locations. SCE’s 13
strong balance sheet, institutional expertise, and SCE’s long history of solar “firsts” makes it a logical 14
candidate to pioneer innovations in the untapped industrial and commercial rooftop market through this 15
program. 16

3
II. 1
NEED FOR PROGRAM 2
A. Implementation Of SCE’s Proposed Large Solar PV Program Will Contribute To State 3
Goals To Promote Both Solar PV and Renewable Power 4
In 2006, Governor Schwarzenegger, working with the Commission and the California 5
Legislature, established a CSI designed to develop 3,000 MW of rooftop solar PV installations by 2016. 6
The State has authorized substantial incentives to achieve this aggressive target of 1 million rooftop 7
solar installations. 8
Solar is a renewable resource. The State has adopted one of the most aggressive RPS programs 9
in the country. The goal is to have 20% of SCE’s customers’ energy needs met with renewable 10
resources.5 Although not specifically targeted at solar resources, the RPS program has the potential to 11
yield substantial development of large central-station solar resources over the next decade. Several 12
large-scale, central station solar installations are under contract or in development as a result of SCE’s 13
RPS program solicitations. 14
But these programs have left a large solar gap. California’s CSI is geared to develop very small 15
solar PV installations. California’s RPS program is geared to develop very large solar (not necessarily 16
PV) installations. Neither program, however, is well suited to develop medium-scale PV solar 17
installations in the 1 to 2 MW range in the near-term due to size and transmission limitations. And 18
although the economics of 1 to 2 MW PV facilities are far superior to typical rooftop facilities, they are 19
too large to take full advantage of the State’s CSI and net energy metering6 programs. Many large 20
commercial rooftops have site electrical loads that do not match the energy production of a 1 to 2 MW 21
5 Public Utilities Code Section 399.15(b)(1) sets forth a goal that 20% of retail electric sales be served by renewable
resources by 2010:
Each retail seller shall, pursuant to subdivision (a), increase its total procurement of eligible renewable resources by at least an additional 1% of retail sales per year so that 20% of its retail sales are procured from eligible renewable energy resources no later than December 31, 2010…
6 Net energy metering installations are limited to 1 MW. Distributed Generation installations that receive CSI or Self Generation Interconnection Program (SGIP) funds are limited to 5 MW in size, but may receive incentives for up to 1 MW under CSI even if they received 1 MW under SGIP for a potential total incentives of 2 MW per site.
4
solar PV facility. Conversely, other utility-scale solar technologies, such as parabolic trough, Stirling 1
dish and “power tower” installations are not commercially practicable in distributed configurations, 2
urban and semi-urban locations, or at the 1 to 2 MW scale. SCE’s Solar PV Program fills this solar gap. 3
There is currently no other program in place to develop this important market sector. SCE proposes 4
immediate start-up of the Solar PV Program to bridge the solar gap and to assist in meeting the State’s 5
renewable goals. 6
SCE’s Solar PV Program is targeted at the vast untapped resource of commercial and industrial 7
rooftop space in SCE’s service territory. This program will aggressively bridge the gap between small 8
and large scale solar installations. Although this program will focus on a fertile market sector 9
undeveloped by either the CSI or RPS programs, the program will contribute to both goals. In CSI 10
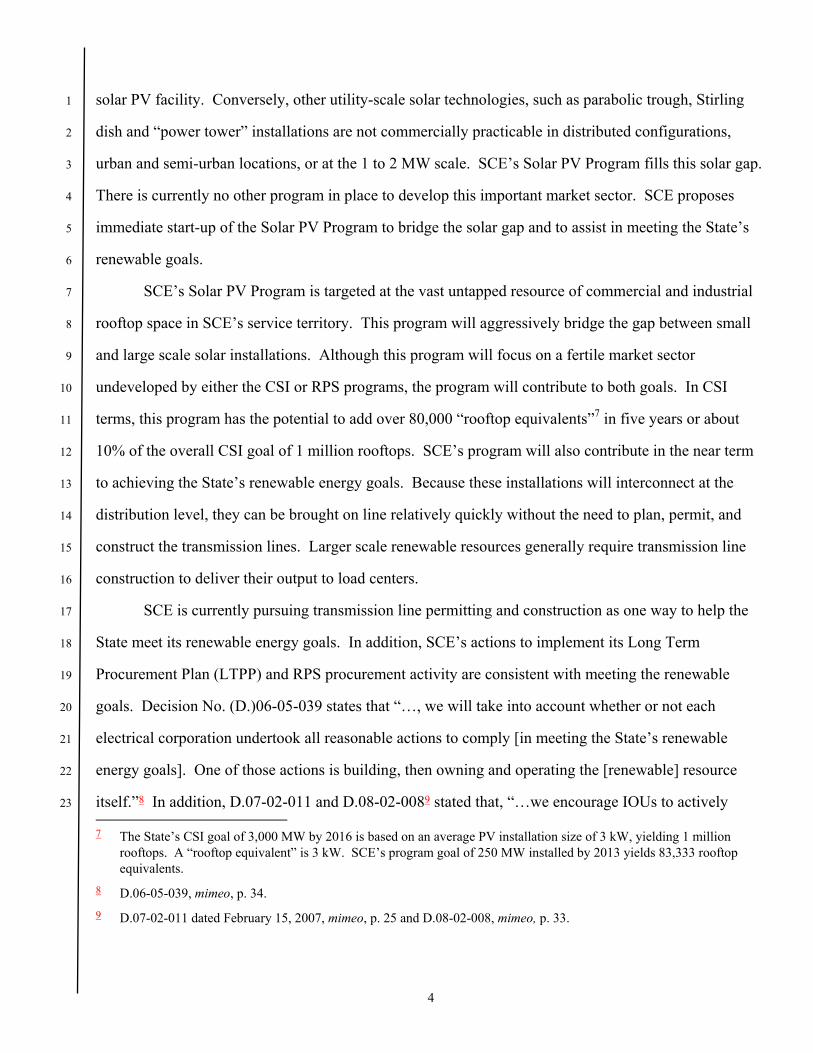
terms, this program has the potential to add over 80,000 “rooftop equivalents”7 in five years or about 11
10% of the overall CSI goal of 1 million rooftops. SCE’s program will also contribute in the near term 12
to achieving the State’s renewable energy goals. Because these installations will interconnect at the 13
distribution level, they can be brought on line relatively quickly without the need to plan, permit, and 14
construct the transmission lines. Larger scale renewable resources generally require transmission line 15
construction to deliver their output to load centers. 16
SCE is currently pursuing transmission line permitting and construction as one way to help the 17
State meet its renewable energy goals. In addition, SCE’s actions to implement its Long Term 18
Procurement Plan (LTPP) and RPS procurement activity are consistent with meeting the renewable 19
goals. Decision No. (D.)06-05-039 states that “…, we will take into account whether or not each 20
electrical corporation undertook all reasonable actions to comply [in meeting the State’s renewable 21
energy goals]. One of those actions is building, then owning and operating the [renewable] resource 22
itself.”8 In addition, D.07-02-011 and D.08-02-0089 stated that, “…we encourage IOUs to actively 23 7 The State’s CSI goal of 3,000 MW by 2016 is based on an average PV installation size of 3 kW, yielding 1 million
rooftops. A “rooftop equivalent” is 3 kW. SCE’s program goal of 250 MW installed by 2013 yields 83,333 rooftop equivalents.
8 D.06-05-039, mimeo, p. 34. 9 D.07-02-011 dated February 15, 2007, mimeo, p. 25 and D.08-02-008, mimeo, p. 33.
5
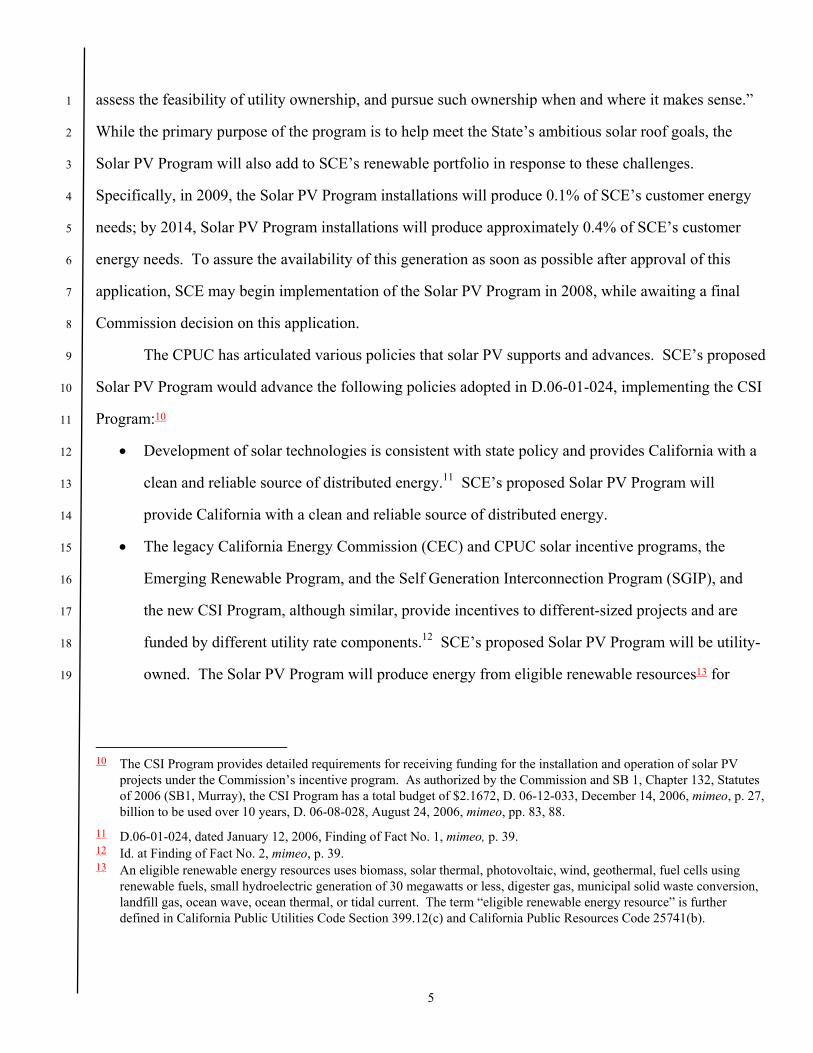
assess the feasibility of utility ownership, and pursue such ownership when and where it makes sense.” 1
While the primary purpose of the program is to help meet the State’s ambitious solar roof goals, the 2
Solar PV Program will also add to SCE’s renewable portfolio in response to these challenges. 3
Specifically, in 2009, the Solar PV Program installations will produce 0.1% of SCE’s customer energy 4
needs; by 2014, Solar PV Program installations will produce approximately 0.4% of SCE’s customer 5
energy needs. To assure the availability of this generation as soon as possible after approval of this 6
application, SCE may begin implementation of the Solar PV Program in 2008, while awaiting a final 7
Commission decision on this application. 8
The CPUC has articulated various policies that solar PV supports and advances. SCE’s proposed 9
Solar PV Program would advance the following policies adopted in D.06-01-024, implementing the CSI 10
Program:10 11
• Development of solar technologies is consistent with state policy and provides California with a 12
clean and reliable source of distributed energy.11 SCE’s proposed Solar PV Program will 13
provide California with a clean and reliable source of distributed energy. 14
• The legacy California Energy Commission (CEC) and CPUC solar incentive programs, the 15
Emerging Renewable Program, and the Self Generation Interconnection Program (SGIP), and 16
the new CSI Program, although similar, provide incentives to different-sized projects and are 17
funded by different utility rate components.12 SCE’s proposed Solar PV Program will be utility-18
owned. The Solar PV Program will produce energy from eligible renewable resources13 for 19
10 The CSI Program provides detailed requirements for receiving funding for the installation and operation of solar PV
projects under the Commission’s incentive program. As authorized by the Commission and SB 1, Chapter 132, Statutes of 2006 (SB1, Murray), the CSI Program has a total budget of $2.1672, D. 06-12-033, December 14, 2006, mimeo, p. 27, billion to be used over 10 years, D. 06-08-028, August 24, 2006, mimeo, pp. 83, 88.
11 D.06-01-024, dated January 12, 2006, Finding of Fact No. 1, mimeo, p. 39. 12 Id. at Finding of Fact No. 2, mimeo, p. 39. 13 An eligible renewable energy resources uses biomass, solar thermal, photovoltaic, wind, geothermal, fuel cells using
renewable fuels, small hydroelectric generation of 30 megawatts or less, digester gas, municipal solid waste conversion, landfill gas, ocean wave, ocean thermal, or tidal current. The term “eligible renewable energy resource” is further defined in California Public Utilities Code Section 399.12(c) and California Public Resources Code 25741(b).

6
SCE’s customers. To the contrary, incentive programs give the customer generator the 1
renewable energy credit which is not currently eligible for use in California. 2
• A 10-year commitment by the state to provide incentives for solar installations provides a signal 3
to manufacturers and other industry participants that encourages innovation and development.14 4
SCE’s proposed Solar PV Program will provide a signal to industry participants that large-scale 5
solar PV projects on commercial-size roofs are a viable power source. This will transform the 6
market for installation of such projects without depending on incentives. 7
• All solar energy technologies have the potential to reduce demand for fossil fuels and 8
investments in more traditional energy resources and provide environmental benefits.15 SCE’s 9
proposed Solar PV Program also has the potential to reduce demand for fossil fuels. 10
SCE proposes this program in furtherance of the State's goal to increase the installation of solar 11
PV technology. Our proposed program will achieve this goal at lower cost and will further help jump-12
start the solar industry. The cost to our customers of the Solar PV Program will be significant, but far 13
less than the cost of CSI implementation.16 For these reasons, if the CSI goals become mandatory for 14
SCE's customers, SCE requests that the MWs installed under its program be "credited" towards its 15
customers' targets. In addition, the cost impact on our customers is not insubstantial. They already bear 16
the annual cost of the CSI program and the carrying costs of the Solar PV program if SCE's application 17
is granted. This may justify reducing their share of the State's CSI goals and potentially some portion of 18
the CSI program costs our customers contribute. 19
SCE proposes a base case budget of about $875 million and a reasonableness threshold of $962.5 20
million to be used over 5-years to produce 250 MW of solar PV power. SCE’s program will improve 21
the efficiency and increase use of solar PV consistent with State goals and policies. 22
14 Id. at Finding of Fact No. 4, mimeo, p. 39. 15 Id. at Finding of Fact No. 5, mimeo, p. 39. 16 See Section II.B.3, infra.

7
B. SCE Can Best Develop Solar PV Program 1
1. System Operation And Integration Into The CAISO System 2
SCE, as operator of its distribution system, has the technical expertise to evaluate the 3
various solar PV technologies and their impacts on its distribution system. SCE will study solar PV 4
panel and inverter efficiency. SCE can monitor system status and cost-effectively facilitate repair of 5
these systems through its field personnel. SCE is the only California Independent System Operator 6
(CAISO) participant scheduling solar resources into the CAISO electric grid. SCE is very aware of the 7
challenge solar generated electricity creates. Solar PV resources over 1 MW must schedule power with 8
the CAISO and will likely participate in the CAISO’s Participating Intermittent Resource Program 9
(PIRP). 10
The current PIRP does not include solar resources. SCE will work with the CAISO to 11
formulate protocols, data acquisition system requirements and forecast methods for solar PV resources 12
just as SCE has done with the wind PIRP. The Solar PV Program will provide SCE with operational 13
control of a utility-owned solar generating resource. This will greatly facilitate development of a solar 14
PIRP. 15
2. Customers Receive Credit For Solar PV Output 16
Solar PV output is eligible to be counted towards the State’s renewable goal of meeting 17
20% of customers energy needs with renewable resources. However, utilities and their customers do not 18
receive credit for the output associated with Solar PV projects installed pursuant to the State’s CSI 19
program, as the customer/owner of the PV facility retains the renewable energy credit.17 Solar PV 20
installed by SCE under the Solar PV Program will count towards SCE’s RPS goals. The Solar PV 21
Program would provide 50 MW each year for 5 years. A generating facility with a 45 MW capacity and 22
an 18% capacity factor is expected to generate 70,956 MW18 per year. In 2009, this would equate to 23
approximately 0.1% of SCE's customer energy needs. A generating facility with a 225 MW capacity 24
17 See, D.07-01-018, mimeo, p. 20 and Ordering Paragraph 1, mimeo, p. 31.. 18 Expected generation shown is assumed to be ac MWh like any other generation SCE procures under the RPS program.
8
and an 18% capacity factor is expected to generate 354,780 MWh19 per year. In 2014, this would equate 1
to approximately 0.4% of SCE's customer energy needs. This supports the State’s overall goals. 2
3. Existing Business Relationships And Resources Can Be Leveraged 3
SCE has established electricity supply relationships with potential vendors and 4
commercial building lessors who are also its customers. These entities see SCE as a reliable business 5
partner, in part because SCE has been in business for over 100 years. SCE’s utility operations are 6
viewed as a stable, competent, and reliable. SCE’s strong balance sheet and procurement expertise 7
allow the utility to readily negotiate contracts with rooftop owners and vendors. SCE expects to receive 8
volume discounts for its proposed investment. Multiple developers are unlikely to achieve the same 9
efficiencies and favorable pricing levels. Because of these established relationships and volume 10
discounts, SCE can move quickly and efficiently to develop the Solar PV Program. 11
SCE can expand solar PV implementation at a lower cost than is currently in effect for 12
CSI customers. Tables II-1 and II-2 below compile CEC data from CSI Photovoltaic Installation 13
Applications from January 1, 2007 to March 1, 2008. The chart compares total installed costs for 14
residential (3 kW nominal size) and large commercial (900kw to 1 MW size) solar PV projects. On 15
average, residential solar PV installations cost $8.25/W, while large commercial installations cost 16
$6.78/W. SCE’s Solar PV Program budgeted cost is $3.50/W on average and proposed reasonableness 17
threshold is $3.85/W on average. SCE expects to achieve these substantially lower installed costs 18
through the volume of the proposed projects creating economies of scale and by partnering with PV 19
suppliers providing newer technologies at considerable cost savings. 20
19 Id.

9
Table II-1 Typical Residential Solar PV Installation (3 kW +/- 0.05)
Utility # Average Total
Cost
Average Nameplate
Rating (kW) Average Cost per Watt
($/W)
SCE 42 $24,206 3 $8.07
PG&E 103 $25,625 3 $8.54
CCSE 11 $24,591 3 $8.22
Table II-2 Typical Large Residential Solar PV Installations (900 kW – 1MW)
Utility # Average
Total Cost
Average Nameplate Rating
(kW) Average Cost per
Watt ($/W)
SCE 29 $7,617,496 1,165 $6.56
PG&E 28 $8,191,391 1,160 $7.08
CCSE 5 $7,698,611 1,190 $6.47
4. SCE’s Extensive History And Experience With Solar Generation 1
In addition to its location, strong balance sheet and institutional expertise, SCE’s long 2
history of solar “firsts” makes it a logical candidate to pioneer innovations in the untapped industrial and 3
commercial rooftop market. Among other things, SCE developed and operated the groundbreaking 10 4
MW Solar One project as the first utility solar “power tower” in the 1980s. SCE followed up with the 5

10
Solar Two project in the 1990s that demonstrated 28 hours of continuous grid connected generation 1
from solar power tower technology using molten salt energy storage technology. This is a world record 2
that still stands today. This storage technology is now being deployed as an important component of 3
today’s larger solar generating stations being built in Spain and of those proposed for California and 4
Arizona. 5
In partnership with McDonnell Douglas, SCE also developed the 25 kW Stirling dish 6
technology. This project set a world record for efficiency, converting solar energy into electricity at a 7
rate of 29.4% in 1984. SCE sold this technology to Stirling Energy System (SES) in 1996 and just this 8
year SES and Sandia National Laboratory announced a new world record for efficiency, converting the 9
sun’s energy into useable electricity at 31% efficiency. This would not have been possible without the 10
years of SCE’s pioneering effort in the 1980s. 11
SCE also partnered with ARCO Solar to build and operate the first large, 1 MW, solar PV 12
array that used concentrating lens technology. SCE was lead contractor for the CEC PIER program that 13
installed and monitored more than a dozen rooftop solar PV systems in the early to mid-1990s. This 14
proved that grid-connected solar PV was feasible. In addition, SCE installed highly visible 15
demonstration solar PV projects located at the Santa Monica pier and the South Coast Air Quality 16
Management District’s (SCAQMD) "solar carport.” The distribution circuit unloading project installed 17
at the Huntington Library using solar PV to defer an underground cable replacement was also a first. 18
SCE also has Power Purchase Agreements (PPAs) for 359 MW ac nameplate capacity 19
with the nine Solar Energy Generating Station (SEGS) facilities that have been operating for over 20 20
years in the Mojave Desert. Presently, these are the only PPAs producing thermal solar generated 21
electricity in California and represent the vast majority of the solar production in the nation today.20 22
Finally, in the 1990s, SCE pioneered flexible PV with Texas Instruments and also 23
provided two solar PV retail tariffs to support the Solar Neighborhoods program. 24
20 Nevada Solar One, a 64 MW SEGS technology solar facility, commenced operation in June, 2007. APS also operates a
1 MW test facility which went into service in 2007. This makes total installed and operating concentrating solar power technology nameplate capacity 424 MW.

11
Over the course of nearly 30 years, SCE has developed a broad institutional knowledge 1
from its relationship with sellers as well as from operating just about every solar generating technology. 2
This knowledge and experience will form a strong foundation for the Solar PV Program. As indicated 3
above, the Solar PV Program will provide about 0.4% of SCE’s estimated customer energy needs in 4
2014. 5
C. SCE’s Solar PV Program Will Increase The Probability That The Million Solar Roofs Goal 6
Will Be Met 7
In the LTPP proceeding, the Commission found that: 8
“If an [Investor-Owned Utility (IOU)] proposes a [Utility-owned Generation] 9 project outside of a competitive [Request for Offers (RFO)], it is reasonable to 10 require the IOU to make a showing that holding a competitive RFO is 11 infeasible.”21 12
According to California Solar Initiative (CSI) data, more than 40% of the applications for projects over 13
900 kW in SCE’s service territory have been cancelled or suspended since CSI was implemented in 14
January 2007.22 SCE has the financial stability and business reputation that will enhance the 15
development opportunities for solar installations generally. The Solar PV Program provides utility 16
customers and the State a substantial increase in the probability that 250 MW of solar PV systems will 17
be available to meet the State’s goals over the next five years. 18
Large PV Projects installed by independent power producers provide valuable information for 19
those firms involved in the project, but less value to the State or the PV industry as a whole. SCE plans 20
to share the information it gains through the installation and operation of Solar PV Program. This type 21
of information gathering and technology assessment associated with the solar PV technology is 22
inconsistent with the concept of private-party completion and low bidders. If the Commission wishes to 23
jump start the competitiveness of roof top solar PV as a renewable resource, SCE’s Solar PV Program 24
will further that goal. It will thoroughly evaluate solar PV technology and will support greater 25
efficiency in the California solar PV market. 26
21 D.07-12-052, Finding of Fact No. 100, mimeo, at p. 286, p. 2, and fn. 240, p. 210. 22 These are mostly legacy SGIP solar PV installations. The SGIP for solar PV was rolled into the CSI in January 2006.

12
SCE is currently developing the procurement process for the PV Systems (i.e., PV panels, 1
inverters, balance of plant), installation, and leasing of the roofs. SCE will rely heavily on competitive 2
solicitations for most procurement activities. This will provide the most cost-effective solution for our 3
customers. Because the Request for Proposals (RFP) process is lengthy, SCE may issue directed 4
purchase orders to selected vendors to expedite the initial installations in parallel with the overall 5
program competitive solicitations. 6
D. Solar PV Program Can Improve Efficiencies of Elements Of The California Solar PV 7
Market To Reduce Costs 8
SCE proposes to pursue large-scale implementation of 50 MW of solar PV projects of 1 to 2 9
MW on commercial rooftops each year for five years. SCE seeks to create efficiencies in the California 10
market for solar PV equipment and installation resources, but not to overheat the market for solar PV 11
panels, equipment, and installation resources. In SCE’s judgment, 50 MW per year will trigger new 12
efficiencies, but not drive prices up due to materials shortages or lack of manufacturing capacity.23 The 13
solar PV modules required for the Solar PV Program will not impact product availability for other solar 14
PV facilities in California. During the last several months, the solar PV module manufacturers have 15
made significant progress towards securing critical materials, such as silicon, needed to meet product 16
demand. The largest solar PV module manufacturers are adding production lines to meet demand. New 17
solar PV module manufacturers located overseas continue to enter the U.S. market. Additionally, 18
emerging technologies using new materials are on the verge of commercial viability. 19
The Solar PV Program system installations can begin a few months after regulatory approval or 20
even earlier with implementation of a memorandum account prior to final Commission approval. The 21
Solar PV Program will aid the market for rooftop solar PV generation. The goals are to drive 22
installation costs down, improve technology and pricing of certain component parts, increase installation 23
23 If the program is successful, SCE may seek Commission authority to increase the overall size of the Solar PV Program to
500 MW. The additional 250 MW would likely be realized through the combination of installing more MW per year and lengthening the program term itself.

13
efficiency, and improve installation methods. Another related goal is to develop a trained in-state 1
installation work force. 2
SCE’s installations of 1 to 2 MW projects totaling up to 50 MW each year should help to 3
(1) refine production of solar PV system parts, (2) improve the capabilities of ancillary equipment, such 4
as inverters, (3) increase the use of otherwise vacant large commercial rooftops in California, and 5
(4) increase the efficiency of installation. To meet Solar PV Program goals, SCE will order large 6
volumes of solar PV panels, mounting, and electrical hardware each year. The increased scale of 7
manufacturing required by such orders should lead manufacturers to improve designs and to increase 8
their capability to produce such parts. Manufacturers will likely also have the incentive to improve 9
manufacturing processes to incorporate economies of scale that drive prices down. 10
SCE expects to order, on average, 50 MW in nameplate rating of large-scale inverters each year. 11
This will provide incentives to improve inverter technology. Improvements in technology are possible 12
through SCE coordination with inverter manufacturers. Solar data that SCE collects may suggest design 13
changes to inverters that could enhance PV performance. SCE could then coordinate with inverter 14
manufactures to implement these design changes. For example, if data collection and subsequent 15
analysis suggest solar inverters could cost-effectively add voltage support, manufacturers could design 16
future inverters to do so. Improvements in technology are always possible. But through SCE 17
participation in code committees and interconnection tariff rules establishing the standards for inverters 18
designed and certification, SCE can help facilitate more ready acceptance of changes. 19
SCE plans to interconnect 50 MW of these projects with the distribution grid each year. This 20
will help: (1) refine the engineering and physical processes for 1 to 2 MW solar PV systems 21
interconnections, and (2) reduce the time and cost of implementing such interconnections. SCE will 22
refine the interconnection process by standardizing engineering and design, training specialized labor, 23
and interacting with building and interconnection code agencies as needed to improve efficiency while 24

14
still maintaining safety. This supports California’s goals as listed in the CEC’s PIER24 Renewable 1
Energy Technologies Program Solar PV Research Plan (“CEC PV R&D Plan”) dated September, 2007, 2
of “improving [PV] education, including updating training for solar PV installers, building code 3
officials, architects, and other building personnel. Milestones emphasize the creation and/or 4
improvement of standards for buildings, energy efficiency, and module certification to ensure 5
consistency and high performance.” 6
SCE anticipates initially contracting with owners of large commercial rooftops. Some rooftop 7
owners may not initially see the benefits of solar PV. SCE’s initial installations will demonstrate to all 8
large commercial rooftop owners the benefits of utility ownership arrangements and should widen 9
acceptance of similar leases. The important difference between this program and the current third-party 10
ownership with PPAs is that the commercial building tenant (host customer of the PPA) is not a party to 11
the business arrangement. This relieves the commercial building owner from the concern over liability 12
to the solar PV owner about host customer failure to pay for electricity deliveries under the PPA. The 13
utility-owned and leased rooftop business model allows the solar PV facility to deliver electricity 14
directly to the utility. This simplified arrangement will reduce the price of solar PV generated electricity 15
delivered to the grid. Because it is a direct transaction with the utility, it will bypass net energy metering 16
costs. 17
SCE’s Solar PV Program should also expand the number of skilled workers by increasing the 18
total number of PV installations. This expanded number of skilled workers should gain greater 19
efficiency and knowledge simply by repetitively performing installations. Currently, labor is about 20% 20
of the cost of solar PV installations. If the Solar PV Program leads to improving the efficiency of 21
workers, SCE’s Solar PV Program should reduce costs of solar PV installation while creating skilled 22
jobs within the State. 23
24 PIER is the CEC’s Public Interest Energy Research group which conducts ratepayer funded studies into various
advanced technology areas, including renewable energy technologies and environmentally preferred advanced generation.

15
SCE intends to improve the efficiency of the California rooftop solar PV market by increasing 1
the number of 1 to 2 MW solar PV systems. Utilities will also have the opportunity to apply this 2
experience gained in California throughout the United States. 3
E. The Solar PV Program Will Provide Unique Benefits And Challenges From the Addition 4
Of Large Amounts of Solar PV To SCE’s System 5
Solar PV is a form of distributed generation. As such, it has unique benefits and challenges. 6
SCE will not need to construct new transmission lines to interconnect the distributed solar PV projects 7
contemplated by the Solar PV Program. These systems will interconnect directly with the distribution 8
system. In addition to increasing the amount of renewable energy and reducing greenhouse gas (GHG) 9
emissions, the Solar PV Program should also help determine: (1) how large numbers of these 1 to 2 10
MW solar PV projects affect the reliability and stability of SCE’s distribution grid, and (2) whether such 11
installations can be relied upon to support generation requirements when it is needed, especially on hot, 12
summer days. 13
Solar PV power may follow the system load better than other intermittent resources. Solar PV 14
energy has historically been higher on clear summer days, which is when the system needs increased 15
generation. Depending on the technology being employed, solar PV output will decrease to a varying 16
degree as temperatures increase. During summer months, higher temperatures might be a deciding 17
factor in technology selection for a given site. Also, as Figure II-1 shows, solar PV power provides 18
significant output when load on SCE’s system ramps up. Solar PV does not normally peak 19
simultaneously with load, as load normally peaks in late afternoon when solar PV output begins to 20
decline. As a result, SCE may opt to install some PV systems in a west-facing orientation to maximize 21
the later afternoon output and thus the value to the grid. 22

16
Figure II-1 Chart of Solar PV Output vs. Time of Day
Center for the Study of Energy Markets, 2005
0
5,000
10,000
15,000
20,000
25,000
30,000
35,000
40,000
45,000
1 2 3 4 5 6 7 8 9 10 11 12 13 14 15 16 17 18 19 20 21 22 23 24 25
Hour of Day
Syst
em D
eman
d (M
W)
0
1
2
3
4
5
6
7
8
9
PV O
utpu
t (kW
)
ISO Load
South Facing Solar PV
West FacingSolar PV
Significant amounts of solar PV output will affect the net load profile characteristic for the circuits on 1
which a Solar PV Program facility will be located. This effect on the net load profile characteristics will 2
be an important finding of this program. 3
SCE can coordinate the Solar PV Program with customer demand shifting using existing SCE 4
demand reduction programs on the same circuit. This will create more fully utilized distribution circuit 5
assets. Without such coordination, much more distribution equipment may be needed to allow solar PV 6
deployment beyond the current Rule 21 guidelines for individual circuits. SCE is uniquely situated to 7
combine Solar PV Program generation, customer demand programs, and advanced distribution circuit 8
design and operation into one unified system. This is more cost effective than separate and 9
17
uncoordinated deployment of each element on separate circuits. SCE also can coordinate generation or 1
storage technologies at the substation level to moderate the inherent weather-caused variability in solar 2
PV production before such intermittency cascades into the higher voltage CAISO-controlled 3
transmission system. Such coordination will reduce system costs. 4
The State’s regulatory agencies identified preferred resources in the Energy Action Plan (EAP), 5
in the order of: “energy efficiency, demand response, renewables, distributed generation and clean 6
fossil-fuel.”25 Solar PV is a renewable resource and is a preferred resource under the EAP. The Solar 7
PV Program will be a renewable distributed generation resource. 8
Solar PV is also a flexible resource. SCE can place solar PV generating facilities in areas where 9
air quality is designated as highly-sensitive by the South Coast Air Quality Management District 10
(SCAQMD), as solar PV has no emissions. Many highly-sensitive SCAQMD areas are also areas with 11
excellent solar resources and significant load growth. SCE expects to place some projects in these 12
highly-sensitive SCAQMD zones both to provide GHG-free renewable energy and to gain valuable 13
understanding of intermittent distributed generation impact on the system. 14
Solar PV systems typically require little maintenance and have long life times (20-25 years for 15
panels, up to 20 years for inverters). SCE proposes the Solar PV Program as a utility-owned distributed 16
generation project to be developed beginning with start-up in 200826 to help meet the Governor’s 17
rooftop solar goals without the need to add transmission. 18
F. The Solar PV Program Will Provide Valuable Information To The State 19
The Solar PV Program will provide valuable information to SCE and to the State. SCE, as a 20
regulated public utility, is willing to share publicly the results of its experience with solar PV. 21
Specifically, SCE will share information about: (1) how solar PV systems of 1 to 2 MW interact with 22
SCE’s distribution system; (2) forecasting and scheduling of solar PV generating facilities of 1 to 2 MW 23
25 D.07-12-052, mimeo, p. 2. 26 Concurrently with the filing of this application, SCE is filing an Advice Letter requesting establishment of a
memorandum account for start-up costs. SCE estimates start-up capital costs to be $25 million in 2008. The memorandum account will allow SCE to recover start-up costs to support immediate start-up of work on this program.

18
disbursed throughout SCE’s inland service territory; (3) information about training and availability of 1
the skilled workforce for installation and maintenance of these facilities; and (4) information about 2
potential streamlining and revision of tariff applications, local and state codes, and best installation 3
practices for 1 to 2 MW solar PV projects. 4
1. Information On Interaction Of Solar PV With The Distribution System 5
With regard to the interaction of these Solar PV generating facilities with SCE’s 6
distribution system, SCE will study the effect of: (1) dependability and availability of generation from 7
the Solar PV Program; (2) the effects of increased amounts of solar PV on distribution circuits; (3) the 8
reaction of Solar PV Program generating facilities to grid disturbances; and (4) the reaction of the grid to 9
Solar PV Program generating facilities’ disturbances. To date, solar PV systems installed in SCE’s 10
service territory have been smaller than those proposed as part of this project and have not amounted to 11
large fractions of circuit saturation. Such systems have also been net metered because they are 12
customer-owned facilities. This means the actual total solar PV generation is unknown. SCE only 13
knows the net output of these facilities after meeting their customer-owner’s load. The large scale 14
deployment of PV under utility ownership will permit SCE to evaluate the efficiency and economics of 15
the generation technologies with precision that is not currently available due to net metering 16
arrangements. 17
The Solar PV Program generating facilities would export all of their power to the 18
distribution system. The intermittent nature of solar PV systems, especially during partially cloudy 19
conditions, can cause rapid swings in solar facility output. SCE will measure the impact of the solar PV 20
system on distribution circuit voltages, amperage, and other power quality attributes, and, if necessary, 21
will determine the most cost-effective remedial measures. 22
SCE intends to study how the intermittency of 1 to 2 MW solar PV installations will 23
affect its system. Solar PV power output typically peaks two to four hours before peak system operating 24

19
conditions when circuits are most heavily loaded.27 That being said, solar PV total energy has been 1
highest on summer days when circuits are typically highly loaded. 2
Solar PV systems are currently set to trip off during high or low voltage excursions. As 3
solar PV becomes more prevalent, SCE may want to keep these systems on-line over a greater voltage 4
range to improve reliable power flow from the solar PV. SCE will gather valuable data to determine 5
new solar PV circuit interruption settings. 6
2. Information And Experience Forecasting Solar PV Output 7
The Solar PV Program will give SCE experience in forecasting the output from solar PV 8
generating facilities. SCE will develop advanced weather monitoring and generation prediction models 9
to estimate the energy that will be generated under various weather conditions. SCE will share these 10
models and the underlying data with others. 11
3. Information On Workforce Training 12
Because SCE intends to work with a few specialized installation vendors, these vendors 13
can begin to train a skilled workforce on the construction of these types of facilities. In addition, SCE 14
will become acquainted with maintenance practices required for these types of facilities and will begin 15
training a skilled workforce to provide those services. 16
4. Information On Streamlining Of Tariff Applications For Solar PV 17
Currently, these larger solar PV installations require individual FERC interconnection 18
tariff applications. With multiple sites being installed, SCE will gain experience on streamlining the 19
FERC interconnection process as well as optimizing system impact studies. For example, answers to 20
questions like, “Is it practical and preferred for small solar PV projects (1 to 20 MW) to be aggregated in 21
the SGIP and CAISO generation queues?” may be answered. 22
27 See Figure II-1 above.

20
III. 1
PROGRAM DESCRIPTION 2
A. Size of Program 3
SCE proposes to install the Solar PV Program’s initial size of up to 250 MW over five years at a 4
base case capital cost of $875 million. SCE’s reasonableness threshold for the Solar PV Program is 5
$962.5 million which is the base case estimate plus a 10% contingency. In years one through five, SCE 6
plans to install solar PV systems at a rate of about 50 MW per year. SCE’s strategic intent is not to 7
overheat the market for solar PV panels, equipment and installation resources. Based on performance, 8
SCE may seek Commission approval to increase the overall size of the Solar PV Program to a total of 9
500 MW, likely through a combination of installing more MW per year and lengthening the program. 10
SCE proposes a limited amount of Year 0 activity to facilitate swift start-up of the full-scale program. 11
This activity would setup key systems, processes, personnel, roof leases and system installation for the 12
purposes of program testing and revision only. 13
The Solar PV Program installation goals are all based on the PV industry convention of using dc 14
output. Unless otherwise specified, the energy output in this filing follows the common convention 15
within the PV industry, which is to refer to output as PV panel dc output. Additionally, the Commission 16
should use the installed dc output in reasonableness reviews because installation occurs in dc panels. 17
Based on sample calculations using the California Energy Commission’s ac MW conversion, the 18
conversion factor of 0.90 will be used to convert from MW dc to MW alternating current (ac) (i.e., 19
multiply MW dc by 0.90 to obtain CEC-ac Rating). 20
B. Length of Program 21
SCE proposes its Solar PV Program to continue for five years. To facilitate a swift start-up after 22
Commission approval, SCE is concurrently filing an advice letter requesting authority to establish a 23
memorandum account. The memorandum account will record start-up costs for preliminary studies, 24
evaluations, and installation of up to 5 MW of solar PV facilities in 2008. SCE estimates Solar PV 25
Program capital expenditures will total $25 million in 2008. If the Commission has not approved this 26

21
application by December 2008, SCE will record its 2009 start-up costs in the memorandum account as 1
well. Specifically, the memorandum account will record costs of the following: 2
• Leases with building owners 3
• Identification of the buildings best suited to gain the most knowledge for the 4
preliminary study 5
• Determination of which technologies to install to gain the most knowledge for the 6
preliminary study 7
• Engineering plans 8
• Equipment purchase orders 9
• Building permits 10
• Installation procedures/training 11
Upon approval of the program (requested by year-end 2008), SCE’s proposed schedule calls for 12
the initial 250 MW of Solar PV generation to be installed within five years. On average, SCE will 13
install 50 MW per year. 14
Table III-3 below shows the expected schedule for the Solar PV Program. 15
22
Table III-3 Estimated Solar PV Program Schedule
Date Event
March 2008 SCE files application with the CPUC
April 2008 Commission approves establishment of memorandum account for Solar PV Program start-up activities
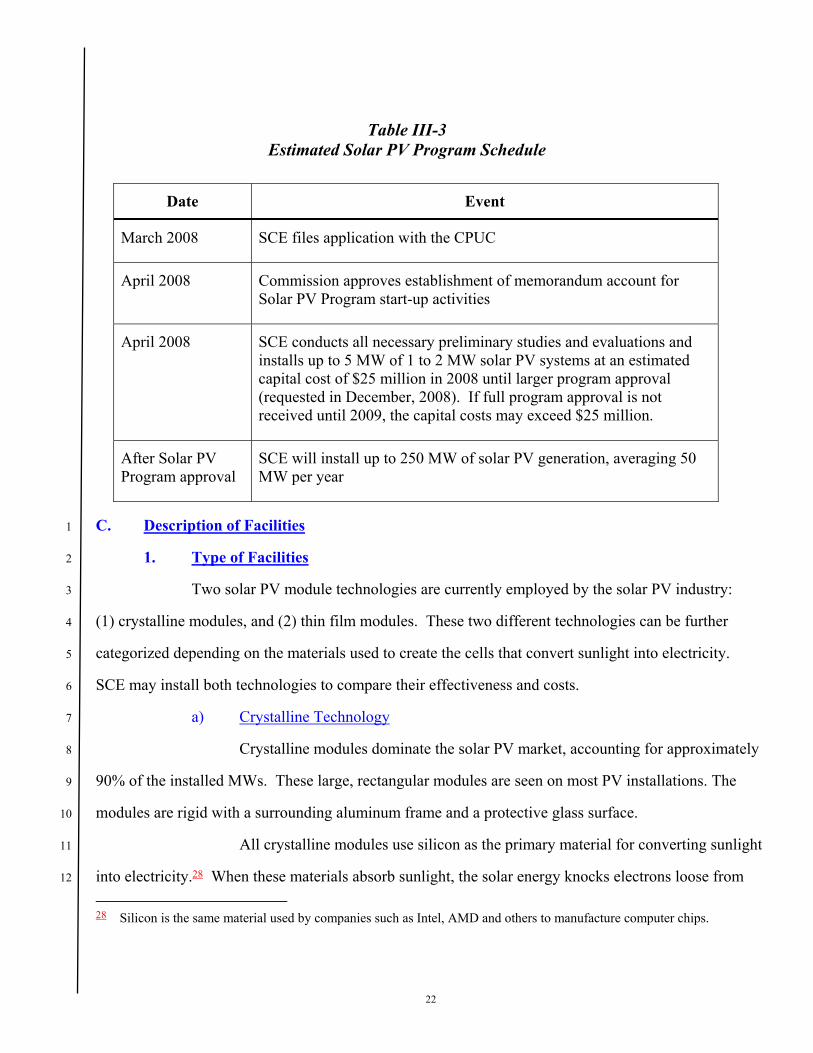
April 2008 SCE conducts all necessary preliminary studies and evaluations and installs up to 5 MW of 1 to 2 MW solar PV systems at an estimated capital cost of $25 million in 2008 until larger program approval (requested in December, 2008). If full program approval is not received until 2009, the capital costs may exceed $25 million.
After Solar PV Program approval
SCE will install up to 250 MW of solar PV generation, averaging 50 MW per year
C. Description of Facilities 1
1. Type of Facilities 2
Two solar PV module technologies are currently employed by the solar PV industry: 3
(1) crystalline modules, and (2) thin film modules. These two different technologies can be further 4
categorized depending on the materials used to create the cells that convert sunlight into electricity. 5
SCE may install both technologies to compare their effectiveness and costs. 6
a) Crystalline Technology 7
Crystalline modules dominate the solar PV market, accounting for approximately 8
90% of the installed MWs. These large, rectangular modules are seen on most PV installations. The 9
modules are rigid with a surrounding aluminum frame and a protective glass surface. 10
All crystalline modules use silicon as the primary material for converting sunlight 11
into electricity.28 When these materials absorb sunlight, the solar energy knocks electrons loose from 12
28 Silicon is the same material used by companies such as Intel, AMD and others to manufacture computer chips.

23
their atoms, allowing the electrons to flow through the material to produce electricity. This process 1
converts light (photons) to electricity (voltage). 2
3
Figure III-2 Typical Crystalline Solar PV Module 175 watts measuring approximately
64”x 32” x 1.75” and weighing 33 pounds
Crystalline modules fall into two primary types: (1) multicrystalline; and 4
(2) monocrystalline. These terms refer to the type of silicon formulation of the individual cells that 5
generate the current inside the module. Simply stated, raw silicon is used to create ingots which are then 6
sliced into thin wafers. These low wattage wafers, or cells, are then wired to each other to increase their 7
output. Figure III-2 shows seventy-two black cells wired to each other and sandwiched between a sheet 8
of tempered glass on top and a protective backing on the rear. The tempered glass makes for a robust 9
product that is impervious to all but the most extreme weather conditions (baseball size hail might 10
damage a module) and normal hazards. An aluminum frame surrounds the glass for mounting purposes. 11
Monocrystalline modules are generally more efficient and more expensive to 12
manufacture than multicrystalline modules. This increases the cost of the module. Just like light bulbs, 13

24
crystalline modules are available in various wattages. The size of the module will vary depending on its 1
wattage and other factors.29 Crystalline modules require a mounting structure, typically referred to a 2
rack, to support it on the roof. Generally, crystalline module warranties are 20-25 years, depending on 3
the manufacturer. 4
b) Thin Film Technology 5
Thin film modules fall into two broad categories: amorphous and rigid. Unlike 6
crystalline modules, amorphous thin film use significantly less silicon than crystalline modules and a 7
few other thin film technologies use no silicon to generate electricity. 8
Figure III-3 below shows that a flexible amorphous thin film modules are flexible 9
panels that can be applied to curved as well as straight surfaces. These modules are manufactured with 10
multiple layers of semiconductor materials that are only a few micrometers thick. These layers are 11
attached to a flexible metal backing called substrate, through a spray-on process. The outer 12
nonconductive layer looks like rubber. Flexible amorphous modules are usually attached to a metal roof 13
known as a standing seam roof. An adhesive is applied to the rear surface of the module at the factory. 14
Installers remove the plastic protection to expose the adhesive. The module is then rolled onto the 15
standing seam roof. As these modules have no frame, unless the roof is a standing seam roof, amorphous 16
modules may not be practical for rooftop applications. 17
29 Solar modules are rated using both national and international standards. This means a 100 W rated module will produce
100 W but its actual physical dimensions and mounting arrangement vary by manufacturer. Solar modules are not a standard physical size, such as a 4 foot by 8 foot piece of plywood.

25
Figure III-3 Typical Amorphous Thin Film Module Measuring 18 feet long by 15.5” wide
and Weighing_17 lbs.
Rigid thin film modules generally utilize different materials than amorphous and 1
crystalline modules. Technologies include cadmium telluride (CdTe) and Copper Indium Gallium 2
Selenide (CIGS). As with flexible thin film modules, a rigid thin film module has multiple layers of 3
semiconductor materials. These layers are attached to a rigid substrate using the same spray-on process 4
as an amorphous module. A tempered glass top protects the assembly. Pricing for these modules is 5
significantly lower than any other commercially available PV module, but they have a lower efficiency 6
than crystalline modules. Consequently, they are usually marketed towards large scale ground-mount 7
systems for the utility market sector or are installed on very large rooftops where space is not a factor. 8
Like crystalline modules, rigid thin film modules require a rack to support them. Generally, warranties 9
on thin film modules are 25 years. Figure III-4 below shows a rigid thin film module. 10
26
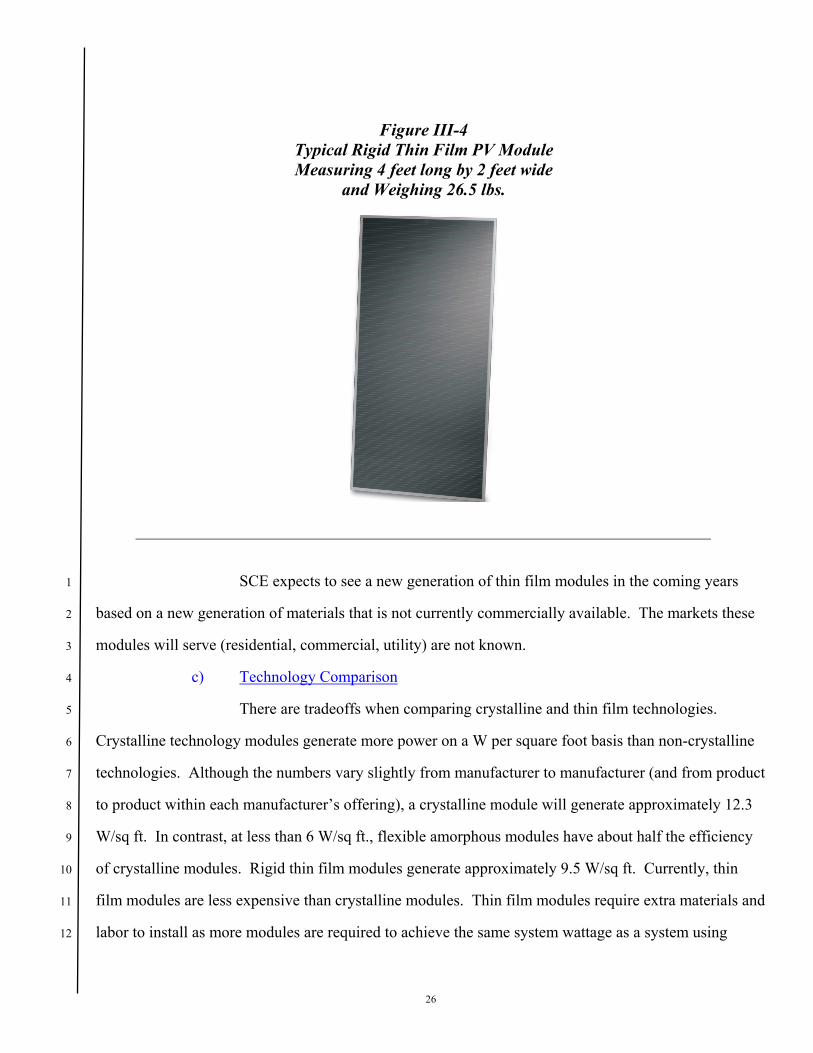
Figure III-4 Typical Rigid Thin Film PV Module Measuring 4 feet long by 2 feet wide
and Weighing 26.5 lbs.
SCE expects to see a new generation of thin film modules in the coming years 1
based on a new generation of materials that is not currently commercially available. The markets these 2
modules will serve (residential, commercial, utility) are not known. 3
c) Technology Comparison 4
There are tradeoffs when comparing crystalline and thin film technologies. 5
Crystalline technology modules generate more power on a W per square foot basis than non-crystalline 6
technologies. Although the numbers vary slightly from manufacturer to manufacturer (and from product 7
to product within each manufacturer’s offering), a crystalline module will generate approximately 12.3 8
W/sq ft. In contrast, at less than 6 W/sq ft., flexible amorphous modules have about half the efficiency 9
of crystalline modules. Rigid thin film modules generate approximately 9.5 W/sq ft. Currently, thin 10
film modules are less expensive than crystalline modules. Thin film modules require extra materials and 11
labor to install as more modules are required to achieve the same system wattage as a system using 12
27
crystalline modules. If roof space is not an issue, thin film modules might be the preferred technology 1
for a solar PV system. In addition to the lower module cost, thin film modules perform better than 2
crystalline modules in low light, or diffuse lighting, conditions. So, they will generate more power on 3
cloudy days. They also generate power earlier in the morning and later into dusk. All module 4
technologies “derate” in hot weather, meaning as they get hotter, they become less and less efficient. 5
Thin film modules derate less than crystalline modules. Therefore, thin film technology might be the 6
preferred technology in certain southern California locations. 7
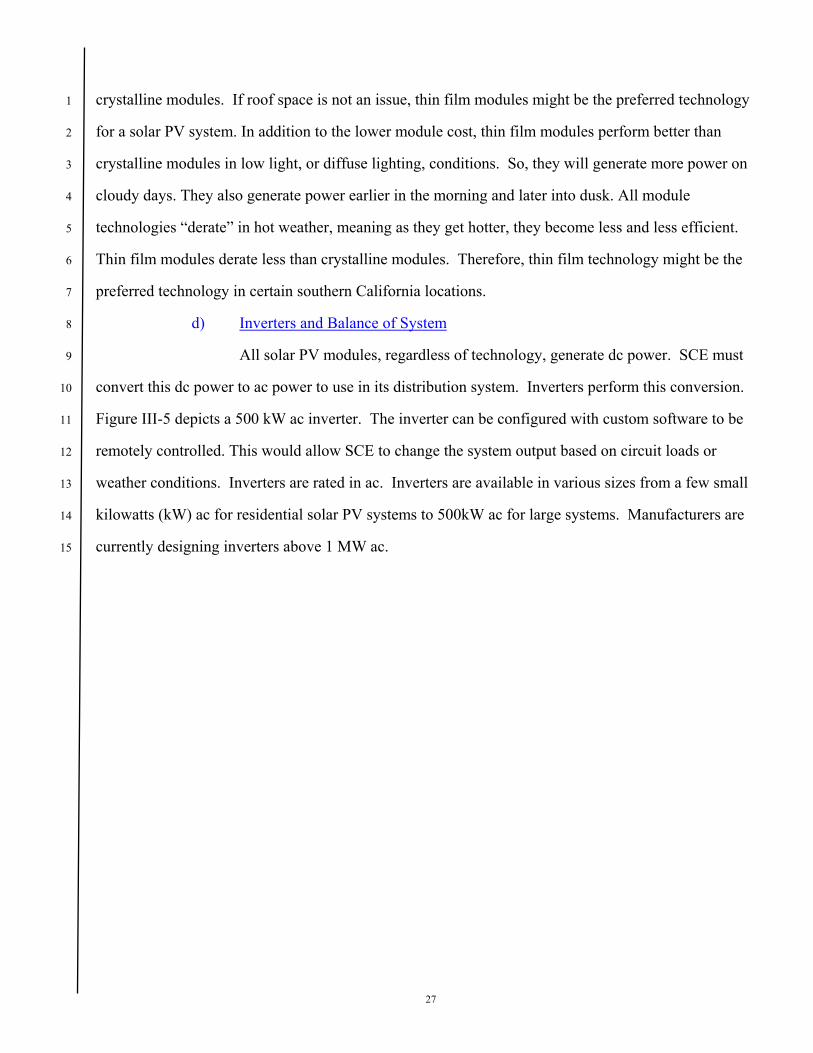
d) Inverters and Balance of System 8
All solar PV modules, regardless of technology, generate dc power. SCE must 9
convert this dc power to ac power to use in its distribution system. Inverters perform this conversion. 10
Figure III-5 depicts a 500 kW ac inverter. The inverter can be configured with custom software to be 11
remotely controlled. This would allow SCE to change the system output based on circuit loads or 12
weather conditions. Inverters are rated in ac. Inverters are available in various sizes from a few small 13
kilowatts (kW) ac for residential solar PV systems to 500kW ac for large systems. Manufacturers are 14
currently designing inverters above 1 MW ac. 15

28
Figure III-5 shows a 500kW ac inverter and transformer. 1
Figure III-5 500kW ac Inverter and Transformer
Inverter measuring 7.6”x9.6’x3’6” (HxWxD) transform measuring 5’x4’x4’ (HxWxD) and weighing combined approximately 9,800 pounds.
Inverter Transformer
Solar PV systems also include conduit, wire, dc and ac disconnects (safety 2
devices to turn off or isolate parts of the system), and combiner boxes. Modules are wired together in 3
series (imagine multiple batteries in a flashlight) into “strings.” These strings can vary in number from 6 4
to 18, depending on a number of factors (module type and lowest temperature one might see at the 5
project location). These larger string quantities enter boxes located throughout the array and are then 6
“combined” into a smaller number of parallel wires that are then wired into the inverter. All of the items 7
in a solar PV sytem other than the modules are commonly called Balance of System (BOS) components. 8
e) PV Module Mounting Systems 9
Except for flexible, amorphous thin film modules, all solar PV systems require 10
some type of attachment method. This product is typically called a rack. There are two main categories 11
of racks: penetrating and non-penetrating. Non-penetrating racks are further defined as ballasted 12
(requiring some weight to be added to the rack besides the modules) or non-ballasted (primarily relying 13

29
on the weight of the rack and modules themselves to hold the array in place). SCE does not plan to use 1
penetrating racks in the Solar PV Program to minimize the probability of roof leaks. 2
Non-penetrating racks are precisely as the name implies. The rack sits on top of 3
the roof. Ballasted systems require the use of weighted material such as cinder blocks or pavers to keep 4
the array in place. These systems add a significant amount of weight to the array. The total weight of 5
ballasted systems, including modules, can reach 8 pounds per square foot and most commercial roofs 6
cannot support this weight. Non-ballasted systems rely on the weight of the array itself to keep them in 7
place and typically weigh 3-5 pounds per square foot, including modules. For an installation subject to 8
high wind conditions an adhesive material (Sika or M1), ballasting material, or a combination of both, 9
might be required at the edges of the array. The manufacturer of the rack will typically specify what is 10
required to assure the PV array will meet local building department codes for anticipated winds. A local 11
structural engineer will then confirm these calculations. 12
Figure III-6 is a non-penetrating rack adhered to the roof with M1 adhesive. The 13
modules on the left side are in their normal operating position. The module is about 1 foot above the 14
roof at its highest point. The right photo shows 1 row tilted to allow access to the wiring underneath the 15
modules and to the roof for maintenance. Thin film modules are usually not tilted. They are installed 16
parallel to the roof and are less than 1 foot off the roof surface. 17

30
Figure III-6 1.2 MW Non-Penetrating Solar PV
System on Commercial Rooftop in Sacramento, CA
f) Building Integrated PV 1
The state of California is committed to promoting the use of Building Integrated 2
Photovoltaic (BIPV) products on new buildings. As evidence of this, the aforementioned CEC PV R&D 3
Plan states that the goals of their program include: “. . . identifying synergies between PV and energy 4
efficiency by 2008 and achieving widespread penetration of BIPV products by 2017. These milestones 5
will provide improved performance, ease of use, and economics of PV systems, thereby supporting CSI 6
and SB 1.” There are an extremely limited number of BIPV installations worldwide to date. SCE’s 7
program will test and encourage this type of installation. Developers may only focus on existing roofs 8
as they are the cheapest installation. 9
A key benefit SCE can bring to this effort is coordination between the various 10
elements of Demand-Side Management (DSM). SCE's New Construction Services (NCS) group is an in-11
house team of technical specialists in energy efficiency (EE) and sustainable design. NCS is responsible 12
for delivering SCE's commercial new construction EE offerings to building owners, developers, 13
architects, and engineers. One way NCS delivers these offerings is by building and maintaining 14
relationships with specific developers. As a result, NCS can review and analyze all of a developer's 15
planned projects for EE opportunities. SCE is working to expand NCS’s offerings to new construction 16

31
projects to include on-site renewable energy incentives, electric transportation (particularly for fork-lift 1
operation), and demand response capabilities. 2
Large customers, also have assigned account managers through our Business 3
Customer Division (BCD), who are the single point-of-contact through all of their dealings with SCE. 4
This ensures continuity of service, and refers any eligible EE projects to the appropriate program. 5
Similarly, because of ongoing relationships with owners and design teams in particular, many projects 6
referred to NCS cover improvements to current building stock. For program purposes, SCE divides gut 7
remodels (considered new construction) from simple equipment swap-outs (considered retrofits). NCS 8
refers any such projects to either Standard Performance Contracting (SPC) or Express Efficiency, 9
depending upon the scope of the retrofit. 10
However, one challenge to working with large customers that operate as landlords 11
(often through property management firms), leasing commercial real estate to tenants, is that the tenants 12
pay the utility bills. SCE may not have identified the landlord through our BCD. If SCE was not 13
involved in the construction of the facility, it may not have a relationship with the actual owner. As 14
large customers that operate as landlords buy and sell properties, often with the express intention of 15
retaining lucrative tenants, this becomes an additional challenge. 16
A key part of the effort to integrate DSM services is the emphasis upon the 17
CPUC's loading order: invest in cost-effective EE (and demand response) first and only then meet the 18
remaining load with renewables. SCE would also work through CSI group to make sure that any 19
projects (including warehouses) pursuing PV had been contacted by their BCD account manager to 20
discuss opportunities for DSM. 21
SCE can leverage this delivery model to great effect with the large customers that 22
lease commercial real estate to tenants in our service territory. This will enable SCE to pursue additional 23
improvements in EE in commercial buildings even if they are not suitable candidates for the Solar PV 24
program. 25

32
2. Size of Facilities 1
Rooftop arrays vary in size depending on the PV module technology being used and 2
whether it is a tilted or flat array. Crystalline modules typically tilt toward the south and thin film 3
modules are usually flat mounted. 4
Tilted arrays require more roof space than flat arrays because there must be adequate 5
space between each row of modules to keep them from shading the adjacent row. An array with a 5 6
degree tilt will require less space between rows than an array with a 20 degree tilt. A flat array only 7
requires enough space between module rows to allow a technician to walk between them for 8
maintenance. Generally, a 1 MW array employing crystalline modules will require 125,000 square feet 9
of roof space. A 1 MW rigid thin film array will require 175,000 square feet of roof space. A 1 MW 10
flexible amorphous thin film array will require 230,000 square feet of roof space. These numbers 11
include space required for conduit, combiner boxes, and other BOS components associated with the 12
array. The required roofspace could increase depending on other roof protrusions they could potentially 13
shade the modules or prevent a module from being installed. A protrusion is defined as anything on the 14
roof (i.e., air handlers, skylights, vents, or drains). Protrusions could substantially impact the required 15
roof space to prevent module shading from the object. For example, an air handler that is 8 feet tall 16
should have 16 feet of clearance to the closest module that could be shaded. 17
None of the module technologies are visible from street level. The combination of 18
building height, minimal height of the array above the roof, and setback of the array from the edge of the 19
roof (usually 3 feet) all contribute to it being hidden. Also, for safety reasons, many buildings have a 20
parapet around the building that also serves as a blind for existing equipment such as air handlers. 21
Figure III-7 is a street level photograph of the solar PV system on the rooftop of the Long 22
Beach Convention and Entertainment Center in Long Beach, CA. There is a 1 to 2 foot parapet 23
surrounding the rooftop, and the array is set back from the roof edge by around 3 feet. 24

33
Figure III-7 Photograph of the Long Beach Convention and Entertainment Center
illustrating the solar PV array is not visible from street level
Inverters vary in size depending on the model. A single 1MW inverter dimensions are 1
double that of a 500kW inverter. Typical 1 MW transformer dimensions are 9’x8’x5’ (HxWxD) for an 2
air-cooled transformer. Oil-cooled transformers are smaller than air-cooled transformers. 3
Inverters are typically located inside the building in an electrical room. If such a room is 4
not available, the inverter(s) can be located outdoors next to the building. It is desirable to locate it as 5
close to the array as possible to minimize power loss due to long wire runs. Inverters are designed to be 6
installed outdoors. So, no additional enclosed building is required to house them. It is preferable to 7
locate inverters in areas with less sun or inside a shade structure in hot, sunny locations. This is because 8
heat can degrade inverter performance. 9
3. Location and Configuration of Facilities 10
SCE’s Solar PV Program will study the appropriate locations of the 1 to 2 MW solar PV 11
installations. SCE will develop methods to determine the optimal location for the PV installations. SCE 12
will consider: (1) quality of the local solar resource (estimate of expected PV generation based on 13

34
factors such as expected cloud/fog cover, haze and smog, ambient temperature, and geographic latitude) 1
and other meteorological data, (2) roof capacity and other building attributes, and (3) local circuit 2
concerns. 3
To determine the quality of the local solar resource, SCE will rely on the National 4
Renewable Energy Lab (NREL) database that provides information down to 10 km grids. By choosing 5
the best combinations of available roof-site location and local solar resource, SCE will optimize the 6
output of the solar PV installations. SCE will also consider other meteorological data. For example, 7
high wind areas may preclude certain solar PV panel attachment methods. Crystalline solar PV panel 8
performance degrades under high temperature conditions. So, more moderate temperature zones may be 9
more desirable than very hot desert regions for this technology. To assess the impact of various solar 10
quality areas, SCE may also install solar PV in poorer solar areas, such as those affected by the regional 11
“June Gloom” (severely overcast). SCE will, then, quantify the effects on solar PV output of location, 12
the resulting impact on the grid, and the implications for sizing back-up power (at the substation) or 13
required demand response (from customers on the affected circuit). 14
In terms of roof capacity and other building attributes, SCE will take into account the 15
following variables: 16
(1) Roof Capacity – Depending on the module technology being employed and roof protrusions, 17
each roof must have available up to 250,000 square feet of available space per 1 MW installation. 18
(2) Roof Loading - Roofs must handle the additional weight loading which can vary based on 19
technology as well as the individual vendor’s panel weight. In general, the roofs must hold an additional 20
3 to 5 lbs. per square foot. 21
(3) Shading and orientation –Roofs should have little to no shading and be oriented to achieve 22
the desired solar PV panel output profile. Normally, this means a south-facing exposure, as this 23
orientation maximizes overall output of the installation. SCE may also consider a west-facing exposure 24
to increase late afternoon sun which is more coincident with system load. 25
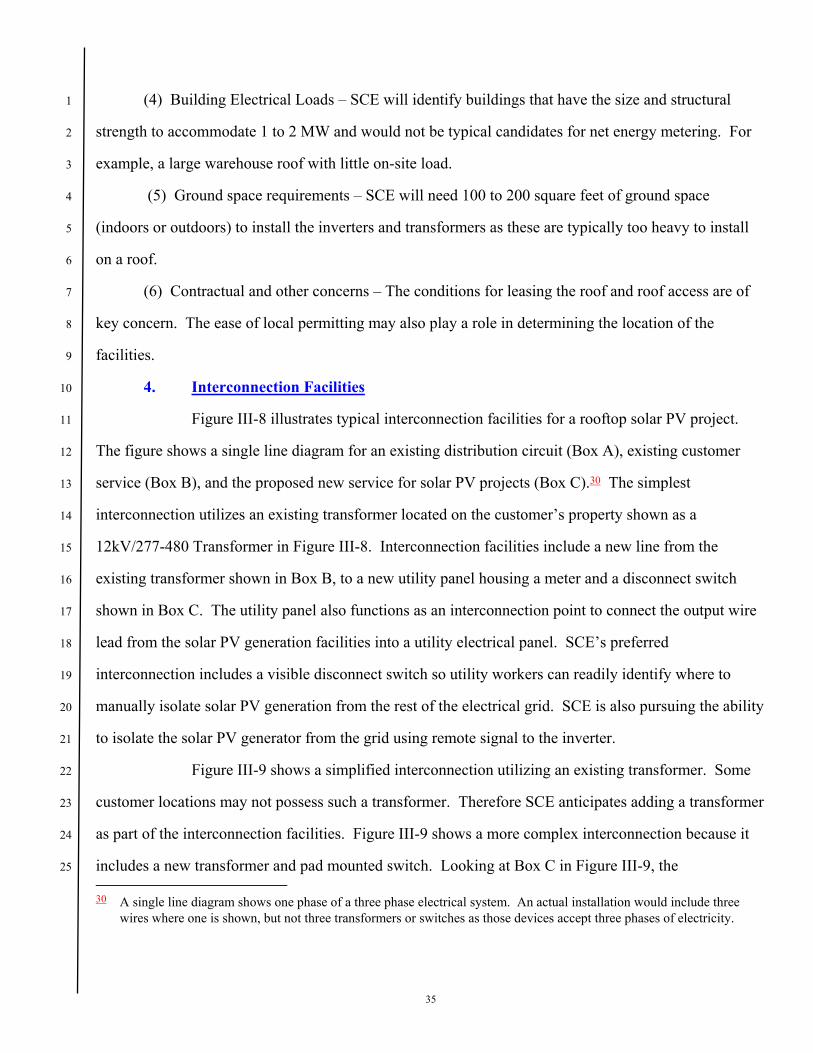
35
(4) Building Electrical Loads – SCE will identify buildings that have the size and structural 1
strength to accommodate 1 to 2 MW and would not be typical candidates for net energy metering. For 2
example, a large warehouse roof with little on-site load. 3
(5) Ground space requirements – SCE will need 100 to 200 square feet of ground space 4
(indoors or outdoors) to install the inverters and transformers as these are typically too heavy to install 5
on a roof. 6
(6) Contractual and other concerns – The conditions for leasing the roof and roof access are of 7
key concern. The ease of local permitting may also play a role in determining the location of the 8
facilities. 9
4. Interconnection Facilities 10
Figure III-8 illustrates typical interconnection facilities for a rooftop solar PV project. 11
The figure shows a single line diagram for an existing distribution circuit (Box A), existing customer 12
service (Box B), and the proposed new service for solar PV projects (Box C).30 The simplest 13
interconnection utilizes an existing transformer located on the customer’s property shown as a 14
12kV/277-480 Transformer in Figure III-8. Interconnection facilities include a new line from the 15
existing transformer shown in Box B, to a new utility panel housing a meter and a disconnect switch 16
shown in Box C. The utility panel also functions as an interconnection point to connect the output wire 17
lead from the solar PV generation facilities into a utility electrical panel. SCE’s preferred 18
interconnection includes a visible disconnect switch so utility workers can readily identify where to 19
manually isolate solar PV generation from the rest of the electrical grid. SCE is also pursuing the ability 20
to isolate the solar PV generator from the grid using remote signal to the inverter. 21
Figure III-9 shows a simplified interconnection utilizing an existing transformer. Some 22
customer locations may not possess such a transformer. Therefore SCE anticipates adding a transformer 23
as part of the interconnection facilities. Figure III-9 shows a more complex interconnection because it 24
includes a new transformer and pad mounted switch. Looking at Box C in Figure III-9, the 25 30 A single line diagram shows one phase of a three phase electrical system. An actual installation would include three
wires where one is shown, but not three transformers or switches as those devices accept three phases of electricity.
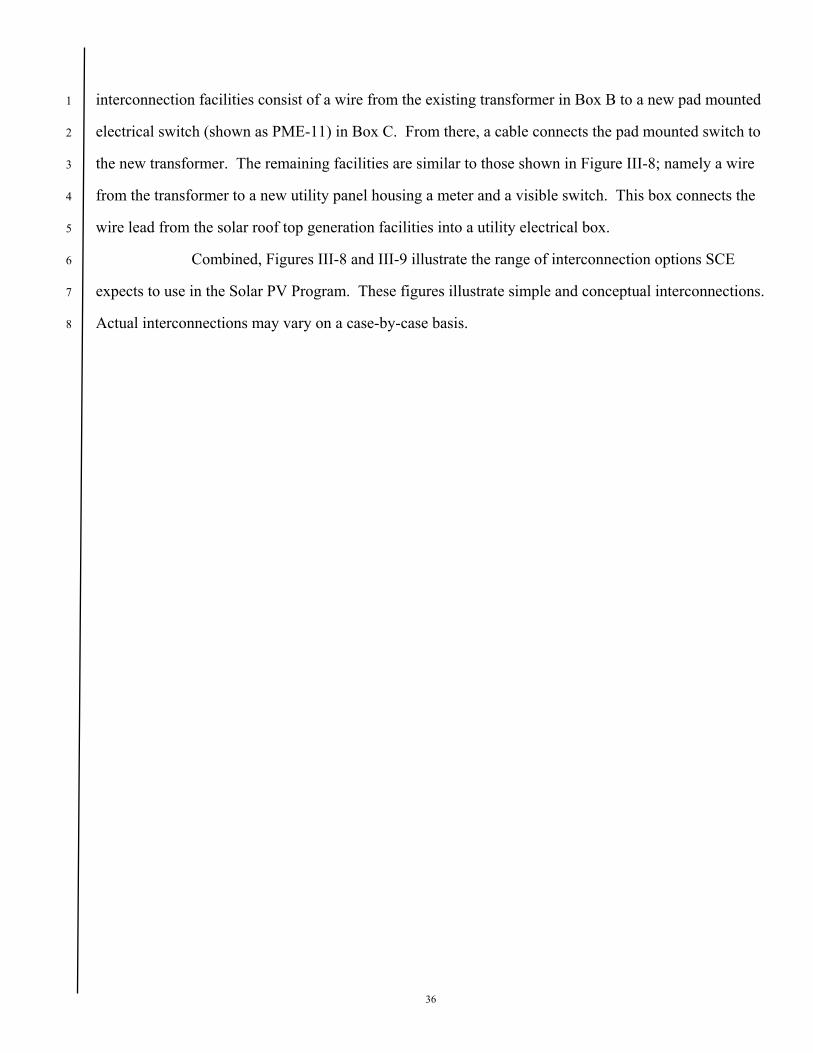
36
interconnection facilities consist of a wire from the existing transformer in Box B to a new pad mounted 1
electrical switch (shown as PME-11) in Box C. From there, a cable connects the pad mounted switch to 2
the new transformer. The remaining facilities are similar to those shown in Figure III-8; namely a wire 3
from the transformer to a new utility panel housing a meter and a visible switch. This box connects the 4
wire lead from the solar roof top generation facilities into a utility electrical box. 5
Combined, Figures III-8 and III-9 illustrate the range of interconnection options SCE 6
expects to use in the Solar PV Program. These figures illustrate simple and conceptual interconnections. 7
Actual interconnections may vary on a case-by-case basis.8
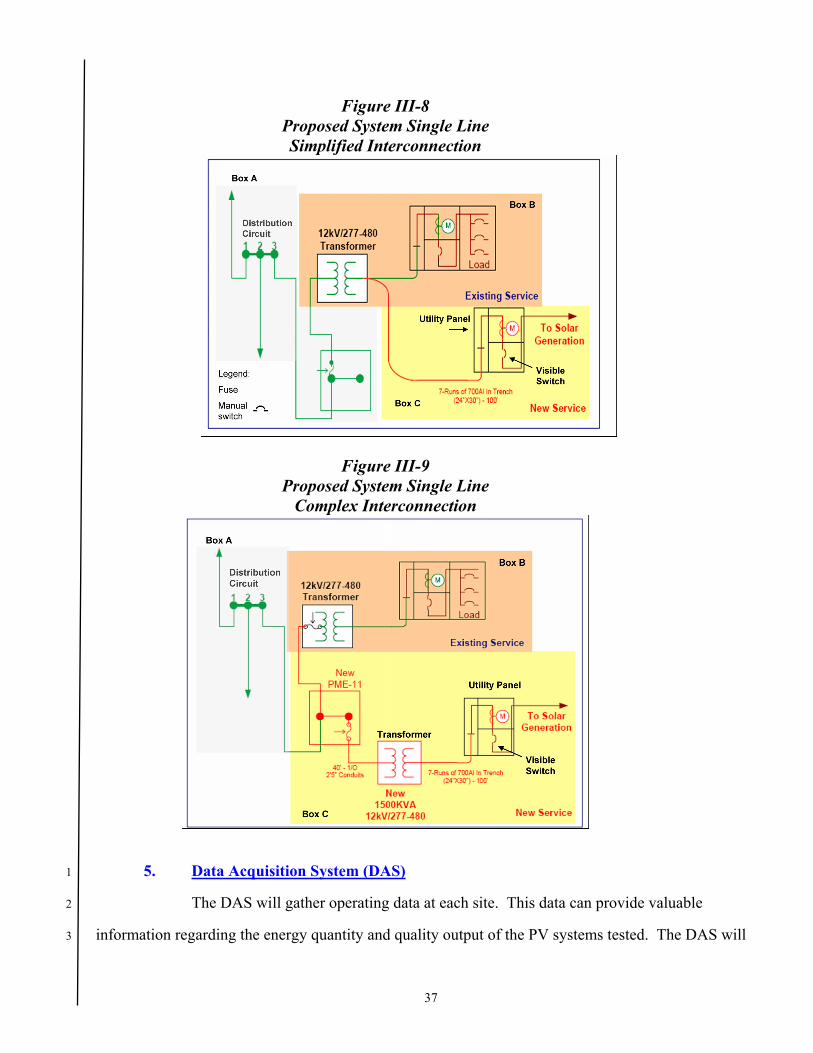
37
Figure III-8 Proposed System Single Line Simplified Interconnection
Figure III-9 Proposed System Single Line
Complex Interconnection
5. Data Acquisition System (DAS) 1
The DAS will gather operating data at each site. This data can provide valuable 2
information regarding the energy quantity and quality output of the PV systems tested. The DAS will 3

38
include weather sensory equipment that will enable SCE: (1) to compare the actual output with 1
projections from computer generated models, and (2) to evaluate the impact of weather conditions 2
experienced on the quantity and quality of power output. 3
Any generating station connecting to the CAISO Grid must enter into a Meter Service 4
Agreement (MSA) with the CAISO. The CAISO requires certain operational data be supplied to them 5
on an ongoing basis as part of interconnecting generation to the electric grid. The DAS systems will 6
collect and send this data to the CAISO real time. 7
All generation connected to the CAISO grid must forecast and schedule power into the 8
CAISO system on an hourly basis. Currently an intermittent technology such as solar PV would 9
participate in the CAISO’s PIRP. However, the PIRP currently only schedules wind resources. SCE 10
will work cooperatively with the CAISO and others to formulate the requirements for solar PV to join 11
the PIRP. For a generation facility not in PIRP, the generation forecast is due nearly 3 hours ahead of 12
the actual generation period. This is a challenging task for solar PV generation. As a part of this 13
project, SCE will identify predictive weather methodologies, such as cloud movement to attempt to 14
forecast output of these PV systems for the CAISO 3 hours ahead until implementation of the PIRP 15
requirements for solar PV. 16
SCE will install all components between the inverter and the point of delivery to the grid. 17
The DAS components are forecast to cost approximately $200,000, for each 1 to 2 MW solar facility, as 18
follows: 19
� Meter $10,000 20
� Communications $45,000 21
� Data collection $40,000 22
� Weather station $55,000 23
� Auxiliaries $50,000 24
6. Leasing Rooftop Space For Facilities 25
The success of the Solar PV Program is in large part dependent upon securing appropriate 26
lease agreements with building owners/developers. As noted above, SCE intends in the first phase to 27
39
install up to 250 MW of solar PV on commercial building rooftops at various locations within SCE’s 1
service territory. The proposed 1 to 2 MW installation per location will require up to about 250,000 sq. 2
ft. of rooftop space. For this Solar PV Program, SCE anticipates that it will look to a limited number of 3
building owners/developers to provide appropriate location inventory in order to more efficiently select 4
appropriate locations and limit the number of simultaneous lease negotiations. 5
Upon the selection of appropriate locations for the PV Facilities, SCE intends to enter 6
into negotiations with the owner/developers of those sites in order to secure a mutually agreeable 7
rooftop lease. Because the large-scale installation of utility-owned rooftop PV systems is a relatively 8
novel concept, the Solar PV Program will allow SCE to gain valuable experience regarding certain 9
rooftop lease business deal points such as optimal lease terms, appropriate rental rate structures, 10
reasonable site access requirements. In every instance, however, SCE will negotiate to secure 11
appropriate and reasonable clauses to ensure appropriate allocation of the rights and obligations of SCE 12
and the respective owner and protection of ratepayer interests. 13
SCE may also opt to locate a few 1 to 2 MW installations on utility-owned roofs as well. 14
15

40
IV. 1
PROGRAM COST ESTIMATE 2
A. Capital 3
1. Generating Facilities Cost 4
Table IV-4 below provides estimated costs for a typical 1 MW project. Due to the 5
volatile price of petroleum and copper, wire distributors will only quote pricing for 30 days. Table IV-4 6
projects average shipping costs which can vary depending on the actual locations of the solar PV 7
facility. 8
Table IV-4 Estimated Hardware Cost for 1 MW Solar PV Project
(2008$)
Hardware Cost
PV System (Module, Rack, Balance of System) $2,540,275
Data Acquisition System (DAS) $ 200,000
Interconnection Equipment $ 150,000
TOTAL HARDWARE COST $2,890,275
2. Installation Cost 9
Table IV-5 provides estimated installation costs for a typical 1 MW project. 10
On-site installation costs can vary substantially based on labor rates in effect at the time of the 11
installation. 12

41
Table IV-5 Estimated Installation Cost for 1 MW Solar PV Project
(2008$)
Labor Activity Cost
Site Selection $ 3,000
Engineering $ 35,000
Permits $ 10,000
Installation and Commissioning $461,725
Project Management $100,000
Total $530,200
TOTAL LABOR COST $609,725
$/W $ 0.61
Assuming computer-based or hard copies of drawings do not exist, a survey will be made 1
of the rooftop before the array layout can begin. This is in addition to an initial site walk of the building. 2
Once the engineering drawings are completed, the roof must be marked for the array layout. 3
Delivery of modules, inverters, rack hardware, and Balance of System (BOS) 4
components includes the process of lifting the equipment to the roof with a crane and locating it 5
throughout the roof to distribute the weight. The delivery schedule can be modified to minimize 6
disruption to the customer. This could either be a compressed schedule of trucks making deliveries to a 7
staging area next to the crane while personnel lift product to the roof (more disruption over a shorter 8
duration), or activities can be spread out to minimize traffic (less disruption over a longer duration). 9
Once all materials have been placed on the roof, installation of the array can begin. 10
During this phase of the installation, impact to the daily operations of the building activities are minimal 11
and are primarily associated with letting installation personnel onto the roof and closing roof access at 12
the end of the day. The building lessee’s security procedures could increase the length of the installation 13

42
period. Vehicles on site are primarily those associated with workers commuting to the site. Additional 1
disruption is possible due to trench work required to tie-in the inverter to the SCE circuit. 2
Commissioning is the process of turning on the system, testing and notation taking, and troubleshooting 3
any problems. 4
Total on-site installation time is approximately 30-45 days for a 1 MW project. 5
However, the time for completion of the first project after regulatory approval is about 4-6 months due 6
to lead times to order the modules and inverters. 7
3. Interconnection Costs 8
Interconnection costs range from about $70,000 for simple installation to $150,000 for 9
the more complex installation (in 2008$). The main difference in costs between the two types of 10
installations is the addition of a new distribution transformer and pad mounted switch. These estimated 11
costs assume a reasonable distance of new distribution cable (100 feet), which if longer or shorter could 12
increase or decrease costs respectively. Cable costs assume underground installation. These cost figures 13
illustrate simple and conceptual interconnections. Actual interconnection costs may vary on a case-by-14
case basis. 15
The proposed Solar PV Program would apply for interconnection service pursuant to 16
SCE’s Wholesale Distribution Access Tariff (WDAT) for each site using the Small Generator 17
Interconnection Process (SGIP), just as any other non-SCE generation project is required to apply for 18
such service. SCE expects the cost of each interconnection to range from $1,500 to $9,000 depending if 19
the interconnection is applicable for the WDAT’s fast track process or normal track process. 20
4. Total Program Capital Costs 21
SCE proposes to install up to 250 MW of PV generation within 5 years at a base case cost 22
of $875 million. The overall base case cost of the Solar PV Program averages $3.50/W, including 23
$2.89/W of material costs and $0.61/W of labor costs. SCE’s proposed reasonableness threshold is 24
$962.5 million which is the base case amount plus a reasonable 10% contingency. The reasonableness 25
threshold cost of the Solar PV Program averages $3.85/W. Table IV-6 summarizes the capital cost of 26
the Solar PV Program per year. 27
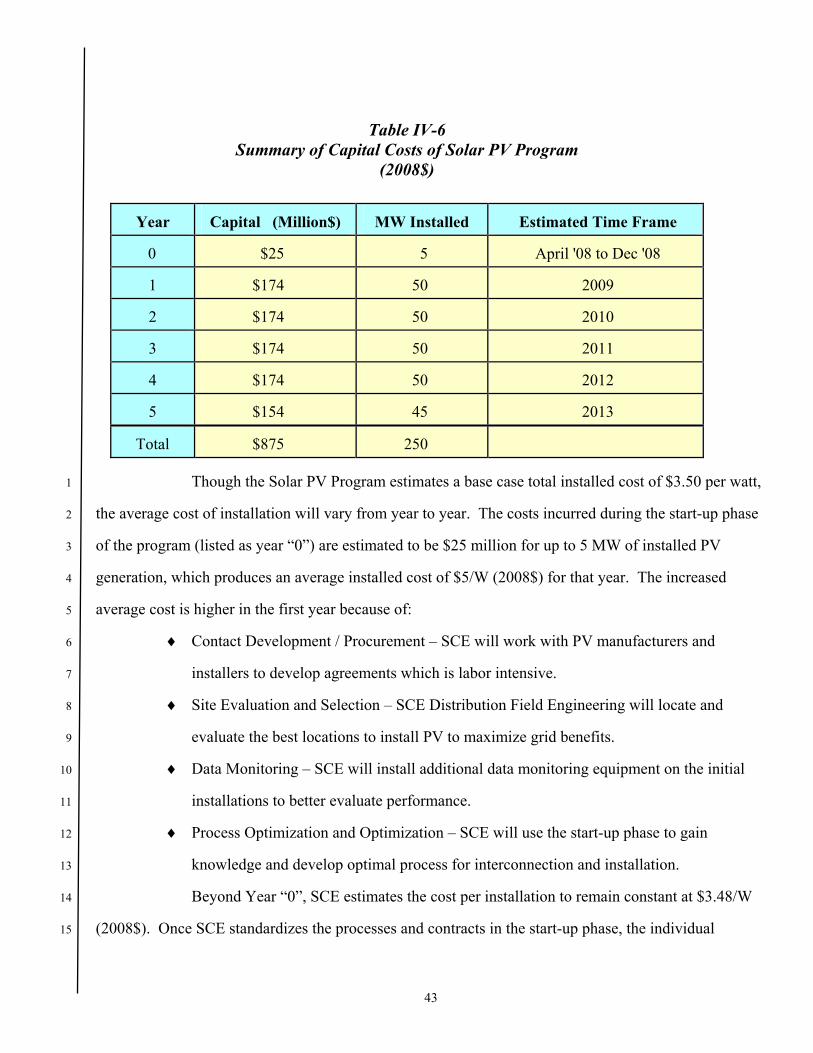
43
Table IV-6 Summary of Capital Costs of Solar PV Program
(2008$)
Year Capital (Million$) MW Installed Estimated Time Frame
0 $25 5 April '08 to Dec '08
1 $174 50 2009
2 $174 50 2010
3 $174 50 2011
4 $174 50 2012
5 $154 45 2013
Total $875 250
Though the Solar PV Program estimates a base case total installed cost of $3.50 per watt, 1
the average cost of installation will vary from year to year. The costs incurred during the start-up phase 2
of the program (listed as year “0”) are estimated to be $25 million for up to 5 MW of installed PV 3
generation, which produces an average installed cost of $5/W (2008$) for that year. The increased 4
average cost is higher in the first year because of: 5
♦ Contact Development / Procurement – SCE will work with PV manufacturers and 6
installers to develop agreements which is labor intensive. 7
♦ Site Evaluation and Selection – SCE Distribution Field Engineering will locate and 8
evaluate the best locations to install PV to maximize grid benefits. 9
♦ Data Monitoring – SCE will install additional data monitoring equipment on the initial 10
installations to better evaluate performance. 11
♦ Process Optimization and Optimization – SCE will use the start-up phase to gain 12
knowledge and develop optimal process for interconnection and installation. 13
Beyond Year “0”, SCE estimates the cost per installation to remain constant at $3.48/W 14
(2008$). Once SCE standardizes the processes and contracts in the start-up phase, the individual 15
44
installation costs will remain stable in constant dollars. Individual project cost will vary due to 1
locational issues (permitting, ease of installation), but the average costs should remain fairly stable. 2
SCE assumes 50 MW of solar PV installed per year for years 1-4 resulting in a annual capital 3
expenditure of $174 million. SCE assumes 45 MW of solar PV installed in year 5 at an average cost of 4
$3.42/W ($2008). The total capital expenditures for year 5 are forecast to be $154 million. 5
B. Operation & Maintenance Cost 6
1. Roof Lease Payments 7
The leasing of roof space for PV panel installations is a novel concept. No real market 8
reference pricing currently exists. The Solar PV Program differs from most large-scale rooftop PV 9
deployments. This program will be for large roof buildings that would not otherwise be typical 10
candidates for net energy metering. The closest business model is the rooftop cell phone tower 11
installations. But even these are not representative, as they occupy a much smaller area of the roof. 12
SCE is engaged in discussions with numerous Real Estate Investment Trusts which own 13
large numbers of commercial buildings, to determine mutually equitable arrangement for leasing roof-14
space. SCE is exploring multiple options to establish a market price, such as leases based on a square 15
foot basis and those based on a percentage of gross power output value. Other issues, such as liability 16
minimization, roof access, lease term, etc., are also being examined to determine acceptable contracting 17
terms. 18
As this is a new opportunity for the large rooftop owners, it is difficult to estimate the 19
expected leasing rates. SCE realizes that the maximum price paid for these roof leases must be kept to a 20
small percentage (equal to or less than 10%) of the value of the electricity being produced. 21
SCE has identified numerous potential leasing partners whose portfolios contain several 22
times the amount of roof space needed for even the 500 MW program. SCE is confident that the leasing 23
issues can be adequately addressed to the satisfaction of both parties and that, ultimately, ample cost-24
effective roof leases can be arranged. 25

45
2. Maintenance Cost 1
Preventative maintenance costs are typically low for solar PV systems. Generally, 2
maintenance consists of washing the modules once or twice each year to facilitate maximum energy 3
production. The frequency could vary depending on specific site conditions. Regularly monitoring the 4
system output through the DAS will provide the necessary information to determine when cleaning is 5
required. A visual inspection of the array once a year is also usually recommended and can be 6
performed at the same time as a routine cleaning. Inverters do not typically require routine maintenance 7
other than to make sure the air filters are clean. If the inverters are installed indoors, a yearly visual 8
inspection should suffice. 9
Table IV-7 contains an estimate of annual O&M costs, not including the roof lease for a 1 10
MW solar PV project of $35,000 (2008 $). The Solar PV Program would add up to 50 such projects 11
each year, increasing O&M by $2.626 million per year. 12
Table IV-7 Estimated Yearly O&M Costs for a 1 MW Solar PV Project
(2008$)
Labor Activity Cost per Year Frequency
Array Cleaning $ 10,000 2x per year
Array Inspection $ 5,000 1x per year
DAS Monitoring $ 20,000 Monthly
TOTAL O&M COST PER YEAR $ 35,000
3. Staffing 13
The Solar PV Program will require a staff of 11 Full Time Equivalent (FTE) employees. 14
If the Commission authorizes SCE’s Solar PV Program, SCE’s current staffing level is insufficient to 15
provide adequate oversight and project development capability. 16
Table IV-8 summarizes the costs associated with the required additional employees. 17

46
Table IV-8 Solar PV Program Management Labor Forecast Increase For New Employees
(2008$)
Line No.
Incremental Staffing:
# Positions Total Labor Increase
1 Manager - Project/Product 2 8 $ 1,029,768
2 Manager 3 1 $ 163,296
3 Technical Specialist 3 2 $ 199,710
3 Total Increase in Labor 11 $ 1,392,774
These employees will provide the project management and program contract oversight 1
necessary for the Solar PV Program. The employees would include senior management, technical 2
specialists, and senior project managers including: 3
• Vendor Relationship Management – Responsible for managing rooftop, panel 4
and supplier relationships. Will have the contact management function. Ongoing 5
primary point of control for all vendors, contracts, and internal SCE interactions. 6
Two Manager-Project/Product 2 positions for the six years of the program. 7
• Site Management – Responsible for site selection, coordination, and interconnect 8
management. Primary point of contact during “pre-installation” phase. Works to 9
assure prompt interconnect activity and permitting coordination. Two Manager-10
Project/Product 2 positions for the six years of the program. 11
• Installation Management – Responsible for managing the installation process 12
through Engineer, Procure, Construct (EPC) Vendor, or multiple contractors. 13
Executes site management’s plan. Two Manager-Project/Product 2 positions for 14
the six years of the program. 15
• Business Management – Responsible for planning, strategy, reporting and 16
management of department and project budgets, staff, regulatory reporting and 17

47
other activities. Two Manager-Project/Product 2 positions for the six years of the 1
program. 2
• Operations – Responsible for project maintenance and monitoring. One 3
Manager 3 and two Technical Specialist 3 positions beginning in year 2 of the 4
program. In addition, the Manager 3 will have management responsibility for the 5
program staff. 6
Table IV-9 below summarizes the proposed staffing costs each year. The dates listed 7
assume approval of the memorandum account in April, 2008. 8
Table IV-9 Forecast Summary of Staffing Costs of Solar PV Program
Year Labor (2008$) Estimated Time Frame
0 $737,514 April '08 to Dec ‘08
1 $1,290,419 2009
2 $1,392,774 2011
3 $1,392,774 2012
4 $1,392,774 2013
5 $1,392,774 2014
9
48
V. 1
RATEMAKING 2
A. Introduction 3
This chapter presents SCE’s cost recovery proposal for the Solar PV Program. SCE is requesting 4
recovery of the revenue requirement associated with the costs associated with Solar PV Program 5
activities described in the previous chapters. SCE expects to incur approximately $53.8 million (2008$) 6
in O&M and $875.0 million (2007$) in direct capital expenditures over the 2008 through 2014 program 7
period, and requests that the Commission find reasonable up to $962.5 million (2008$) in direct capital 8
expenditures during the 2008 through 2014 program period. 9
B. Forecast of SCE’s Solar PV Program Revenue Requirements 10
Table V-10 below, contains the estimated annual revenue requirements during the 2008 through 11
2014 period.31 12
31 The revenue requirement shown for 2008 will be recovered from customers in 2009 along with the estimated 2009
revenue requirement.
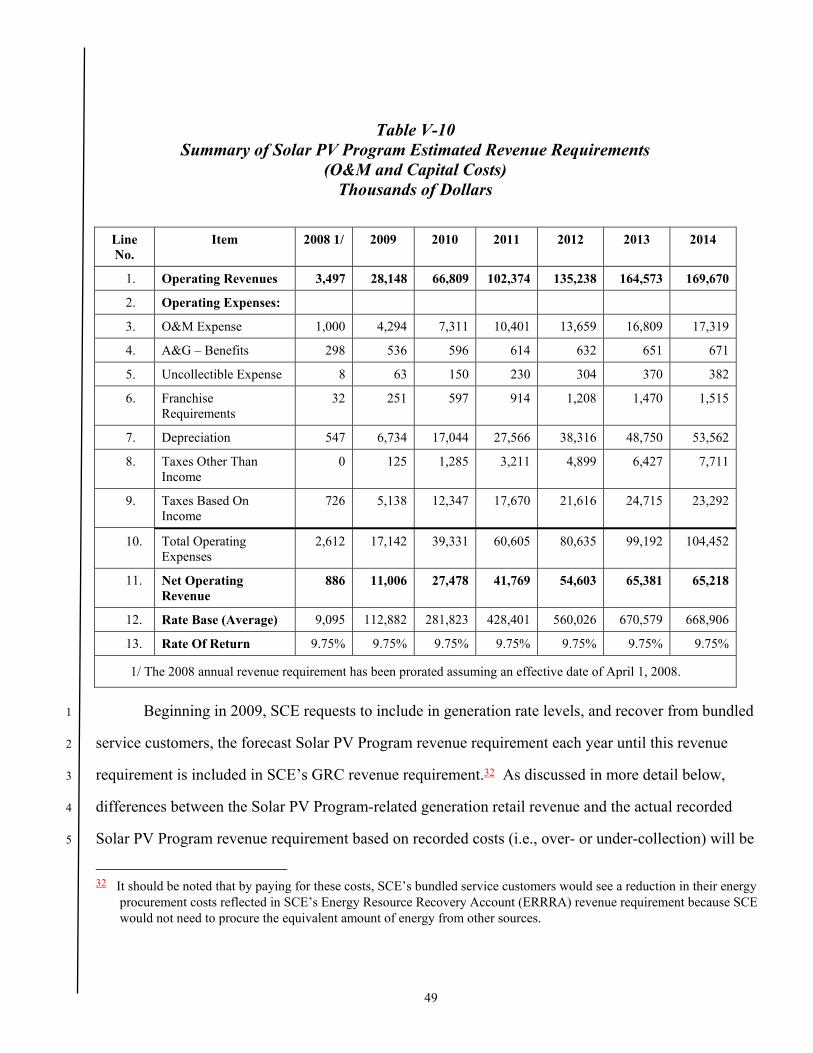
49
Table V-10 Summary of Solar PV Program Estimated Revenue Requirements
(O&M and Capital Costs) Thousands of Dollars
Line No.
Item 2008 1/ 2009 2010 2011 2012 2013 2014
1. Operating Revenues 3,497 28,148 66,809 102,374 135,238 164,573 169,670
2. Operating Expenses:
3. O&M Expense 1,000 4,294 7,311 10,401 13,659 16,809 17,319
4. A&G – Benefits 298 536 596 614 632 651 671
5. Uncollectible Expense 8 63 150 230 304 370 382
6. Franchise Requirements
32 251 597 914 1,208 1,470 1,515
7. Depreciation 547 6,734 17,044 27,566 38,316 48,750 53,562
8. Taxes Other Than Income
0 125 1,285 3,211 4,899 6,427 7,711
9. Taxes Based On Income
726 5,138 12,347 17,670 21,616 24,715 23,292
10. Total Operating Expenses
2,612 17,142 39,331 60,605 80,635 99,192 104,452
11. Net Operating Revenue
886 11,006 27,478 41,769 54,603 65,381 65,218
12. Rate Base (Average) 9,095 112,882 281,823 428,401 560,026 670,579 668,906
13. Rate Of Return 9.75% 9.75% 9.75% 9.75% 9.75% 9.75% 9.75%
1/ The 2008 annual revenue requirement has been prorated assuming an effective date of April 1, 2008.
Beginning in 2009, SCE requests to include in generation rate levels, and recover from bundled 1
service customers, the forecast Solar PV Program revenue requirement each year until this revenue 2
requirement is included in SCE’s GRC revenue requirement.32 As discussed in more detail below, 3
differences between the Solar PV Program-related generation retail revenue and the actual recorded 4
Solar PV Program revenue requirement based on recorded costs (i.e., over- or under-collection) will be 5
32 It should be noted that by paying for these costs, SCE’s bundled service customers would see a reduction in their energy
procurement costs reflected in SCE’s Energy Resource Recovery Account (ERRRA) revenue requirement because SCE would not need to procure the equivalent amount of energy from other sources.

50
recorded in the SPVPBA. SCE will also include the estimated above market cost of the annual revenue 1
requirement in the calculation of the vintaged Cost Responsibility Surcharges (CRS) applicable to Direct 2
Access, Departing Load and Community Choice Aggregation customers each year.33 3
If as discussed in Chapter I, the Solar PV program is successful, SCE may seek additional 4
authority to expand the program to 500 MW. In the request to expand the program, SCE will include its 5
proposal to continue to use the SPVPBA during the expansion period. 6
1. Capital Expenditures/Additions 7
For purposes of estimating the annual revenue requirements contained in Table V-10 8
above, SCE used the direct capital expenditures estimated to be $875 million in constant 2008$ shown 9
in Table IV-6. Table V-11 shows the estimated direct capital expenditures for each calendar year, plus 10
escalation based on the index discussed in Section D below, plus an adder to estimate overheads such as, 11
Allowance for Funds Used During Construction (AFUDC), capitalized pensions and benefits, payroll 12
and property taxes.34 The total estimated nominal expenditures in the amount of $1,028.0 million are 13
included in forecast plant-in-service (i.e., rate base) as of the date the plant investment is estimated to go 14
in service. 15
33 Currently, the Commission authorizes the CRS rates in SCE’s annual ERRA Forecast Proceedings. 34 SCE will not include capitalized A&G on recorded capital expenditures included in the SPVPBA.
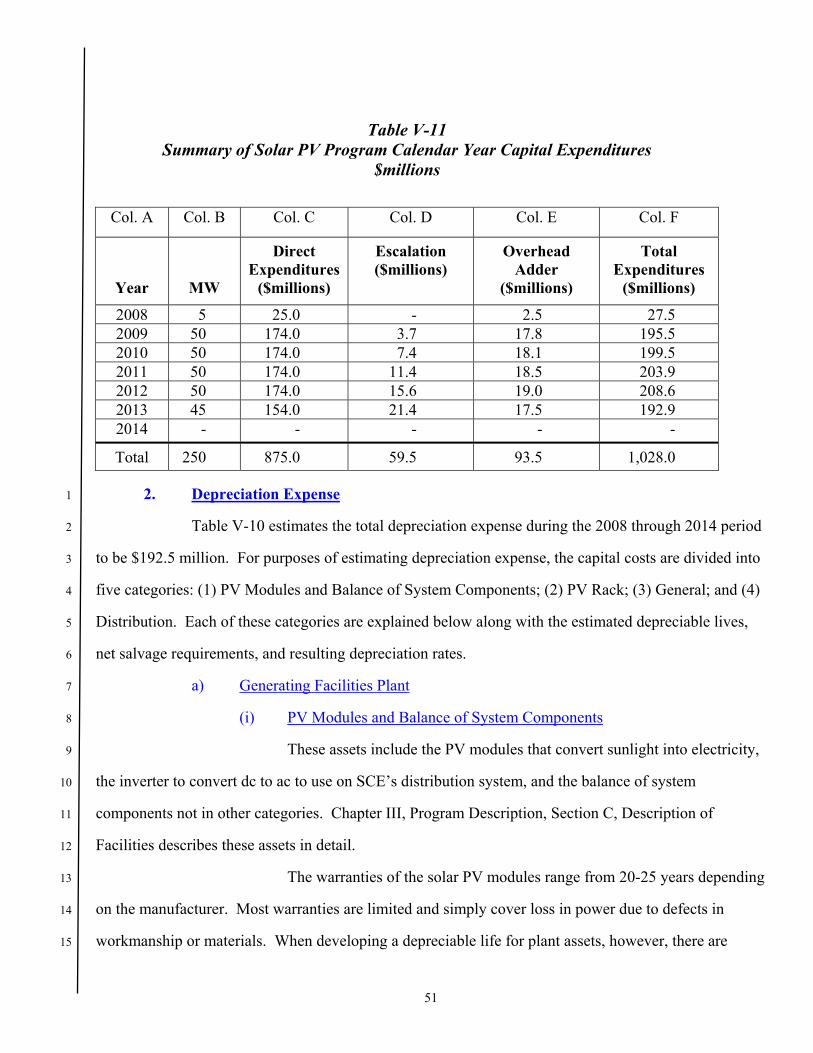
51
Table V-11 Summary of Solar PV Program Calendar Year Capital Expenditures
$millions
Col. A Col. B Col. C Col. D Col. E Col. F
Year
MW
Direct Expenditures
($millions)
Escalation ($millions)
Overhead Adder
($millions)
Total Expenditures
($millions)
2008 5 25.0 - 2.5 27.5 2009 50 174.0 3.7 17.8 195.5 2010 50 174.0 7.4 18.1 199.5 2011 50 174.0 11.4 18.5 203.9 2012 50 174.0 15.6 19.0 208.6 2013 45 154.0 21.4 17.5 192.9 2014 - - - - -
Total 250 875.0 59.5 93.5 1,028.0
2. Depreciation Expense 1
Table V-10 estimates the total depreciation expense during the 2008 through 2014 period 2
to be $192.5 million. For purposes of estimating depreciation expense, the capital costs are divided into 3
five categories: (1) PV Modules and Balance of System Components; (2) PV Rack; (3) General; and (4) 4
Distribution. Each of these categories are explained below along with the estimated depreciable lives, 5
net salvage requirements, and resulting depreciation rates. 6
a) Generating Facilities Plant 7
(i) PV Modules and Balance of System Components 8
These assets include the PV modules that convert sunlight into electricity, 9
the inverter to convert dc to ac to use on SCE’s distribution system, and the balance of system 10
components not in other categories. Chapter III, Program Description, Section C, Description of 11
Facilities describes these assets in detail. 12
The warranties of the solar PV modules range from 20-25 years depending 13
on the manufacturer. Most warranties are limited and simply cover loss in power due to defects in 14
workmanship or materials. When developing a depreciable life for plant assets, however, there are 15

52
many other forces of retirement to consider in addition to defects in workmanship or material. These 1
retirement forces for rooftop PV may include (but are not limited to): weather (wind, electrical, and rain 2
storms), fire, theft, vandalism, terminating lease contracts, roof failure, and obsolescence. Considering 3
all forces of asset retirement the average depreciable life of the PV modules could average 15-20 years 4
(i.e., some may retire earlier or later). At this time, SCE proposes using an average service life of 20 5
years. 6
The estimated decommissioning cost for the solar PV system is 7
approximately $75,000/MW in 2008 dollars. The decommissioning costs are expected to be incurred 20 8
years after the date of installation of the PV Production assets. So, SCE projected the costs at the 9
expected retirement date. Depreciation accrual for decommissioning begins upon installation of the 10
underlying assets. Table V-10 shows the future decommissioning estimates and the estimated future 11
annual deprecation expense for the assets installed in each respective year. 12
Table V-12 Summary of Future Decommissioning Expenses (included in Depr. Expense)
thousands of dollars
Year
Installed
MW
Year
Retired
Decommissioning
$75 / MW
Escalation
Factor 1/
Decommissioning (retirement year$)
Annual
Depreciation 2/
2008 5 2028 $375 1.6395 $615 $31
2009 50 2029 $3,750 1.6323 $6,121 $306
2010 50 2030 $3,750 1.6263 $6,099 $305
2011 50 2031 $3,750 1.6208 $6,078 $304
2012 50 2032 $3,750 1.6198 $6,074 $304
2013 45 2033 $3,375 1.6220 $5,474 $274
1 / Escalation factor is based on Global Insight Chain-Weighted GDP between year installed and year retired
2/ Assets are estimated to be installed mid-year, so the first year of estimated depreciation will be half the annual amount.

53
(ii) PV Rack 1
The PV rack is the support structure for the PV modules, made primarily 2
of aluminum and miscellaneous hardware. Chapter III, Program Description, Section C, Description of 3
Facilities explains the rack in detail. As a support structure, the estimated depreciable life of the PV 4
rack is 30 years. 5
b) General Plant 6
The general plant in the Solar PV Program is the data acquisition system (DAS). 7
The DAS will include data collection, metering, communication, and weather sensoring equipment. 8
This equipment is primarily modern, digital electronic computer and microprocessor-equipment and is 9
similar to SCE’s existing Supervisory Control and Data Acquisition (SCADA) equipment. SCE’s 10
current authorized depreciation lives for this type of SCADA equipment ranges from 7 to 15 years.35 11
For purposes of estimating depreciation in this filing, SCE used 10 years. The net salvage requirement 12
for this equipment is estimated at zero percent. 13
c) Distribution Plant 14
The distribution plant is the equipment required to connect the solar PV 15
generation to the distribution grid. The plant may include overhead conductor, underground conduit and 16
conductor, disconnect switches, distribution line transformers, services, and other distribution 17
equipment. SCE determined the estimated depreciation for these assets using composite depreciation 18
rates based on SCE’s 2006 General Rate Case (GRC) Decision 36 authorized depreciation rates for year 19
2008 cost estimates, and its proposed 2009 GRC37 depreciation rates for years 2009 through 2014. The 20
current authorized depreciation rates are based on an average service life of 30 to 55 years and net 21
salvage requirements ranging from 0 to -100 percent. 22
35 D. 06-05-016. SCE’s proposed depreciation lives in its 2009 GRC (A. 07-11-011) are the same. 36 D. 06-05-016 37 A. 07-11-011
54
3. Rate of Return 1
As authorized in D.06-05-039, SCE calculated the rate of return on rate base using SCE’s 2
current authorized rate of return of 8.75%, plus 1%, since this new plant will be utility-owned renewable 3
generation. 4
4. O&M Expense 5
Table V-11 shows the estimated O&M expenses by year included in the estimated 6
revenue requirements shown in Table V-10. Column C of Table V-13, shows the total estimated O&M 7
expenses in the amount of $53.83 million in constant $2008 as supported in the previous chapters.38 8
Column D includes the annual estimated incremental staffing expenses in the amount of $8.98 million as 9
supported in Chapter IV.39 Column E includes an estimate of the benefits associated with the 10
incremental staffing in the amount of $3.63 million. Column F includes estimated escalation associated 11
with the amounts included in Columns C through E based on escalation rates supported in SCE’s 2009 12
GRC Application (A.07-11-011). Therefore, as shown in Column G, the total estimated nominal O&M 13
expenses included in the estimated 2008 through 2014 annual revenue requirements is $74.79 million. 14
38 For example, the estimated maintenance and roof lease O&M for 2008 is calculated by multiplying 5 MW by
$52,520/MW. For purposes of calculating and annual revenue requirement for 2014, SCE has included a full year of estimated O&M expenses.
39 Table IV-9

55
Table V-13 Summary of Solar PV Program Calendar Year Estimated O&M Expenditures
$millions
Col. A Col. B Col. C Col. D Col. E Col. F Col. G Non-
Labor Labor Related
Year
Cumulative Installed
MW
$2008
Constant
Labor $2008
Constant
Benefits $2008
Constant
Escalation
Total
Nominal
2008 5 0.26 0.74 0.30 - 1.30
2009 55 2.89 1.29 0.52 0.13 4.83
2010 105 5.51 1.39 0.56 0.44 7.91
2011 155 8.14 1.39 0.56 0.92 11.01
2012 205 10.77 1.39 0.56 1.58 14.29
2013 250 13.13 1.39 0.56 2.38 17.46
2014 250 13.13 1.39 0.56 2.90 17.99
Total 53.83 8.98 3.63 8.35 74.79
5. Income Taxes 1
SCE estimates income taxes by following the rules and methods traditionally adopted in 2
the Company’s GRC. Specifically, in computing tax depreciation, SCE uses the five year MACRS 3
(Modified Accelerated Cost Recovery System) tax life for federal purposes and a five year life, straight-4
line method, for computing state tax depreciation. For Federal tax purposes, SCE includes 50% Bonus 5
Depreciation for all 2008 capital additions that meet prescribed requirements. Deferred taxes are 6
estimated as required by the Internal Revenue Code. SCE computes tax basis by removing any recorded 7
Allowance for Funds Used During Construction (AFUDC) and replacing it with tax capitalized interest 8
following the rules of Internal Revenue Code Section 263A. SCE also computes a tax deduction for the 9
benefits of Internal Revenue Code Section 199. SCE computes tax expense and the corresponding 10

56
deferred taxes using the applicable Federal corporate tax rate of 35% for each year and an apportioned 1
state corporate tax rate, as applicable.40 2
C. Description of Solar PV Program Balancing Account (SPVPBA) 3
SCE requests that the Commission authorize SCE to establish the SPVPBA to record the 4
difference between: 1) the actual incremental O&M and capital-related revenue requirement associated 5
with the Solar PV Program and; 2) the recorded Solar PV Program-related generation retail revenue. 6
The SPVPBA will ensure that no more and no less than the reasonably incurred actual revenue 7
requirement associated with the Solar PV Program is ultimately recovered from customers. The 8
incremental O&M costs that will be recorded in the SPVPBA will include such things as the cost of 9
cleaning, inspecting and monitoring the solar PV equipment, lease costs, insurance, incremental labor 10
associated with the staffing requirements to manage the project, and travel expenses.41 SCE proposes to 11
also record the revenue requirement (i.e. depreciation,42 property, payroll and income taxes, and return 12
calculated at the authorized rate of return on rate base) associated with actual Solar PV Program capital 13
additions.43 Consistent with D.06-05-039, SCE will calculate the rate of return on rate base using SCE’s 14
current authorized rate of return of 8.75%, plus 1%, since this new plant will be utility-owned renewable 15
generation.44 16
SCE will continue to record entries in the SPVPBA until both the O&M and capital-related 17
revenue requirements are included in SCE’s GRC revenue requirement, which is expected to be 18
January 1, 2015, or sooner. 19
40 Congress is currently proposing legislation that could produce tax credits for solar projects. If enacted and if this project
meets the requirements and qualifications of any enacted legislation, SCE will record any solar tax credit benefits in the SPVPBA taking into account the normalization requirements
41 SCE will also record applicable benefits associated with any incremental labor that is recorded in the SPVPBA. 42 The depreciation expense recorded to the SPVPBA for these assets will reflect the current authorized depreciation rates
for the respective general plant accounts and will be updated, as necessary, as a result of SCE’s 2009 GRC decision and any subsequent General Rate Case decision regarding depreciation of the respective plant accounts.
43 Capital additions include overheads such as AFUDC, capitalized property and payroll taxes, and pension and benefits added to direct expenditures of $875 million.
44 The Commission in D.06-05-039 implemented the California Legislature’s authorization for increased incentive for utility ownership of renewable generation.

57
On March 27, 2008, SCE filed an advice letter requesting Commission authority to establish the 1
SPVPMA to record all incremental O&M expenses, invoiced costs for outside services (e.g., consultants 2
and vendors), insurance, and any capital-related revenue requirement incurred as a result of SCE’s Solar 3
PV Program activities prior to Commission approval of SCE’s ratemaking request in this instant 4
application. The establishment of the SPVPMA is necessary to ensure that the Solar PV Program can 5
proceed without delay and without precluding cost recovery at a future date. Similar to all Commission-6
approved memorandum accounts, the SPVPMA will protect against retroactive ratemaking concerns, 7
but will not guarantee recovery in rates of any recorded costs prior to Commission review and approval. 8
SCE plans to only use the interim ratemaking (i.e. the SPVPMA) while this application is pending in 9
2008 to record incremental O&M and capital-related revenue requirement associated with the first 10
$25 million of direct capital expenditures. If the Commission does not act on this application in 2008, 11
SCE will record incremental O&M and capital-related revenue requirement above $25 million in the 12
SPVPMA until a final Commission decision is issued. Finally, upon approval of this application, SCE 13
will transfer the balance recorded in the SPVPMA to the SPVPBA. 14
At the end of each year, SCE proposes to transfer the balance recorded in the SPVPBA, either 15
over- or under-collected, to the generation sub-account of the Base Revenue Requirement Balancing 16
Account (BRRBA). At the beginning of each year, SCE consolidates the December 31st balance 17
recorded in the generation sub-account of the BRRBA in generation rate levels to be recovered from 18
bundled service customers. 19
D. Proposed Reasonableness Review and Standard for Reasonableness Review 20
SCE proposes to include in its annual April ERRA Reasonableness proceedings, testimony 21
supporting the reasonableness of the O&M costs recorded in the SPVPBA during the prior calendar 22
year. SCE proposes that if SCE’s direct capital expenditures in each calendar year of the program are 23
less, on a $/W basis than the amount in Table V-14 below, then those capital expenditures will be 24
deemed to be reasonable. 25

58
Table V-14 Reasonableness Review Threshold For Direct Solar PV Program Capital Costs
(2008$)45
Expenditures Incurred During
$/W
2008 5.50
2009 3.83
2010 3.83
2011 3.83
2012 3.83
2013 3.76
The threshold levels contained in Table V-14 are reasonable because they represent SCE’s base 1
case estimate of Solar PV Program cost per Watt, as shown on Table IV-6, plus a reasonable 10% 2
contingency. 3
1. Inflation Adjustment 4
Because direct capital expenditures will be recorded in nominal dollars during each year 5
of the project, the $/W costs in Table V-14 will have to be adjusted for general price inflation between 6
2008 and later years. SCE proposes to accomplish this by multiplying the $/W costs in 2008 dollars by 7
the ratio of the Gross Domestic Product Price Index (GDPPI) for the calendar year being reviewed to the 8
Gross Domestic Product Price Index for 2008. Expressed as a formula where RT is the reasonableness 9
threshold: 10
2008
14-V Table GDPPIGDPPIRTRT t
t ×= 11
2. Reasonableness Review Procedure 12
In any year that SCE’s direct capital expenditures, on a $/W basis, exceed the amounts 13
set forth in Table V-14 above, as escalated, SCE will include, in its annual April ERRA Reasonableness 14
45 These threshold amounts will be escalated to nominal year amounts for use in reasonableness review.

59
proceedings, testimony supporting the reasonableness of the capital expenditures during the previous 1
calendar year. Even if no reasonableness testimony is required, SCE will include for Commission audit 2
and review the O&M and capital revenue requirement recorded in the SPVPBA in its annual April 3
ERRA Reasonableness proceeding. 4

Appendix A
Witness Qualifications

A-1
SOUTHERN CALIFORNIA EDISON COMPANY 1
QUALIFICATIONS AND PREPARED TESTIMONY 2
OF RICHARD FISHER 3
Q. Please state your name and business address for the record. 4
A. My name is Richard Fisher, and my business address is 2244 Walnut Grove Avenue, 5
Rosemead, California 91770. 6
Q. Briefly describe your present responsibilities at the Southern California Edison Company. 7
A. I am the manager of the Rate Base and Depreciation group in the Capital Recovery Division, 8
responsible for recorded depreciation, nuclear decommissioning, and portions of rate base. 9
Q. Briefly describe your educational and professional background. 10
A. I have a Bachelor of Science Degree in Business Administration, with an emphasis in Finance, 11
Real Estate, and Law, from California State Polytechnic University, Pomona. I am currently 12
completing course work towards a Masters degree in Business Administration at the University 13
of Southern California and will be completed by June 2008. I am a member of the Society of 14
Depreciation Professionals and have been qualified as a Certified Depreciation Professional. 15
Since my employment with Southern California Edison in 1999 I have been with the 16
Capital Recovery Division of the Controllers Department. My responsibilities have included 17
functions involving depreciation and nuclear decommissioning accounting, depreciation 18
studies, and the development of forecasting models for plant additions, rate base, and 19
depreciation expense in direct support of the Company’s regulatory proceedings. I have 20
previously testified before the California Public Utilities Commission. 21
Q. What is the purpose of your testimony in this proceeding? 22
A. The purpose of my testimony in this proceeding is to sponsor those portions of Exhibit No. 23
SCE-1, entitled Solar Photovoltaic (PV) Program Testimony, as identified in the Table of 24
Contents thereto. 25
Q. Was this material prepared by you or under your supervision? 26
A. Yes, it was. 27
A-2
Q. Insofar as this material is factual in nature, do you believe it to be correct? 1
A. Yes, I do. 2
Q. Insofar as this material is in the nature of opinion or judgment, does it represent your best 3
judgment? 4
A. Yes, it does. 5
Q. Does this conclude your qualifications and prepared testimony? 6
A. Yes, it does. 7

A-3
SOUTHERN CALIFORNIA EDISON COMPANY 1
QUALIFICATIONS AND PREPARED TESTIMONY 2
OF PAUL T. HUNT, JR. 3
Q. Please state your name and business address for the record. 4
A. My name is Paul T. Hunt, Jr., and my business address is 2244 Walnut Grove Avenue, 5
Rosemead, California 91770. 6
Q. Briefly describe your present responsibilities at the Southern California Edison Company. 7
A. I am the Manager of Regulatory Finance and Economics, supervising the Regulatory Finance 8
Division of the Treasurer’s Department. My present responsibility is to apply economic, 9
financial, and statistical analysis to regulatory issues and for internal corporate purposes. 10
Q. Briefly describe your educational and professional background. 11
A. I received a Bachelor of Arts degree in Economics from Pomona College in 1975, a Master of 12
Arts degree in Economics from Stanford University in 1976, and a Doctor of Philosophy degree 13
from Stanford University in 1981. I joined the Southern California Edison Company as an 14
Associate Economist in the Treasurer’s Department in July 1980. I was promoted to Economist 15
in 1982 and Senior Economist in 1984. In 1989, I transferred to the Regulatory Policy and 16
Affairs Department as a Regulatory Economics Consultant. I returned to the Treasurer’s 17
Department in 1996 as a Senior Economist. In 1997, I was promoted to Project Manager. I was 18
promoted to my present position in 2000. 19
I have testified before the California Public Utilities Commission and the Federal Energy 20
Regulatory Commission. 21
Q. What is the purpose of your testimony in this proceeding? 22
A. The purpose of my testimony in this proceeding is to sponsor the portions of Exhibit No. SCE-1, 23
entitled Solar Photovoltaic (PV) Program Testimony, as identified in the Table of Contents 24
thereto. 25

A-4
Q. Was this material prepared by you or under your supervision? 1
A. Yes, it was. 2
Q. Insofar as this material is factual in nature, do you believe it to be correct? 3
A. Yes, I do. 4
Q. Insofar as this material is in the nature of opinion or judgment, does it represent your best 5
judgment? 6
A. Yes, it does. 7
Q. Does this conclude your qualifications and prepared testimony? 8
A. Yes, it does. 9

A-5
SOUTHERN CALIFORNIA EDISON COMPANY 1
QUALIFICATIONS AND PREPARED TESTIMONY 2
OF DEBORAH J. KLUN 3
Q. Please state your name and business address for the record. 4
A. My name is Deborah J. Klun, and my business address is 2244 Walnut Grove Avenue, Rosemead, 5
California 91770. 6
Q. Briefly describe your present responsibilities at the Southern California Edison Company. 7
A. I am a Director in the Tax Department. Since late April 2007, I have been responsible for all tax 8
matters in CPUC and FERC rate filings made by the company. 9
Q. Briefly describe your educational and professional background. 10
A. I hold an undergraduate degree in Accounting from De Paul University, a Master’s degree in 11
Taxation from De Paul University and a Juris Doctorate degree from Northwestern University. I have 12
passed the CPA exam (Illinois), and am licensed to practice law in Hawaii. I have been employed in the 13
Edison Tax Department since 1988. I have held various positions in the tax department, having 14
responsibility for Tax Research and Planning, IRS Audits and the Accounting for Income Tax function, 15
as well as, tax rate regulation. Prior to joining Edison, I worked as Director of Federal Tax for another 16
corporation, I practiced with a large law firm and worked for a big four CPA firm. 17
Q. What is the purpose of your testimony in this proceeding? 18
A. The purpose of my testimony in this proceeding is to sponsor those portions of Exhibit No. SCE-1, 19
entitled Solar Photovoltaic (PV) Program Testimony, as identified in the Table of Contents thereto. 20
Q. Was this material prepared by you or under your supervision? 21
A. Yes, it was. 22
Q. Insofar as this material is factual in nature, do you believe it to be correct? 23
A. Yes, I do. 24
Q. Insofar as this material is in the nature of opinion or judgment, does it represent your best 25
judgment? 26
A. Yes, it does. 27

A-6
Q. Does this conclude your qualifications and prepared testimony? 1
A. Yes, it does. 2

A-7
SOUTHERN CALIFORNIA EDISON COMPANY 1
QUALIFICATIONS AND PREPARED TESTIMONY 2
OF MARK E. NELSON 3
Q. Please state your name and business address for the record. 4
A. My name is Mark E. Nelson, and my business address is 8631 Rush Street, Rosemead, California 5
91770. 6
Q. Briefly describe your present responsibilities at the Southern California Edison Company. 7
A. I am the Director of Generation Planning and Strategy in the Generation Business Unit. My 8
present responsibility includes the broad support of generation initiatives and regulatory efforts 9
at SCE, and management of the Project Development Division. 10
Q. Briefly describe your educational and professional background. 11
A. I earned a Bachelor of Science degree in Economics from Iowa State University with emphasis 12
work in Chemical Engineering and Systems. I earned a Master of Science degree in 13
Econometrics from Iowa State University with thesis work in electricity demand analysis. I first 14
joined the Southern California Edison Company as a Planning Engineer in 1991 and held various 15
management positions through 1996, including Manager of Real Time Pricing and Customer 16
Software Systems. In 1996 I joined Edison Source and held a number of management positions 17
including Director of Retail Energy Operations until my departure in 1999 following the 18
cessation of energy marketing activities. From 1999-2003, I served as Managing Consultant of 19
Commerce Venture Group LLC, with primary responsibility for energy sector consulting and 20
analysis. I rejoined Southern California Edison in 2003 as Integrated Planning Manager and was 21
subsequently promoted to Manager of Strategic Projects in the Resource Planning & Strategy 22
Department prior to promotion to my current position. 23
Prior to joining Southern California Edison, I served as a Consultant for Midwest Solar, Inc., a 24
leading national supplier of large scale solar thermal systems, with responsibility for economic 25
and engineering analysis from 1980-83. From 1983-88, I held management and analysis 26
positions with subsidiaries of MidAmerican Energy, with responsibility for generation and 27
A-8
transmission projects, economic analysis, regulatory affairs and customer services. From 1988-1
91, I served as Vice President of Analysis for DATASSIST, where I was responsible for 2
economic and statistical analysis of electric and gas utility projects. 3
I am the author of a number of energy and business books and articles, including: An 4
Econometric Study of Residential Electricity Demand (ISBN 1-56471-005-X), Fundamentals of 5
Business Process Analysis (1-56471-009-2), and “Understanding Natural Gas Demand for 6
Electric Utilities.” 7
Q. What is the purpose of your testimony in this proceeding? 8
A. The purpose of my testimony in this proceeding is to sponsor the portions of Exhibit No. SCE-1 9
entitled Solar Photovoltaic (PV) Program Testimony, as identified in the Table of Contents 10
thereto. 11
Q. Was this material prepared by you or under your supervision? 12
A. Yes, it was. 13
Q. Insofar as this material is factual in nature, do you believe it to be correct? 14
A. Yes, I do. 15
Q. Insofar as this material is in the nature of opinion or judgment, does it represent your best 16
judgment? 17
A. Yes, it does. 18
Q. Does this conclude your qualifications and prepared testimony? 19
A. Yes, it does. 20
A-9
SOUTHERN CALIFORNIA EDISON COMPANY 1
QUALIFICATIONS AND PREPARED TESTIMONY 2
OF RUDY PEREZ 3
Q.1 Please state your name and business address for the record. 4
A.1 My name is Rodolfo “Rudy” Perez and my business address is Southern California Edison 5
Company, 8631 Rush Street, Rosemead, California 91770. 6
Q.2 Briefly describe your present responsibilities at the Southern California Edison Company. 7
A.2 I am the current Project Manager for the development of the Solar Photovoltaic Program (SPVP) 8
within the Generation Business Unit Planning and Strategy Group at the Southern California 9
Edison Company. 10
Q.3 Briefly describe your educational and professional background. 11
A.3 I hold bachelor degrees in Chemical Engineering and Economics from the University of Notre 12
Dame (Indiana) as well as a Masters in Business Administration from California State University 13
– Long Beach. I also hold a California Professional Engineer’s License in Mechanical 14
Engineering. I have been an SCE employee for over 25 years holding various engineering and 15
management positions within Generation, Transmission & Distribution and the Renewable and 16
Alternative Power Organizations. 17
Q.4 What is the purpose of your testimony in this proceeding? 18
A.4 The purpose of my testimony in this proceeding is to sponsor the portions of Exhibit No. SCE-1, 19
entitled Solar Photovoltaic (PV) Program Testimony, as set forth in the Table of Contents 20
thereto. 21
Q.5 Was this material prepared by you or under your supervision? 22
A.5 Yes, it was. 23
Q.6 Insofar as this material is factual in nature, do you believe it to be correct? 24
A.6 Yes, I do. 25
Q.7 Insofar as this material is in the nature of opinion or judgment, does it represent your best 26
judgment? 27

A-10
A.7 Yes, it does. 1
Q.8 Does this conclude your qualifications and prepared testimony? 2
A.8 Yes, it does. 3
A-11
SOUTHERN CALIFORNIA EDISON COMPANY 1
QUALIFICATIONS AND PREPARED TESTIMONY 2
OF GENE E. RODRIGUES 3
Q. Please state your name and business address for the record. 4
A. My name is Gene E. Rodrigues, and my business address is 6042A N. Irwindale Avenue, 5
Irwindale, CA 91702. 6
Q. Briefly describe your present responsibilities at the Southern California Edison Company (SCE). 7
A. I am presently the Director of Energy Efficiency for SCE. In that capacity, I have direct 8
oversight of SCE’s portfolio of energy efficiency programs, low income energy efficiency 9
programs, the California Alternate Rates for Energy (CARE) program, the self generation 10
incentives program, California Solar Initiative and the measurement & evaluation and regulatory 11
support functions for these areas. 12
Q. Briefly describe your educational and professional background. 13
A. I received a Bachelor of Science degree in Education from Northern Arizona University in 1980 14
and a Juris Doctor degree from the University of California, Hastings College of Law in 1988. 15
Before coming to SCE, I taught high school in Arizona and practiced law with a civil litigation 16
firm in Los Angeles. In 1990, I joined SCE’s regulatory law department, where I provided legal 17
support for SCE’s energy efficiency programs, among other things. Since moving to the 18
business side of SCE, I have held various positions within the Customer Service Business Unit, 19
managing energy efficiency policy, operations and regulatory functions. My current position is 20
Director of Energy Efficiency. I have previously practiced law and testified before the 21
Commission. 22
Q. What is the purpose of your testimony in this proceeding? 23
A. The purpose of my testimony in this proceeding is to sponsor the portions of Exhibit No. SCE-1, 24
entitled Solar Photovoltaic (PV) Program Testimony, as set forth in the Table of Contents 25
thereto. 26
Q. Was this material prepared by you or under your supervision? 27

A-12
A. Yes, it was. 1
Q. Insofar as this material is factual in nature, do you believe it to be correct? 2
A. Yes, I do. 3
Q. Insofar as this material is in the nature of opinion or judgment, does it represent your best 4
judgment? 5
A. Yes, it does. 6
Q. Does this conclude your qualifications and prepared testimony? 7
A. Yes, it does. 8
9
A-13
SOUTHERN CALIFORNIA EDISON COMPANY 1
QUALIFICATIONS AND PREPARED TESTIMONY 2
OF DOUGLAS A. SNOW 3
Q. Please state your name and business address for the record. 4
A. My name is Douglas A. Snow, and my business address is 2244 Walnut Grove Avenue, 5
Rosemead, California 91770. 6
Q. Briefly describe your present responsibilities at the Southern California Edison Company (SCE). 7
A. I am the Manager of Revenue Requirements in SCE’s Regulatory Policy and Affairs (RP&A) 8
Department. As such, I am responsible for overseeing the operation of various Balancing and 9
Memorandum Accounts and the associated disposition of the balances in those accounts for 10
ratemaking purposes. 11
Q. Briefly describe your educational and professional background. 12
A. I graduated from Texas A&M University in May of 1982 with a Bachelors of Science Degree in 13
Industrial Engineering. In June of 1982, I went to work for Southwestern Public Service 14
Company (SPS) in west Texas. While there, I attained a title of Supervisory Engineer and was 15
responsible for revenue requirement calculations and rate design for both retail and resale 16
customers. I filed testimony on behalf of SPS before the Texas Public Utility Commission and 17
the Federal Energy Regulatory Commission. In November of 1993, I went to work for the 18
Southern California Edison Company as a Financial Analyst in the FERC Pricing section in the 19
RP&A Department. While working in the FERC section, I was responsible for the rate design 20
for SCE’s requirements sales for resale, Wheeling Access Charges, and wholesale Distribution 21
Access Charges. In March 1998, I became a Supervisor in the Revenue Requirements division 22
of RP&A, responsible for supervising a group of analysts that oversee the forecasting and 23
recording entries associated with all CPUC regulatory mechanisms. In December 2001, I was 24
promoted to the position of manager in the Revenue Requirements division of RP&A. In August 25
2006, I was promoted to my current position as Manager of Revenue Requirements. I have 26
previously testified before the California Public Utilities Commission. 27

A-14
Q. What is the purpose of your testimony in this proceeding? 1
A. The purpose of my testimony in this proceeding is to sponsor portions of Exhibit No. SCE-1, 2
entitled Solar Photovoltaic (PV) Program Testimony, as identified in the Table of Contents 3
thereto. 4
Q. Was this material prepared by you or under your supervision? 5
A. Yes, it was. 6
Q. Insofar as this material is factual in nature, do you believe it to be correct? 7
A. Yes, I do. 8
Q. Insofar as this material is in the nature of opinion or judgment, does it represent your best 9
judgment? 10
A. Yes, it does. 11
Q. Does this conclude your qualifications and prepared testimony? 12
A. Yes, it does. 13

1