solar panels combined with led lighting - case study from ... · solar panels combined with led...
TRANSCRIPT
Solar panels combined with LED lighting - Case study from Finland
Ater Amogpai M.Sc. Researcher Department of Electronics Lighting unit Aalto University Finland [email protected]
Janne Viitanen, Researcher, Department of Electronics, Lighting unit, Aalto University, Finland, [email protected] Marjukka Puolakka, D.Sc, Department of Electronics, Lighting unit, Aalto University, Finland, [email protected] Liisa Halonen, D.Sc, Department of Electronics, Lighting unit, Aalto University, Finland, [email protected] Extended abstract The energy efficiency of lighting has gained more interest lately and one possible solution for this is LED lighting. The concern for climate change has also raised interest for renewable energy sources such as photovoltaics. This paper discusses LED lighting combined with solar panels using DC network for office lighting in Finland. A demonstrational office lighting system was built into Light cube, which is a 4mx4mx2.5m glass cube located on the roof of the Department of Electronics and Communication of Aalto University School of Science and Technology. Lighting was powered using solar panels installed outside the glass cube. The whole system used 24 V DC. The purpose of the demonstration was to study possibilities of photovoltaics in office lighting and compare LED lighting to fluorescent lighting using similar luminaires with both light sources. The solar electricity production was also monitored from different compass points and solar panel tilt angles. The solar panel measurements were done using separate measurement panels that were not connected to the power production of the glass cube, but their power was consumed on integrated resistors. The voltage level over these resistors was proven to be proportional to the output current of the main solar panels that produced electricity to the demonstrational system. This enabled to measure the power production of similar system in all the directions that had measurement panels installed. The power production varied greatly according to seasonal and daily changes. In the middle of the winter 300 Wp (peak watts) the system produced only 20 W on average in the middle of the day but in March the average production was raised to about 150 W. These are average values over the month, the daily production varied much according to weather. The measurements showed that in winter almost vertical tilt angles produce most electricity. As the position of the sun goes higher when season turns to spring and summer, the optimal tilt angle changes towards more horizontal values. The optimal tilt angle also depends on the time of the day. The luminaires used in this demonstration were based on typical Finnish office lighting luminaire, which originally had 3x28W TL5 fluorescent lamps. Two of these lamps provided uplight, but they were removed for this demonstration and the measurements were done using only downlight. After measuring the FL luminaires, similar luminaires were converted to use 11x3W Citizen LEDs each
and lighting measurements were repeated. LED measurements were also done using several luminaire power dimming levels. The illuminance levels of the working area and surrounding area were measured first. The results showed that FL average illuminance was 420 lx for the working area and 377 lx for the whole area. For LED average illuminance was 771 lx for working area and 677 lx for the whole area without dimming. FL luminares were only measured using the full power but LED luminares were in addition dimmed to 37.5%, 50% and 62.5% of the full power. The average illuminances for the dimmed LED lighting in the working area were 510 lx, 391 lx and 285 lx respectively to the dimming levels mentioned above. Based on these measurements, dimming level of 37.5% was chosen for additional UGR measurements. At this dimming level LED lighting used 35% less power than the FLs but gave 23% more light to the working area. UGR values were above the recommendations for office lighting with both light sources. The uniformity of light was better with FLs than with LEDs. Most of today’s office devices operate internally with DC. If buildings would have integrated DC networks, transformers would not be necessary as long as the DC network voltage level would be suitable for the devices. This could result to increased power efficacy. DC network is also more suitable for distributed power purposes, because solar panels and other DC generators are more easily connected to it than to AC network. This is because DC sources do not need to be synchronized to the same frequency and phase with the electricity grid as opposite to AC generators and networks. DC network also has smaller transfer losses than AC network. The disadvantages of DC distribution are that DC current is more complicated to switch off than AC because there is no zero points in the signal. Some equipment also still requires AC power and different devices use often different voltages. This means that if DC networks would be built, the system would still require voltage level and form conversions that cause extra costs and increase losses. If DC network would be built solely for lighting purposes, it would be much easier to use single voltage level throughout the system. The measurement results showed that there is possibility to gain substantial energy savings using LEDs instead of fluorescent lamps in office lighting. With LEDs the lighting levels can be more freely selected and focused to the area where it is most needed. LED and fluorescent lamp luminaires used in this office lighting demonstration suffered from minor glare problems. A possible reason for this was the small dimensions of the demonstrational office room. It was found that it is possible to implement office lighting using LEDs combined with photovoltaics. The disadvantage of photovoltaic energy production is that it varies greatly accordingly to time of year and day and also weather affects it substantially. In the Finnish conditions photovoltaics should be combined with other energy sources whenever possible. LED lighting combined with solar panels can result in energy savings, but they are still a relatively expensive choice today. Also the efficiency of both is still in a developing stage but it is expected to get much better in the future with new technological innovations.
Summary This paper focuses on solar energy and its utilization possibilities for office lighting in Finland. In addition to literary resources, a demonstrational lighting system that combined LEDs and solar panels using DC power network was installed at the Aalto University School of Science and Technology. The aim of this case study was to provide electricity for LED office lighting efficiently using DC networks with as few system components as possible. Further objective of the demonstration was to study the applicability of LEDs in office lighting and to compare them to fluorescent lamps The effects of seasonal and daily changes to power production of the solar panels were also analyzed with various tilt angles. Solar electricity production varied significantly according to season and weather. In winter 300 Wp (peak watts, maximum output power of solar panels) solar electricity system had difficulties to keep up 40 W lighting power running because there was so little solar radiation available, even with large capacity backup battery. During spring the photovoltaic system provided electricity abundantly and much more than the lighting could utilize. The optimal tilt angle varied according to the time of year and day. In February optimal angle for south facing solar panel was almost vertical but in April it was close to the annual optimal tilt angle (48º) for this installation location (Espoo, Finland). Room illuminances for LED and fluorescent lamp lighting were measured using full power and several dimming levels. LED luminaires were dimmed to 37.5. %, 50% and 62.5% of their full power to study the effects of dimming to power consumption. When luminaires operated at full power, LEDs consumed more power (74 W) than FLs (61 W) but they provided more light also. The dimming level of 37.5% was found to be useful for office lighting because it provided the recommended office Illuminance level of 500 lx. However, luminaires used here suffered from minor glare problems. The UGR glare index values of the LED and FLs exceeded the recommended values for office lighting. The colour temperature for FL lighting was 3000K and for LED lighting 5250K.
Keywords: photovoltaics, LED, DC networks 1. Introduction The global concern for climate change has raised interest for renewable energy sources. In this paper the focus is on solar energy and its utilization possibilities for office lighting in Finland. LEDs are expected to be the most important light source in the near future. They operate with DC-current as do the solar panels. LEDs and solar panels were combined using DC-network in a case study realized in the Lighting Unit of Aalto University School of Science and Technology. By choosing suitable DC voltage level it was possible to implement this system without transformers or DC choppers. The point of interest in the case study was on system efficacy and the utilisation possibilities of the photovoltaic electricity in lighting systems. The results were compared to a traditional fluorescent lamp lighting system that was installed in the same demonstrational space. The overall results showed promising possibilities, but also system restrictions dictated by the varying PV production and limited energy storage capacity. LED and PV-modules are also quite expensive still today when compared to their benefits, but the prices are reducing every year due to increased production volumes and technical development.
2. Photovoltaic and low voltage DC systems Distributed generation is defined as a small-scale electricity generation that can be combined with photovoltaic systems. In the early days of electricity generation, the distribution system was a DC based. This meant that electric power was only supplied to customers from a point of generation. However, at the end of the 19th century, and due to technological evolution, AC took over as the mean of electric power distribution system. This was because AC is more flexible to transmit over long distances than DC [1]. However, in the last decades due to technological innovations and rising environmental issues, as well as a changing economics has resulted in renewed interest for distributed generation systems [2]. In office buildings, nonlinear electronic loads, for example FL lighting, LED lighting, and varied speed drivers all have high losses due to conversion processes that involved AC/DC/AC. These conversion processes cause power quality problems such as reactive power consumption and low frequency current harmonics [2]. Therefore, alternative generation sources that reduce these losses are necessary. One of which produces DC is a photovoltaic. Photovoltaic generated source can be directly connected to a DC distributed system or through a DC/DC converter. Nonlinear electronic load such as lighting can be as well connected to a DC distributed system through AC/DC converter. [3]. DC distribution systems combined with photovoltaic in office buildings can achieve higher efficiency, higher reliability due to the need of the electricity storage, and avoid unnecessary conversion losses. There is increasing interest in sustainability in electricity supply through clean, renewable and affordable energy sources. Further, efficiency in electricity generation and distribution are both needed for less losses and higher reliability. So far, DC distribution is seen as a long term solution to improve efficiency in buildings. However, its acceptance is not yet predicted in the near future. In other words, DC voltage could continue to be supplied in buildings together with AC voltage. 3. Electricity consumption in office lighting World consumed about 2650 TWh of electricity for lighting in 2005 which is equivalent to 19% of total global electricity consumption [4]. Lighting is considered as a major electricity consumer in commercial buildings. For example, European office buildings use 50% of electricity for lighting, 20-30% in hospitals, 15% in industries, and 10-15% in residential buildings [5]. Currently, the dominant lighting technology in office buildings is based on fluorescent lamps. These lamps are very efficient lamp types. In the future LEDs are expected to become the most important lighting technology also in office lighting. They have much potential to save energy and enhance the quality of lighting [5]. Small size, long lifetime, and high luminous efficacy make LEDs more advantageous than conventional light sources. Further, unlike, fluorescent lamps, LEDs do not contain mercury, no radiant heat, and have low ambient temperature operation. It is also proved that switching has no effect on LEDs lifetime which is meant that rise time is very short [5]. Compared to FLs, LEDs are also more suitable for dimming.

Fig. 1 The layout of the demonstration system
Fig. 4 Used luminaires. FL (upper) and LED version (lower)
Fig. 2 Main solar panels, 3 x Naps NR100G24
Fig. 3 Measurement panel, Naps 13009
4. Photovoltaic DC system in office lighting - Case study: light cube,
Otaniemi Espoo, Finland
4.1 Measurement arrangements The demonstration system was built around Light cube, which is located on a roof of the Department of Electronics, Communication and Automation of Aalto University School of Science and Technology. The basic idea was to build off-grid solar power system that provides electricity to indoor LED-luminaires and to see how well this sort of arrangement works in Finnish conditions. The main difference to regular lighting systems was that the system was implemented using completely DC power instead of the commonly used AC power. If the voltage levels of the luminaires and distributed electricity are chosen to be the same, this type of system requires less components and can have smaller conversion losses than AC-systems. This type of solar panel and lighting system can be installed for example to summer cottages, third world country villages, research stations or other places that are located outside the electricity grid. It is also possible to modify the system so that it can be utilized in office buildings and use PV-system as an addition to grid electricity for reducing the electricity bill.
In addition to the PV- powered lighting system, additional stand-alone solar panels were also mounted to each principal compass point. The purpose of this was to gather information about the relativity between the panel mounting direction and the changes in electricity production. In Fig 1 is the layout of the installed system.
4.2 Equipment The system consists of three 100 Wp (peak watts) solar panels, 210 Ah / 24 V battery unit, two LED-luminaires, five 13 Wp PV modules, battery charge controller, installation accessories and a data logger unit. The main panels used for electricity production were Naps Systems NR100G24 and the total effective area of these panels was 2.16 m2 with maximum power output of 300 W. The system voltage was 24 V. The main panels were facing south and tilted in 48° angle.
For solar panel measurements, there were five Naps 13009 solar modules (Fig. 3), pointing to each principal compass point in tilt angle of 90° and one facing south with adjustable tilt angle. These modules were not connected to the actual electrical production, but the produced power was consumed in resistors connected directly to the modules. Luminaires (Fig 4.) were based on typically used office ceiling light. The original luminaires used 3x 28W TL5. Two of these TL5 lamps provided uplight. The purpose of this demonstration was to gain better energy efficiency on the working area, so the uplight capabilities of the luminaire were removed. After conversion process luminaires had 1x28W TL5 downlight with 3000K colour temperature. In addition two similar luminaires were converted to use LEDs as a light source. Each LED luminaire had 11 x 3W (Citizen CL-L102-C3N-B) LEDs and 6 LED drivers (Innoline RCD-24-0.35). The colour temperature of the LEDs was 5250K. 4.3 Photovoltaic measurements Because of the limitations of the data logger unit, it was not possible to directly measure the actual produced electrical power continuously, because of the high output currents. This is why the measurements were implemented using a relativistic method. At first the output current of the main panels was measured using a charge controller’s integrated current meter. This data however could not be stored to the data logger, so these measurements were performed with several solar radiation levels and corresponding current levels. At this time the south facing measurement panel with adjustable tilt angle was installed to the same place and angle as the main panels. When measuring the voltage over the resistors of the measuring panels, it was confirmed that this voltage level changed at the same rate as the output current of the main panels. This relativity is presented in Equation 1:
(1)
where: k = system specific constant ump = voltage over the resistor of the measurement panel [V] I = Output current of the main panels [A] All the voltages of the system could be measured and stored using the data logger unit. This means that the power output of the main panels could be measured continuously using voltage data of the main system and the measurement panels, because the output current of the main panels was relativistic to the measurement panel voltage. So the system output power was calculated using Equation 2:
(2)
where: P = system output power [W] U = system voltage [V] All the measurement panels were identical, so after the calculation of the constant k it was possible to calculate the power production in all those directions that had measurement panels installed, based on the collected voltage data. The error margin of this type of measurement is about 5% when compared to the values read from stand-alone voltage and current meters. 4.3.1 Angle dependency Photovoltaic energy production is highly dependent of several factors: panel technology, time of year, time of day, weather, temperature, tilt angle and shading. Most of these cannot be controlled.
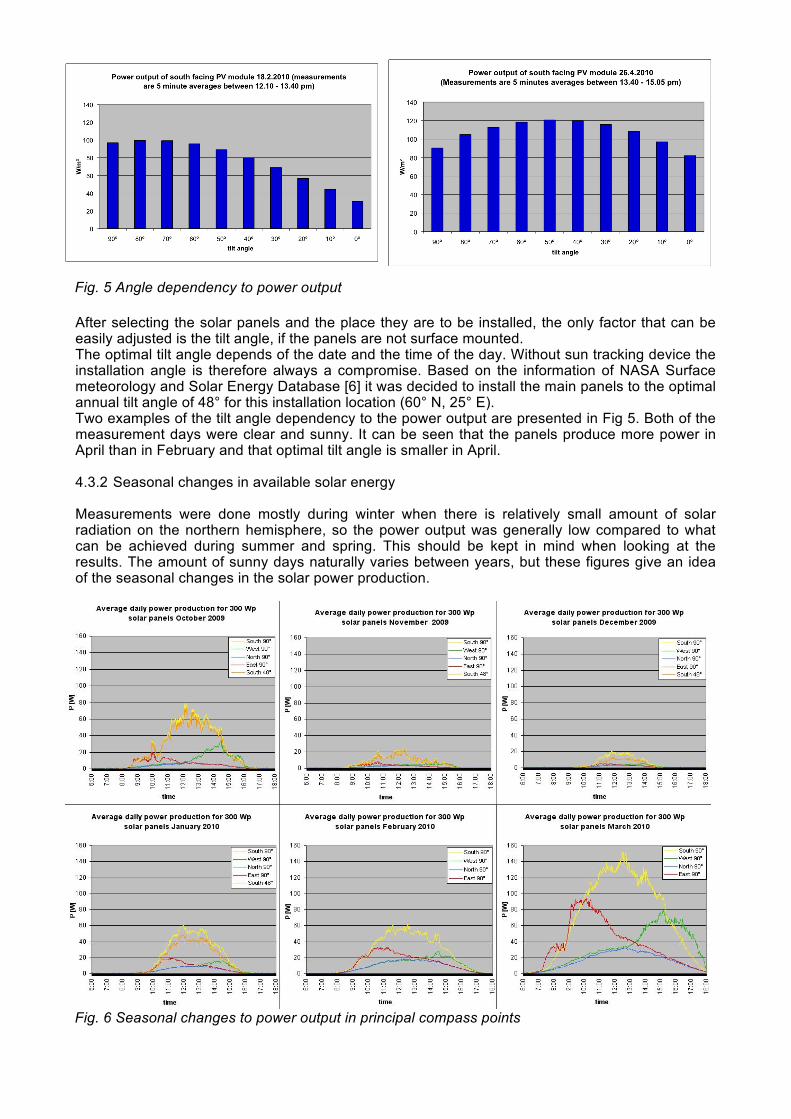
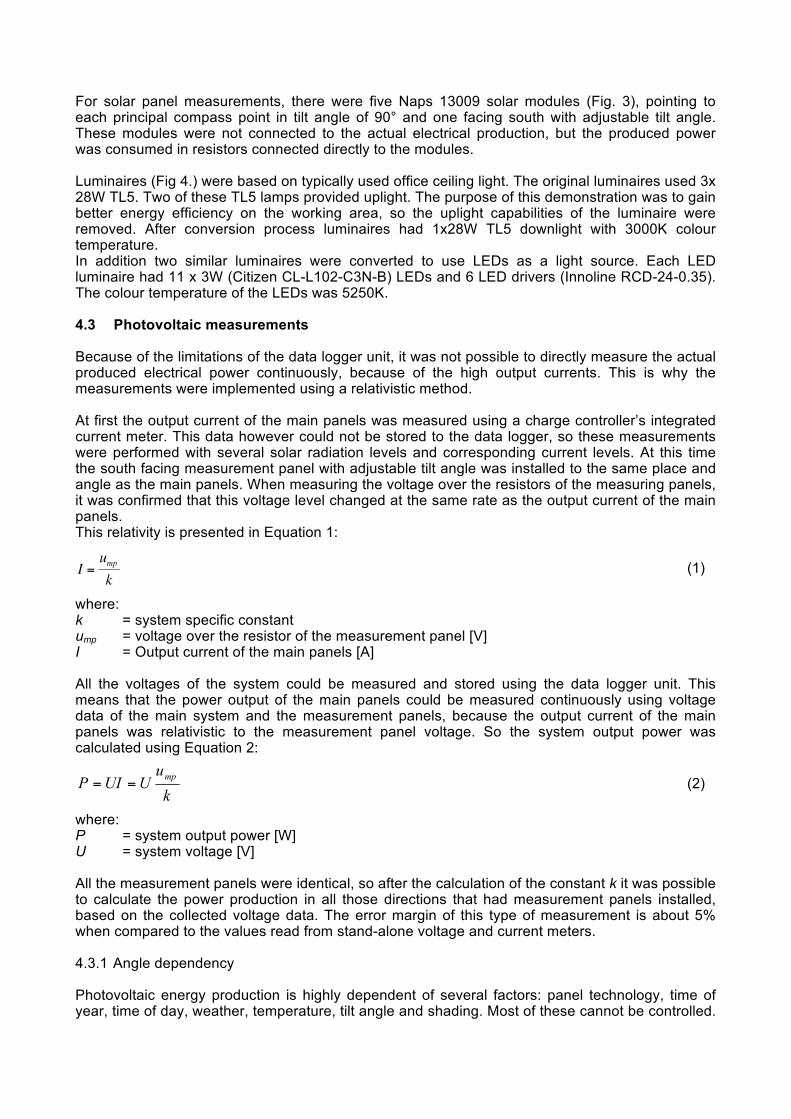
Fig. 5 Angle dependency to power output
Fig. 6 Seasonal changes to power output in principal compass points
After selecting the solar panels and the place they are to be installed, the only factor that can be easily adjusted is the tilt angle, if the panels are not surface mounted. The optimal tilt angle depends of the date and the time of the day. Without sun tracking device the installation angle is therefore always a compromise. Based on the information of NASA Surface meteorology and Solar Energy Database [6] it was decided to install the main panels to the optimal annual tilt angle of 48° for this installation location (60° N, 25° E). Two examples of the tilt angle dependency to the power output are presented in Fig 5. Both of the measurement days were clear and sunny. It can be seen that the panels produce more power in April than in February and that optimal tilt angle is smaller in April. 4.3.2 Seasonal changes in available solar energy Measurements were done mostly during winter when there is relatively small amount of solar radiation on the northern hemisphere, so the power output was generally low compared to what can be achieved during summer and spring. This should be kept in mind when looking at the results. The amount of sunny days naturally varies between years, but these figures give an idea of the seasonal changes in the solar power production.
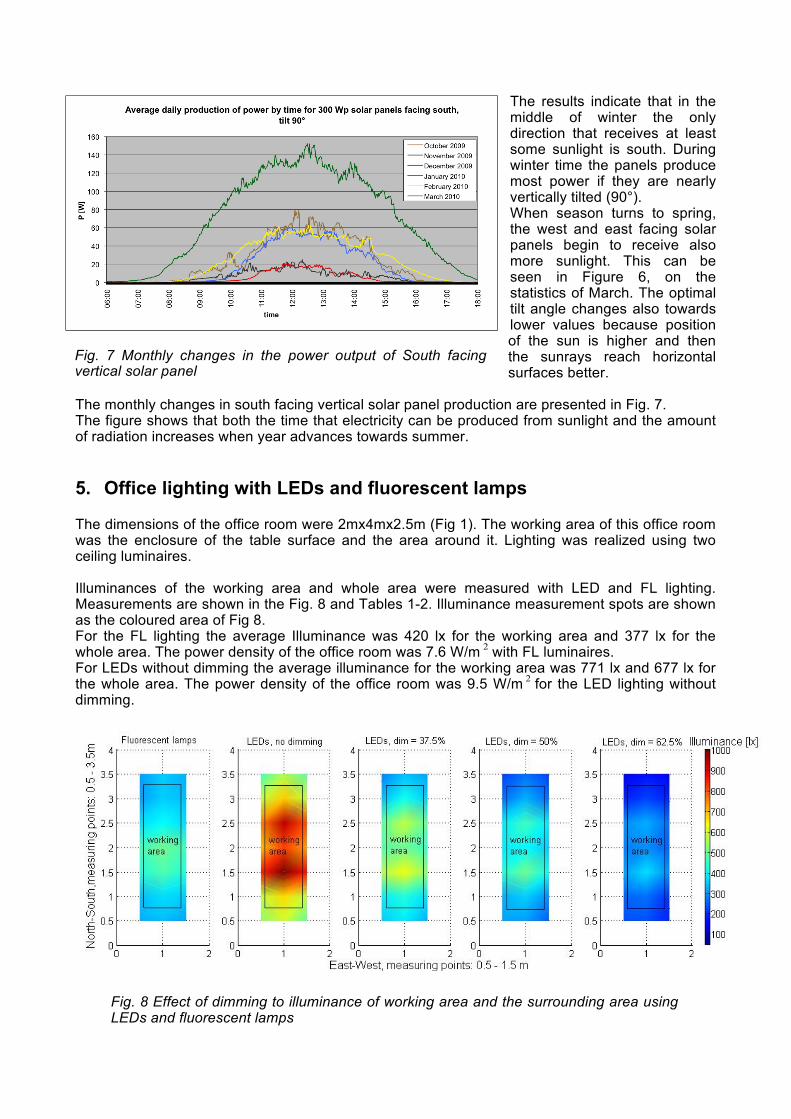
Fig. 7 Monthly changes in the power output of South facing vertical solar panel
Fig. 8 Effect of dimming to illuminance of working area and the surrounding area using LEDs and fluorescent lamps
The results indicate that in the middle of winter the only direction that receives at least some sunlight is south. During winter time the panels produce most power if they are nearly vertically tilted (90°). When season turns to spring, the west and east facing solar panels begin to receive also more sunlight. This can be seen in Figure 6, on the statistics of March. The optimal tilt angle changes also towards lower values because position of the sun is higher and then the sunrays reach horizontal surfaces better.
The monthly changes in south facing vertical solar panel production are presented in Fig. 7. The figure shows that both the time that electricity can be produced from sunlight and the amount of radiation increases when year advances towards summer.
5. Office lighting with LEDs and fluorescent lamps The dimensions of the office room were 2mx4mx2.5m (Fig 1). The working area of this office room was the enclosure of the table surface and the area around it. Lighting was realized using two ceiling luminaires. Illuminances of the working area and whole area were measured with LED and FL lighting. Measurements are shown in the Fig. 8 and Tables 1-2. Illuminance measurement spots are shown as the coloured area of Fig 8. For the FL lighting the average Illuminance was 420 lx for the working area and 377 lx for the whole area. The power density of the office room was 7.6 W/m with FL luminaires. For LEDs without dimming the average illuminance for the working area was 771 lx and 677 lx for the whole area. The power density of the office room was 9.5 W/m for the LED lighting without dimming.
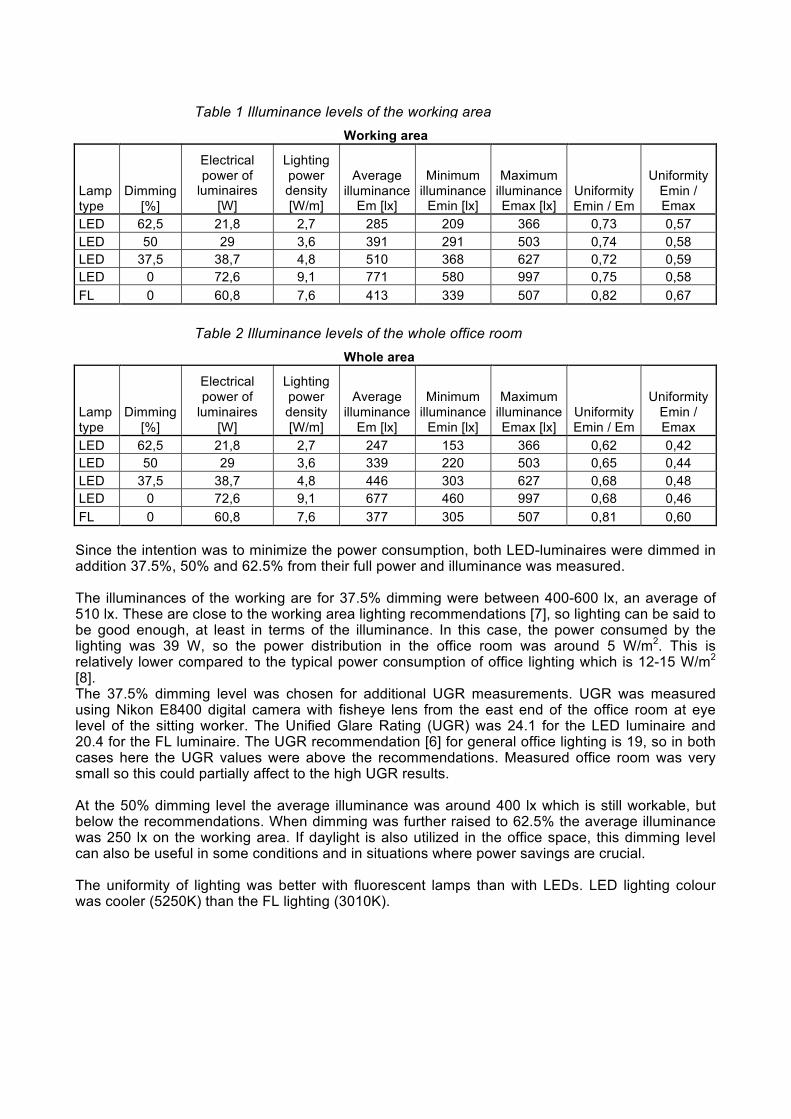
Table 1 Illuminance levels of the working area
Table 2 Illuminance levels of the whole office room
Working area
Lamp type
Dimming [%]
Electrical power of
luminaires [W]
Lighting power density [W/m]
Average illuminance
Em [lx]
Minimum illuminance
Emin [lx]
Maximum illuminance Emax [lx]
Uniformity Emin / Em
Uniformity Emin / Emax
LED 62,5 21,8 2,7 285 209 366 0,73 0,57 LED 50 29 3,6 391 291 503 0,74 0,58 LED 37,5 38,7 4,8 510 368 627 0,72 0,59 LED 0 72,6 9,1 771 580 997 0,75 0,58 FL 0 60,8 7,6 413 339 507 0,82 0,67
Whole area
Lamp type
Dimming [%]
Electrical power of
luminaires [W]
Lighting power density [W/m]
Average illuminance
Em [lx]
Minimum illuminance
Emin [lx]
Maximum illuminance Emax [lx]
Uniformity Emin / Em
Uniformity Emin / Emax
LED 62,5 21,8 2,7 247 153 366 0,62 0,42 LED 50 29 3,6 339 220 503 0,65 0,44 LED 37,5 38,7 4,8 446 303 627 0,68 0,48 LED 0 72,6 9,1 677 460 997 0,68 0,46 FL 0 60,8 7,6 377 305 507 0,81 0,60 Since the intention was to minimize the power consumption, both LED-luminaires were dimmed in addition 37.5%, 50% and 62.5% from their full power and illuminance was measured. The illuminances of the working are for 37.5% dimming were between 400-600 lx, an average of 510 lx. These are close to the working area lighting recommendations [7], so lighting can be said to be good enough, at least in terms of the illuminance. In this case, the power consumed by the lighting was 39 W, so the power distribution in the office room was around 5 W/m2. This is relatively lower compared to the typical power consumption of office lighting which is 12-15 W/m2 [8]. The 37.5% dimming level was chosen for additional UGR measurements. UGR was measured using Nikon E8400 digital camera with fisheye lens from the east end of the office room at eye level of the sitting worker. The Unified Glare Rating (UGR) was 24.1 for the LED luminaire and 20.4 for the FL luminaire. The UGR recommendation [6] for general office lighting is 19, so in both cases here the UGR values were above the recommendations. Measured office room was very small so this could partially affect to the high UGR results. At the 50% dimming level the average illuminance was around 400 lx which is still workable, but below the recommendations. When dimming was further raised to 62.5% the average illuminance was 250 lx on the working area. If daylight is also utilized in the office space, this dimming level can also be useful in some conditions and in situations where power savings are crucial. The uniformity of lighting was better with fluorescent lamps than with LEDs. LED lighting colour was cooler (5250K) than the FL lighting (3010K).

6. Advantages and challenges of DC system and photovoltaics in office
lighting Most of today’s office devices operate internally with DC. For example luminaires (incandescent, fluorescent lights, LEDs and halogens), control electronics, computers, A/V devices and electrical heaters use DC internally or existing devices can easily be converted so that they can utilize it. If DC-networks would be integrated into buildings, it could lower transformer- and rectifier-losses that occur in the AC/DC conversion. One estimate predicts that with a DC-network the yearly energy savings could be up to 20% of current energy use [9]. The quality of electricity is also better with DC because there is no harmonic frequencies that cause ripple and distortion to AC-signals and affect negatively to some sensitive electrical devices [9]. When the DC network is at continuous state, there are no inductive losses. AC network always contains inductive losses, the amount of these depends of the cable lengths, types and external error sources. DC electricity does not cause skin effect to cables in contrary to AC and this means that the resistive losses are also smaller. This means that DC networks are capable to transmit more power using same cables [10]-[11]. In addition to these factors, DC-network is more suitable than AC for distributed energy production. DC power generators can be connected more easily to grid, because they do not need to be synchronized to the same frequency and phase than the grid in contrary to AC systems. As long as the voltage levels of the grid and the generator are the same, DC-generators can be connected directly to grid. Solar panels produce DC-power, so with available DC-networks we could avoid DC/AC conversion and therefore reduce the conversion losses. It is also easier to connect batteries to DC network as a backup power reserve and voltage level regulation purposes because they internally DC use [9]. The DC networks provide possibilities to gain better efficiency and quality of electricity, but they also have disadvantages. DC power is more complicated to switch off than AC because there is no zero points in the signal. This means that circuit breakers used in DC networks have to be capable of switching of the full power. If the DC voltage level is low, the system requires cables with more cross-sectional area because the load currents will be higher than with high voltage level. This means additional costs and thicker cables also require more space. This should be kept in mind when designing DC-networks. It is possible to use the existing electrical cables to transmit DC power but as long as most devices in offices are designed to AC use, it would require separate cables for lighting and other possible DC connected devices. This results to additional installation and material expenses [9]. 7. Discussion and conclusions This case study showed that it is possible to gain substantial energy savings using LEDs instead of fluorescent lamps in office lighting. The key for achieving this is more flexible control of lighting in the office building. The demonstration showed that LEDs can provide more light with the same power compared to fluorescent lamps. With dimming level 37.5 % the LEDs used 35 % less power than the fluorescent lamps but gave 23% more light to the working area. The measured UGR values were little bit over the recommendations with fluorescent lamp luminaires and modified LED luminaires resulted in even higher UGR values. The main reason for this was that in the LED luminaires the light came from a relatively small amount of bright light points. Increasing the number of LEDs and using lower power LEDs could lessen the problem. The small dimensions of the measured office room also partially affect the measured UGR. If the dimensions of the office room would have been larger the glare increased indices could have been closer to the recommended value. A further design and construction of the LED luminaires would most likely reduce the glare problems. It is possible to implement LED lighting system completely with DC electricity. This is especially useful if electricity is generated using sources that produce DC, such as photovoltaics. The
problem with photovoltaic energy production is that it varies greatly due to time of year and day and also to weather conditions. In Finnish conditions this means that photovoltaics should be combined with other energy sources whenever possible. The grid electricity is in AC form so if that is used in addition to PV production, DC rectifiers are require to convert grid electricity to the correct form before utilizing it. The use of photovoltaics and LEDs can result to energy savings, but they are still a relatively expensive choice today. Also the efficiency of both is still on a developing stage but it is expected to get much better in the future with new technological innovations. With mass production the unit prices are expected to go down and this combined to the improving technology makes LEDs and photovoltaics an interesting choice in the future, when demand for greener and more efficiently used energy becomes more important. 8. References [1] G. PEPERMANS, J. DRISEN, D. HAESELDONCKX, R. BELMANS, and W. D’HAESELEER,
“Distribution generation: definition, benefits and issues”, Energy Policy 33, 2005, pp. 787-798 [2] DONLAND J. HAMMERSTROM, “AC versus DC distribution systems-Did We get it right?”,
IEEE 2007 [3] D. SALOMONSSON, A. SANNINO, “Low –voltage DC distribution system for commercial
power systems with sensitive electronic loads”, IEEE 2007 [4] IEA, “Light’s labour’s lost”, IEA publications, France, 2006 [5] VTT EDITA , ”Energy vision 2050”, Finland, 2009 [6] NASA SURFACE METEOROLOGY DATABASE, http://eosweb.larc.nasa.gov/cgi-
bin/sse/grid.cgi?&step=1&submit=Submit, location (60° N, 25° E), 2010 [7] F INNISH STANDARDS ASSOCIATION, “Valo ja valaistus. Työkohteiden valaistus. Osa 1:
Sisätilojen työkohteiden valaistus”, SFS-EN 12464-1:2003 , pp. 451. [8] MOTIVA, “Energiatehokkaat toimistovalaistusratkaisut”, ISBN 952-5304-01-9 pp. 72.
http://www.motiva.fi/files/307/Toimistovalaistusraportti.pdf [9] KYLKISALO T., ALANEN R., “Tasajännite taajaman sähkönjakelussa ja mikroverkoissa”,
VTT Working papers, Vol. 78, 2007, ISBN 978-951-38-6629-7 http://www.vtt.fi/inf/pdf/workingpapers/2007/W78.pdf
[10] MÖRSKY J., “Voimalaitosten yhteiskäytön tekniikka”, Otatieto, Helsinki, 1994, ISBN 951-672-184-2, pp. 300.
[11] PAAVOLA M., ” Sähköjohdot” , WSOY, Porvoo, 1975,. ISBN 951-0-06635-4, pp. 320.