solar integration experiences - uwig.org · distributed solar integration experiences prepared by:...
TRANSCRIPT
Distributed Solar Integration Experiences
Prepared by:
Philip Barker
Founder and Principal EngineerNova Energy Specialists, LLC
Schenectady, NY
Phone (518) 346‐9770
Website: novaenergyspecialists.com
E‐Mail: [email protected]
Presented at:
Utility Wind Integration Group (UWIG)2013 Distributed Wind/Solar Interconnection Workshop
May 21‐22, 2013
Golden, CO
1Prepared by Nova Energy Specialists, LLC
Topics• Discussion of Distribution and Subtransmission Factors Considered in Basic DG integration Studies
• Useful Ratios for Screening Analysis of DG Impacts
• Review of Some System Impacts:– Voltage Issues
– Fault Current Issues
– Islanding Issues
– Ground Fault and Load Rejection Overvoltage Issues
• Summary and Conclusions of PV Experiences
Prepared by Nova Energy Specialists, LLC 2
Prepared by Nova Energy Specialists, LLC 3
12.47 kV
Subtransmission Line
Substation Transformer
LTC
DG
DistributionFeeder
Rotating Machine or Inverter based DG
Step Up Transformer
Subtransmission Source
Bulk System
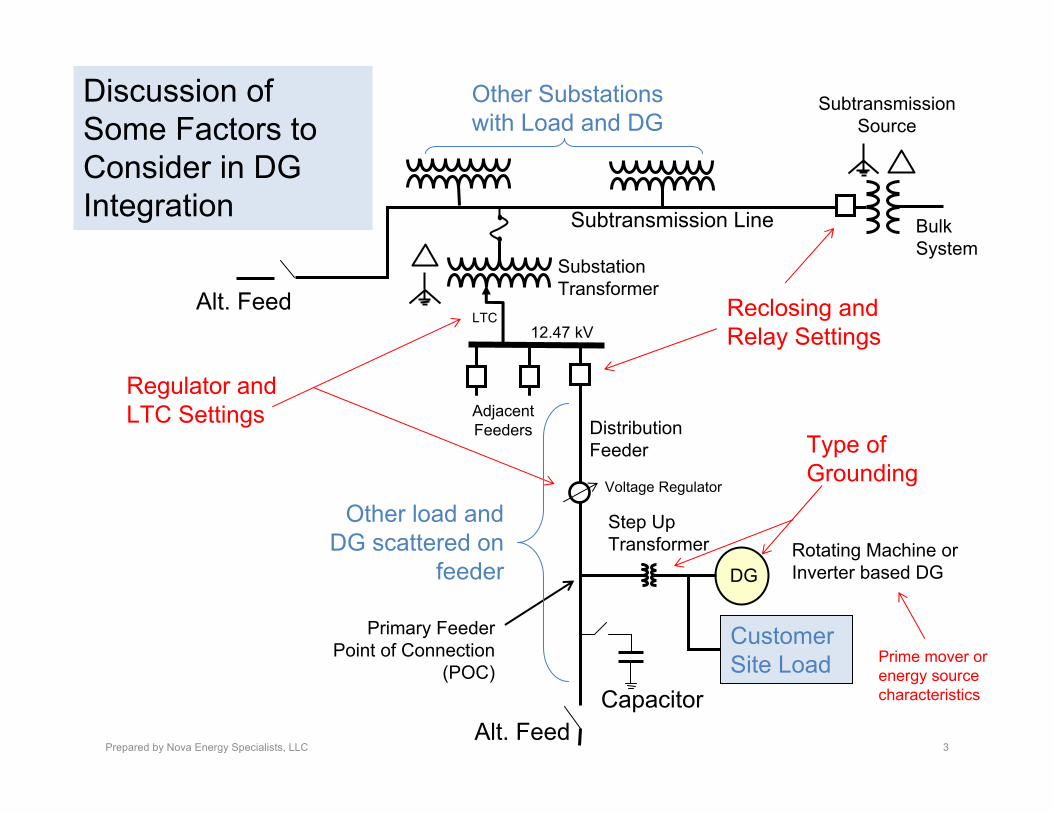
Reclosing and Relay Settings
Primary Feeder Point of Connection
(POC)
Other Substations with Load and DG
Customer Site Load
Adjacent Feeders
Voltage Regulator
Discussion of Some Factors to Consider in DG Integration
Regulator and LTC Settings
CapacitorAlt. Feed
Alt. Feed
Other load and DG scattered on
feeder
Type of Grounding
Prime mover or energy source characteristics
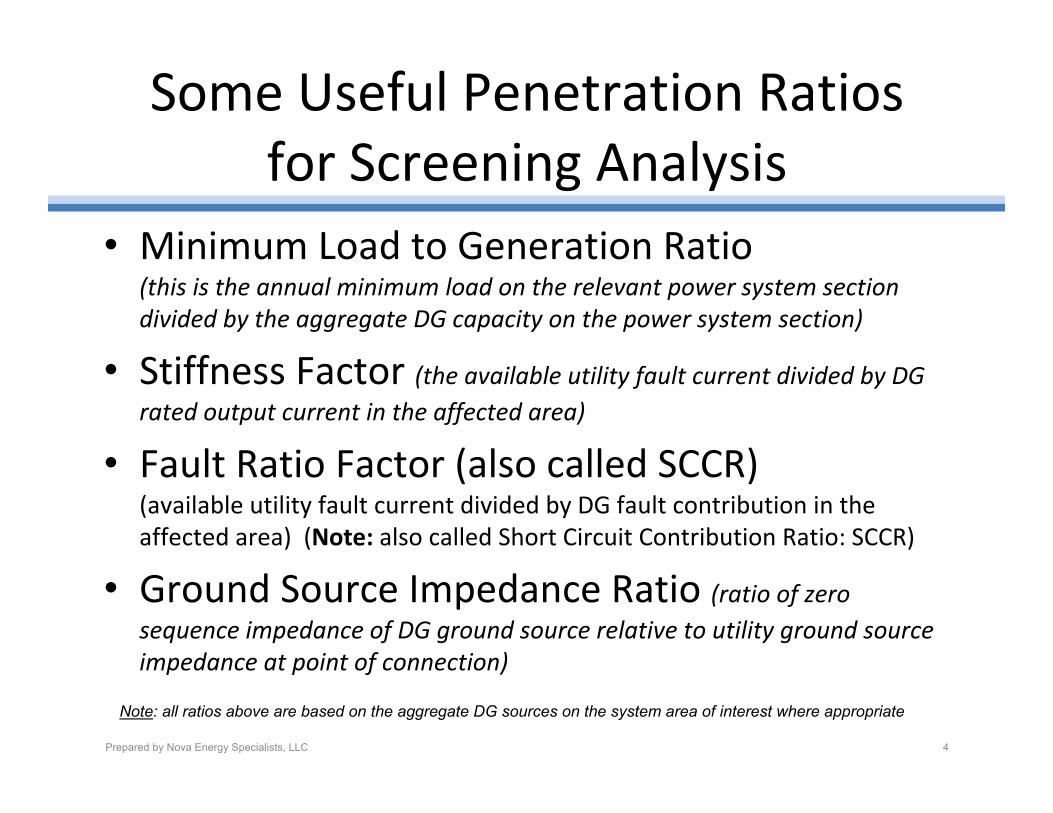
Some Useful Penetration Ratios for Screening Analysis
• Minimum Load to Generation Ratio(this is the annual minimum load on the relevant power system section divided by the aggregate DG capacity on the power system section)
• Stiffness Factor (the available utility fault current divided by DG rated output current in the affected area)
• Fault Ratio Factor (also called SCCR)(available utility fault current divided by DG fault contribution in the affected area) (Note: also called Short Circuit Contribution Ratio: SCCR)
• Ground Source Impedance Ratio (ratio of zero sequence impedance of DG ground source relative to utility ground source impedance at point of connection)
NREL Workshop on High Penetration PV: Defining High Penetration PV – Multiple Definitions and Where to Apply Them Phil Barker, Nova Energy Specialists, LLC
Note: all ratios above are based on the aggregate DG sources on the system area of interest where appropriate
Prepared by Nova Energy Specialists, LLC 4
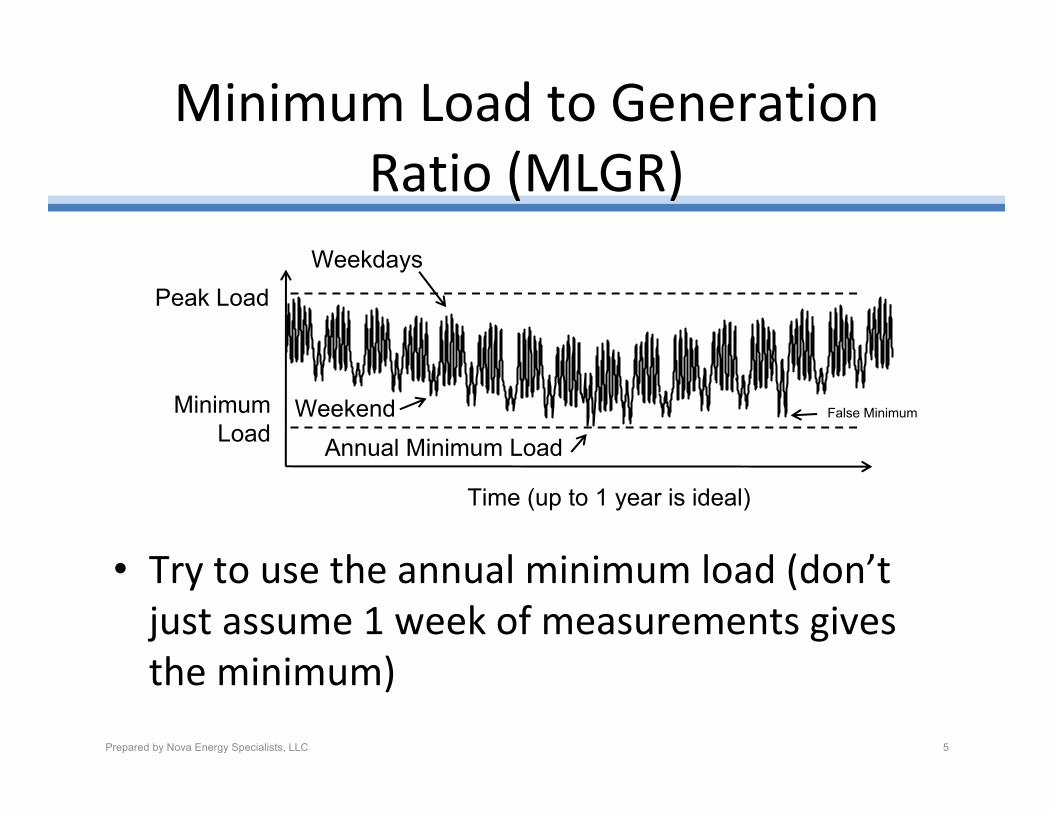
Minimum Load to Generation Ratio (MLGR)
• Try to use the annual minimum load (don’t just assume 1 week of measurements gives the minimum)
Prepared by Nova Energy Specialists, LLC 5
Time (up to 1 year is ideal)
Minimum Load
Peak Load
Weekend
Weekdays
Annual Minimum LoadFalse Minimum
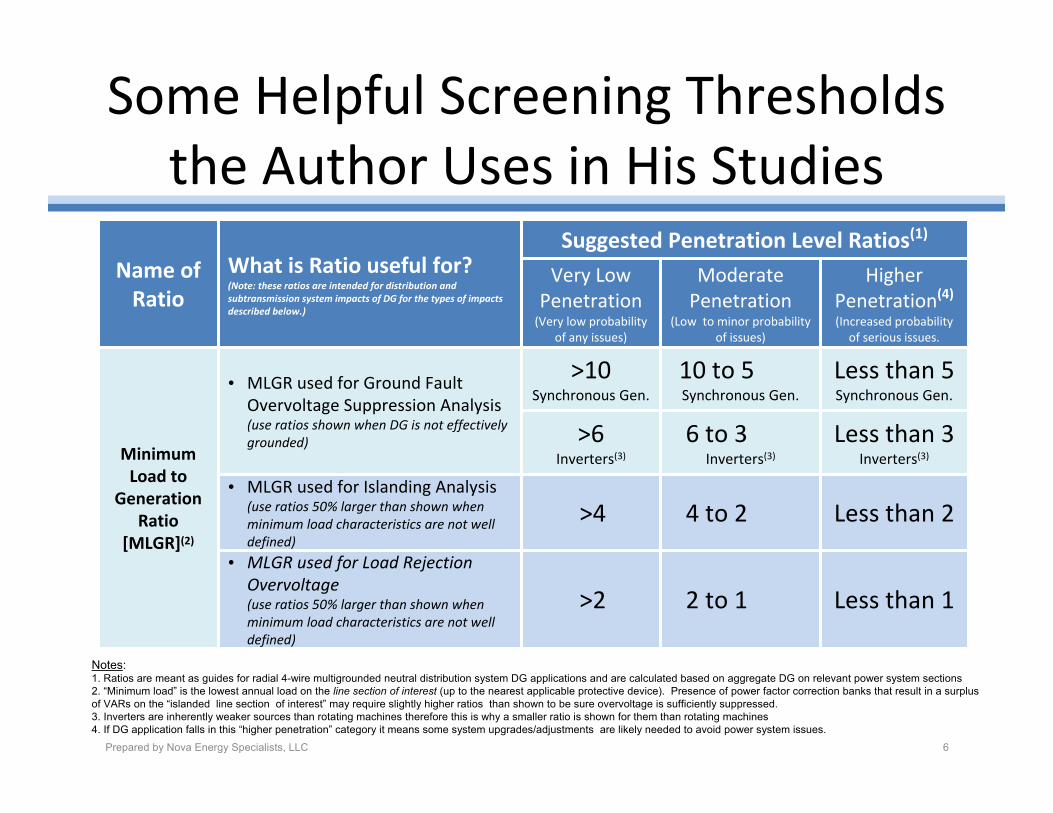
Name of Ratio
What is Ratio useful for?(Note: these ratios are intended for distribution and subtransmission system impacts of DG for the types of impacts described below.)
Suggested Penetration Level Ratios(1)
Very Low Penetration(Very low probability
of any issues)
Moderate Penetration
(Low to minor probability of issues)
Higher Penetration(4)(Increased probability of serious issues.
Minimum Load to
Generation Ratio
[MLGR](2)
• MLGR used for Ground Fault Overvoltage Suppression Analysis (use ratios shown when DG is not effectively grounded)
>10Synchronous Gen.
10 to 5Synchronous Gen.
Less than 5Synchronous Gen.
>6 Inverters(3)
6 to 3Inverters(3)
Less than 3 Inverters(3)
• MLGR used for Islanding Analysis (use ratios 50% larger than shown when minimum load characteristics are not well defined)
>4 4 to 2 Less than 2
• MLGR used for Load Rejection Overvoltage (use ratios 50% larger than shown when minimum load characteristics are not well defined)
>2 2 to 1 Less than 1
Notes: 1. Ratios are meant as guides for radial 4-wire multigrounded neutral distribution system DG applications and are calculated based on aggregate DG on relevant power system sections2. “Minimum load” is the lowest annual load on the line section of interest (up to the nearest applicable protective device). Presence of power factor correction banks that result in a surplus of VARs on the “islanded line section of interest” may require slightly higher ratios than shown to be sure overvoltage is sufficiently suppressed.3. Inverters are inherently weaker sources than rotating machines therefore this is why a smaller ratio is shown for them than rotating machines4. If DG application falls in this “higher penetration” category it means some system upgrades/adjustments are likely needed to avoid power system issues.
NREL Workshop on High Penetration PV: Defining High Penetration PV – Multiple Definitions and Where to Apply Them Phil Barker, Nova Energy Specialists, LLC
Some Helpful Screening Thresholds the Author Uses in His Studies
Prepared by Nova Energy Specialists, LLC 6
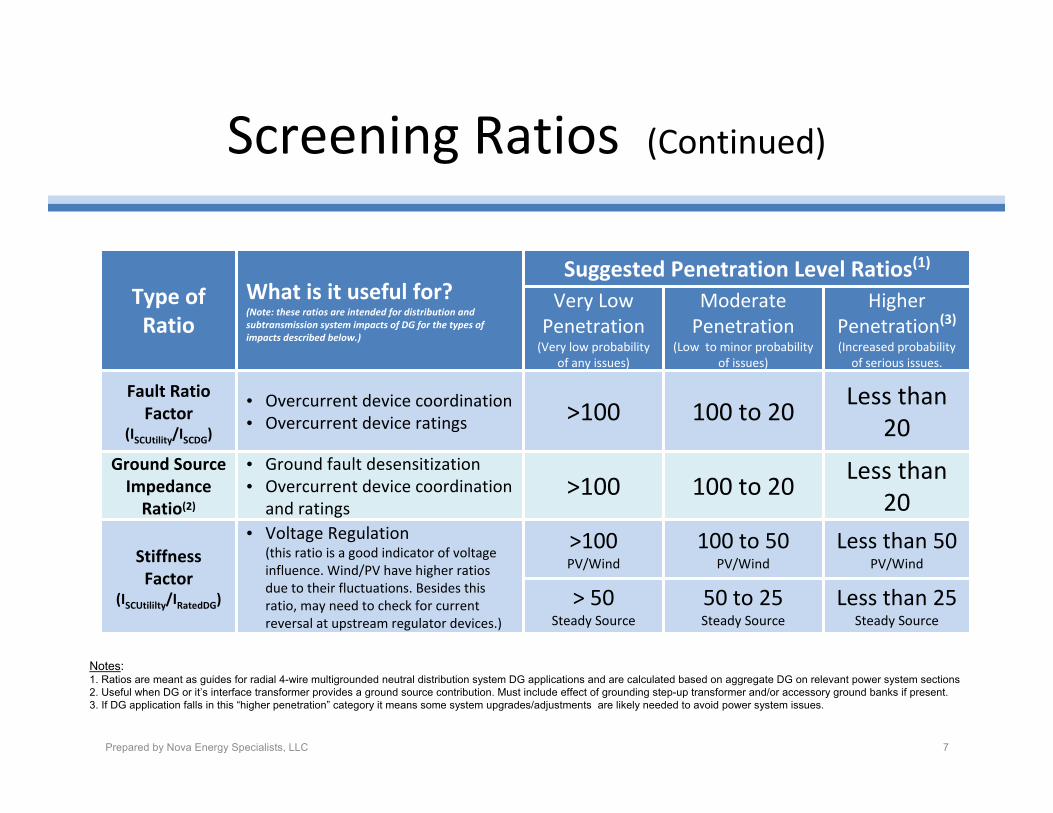
Type of Ratio
What is it useful for?(Note: these ratios are intended for distribution and subtransmission system impacts of DG for the types of impacts described below.)
Suggested Penetration Level Ratios(1)
Very Low Penetration(Very low probability
of any issues)
Moderate Penetration
(Low to minor probability of issues)
Higher Penetration(3)(Increased probability of serious issues.
Fault Ratio Factor
(ISCUtility/ISCDG)
• Overcurrent device coordination• Overcurrent device ratings >100 100 to 20
Less than 20
Ground Source Impedance Ratio(2)
• Ground fault desensitization• Overcurrent device coordination
and ratings>100 100 to 20
Less than 20
Stiffness Factor
(ISCUtililty/IRatedDG)
• Voltage Regulation(this ratio is a good indicator of voltage influence. Wind/PV have higher ratios due to their fluctuations. Besides this ratio, may need to check for current reversal at upstream regulator devices.)
>100 PV/Wind
100 to 50PV/Wind
Less than 50 PV/Wind
> 50 Steady Source
50 to 25Steady Source
Less than 25 Steady Source
Notes: 1. Ratios are meant as guides for radial 4-wire multigrounded neutral distribution system DG applications and are calculated based on aggregate DG on relevant power system sections2. Useful when DG or it’s interface transformer provides a ground source contribution. Must include effect of grounding step-up transformer and/or accessory ground banks if present.3. If DG application falls in this “higher penetration” category it means some system upgrades/adjustments are likely needed to avoid power system issues.
NREL Workshop on High Penetration PV: Defining High Penetration PV – Multiple Definitions and Where to Apply Them Phil Barker, Nova Energy Specialists, LLC
Screening Ratios (Continued)
Prepared by Nova Energy Specialists, LLC 7
NREL Workshop on High Penetration PV: Defining High Penetration PV – Multiple Definitions and Where to Apply Them Phil Barker, Nova Energy Specialists, LLC
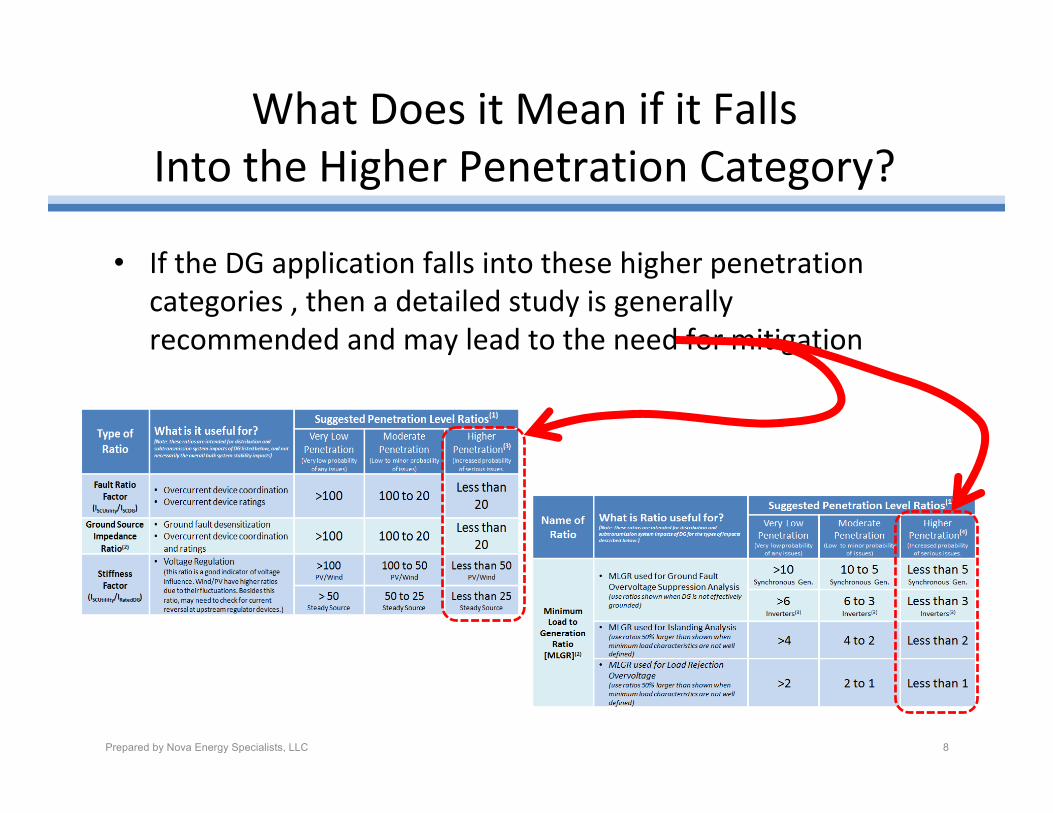
What Does it Mean if it Falls Into the Higher Penetration Category?
• If the DG application falls into these higher penetration categories , then a detailed study is generally recommended and may lead to the need for mitigation
Prepared by Nova Energy Specialists, LLC 8
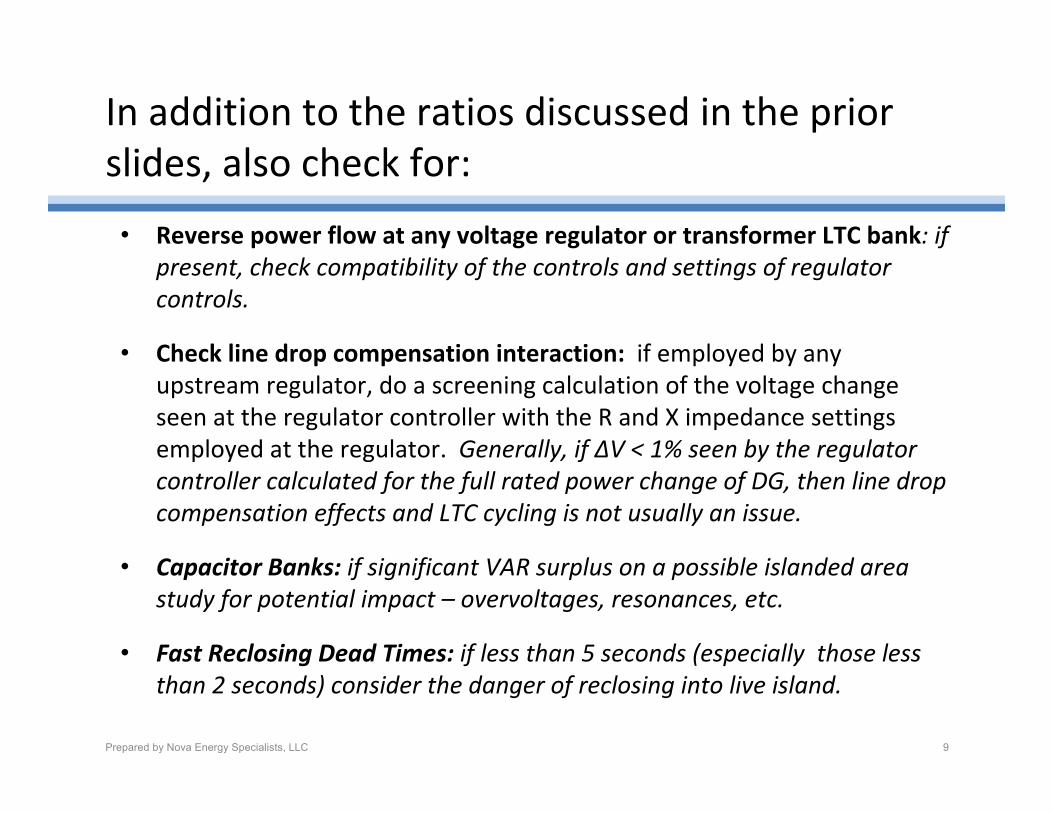
In addition to the ratios discussed in the prior slides, also check for:
• Reverse power flow at any voltage regulator or transformer LTC bank: if present, check compatibility of the controls and settings of regulator controls.
• Check line drop compensation interaction: if employed by any upstream regulator, do a screening calculation of the voltage change seen at the regulator controller with the R and X impedance settings employed at the regulator. Generally, if ΔV < 1% seen by the regulator controller calculated for the full rated power change of DG, then line drop compensation effects and LTC cycling is not usually an issue.
• Capacitor Banks: if significant VAR surplus on a possible islanded area study for potential impact – overvoltages, resonances, etc.
• Fast Reclosing Dead Times: if less than 5 seconds (especially those less than 2 seconds) consider the danger of reclosing into live island.
Prepared by Nova Energy Specialists, LLC 9
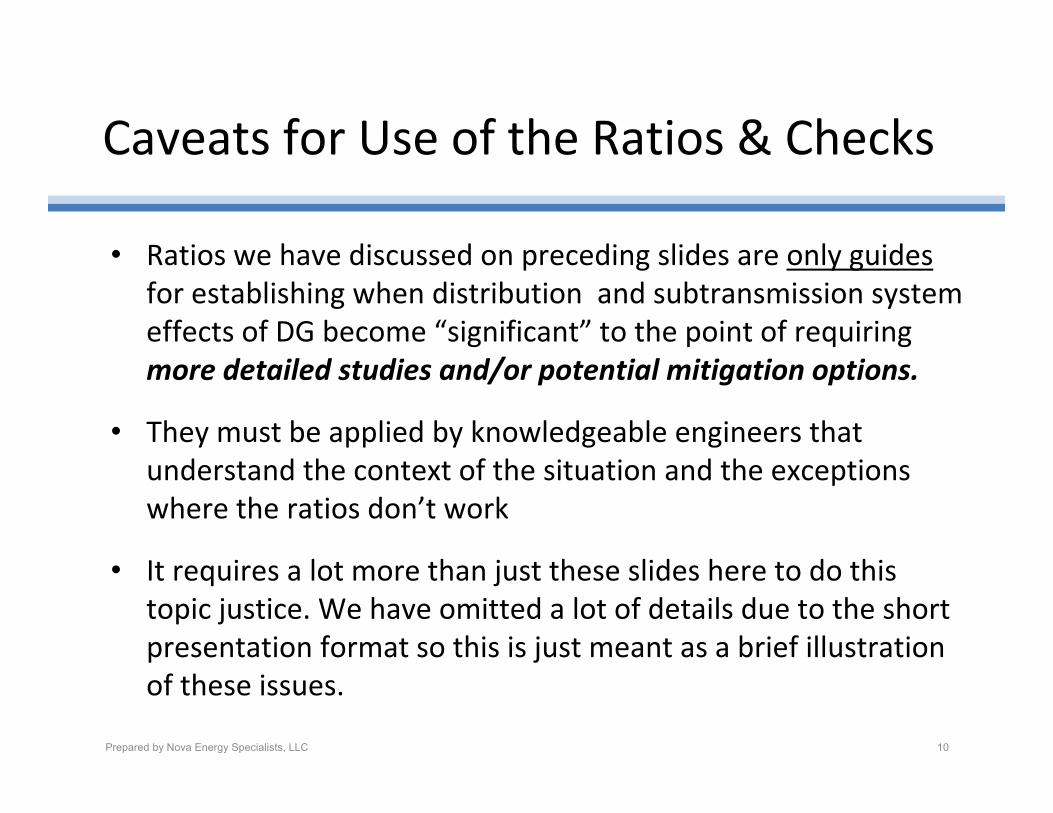
Caveats for Use of the Ratios & Checks
• Ratios we have discussed on preceding slides are only guides for establishing when distribution and subtransmission system effects of DG become “significant” to the point of requiring more detailed studies and/or potential mitigation options.
• They must be applied by knowledgeable engineers that understand the context of the situation and the exceptions where the ratios don’t work
• It requires a lot more than just these slides here to do this topic justice. We have omitted a lot of details due to the shortpresentation format so this is just meant as a brief illustration of these issues.
NREL Workshop on High Penetration PV: Defining High Penetration PV – Multiple Definitions and Where to Apply Them Phil Barker, Nova Energy Specialists, LLCPrepared by Nova Energy Specialists, LLC 10
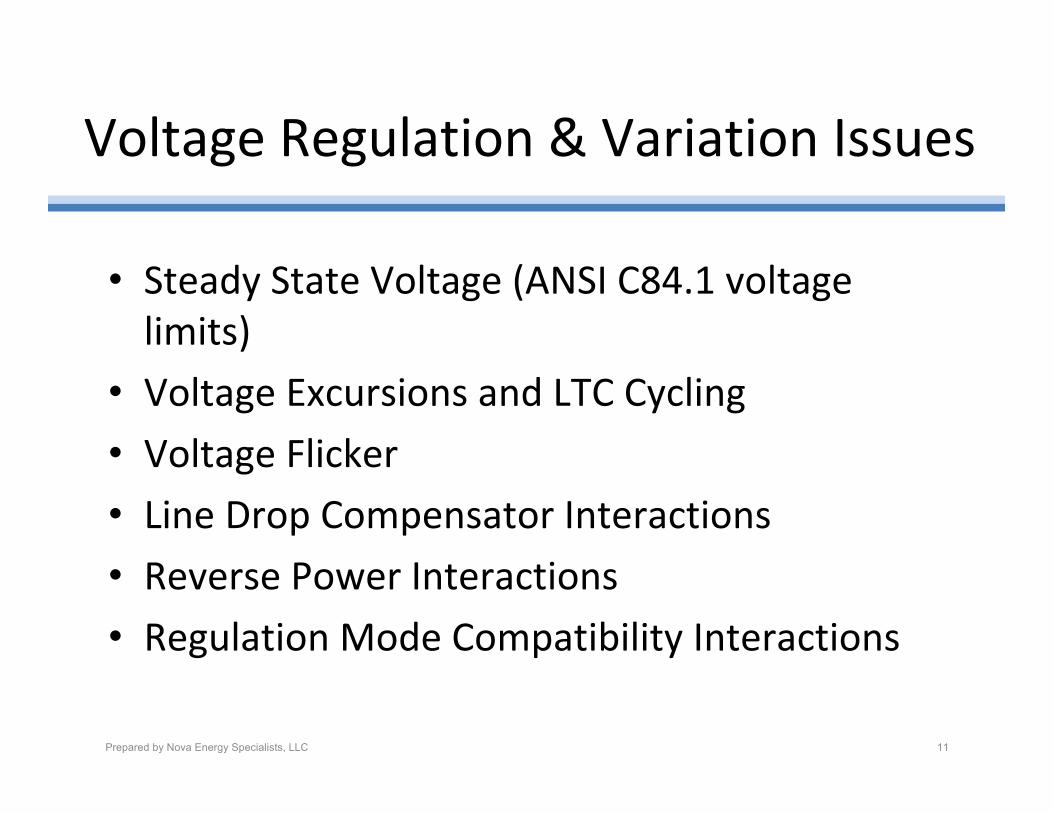
Voltage Regulation & Variation Issues
• Steady State Voltage (ANSI C84.1 voltage limits)
• Voltage Excursions and LTC Cycling
• Voltage Flicker
• Line Drop Compensator Interactions
• Reverse Power Interactions
• Regulation Mode Compatibility Interactions
Prepared by Nova Energy Specialists, LLC 11
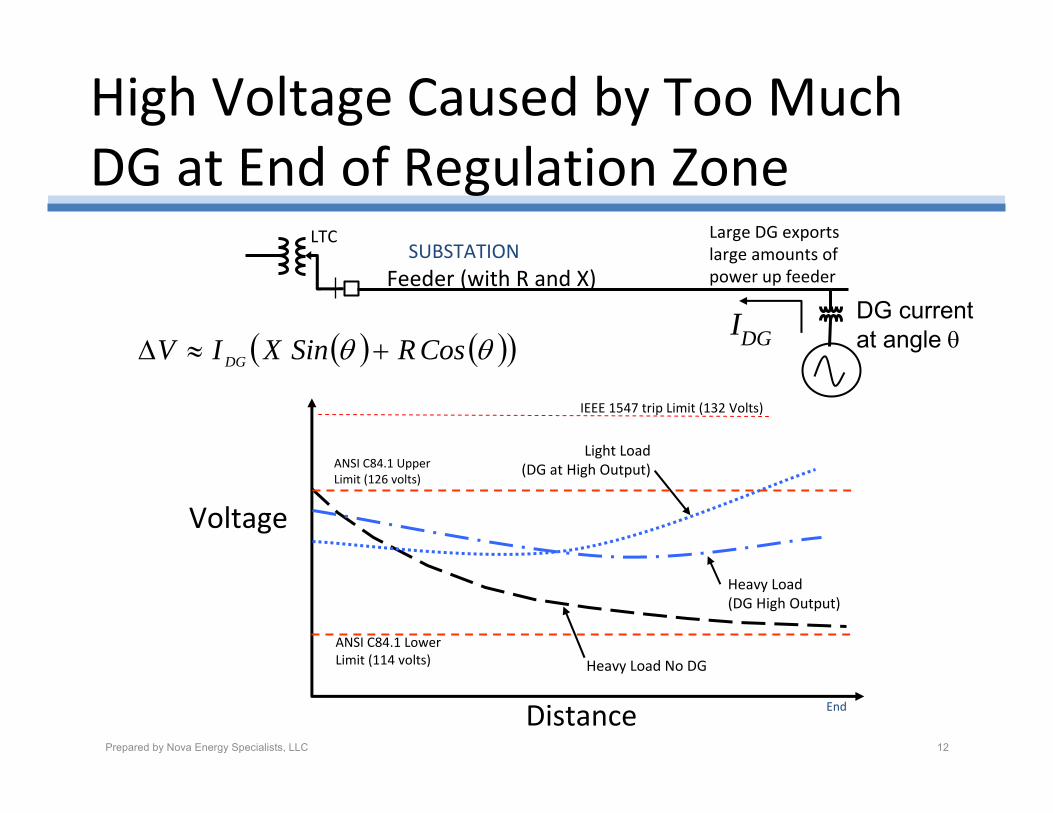
High Voltage Caused by Too Much DG at End of Regulation Zone
SUBSTATION
Voltage
Distance
Heavy Load No DG
Heavy Load(DG High Output)
End
ANSI C84.1 Lower Limit (114 volts)
Light Load (DG at High Output)ANSI C84.1 Upper
Limit (126 volts)
( ) ( )( )θθ CosRSinXIV DG +≈Δ
LTC Large DG exports large amounts of power up feeder
IDG
Feeder (with R and X)
IEEE 1547 trip Limit (132 Volts)
Prepared by Nova Energy Specialists, LLC 12
DG current at angle θ
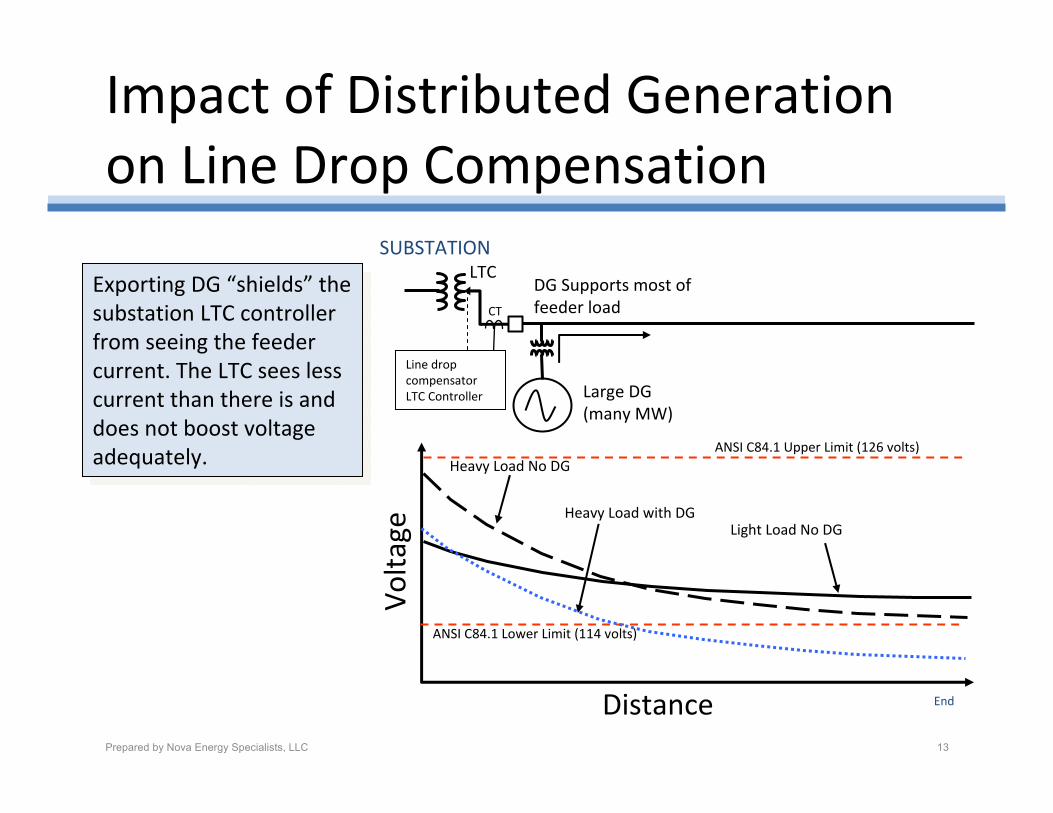
Impact of Distributed Generation on Line Drop Compensation
Volta
ge
Distance
Heavy Load No DG
Heavy Load with DG
End
ANSI C84.1 Lower Limit (114 volts)
Light Load No DG
SUBSTATIONLTC
Large DG (many MW)
DG Supports most of feeder load
Exporting DG “shields” the substation LTC controller from seeing the feeder current. The LTC sees less current than there is and does not boost voltage adequately.
Exporting DG “shields” the substation LTC controller from seeing the feeder current. The LTC sees less current than there is and does not boost voltage adequately.
CT
Line drop compensator LTC Controller
Prepared by Nova Energy Specialists, LLC 13
ANSI C84.1 Upper Limit (126 volts)
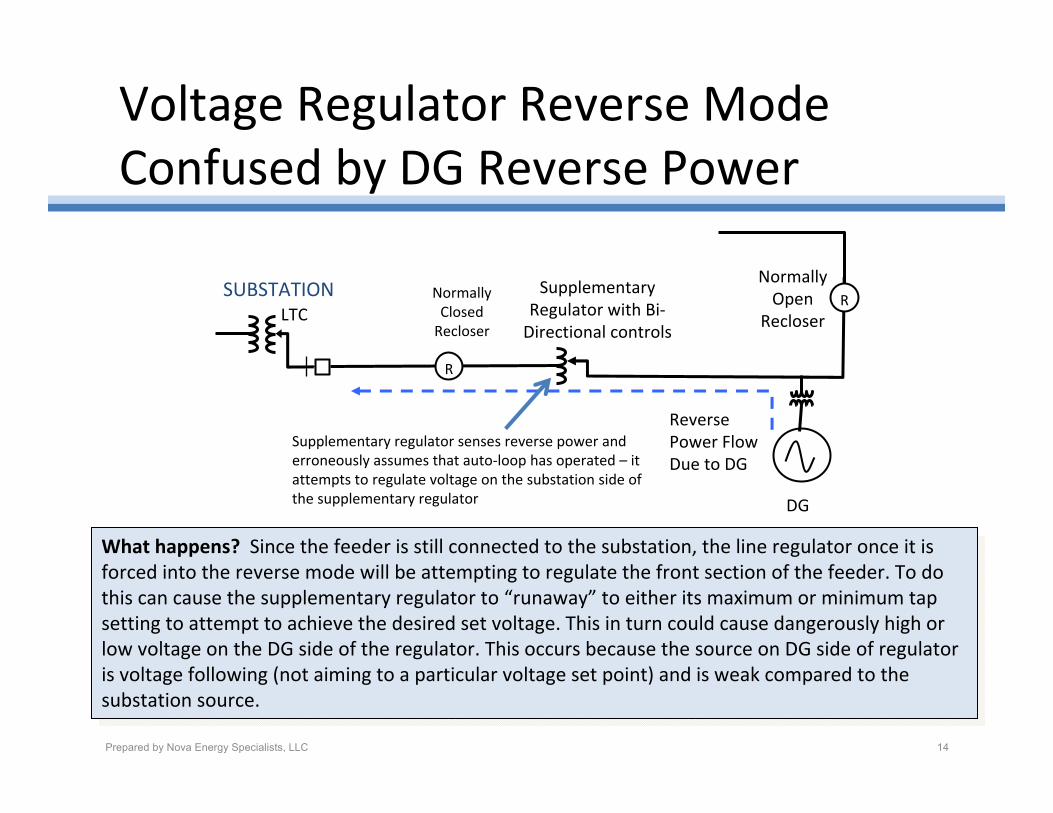
Voltage Regulator Reverse Mode Confused by DG Reverse Power
SUBSTATIONLTC
Reverse Power Flow Due to DG
Supplementary Regulator with Bi‐Directional controls
Normally Closed Recloser
R
R
Normally Open
Recloser
DG
Supplementary regulator senses reverse power and erroneously assumes that auto‐loop has operated – it attempts to regulate voltage on the substation side of the supplementary regulator
What happens? Since the feeder is still connected to the substation, the line regulator once it is forced into the reverse mode will be attempting to regulate the front section of the feeder. To do this can cause the supplementary regulator to “runaway” to either its maximum or minimum tap setting to attempt to achieve the desired set voltage. This in turn could cause dangerously high or low voltage on the DG side of the regulator. This occurs because the source on DG side of regulator is voltage following (not aiming to a particular voltage set point) and is weak compared to the substation source.
What happens? Since the feeder is still connected to the substation, the line regulator once it is forced into the reverse mode will be attempting to regulate the front section of the feeder. To do this can cause the supplementary regulator to “runaway” to either its maximum or minimum tap setting to attempt to achieve the desired set voltage. This in turn could cause dangerously high or low voltage on the DG side of the regulator. This occurs because the source on DG side of regulator is voltage following (not aiming to a particular voltage set point) and is weak compared to the substation source.
Prepared by Nova Energy Specialists, LLC 14
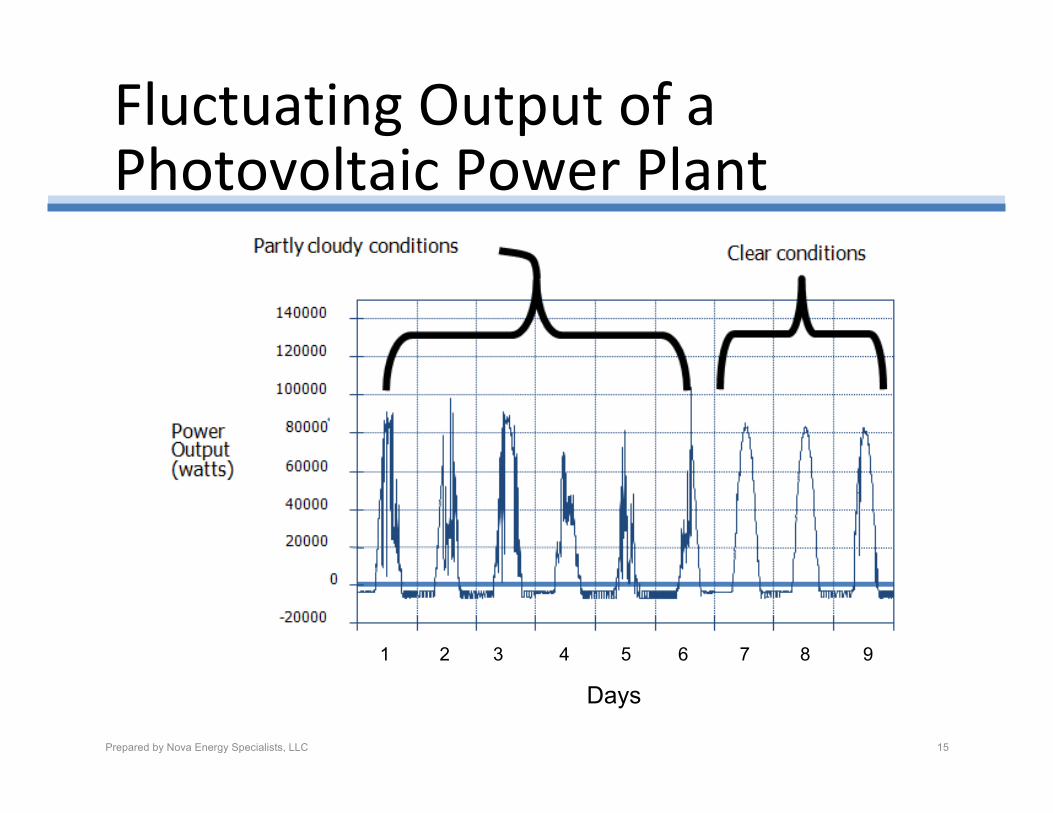
Fluctuating Output of a Photovoltaic Power Plant
Prepared by Nova Energy Specialists, LLC 15
1 2 3 4 5 6 7 8 9
Days
( ) ( )( )θθ CosRSinXIV DG +Δ≈Δ
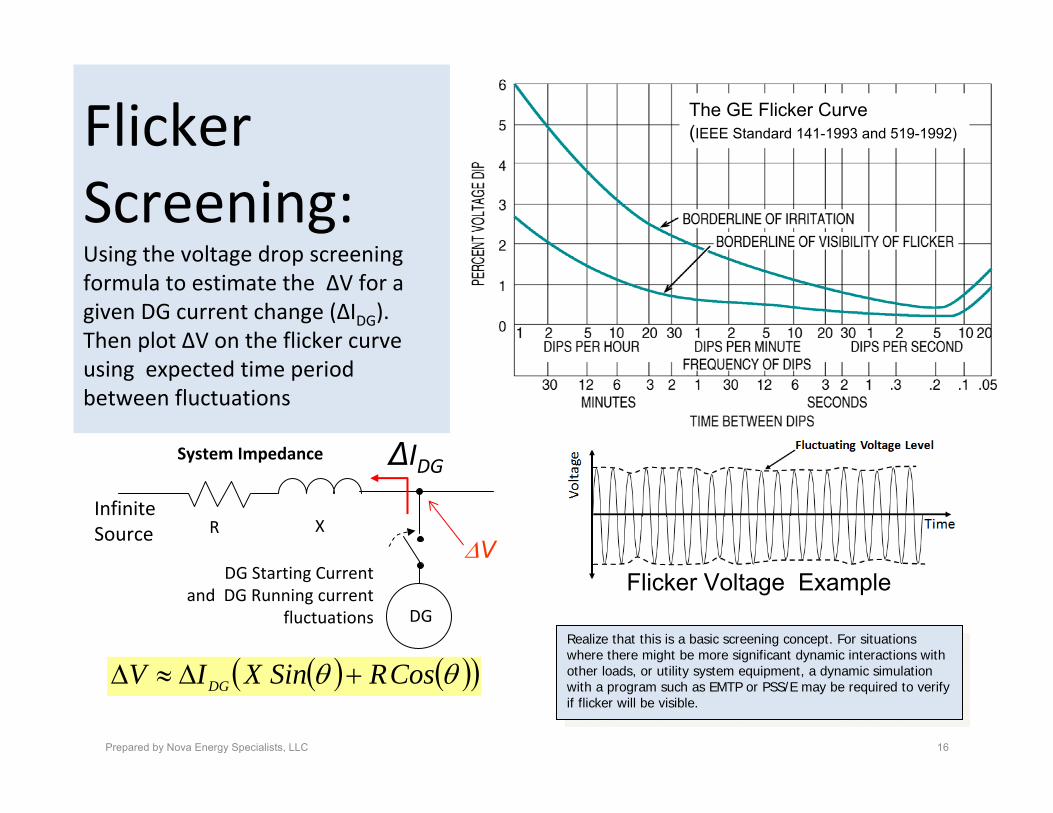
System Impedance
DG Starting Current and DG Running current
fluctuations DG
ΔIDGInfinite Source R X
ΔVFlicker Voltage Example
The GE Flicker Curve(IEEE Standard 141-1993 and 519-1992)Flicker
Screening: Using the voltage drop screening formula to estimate the ΔV for a given DG current change (ΔIDG). Then plot ΔV on the flicker curve using expected time period between fluctuations
Realize that this is a basic screening concept. For situations where there might be more significant dynamic interactions with other loads, or utility system equipment, a dynamic simulation with a program such as EMTP or PSS/E may be required to verify if flicker will be visible.
Realize that this is a basic screening concept. For situations where there might be more significant dynamic interactions with other loads, or utility system equipment, a dynamic simulation with a program such as EMTP or PSS/E may be required to verify if flicker will be visible.
Prepared by Nova Energy Specialists, LLC 16
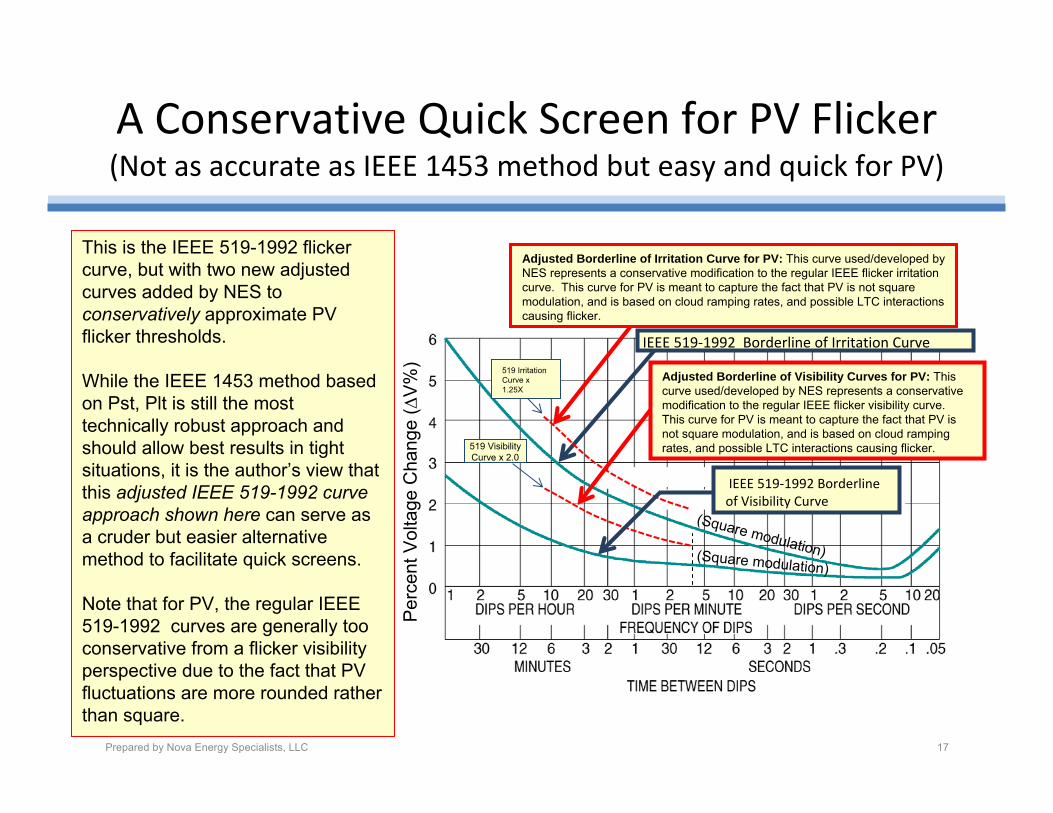
A Conservative Quick Screen for PV Flicker(Not as accurate as IEEE 1453 method but easy and quick for PV)
Prepared by Nova Energy Specialists, LLC 17
Per
cent
Vol
tage
Cha
nge
(ΔV
%)
(Square modulation)(Square modulation)
Adjusted Borderline of Visibility Curves for PV: This curve used/developed by NES represents a conservative modification to the regular IEEE flicker visibility curve. This curve for PV is meant to capture the fact that PV is not square modulation, and is based on cloud ramping rates, and possible LTC interactions causing flicker.
IEEE 519‐1992 Borderline of Irritation Curve
519 Visibility Curve x 2.0
519 Irritation Curve x 1.25X
Adjusted Borderline of Irritation Curve for PV: This curve used/developed by NES represents a conservative modification to the regular IEEE flicker irritation curve. This curve for PV is meant to capture the fact that PV is not square modulation, and is based on cloud ramping rates, and possible LTC interactions causing flicker.
IEEE 519‐1992 Borderline of Visibility Curve
This is the IEEE 519-1992 flicker curve, but with two new adjusted curves added by NES to conservatively approximate PV flicker thresholds.
While the IEEE 1453 method based on Pst, Plt is still the most technically robust approach and should allow best results in tight situations, it is the author’s view that this adjusted IEEE 519-1992 curve approach shown here can serve as a cruder but easier alternative method to facilitate quick screens.
Note that for PV, the regular IEEE 519-1992 curves are generally too conservative from a flicker visibility perspective due to the fact that PV fluctuations are more rounded rather than square.
PV Flicker Experiences
• Use of IEEE 1453 method is a technically very robust screening methodology for flicker when very accurate threshold levels need to be determined
• However, a suggested modified GE flicker curve can work well for PV as a conservative tool for simple screening when less accuracy is required
• It is the author’s experience that other voltage problems (LTC cycling, ANSI limits, etc.) related to PV become problematic at lower capacity thresholds than flicker – flicker is one of the last concerns to arise
Prepared by Nova Energy Specialists, LLC 18
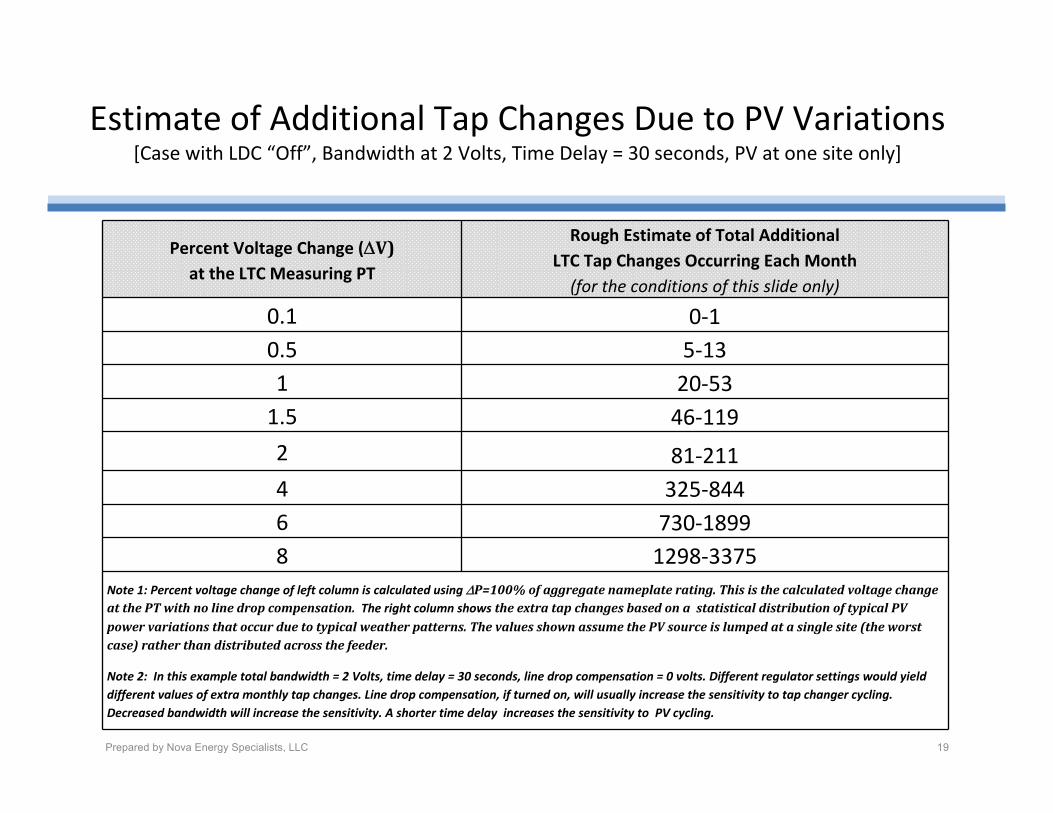
Estimate of Additional Tap Changes Due to PV Variations [Case with LDC “Off”, Bandwidth at 2 Volts, Time Delay = 30 seconds, PV at one site only]
Prepared by Nova Energy Specialists, LLC 19
Percent Voltage Change (ΔV)at the LTC Measuring PT
Rough Estimate of Total Additional LTC Tap Changes Occurring Each Month(for the conditions of this slide only)
0.1 0‐10.5 5‐131 20‐531.5 46‐119
2 81‐2114 325‐8446 730‐18998 1298‐3375
Note 1: Percent voltage change of left column is calculated using ΔP=100% of aggregate nameplate rating. This is the calculated voltage change at the PT with no line drop compensation. The right column shows the extra tap changes based on a statistical distribution of typical PV power variations that occur due to typical weather patterns. The values shown assume the PV source is lumped at a single site (the worst case) rather than distributed across the feeder.
Note 2: In this example total bandwidth = 2 Volts, time delay = 30 seconds, line drop compensation = 0 volts. Different regulator settings would yield different values of extra monthly tap changes. Line drop compensation, if turned on, will usually increase the sensitivity to tap changer cycling. Decreased bandwidth will increase the sensitivity. A shorter time delay increases the sensitivity to PV cycling.
Some DG Fault Current Issues
• Impact of current on breaker, fuse, recloser, coordination. Affect on directional devices and impedance sensing devices.
• Increase in fault levels (interrupting capacity of breakers on the utility system)
• Nuisance trips due to “backfeed” fault current
• Distribution transformer rupture issues
• Impact on temporary fault clearing/deionization
Prepared by Nova Energy Specialists, LLC 20
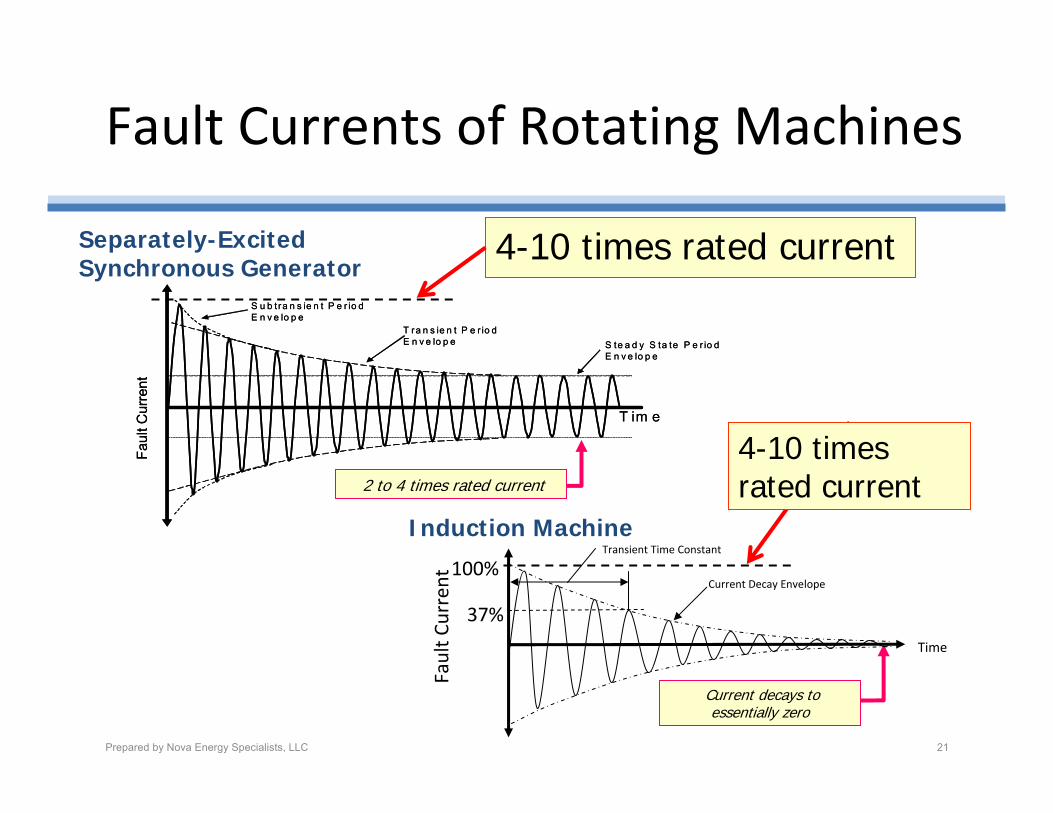
Fault Currents of Rotating Machines
Separately-Excited Synchronous Generator
2 to 4 times rated current
Faul
t Cur
rent
T im e
S u b tra n s ie n t P e r io d E n v e lo p e
T ra n s ie n t P e r io d E n v e lo p e S te a d y S ta te P e r io d
E n v e lo p e
Faul
t Cur
rent
T im e
S u b tra n s ie n t P e r io d E n v e lo p e
T ra n s ie n t P e r io d E n v e lo p e S te a d y S ta te P e r io d
E n v e lo p e
4-10 times rated current
Induction Machine
Current decays to essentially zero
Current Decay Envelope
37%
Transient Time Constant
Time
100%
Fault C
urrent
4-10 times rated current
Prepared by Nova Energy Specialists, LLC 21
Pre-fault Inverter Fault Currenti
t
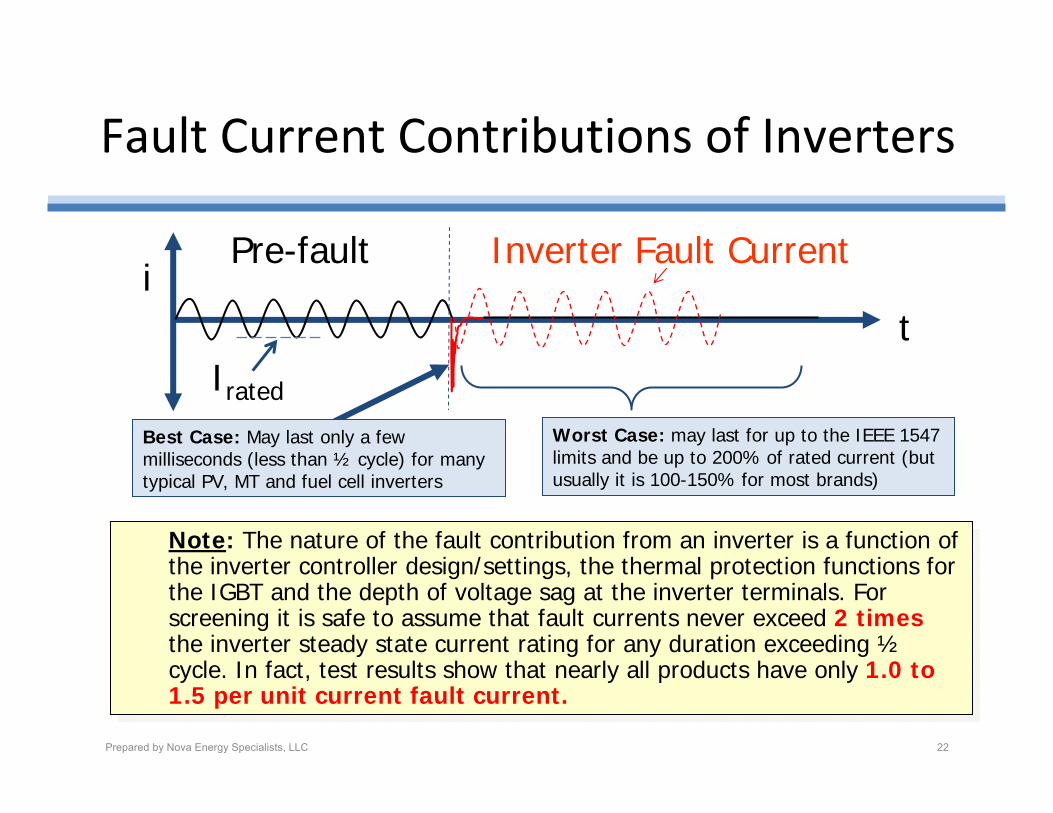
Fault Current Contributions of Inverters
Note: The nature of the fault contribution from an inverter is a function of the inverter controller design/settings, the thermal protection functions for the IGBT and the depth of voltage sag at the inverter terminals. For screening it is safe to assume that fault currents never exceed 2 times the inverter steady state current rating for any duration exceeding ½cycle. In fact, test results show that nearly all products have only 1.0 to 1.5 per unit current fault current.
Note: The nature of the fault contribution from an inverter is a function of the inverter controller design/settings, the thermal protection functions for the IGBT and the depth of voltage sag at the inverter terminals. For screening it is safe to assume that fault currents never exceed 2 times the inverter steady state current rating for any duration exceeding ½cycle. In fact, test results show that nearly all products have only 1.0 to 1.5 per unit current fault current.
Best Case: May last only a few milliseconds (less than ½ cycle) for many typical PV, MT and fuel cell inverters
Worst Case: may last for up to the IEEE 1547 limits and be up to 200% of rated current (but usually it is 100-150% for most brands)
Irated
Prepared by Nova Energy Specialists, LLC 22
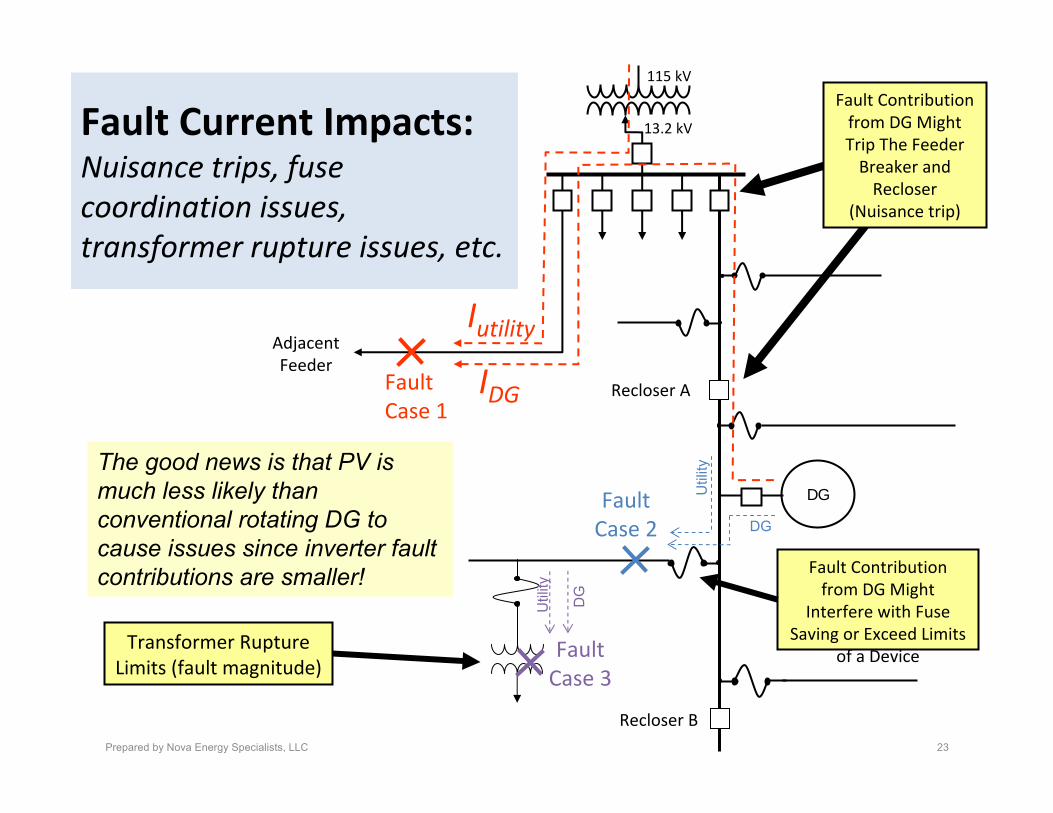
Fault Current Impacts: Nuisance trips, fuse coordination issues, transformer rupture issues, etc.
Recloser B
13.2 kV
115 kV
Recloser A
DG
Adjacent Feeder
Fault Case 1
Fault Contribution from DG Might Trip The Feeder Breaker and Recloser
(Nuisance trip)
Iutility
IDG
Prepared by Nova Energy Specialists, LLC 23
Fault Case 2
Util
ity
DGU
tility
DG
Fault Case 3
The good news is that PV is much less likely than conventional rotating DG to cause issues since inverter fault contributions are smaller! Fault Contribution
from DG Might Interfere with Fuse
Saving or Exceed Limits of a Device
Transformer Rupture Limits (fault magnitude)
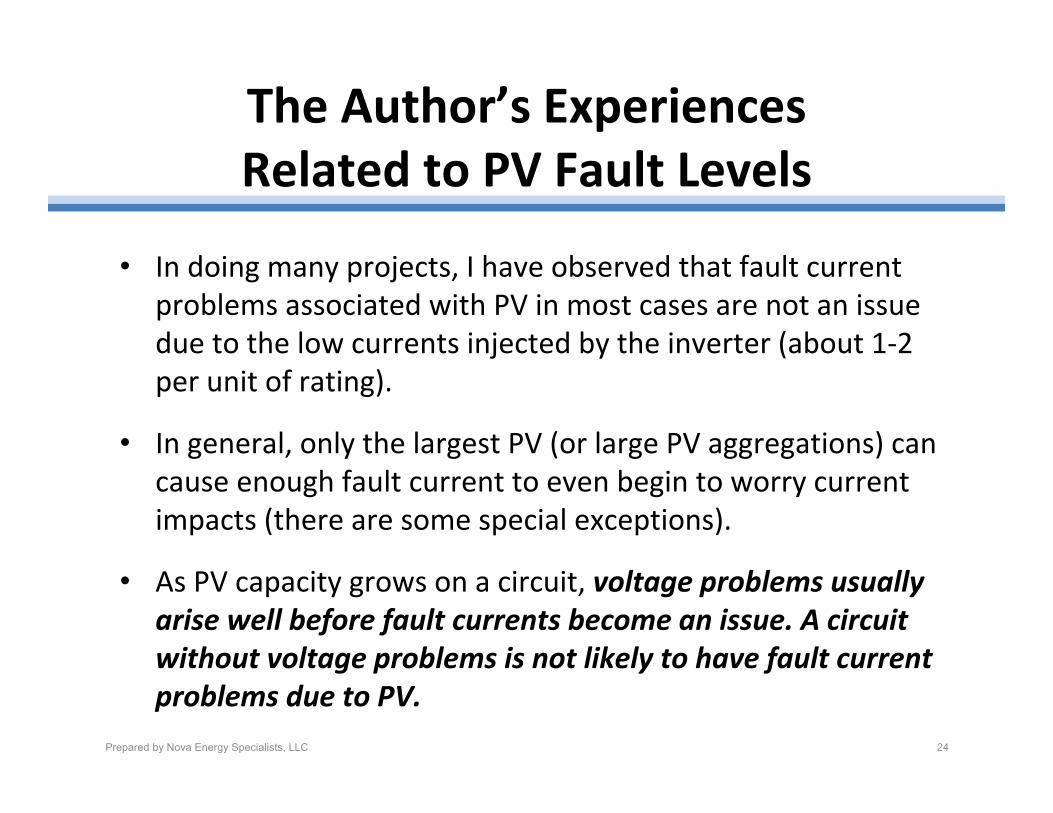
The Author’s Experiences Related to PV Fault Levels
• In doing many projects, I have observed that fault current problems associated with PV in most cases are not an issue due to the low currents injected by the inverter (about 1‐2 per unit of rating).
• In general, only the largest PV (or large PV aggregations) can cause enough fault current to even begin to worry current impacts (there are some special exceptions).
• As PV capacity grows on a circuit, voltage problems usually arise well before fault currents become an issue. A circuit without voltage problems is not likely to have fault current problems due to PV.
Prepared by Nova Energy Specialists, LLC 24
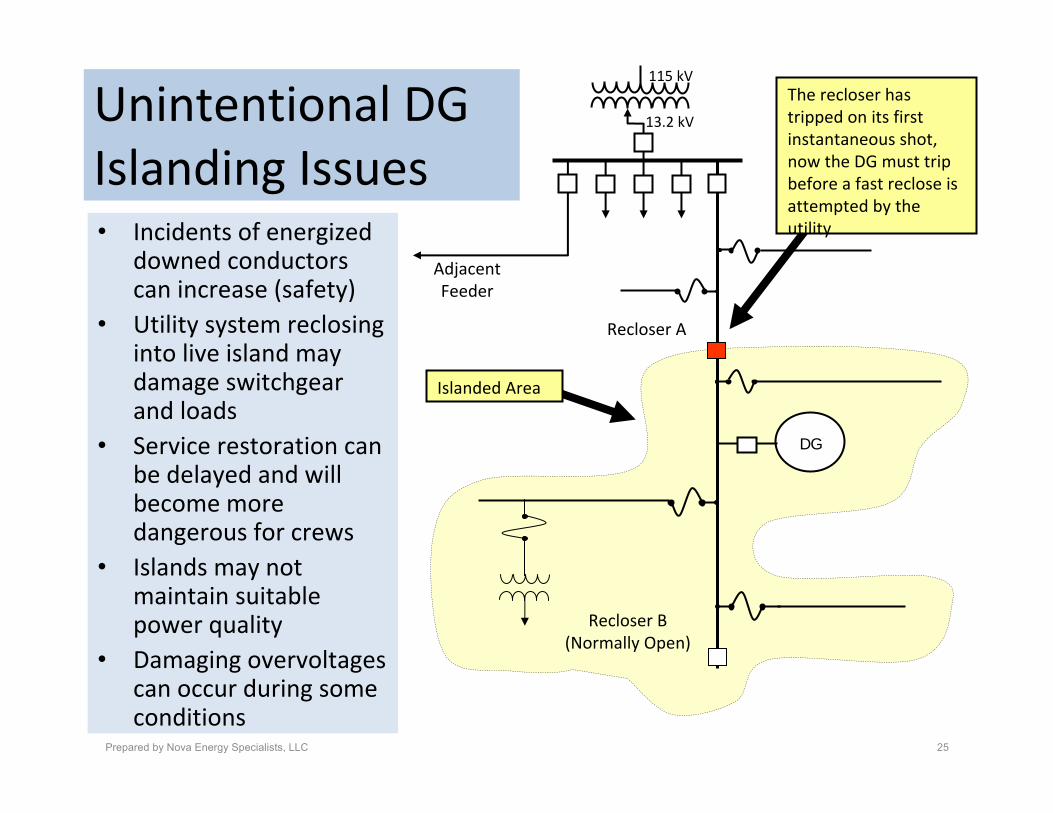
Unintentional DG Islanding Issues
Recloser B(Normally Open)
13.2 kV
115 kV
Recloser A
DG
Adjacent Feeder
The recloser has tripped on its first instantaneous shot, now the DG must trip before a fast reclose is attempted by the utility
Islanded Area
• Incidents of energized downed conductors can increase (safety)
• Utility system reclosing into live island may damage switchgear and loads
• Service restoration can be delayed and will become more dangerous for crews
• Islands may not maintain suitable power quality
• Damaging overvoltages can occur during some conditions
Prepared by Nova Energy Specialists, LLC 25
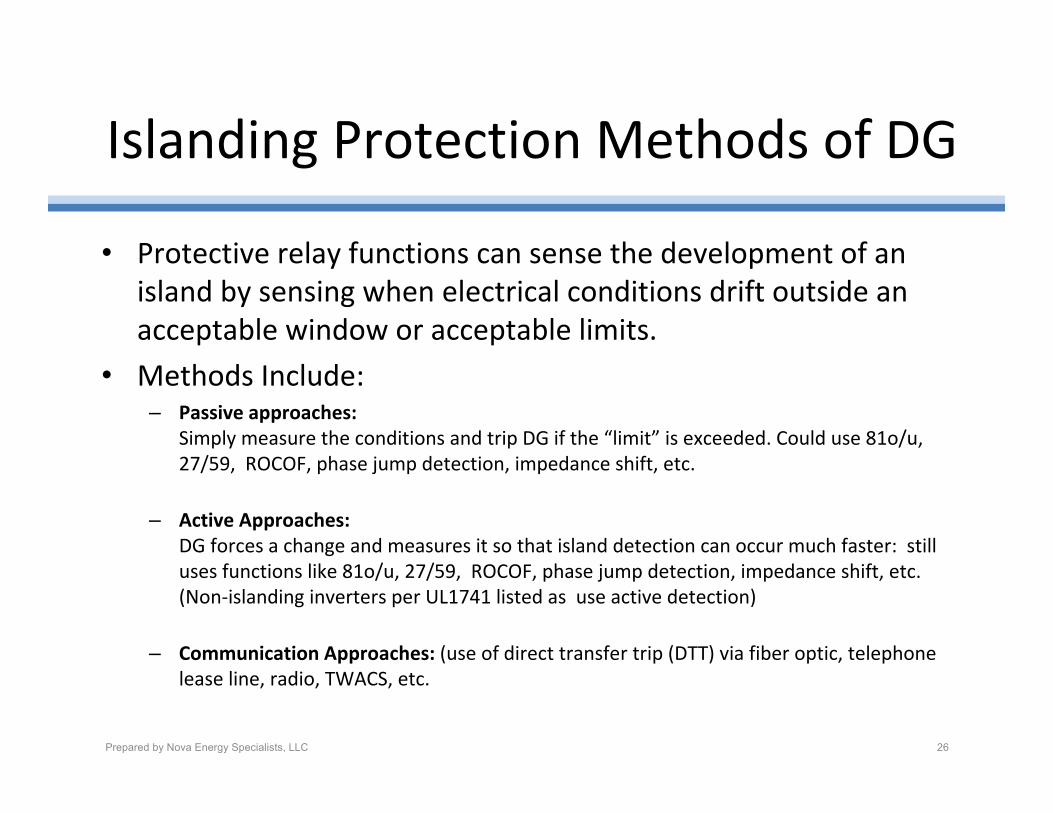
Islanding Protection Methods of DG
Prepared by Nova Energy Specialists, LLC 26
• Protective relay functions can sense the development of an island by sensing when electrical conditions drift outside an acceptable window or acceptable limits.
• Methods Include:– Passive approaches:
Simply measure the conditions and trip DG if the “limit” is exceeded. Could use 81o/u, 27/59, ROCOF, phase jump detection, impedance shift, etc.
– Active Approaches: DG forces a change and measures it so that island detection can occur much faster: still uses functions like 81o/u, 27/59, ROCOF, phase jump detection, impedance shift, etc. (Non‐islanding inverters per UL1741 listed as use active detection)
– Communication Approaches: (use of direct transfer trip (DTT) via fiber optic, telephone lease line, radio, TWACS, etc.
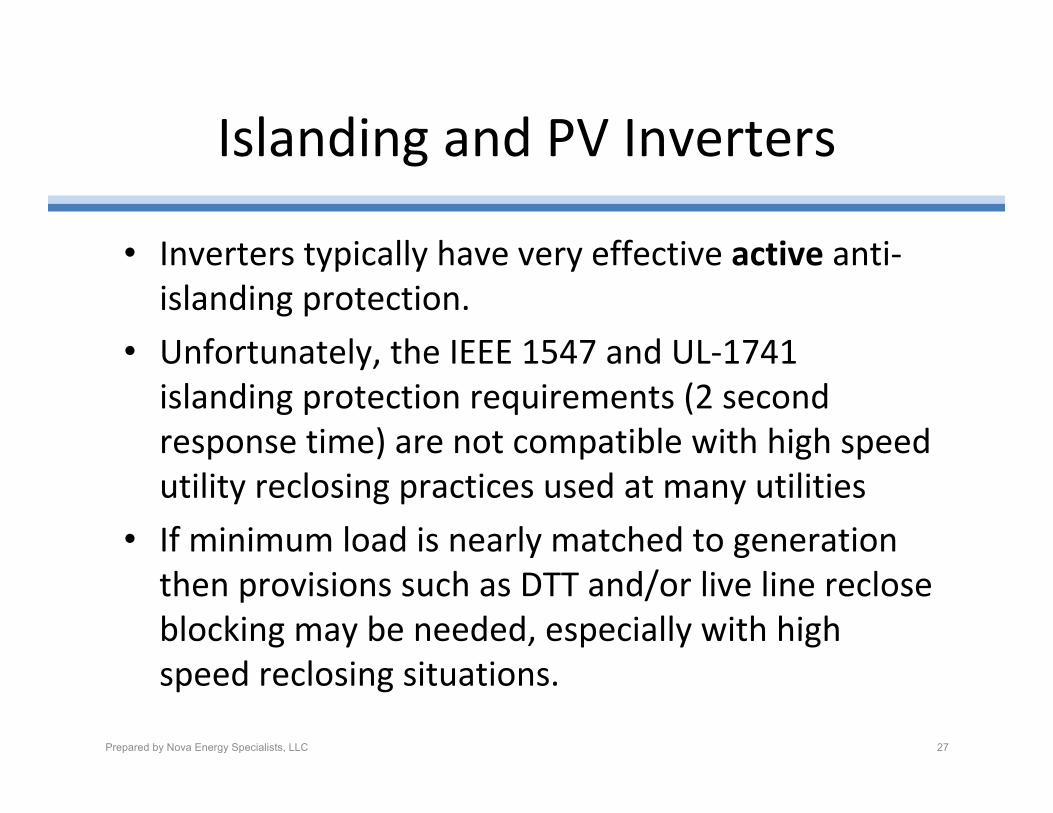
Islanding and PV Inverters
• Inverters typically have very effective active anti‐islanding protection.
• Unfortunately, the IEEE 1547 and UL‐1741 islanding protection requirements (2 second response time) are not compatible with high speed utility reclosing practices used at many utilities
• If minimum load is nearly matched to generation then provisions such as DTT and/or live line reclose blocking may be needed, especially with high speed reclosing situations.
Prepared by Nova Energy Specialists, LLC 27
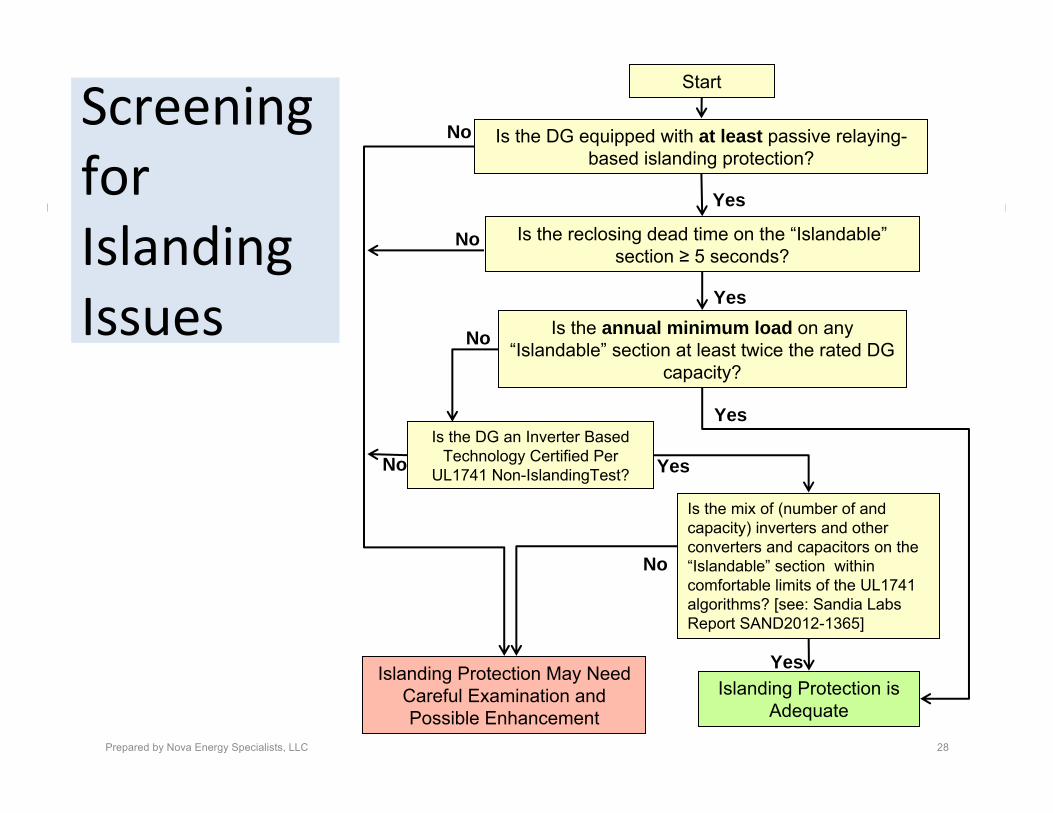
Screeningfor Islanding Issues
Prepared by Nova Energy Specialists, LLC 28
Start
Is the annual minimum load on any “Islandable” section at least twice the rated DG
capacity?
Is the DG an Inverter Based Technology Certified Per
UL1741 Non-IslandingTest?
Islanding Protection May Need Careful Examination and Possible Enhancement
Islanding Protection is Adequate
Yes
No
Yes
Yes
No
No Is the reclosing dead time on the “Islandable”section ≥ 5 seconds?
Is the DG equipped with at least passive relaying-based islanding protection?
No
Is the mix of (number of and capacity) inverters and other converters and capacitors on the “Islandable” section within comfortable limits of the UL1741 algorithms? [see: Sandia Labs Report SAND2012-1365]
No
Yes
Yes
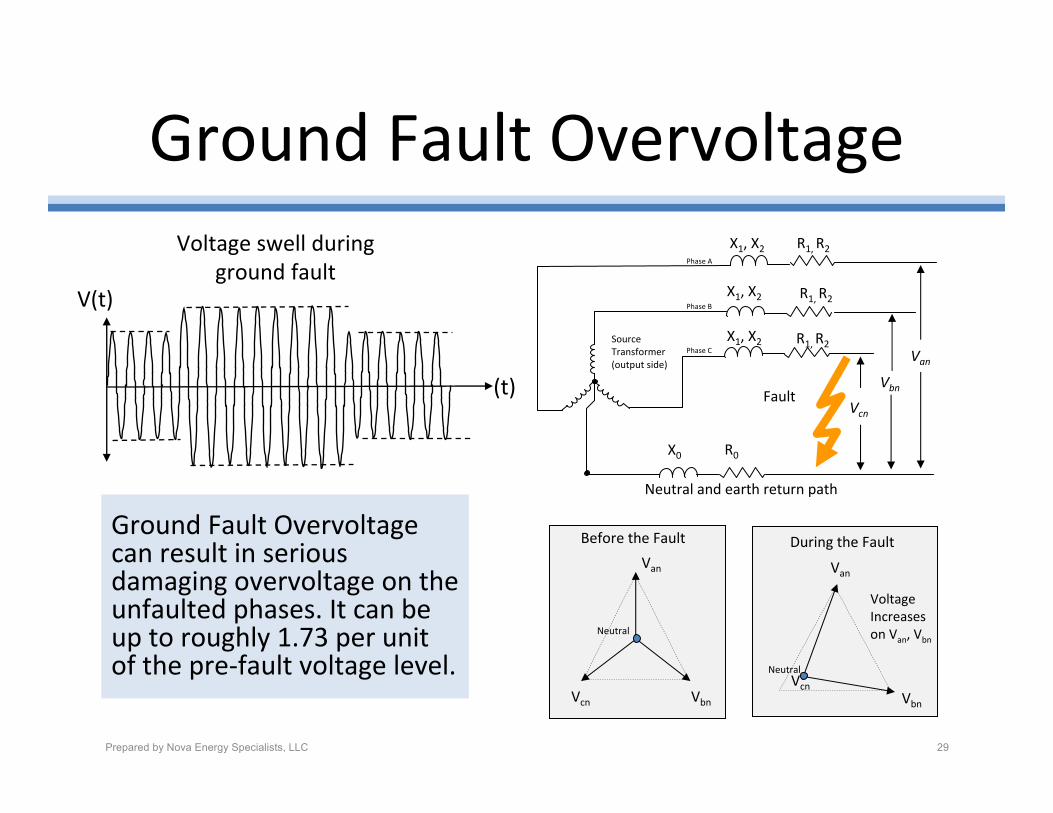
Ground Fault Overvoltage
Ground Fault Overvoltage can result in serious damaging overvoltage on the unfaulted phases. It can be up to roughly 1.73 per unit of the pre‐fault voltage level.
Neutral
Vcn
Van
Vbn
Before the Fault
Neutral
Voltage Increases on Van, Vbn
Vbn
Van
Vcn
During the Fault
Neutral and earth return path
Phase A
Phase B
Phase CSource Transformer (output side)
FaultVbn
Van
Vcn
X1, X2 R1, R2
X0 R0
Voltage swell during ground fault
V(t)
(t)
Prepared by Nova Energy Specialists, LLC 29
X1, X2
X1, X2 R1, R2
R1, R2
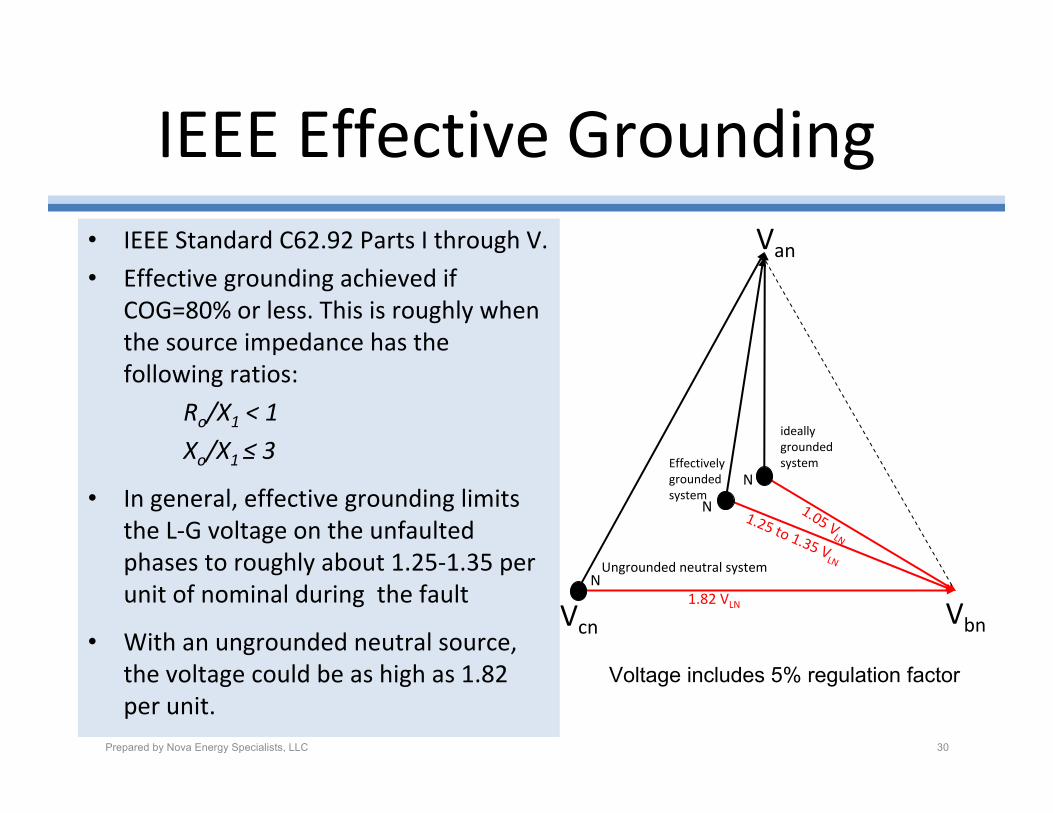
IEEE Effective Grounding• IEEE Standard C62.92 Parts I through V.
• Effective grounding achieved if COG=80% or less. This is roughly when the source impedance has the following ratios:
Ro/X1 < 1
Xo/X1 ≤ 3
• In general, effective grounding limits the L‐G voltage on the unfaulted phases to roughly about 1.25‐1.35 per unit of nominal during the fault
• With an ungrounded neutral source, the voltage could be as high as 1.82 per unit.
ideally grounded system
Vbn
Van
Vcn
Effectively grounded system
Ungrounded neutral system
N
N
N
1.05 VLN
1.25 to 1.35 VLN
1.82 VLN
Prepared by Nova Energy Specialists, LLC 30
Voltage includes 5% regulation factor
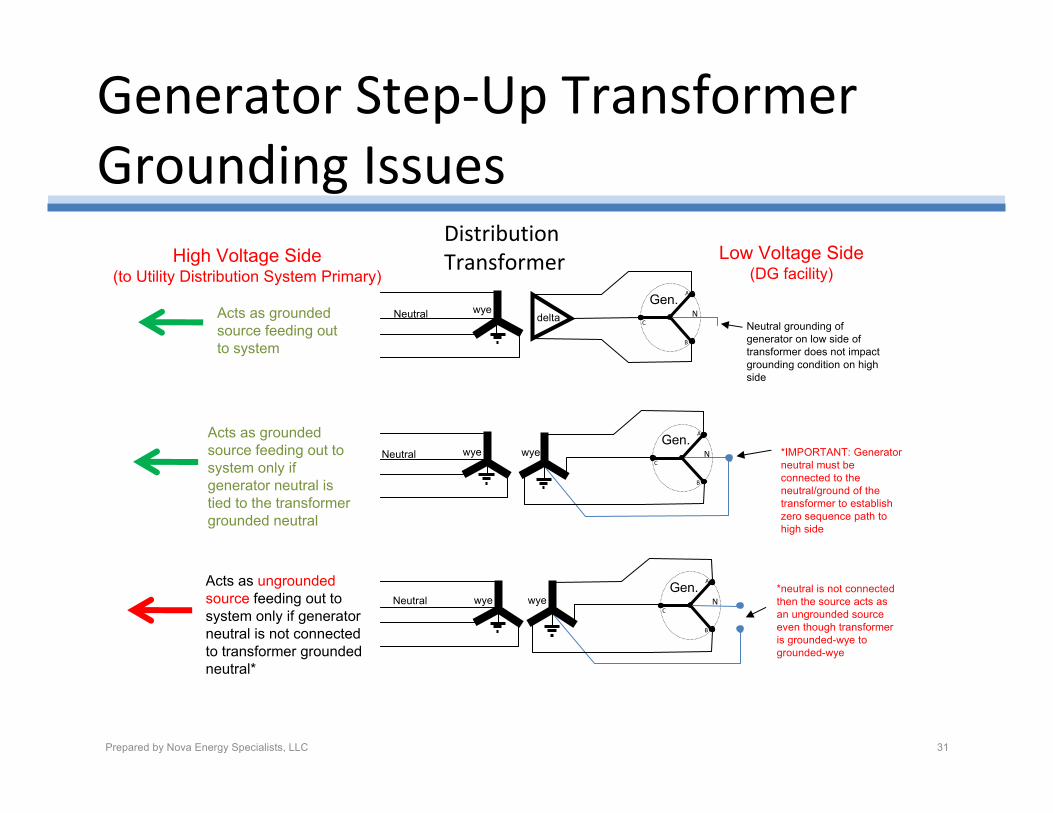
Generator Step‐Up Transformer Grounding Issues
deltaNeutral
Neutral
Low Voltage Side(DG facility)
wye
wye wye
Neutral grounding of generator on low side of transformer does not impact grounding condition on high side
*IMPORTANT: Generator neutral must be connected to the neutral/ground of the transformer to establish zero sequence path to high side
Neutral wye*neutral is not connected then the source acts as an ungrounded source even though transformer is grounded-wye to grounded-wye
Acts as grounded source feeding out to system only if generator neutral is tied to the transformer grounded neutral
Acts as ungrounded source feeding out to system only if generator neutral is not connected to transformer grounded neutral*
Acts as grounded source feeding out to system
C N
A
B
Gen.C
C N
A
B
Gen.C
C N
A
B
Gen.C
Distribution Transformer
wye
High Voltage Side(to Utility Distribution System Primary)
Prepared by Nova Energy Specialists, LLC 31
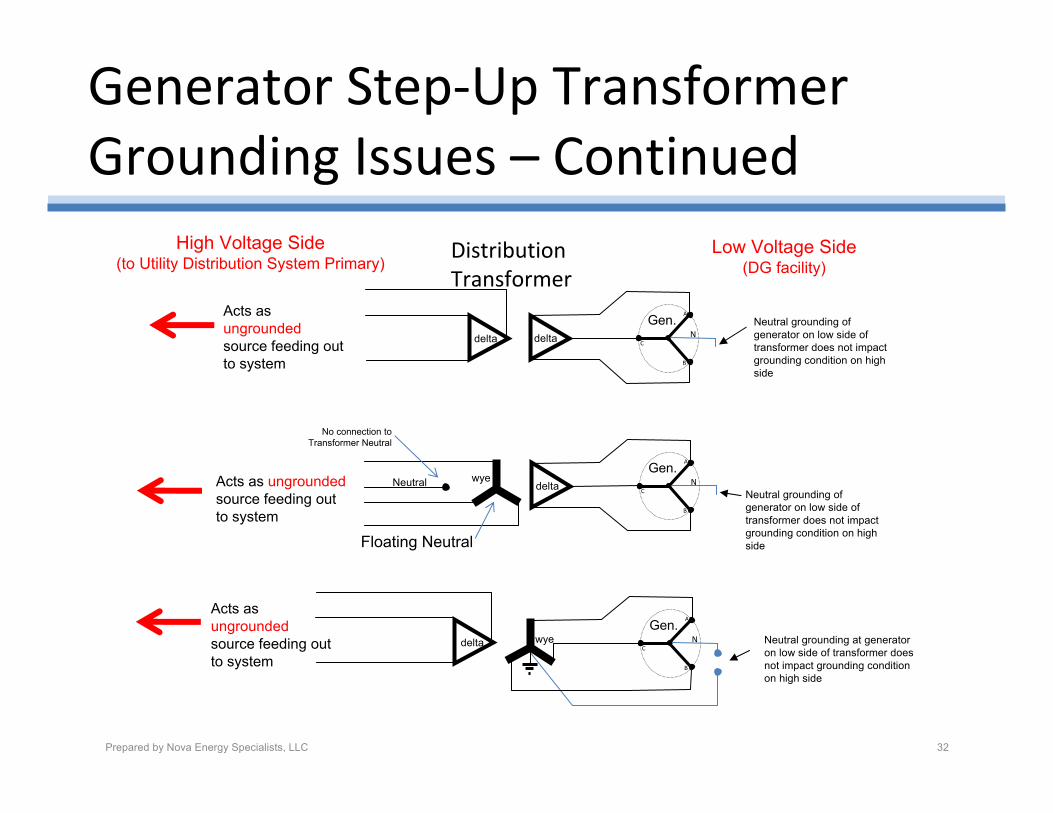
Generator Step‐Up Transformer Grounding Issues – Continued
deltaNeutral
Low Voltage Side(DG facility)
wyeNeutral grounding of generator on low side of transformer does not impact grounding condition on high side
Acts as ungroundedsource feeding out to system
C N
A
B
Gen.C
Distribution Transformer
High Voltage Side(to Utility Distribution System Primary)
delta
Acts as ungrounded source feeding out to system
Neutral grounding of generator on low side of transformer does not impact grounding condition on high side
C N
A
B
Gen.Cdelta
delta wye Neutral grounding at generator on low side of transformer does not impact grounding condition on high side
Acts as ungrounded source feeding out to system
C N
A
B
Gen.C
Floating Neutral
No connection to Transformer Neutral
Prepared by Nova Energy Specialists, LLC 32
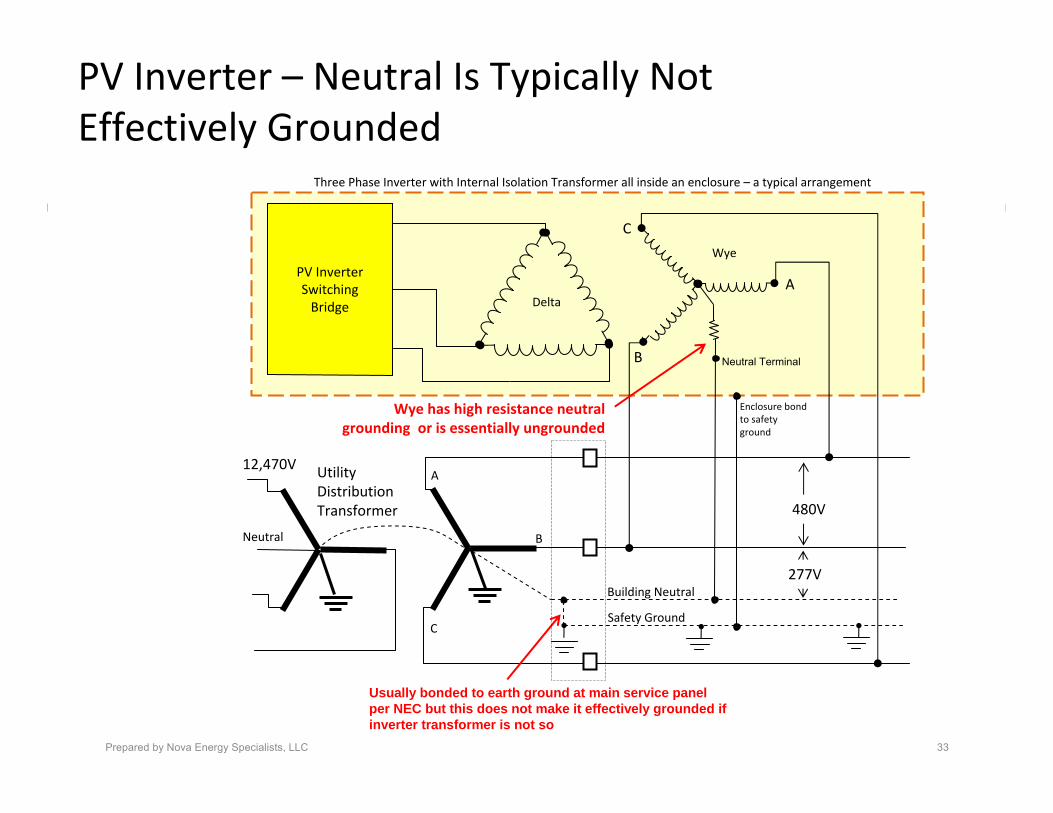
PV Inverter – Neutral Is Typically Not Effectively Grounded
Prepared by Nova Energy Specialists, LLC 33
PV Inverter Switching Bridge
Building Neutral
A
A
B
C
Utility Distribution Transformer 480V
277V
Delta
12,470V
Wye
B
C
Wye has high resistance neutral grounding or is essentially ungrounded
Three Phase Inverter with Internal Isolation Transformer all inside an enclosure – a typical arrangement
Safety Ground
Enclosure bond to safety ground
Neutral
Neutral Terminal
Usually bonded to earth ground at main service panel per NEC but this does not make it effectively grounded if inverter transformer is not so
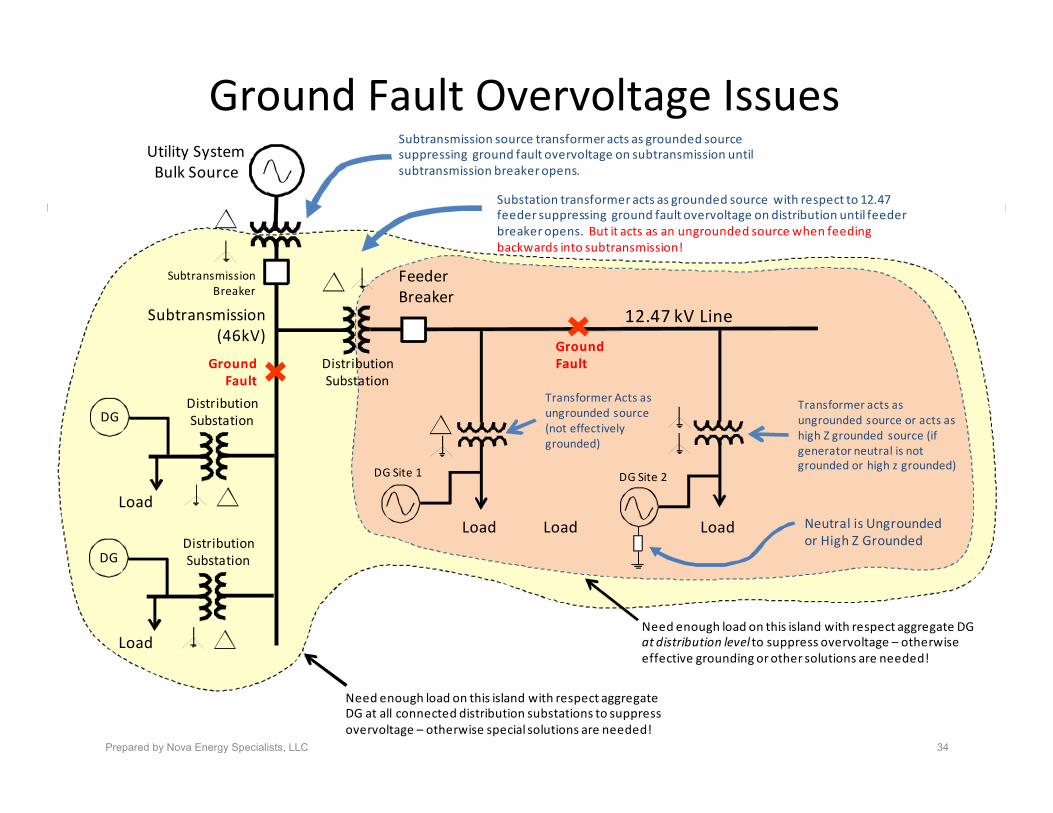
Ground Fault Overvoltage Issues
Prepared by Nova Energy Specialists, LLC 34
Need enough load on this island with respect aggregate DG at all connected distribution substations to suppress overvoltage – otherwise special solutions are needed!
12.47 kV Line
DG Site 1
Ground Fault
Feeder Breaker
Utility System Bulk Source
Load Load Load
Need enough load on this island with respect aggregate DG at distribution level to suppress overvoltage – otherwise effective grounding or other solutions are needed!
Transformer Acts as ungrounded source (not effectively grounded)
Substation transformer acts as grounded source with respect to 12.47 feeder suppressing ground fault overvoltage on distribution until feeder breaker opens. But it acts as an ungrounded source when feeding backwards into subtransmission!
Neutral is Ungrounded or High Z Grounded
Transformer acts as ungrounded source or acts as high Z grounded source (if generator neutral is not grounded or high z grounded)
DG Site 2
Subtransmission (46kV)
Subtransmission source transformer acts as grounded source suppressing ground fault overvoltage on subtransmission until subtransmission breaker opens.
Ground Fault
Distribution SubstationDG
DGDistribution Substation
Load
Load
Distribution Substation
Subtransmission Breaker
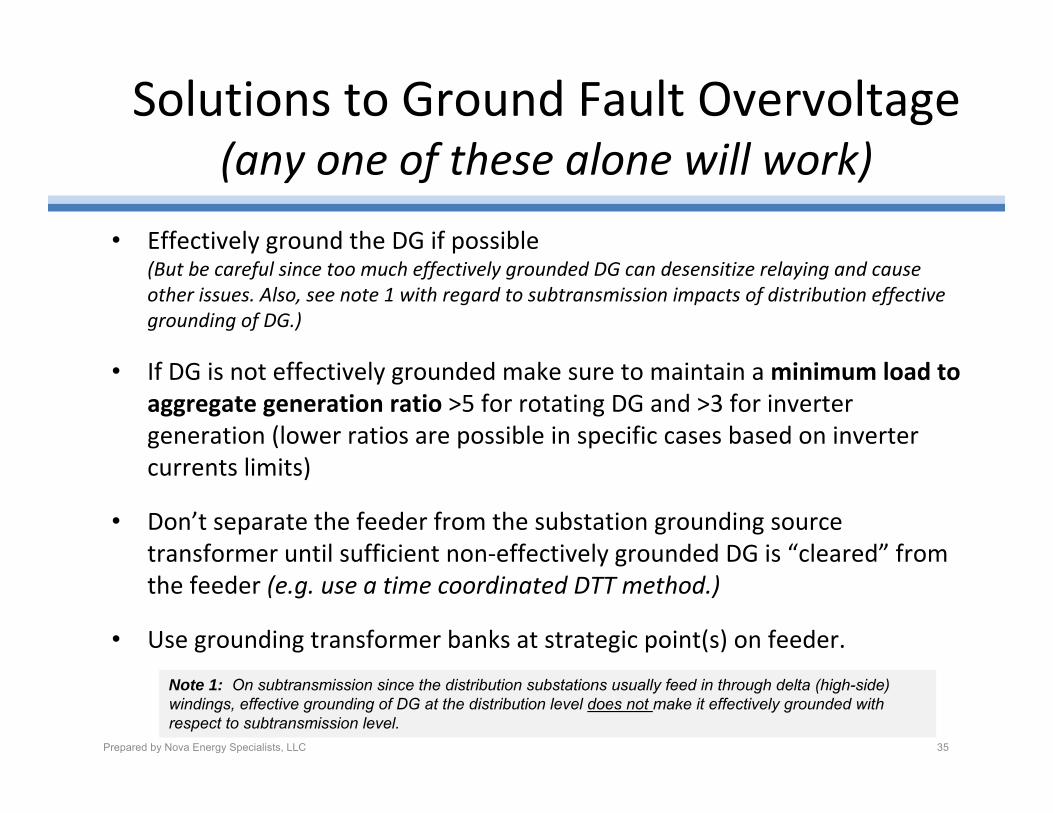
Solutions to Ground Fault Overvoltage (any one of these alone will work)
• Effectively ground the DG if possible (But be careful since too much effectively grounded DG can desensitize relaying and cause other issues. Also, see note 1 with regard to subtransmission impacts of distribution effective grounding of DG.)
• If DG is not effectively grounded make sure to maintain a minimum load to aggregate generation ratio >5 for rotating DG and >3 for inverter generation (lower ratios are possible in specific cases based on inverter currents limits)
• Don’t separate the feeder from the substation grounding source transformer until sufficient non‐effectively grounded DG is “cleared” from the feeder (e.g. use a time coordinated DTT method.)
• Use grounding transformer banks at strategic point(s) on feeder.
Prepared by Nova Energy Specialists, LLC 35
Note 1: On subtransmission since the distribution substations usually feed in through delta (high-side) windings, effective grounding of DG at the distribution level does not make it effectively grounded with respect to subtransmission level.
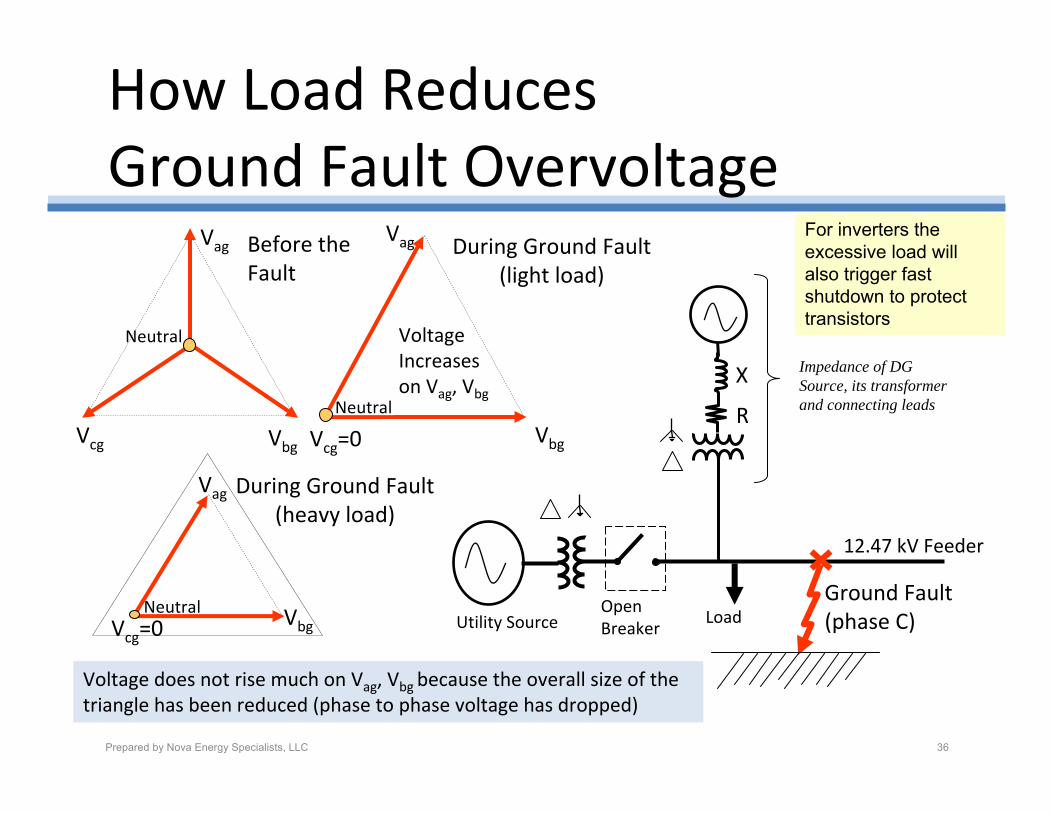
How Load Reduces Ground Fault Overvoltage
Neutral
Vcg
Vag
Vbg
Before the Fault
12.47 kV Feeder
Load
Impedance of DG Source, its transformer and connecting leads
Ground Fault(phase C)
Open BreakerUtility Source
Neutral
Voltage Increases on Vag, Vbg
VbgVcg=0
During Ground Fault(light load)
Neutral
Voltage does not rise much on Vag, Vbg because the overall size of the triangle has been reduced (phase to phase voltage has dropped)
Vbg
During Ground Fault(heavy load)
X
R
Vag
Vcg=0
Vag
Prepared by Nova Energy Specialists, LLC 36
For inverters the excessive load will also trigger fast shutdown to protect transistors
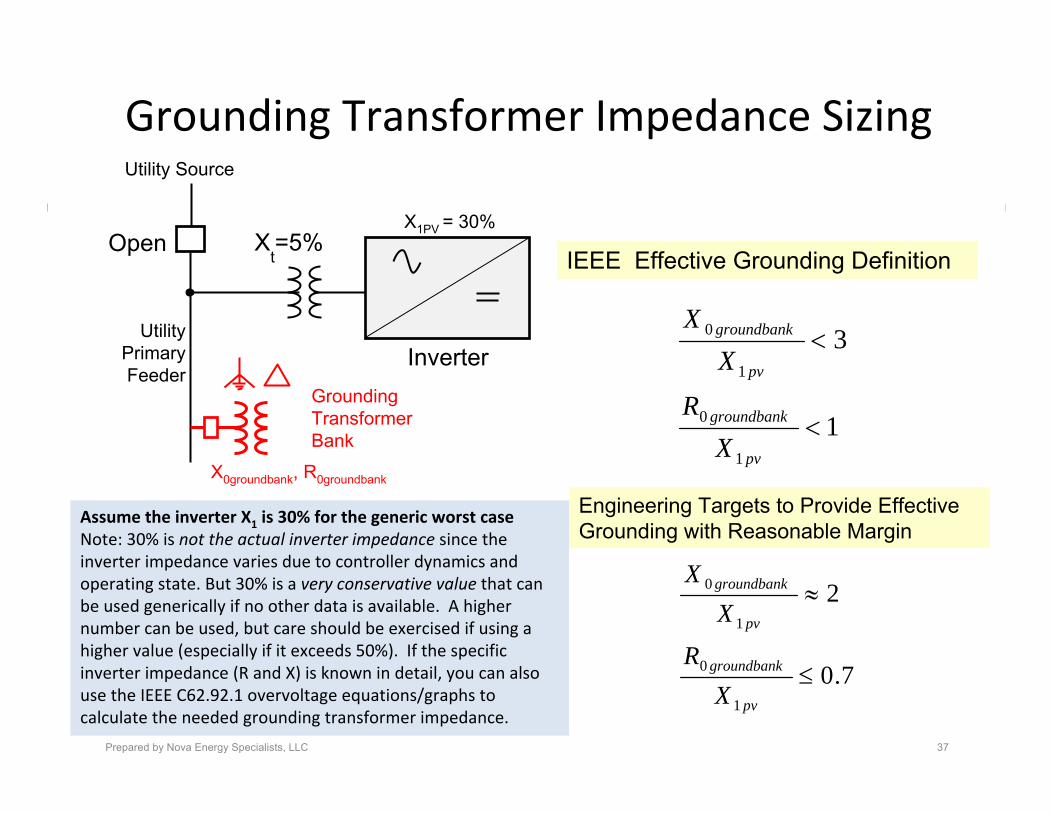
Grounding Transformer Impedance Sizing
Prepared by Nova Energy Specialists, LLC 37
1
3
1
0
1
0
<
<
pv
groundbank
pv
groundbank
XR
XX
IEEE Effective Grounding Definition
7.0
2
1
0
1
0
≤
≈
pv
groundbank
pv
groundbank
XR
XX
Engineering Targets to Provide Effective Grounding with Reasonable Margin
Assume the inverter X1 is 30% for the generic worst caseNote: 30% is not the actual inverter impedance since the inverter impedance varies due to controller dynamics and operating state. But 30% is a very conservative value that can be used generically if no other data is available. A higher number can be used, but care should be exercised if using a higher value (especially if it exceeds 50%). If the specific inverter impedance (R and X) is known in detail, you can also use the IEEE C62.92.1 overvoltage equations/graphs to calculate the needed grounding transformer impedance.
Utility Primary Feeder
X1PV = 30%X
t=5%
Utility Source
Grounding TransformerBank
X0groundbank, R0groundbank
Open
Inverter
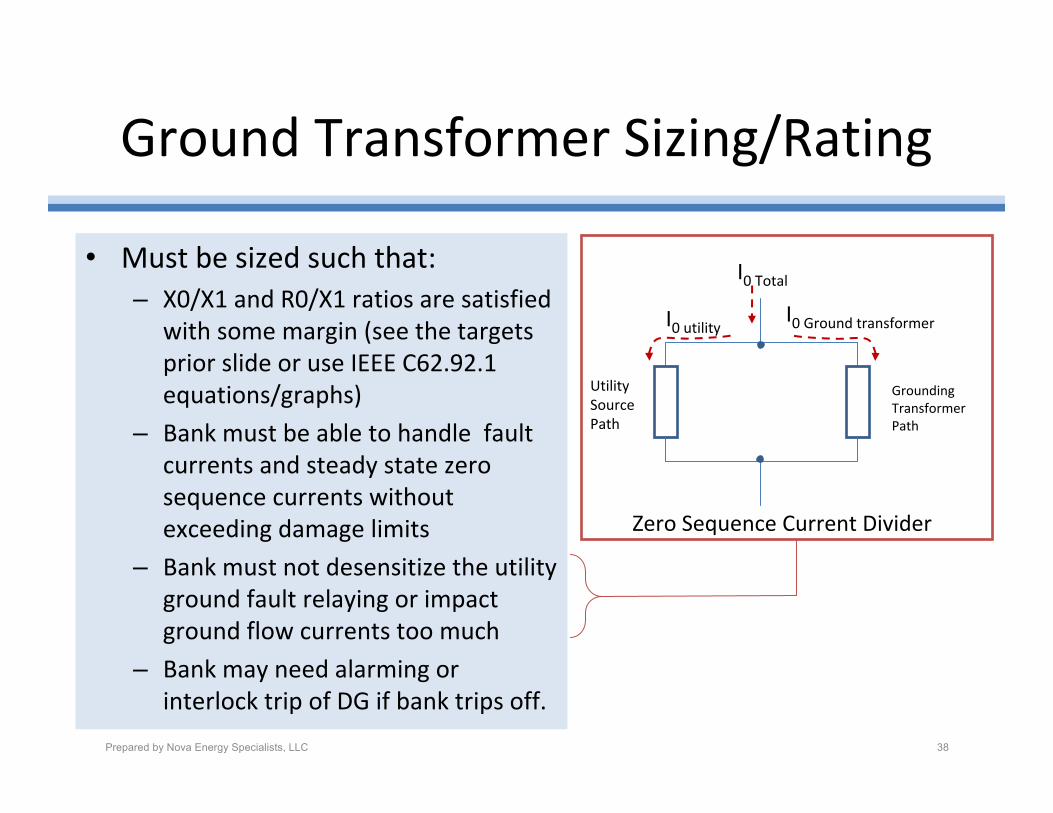
Ground Transformer Sizing/Rating
• Must be sized such that:– X0/X1 and R0/X1 ratios are satisfied
with some margin (see the targets prior slide or use IEEE C62.92.1 equations/graphs)
– Bank must be able to handle fault currents and steady state zero sequence currents without exceeding damage limits
– Bank must not desensitize the utility ground fault relaying or impact ground flow currents too much
– Bank may need alarming or interlock trip of DG if bank trips off.
Prepared by Nova Energy Specialists, LLC 38
Zero Sequence Current Divider
Grounding Transformer Path
Utility Source Path
I0 utility
I0 Total
I0 Ground transformer
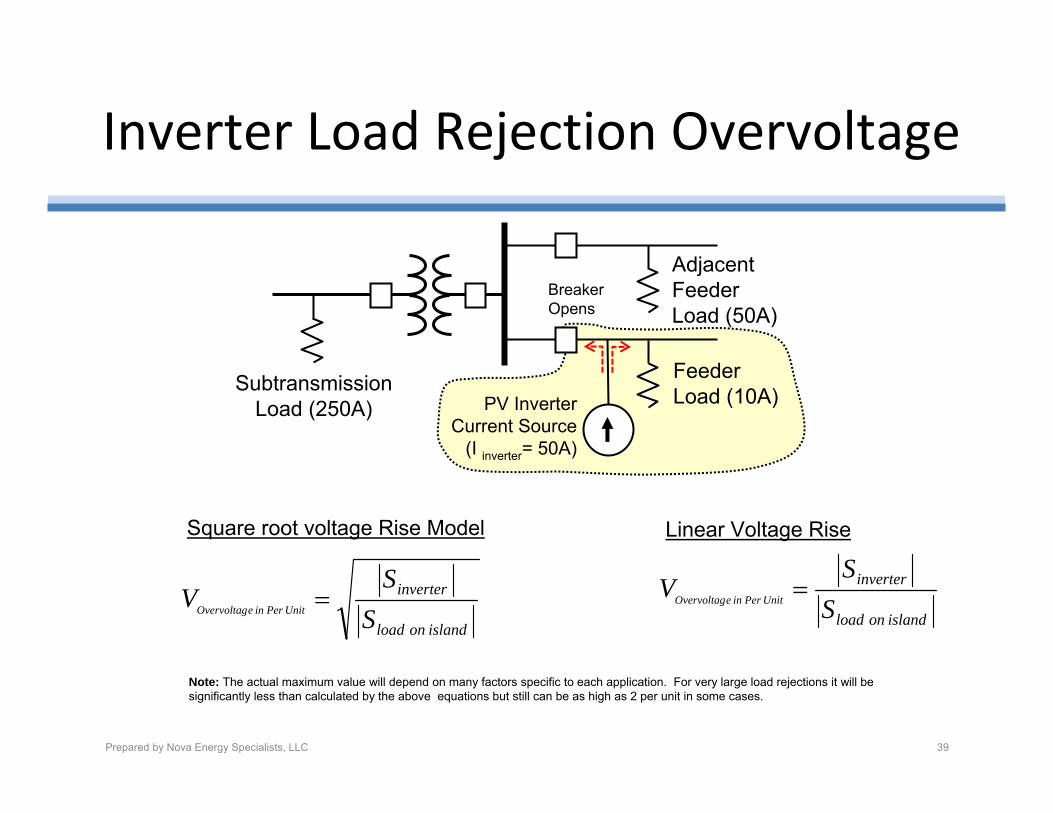
Inverter Load Rejection Overvoltage
Prepared by Nova Energy Specialists, LLC 39
FeederLoad (10A)
Adjacent FeederLoad (50A)
Subtransmission Load (250A) PV Inverter
Current Source(I inverter= 50A)
Breaker Opens
island on load
inverter
SS
V Unit Per in eOvervoltag =
Square root voltage Rise Model Linear Voltage Rise
Note: The actual maximum value will depend on many factors specific to each application. For very large load rejections it will be significantly less than calculated by the above equations but still can be as high as 2 per unit in some cases.
island on load
inverter
SS
V Unit Per in eOvervoltag =
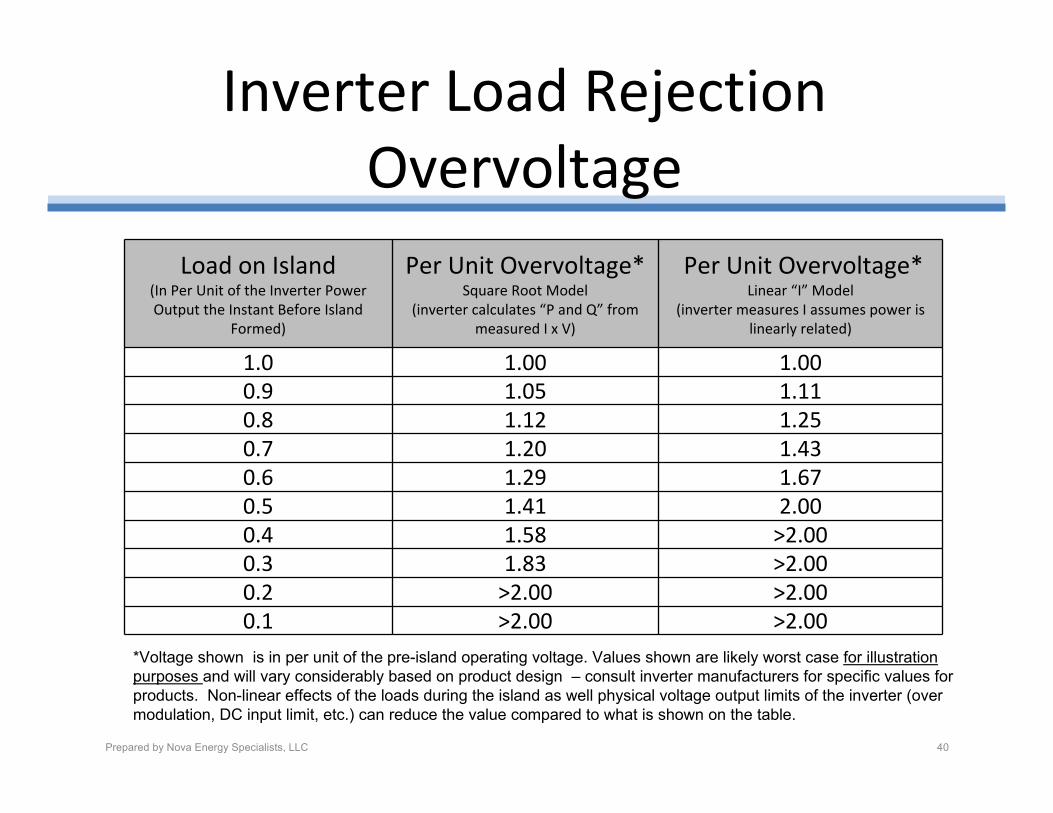
Inverter Load Rejection Overvoltage
Prepared by Nova Energy Specialists, LLC 40
Load on Island (In Per Unit of the Inverter Power Output the Instant Before Island
Formed)
Per Unit Overvoltage* Square Root Model
(inverter calculates “P and Q” from measured I x V)
Per Unit Overvoltage*Linear “I” Model
(inverter measures I assumes power is linearly related)
1.0 1.00 1.000.9 1.05 1.110.8 1.12 1.250.7 1.20 1.430.6 1.29 1.670.5 1.41 2.000.4 1.58 >2.000.3 1.83 >2.000.2 >2.00 >2.000.1 >2.00 >2.00
*Voltage shown is in per unit of the pre-island operating voltage. Values shown are likely worst case for illustration purposes and will vary considerably based on product design – consult inverter manufacturers for specific values for products. Non-linear effects of the loads during the island as well physical voltage output limits of the inverter (over modulation, DC input limit, etc.) can reduce the value compared to what is shown on the table.
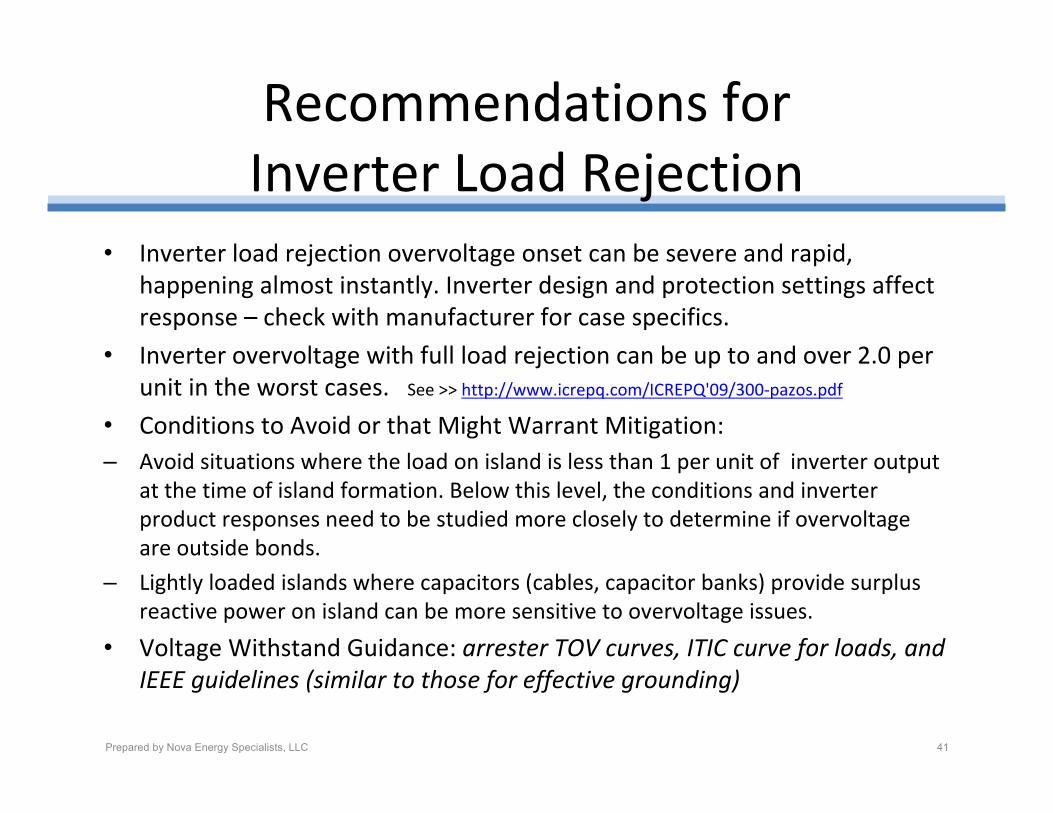
Recommendations for Inverter Load Rejection
Prepared by Nova Energy Specialists, LLC 41
• Inverter load rejection overvoltage onset can be severe and rapid, happening almost instantly. Inverter design and protection settings affect response – check with manufacturer for case specifics.
• Inverter overvoltage with full load rejection can be up to and over 2.0 per unit in the worst cases. See >> http://www.icrepq.com/ICREPQ'09/300‐pazos.pdf
• Conditions to Avoid or that Might Warrant Mitigation:– Avoid situations where the load on island is less than 1 per unit of inverter output
at the time of island formation. Below this level, the conditions and inverter product responses need to be studied more closely to determine if overvoltage are outside bonds.
– Lightly loaded islands where capacitors (cables, capacitor banks) provide surplus reactive power on island can be more sensitive to overvoltage issues.
• Voltage Withstand Guidance: arrester TOV curves, ITIC curve for loads, and IEEE guidelines (similar to those for effective grounding)
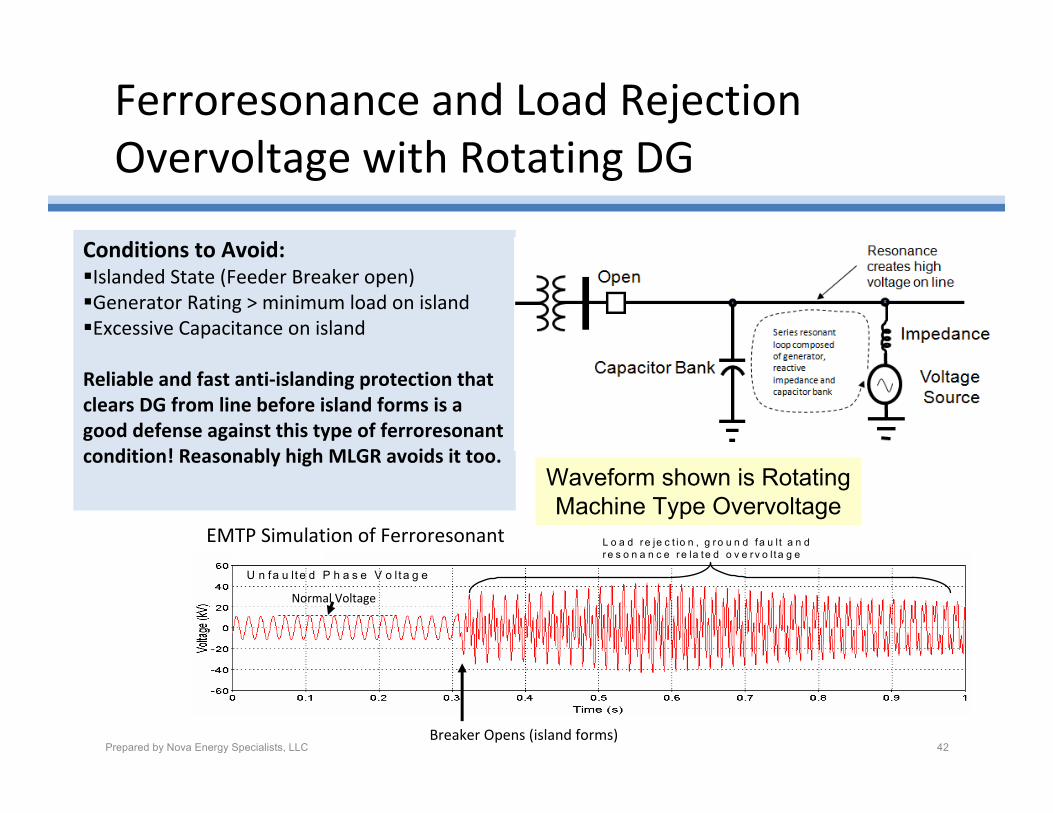
Ferroresonance and Load Rejection Overvoltage with Rotating DG
Conditions to Avoid:Islanded State (Feeder Breaker open)Generator Rating > minimum load on islandExcessive Capacitance on island
Reliable and fast anti‐islanding protection that clears DG from line before island forms is a good defense against this type of ferroresonant condition! Reasonably high MLGR avoids it too.
EMTP Simulation of Ferroresonant Overvoltage
U n fa u lte d P h a s e V o l ta g e
L o a d r e je c t io n , g r o u n d fa u l t a n d r e s o n a n c e r e la te d o v e r v o l t a g e
Breaker Opens (island forms)
Normal Voltage
Prepared by Nova Energy Specialists, LLC 42
Waveform shown is Rotating Machine Type Overvoltage
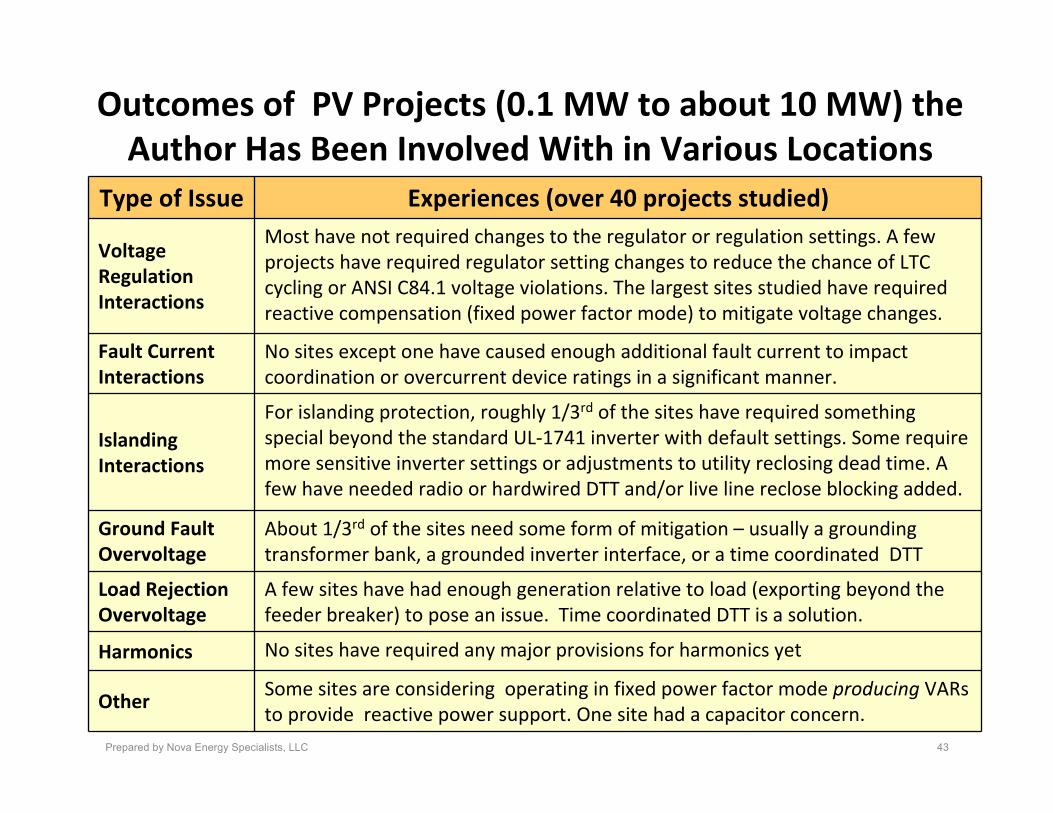
Outcomes of PV Projects (0.1 MW to about 10 MW) the Author Has Been Involved With in Various Locations
Prepared by Nova Energy Specialists, LLC 43
Type of Issue Experiences (over 40 projects studied)
Voltage Regulation Interactions
Most have not required changes to the regulator or regulation settings. A few projects have required regulator setting changes to reduce the chance of LTC cycling or ANSI C84.1 voltage violations. The largest sites studied have required reactive compensation (fixed power factor mode) to mitigate voltage changes.
Fault Current Interactions
No sites except one have caused enough additional fault current to impact coordination or overcurrent device ratings in a significant manner.
Islanding Interactions
For islanding protection, roughly 1/3rd of the sites have required something special beyond the standard UL‐1741 inverter with default settings. Some require more sensitive inverter settings or adjustments to utility reclosing dead time. A few have needed radio or hardwired DTT and/or live line reclose blocking added.
Ground Fault Overvoltage
About 1/3rd of the sites need some form of mitigation – usually a grounding transformer bank, a grounded inverter interface, or a time coordinated DTT
Load Rejection Overvoltage
A few sites have had enough generation relative to load (exporting beyond the feeder breaker) to pose an issue. Time coordinated DTT is a solution.
Harmonics No sites have required any major provisions for harmonics yet
OtherSome sites are considering operating in fixed power factor mode producing VARs to provide reactive power support. One site had a capacitor concern.
Conclusions
• PV and other types of DG today are being successfully interconnected on distribution feeders all over the country. In many cases the impacts of smaller projects and/or low aggregations are not enough to cause worrisome effects.
• However, the size of projects is growing, especially the large commercial and FIT type projects interconnecting at the distribution level. Also, the aggregation of PV as it becomes more widely adopted is leading to more substantial impacts.
• Inverter features such as fixed power factor mode, high speed overvoltage limiting and robust active islanding detection can help in many situations, but impact mitigation can still be required depending on case specific conditions.
Prepared by Nova Energy Specialists, LLC 44
Conclusions (continued)• The “relative size” of the PV (or DG) compared to the power
system to which it is connected plays the key role in system impact effects. Key factors that gauge the relative size include:
– The MLGR, FRF (SCCR), Stiffness Factor, and GSIR
– The ratios will usually need to be gauged based on aggregate DG in a zone or region of concern
• The settings of utility voltage regulation equipment and feeder overcurrent devices and system designs also play a key role.
• The “absolute size” and “project class” (e.g. FIT, net metered) play a role only in that this impacts the scope and criticality of the project and may trigger certain regulatory requirements.
Prepared by Nova Energy Specialists, LLC 45