solar energy prospecting in remote alaska energy prospecting in remote alaska an economic analysis...
TRANSCRIPT

Solar Energy Prospecting in Remote Alaska An Economic Analysis of Solar Photovoltaics in the Last Frontier State by Paul Schwabe, National Renewable Energy Laboratory
U.S. Department of Energy | Office of Indian Energy
1000 Independence Ave. SW, Washington DC 20585 | 202-586-1272
energy.gov/indianenergy | [email protected]

Solar Energy Prospecting in Remote Alaska
ii
NOTICE
This report was prepared as an account of work sponsored by an agency of the United States government. Neither the United States government nor any agency thereof, nor any of their employees, makes any warranty, express or implied, or assumes any legal liability or responsibility for the accuracy, completeness, or usefulness of any information, apparatus, product, or process disclosed, or represents that its use would not infringe privately owned rights. Reference herein to any specific commercial product, process, or service by trade name, trademark, manufacturer, or otherwise does not necessarily constitute or imply its endorsement, recommendation, or favoring by the United States government or any agency thereof. The views and opinions of authors expressed herein do not necessarily state or reflect those of the United States government or any agency thereof.
Available electronically at SciTech Connect http:/www.osti.gov/scitech
Available for a processing fee to U.S. Department of Energy and its contractors, in paper, from:
U.S. Department of Energy Office of Scientific and Technical Information P.O. Box 62 Oak Ridge, TN 37831-0062 OSTI http://www.osti.gov Phone: 865.576.8401 Fax: 865.576.5728 Email: [email protected]
Available for sale to the public, in paper, from:
U.S. Department of Commerce National Technical Information Service 5301 Shawnee Road Alexandra, VA 22312 NTIS http://www.ntis.gov Phone: 800.553.6847 or 703.605.6000 Fax: 703.605.6900 Email: [email protected]
energy.gov/indianenergy | [email protected] DOE/IE-0040 • February 2016 Cover photo from Alamy EPC220. Credit to Design Pics Inc / Alamy Stock Photo.

Solar Energy Prospecting in Remote Alaska
iii
Acknowledgements This work is made possible through support from the U.S. Department of Energy’s Office of Indian Energy Policy and Programs. The author would like to thank Christopher Deschene, Givey Kochanowski and Douglas Maccourt for their support of this work. The author would also like to thank the following reviewers for their insightful review comments: Robert Bensin of Bering Straits Development Company; Brian Hirsch of Deerstone Consulting; David Lockard of Alaska Energy Authority; Ingemar Mathiasson of Northwest Arctic Borough; David Pelunis-Messier of Tanana Chiefs Conference; and Erin Whitney of Alaska Center for Energy and Power. The author also wishes to thank Elizabeth Doris, Sherry Stout, and Jared Temanson of the National Renewable Energy Laboratory (NREL) for their strategic guidance throughout this effort as well as Jeffrey Logan and David Mooney, of NREL, for their insightful review of the document. The author is grateful for the technical editing of Heidi Blakley, Karen Petersen, and Rachel Sullivan of NREL. Finally the author also wishes to thank Jared Wiedmeyer for assistance with development of the analytical model and Pilar Thomas for her guidance and support early in this work. The author is solely responsible for any remaining errors or omissions.

Solar Energy Prospecting in Remote Alaska
iv
List of Acronyms AEA Alaska Energy Authority
Btu British thermal unit
kW kilowatt
kWh kilowatt-hour
LCOE levelized cost of energy
m2 square meter
MW megawatt
NREL National Renewable Energy Laboratory
O&M operations and maintenance
PCE Power Cost Equalization
PV photovoltaic
W watt

Solar Energy Prospecting in Remote Alaska
v
Table of Contents
Introduction ..................................................................................................................................... 1
Analysis Description and Limitations ............................................................................................ 7
Analysis Limitations ........................................................................................................................ 8
Data Input Assumptions: Diesel Generation Costs, Solar Costs, and Solar Resource Estimates ............................................................................................................................... 11
Input Parameters for Diesel Generation Costs .......................................................................... 11 Input Parameters for Solar Electricity Generation ..................................................................... 13 Summary of Input Assumptions .................................................................................................. 17
Analysis Results ........................................................................................................................... 20
Conclusion ................................................................................................................................... 22
References ................................................................................................................................... 23
Appendix A. Model Overview and Description ........................................................................... 27
Appendix B. Levelized Cost of Energy Results ........................................................................... 28

Solar Energy Prospecting in Remote Alaska
vi
List of Figures
Figure 1. Solar resource comparison of Alaska and Germany .................................................... 2
Figure 2. Annual solar production percentage across four regions in Alaska by month ........... 3
Figure 3. Solar PV installations at water treatment facilities in the remote villages of Ambler, Shungnak, Deering, and Kobuk, Alaska ................................................................... 5
Figure 4. The seasonal sun paths of Kotzebue, Alaska, and Denver, Colorado ..........................
Figure 5. Villages included in solar analysis ................................................................................. 7
Figure 6. PV Installations in Nome and Galena ..............................................................................
Figure 7. Average wholesale diesel prices in $/gal for the 11 villages tested in 2013 and 2014 ............................................................................................................................... 12
Figure 8. Screenshot and callout of diesel fuel purchases in Anaktuvuk Pass, Alaska ......... 13
Figure 9. PVWatts solar resource estimate tool screenshot for Adak, Alaska ........................ 14
Figure 10. PVWatts solar resource estimate tool for a 100-kW PV system in Adak, Alaska .. 15
Figure 11. Indexed diesel and solar PV prices from 2002 to 2015 .............................................
Figure 12. Servicing a PV system in remote Alaska .................................................................. 17
Figure 13. Cost of electricity comparison between solar PV and diesel generation .............. 21
Figure 14. Schematic of LCOE model used in this analysis ..................................................... 27
List of Tables
Table 1. Cost Estimates for a 100-kW PV System .................................................................... 17
Table 2. Annual Solar Energy Estimates .................................................................................... 18
Table 3. Wholesale Diesel Fuel Costs for Electricity Generation ............................................. 19
Table 4. Solar PV LCOE Modeling Results ................................................................................. 28

Solar Energy Prospecting in Remote Alaska
1
Introduction Exploitation and utilization of energy resources within the state of Alaska has predominantly and historically centered on its abundance of fossil-fuel deposits including oil, natural gas, and coal. Within the last decade, however, renewable energy technologies have been deployed across the state for both demonstration purposes and commercial ventures (REAP 2016). This diversification of energy sources has been driven from at least three primary factors: (1) the economic exposure of many Alaskan communities to oil price fluctuations and other petroleum market influences (2) technological advancements and reductions in the cost of renewable energy equipment, and (3) efforts to improve self-sufficiency for remote Alaskan communities. Due to these factors and more, renewable energy resources are increasingly being considered to meet Alaska’s energy needs (Foster et al. 2013).
Renewable energy technologies used in Alaska have included small and large hydroelectric facilities, utility-scale and distributed wind generation, geothermal and air heat pumps, and woody biomass for electricity and heating (REAP 2016, CCHRC 2016). In addition to these endemic natural resources, a previously dismissed but pervasive form of renewable energy is also increasingly being analyzed and deployed in Alaska: solar electricity generated from photovoltaic (PV) panels.
The lack of historical solar energy development in Alaska is due to a multitude of factors, but not surprisingly starts with one fundamental problem: minimal to no sunlight in the winter months, particularly for the northern latitudes. Of course, Alaska also experiences prolonged and sunlight rich summer days, but many of the biggest energy needs arise during the cold and dark months of winter. Despite this seemingly obvious barrier for solar electricity in Alaska, upon deeper examination there are several factors that may support the deployment of solar energy in particular locations across the state.
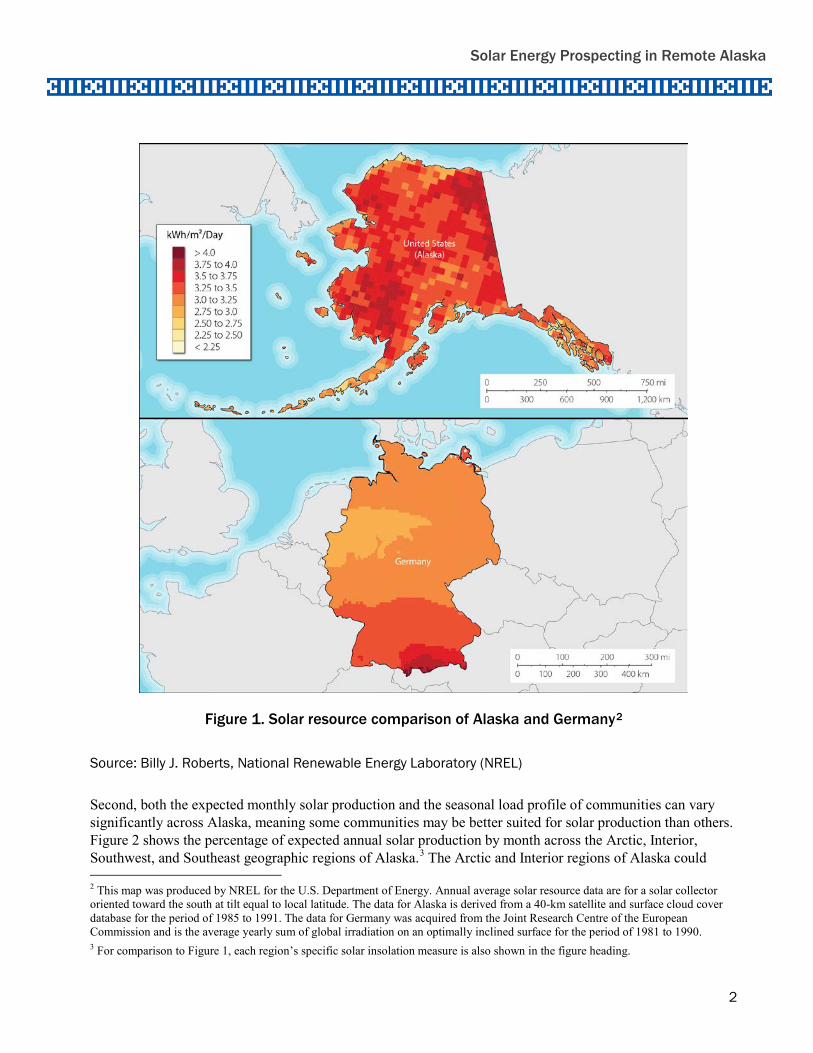
First, Alaska is an immense state with a large geographic range along both the north-to-south and east-to-west directions. Many Alaskans will proudly and dryly note that if one was to hypothetically cut the state into two, Texas would be only the third largest state in the Union. This expansive and diverse geographic range means that there are significant differences in both the amount and seasonal variation of the solar resource across the state. Additionally many of the meteorological conditions experienced in certain regions of Alaska can actually be beneficial to solar energy production, including low ambient temperatures that improve the efficiency of solar modules and the reflectivity of sunlight off of snow cover on the ground. As shown in Figure 1, the solar resource (i.e., the amount of solar insolation received in kilowatt-hours (kWh)/square meters (m2)/day) in some regions of Alaska is at-least comparable to that of Germany, which leads the world in PV installations with more than 38,500 megawatts (MW) of solar installed as of October 2015 (Wirth 2015).1
1 To put 38,500 MW in perspective, with a population of roughly 80 million, Germany has installed approximately 480 watts (W) of PV per capita, or roughly two average-sized 250-W PV panels for every person in the country.
Solar Energy Prospecting in Remote Alaska
2
Figure 1. Solar resource comparison of Alaska and Germany2
Source: Billy J. Roberts, National Renewable Energy Laboratory (NREL)
Second, both the expected monthly solar production and the seasonal load profile of communities can vary significantly across Alaska, meaning some communities may be better suited for solar production than others. Figure 2 shows the percentage of expected annual solar production by month across the Arctic, Interior, Southwest, and Southeast geographic regions of Alaska.3 The Arctic and Interior regions of Alaska could 2 This map was produced by NREL for the U.S. Department of Energy. Annual average solar resource data are for a solar collector oriented toward the south at tilt equal to local latitude. The data for Alaska is derived from a 40-km satellite and surface cloud cover database for the period of 1985 to 1991. The data for Germany was acquired from the Joint Research Centre of the European Commission and is the average yearly sum of global irradiation on an optimally inclined surface for the period of 1981 to 1990. 3 For comparison to Figure 1, each region’s specific solar insolation measure is also shown in the figure heading.

Solar Energy Prospecting in Remote Alaska
3
expect high solar production predominantly from March through August, with a steep drop off in the shoulder months and little to no production in the winter. The Southeast and Southwest regions of Alaska show a more gradual transition of solar production levels from the sunlight rich spring and summer months to the shortening days of fall and winter. Although the electricity load peaks for many Alaska Native villages in the winter months when solar is minimally producing, these villages are also often running primarily on diesel-based generation during summer months for basic electricity needs such as lighting, refrigeration, cooking, and electronics when solar PV energy could offset fossil-fuel consumption. Furthermore, despite the cold and dark winters in Alaska that result in high energy demands, some Alaska communities have summer-peaking energy demands primarily because of commercial fishing activities and higher seasonal populations in the summer, which is generally compatible with solar availability.4
Figure 2. Annual solar production percentage across four regions in Alaska by month
Source: NREL 2015
Lastly, and perhaps most significantly, Alaska has more than 175 remote village populations that rely almost exclusively on diesel fuel for electricity generation and heating oil for heat (Goldsmith 2008, AEA 2014a). Although oil is extracted in the North Slope of Alaska, the in-state production does not result in a below
4 Additionally, Sidebar 1 compares the path of the sun in the village of Kotzebue, Alaska to Denver, Colorado, to illustrate solar production in the Arctic region with a reference point in the contiguous 48 states.
0%4%
15%
17% 17%
14%15%
10%
5%3%
0% 0%
J F M A M J J A S O N D
Arctic Alaska Annual Solar Production Percentage by Month (2.3 kWh/m2/day)
1% 2%
11%12%
14% 14%15%
13%
7% 7%
2% 1%
J F M A M J J A S O N D
Interior Alaska Annual Solar Production Percentage by Month (3.4 kWh/m2/day)
3%
9%
13%14%
12%11% 10%
8% 7%
6%4%
3%
J F M A M J J A S O N D
Southwest Alaska Annual Solar Production Percentage by Month (3.1 kWh/m2/day)
3%
5%
11%
14%15%
9%
14%
10%
8%
5% 5%
2%
J F M A M J J A S O N D
Southeast Alaska Annual Solar Production Percentage by Month (3.1 kWh/m2/day)

Solar Energy Prospecting in Remote Alaska
4
market price for oil within the state. Chris Rose, Renewable Energy Alaska Project Executive Director notes, “We [Alaskans] pay the world commodity oil price. We’ve never received some sort of ‘hometown’ discount for oil.” (Gerdes 2015). Unprocessed crude oil extracted within the state is transported via the TransAlaska pipeline from the North Slope to refineries in the Interior and South-Central regions of Alaska and then delivered locally as diesel and gasoline to rural communities a few times per year. Most fuel deliveries to remote communities are made via barge, ice road, or air transport, which also contributes to the high local prices for diesel and gasoline.5 The local markup to retail pricing also adds to the “all-in” prices for fuel in rural villages. Due to these and other factors, electricity generated by diesel fuel in some rural communities can be $1.00/kilowatt-hour (kWh) or more, which is more than 8 times the national average of $0.12/kWh (AEA 2014a, EIA 2014). As described later in this report, the State of Alaska has enacted various programs for both renewable and diesel energy sources to help reduce the energy costs in rural Alaska, but many of these programs are limited to certain sectors, or are increasingly under scrutiny with the budget difficulties being experienced by the state (AEA 2016a, AEA 2016b, Johnson 2015).
For these reasons and more, alternative forms of electricity generation including solar PV are increasingly being pursued in remote Alaska communities (see Figure 3 for examples of solar PV recently installed in the Northwest Arctic Borough). This analysis provides a high-level examination of the potential economics of solar energy in rural Alaska across a geographically diverse sample of remote villages throughout the state. It analyzes at a high level what combination of diesel fuel prices, solar resource quality, and PV system costs could lead to an economically competitive moderate-scale PV installation at a remote village. The goal of this analysis is to provide a baseline economic assessment to highlight the possible economic opportunities for solar PV in rural Alaska for both the public and private sectors.
5 The cost of transportation is even more pronounced in regions that require regular fuel deliveries via air shipments, if for example, barge or ice road transport is unavailable due to freezing, thawing, low runoff, high silting, or other conditions.

Solar Energy Prospecting in Remote Alaska
5
Figure 3. Solar PV installations at water treatment facilities in the remote villages of Ambler, Shungnak, Deering, and Kobuk, Alaska6
Source: Mathiasson 2015b, Northwest Arctic Borough
6 Clockwise from top left, the 8.4-kW Ambler array uses a pole-mounted array design and the 7.5-kW Shungnak installation utilizes a roof-mounted design with 90° directional offsets. The 11.55-kW and 7.38-kW design in Deering and Kobuk respectively incorporate a 180° circular system design that wraps around the east, south, and west facing walls of water treatment towers. These designs are utilized to even out the daily solar production profile (compared to systems installed facing just to the south) which can ease integration with existing diesel generators.

Solar Energy Prospecting in Remote Alaska
6
Sidebar 1. Seasonal Sun Path in Kotzebue, Alaska, Compared to Denver, Colorado
The state of Alaska is well known for its long summer days and prolonged winter nights. Given the immense size of the state from the Northern to Southern latitudes, however, there is a wide range of expected daylight hours throughout the state. For example, on the shortest day of the year the capital city of Juneau located in the South can expect 6 hours, 22 minutes of daylight while the Northern city of Barrow is in the midst of 67 straight days of total winter darkness (Alaska.org 2015). To highlight the seasonal sun path variations of one region of Alaska compared to a representative point in the contiguous 48 United States (lower 48 states), Figure 4 below shows the sun’s path for Kotzebue, Alaska, located in the Northwest Arctic Borough, compared to Denver, Colorado, which is an approximate latitudinal mid-point of the lower 48 states. This figure shows both the spring and fall equinoxes when the total length of day and night are equal across the globe and the summer and winter solstices when the longest and shortest days of the year occur.
The path of the sun’s altitude for Kotzebue illustrates how the sun never falls completely below the horizon on the summer solstice, while on the winter solstice, it never quite rises above. The shape of the sun’s path for Kotzebue also illustrates a flatter and more gradual curve compared to the relatively steep curve for Denver. While solar electricity production in Kotzebue would be minimal during the winter months, the long summer days would provide a period of extended production. The spring and fall months would also produce a moderate amount of solar electricity and benefit from low ambient temperatures and increased production from sunlight reflected off of snow cover on the ground.
Figure 4. The seasonal sun paths of Kotzebue, Alaska, and Denver, Colorado
Source: Suncalc 2015 with visual concept adapted from Time and Date 2015

Solar Energy Prospecting in Remote Alaska
7
Analysis Description and Limitations This analysis examines the economics of solar electricity at a sampling of 11 remote villages across the state. The villages were selected to represent major geographical regions across the state including the Arctic Slope, the Interior, the Southwest, the Southeast, and the Aleutian Islands. In general, these regional variations were selected to capture the variations in meteorological conditions across the state, different delivery options, and possible ranges in diesel fuel prices. All of the villages are off of Alaska’s road system. The villages included in this analysis include Adak, Ambler, Anaktuvuk Pass, Hughes, Kasigluk, Shungnak, St. Paul, Tenakee Springs, Venetie, Yakutat, and Wainwright. Figure 5 shows the location of each of the 11 villages across the state and their estimated solar insolation.
Figure 5. Villages included in solar analysis7
Source: Billy J. Roberts, NREL
7 This map was produced by NREL for the U.S. Department of Energy. Annual average solar resource data are for a solar collector oriented toward the south at tilt equal to local latitude. The data is derived from a 40-km satellite and surface cloud cover database for the period 1985–1991.

Solar Energy Prospecting in Remote Alaska
8
The analysis uses the levelized cost of electricity (LCOE) as a metric to compare the costs of solar electricity to diesel fuel rates, reported in cents per kilowatt-hour. LCOE is a metric that takes the entire lifecycle expenditures of an energy technology including capital costs, transportation, operating, and fuel costs (zero for solar) discounted to the present term and divided by the expected annual energy production of the energy system. While there is not a single universally accepted definition or methodology to calculate LCOE, in its basic form LCOE is often used to compare the cost of different energy technologies that can have very different cost and generation profiles (i.e., capital intensive versus operational intensive, project life, fuel costs, etc.). A common criticism for LCOE is that it does not differentiate between energy sources that are generally considered non-variable such as diesel generation from variable energy sources such as wind or solar energy. Moreover, project-level feasibility and economic evaluations are not typically made with just one metric, but instead incorporate a variety of analytical criteria including LCOE, net present value, internal rate of return, payback period, and a benefit to cost ratio, among others. For these reasons and more, LCOE is a useful though not singular metric to compare the cost of solar to the fuel-only cost of diesel generation (EIA 2015).8
To conduct the analysis, a spreadsheet-based pro-forma tool was created to calculate the LCOE for solar PV systems. This model was based on a simplified version of NREL’s Cost of Renewable Energy Spreadsheet Tool that allows for basic LCOE evaluations and includes capital, operating, and financial costs, performance and inflation adjustments, as well federal, state, and local policy support schemes (NREL 2011). This model includes the ability to model the economically significant federal tax benefits given to solar energy technologies such as the 30% investment tax credit and accelerated depreciation. The model used in this analysis was tested and reviewed by two outside entities.9 See Appendix A for more information on the model used in this analysis.
Analysis Limitations It is important to note that there are many factors that will impact both the technical and economic characteristics of solar electricity, which are beyond the scope of this initial analysis. From a technical standpoint, this analysis does not explicitly consider the impact of integrating high penetration levels of variable solar electricity with a baseload diesel generation system. Instead, this analysis makes a few simplifying assumptions on integrating solar and diesel generation:
• First, the analysis assumes that a kilowatt-hour produced from solar electricity is able to offset a kilowatt-hour produced from diesel generation. This one-to-one offset may not always be achievable as diesel generators are often most fuel-efficient at a given power level and generation from PV could impact the generator’s power level and thus fuel efficiency. Moreover, because diesel generators provide both energy (i.e., kilowatt-hours of generation) as well as other grid services such as voltage and frequency regulation, this analysis assumes that some level of diesel generation will always be running for grid operations and is not attempting to model a “diesel-off” scenario.
• Second, the analysis also assumes the PV system would be sized small enough relative to the existing diesel generator to not require extensive energy storage systems (i.e., batteries) to integrate the solar
8 See the Data Input Assumptions Section for why only the fuel-cost component of diesel fired generation is used in this analysis. 9 These entities include the original developers of the Cost of Renewable Energy Spreadsheet Tool at Sustainable Energy Advantage and researchers at the Institute of Social and Economic Research at University of Alaska Anchorage.

Solar Energy Prospecting in Remote Alaska
9
and diesel generators.10 As shown previously in Figure 3, the Northwest Arctic Borough recently installed a series of PV arrays at water treatment plants in remote regional villages using PV system designs that smooths the daily solar generation profile and thus integrates more easily with the existing diesel generators. Furthermore, comparatively smaller integration upgrades such as advanced power electronics and controls installed at either the diesel powerhouse or at the PV system are assumed to be utilized and implicitly included into the all-in PV system price. As an example, a 2014 study conducted by the Alaska Center for Energy and Power found that a remote Alaskan village with a peak load of about 1.1 MW could accommodate a 135-kW PV system with no control system upgrades, and a 205-kW PV system with some control system upgrades (Mueller-Stoffels 2014).11 Conversely, whole system upgrades, or a new, but smaller diesel generator is not assumed to be included in the all-in PV system price.
From an economic standpoint, this analysis also does not attempt to examine the interplay of state-derived financial relief of diesel fuel purchases by remote villages through its Power Cost Equalization (PCE) program. Instead it makes a simplifying assumption that PV would be targeted at installations not eligible for PCE such as commercial businesses, schools, or state or federal buildings.12 Although the simplifying assumptions incorporated here are useful for the purposes of this high-level investigation, more research is required in order to further refine the analysis and provide project-specific economic feasibility.
10 Existing research has attempted to quantity what levels of PV integration would require extensive integration costs for a single village, though more investigation is required for broader applicability (Jensen et al. 2013, Mueller-Stoffels 2015). 11 The range of installed costs for the PV systems described in the Data Inputs Assumptions Section is likely sufficiently wide enough to include at least one case where the control upgrades are included in the PV system pricing. 12 See Sidebar 2 for more information on the Power Cost Equalization program.

Solar Energy Prospecting in Remote Alaska
10
Sidebar 2. Power Cost Equalization and Renewable Energy
In Alaska, a long-standing state policy program known as Power Cost Equalization attempts to equalize electricity costs between high-cost rural communities with comparatively cheaper urban population centers connected by the rail and road system from Fairbanks in the Interior through Anchorage to Homer in the South-Central region (known as the “Railbelt”) and Juneau in the Southeast. The PCE program provides significant financial relief to many of the rural communities throughout Alaska, in particular those not on the rail or road system, by using a state endowment fund to subsidize rural electricity rates to be in-line with rates experienced in the Railbelt and Southeast Regions. Although several components contribute to the PCE rate amount, a sizable portion of it is determined from the cost of diesel fuel used to generate electricity in eligible remote Alaskan communities (AEA 2014b). In this sense the PCE has been suggested by some as a financial disincentive for rural Alaskan communities to reduce their diesel dependency as doing so can also reduce the amount of PCE financial support (Hirsch 2015, Fay et al. 2012). Others note that the impacts from a renewable energy installation on PCE payments can be more pronounced on certain customer classes than others and a more nuanced assessment is appropriate (Drolet 2014). In any case, the current PCE structure has unquestionably led to a debate around if, how, and to what extent the economic value of renewable energy—principally the ability offset diesel fuel costs—is restricted by the PCE.
As mentioned above, this analysis does not dive into the complex assessment of determining the net impact of renewable energy to diesel savings to PCE subsidies at the village level. Instead it makes a simplifying assumption that under the current PCE structure, the solar installation is logically targeted at a facility not currently eligible for PCE. These non-PCE eligible facilities include schools, local businesses such as a village or Native corporation, or state and federal facilities (AEA 2014b). An early example of this type of installation is the 16.8-kW system installed at Bering Straits Native Corporation in Nome in 2008, shown on the left in Figure 6 (AEA 2016c). Another example is the 6.7-kW PV project (originally installed in 2012 and expanded to more than 10 kW in 2015) developed on the school in Galena, Alaska, shown on the right in Figure 6 (Galena 2012, Pelunis-Messier 2015). Given that schools are among the largest energy users at many remote village communities, schools seem like an especially likely candidate for solar PV installations without impacting PCE as it is currently structured.
Figure 6. PV Installations in Nome and Galena
Source: AEA 2016c and Pelunis-Messier 2015

Solar Energy Prospecting in Remote Alaska
11
Data Input Assumptions: Diesel Generation Costs, Solar Costs, and Solar Resource Estimates This section briefly describes each of the data sources used for this analysis and presents the range of input cost parameters tested.
Input Parameters for Diesel Generation Costs For diesel-based generation, this analysis focuses principally on the costs attributed to purchasing and transporting the diesel fuel used to run the village’s electricity generators (i.e., “fuel costs”). Other fixed costs (i.e., “non-fuel costs”) also contribute to the overall electricity prices; however, because these non-fuel costs would likely not be offset by adding solar generation, they are ignored for purposes of this analysis.13 Examples of non-fuel costs excluded from this analysis are the capital and operations and maintenance (O&M) costs for a diesel generator and a utility’s administrative charges.
The costs for wholesale diesel fuel prices in remote Alaskan villages are comprehensively reported by the Alaska Energy Authority (AEA) in their annual report “Power Cost Equalization Program Statistical Data by Community” for the years 2013 and 2014 (AEA 2014a, AEA 2015).14 Utility purchases of diesel fuel for electricity generation at remote villages are typically made at wholesale rather than retail rates. The 11 villages included in this analysis present a wide range of wholesale diesel fuel costs. For example, wholesale diesel fuel prices range from a low of $3.95/gallon (gal) in Wainwright up to $6.90/gal in Ambler in 2014.
Figure 7 shows the diesel fuel prices distribution for the years 2013 and 2014 for each of the 11 villages tested (AEA 2014a, AEA 2015).15 There was no consistent trend for fuel prices across the 11 villages from 2013 to 2014. Some village’s diesel fuel prices stayed relatively flat or even decreased while others increased substantially. This price variation could be due to several factors including oil commodity price fluctuations throughout the course of the year, fuel purchase prices that may or may not have been locked-in a year or more in advance, cost factors from logistical and transportation challenges from one year to the next,16 or simple reporting errors.17 Given these cost fluctuations from year to year, this analysis uses the reported diesel price points for a village as illustrative rather than precise.
13 See the Analysis Description and Limitations Section for a discussion on the costs associated with integrating the diesel and solar systems. 14 The reporting period for this report is through the end of June in the preceding year. Prices are shown in nominal dollars. 15 The years 2013 and 2014 were included in the analysis as these were the only years that a comprehensive data source with a consistently applied methodology was available. Note that the 2015 version of the AEA Power Cost Equalization Program Statistical Data by Community report was released in February 2016, shortly before the publication of this report (AEA 2016d). The analysis in this report does not incorporate the AEA 2015 data. 16 Ambler and Shungnak, for example, receive fuel shipments via barge in some years and through air transport in others. 17 Note, for example, that several reviewers suspected that a few of the outlying statistics presented in AEA 2014a and AEA 2015 were likely due to imperfect reporting or other data errors (particularly for Hughes in 2013) but generally acknowledged that these data reports are among the best available sources at this time.

Solar Energy Prospecting in Remote Alaska
12
Figure 7. Average wholesale diesel prices in $/gal for the 11 villages tested in 2013 and 2014
Source: AEA 2014a and AEA 2015
Although the most familiar reporting term for diesel fuel prices is in dollars per gallon, in the context of electricity generation a different cost metric is used here. AEA reports the “fuel cost per kilowatt-hour sold” ($/kWh) metric for any village that receives energy price support through the PCE program. Figure 8 shows a screenshot and callout of the fuel cost per kWh data reported for the village of Anaktuvuk Pass in the AEA report (AEA 2015). For this analysis, the fuel cost per kWh sold metric is compared to the calculated solar LCOE. Note that the terms “diesel costs”, “diesel electricity costs”, or “diesel fuel costs” are used interchangeably in this narrative to represent the “fuel costs per kWh sold” metric.
$4.88 $4.96
$4.20
$6.90
$5.94
$6.83
$6.17
$5.92
$4.18
$3.91
$5.10
$6.84
$4.84 $4.77$4.78$4.61
$5.59$5.51
$3.95
$4.31$4.36
$4.08
2013 2014
Wainwright
KasiglukAmblerYakutat
Tenakee SpringsSt. Paul
AdakShungnak
Venetie
Anaktuvuk Pass
Hughes

Solar Energy Prospecting in Remote Alaska
13
Figure 8. Screenshot and callout of diesel fuel purchases in Anaktuvuk Pass, Alaska
Source: AEA 2015
Input Parameters for Solar Electricity Generation There are three primary data inputs used to estimate the solar LCOE: (1) the all-in installation costs for a solar PV system, (2) the ongoing O&M costs for the PV system, and (3) solar resource estimates to determine the amount of electricity produced at a given location. The input parameters for the solar resource estimates are described first followed by the solar cost estimates (both installation and O&M).
This analysis uses PVWatts to simulate solar electricity production at a given village under study (NREL 2015). PVWatts utilizes the NREL National Solar Radiation database and combines solar radiation data with weather data for the years 1991–2010 to estimate a PV system’s electricity production. For this analysis, the closest available meteorological data was used to determine the electricity production at each of the 11 villages.18 Figure 9 shows a PVWatts screenshot of the village of Adak, which had data available for that exact location.
18 Five of the eleven villages had weather and solar resource data available in PVWatts. The remaining six villages were based on data from the nearest available data collection site, which ranged from 24 to 117 miles from the village under analysis.

Solar Energy Prospecting in Remote Alaska
14
Figure 9. PVWatts solar resource estimate tool screenshot for Adak, Alaska
Source: NREL 2015
After selecting the exact or nearest location, PVWatts requires a few basic assumptions about the PV system to estimate the solar electricity production at a given site. These assumptions include system size, module type (standard or premium), mounting type (roof versus ground mounted), expected losses,19 orientation, and others. For this analysis, a 100-kW system size was assumed with an open rack-mounting system common for ground-mounted systems. Figure 10 shows a screenshot of the estimated annual kilowatt-hour production for a 100-kW PV system in Adak, Alaska (67,949 kWh per year). To estimate the solar production for a 100-kW system at all 11 villages, the process shown in Figures 8, 9, and 10 was simply repeated for each of the villages.20
19 Importantly, this analysis assumes a 5% loss factor due to snow accumulation. Snow accumulation has both positive and negative impact on a PV system’s electricity production. Snow cover on the PV panels themselves dramatically reduces the system’s ability to generate electricity. However, snow coverage on the ground can actually increase a PV system’s production through enhanced reflectivity or albedo. This analysis assumes efficient removal of snow from the panels themselves due to the easy access that ground-mounted systems provide and the steep tilt of PV panels at northern latitudes. More research is required to refine this assumption. 20 Note that in the model used in this analysis, both the installed and O&M costs of the system as well as estimated energy production scale proportionally with the size of the PV system. Therefore the PV system’s size does not directly impact the LCOE results. To illustrate, a 50-kW system would cost 50% of a 100-kW system, but correspondingly only produce half of the energy. Thus, a 50-kW, 100-kW, or any other sized system would return the same modeled LCOE. In reality, however, we would expect to see slight variations in the actual pricing due to economies of scale and other non-scaling cost and production factors.

Solar Energy Prospecting in Remote Alaska
15
Figure 10. PVWatts solar resource estimate tool for a 100-kW PV system in Adak, Alaska
Source: NREL 2015
The solar system PV cost estimates used in this analysis are based on approximate multiples of PV pricing reported in the lower 48. Lawrence Berkeley National Laboratory reports a 100-kW commercial-scale PV system at a median price point of approximately $3.40/watt (W) in the first half of 2015 (Barbose et al. 2015). As prices continued to fall in the second half of 2015 and 2016, this analysis assumes a flat $3/W pricing as the lower 48 base level price, which is then increased to account for higher costs for nearly all goods and services in remote Alaskan communities. This analysis multiplies the lower 48 base level price by 2, 3, or 4 times to get a range of estimates for remote village pricing. These multiples correspond to $6/W, $9/W, and $12/W for low-cost, base-case, and high-cost cases respectively. There is some limited evidence of PV installed pricing at both the low and high end of the range presented in Table 1. For example, Pelunis-Messier 2014 reports PV installed at approximately $5/W, Mathiasson 2015a indicates that ten small sized PV projects ranged in pricing from nearly $6/W to over $11/W, and Irwin 2013 cites a 2013 installation at nearly $11/W. Given this wide variation in pricing, this analysis uses a range of possible Alaskan village PV costs rather than a single point estimate as there is significant uncertainty in both the low and high end of the installed PV price ranges in the remote village locations.
The O&M costs are treated in a similar fashion. Assuming a lower 48 cost of $20/kW per year for O&M expenditures, the low-cost, base-case, and high-cost cases for remote Alaskan villages is estimated at $40/kW/year, $60/kW/year, and $80/kW/year respectively.

Solar Energy Prospecting in Remote Alaska
16
Sidebar 3. Cost Trajectories of Diesel Fuel and Solar PV
Figure 11 below illustrates the cost trajectories of wholesale diesel fuel rates compared to the installed price of solar PV (based on commercial sector pricing from the lower 48) from 2002 through mid-year 2015 (EIA 2016a, Barbose et al. 2015). This chart indexes diesel fuel and solar PV prices in $/gal and $/W respectively, to a base value of 100 in 2002. Figure 11 highlights the percentage change based on real dollars over time. Several trends are apparent in Figure 11.
The cost of diesel fuel has been rising steadily since 2002 with two noticeably steep price declines in 2008 and 2014. Diesel fuel prices quickly recovered in 2009, but as of November 2015 remain at their lowest price point since 2003. Even at the low historic pricing levels, the indexed value of diesel fuel costs rose by more than 50% from a base value of 100 in 2002 to 153 in late 2015. Solar PV pricing has shown a steady cost decline in every year since 2002 from a base index value of 100 in 2002 to 32 in 2015 – a reduction of over 67%.
Given this cost comparison over time, several factors contribute to an improving relative economic case over time for solar PV. First, solar PV price declines exhibited both predictability and an overall declining cost path. Conversely, diesel prices have been more volatile and have shown an overall increase from 2002 to 2015. Unpredictability in diesel fuel costs makes long-term village electricity cost projections difficult to manage. As a repercussion, some villages have locked in future diesel fuel purchases at a previous year’s pricing and therefore are not paying current market rates (both on a premium or a discount). Moreover, even while diesel fuel prices are currently lower than any time since 2003, there are other ramifications of the low commodity price. Perhaps most noteworthy is that Alaska’s state budget has been drastically reduced from the low price of oil. This means that many state funded programs could be at risk in the current budget environment, including ones targeted at rural communities such as PCE (Johnson 2015 and Forgey 2015). Moreover, as described later, several sources are predicting a rise in diesel rates as soon as mid- year 2016 (EIA 2016b). Solar PV can therefore offer a pricing hedge against the volatile nature of diesel fuel prices and potential changes to PCE that could impact remote communities.
Figure 11. Indexed diesel and solar PV prices from 2002 to 2015
Source: EIA 2016a and Barbose et al. 2015. Diesel and solar PV pricing data underlying the index values use 2014 real dollars. Note that this comparison does not normalize for energy content. For comparison, a gallon of diesel has approximately 128,488 British thermal units (Btu) while 1 kWh of electricity has approximately 3,414 Btu (AFDC 2014).
153
320
50
100
150
200
250
300
350
400
'02 '03 '04 '05 '06 '07 '08 '09 '10 '11 '12 '13 '14 '15
Diesel
Solar PV

Solar Energy Prospecting in Remote Alaska
17
Summary of Input Assumptions Table 1 presents the solar capital and O&M cost estimates for a low-, base-, and high-cost scenario. Figure 12 visually captures the at-times difficult conditions of installing and maintaining all types of equipment, including PV, in remote Alaska. The occasionally harsh conditions contribute in part to the uncertainty in costs of installing and maintaining different energy generation technologies in remote communities and thus, the wide ranges of input parameters used.
Table 1. Cost Estimates for a 100-kW PV System
Village Case Lower 48
Cost Multiple Capital Costs
($/W) O&M Costs
($/kW/yr)
All Low Cost 2 X $6 $40 Base Case 3 X $9 $60 High Cost 4 X $12 $80
Figure 12. Servicing a PV system in remote Alaska
Source: Bensin 2015

Solar Energy Prospecting in Remote Alaska
18
Table 2 shows the annual kilowatt-hour production for a 100-kW system installed across the 11 villages. The capacity factor is also shown for illustrative purposes.21
Table 2. Annual Solar Energy Estimates
Annual Solar Energy
Solar Capacity Factor
Village (kWh) (%) Adak 67,979 7.8% Ambler 86,230 9.8% Anaktuvuk Pass 85,138 9.7% Hughes 90,456 10.3% Kasigluk 91,764 10.5% Shungnak 86,230 9.8% St. Paul 62,268 7.1% Tenakee Springs 88,547 10.1% Venetie 101,824 11.6% Wainwright 73,881 8.4% Yakutat 73,934 8.4%
Source: NREL 2015
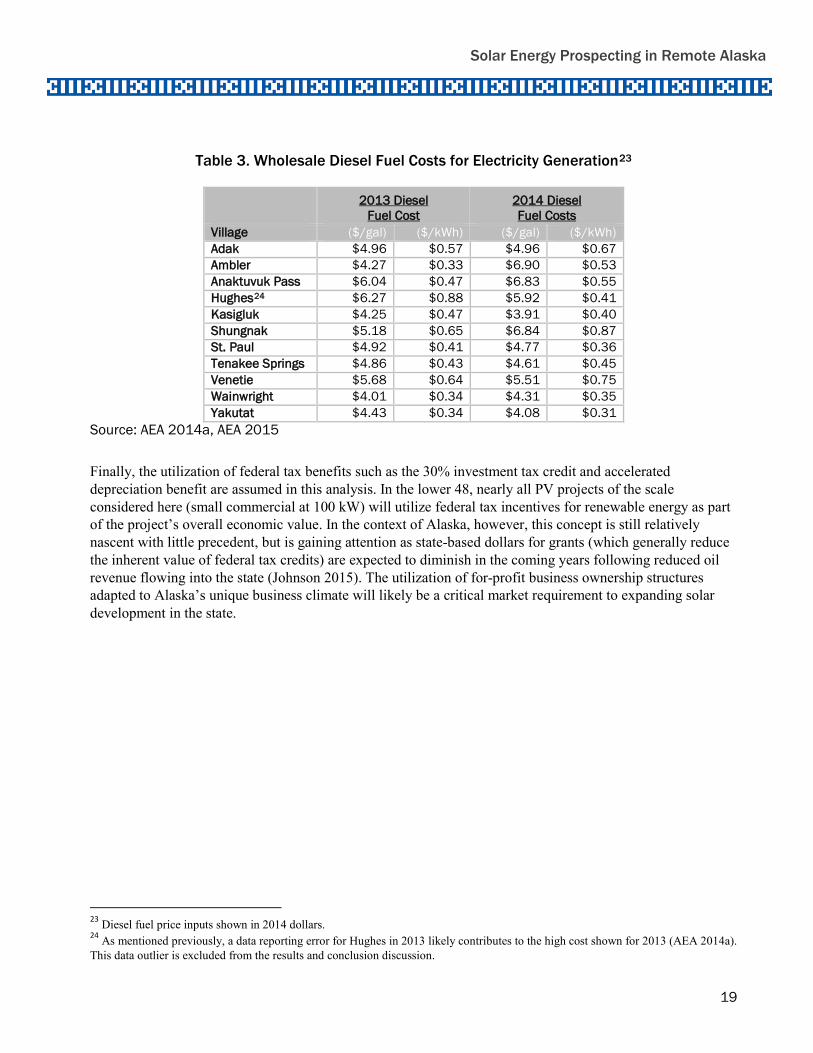
Table 3 summarizes the wholesale diesel fuel cost data gathered for the 11 villages in this analysis. Because diesel fuel is a world commodity with constantly changing prices, price data from both 2013 and 2014 are included in this analysis and represent the range of years in which the comprehensive and consistent data source is available.22 While the continued drop in oil and diesel fuel rates experienced in 2015 is not captured in AEA 2014a and AEA 2015, some analytical projections indicate that diesel commodity prices will begin to rise in mid-2016 (EIA 2016b). Future research could provide an update to the results presented here based the most current pricing data available for both diesel fuel and installed solar PV prices.
21 Capacity factor is a common metric reported for electrical generation, which is a ratio that compares the amount of actual electric generation produced in a year divided by its potential generation if it could operate at full capacity for the entire year. 22 Is it is also important to note that while the two metrics of fuel costs, $/gal and $/kWh, track one another fairly well, they are not perfectly correlated from one year to the next nor village to another. This is because fuel costs in $/kWh calculations are impacted by other factors such as changing diesel engine efficiency (particularly if a newer, more efficient generator is installed), electrical line losses, and other factors. It is also likely that simple data reporting inconsistencies from year to year influence how closely fuel costs in $/gal and $/kWh track one another.
Solar Energy Prospecting in Remote Alaska
19
Table 3. Wholesale Diesel Fuel Costs for Electricity Generation23
2013 Diesel
Fuel Cost 2014 Diesel Fuel Costs
Village ($/gal) ($/kWh) ($/gal) ($/kWh) Adak $4.96 $0.57 $4.96 $0.67 Ambler $4.27 $0.33 $6.90 $0.53 Anaktuvuk Pass $6.04 $0.47 $6.83 $0.55 Hughes24 $6.27 $0.88 $5.92 $0.41 Kasigluk $4.25 $0.47 $3.91 $0.40 Shungnak $5.18 $0.65 $6.84 $0.87 St. Paul $4.92 $0.41 $4.77 $0.36 Tenakee Springs $4.86 $0.43 $4.61 $0.45 Venetie $5.68 $0.64 $5.51 $0.75 Wainwright $4.01 $0.34 $4.31 $0.35 Yakutat $4.43 $0.34 $4.08 $0.31
Source: AEA 2014a, AEA 2015
Finally, the utilization of federal tax benefits such as the 30% investment tax credit and accelerated depreciation benefit are assumed in this analysis. In the lower 48, nearly all PV projects of the scale considered here (small commercial at 100 kW) will utilize federal tax incentives for renewable energy as part of the project’s overall economic value. In the context of Alaska, however, this concept is still relatively nascent with little precedent, but is gaining attention as state-based dollars for grants (which generally reduce the inherent value of federal tax credits) are expected to diminish in the coming years following reduced oil revenue flowing into the state (Johnson 2015). The utilization of for-profit business ownership structures adapted to Alaska’s unique business climate will likely be a critical market requirement to expanding solar development in the state.
23 Diesel fuel price inputs shown in 2014 dollars. 24 As mentioned previously, a data reporting error for Hughes in 2013 likely contributes to the high cost shown for 2013 (AEA 2014a). This data outlier is excluded from the results and conclusion discussion.
Solar Energy Prospecting in Remote Alaska
20
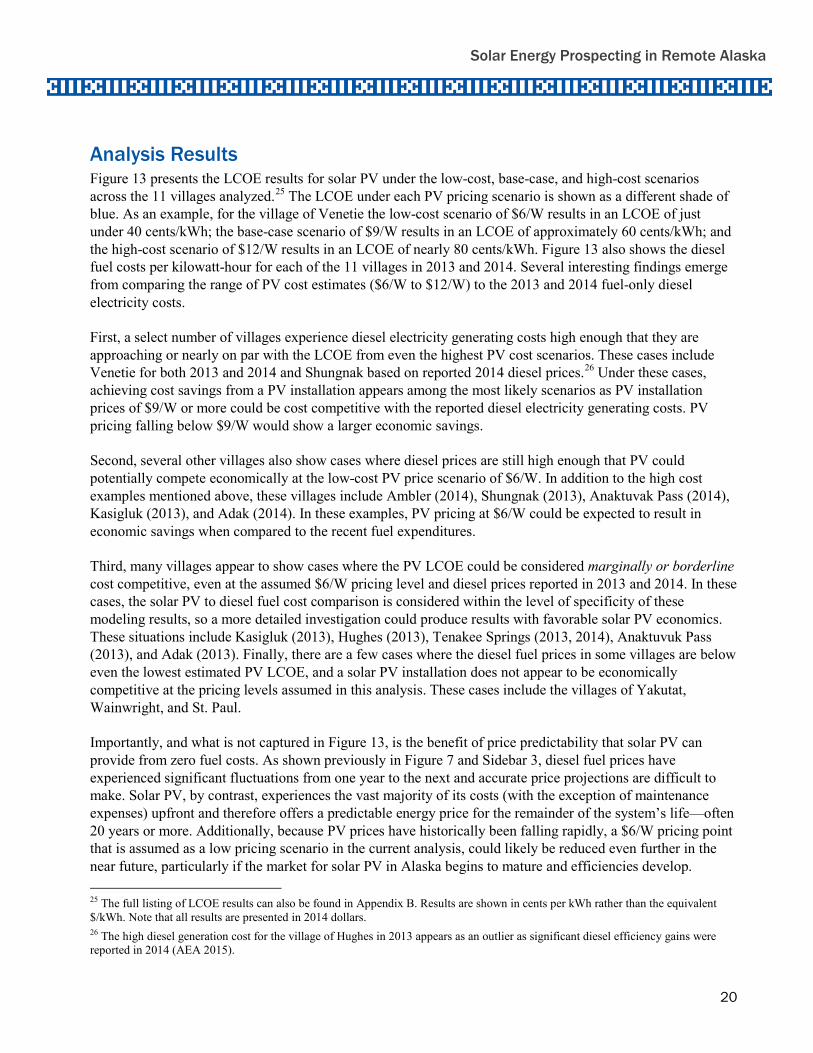
Analysis Results Figure 13 presents the LCOE results for solar PV under the low-cost, base-case, and high-cost scenarios across the 11 villages analyzed.25 The LCOE under each PV pricing scenario is shown as a different shade of blue. As an example, for the village of Venetie the low-cost scenario of $6/W results in an LCOE of just under 40 cents/kWh; the base-case scenario of $9/W results in an LCOE of approximately 60 cents/kWh; and the high-cost scenario of $12/W results in an LCOE of nearly 80 cents/kWh. Figure 13 also shows the diesel fuel costs per kilowatt-hour for each of the 11 villages in 2013 and 2014. Several interesting findings emerge from comparing the range of PV cost estimates ($6/W to $12/W) to the 2013 and 2014 fuel-only diesel electricity costs.
First, a select number of villages experience diesel electricity generating costs high enough that they are approaching or nearly on par with the LCOE from even the highest PV cost scenarios. These cases include Venetie for both 2013 and 2014 and Shungnak based on reported 2014 diesel prices.26 Under these cases, achieving cost savings from a PV installation appears among the most likely scenarios as PV installation prices of $9/W or more could be cost competitive with the reported diesel electricity generating costs. PV pricing falling below $9/W would show a larger economic savings.
Second, several other villages also show cases where diesel prices are still high enough that PV could potentially compete economically at the low-cost PV price scenario of $6/W. In addition to the high cost examples mentioned above, these villages include Ambler (2014), Shungnak (2013), Anaktuvak Pass (2014), Kasigluk (2013), and Adak (2014). In these examples, PV pricing at $6/W could be expected to result in economic savings when compared to the recent fuel expenditures.
Third, many villages appear to show cases where the PV LCOE could be considered marginally or borderline cost competitive, even at the assumed $6/W pricing level and diesel prices reported in 2013 and 2014. In these cases, the solar PV to diesel fuel cost comparison is considered within the level of specificity of these modeling results, so a more detailed investigation could produce results with favorable solar PV economics. These situations include Kasigluk (2013), Hughes (2013), Tenakee Springs (2013, 2014), Anaktuvuk Pass (2013), and Adak (2013). Finally, there are a few cases where the diesel fuel prices in some villages are below even the lowest estimated PV LCOE, and a solar PV installation does not appear to be economically competitive at the pricing levels assumed in this analysis. These cases include the villages of Yakutat, Wainwright, and St. Paul.
Importantly, and what is not captured in Figure 13, is the benefit of price predictability that solar PV can provide from zero fuel costs. As shown previously in Figure 7 and Sidebar 3, diesel fuel prices have experienced significant fluctuations from one year to the next and accurate price projections are difficult to make. Solar PV, by contrast, experiences the vast majority of its costs (with the exception of maintenance expenses) upfront and therefore offers a predictable energy price for the remainder of the system’s life—often 20 years or more. Additionally, because PV prices have historically been falling rapidly, a $6/W pricing point that is assumed as a low pricing scenario in the current analysis, could likely be reduced even further in the near future, particularly if the market for solar PV in Alaska begins to mature and efficiencies develop. 25 The full listing of LCOE results can also be found in Appendix B. Results are shown in cents per kWh rather than the equivalent $/kWh. Note that all results are presented in 2014 dollars. 26 The high diesel generation cost for the village of Hughes in 2013 appears as an outlier as significant diesel efficiency gains were reported in 2014 (AEA 2015).

Solar Energy Prospecting in Remote Alaska
21
Figure 13. Cost of electricity comparison between solar PV and diesel generation
0
20
40
60
80
100
120
140
Cost
of E
lect
ricty
(cen
ts/k
Wh)

Solar Energy Prospecting in Remote Alaska
22
Conclusion This analysis compares the cost of installing and operating a moderately sized solar PV system to recent diesel fuel expenditures for electricity generation for several remote villages across Alaska. The high-level results indicate there are plausible scenarios in which PV can be economically competitive with diesel fuel prices at low PV penetration levels. In this analysis, the cases where PV appears economically competitive generally required a combination of (1) high diesel fuel prices (at least 40 cents/kWh), (2) relatively low, for Alaska, PV prices (approximately $6 to $9 per W installed), (3) relatively high, for Alaska, solar production levels (capacity factor of nearly 10% or higher), and (4) the ability to make use of economically valuable tax benefits provided by the federal government. Solar development is likely to be favorable for other Alaskan villages not considered in this analysis but that have a similar combination of characteristics. However, to advance this high-level analysis to more precise estimates and eventually a large increase in deployed solar projects in Alaska, a select number of potential barriers noted previously will require further research or business ingenuity to address. Some of these barriers include, but are not limited to, the following.
• The integration of solar PV with a diesel generator is an ongoing area of study and demonstration. The simplifying integration assumptions, including seasonal variability, made in this analysis should be revised when better information is available.
• Regulatory and business structures such as how to work with the current PCE formula and how to utilize the valuable federal tax incentives will need to be addressed by the stakeholders involved.
• Further refinements in real-world installation and maintenance costs of large-scale PV systems in rural Alaska will provide more accurate inputs to the economic modeling.
Despite each of the simplifying assumptions made here, this analysis suggests that solar PV—along with fuel and other electricity savings measures—can be economically competitive in many remote Alaskan villages and could have a number of benefits including reducing a village’s dependency on diesel fuel, improving electricity price predictability, providing local environmental benefits, and more.

Solar Energy Prospecting in Remote Alaska
23
References Alaska.org. 2015. “Shortest Day in Alaska,” accessed January 20, 2016, http://www.alaska.org/advice/shortest-day-in-alaska.
Alaska Energy Authority (AEA). 2014a. Power Cost Equalization Program: Statistical Data by Community. Reporting Period: July 1, 2012 to June 30, 2013. Issued February 2014. http://www.akenergyauthority.org/Content/Programs/PCE/Documents/FY13StatisticalRptComt.pdf.
Alaska Energy Authority. 2014b. Power Cost Equalization Program Guide. Updated July 2014. http://www.akenergyauthority.org/Content/Programs/PCE/Documents/PCEProgramGuideJuly292014EDITS.pdf.
Alaska Energy Authority. 2015. Power Cost Equalization Program. Statistical Data by Community. Reporting Period: July 1, 2013 to June 30, 2014. Amended March 2015. http://www.akenergyauthority.org/Content/Programs/PCE/Documents/ FY14PCEStatisticalRptByComtAmended.pdf.
Alaska Energy Authority. 2016a. “Renewable Energy Fund,” accessed January 20, 2016, http://www.akenergyauthority.org/Programs/RenewableEnergyFund.
Alaska Energy Authority. 2016b. “Rural Power System Upgrade Program,” accessed January 20, 2016, http://www.akenergyauthority.org/Programs/RPSU.
Alaska Energy Authority. 2016c. “Solar Projects,” accessed January 20, 2016, http://www.akenergyauthority.org/Programs/AEEE/Solar/solarprojects.
Alaska Energy Authority. 2016d. Power Cost Equalization Program. Statistical Data by Community. Reporting Period: July 1, 2014 to June 30, 2015. Issued February 2016. http://www.akenergyauthority.org/Portals/0/Programs/PCE/Documents/ FY15PCEAnnualbyCommunity.pdf?ver=2016-02-09-072244-933.
Alternative Fuels Data Center (AFDC). 2014. “Fuel Properties Comparison.” October 29, 2015. http://www.afdc.energy.gov/fuels/fuel_comparison_chart.pdf.
Barbose, G., Darghouth, N., Millstein, D., Spears, M., Wiser, R., Buckley, M., Widiss, R., Grue, N. 2015. Tracking the Sun VIII. The Installed Price of Residential and Non-Residential Photovoltaic Systems in the United States. Lawrence Berkeley National Laboratory, Berkeley, California. August 2015. Accessed January 20, 2016. https://emp.lbl.gov/sites/all/files/lbnl-188238_1.pdf.
Bensin, R. 2015. Bering Straits Native Corporation, personal correspondence, May 7, 2015.
Cold Climate Housing Research Center (CCHRC). 2016. “Geothermal Heat Pumps,” accessed January 20, 2016, http://www.cchrc.org/ground-source-heat-pumps.

Solar Energy Prospecting in Remote Alaska
24
Drolet, J. 2014. “Power Cost Equalization: AEA Perspective.” Presented by Alaska Energy Authority. Alaska Rural Energy Conference, September 25, 2014. http://www.akruralenergy.org/2014/PCE-AEA's_Perspective-Jed_Drolet.pdf.
Energy Information Administration (EIA). 2014. “Electric Power Monthly: Table 5.6.A. Average Price of Electricity to Ultimate Customers by End-Use Sector, by State,” October 2015, accessed January 20, 2016, http://www.eia.gov/electricity/monthly/epm_table_grapher.cfm?t=epmt_5_6_a.
Energy Information Administration. 2015. Levelized Cost and Levelized Avoided Cost of New Generation Resources in the Annual Energy Outlook 2015. Annual Energy Outlook 2015. June 3, 2015. http://www.eia.gov/forecasts/aeo/electricity_generation.cfm.
Energy Information Administration. 2016a. “Petroleum and Other Liquids. U.S. No 2 Diesel Wholesale/Resale Price by Refiners,” January 4, 2016, accessed January 20, 2016, http://www.eia.gov/dnav/pet/hist/LeafHandler.ashx?n=PET&s=EMA_EPD2D_PWG_NUS_DPG&f=A.
Energy Information Administration. 2016b. “Short Term Energy Outlook. Real Prices Viewer. Diesel Fuel Retain Prices” January 12, 2016. Accessed February 5, 2016, http://www.eia.gov/forecasts/steo/realprices/.
Fay, G., Meléndez, A., and SchwÖrer, T. 2012. Power Cost Equalization Funding Formula Review. Prepared by the Institute of Social and Economic Research, University of Alaska Anchorage, for the National Renewable Energy Laboratory, Golden, CO, March 2012. Accessed February 5, 2016. http://www.iser.uaa.alaska.edu/Publications/2012_03_14-NREL_PCEfinal.pdf.
Forgey, P. 2015. “Alaska lawmakers look to once-forbidden sources for money,” Alaska Dispatch News, March 22, 2015, accessed February 5, 2016. http://www.adn.com/article/20150322/alaska-lawmakers-look-once-forbidden-sources-money.
Foster, M.A., Yanity, B., Holt, B., and Hermanson, J. 2013. Renewable Energy in Alaska. NREL/SR-7A40-47176. Prepared by WH Pacific, Inc. for the National Renewable Energy Laboratory on behalf of the U.S. Department of Energy, Golden, CO, March 2013. Accessed January 5, 2016. http://www.nrel.gov/docs/fy13osti/47176.pdf.
Galena City School District. 2012. “Galena Solar Energy Project,” accessed January 20, 2016, http://www.galenaalaska.org/solar.html.
Gerdes, J. 2015. “The Triumph of Clean Energy,” Alaska Beyond. Alaska Energy Magazine, April 2015, accessed January 20, 2016, http://www.paradigmcg.com/digitaleditions/aam-0415/index.html.
Goldsmith, S. 2008. Understanding Alaska’s Remote Rural Economy. UA Research Summary No. 10, January 2008, Institute for Social and Economic Research, University of Alaska Anchorage. Accessed January 20, 2016. http://www.iser.uaa.alaska.edu/Publications/researchsumm/UA_RS10.pdf.
Hirsch, B. 2015. “A partial solution to rural Alaska energy challenges,” Alaska Dispatch News, October 24, 2015, accessed January 20, 2016, http://www.adn.com/article/20151024/partial-solution-rural-alaska-energy-challenges.

Solar Energy Prospecting in Remote Alaska
25
Irwin, C. 2013. “Displacing Diesel May Prove Cost-Prohibitive in Rural Alaska,” Breaking Energy, August 1, 2013, accessed January 20, 2016, http://breakingenergy.com/2013/08/01/displacing-diesel-may-prove-cost-prohibitive-in-rural-alaska/.
Jensen, R., Baca, M., Schenkman, B., and Brainard, J. 2013. Venetie, Alaska Energy Assessment. SAND2013-6185. Sandia National Laboratories, Albuquerque, NM, July 29, 2013. Accessed January 20, 2016. http://prod.sandia.gov/techlib/access-control.cgi/2013/136185.pdf.
Johnson, K. 2015. “As Oil Prices Fall, Alaska’s New Governor Faces a Novel Goal, Frugality,” New York Times, January 25, 2015, accessed January 20, 2016, http://www.nytimes.com/2015/01/26/us/as-oil-falls-alaskas-new-chief-faces-a-novel-goal-frugality.html?_r=1.
Mathiasson, I. 2015a. “2011 NAB Synergy Project.” 2015 Alaska Solar Energy Workshop, accessed January 20, 2016. http://acep.uaf.edu/media/131247/2015-SEW-Case-Studies-from-Around-the-State-Solar-PV-PCE-Calculations-Ingemar-Mathiasson.pdf.
Mathiasson, I. 2015b. Northwest Arctic Borough, personal correspondence, December 7, 2015.
Mueller-Stoffels, M. 2014. Adding PV Capacity: Initial Assessment and Recommendations for Galena, Alaska. Alaska Center for Energy and Power, University of Alaska Fairbanks. January 2014. Accessed January 20, 2016. http://acep.uaf.edu/media/82430/initialAssessmentReport-3.pdf.
NREL. 2011. “CREST Cost of Energy Models,” Renewable Energy Project Finance, National Renewable Energy Laboratory, accessed January 20, 2016, https://financere.nrel.gov/finance/content/crest-cost-energy-models.
NREL. 2013. “Renewable Energy In Alaska”. WH Pacific, Inc. National Renewable Energy Laboratory, accessed February 5, 2016. http://www.nrel.gov/docs/fy13osti/47176.pdf.
NREL. 2015. “PVWatts Calculator,” National Renewable Energy Laboratory, accessed January 20, 2016, http://pvwatts.nrel.gov/.
Pelunis-Messier, D. 2014. “Interior Alaska’s Solar Resource.” 2014 Rural Energy Conference, accessed January 20, 2016, http://www.akruralenergy.org/2014/Opportunities_for_Solar_PV_in_Alaska's_Interior-David_Pelunis-Messier.pdf.
Pelunis-Messier, D. 2015. Personal correspondence, December 7, 2015.
Renewable Energy Alaska Project (REAP). 2016. “Alaska’s Renewable Energy Projects,” accessed January 20, 2016, http://alaskarenewableenergy.org/why-renewable-energy-is-important/alaskas-renewable-energy-projects/.
Suncalc. 2015. “Computation path of the sun for Kotzebue, Alaska, and Denver, Colorado,” accessed January 20, 2016, www.suncalc.org.

Solar Energy Prospecting in Remote Alaska
26
Time and Date. 2015. “Today’s Sun Position,” Time and Date AS, accessed January 20, 2016, http://www.timeanddate.com/astronomy/usa/denver.
Wirth, H. 2015. Recent Facts about Photovoltaics in Germany. Fraunhofer ISE, Freiburg, Germany, December 25, 2015. Accessed January 20, 2015. https://www.ise.fraunhofer.de/en/publications/veroeffentlichungen-pdf-dateien-en/studien-und-konzeptpapiere/recent-facts-about-photovoltaics-in-germany.pdf.

Solar Energy Prospecting in Remote Alaska
27
Appendix A. Model Overview and Description The analysis utilized an NREL-developed cost-of-energy spreadsheet model intended to assist in the evaluation of the costs of an electricity generation system for a representative remote Alaskan town (model schematic depicted in Figure 14. The model calculates the cost of energy for three different types of load: Primary, Deferrable, and Thermal, based on inputs defining project installation (size, capital costs, etc.), financing, and operational costs and the ratios of each generation price and load type. Users can choose to run the model in one of three calculation modes: Target Internal Rate of Return, Target Payback Period, or Target Energy Cost, holding that variable constant and returning values for the other two variables along with debt metrics, fuel savings, and other costs.
For this analysis, all revenue was assumed to be generated from the AC Primary Load, thus the inputs for the Deferrable Load and Thermal Load were set to zero. In addition to the inputs shown in Table 1 and Table 2, this analysis also assumed that the project was financed with 100% equity, generated an 8% Internal Rate of Return, and that both the LCOE and annual O&M expenditures increased by 1.5% annually.
Figure 14. Schematic of LCOE model used in this analysis

Solar Energy Prospecting in Remote Alaska
28
Appendix B. Levelized Cost of Energy Results Table 4 shows the solar PV LCOE for each of the 11 villages under analysis for the low-cost, base-case, and high-cost scenarios.
Table 4. Solar PV LCOE Modeling Results
Low-Cost Base-Case High-Cost Village (¢/kWh) (¢/kWh) (¢/kWh) Venetie $39.91 $59.44 $78.96 Kasigluk $44.29 $65.95 $87.62 Hughes $44.93 $66.91 $88.89 Tenakee Springs $45.90 $68.35 $90.80 Ambler $47.13 $70.19 $93.24 Shungnak $47.13 $70.19 $93.24 Anaktuvuk Pass $47.74 $71.09 $94.44 Yakutat $54.97 $81.86 $108.75 Wainwright $55.01 $81.92 $108.83 Adak $59.79 $89.03 $118.28 St. Paul $65.27 $97.20 $129.12