solar and wind power iowa s future
TRANSCRIPT
Solar and Wind Power – Iowa’s Future
William Haman, P.E.
Wind & Solar Energy Conference
February 26, 2013

Who is the Iowa Energy Center?
• A Little History
– Created by the 1990 Iowa Energy Efficiency Act
– Funded by surcharge on intra-state electric & gas sales
• 0.085% of gross revenues
• ~ $3,900,000 annual budget
– Administered by Iowa State University
– Work with Iowa’s colleges, universities & private nonprofits
– Guided by a 13 member advisory council
• Mission is to sponsor and conduct research,
demonstration & information dissemination
– Energy efficiency
– Alternate energy systems
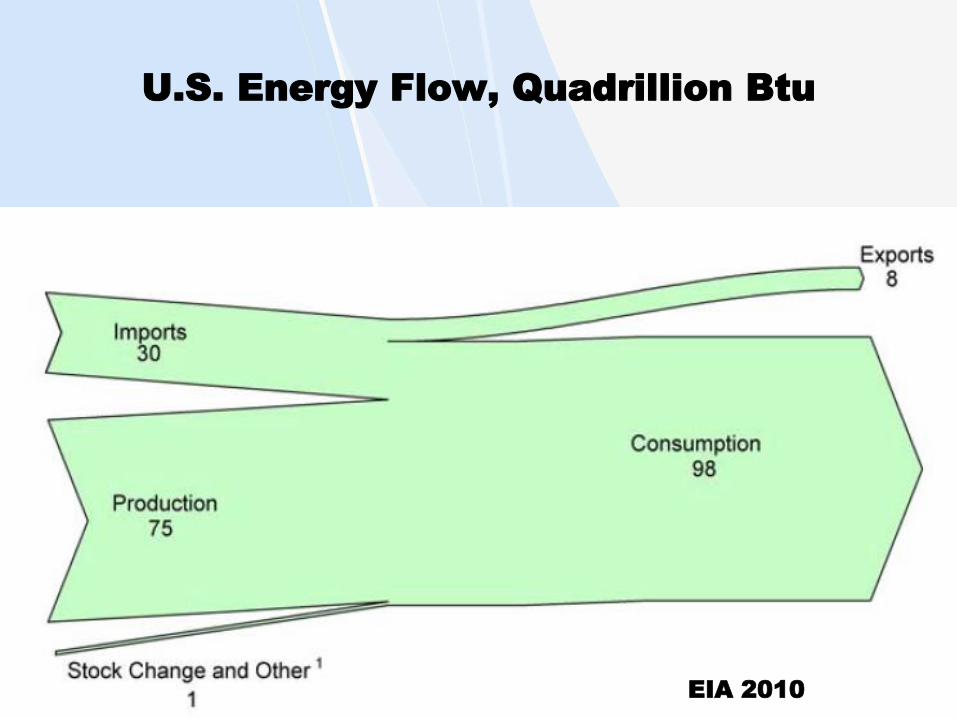
U.S. Energy Flow, Quadrillion Btu
EIA 2010

U.S. Energy Flow, Quadrillion Btu
EIA, 2010

U.S. Energy Overview Trend, EIA 2010

U.S. Energy Production Trend, EIA 2010
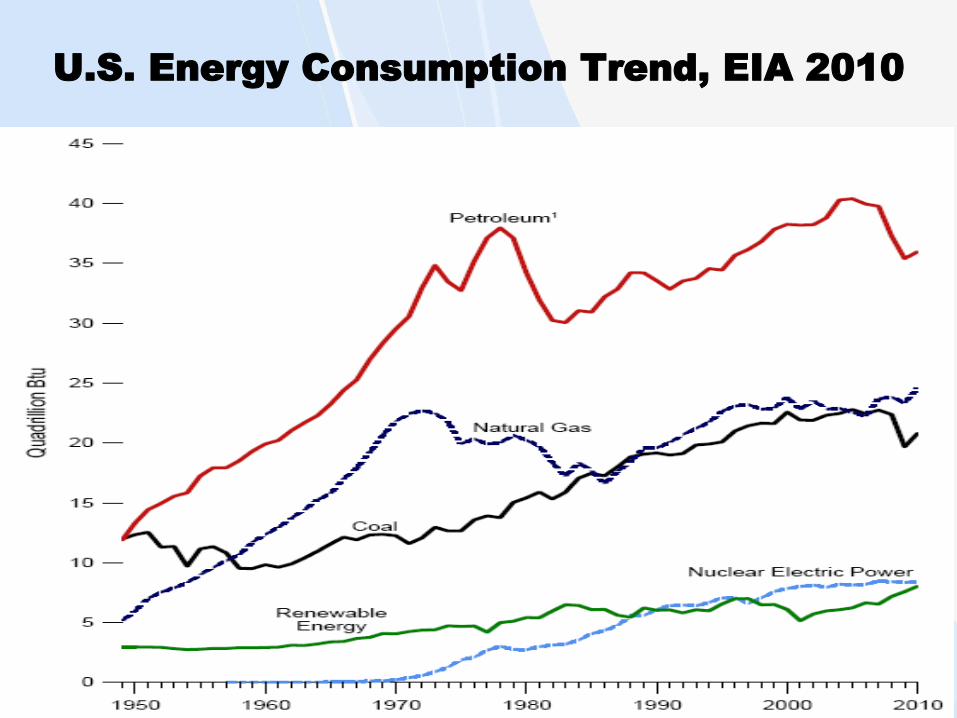
U.S. Energy Consumption Trend, EIA 2010
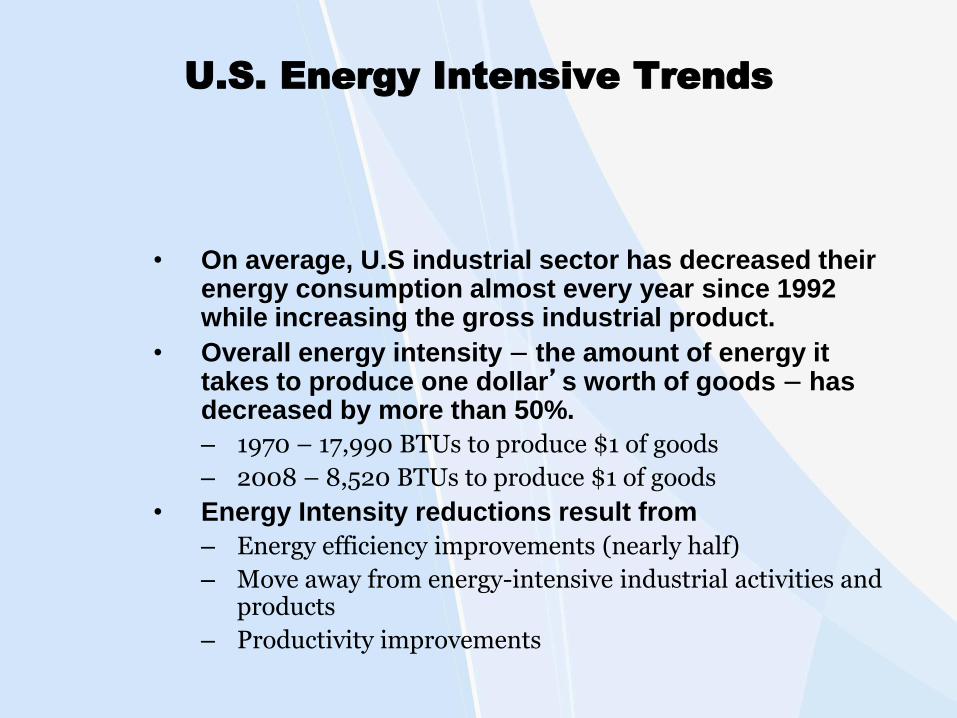
U.S. Energy Intensive Trends
• On average, U.S industrial sector has decreased their energy consumption almost every year since 1992 while increasing the gross industrial product.
• Overall energy intensity – the amount of energy it takes to produce one dollar’s worth of goods – has decreased by more than 50%.
– 1970 – 17,990 BTUs to produce $1 of goods
– 2008 – 8,520 BTUs to produce $1 of goods
• Energy Intensity reductions result from
– Energy efficiency improvements (nearly half)
– Move away from energy-intensive industrial activities and products
– Productivity improvements
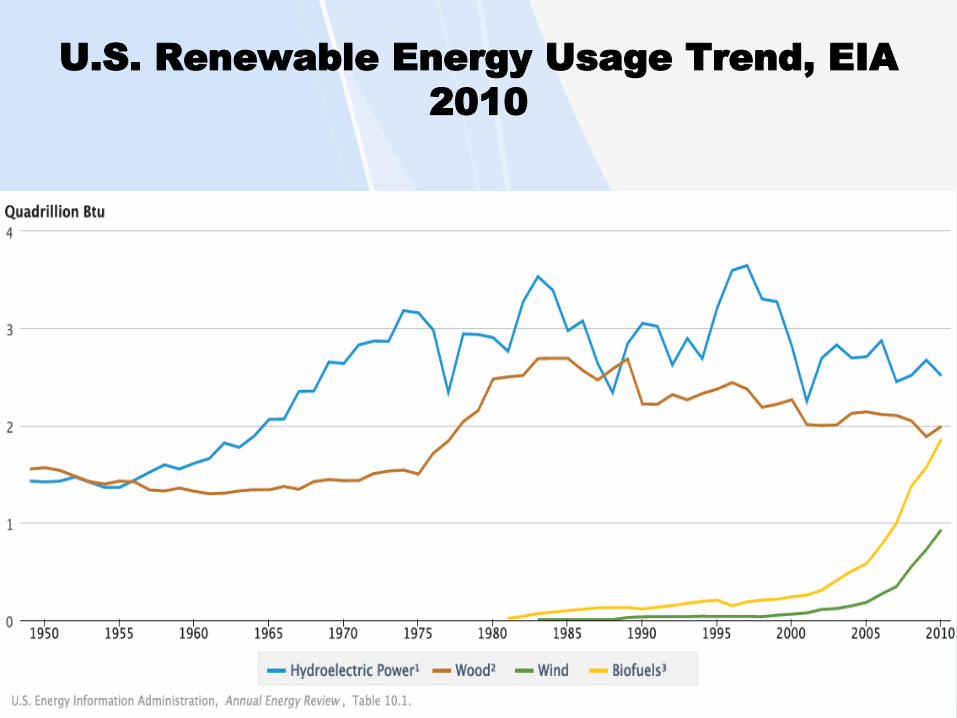
U.S. Renewable Energy Usage Trend, EIA
2010

What is Wind?
• Wind is a byproduct of solar energy
• Approximately 2% of solar energy reaching the earth is
converted to wind
• Wind results from
– uneven heating & cooling of earth
– creates atmospheric pressure gradients
– gradients force air movement from areas of high pressure to low pressure

Physics of Wind Power
• Power = ½ρAv3η
ρ = specific gravity of air
• function of air temperature and elevation
A = cross sectional area of swept blades
v = wind velocity
• function of height above ground
• V2 = V1 ( H2 / H1 ) 0.2
η = loss factor
• function of wind direction relative to turbine orientation
• function of ground turbulence effects
• function of turbine design

Swept Area for Turbine Blades
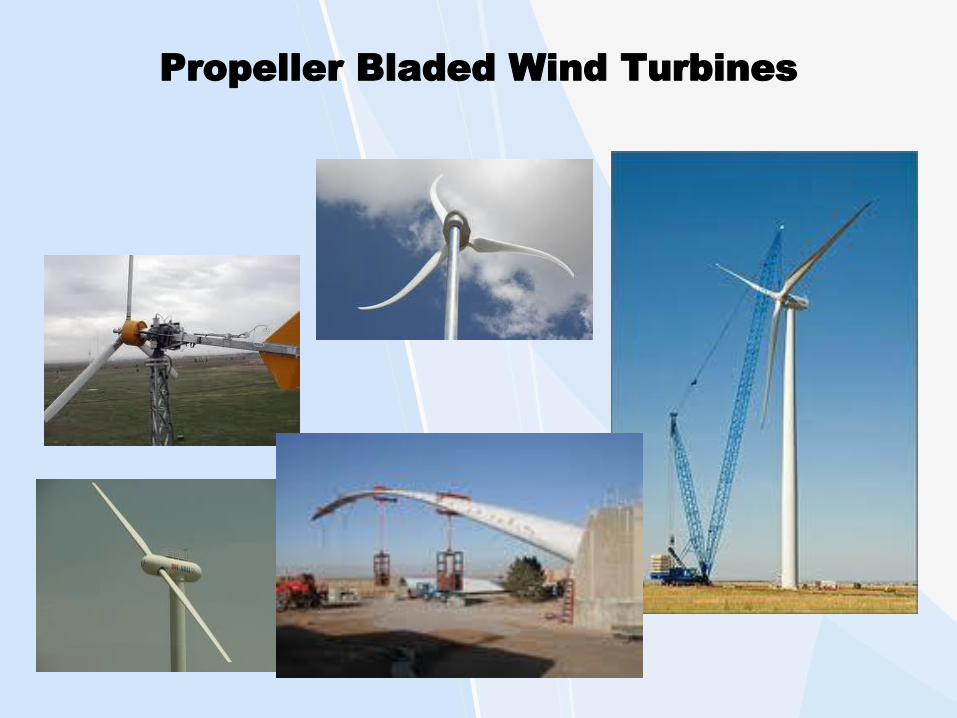
Propeller Bladed Wind Turbines
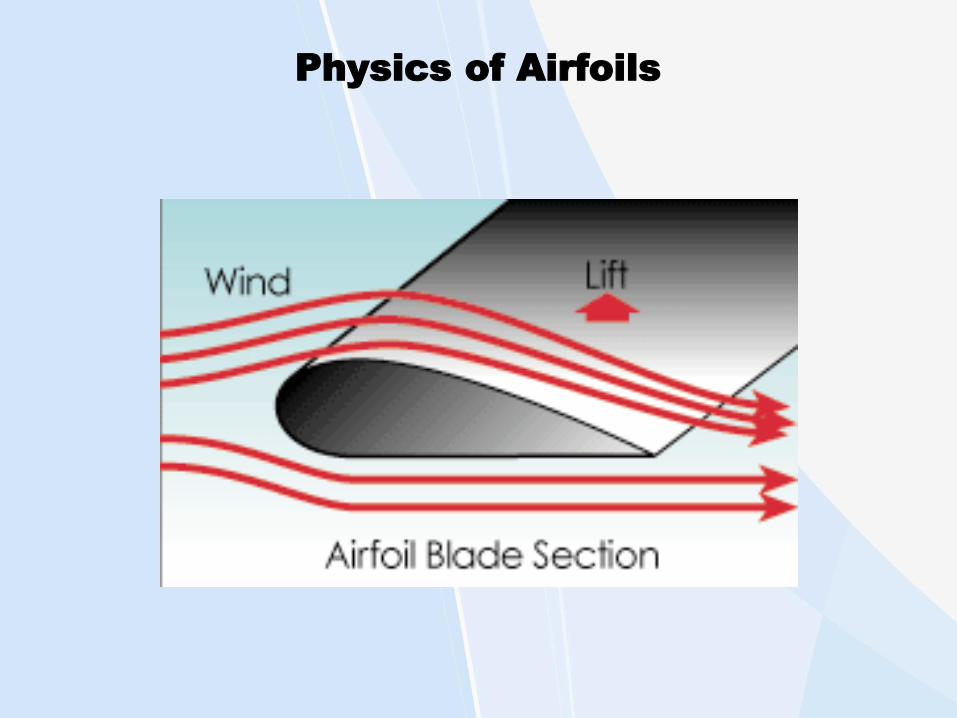
Physics of Airfoils

U.S. Wind Resources, 80 m

US Wind Farm Locations
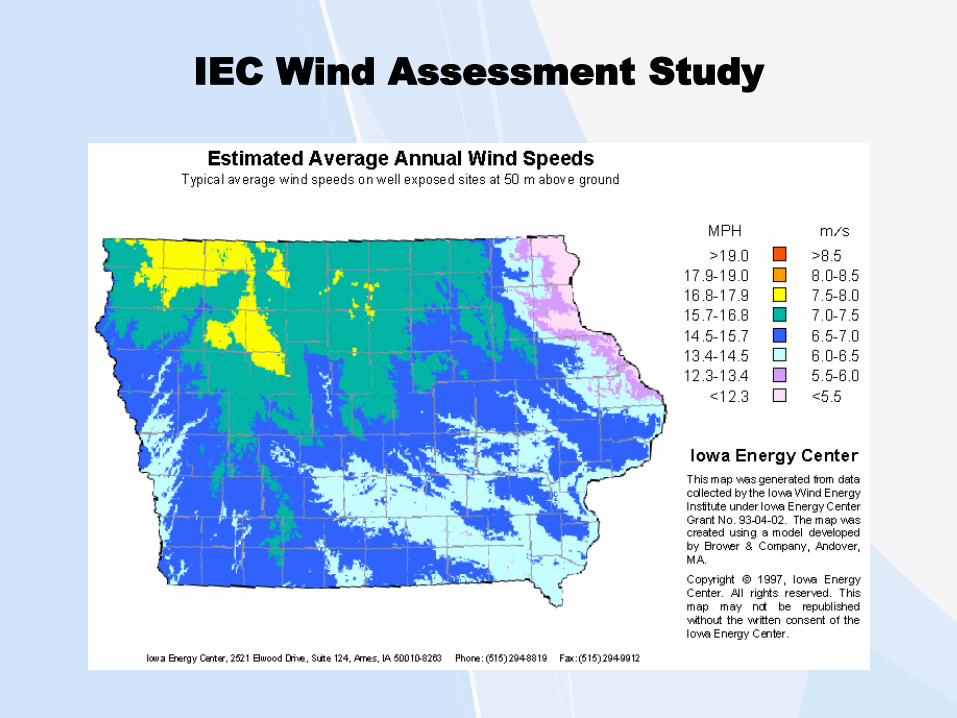
IEC Wind Assessment Study

January February
March April
IEC Wind Assessment Study

May
July August
June
IEC Wind Assessment Study

IEC Wind Assessment Study
November
September
December
October
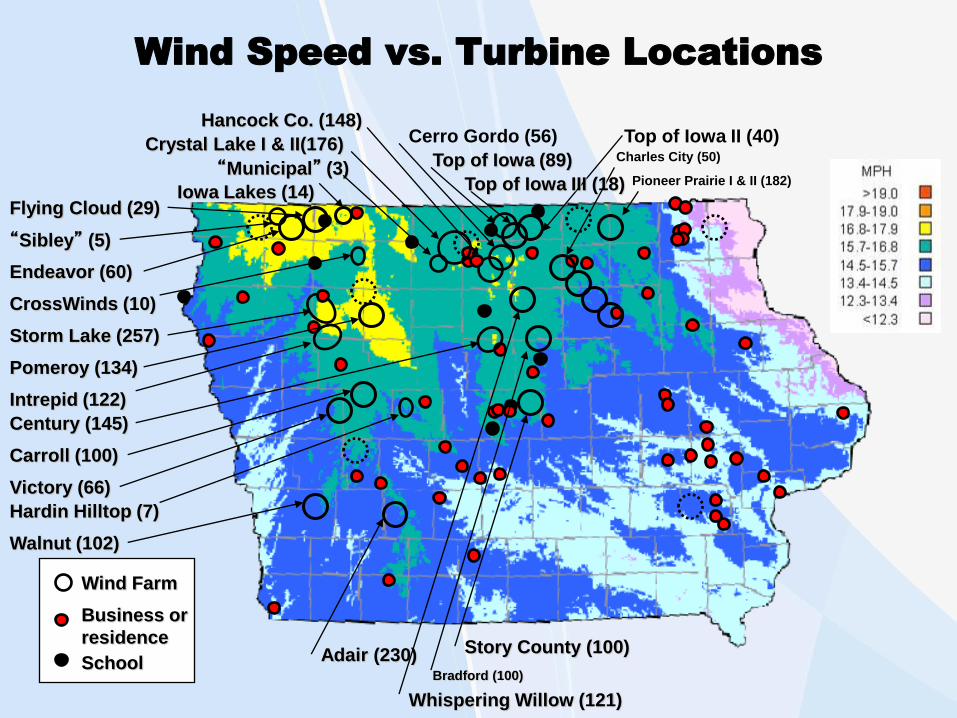
Wind Speed vs. Turbine Locations
Business or
residence
School
Wind Farm
“Sibley” (5)
Storm Lake (257)
Flying Cloud (29)
“Municipal” (3)
Hancock Co. (148)
Top of Iowa (89)
Cerro Gordo (56)
Intrepid (122)
Century (145)
Hardin Hilltop (7)
CrossWinds (10)
Top of Iowa II (40)
Endeavor (60)
Pomeroy (134)
Charles City (50)
Story County (100)
Crystal Lake I & II(176)
Walnut (102)
Adair (230)
Pioneer Prairie I & II (182) Top of Iowa III (18) Iowa Lakes (14)
Bradford (100)
Whispering Willow (121)
Victory (66)
Carroll (100)

Status of Wind Energy in Iowa
• Wind Facts
– Iowa is the nation’s 7th windiest state and ranks 3rd in total wind energy generation behind Texas & California
– Approximately 5,137 MW installed capacity
– No new or planned/under construction capacity
– ~ 3,400 existing utility-scale turbines (>50 kW)
– Percentage of Iowa power from wind in 2012: ~20%
• Iowa ranked first in the US in 2011 for percentage of electricity derived from wind.
– Iowa wind farms now online power the equivalent of more than 1,200,000 homes
– Many farm/residential units (300-400)

Wind Power Economic Viability
• Economic viability is a
function of:
– wind resource (mph)
– value of energy ($/kWh)
• Multiple scenarios
– high wind resource + high energy value
– high wind resource + low energy value
– low wind resource + high energy value
– average wind resources + average energy value
• Cost-to-Benefit Analysis
Wind
Resource
Energy Value
Economic
Viability

Wind Energy Costs
• Capital costs are declining
– technology advancements
– economies of scale
– utility scale wind farms are competitive with new fossil fuel power plants ($0.041 - 0.045/kWh)
• Installed costs
– small/residential (< 10 kW) - $9,500 - $4,500/kW
– medium/commercial (10 – 600 kW) - $4,500 - $2,000/kW
– large/utility scale (600 – 2,100 kW) - $2,000 - $1,600/kW
• Maintenance costs
– $0.005 - $0.01/kWh
– increases with age of turbine
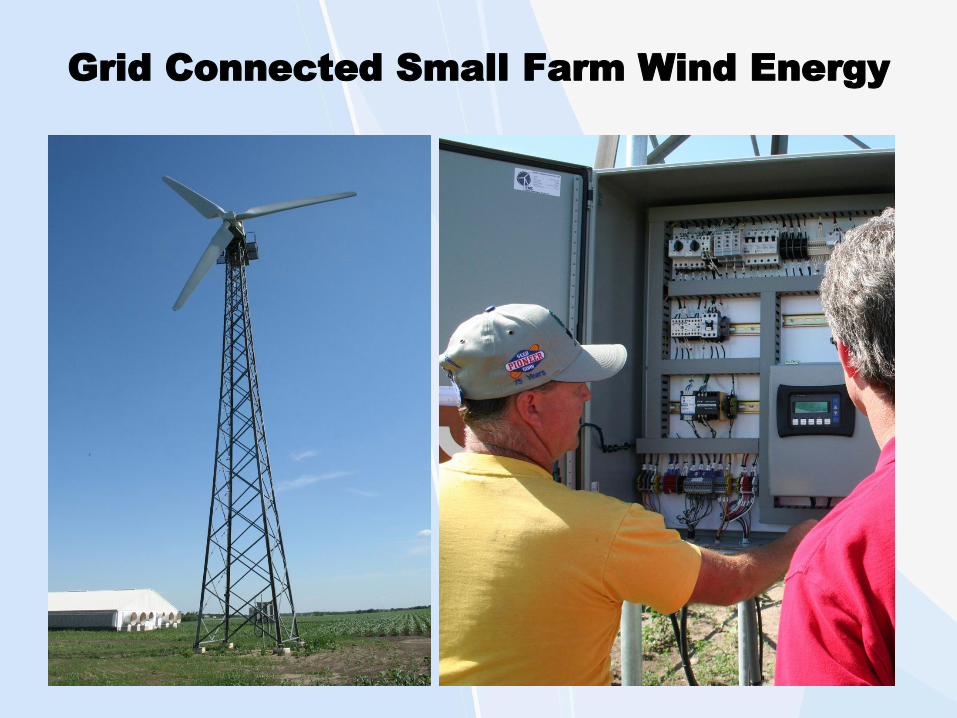
Grid Connected Small Farm Wind Energy

School District Wind Turbine Project
• Owner
– Spirit Lake CSD
• Location
– Spirit Lake, IA
• Equipment
– N.E.G. Micon 750kW
• Notes
– online October 2001
– project cost = $780,000
– projected savings = $115,327/yr.
– actual savings = $112,235/yr.
– 6.9 year payback
– production = 1,550,000 kWh/yr (10/’01 – 10/’03)
– usage = 1,755,000 kWh/yr
– production = 88% of usage
– $250,000 – 10 yr. AERLP funds

Hardin Hills - Community Wind Farm
• Located near Jefferson, IA
• Online May 2007
• 7 Local LLC Owners – Equity Partner – Edison Mission – Flip Arrangement
• 7 - Suzlon S88 (2.1 MW) – On 80 meter tubular tower – 88 meter blades
• Performance – Annual generation = 6,920,000
kWh/unit – Power for about 4,800 homes
• Total Installed Cost – $2,890,000 per turbine
• Financing – AERLP = $250,000 (9 yr.) – USDA Grant = $234,000 - $270,000
• Incentives – Federal Production Tax Credit – State Production Tax Credit – Property Tax Abatement


Solar Energy Introduction
• Three general types of solar energy:
– Passive
• Used for space heating and cooling
– Active
• Used for space heating and domestic hot water
– Photovoltaic
• Production of electricity from solar radiation
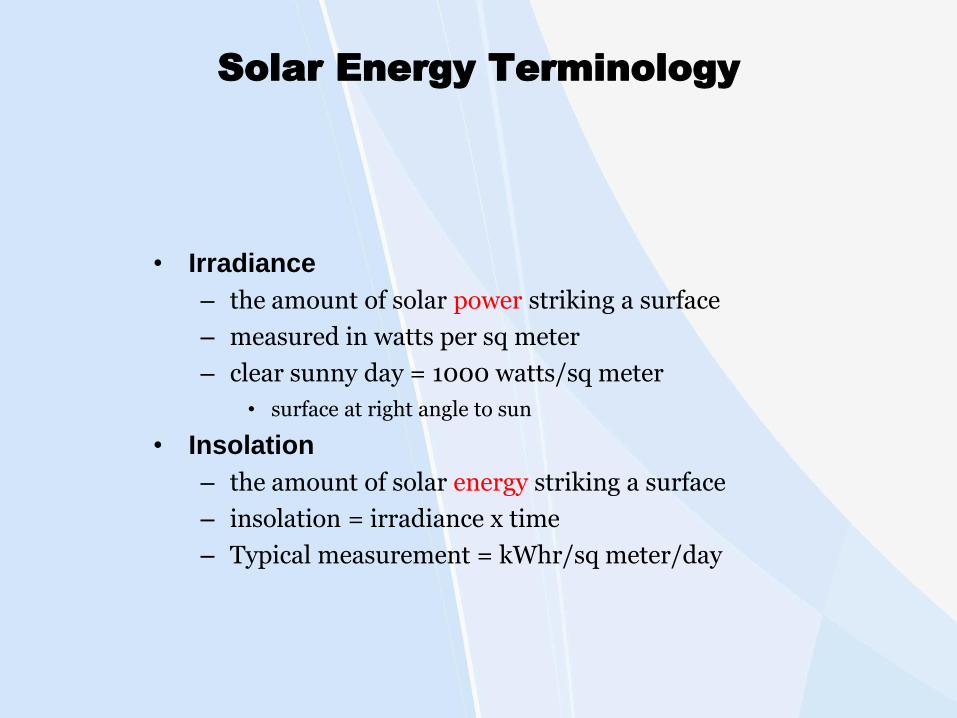
Solar Energy Terminology
• Irradiance
– the amount of solar power striking a surface
– measured in watts per sq meter
– clear sunny day = 1000 watts/sq meter
• surface at right angle to sun
• Insolation
– the amount of solar energy striking a surface
– insolation = irradiance x time
– Typical measurement = kWhr/sq meter/day

Types of Irradiance
Courtesy of the NREL Renewable Resource Data
Center (RReDC).
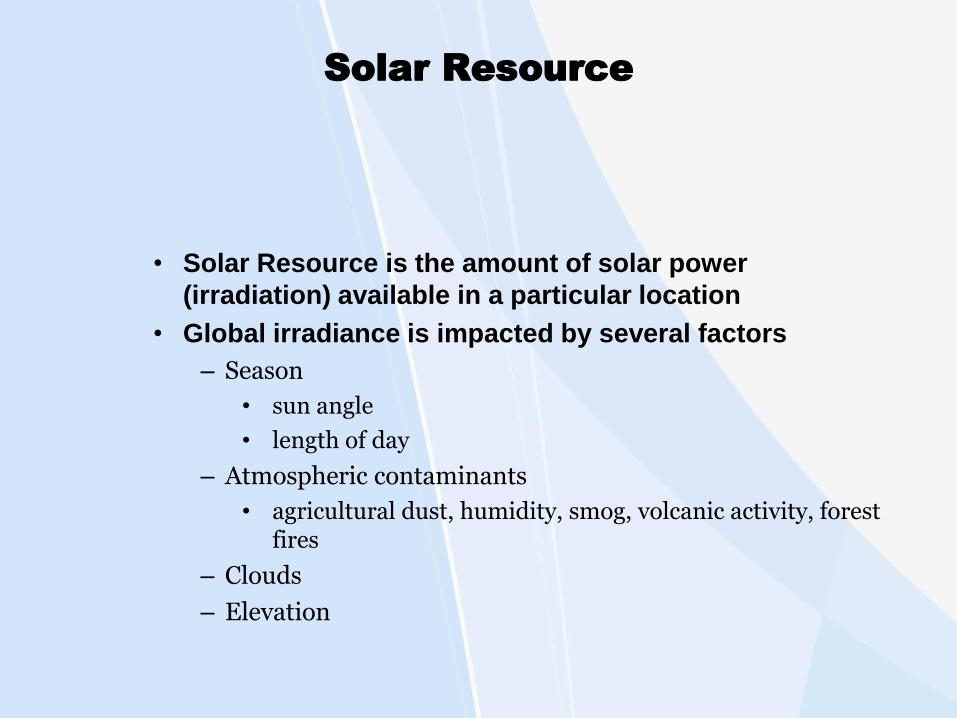
Solar Resource
• Solar Resource is the amount of solar power
(irradiation) available in a particular location
• Global irradiance is impacted by several factors
– Season
• sun angle
• length of day
– Atmospheric contaminants
• agricultural dust, humidity, smog, volcanic activity, forest fires
– Clouds
– Elevation
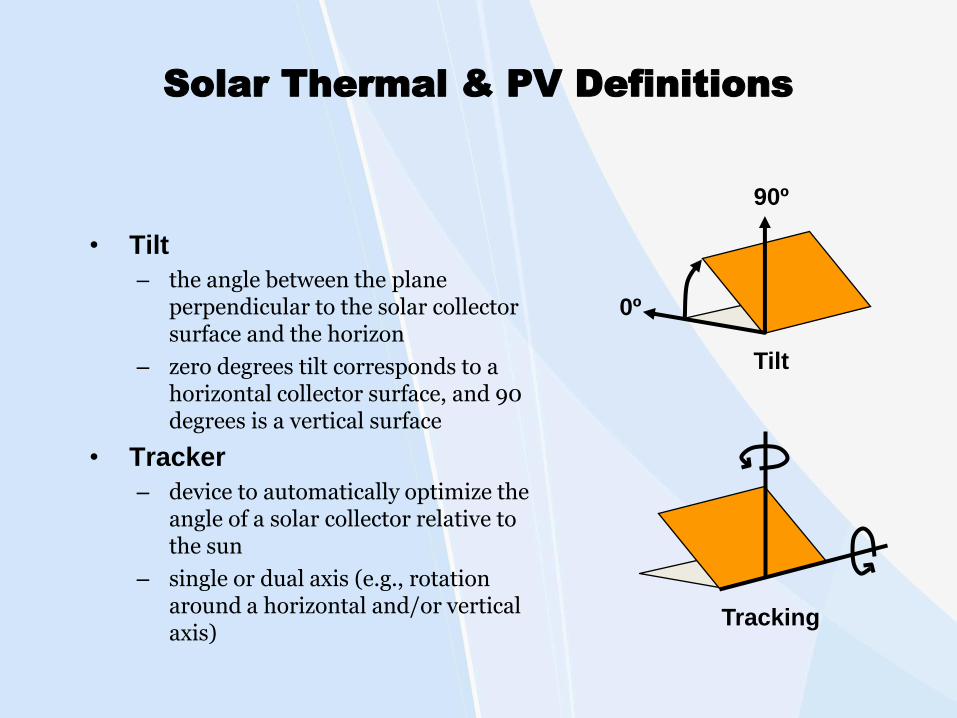
Solar Thermal & PV Definitions
• Tilt
– the angle between the plane perpendicular to the solar collector surface and the horizon
– zero degrees tilt corresponds to a horizontal collector surface, and 90 degrees is a vertical surface
• Tracker
– device to automatically optimize the angle of a solar collector relative to the sun
– single or dual axis (e.g., rotation around a horizontal and/or vertical axis)
0º
90º
Tilt
Tracking
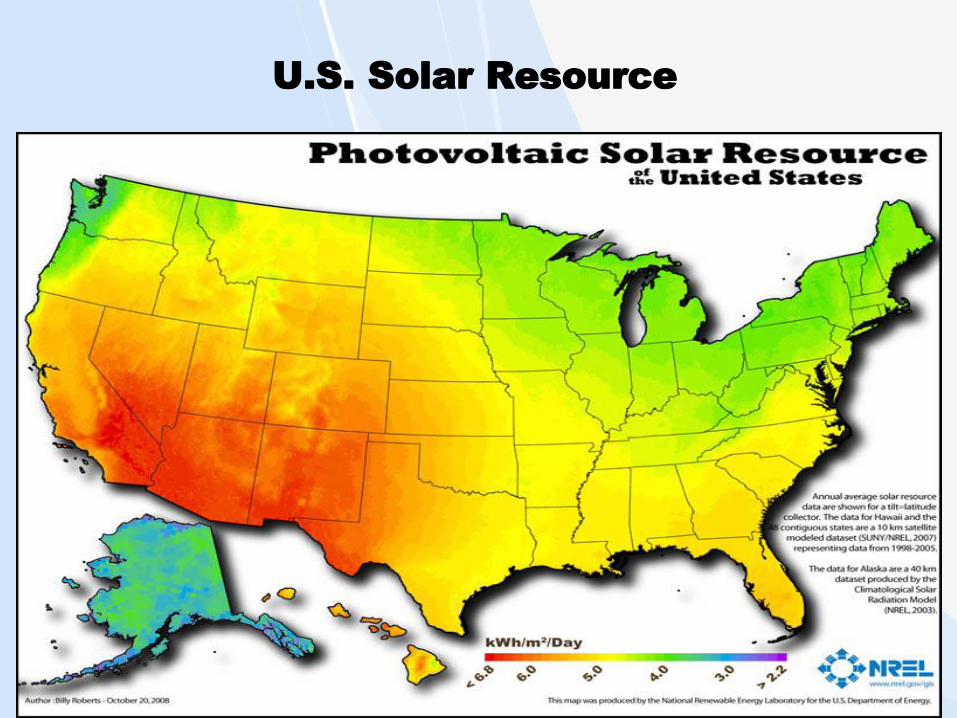
U.S. Solar Resource

Iowa’s Solar Resource

Iowa’s Solar Resource
PV System Components
• Cells, Modules or Arrays
• Mounting structures – ground or roof mounted – fixed or tracking capabilities
• Energy conversion – power inverter (dc to ac)
• Switches, wiring, protective devices
• Energy storage devices – battery banks – grid connection

Silicon PV
Module
Solar Energy: Photovoltaic
Battery Storage
DC Load
Inverter
AC Load

Solar PV Residential Interconnection

Photovoltaic Building Blocks
• PV cell
– basic unit of PV system
– rated 1-4 watts @ ½ vdc
• PV module
– series of connected cells
– 10 – 320 watts @ 6 – 36 vdc
• PV array
– series of connected modules
– up to 600 vdc
From Florida Solar Energy Center

Typical PV Modules
Single-crystalline Multi-crystalline
Thin Film Amorphous Silicon
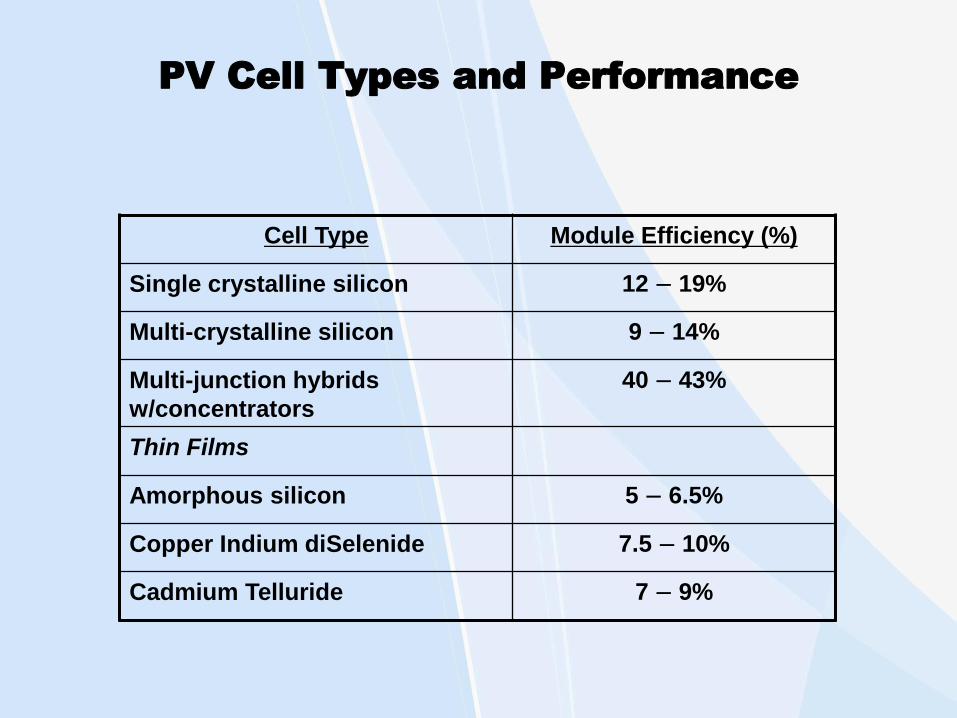
PV Cell Types and Performance
Cell Type Module Efficiency (%)
Single crystalline silicon 12 – 19%
Multi-crystalline silicon 9 – 14%
Multi-junction hybrids
w/concentrators
40 – 43%
Thin Films
Amorphous silicon 5 – 6.5%
Copper Indium diSelenide 7.5 – 10%
Cadmium Telluride 7 – 9%
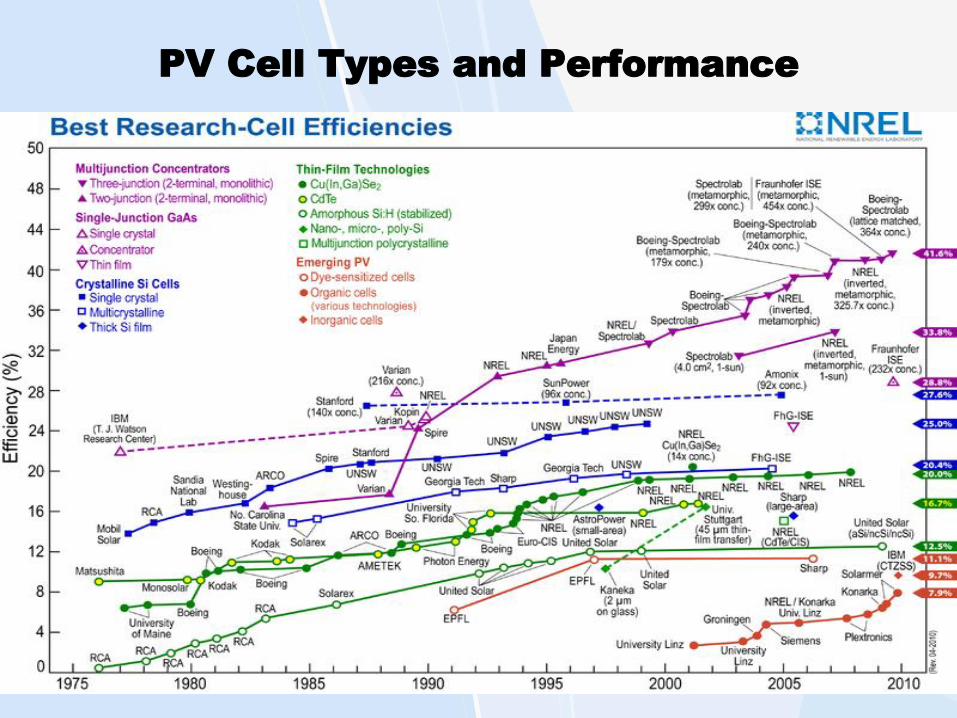
PV Cell Types and Performance

Typical PV System Losses
Type Loss (%)
Wiring 2%
Module Mismatch 2%
Inverter 10%
Soiling 4 – 8%
Orientation (tilt & shading) 0 – 15%
Total 18 – 37%
Note: Cell temperatures above 25 C may decrease performance

Photovoltaic Energy
• Advantages
– Excellent for remote applications
– No moving parts
– Very durable components
– Flexible sizing of systems
• Expansion can be simple
– Can be installed on or off a building
– Commercial systems are well tested; industry standards exist
• Disadvantages – High cost relative to other
renewable systems – Significant roof or land areas
required for large systems – Battery storage required for
off-grid systems
• Batteries are expensive and can be hazardous
– Can be unsightly
• Generally will be installed on south or west facing roof
– Building permits and inspections are likely to be required
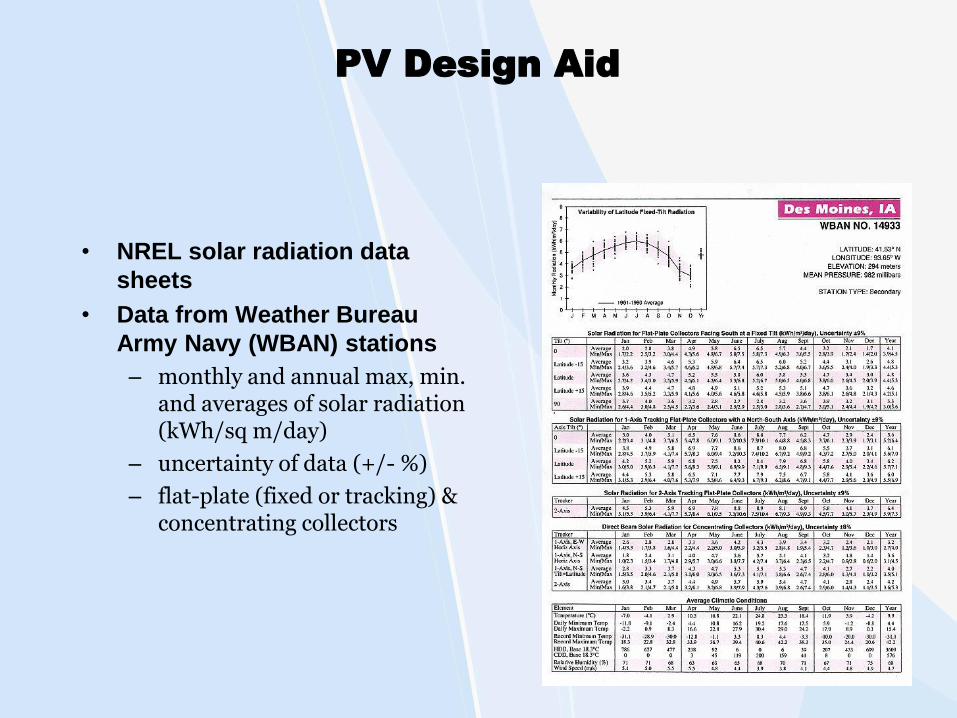
PV Design Aid
• NREL solar radiation data
sheets
• Data from Weather Bureau
Army Navy (WBAN) stations
– monthly and annual max, min. and averages of solar radiation (kWh/sq m/day)
– uncertainty of data (+/- %)
– flat-plate (fixed or tracking) & concentrating collectors


Simple PV System Sizing Example
• Assumptions
– Location: Des Moines, IA
– Roof orientation = 0o due south; tilt = 22.5
o (pitch 5 on 12)
– PV module peak rating : 200 watts
– System Losses = 15%
– Daily energy demand = 30 kWh (avg of 900 kWh/month)
• Look Up
– Average annual daily insolation = 4.8 kWh/m2/day or 4.8 solar hrs.
• Calculate Module Output
– Energy = (4.8 hrs. x 200 watts x 0.85)/1000 W/kW = 0.816 kWh
• Determine System Array Size
– Module Quantity = 30 kWh/0.816 kWh/module = 37 modules
– System Rating = 37 modules x 0.2 kW = 7.4 kW

Challenges/Opportunities for Solar Energy
• Historically high capital cost ($7- $10 /installed watt)
• Recent opportunities
– 2009-2012 economic recession has depressed the world market for solar panels
– World surplus of polycrystalline silicon
– Record low panel cost ( < $1 - $2/watt)
– Installed cost $3.50 - $5 per installed watt
• General lack of Iowa-specific data
– Relatively few solar PV installations; most are not monitored
• General lack of specialized contractors
– North American Board of Certified Energy Practitioners (NABCEP)
• Ten certified professionals in Iowa
• Urban based permitting issues

Solar PV - Wind Hybrid System

Solar Installation
• Solar hot water system
– Solarhart system
– 80 gal. storage tank with heat exchanger jacket
– Ethylene glycol anti-freeze thermosyphon exchange
• PV system
– 10-Astropower panels
– 120 watts/panel
– Zomeworks U2000 passive tracker

PV Power Center Installation
• Power Control System
– Trace 4024 inverter
– Trace inverter bypass
– Solar Boost charge controller
• lowers charge voltage to 24 volts and increases charging amps
– Trace battery disconnect and overcurrent protection
• Power Storage System
– 12 GNB 12-volt, 90 amp battery bank
– 610 amp-hr capacity
– wired for 24-volt


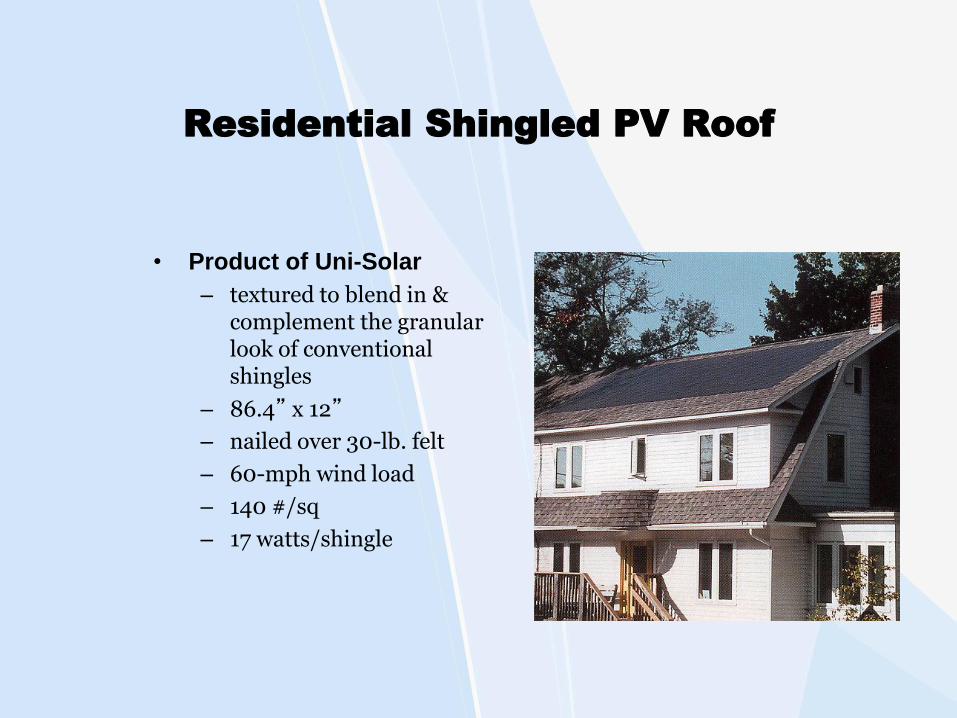
Residential Shingled PV Roof
• Product of Uni-Solar
– textured to blend in & complement the granular look of conventional shingles
– 86.4” x 12”
– nailed over 30-lb. felt
– 60-mph wind load
– 140 #/sq
– 17 watts/shingle

Standing Seam PV Roof

Iowa Energy Center Stationary PV

Iowa Energy Center Tracker PV

Iowa Energy Center Tracker PV
? Questions ?
Iowa Energy Center
www.iowaenergycenter.org
515-294-8819