solano county transportation authority · solano county transportation authority short range...
TRANSCRIPT

Solano County Transportation Authority Short Range Transit Plan SolTrans
DocRef
Issue | June 18, 2013
This report takes into account the particular instructions and requirements of our client.
It is not intended for and should not be relied upon by any third party and no responsibility is undertaken to any third party. Job number Job number
Arup North America Ltd 560 Mission Street Suite 700 San Francisco 94105 United States of America www.arup.com

DocRef | Issue | June 18, 2013 | Arup North America Ltd S:\SOLTRANS\ELIZABETH\MEETINGS AND PRESENTATIONS\BOARD MEETING\6-27-2013\COORDINATED SRTP\ATTACHMENT A. SOLTRANS FINAL DRAFT SRTP.DOCX
Document Verification
Job title Short Range Transit Plan Job number
Job number Document title SolTrans File reference
Document ref DocRef Revision Date Filename Document2 SO A S S ( i l) 2013 06 18 18 d Issue Jun 18,
2013 Description Final Draft
Prepared by Checked by Approved by
Name Corey Wong Al Zahradnik Corey Wong / Tony Bruzzone
Signature Filename
Description
Prepared by Checked by Approved by
Name
Signature Filename
Description
Prepared by Checked by Approved by
Name
Signature Issue Document Verification with Document

Solano County Transportation Authority Short Range Transit Plan SolTrans
DocRef | Issue | June 18, 2013 | Arup North America Ltd S:\SOLTRANS\ELIZABETH\MEETINGS AND PRESENTATIONS\BOARD MEETING\6-27-2013\COORDINATED SRTP\ATTACHMENT A. SOLTRANS FINAL DRAFT SRTP.DOCX
Solano County Transit Short Range Transit Plan FY2012-13 to FY2022-23 [Date Approved by Governing Board] [Date Approved by STA Board]
Federal transportation statutes require that the Metropolitan Transportation Commission (MTC), in partnership with state and local agencies, develop and periodically update a long-range Regional Transportation Plan (RTP), and a Transportation Improvement Program (TIP) which implements the RTP by programming federal funds to transportation projects contained in the RTP. In order to effectively execute these planning and programming responsibilities, MTC requires that each transit operator in its region which receives federal funding through the TIP, prepare, adopt, and submit to MTC a Short Range Transit Plan (SRTP).
[Placeholder for Board Adopted Resolution]

Solano County Transportation Authority Short Range Transit Plan SolTrans
DocRef | Issue | June 18, 2013 | Arup North America Ltd S:\SOLTRANS\ELIZABETH\MEETINGS AND PRESENTATIONS\BOARD MEETING\6-27-2013\COORDINATED SRTP\ATTACHMENT A. SOLTRANS FINAL DRAFT SRTP.DOCX
Contents Page
1 Overview of Solano County Transit 8
1.1 Brief History 8 1.2 Governance 8 1.3 Organizational Structure 9 1.4 Service Area Characteristics 11 1.5 Transit Services Provided and Areas Served 11 1.6 Fare Structure 18 1.7 Revenue Fleet 20 1.8 Existing Facilities 24
2 Goal, Objectives, Measures, and Standards 26
2.1 Introduction 26 2.2 Definition of Terms 26 2.3 Prior SRTP Goals, Objectives, Measures and Standards 26 2.4 Modifications Incorporated in to this SRTP 33
3 Service and System Performance Evaluation 34
3.1 Introduction 34 3.2 System Trends 35 3.3 Service Performance 42 3.4 System Performance 46 3.5 Route Performance 50 3.6 Other Relevant Programmatic Evaluations 55 3.7 Summary of Performance 60
4 Operating, Financial and Capital Plan 62
4.1 Operations Plan 62 4.2 Operating Budget and Financial Projection 62 4.3 Capital Improvements Plans 71 4.4 Summary of Operating & Capital Plans 78
Solano County Transportation Authority Short Range Transit Plan SolTrans
DocRef | Issue | June 18, 2013 | Arup North America Ltd S:\SOLTRANS\ELIZABETH\MEETINGS AND PRESENTATIONS\BOARD MEETING\6-27-2013\COORDINATED SRTP\ATTACHMENT A. SOLTRANS FINAL DRAFT SRTP.DOCX
Appendices
Appendix A
Operating Budgets and Financial Projections
Appendix B
Title VI and Previous Reports Tables Table 1: Benicia and Vallejo Demographic Overview ......................................... 11 Table 2: SolTrans Transit Service Hours .............................................................. 17 Table 3: SolTrans Fare Structure .......................................................................... 19 Table 4: Summary of Existing SolTrans Revenue Vehicle Fleet (as of June 4, 2013) ..................................................................................................................... 21 Table 5: Detailed SolTrans Revenue Vehicle Fleet Inventory (as of June 4, 2013) ............................................................................................................................... 22 Table 6: SolTrans Goals ........................................................................................ 27 Table 7: SolTrans Objectives ................................................................................ 28 Table 8: SolTrans Performance Measures and Standards ..................................... 30 Table 9: Extent of Data Availability for SolTrans SRTP ..................................... 34 Table 10: SolTrans Quantified Service Performance (Gray Shading Represents Performance below the Defined Standard) ........................................................... 45 Table 11: SolTrans Qualitative System Performance (Gray Shading Represents Performance below the Defined Standard) ........................................................... 48 Table 12: SolTrans Intercity Fixed Route, Local Fixed Route and DAR Standards ............................................................................................................................... 50 Table 13: SolTrans Route-Level Performance ...................................................... 52 Table 14: SolTrans Route-Level Performance and Productivity .......................... 54 Table 15: Intercity Route Performance vs. GOMS Intercity Standards ............... 55 Table 16: SolTrans Operating Budget and Financial Projection – Fixed Route: Local & Intercity ................................................................................................... 67 Table 17: SolTrans Operating Budget and Financial Projection– Paratransit & Dial-A-Ride ........................................................................................................... 69 Table 18: SolTrans Operating Budget and Financial Projection – Systemwide Total ...................................................................................................................... 70 Table 19: Vehicle Fleet Replacement Schedule – Fixed Route Local .................. 73 Table 20: Vehicle Fleet Replacement Schedule – Fixed Route Intercity ............. 74 Table 21: Vehicle Fleet Replacement Schedule – Paratransit-DAR ..................... 75 Table 22: SolTrans Capital Plan Budget ............................................................... 79

Solano County Transportation Authority Short Range Transit Plan SolTrans
DocRef | Issue | June 18, 2013 | Arup North America Ltd S:\SOLTRANS\ELIZABETH\MEETINGS AND PRESENTATIONS\BOARD MEETING\6-27-2013\COORDINATED SRTP\ATTACHMENT A. SOLTRANS FINAL DRAFT SRTP.DOCX
Figures Figure 1: Original SolTrans Organizational Chart (Approved May 2011) ........... 10 Figure 2: New SolTrans Organizational Chart (Approved November 15, 2012) . 10 Figure 3: SolTrans Fixed Route Service ............................................................... 15 Figure 4: SolTrans Ridership (FY2008-12) .......................................................... 37 Figure 5: SolTrans Fare Revenue (FY2008-12) ................................................... 39 Figure 6: SolTrans Vehicle Revenue Hours (FY2008-12) ................................... 40 Figure 7: SolTrans Operating Cost (FY2008-12) ................................................. 42
Solano County Transportation Authority Short Range Transit Plan SolTrans
DocRef | Issue | June 18, 2013 | Arup North America Ltd S:\SOLTRANS\ELIZABETH\MEETINGS AND PRESENTATIONS\BOARD MEETING\6-27-2013\COORDINATED SRTP\ATTACHMENT A. SOLTRANS FINAL DRAFT SRTP.DOCX
Page 1
Executive Summary
Purpose and Organization In September 2012, Solano Transportation Authority contracted with the Arup consulting team (consultant) to develop the Solano Coordinated Short Range Transit Plan (SCSRTP) including the Metropolitan Transportation Commission (MTC) requested areas of coordination and the I-80/I-680/I-780/State Route 12 Transit Corridor Study update. The scope of the SCSRTP also includes preparation of Short Range Transit Plans (SRTP) for each transit operator in Solano County in accordance with guidelines contained in MTC Resolution 3532 that address requirements of the Federal Transit Administration (FTA). This report presents the SRTP for Solano County Transit (SolTrans). It documents actual transit system performance for FY2007-08 – FY2011-12 and plans and projections for ten years beginning FY2012-13 and ending FY2021-22. To prepare the SRTP, the consultant collaborated with STA and transit staff to update Goals, Objectives, Performance Measures and Standards; evaluate existing SolTrans service, analyze existing conditions and trends, and develop a recommended service, capital improvement and financial plan that serves Vallejo and Benicia residents’ transit needs within the financial capacity of SolTrans and the cities of Vallejo and Benicia. The overarching purpose of this SRTP is to:
• Serve as a management and policy document for SolTrans, as well as a means of providing FTA and MTC with information necessary to meet regional fund programming and planning requirements,
• Clearly and concisely describe and justify SolTrans’ capital and operating budgets
• Assess SolTrans’ financial capacity to carry out proposed levels of operations and the associated capital improvement plan,
• Regularly provide MTC with information on projects and programs of regional significance which include: provision of paratransit service to persons with disabilities, older adults and others; compliance with federal Title VI and Environmental Justice requirements; and results of most recent FTA Triennial Review,
• Identify potential capital and operating programs to provide the basis for inclusion in the RTP, and
• Identify goals, objectives and standards to serve as the basis for the assessment of SolTrans’ performance in the SRTP and as part of the TDA Triennial Performance Audit.

Solano County Transportation Authority Short Range Transit Plan SolTrans
DocRef | Issue | June 18, 2013 | Arup North America Ltd S:\SOLTRANS\ELIZABETH\MEETINGS AND PRESENTATIONS\BOARD MEETING\6-27-2013\COORDINATED SRTP\ATTACHMENT A. SOLTRANS FINAL DRAFT SRTP.DOCX
Page 2
The Short Range Transit Plan is divided into five sections including:
• Executive Summary
• Overview of Transit System
• Goals, Objectives and Standards
• Service and System Evaluation
• Operating, Financial and Capital Plan. Presented herein is a summary of each and the associated findings.
Overview of Transit System SolTrans is overseen by the SolTrans Joint Powers Authority Board which is comprised of five appointed directors and one ex-officio, non-voting director and two alternates. These positions are comprised of two voting directors from each member agency other than STA, one voting director that is the Solano County representative to the Metropolitan Transportation Commission (MTC), and one non-voting STA representative. SolTrans is the result of a merger between Vallejo Transit and Benicia Breeze. The agency currently has a fleet of 29-vehicle local fixed route vehicles including 21 low-floor 40-foot Gillig Hybrid/Diesel and 8 Orion Diesel buses (five of which are in contingency). The intercity fleet is comprised of twenty-five (25) 45-foot Motor Coach Industries (MCI) diesel buses with seating capacity up to 57. Ten of these vehicles are held in a contingency fleet. One Gillig hybrid diesel bus is also shared between local mid-day service and peak inter-city service. An additional ten (10) MCIs are owned by SolTrans but leased to the City of Fairfield for their intercity services. The Dial-A-Ride and ADA paratransit fleet consists of 14 vehicles (ten in active service and four in contingency). All revenue vehicles are ADA compliant. SolTrans’ fleet also includes five maintenance support vehicles and five administrative vehicles in various states of condition. SolTrans provides 11 local bus fixed-routes and five intercity, commuter express bus routes. Additionally, SolTrans currently operates: (i) a supplemental bus route for the Vallejo Ferry; (ii) shared-ride, curb-to-curb general public Dial-A-Ride (DAR) bus service that operates within Benicia only; (iii) ADA paratransit bus service for qualified persons with disabilities complementing the fixed-route service; and (iv) subsidized taxi programs that provide rides locally and within Solano County for eligible individuals.
Solano County Transportation Authority Short Range Transit Plan SolTrans
DocRef | Issue | June 18, 2013 | Arup North America Ltd S:\SOLTRANS\ELIZABETH\MEETINGS AND PRESENTATIONS\BOARD MEETING\6-27-2013\COORDINATED SRTP\ATTACHMENT A. SOLTRANS FINAL DRAFT SRTP.DOCX
Page 3
Goals, Objectives and Standards The goals, objectives, measures and standards that guide SolTrans are based on a performance measuring system grounded in the agency’s Mission Statement, approved by the Board of Directors in May 2013:
“The Mission of Solano County Transit is to deliver safe, reliable and efficient transportation services that link people, jobs, and our communities.
The following modifications are incorporated to improve SolTrans’ goals, objectives, measures and standards:
• Develop a Ridership goal;
• Develop a Regional Coordination goal with corresponding objectives, measures and standards;
• Add measures and standards for fixed route service frequency; and
• Add goals, objectives, measures, and standards for land use.
Service and System Performance Evaluation Ridership has been decreasing since FY2008-09 and continued to fall after the merger in July 2011. As of FY2011-12, SolTrans ridership fell by about 310,000 or 17.3% since FY2008-09. Fare revenues on the other hand have been climbing since FY2009-10. In its first full year since the merger, SolTrans achieved its highest overall system revenues, generating about $3.6 million annually – an increase of $375,000 or about 11.7% over the last two years. After the merger, the amount of service provided by SolTrans dropped significantly – by nearly 14,000 vehicle revenue hours - due to consolidation and elimination of routes. As of FY2011-12, SolTrans provided about 113,000 vehicle revenue hours systemwide, including fixed route local, fixed route intercity, DAR, and paratransit services. Total operating costs have risen, despite the decrease in amount of service provided, from $10.8 million in FY2009-10 to about $12.3 million in FY2011-12, an increase of over 13.3% over the three year period.
Prior to the merger of Vallejo Transit and Benicia Breeze, a ten year financial forecast was prepared. Both transit systems were found to be unsustainable in the near term. Through the merger, a plan for creating a financial sustainable system was initiated. The plan included reducing the hourly cost of service, reducing and restructuring service, and seeking near term funding to assist in maintaining service through the restructuring period.
In FY2010-11 before the merger, SolTrans met only 9 of 13 of its service performance standards, with most deficiencies in the financial cost effectiveness categories. However, FY2010-11 data was unavailable for 8 of the standards.
Solano County Transportation Authority Short Range Transit Plan SolTrans
DocRef | Issue | June 18, 2013 | Arup North America Ltd S:\SOLTRANS\ELIZABETH\MEETINGS AND PRESENTATIONS\BOARD MEETING\6-27-2013\COORDINATED SRTP\ATTACHMENT A. SOLTRANS FINAL DRAFT SRTP.DOCX
Page 4
Performance improved in FY2011-12 after the merger, as SolTrans met 13 of its 19 service performance standards, with deficiencies in similar categories. However FY 2011-12 data was unavailable for 5 of its standards. During FY2012-13, SolTrans staff placed a high priority on obtaining historical operating data from its predecessor municipal operators (the Cities of Vallejo and Benicia) and working with its service contractor (MV Transportation) to collect, compile, and report current operating data for SolTrans fixed route and demand response service. For FY2012-13 and future years, staff expects all necessary data to be available to monitor service performance consistent with its internal (SRTP based) performance monitoring system as well as for TDA and NTD reporting.
In FY2010-11 before the merger, SolTrans did not meet any of its system performance standards in which data was available (with 16 out of 20 standards lacking data). Key deficiencies were in on-time performance and service frequency. Data was more readily available after the merger, thus in FY2011-12, SolTrans met 13 of its 16 standards in which data was available (only four standards lacked data to evaluate). Key deficiencies were in DAR on-time performance, fixed route system transfer waiting time, and having 30 minute minimum fixed route headways.
Overall, it appears that since July 2012, performance has improved for local buses, although some still perform below the standard (Route 4 in particular). Three intercity routes are operating poorly in terms of both boardings/VRH and boardings/VRM and could be candidates for modification, and/or consolidation such as Route 76, 78 and 80S. In terms of meeting proposed STA intercity standards as well as farebox recovery standards among MTC Regional Express Bus (REB) routes, Route 80 had the highest performance, while Route 78 had the lowest.
The 2008 Community Based Transportation Plan revealed that the top community needs involve transit routing, service span, and schedule, as well as cost, safety/comfort, coordination, and accessibility. SolTrans submitted a Title VI Program in November 2011. The FTA triennial review found that SolTrans was in accordance with FTA requirements in 20 of the 24 areas, with deficiencies in the Technical, Satisfactory Continuing Control, ADA, and ARRA categories. The March 2012 TDA Audit findings (for FY2006-2011) regarding SolTrans service performance trends were consistent with the performance evaluation conducted for this SRTP. The review noted that SolTrans was implementing a new performance management system based on its recently approved SRTP to rectify declining bus and paratransit service performance.
Operating, Financial, and Capital Plans
Operating Plan SolTrans will continue to provide fixed route local bus, complementary ADA paratransit services, and local dial-a-ride (DAR) services supplemented by a local taxi scrip program in the SolTrans service area. In addition to these local public
Solano County Transportation Authority Short Range Transit Plan SolTrans
DocRef | Issue | June 18, 2013 | Arup North America Ltd S:\SOLTRANS\ELIZABETH\MEETINGS AND PRESENTATIONS\BOARD MEETING\6-27-2013\COORDINATED SRTP\ATTACHMENT A. SOLTRANS FINAL DRAFT SRTP.DOCX
Page 5
transit services, SolTrans will provide SolanoExpress intercity fixed route bus services and will also continue its funding participation in the County’s intercity taxi scrip program for ADA qualified persons. In FY2013-14 and FY2014-15, staff proposes to add about 2,000 revenue hours each year, 4,000 hours total, on the most productive local bus routes which amounts to less than 5% fixed route service expansion.
In FY2012-13, SolTrans is expected to serve about 1.5 million riders systemwide with about 115,000 service hours, an average of about 5,000 passenger trips per day and 13 passengers per hour, at a cost of about $11.5 million with fare revenues of about $3.3 million recovering about 29% of operating costs from fare revenues. Between FY2012-13 and FY2014-15, ridership on fixed route local service is expected to grow 3% due to the introduction of new services. After this initial increase, local ridership is forecast to be about 1% per year. Ridership on Intercity and all paratransit services is forecast to grow at 2% per year through FY2021-22. Ridership increases should be able to be accommodated without any additional expansion of local service.
Financial Plan The Operating Budget and Financial Projection shows that SolTrans will have declining annual operating surplus over most of the 10 year forecast period, with a small operating deficit in the final year of the plan. The deficit can be covered with available TDA reserves. However, deficits are on pace to increase after the forecast horizon, so SolTrans will need to evaluate its expense and revenue trends and determine options for making the operating budget more sustainable, so that TDA reserves can be retained as contingency for unexpected operating and capital needs.
Capital Improvement Program SolTrans has defined a ten-year program of capital projects to maintain its assets in a state of good repair. Many of the capital projects listed below have committed funding plans from previously approved state and federal grants or designated funding programmed by STA and/or MTC. In particular, the cost of intercity vehicle replacements is subject to an inter-agency funding agreement that details the exact sources and uses. However, the capital plan also relies on $14 million in future unspecified local and federal sources to complete several projects.
Planned and proposed capital projects contained in the SolTrans’ ten year capital improvement plan that support local and intercity fixed route and public DAR transit services include:
• SolTrans is scheduled to replace the three oldest vehicles in the local bus fleet in FY 2016-17.
• SolTrans will contribute towards its share of the cost to replace 34 over-the-road vehicles used for all SolanoExpress intercity services.
Solano County Transportation Authority Short Range Transit Plan SolTrans
DocRef | Issue | June 18, 2013 | Arup North America Ltd S:\SOLTRANS\ELIZABETH\MEETINGS AND PRESENTATIONS\BOARD MEETING\6-27-2013\COORDINATED SRTP\ATTACHMENT A. SOLTRANS FINAL DRAFT SRTP.DOCX
Page 6
• SolTrans will purchase a total of ten replacement cutaway vans over the period covered by this SRTP.
• SolTrans will replace five non-revenue vehicles over the next 10 years.
• SolTrans has budgeted an annual allocation of capital funds for unscheduled preventive maintenance activities.
• SolTrans is renovating and expanding the existing central operations and maintenance facility on Broadway in 2012-13.
• Staff proposes to upgrade security and maintenance of the heavily used Curtola Park & Ride lot in FY2014-15.
• In FY2013-14, SolTrans proposes to purchase and install a new Automatic Vehicle Location-Computer Aided Dispatch (AVL-CAD) system on its fixed route fleet to track on-time performance.
• SolTrans will replace the mobile radio and dispatch communications network in FY2013-14
• In FY2012-13 and FY 2013-14, SolTrans is making a variety of technology enhancements such as information technology equipment, communications, farebox upgrade, and security cameras.
• Expenses have been budgeted in FY2015-16 to support possible additional purchases of Clipper equipment that may be necessary as part of completing deployment on all of SolTrans’ fleet.
• $250,000 is budgeted in FY2012-13 for SolanoExpress branding activities including bus decals and bus stop signage.
• SolTrans staff proposes to reconfigure and expand the existing Curtola Park & Ride lot to create a full-featured transit center over three years from FY2012-13 to FY2014-15.
The majority of the projects listed above are planned to be funded with committed revenues from multiple sources including Regional Measure 2, Proposition 1B, FTA 5307 Urbanized Area formula allocations, and FTA discretionary grants. SolTrans also plans to use over $9 million in TDA-LTF funding towards its share of the capital costs.
The current capital plan assumes SolTrans will request and receive $10 million in future local/regional funds for the Curtola park-and-ride expansion. If the local funds are not received, the project would be deferred. Similarly, the plan assumes that SolTrans would apply for and receive $4 million in funding to pay for 80% of the cost to replace local and paratransit vehicles in FY2015-16 through FY2021-22.
If federal funding is not received, SolTrans has sufficient TDA reserves to pay the full cost of the vehicles scheduled for replacement through FY2018-19. However, TDA reserves would be completely depleted that year, compromising SolTrans’ ability to pay for capital projects in later years.
Solano County Transportation Authority Short Range Transit Plan SolTrans
DocRef | Issue | June 18, 2013 | Arup North America Ltd S:\SOLTRANS\ELIZABETH\MEETINGS AND PRESENTATIONS\BOARD MEETING\6-27-2013\COORDINATED SRTP\ATTACHMENT A. SOLTRANS FINAL DRAFT SRTP.DOCX
Page 7
Summary of Operating & Capital Plans Under the current baseline assumptions, the operating plan generates an annual surplus every year until the last year of the plan. The operating deficit in the final year is small enough that it can be covered with available TDA reserves. However, the trend in operating results is for increasing deficits after the forecast horizon. At the same time, the capital plan relies on unspecified future funding sources to avoid depleting available TDA reserves. Beyond the horizon year, additional operating subsidy from TDA would be required, which could constrain SolTrans’ ability to meet future capital needs.

Solano County Transportation Authority Short Range Transit Plan SolTrans
DocRef | Issue | June 18, 2013 | Arup North America Ltd S:\SOLTRANS\ELIZABETH\MEETINGS AND PRESENTATIONS\BOARD MEETING\6-27-2013\COORDINATED SRTP\ATTACHMENT A. SOLTRANS FINAL DRAFT SRTP.DOCX
Page 8
1 Overview of Solano County Transit
1.1 Brief History In 2005, the Solano Transportation Authority (STA) Board held a retreat with STA staff. Following the retreat, STA staff was directed to complete a consolidated study of Solano County’s six transit operators. The study was conducted in phases, with Phase II presenting six major consolidation options analyzed by the STA Board and guided by a Transportation Consolidation Steering Committee. The resulting recommendations called for the consolidation of the respective public transit systems serving Benicia and Vallejo (Benicia Breeze and Vallejo Transit).
In June 2009, the STA Board moved forward with this recommendation. Over the balance of 2009, monthly meetings were held and additional committees were coordinated (i.e., Coordinating Committee, Management Committee, and Working Group) comprised of STA Board members as well as Benicia, Vallejo, and STA transit staff/consultants to oversee this process. A Memorandum of Understanding (MOU) was prepared combining the operations of both transit programs into a Joint Powers Authority (JPA); the Solano County Transit (SolTrans) Joint Powers Agreement was approved by all parties on November 30, 2010, with SolTrans taking over management of transit operations on July 1, 2011.
1.2 Governance
1.2.1 Type of Unit of Government The Government Code of the State of California, Division 7, Title 1 commencing with Section 6500, also known as the Joint Powers Authority Law, permits two or more local public entities by agreement to jointly exercise any power common to them. Based on this code, it was the decision of the Coordinating Committee for the new agency (i.e., SolTrans) to govern as a Joint Powers Authority. In accordance with the Joint Powers Agreement, the Cities of Benicia and Vallejo, and the Solano Transportation Authority created the Solano County Transit or SolTrans. Parties interested in being a member of SolTrans must be voted in by active members and receive two-thirds the SolTrans JPA Board vote, with no less than one affirmative vote on the part of each member city or MTC representative of the County.
1.2.2 Composition and Nature of Governing Body The SolTrans JPA Board is comprised of five appointed directors and one ex-officio, non-voting director and two alternates. These positions are comprised of two voting directors from each member agency other than STA, one voting director that is the Solano County representative to the Metropolitan

Solano County Transportation Authority Short Range Transit Plan SolTrans
DocRef | Issue | June 18, 2013 | Arup North America Ltd S:\SOLTRANS\ELIZABETH\MEETINGS AND PRESENTATIONS\BOARD MEETING\6-27-2013\COORDINATED SRTP\ATTACHMENT A. SOLTRANS FINAL DRAFT SRTP.DOCX
Page 9
Transportation Commission (MTC), and one non-voting STA representative. All directors serve two-year terms.
At a January 17, 2013 meeting, the SolTrans Board of Directors appointed City of Vallejo Mayor, Osby Davis, and City of Benicia City Council Member, Mark Hughes, as the Chairperson and Vice Chairperson, respectively, for the 2013-14 term, which runs from February 2013 through January 2014. Additionally, City of Suisun City Mayor, Pete Sanchez, and City of Vallejo City Council Member, Hermie Sunga, will join the SolTrans Board, replacing City of Fairfield Mayor, Harry Price, and newly elected Solano County Supervisor, Erin Hannigan, respectively. As new Directors, Mayor Sanchez will assume the role of “Ex-Officio Director” representing the Solano Transportation Authority (STA), and Councilmember Sunga will represent the City of Vallejo. Directors Sanchez and Sunga will serve alongside current members, Jim Spering, Solano County Supervisor; Elizabeth Patterson, Mayor of the City of Benicia; Mark Hughes, City of Benicia Council Member; and Osby Davis, Mayor of the City of Vallejo.
1.3 Organizational Structure In May 2011, the SolTrans Board approved an organizational structure that included 5.5 full time positions. Since that time, these positions, as well as an additional three full-time and two-part-time employee positions, have been filled through a combination of employee, consulting, and temporary staffing agreements. In an effort to “right-size” the agency and allow for organizational stability, the Board approved a new organizational structure on November 15, 2012 to provide for 10 full-time employment positions. Figure 1 shows the organizational chart approved in May 2011, and Figure 2 shows the new structure approved on November 15, 2012.
The main transit service contractor continues to be MV Transportation under contract through June 30, 2013. On March 21, 2013, the SolTrans JPA Board of Directors approved the award of a Transit Operations Services Contract to National Express for FY2013-2014 through FY2017-2018 and two one-year options through FY2019-2020. The Board also authorized the Executive Director to negotiate and execute a contract with National Express in an amount not to exceed $7,698,326.90 for FY2013-14.

Solano County Transportation Authority Short Range Transit Plan SolTrans
DocRef | Issue | June 18, 2013 | Arup North America Ltd S:\SOLTRANS\ELIZABETH\MEETINGS AND PRESENTATIONS\BOARD MEETING\6-27-2013\COORDINATED SRTP\ATTACHMENT A. SOLTRANS FINAL DRAFT SRTP.DOCX
Page 10
Figure 1: Original SolTrans Organizational Chart (Approved May 2011)
Source: SolTrans, 2012.
Figure 2: New SolTrans Organizational Chart (Approved November 15, 2012)
Source: SolTrans, 2012.

Solano County Transportation Authority Short Range Transit Plan SolTrans
DocRef | Issue | June 18, 2013 | Arup North America Ltd S:\SOLTRANS\ELIZABETH\MEETINGS AND PRESENTATIONS\BOARD MEETING\6-27-2013\COORDINATED SRTP\ATTACHMENT A. SOLTRANS FINAL DRAFT SRTP.DOCX
Page 11
1.4 Service Area Characteristics Table 1 presents a demographic summary of the Benicia and Vallejo areas.
Table 1: Benicia and Vallejo Demographic Overview
Source: 2010 Census. (Accessed September 2012). American Fact Finder Quick Tables.
1.5 Transit Services Provided and Areas Served SolTrans provides 11 local bus fixed-routes and five intercity, commuter express bus routes. Additionally, SolTrans currently operates: (i) a supplemental bus route for the Vallejo Baylink Ferry; (ii) shared-ride, curb-to-curb general public Dial-A-Ride (DAR) bus service that operates within Benicia only; (iii) ADA paratransit bus service for qualified persons with disabilities complementing the fixed-route
Solano County
Benicia &
Vallejo % California %Total Population (2011 estimate) 144,036 37,691,912Population, 2010 142,937 37,253,956Population, percent change, April 1, 2010 to July 1, 2011 0.8% 1.2%AgePersons under 5 years, percent, 2010 8,832 6.2% 2,563,050 6.8%Persons under 18 years, percent, 2010 33,215 23.2% 9,422,978 25.0%Persons 65 years and over, percent, 2010 17,403 12.2% 4,296,878 11.4%GenderFemale, 2010 73,721 51.6% 18,959,032 50.3%Male, 2010 69,216 48.4% 18,732,880 49.7%DisabilityPersons with a disability, 2010 15,826 11.1%Journey to WorkMean travel time to work (minutes), workers age 16+, 2006-2010 31.2 26.9EthnicityWhite persons, percent, 2010 (a) 57,601 40.3% 21,710,541 57.6%Black persons, percent, 2010 (a) 27,135 19.0% 2,336,899 6.2%American Indian and Alaska Native persons, percent, 2010 (a) 947 0.7% 376,919 1.0%Asian persons, percent, 2010 (a) 31,866 22.3% 4,899,949 13.0%Native Hawaiian and Other Pacific Islander, percent, 2010 (a) 1,383 1.0% 150,768 0.4%Persons reporting two or more races, percent, 2010 10,504 7.3% 1,846,904 4.9%Persons of Hispanic or Latino origin, percent, 2010 (b) 29,442 20.6% 14,172,159 37.6%White persons not Hispanic, percent, 2010 46,830 32.8% 15,114,457 40.1%Language and EducationLanguage other than English spoken at home, pct age 5+, 2006-2010 47,645 33.3% 16,207,522 43.0%High school graduates, percent of persons age 25+, 2006-2010 123,767 86.6% 30,417,373 80.7%Bachelor's degree or higher, pct of persons age 25+, 2006-2010 39,760 27.8% 11,345,266 30.1%Housing and HouseholdsHousing units, 2010 55,739 13,680,081Homeownership rate, 2006-2010 35,620 71.0% 7,852,366 57.4%Housing units in multi-unit structures, percent, 2006-2010 14,689 24.6% 4,199,785 30.7%Average of median value of owner-occupied housing units for Benicia and Vallejo, 2006-2010 $435,250 $458,500Households, 2006-2010 51,197 12,392,852Average persons per household for Benicia and Vallejo, 2006-2010 2.66 2.89Average per capita money income in past 12 months (2010 dollars) 2006-2010 $34,844 $29,188Average of median household incomes for Benicia and Vallejo, 2006-2010 $74,250 $60,883Persons below poverty level, percent, 2006-2010 17,520 12.3% 5,163,792 13.7%Land FactsLand area, 2010 (square miles) 43.6 155,779.22Persons per square mile, 2010 3278.37 239.1
Solano County Transportation Authority Short Range Transit Plan SolTrans
DocRef | Issue | June 18, 2013 | Arup North America Ltd S:\SOLTRANS\ELIZABETH\MEETINGS AND PRESENTATIONS\BOARD MEETING\6-27-2013\COORDINATED SRTP\ATTACHMENT A. SOLTRANS FINAL DRAFT SRTP.DOCX
Page 12
service; and (iv) subsidized taxi programs for eligible individuals that provide rides locally and within Solano County.
1.5.1 Fixed Route Fixed route services include the following:
Local Fixed-Routes SolTrans operates 11 fixed-routes providing service locally within Vallejo and Benicia. Within Vallejo, weekday routes operate between 5:50AM to 8:50PM, averaging 30 minute headways during the AM/PM peak hours, with 60 minute headways during off-peak hours (Route 2 is the one exception, operating on 45 minute headways). Routes 1 and 7 operate seven days a week, while Routes 2, 3, 4, 5, and 6 operate six days a week. Weekend service operates on increased headways of one hour for most routes, and one and a half hours for Route 2 and some trips of the new Route 7. These seven local all-day routes are supplemented by two limited routes with service to schools in the morning and afternoon bell times. Within Benicia, SolTrans operates two limited routes with service to schools during the morning and afternoon bell times, Monday through Friday. The base fare for local fixed-route services is $1.75, and a fare is charged for each boarding. SolTrans does not offer free transfers within its local fixed route system.
SolTrans implemented system-wide service changes on Sunday July 1, 2012, impacting nearly all existing services and resulting in a 10% reduction in service hours. Current SolTrans local services and the recent changes to these services are summarized below. The updated service route map is shown in Figure 3 and the schedule information is shown in Table 2.
• Route 1 operates seven days a week and provides service from North West Vallejo to the Vallejo Transit Center. Major destinations along this route include the Vallejo High School, Raley’s Shopping Center, Seafood City and Food-4-Less. Previous service provided by this route to South Vallejo is now provided by the revised Route 3.
• Route 2 runs Monday through Saturday and provides service from North East Vallejo to the Vallejo Transit Center. Major destinations served include Seafood City, Solano Middle School and two elementary schools, Solano College (Vallejo), Jesse Bethel High School and the Gateway Plaza. Service changes included a modified routing to serve Gateway Plaza and the Vallejo campus of Solano Community College at under 45-minute headways.
• Route 3 provides service Monday through Saturday from Glen Cove to South Vallejo, Beverly Hills and the Vallejo Transit Center. Major destinations served include the Glen Cove Shopping Center, the Park & Ride at Curtola and Lemon, and the South Vallejo Community Center. This route was modified to serve South Vallejo, Beverly Hills and the Glen Cove neighborhoods.
Solano County Transportation Authority Short Range Transit Plan SolTrans
DocRef | Issue | June 18, 2013 | Arup North America Ltd S:\SOLTRANS\ELIZABETH\MEETINGS AND PRESENTATIONS\BOARD MEETING\6-27-2013\COORDINATED SRTP\ATTACHMENT A. SOLTRANS FINAL DRAFT SRTP.DOCX
Page 13
• Route 4 operates Monday through Saturday providing service from Tuolumne Street to the Vallejo Transit Center. Major trip generators served include the Florence Douglas Senior Center, Vallejo Community Center, Solano County Courthouse, Sutter Solano Medical Center, Raley’s Shopping Center and Kaiser Hospital. No changes were made to this route.
• Route 5 operates Monday through Saturday from the Six Flags Discovery Kingdom to the Vallejo Transit Center. Other major destinations served include Seafood City, the Ferry Terminal, Solano County Fairgrounds and Kaiser Hospital. This route was modified to eliminate service to Plaza Drive/Target, and to add service to Kaiser Hospital, Sereno Drive and Discovery Kingdom. This route now alternates between Sereno Drive and Redwood Street.
• Route 6 operates Monday through Saturday from Vallejo Transit Center to Benicia Road, Ascot Parkway and Tennessee Street. It also provides service to Grocery Outlet, Hogan Middle School, Vallejo Adult School, Franklin Middle School and Pennycook Elementary. Route 6L provides limited supplemental school route service. This route was modified to serve neighborhoods in East Vallejo along Ascot Parkway. A portion of the route south of Benicia Road was eliminated, but is now covered by the revised Route 3.
• Route 7 operates seven days a week from the Gateway Plaza to Springs Road and the Vallejo Transit Center. It also provides service to the Solano 80 Shopping Center, Pacific Island Supermarket, Jesse Bethel High School, Redwood Plaza and the Gateway Plaza. Route 7L provides limited supplemental school route service. Route 7 was modified to change from a unidirectional loop service to a bidirectional route that operates between Vallejo Transit Center and Gateway Plaza.
• Routes 12 and 14 operate during the weekdays, providing supplemental school service to Solano Middle School, Vallejo High School, Glen Cove Elementary, Annie Pennycook Elementary, Hogan Middle School, and Jesse Bethel High School in Vallejo.
• Routes 15 and 17 operate during the weekdays, providing supplemental school service to Mary Farmar Elementary, Benicia High School, Benicia Middle School, Joe Henderson Elementary, Matthew Turner Elementary School, Robert Semple Elementary, and Southampton Shopping Center (Raley’s).
Intercity Service In 1997, the SolanoLinks Intercity Transit Consortium was formed by the seven Solano transit operators, Solano Napa Commuter Information and the STA to coordinate intercity service that goes through Solano County from Sacramento County, Yolo County, Napa County and Contra Costa County. SolTrans also participates in the Intercity Funding Agreement, which includes all Solano County jurisdictions except Rio Vista. The Intercity Funding Agreement currently supports seven inter-city bus routes. Intercity transit costs are shared among jurisdictions using a formula that is based on two factors: ridership by residence and population.

Solano County Transportation Authority Short Range Transit Plan SolTrans
DocRef | Issue | June 18, 2013 | Arup North America Ltd S:\SOLTRANS\ELIZABETH\MEETINGS AND PRESENTATIONS\BOARD MEETING\6-27-2013\COORDINATED SRTP\ATTACHMENT A. SOLTRANS FINAL DRAFT SRTP.DOCX
Page 14
SolTrans operates six intercity routes including Route 76, Route 78, Route 80, Route 80s, Route 85 and Route 200. Three of these six routes are in the “SolanoExpress” program created by STA and jointly funded by transit agencies in the County in accordance with the Intercity Transit Funding Agreement. Base fare for multi-zone service is $5.00. Intercity routes are described below.
• Route 76 connects Vallejo and Benicia with the Diablo Valley College with two trips a day every weekday. This route also stops at the Vallejo Transit Center and Benicia City Park.
• Route 78 SolTrans “SolanoExpress” connects Vallejo and Benicia with the Pleasant Hill and Walnut Creek BART stations in Contra Costa County during weekdays from 5:30AM-8:45PM and from 6:30AM-8:15PM on Saturday. Routes operate at 30 minute headways during the peak and 60 minute headways during the off-peak with limited service on Saturdays. This route also serves the Vallejo Transit Center and Benicia City Park. Sunday service to Walnut Creek BART is provided by Route 80 South.
• Route 80 SolTrans “SolanoExpress” connects Vallejo with the El Cerrito del Norte BART station six days a week with 15-30 minute headways. Other locations served by this route include the Vallejo Ferry Terminal, Vallejo Transit Center and the Curtola & Lemon Park-and-Ride. Sunday service for this route has been discontinued.
• Route 80s provides Sunday service between Vallejo, Benicia and the Walnut Creek BART station operating with hourly service frequencies and limited midday service.
• Route 85 SolTrans “SolanoExpress” connects Vallejo with Fairfield, Solano Community College (Fairfield), and the Solano Mall. This route also provides service to the Vallejo Ferry Terminal and Six Flags Discovery Kingdom. This route now operates on hourly headways and has a reduced number of stops in Vallejo, while maintaining service to Discovery Kingdom.
SolTrans also operates Route 200 (under an agreement with the Water Emergency Transit Authority), an express bus service from Vallejo to the Ferry Building in San Francisco during the morning hours. Route 200 augments the Vallejo Ferry service recently transitioned from the City of Vallejo to WETA. Route 400, a seasonal bus service, from May 14 through October 28, which connected the Ferry Terminal in Vallejo to the Six Flags Discovery Kingdom as part of the Ferry fare, was discontinued in FY2012-13 due to extremely low ridership.

Solano County Transportation Authority Short Range Transit Plan SolTrans
DocRef | Issue | June 18, 2013 | Arup North America Ltd S:\SOLTRANS\ELIZABETH\MEETINGS AND PRESENTATIONS\BOARD MEETING\6-27-2013\COORDINATED SRTP\ATTACHMENT A. SOLTRANS FINAL DRAFT SRTP.DOCX
Page 15
Figure 3: SolTrans Fixed Route Service
Source: SolTrans. (July, 2012). SolTrans Routes. http://www.soltransride.com/routes/ Note: The most recent modifications to Route 7, 78 and 85 are not reflected in this map. Limited routes 76, 80s, 12, 14, 15 and 17 are not shown either.
1.5.2 Demand Response SolTrans ADA Paratransit Bus Service The SolTrans ADA Paratransit Bus Service (SolTrans Paratransit) is a complementary, ADA-required paratransit service which offers origin-to-destination service to those unable to use the regular fixed-route service. SolTrans Paratransit provides service within a ¾ mile of a fixed route and operates the same hours and days as the fixed route system and offers service within and between Vallejo and Benicia. This service was formerly known as Runabout.
Solano County Transportation Authority Short Range Transit Plan SolTrans
DocRef | Issue | June 18, 2013 | Arup North America Ltd S:\SOLTRANS\ELIZABETH\MEETINGS AND PRESENTATIONS\BOARD MEETING\6-27-2013\COORDINATED SRTP\ATTACHMENT A. SOLTRANS FINAL DRAFT SRTP.DOCX
Page 16
SolTrans Paratransit dispatch coordinates inter-city and inter-county transfers through ADA Paratransit “Plus” services with six transfer points, three southbound and three northbound, outside its primary service area listed below. Currently, SolTrans Paratransit travels outside of the required service area to take passengers to connect with other agencies and pick them up from other agency’s service area to bring them home. With the exception of Napa VINE, connecting agencies are not picking up or dropping off passengers within SolTrans’s service area.
Southbound
• To and from East Bay: 1400 Fitzgerald (Pinole Target) (East Bay Paratransit)
• To and from Marin County: El Cerrito Del Norte BART (Whistle Stop) • To and from Hercules: BART park-and-ride (Hercules Transit Center) on
Willow Avenue near eastbound I-80 off-ramp (West Contra Costa Transit Authority –WestCAT)
Northbound
• To and from Fairfield: Solano College, Fairfield (DART) • To and from Napa: 701 Sereno Drive (Old Mervyn's) in Vallejo (Napa
VINE) • To and from Concord: Red Robin at Sun Valley Mall in Concord (Links
County Connection)
SolTrans Paratransit does not operate on the following holidays: New Year's Day, Easter, Memorial Day, Independence Day, Labor Day, Thanksgiving Day, and Christmas Day. A holiday (Saturday) schedule is in effect on Martin Luther King Day, President’s Day, Veteran’s Day, and the day after Thanksgiving.
Dial-A-Ride Bus Service The General Public Dial-A-Ride bus service offers local origin to destination shared ride service within the Benicia city limits only. This service is open to the public with no application necessary for use. Dial-A-Ride generally operates six days a week from 5:50AM-8:20PM. Base fare for Dial-A-Ride is $2.00 with reduced service on Saturdays. This service replaced the Benicia Breeze Paratransit Flex Routes 21 and 22.
SolTrans Local and Intercity Taxi Scrip Programs The SolTrans Local Taxi Scrip Program provides alternative transportation for Medicare cardholders, seniors 65 and over and persons with disabilities living in Vallejo or Benicia. SolTrans has also entered into an MOU with all other transit agencies in the County to fund the Intercity taxi program (Solano County serves as the lead agency). Eligibility criteria and application process vary between the local and intercity taxi programs. The Solano County Intercity Taxi Scrip Program is limited to qualified ADA Paratransit certified riders. The Local Scrip program provides a 50% discount off taxi fares for eligible riders; while the Intercity Scrip provides an 85% discount ($15 scrip booklet provides $100 value). SolTrans directly contracts with local taxi providers for subsidized taxi services for seniors
Solano County Transportation Authority Short Range Transit Plan SolTrans
DocRef | Issue | June 18, 2013 | Arup North America Ltd S:\SOLTRANS\ELIZABETH\MEETINGS AND PRESENTATIONS\BOARD MEETING\6-27-2013\COORDINATED SRTP\ATTACHMENT A. SOLTRANS FINAL DRAFT SRTP.DOCX
Page 17
and people with disabilities. It is not guaranteed, however, that every taxi will be wheelchair accessible.
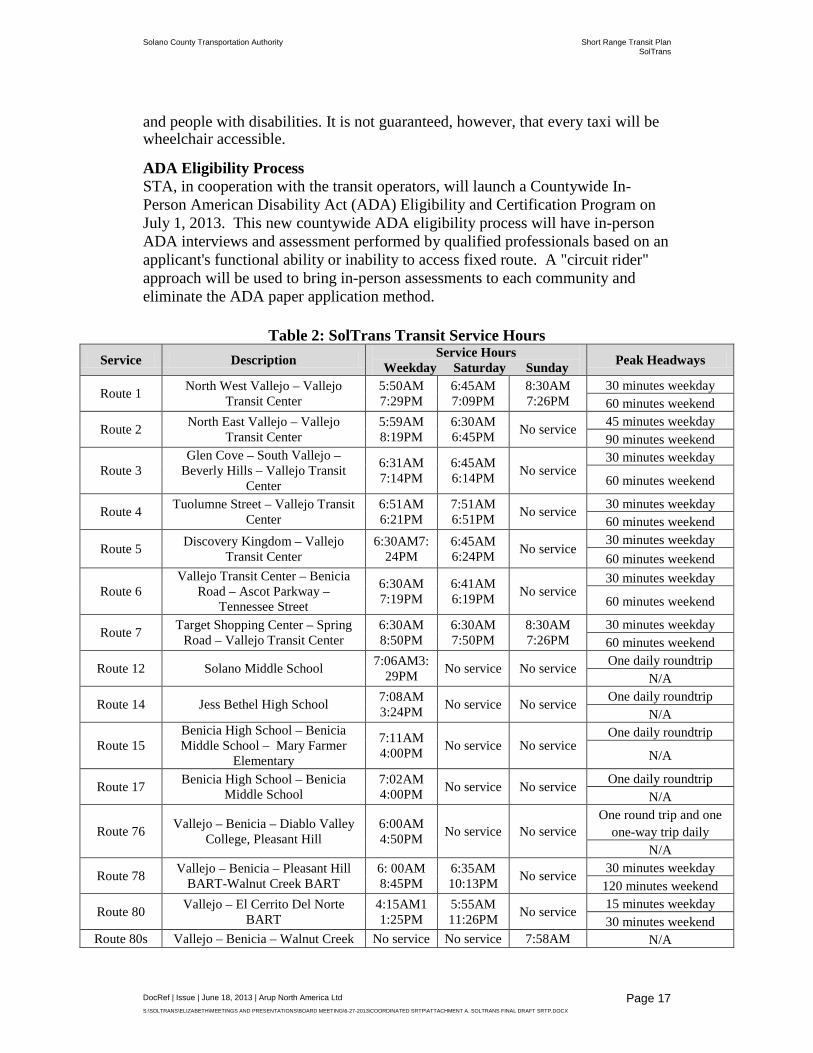
ADA Eligibility Process STA, in cooperation with the transit operators, will launch a Countywide In-Person American Disability Act (ADA) Eligibility and Certification Program on July 1, 2013. This new countywide ADA eligibility process will have in-person ADA interviews and assessment performed by qualified professionals based on an applicant's functional ability or inability to access fixed route. A "circuit rider" approach will be used to bring in-person assessments to each community and eliminate the ADA paper application method.
Table 2: SolTrans Transit Service Hours Service Description Service Hours
Weekday Saturday Sunday Peak Headways
Route 1 North West Vallejo – Vallejo Transit Center
5:50AM 7:29PM
6:45AM 7:09PM
8:30AM 7:26PM
30 minutes weekday 60 minutes weekend
Route 2 North East Vallejo – Vallejo Transit Center
5:59AM 8:19PM
6:30AM 6:45PM No service 45 minutes weekday
90 minutes weekend
Route 3 Glen Cove – South Vallejo –
Beverly Hills – Vallejo Transit Center
6:31AM 7:14PM
6:45AM 6:14PM No service
30 minutes weekday
60 minutes weekend
Route 4 Tuolumne Street – Vallejo Transit Center
6:51AM 6:21PM
7:51AM 6:51PM No service 30 minutes weekday
60 minutes weekend
Route 5 Discovery Kingdom – Vallejo Transit Center
6:30AM7:24PM
6:45AM 6:24PM No service
30 minutes weekday 60 minutes weekend
Route 6 Vallejo Transit Center – Benicia
Road – Ascot Parkway – Tennessee Street
6:30AM 7:19PM
6:41AM 6:19PM No service
30 minutes weekday
60 minutes weekend
Route 7 Target Shopping Center – Spring Road – Vallejo Transit Center
6:30AM 8:50PM
6:30AM 7:50PM
8:30AM 7:26PM
30 minutes weekday 60 minutes weekend
Route 12 Solano Middle School 7:06AM3:29PM No service No service One daily roundtrip
N/A
Route 14 Jess Bethel High School 7:08AM 3:24PM No service No service One daily roundtrip
N/A
Route 15 Benicia High School – Benicia Middle School – Mary Farmer
Elementary
7:11AM 4:00PM No service No service
One daily roundtrip
N/A
Route 17 Benicia High School – Benicia Middle School
7:02AM 4:00PM No service No service One daily roundtrip
N/A
Route 76 Vallejo – Benicia – Diablo Valley College, Pleasant Hill
6:00AM 4:50PM No service No service
One round trip and one one-way trip daily
N/A
Route 78 Vallejo – Benicia – Pleasant Hill BART-Walnut Creek BART
6: 00AM 8:45PM
6:35AM 10:13PM No service 30 minutes weekday
120 minutes weekend
Route 80 Vallejo – El Cerrito Del Norte BART
4:15AM11:25PM
5:55AM 11:26PM No service 15 minutes weekday
30 minutes weekend Route 80s Vallejo – Benicia – Walnut Creek No service No service 7:58AM N/A
Solano County Transportation Authority Short Range Transit Plan SolTrans
DocRef | Issue | June 18, 2013 | Arup North America Ltd S:\SOLTRANS\ELIZABETH\MEETINGS AND PRESENTATIONS\BOARD MEETING\6-27-2013\COORDINATED SRTP\ATTACHMENT A. SOLTRANS FINAL DRAFT SRTP.DOCX
Page 18
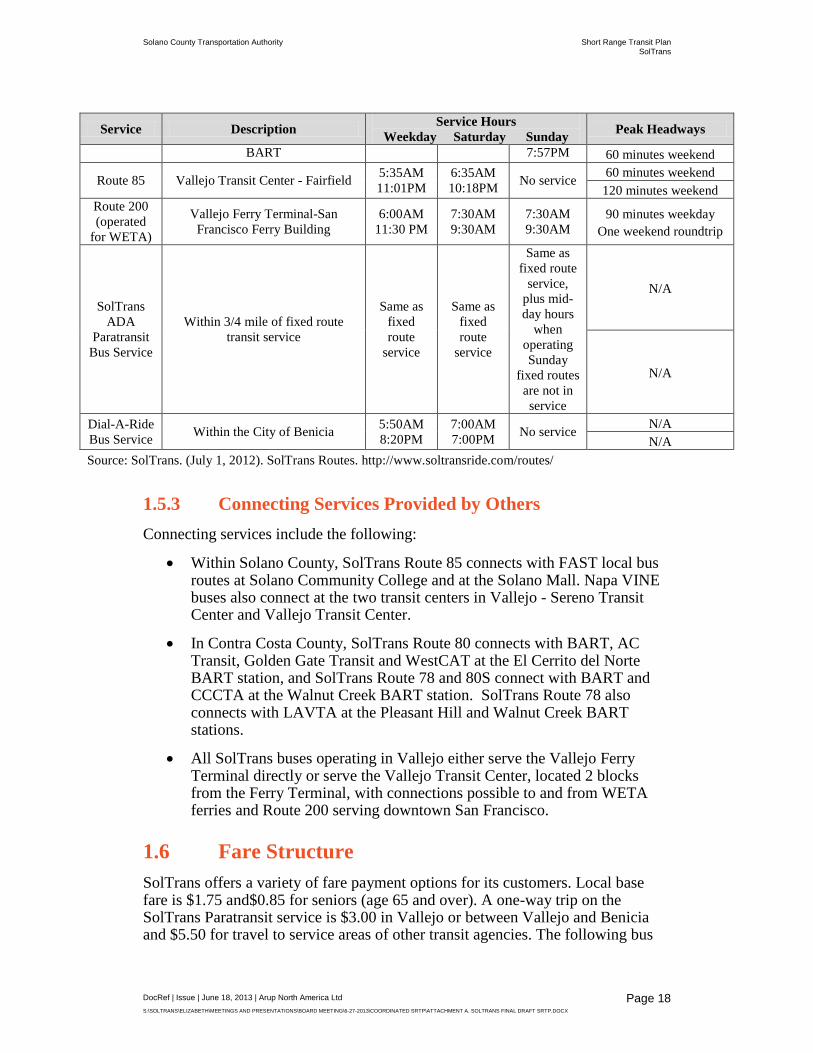
Service Description Service Hours Weekday Saturday Sunday Peak Headways
BART 7:57PM 60 minutes weekend
Route 85 Vallejo Transit Center - Fairfield 5:35AM 11:01PM
6:35AM 10:18PM No service 60 minutes weekend
120 minutes weekend Route 200 (operated
for WETA)
Vallejo Ferry Terminal-San Francisco Ferry Building
6:00AM 11:30 PM
7:30AM 9:30AM
7:30AM 9:30AM
90 minutes weekday One weekend roundtrip
SolTrans ADA
Paratransit Bus Service
Within 3/4 mile of fixed route transit service
Same as fixed route
service
Same as fixed route
service
Same as fixed route
service, plus mid-day hours
when operating Sunday
fixed routes are not in service
N/A
N/A
Dial-A-Ride Bus Service Within the City of Benicia 5:50AM
8:20PM 7:00AM 7:00PM No service N/A
N/A Source: SolTrans. (July 1, 2012). SolTrans Routes. http://www.soltransride.com/routes/
1.5.3 Connecting Services Provided by Others Connecting services include the following:
• Within Solano County, SolTrans Route 85 connects with FAST local bus routes at Solano Community College and at the Solano Mall. Napa VINE buses also connect at the two transit centers in Vallejo - Sereno Transit Center and Vallejo Transit Center.
• In Contra Costa County, SolTrans Route 80 connects with BART, AC Transit, Golden Gate Transit and WestCAT at the El Cerrito del Norte BART station, and SolTrans Route 78 and 80S connect with BART and CCCTA at the Walnut Creek BART station. SolTrans Route 78 also connects with LAVTA at the Pleasant Hill and Walnut Creek BART stations.
• All SolTrans buses operating in Vallejo either serve the Vallejo Ferry Terminal directly or serve the Vallejo Transit Center, located 2 blocks from the Ferry Terminal, with connections possible to and from WETA ferries and Route 200 serving downtown San Francisco.
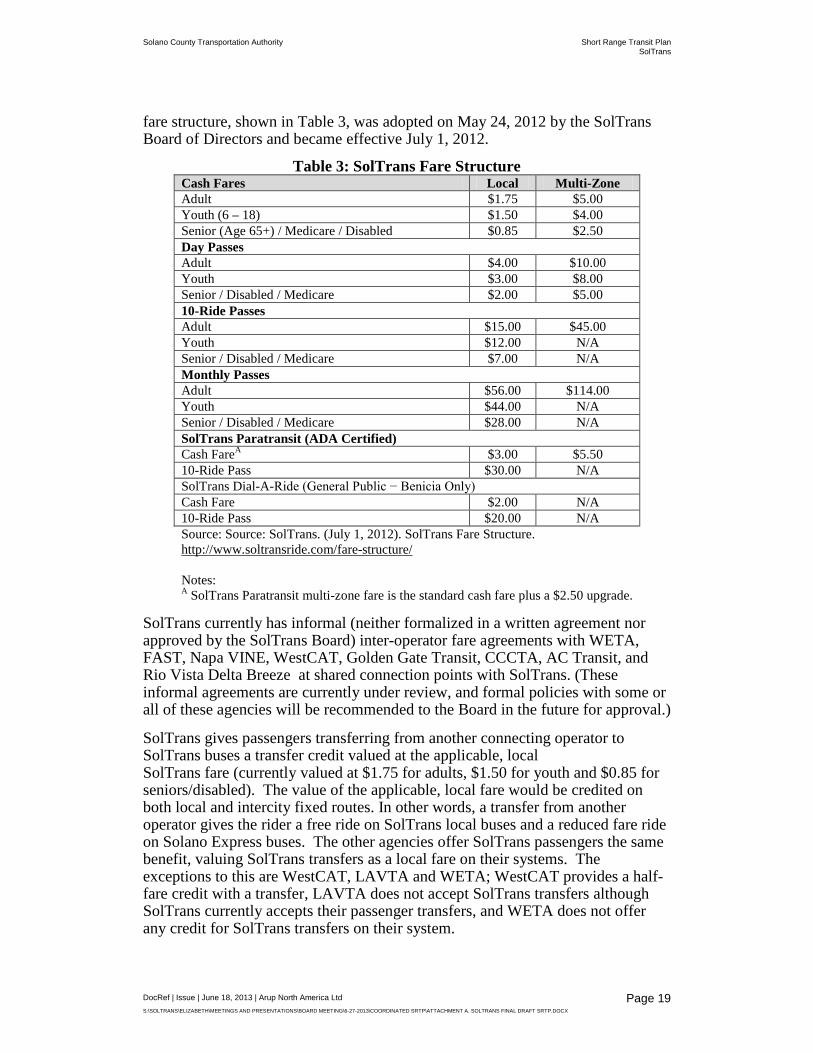
1.6 Fare Structure SolTrans offers a variety of fare payment options for its customers. Local base fare is $1.75 and$0.85 for seniors (age 65 and over). A one-way trip on the SolTrans Paratransit service is $3.00 in Vallejo or between Vallejo and Benicia and $5.50 for travel to service areas of other transit agencies. The following bus
Solano County Transportation Authority Short Range Transit Plan SolTrans
DocRef | Issue | June 18, 2013 | Arup North America Ltd S:\SOLTRANS\ELIZABETH\MEETINGS AND PRESENTATIONS\BOARD MEETING\6-27-2013\COORDINATED SRTP\ATTACHMENT A. SOLTRANS FINAL DRAFT SRTP.DOCX
Page 19
fare structure, shown in Table 3, was adopted on May 24, 2012 by the SolTrans Board of Directors and became effective July 1, 2012.
Table 3: SolTrans Fare Structure Cash Fares Local Multi-Zone Adult $1.75 $5.00 Youth (6 – 18) $1.50 $4.00 Senior (Age 65+) / Medicare / Disabled $0.85 $2.50 Day Passes Adult $4.00 $10.00 Youth $3.00 $8.00 Senior / Disabled / Medicare $2.00 $5.00 10-Ride Passes Adult $15.00 $45.00 Youth $12.00 N/A Senior / Disabled / Medicare $7.00 N/A Monthly Passes Adult $56.00 $114.00 Youth $44.00 N/A Senior / Disabled / Medicare $28.00 N/A SolTrans Paratransit (ADA Certified) Cash FareA $3.00 $5.50 10-Ride Pass $30.00 N/A SolTrans Dial-A-Ride (General Public − Benicia Only) Cash Fare $2.00 N/A 10-Ride Pass $20.00 N/A Source: Source: SolTrans. (July 1, 2012). SolTrans Fare Structure. http://www.soltransride.com/fare-structure/ Notes: A SolTrans Paratransit multi-zone fare is the standard cash fare plus a $2.50 upgrade.
SolTrans currently has informal (neither formalized in a written agreement nor approved by the SolTrans Board) inter-operator fare agreements with WETA, FAST, Napa VINE, WestCAT, Golden Gate Transit, CCCTA, AC Transit, and Rio Vista Delta Breeze at shared connection points with SolTrans. (These informal agreements are currently under review, and formal policies with some or all of these agencies will be recommended to the Board in the future for approval.)
SolTrans gives passengers transferring from another connecting operator to SolTrans buses a transfer credit valued at the applicable, local SolTrans fare (currently valued at $1.75 for adults, $1.50 for youth and $0.85 for seniors/disabled). The value of the applicable, local fare would be credited on both local and intercity fixed routes. In other words, a transfer from another operator gives the rider a free ride on SolTrans local buses and a reduced fare ride on Solano Express buses. The other agencies offer SolTrans passengers the same benefit, valuing SolTrans transfers as a local fare on their systems. The exceptions to this are WestCAT, LAVTA and WETA; WestCAT provides a half-fare credit with a transfer, LAVTA does not accept SolTrans transfers although SolTrans currently accepts their passenger transfers, and WETA does not offer any credit for SolTrans transfers on their system.

Solano County Transportation Authority Short Range Transit Plan SolTrans
DocRef | Issue | June 18, 2013 | Arup North America Ltd S:\SOLTRANS\ELIZABETH\MEETINGS AND PRESENTATIONS\BOARD MEETING\6-27-2013\COORDINATED SRTP\ATTACHMENT A. SOLTRANS FINAL DRAFT SRTP.DOCX
Page 20
SolTrans has additional informal fare agreements with WETA. The day pass and monthly pass for WETA Route 200 currently allow for unlimited travel on SolTrans local fixed-routes, Route 80, and the ferry service. This agreement with WETA will be re-assessed during FY2012-13 due to budgetary constraints. For FY2012-13, WETA passengers are allowed to continue to ride the Route 80 using a ferry pass, but due to budgetary constraints, this agreement is scheduled to end on June 30, 2013.
1.7 Revenue Fleet The revenue fleet consists of the following:
Local Fixed-Route Fleet SolTrans’s 29-vehicle local fixed-route fleet is comprised of 21 low-floor 40-foot Gillig Hybrid/Diesel and 8 Orion V high floor diesel vehicles. These buses accommodate between 39-44 seated passengers per vehicle. All Gilligs and three of the Orion V’s are deployed in active service. The five remaining Orion V’s are part of a contingency fleet, stored and maintained in case of emergency. Two peak vehicles are assigned to each local route (Routes 1 through 6), with Route 7 requiring 3 vehicles. One peak vehicle is assigned to each limited service route (Routes 12, 14, 15, and 17). Nineteen (19) total peak vehicles are in local service.
Intercity Fixed-Route Fleet The intercity fleet is comprised of thirty-five (35) 45-foot Motor Coach Industries (MCI) diesel buses with seating capacity up to 57. Of these, 10 buses are leased to the City of Fairfield and 25 are used by SolTrans for intercity operations. In addition, one Gillig hybrid diesel bus is shared with Route 76 (peak service) and local bus routes (mid-day service). The number of vehicles assigned to regional routes varies between one and five, with one for Route 76, four for Route 78, five for Route 80, one for Route 80S, two for Route 85, and one for Route 200, respectively. Thirteen (13) total vehicles operate in intercity service during the weekday peak. The remaining 13 vehicles are assigned as follows: 3 in the active reserve and 10 in contingency.
Paratransit and Dial-A-Ride Fleet The Dial-A-Ride fleet consists of five vehicles. The active fleet includes two 2007 Ford E-450 vehicles (16 passengers), one 2012 Ford E-450 vehicle (16 passengers), while the reserve fleet includes one 2006 and one 2008 Ford E-450 vehicle (both carrying 16 passengers). Nine (9) vehicles are used for SolTrans Paratransit, including seven 2011 Ford E450 El Dorado vehicles (16 passengers each) in active service and two inactive 2001 Ford E450 El Dorado vehicles (16 passengers each) in contingency.
Support Fleet SolTrans fleet presently includes five maintenance support vehicles and five administrative vehicles in various operating conditions. The support fleet is comprised of light duty vehicles (i.e., cars and trucks) of various makes and models including Ford Super Duty and for F150 vehicles, as well as three Ford Taurus vehicles. The five oldest vehicles will be retired in 2013.
Solano County Transportation Authority Short Range Transit Plan SolTrans
DocRef | Issue | June 18, 2013 | Arup North America Ltd S:\SOLTRANS\ELIZABETH\MEETINGS AND PRESENTATIONS\BOARD MEETING\6-27-2013\COORDINATED SRTP\ATTACHMENT A. SOLTRANS FINAL DRAFT SRTP.DOCX
Page 21
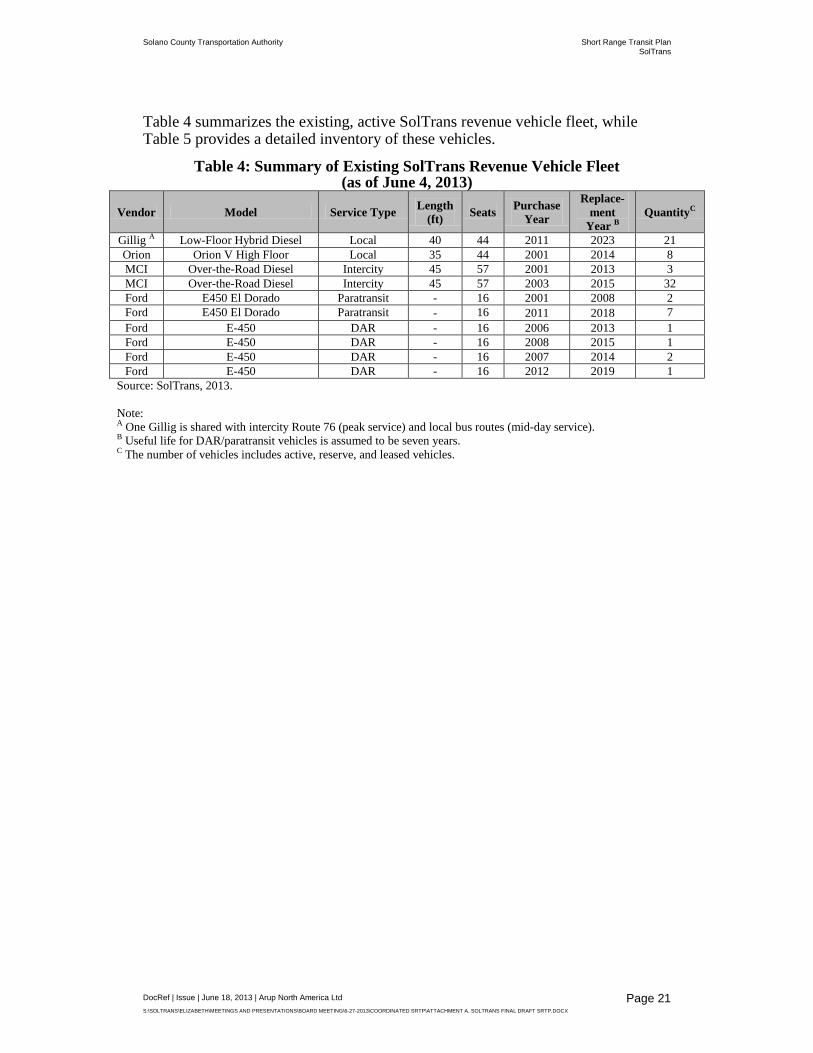
Table 4 summarizes the existing, active SolTrans revenue vehicle fleet, while Table 5 provides a detailed inventory of these vehicles.
Table 4: Summary of Existing SolTrans Revenue Vehicle Fleet (as of June 4, 2013)
Vendor Model Service Type Length (ft) Seats Purchase
Year
Replace-ment
Year B QuantityC
Gillig A Low-Floor Hybrid Diesel Local 40 44 2011 2023 21 Orion Orion V High Floor Local 35 44 2001 2014 8 MCI Over-the-Road Diesel Intercity 45 57 2001 2013 3 MCI Over-the-Road Diesel Intercity 45 57 2003 2015 32 Ford E450 El Dorado Paratransit - 16 2001 2008 2 Ford E450 El Dorado Paratransit - 16 2011 2018 7 Ford E-450 DAR - 16 2006 2013 1 Ford E-450 DAR - 16 2008 2015 1 Ford E-450 DAR - 16 2007 2014 2 Ford E-450 DAR - 16 2012 2019 1
Source: SolTrans, 2013. Note: A One Gillig is shared with intercity Route 76 (peak service) and local bus routes (mid-day service). B Useful life for DAR/paratransit vehicles is assumed to be seven years. C The number of vehicles includes active, reserve, and leased vehicles.
Solano County Transportation Authority Short Range Transit Plan SolTrans
DocRef | Issue | June 18, 2013 | Arup North America Ltd S:\SOLTRANS\ELIZABETH\MEETINGS AND PRESENTATIONS\BOARD MEETING\6-27-2013\COORDINATED SRTP\ATTACHMENT A. SOLTRANS FINAL DRAFT SRTP.DOCX
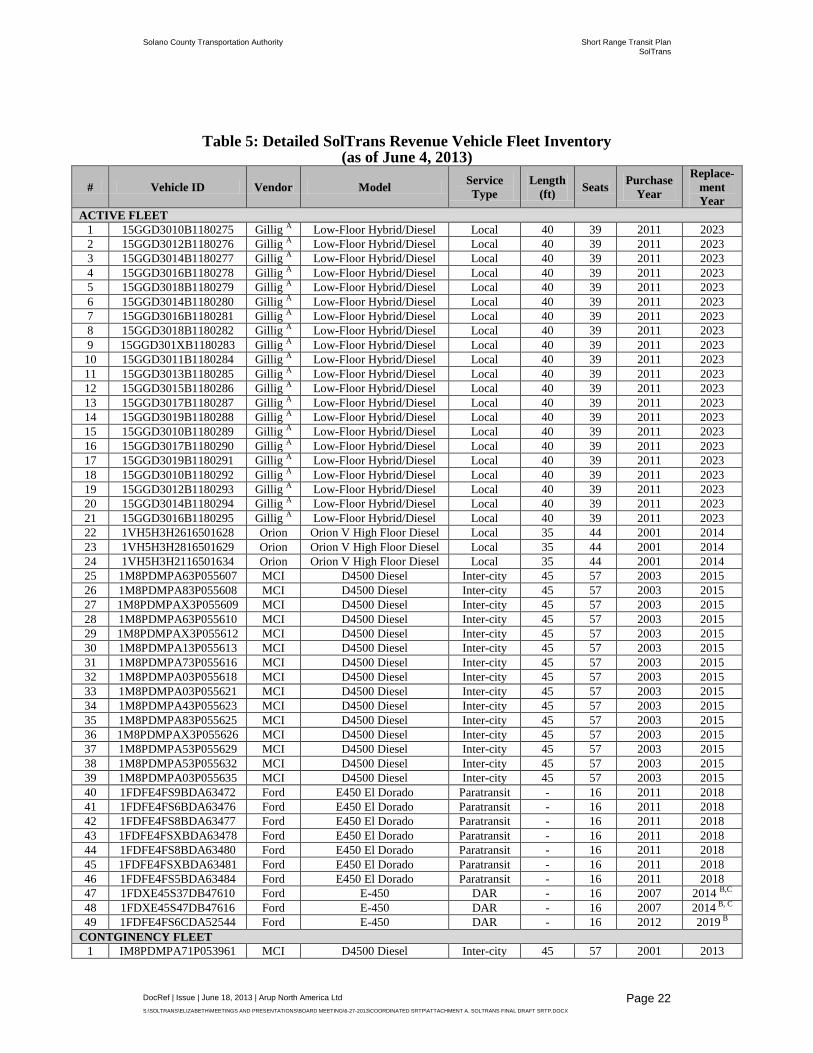
Page 22
Table 5: Detailed SolTrans Revenue Vehicle Fleet Inventory
(as of June 4, 2013)
# Vehicle ID Vendor Model Service Type
Length (ft) Seats Purchase
Year
Replace-ment Year
ACTIVE FLEET 1 15GGD3010B1180275 Gillig A Low-Floor Hybrid/Diesel Local 40 39 2011 2023 2 15GGD3012B1180276 Gillig A Low-Floor Hybrid/Diesel Local 40 39 2011 2023 3 15GGD3014B1180277 Gillig A Low-Floor Hybrid/Diesel Local 40 39 2011 2023 4 15GGD3016B1180278 Gillig A Low-Floor Hybrid/Diesel Local 40 39 2011 2023 5 15GGD3018B1180279 Gillig A Low-Floor Hybrid/Diesel Local 40 39 2011 2023 6 15GGD3014B1180280 Gillig A Low-Floor Hybrid/Diesel Local 40 39 2011 2023 7 15GGD3016B1180281 Gillig A Low-Floor Hybrid/Diesel Local 40 39 2011 2023 8 15GGD3018B1180282 Gillig A Low-Floor Hybrid/Diesel Local 40 39 2011 2023 9 15GGD301XB1180283 Gillig A Low-Floor Hybrid/Diesel Local 40 39 2011 2023 10 15GGD3011B1180284 Gillig A Low-Floor Hybrid/Diesel Local 40 39 2011 2023 11 15GGD3013B1180285 Gillig A Low-Floor Hybrid/Diesel Local 40 39 2011 2023 12 15GGD3015B1180286 Gillig A Low-Floor Hybrid/Diesel Local 40 39 2011 2023 13 15GGD3017B1180287 Gillig A Low-Floor Hybrid/Diesel Local 40 39 2011 2023 14 15GGD3019B1180288 Gillig A Low-Floor Hybrid/Diesel Local 40 39 2011 2023 15 15GGD3010B1180289 Gillig A Low-Floor Hybrid/Diesel Local 40 39 2011 2023 16 15GGD3017B1180290 Gillig A Low-Floor Hybrid/Diesel Local 40 39 2011 2023 17 15GGD3019B1180291 Gillig A Low-Floor Hybrid/Diesel Local 40 39 2011 2023 18 15GGD3010B1180292 Gillig A Low-Floor Hybrid/Diesel Local 40 39 2011 2023 19 15GGD3012B1180293 Gillig A Low-Floor Hybrid/Diesel Local 40 39 2011 2023 20 15GGD3014B1180294 Gillig A Low-Floor Hybrid/Diesel Local 40 39 2011 2023 21 15GGD3016B1180295 Gillig A Low-Floor Hybrid/Diesel Local 40 39 2011 2023 22 1VH5H3H2616501628 Orion Orion V High Floor Diesel Local 35 44 2001 2014 23 1VH5H3H2816501629 Orion Orion V High Floor Diesel Local 35 44 2001 2014 24 1VH5H3H2116501634 Orion Orion V High Floor Diesel Local 35 44 2001 2014 25 1M8PDMPA63P055607 MCI D4500 Diesel Inter-city 45 57 2003 2015 26 1M8PDMPA83P055608 MCI D4500 Diesel Inter-city 45 57 2003 2015 27 1M8PDMPAX3P055609 MCI D4500 Diesel Inter-city 45 57 2003 2015 28 1M8PDMPA63P055610 MCI D4500 Diesel Inter-city 45 57 2003 2015 29 1M8PDMPAX3P055612 MCI D4500 Diesel Inter-city 45 57 2003 2015 30 1M8PDMPA13P055613 MCI D4500 Diesel Inter-city 45 57 2003 2015 31 1M8PDMPA73P055616 MCI D4500 Diesel Inter-city 45 57 2003 2015 32 1M8PDMPA03P055618 MCI D4500 Diesel Inter-city 45 57 2003 2015 33 1M8PDMPA03P055621 MCI D4500 Diesel Inter-city 45 57 2003 2015 34 1M8PDMPA43P055623 MCI D4500 Diesel Inter-city 45 57 2003 2015 35 1M8PDMPA83P055625 MCI D4500 Diesel Inter-city 45 57 2003 2015 36 1M8PDMPAX3P055626 MCI D4500 Diesel Inter-city 45 57 2003 2015 37 1M8PDMPA53P055629 MCI D4500 Diesel Inter-city 45 57 2003 2015 38 1M8PDMPA53P055632 MCI D4500 Diesel Inter-city 45 57 2003 2015 39 1M8PDMPA03P055635 MCI D4500 Diesel Inter-city 45 57 2003 2015 40 1FDFE4FS9BDA63472 Ford E450 El Dorado Paratransit - 16 2011 2018 41 1FDFE4FS6BDA63476 Ford E450 El Dorado Paratransit - 16 2011 2018 42 1FDFE4FS8BDA63477 Ford E450 El Dorado Paratransit - 16 2011 2018 43 1FDFE4FSXBDA63478 Ford E450 El Dorado Paratransit - 16 2011 2018 44 1FDFE4FS8BDA63480 Ford E450 El Dorado Paratransit - 16 2011 2018 45 1FDFE4FSXBDA63481 Ford E450 El Dorado Paratransit - 16 2011 2018 46 1FDFE4FS5BDA63484 Ford E450 El Dorado Paratransit - 16 2011 2018 47 1FDXE45S37DB47610 Ford E-450 DAR - 16 2007 2014 B,C 48 1FDXE45S47DB47616 Ford E-450 DAR - 16 2007 2014 B, C 49 1FDFE4FS6CDA52544 Ford E-450 DAR - 16 2012 2019 B
CONTGINENCY FLEET 1 IM8PDMPA71P053961 MCI D4500 Diesel Inter-city 45 57 2001 2013

Solano County Transportation Authority Short Range Transit Plan SolTrans
DocRef | Issue | June 18, 2013 | Arup North America Ltd S:\SOLTRANS\ELIZABETH\MEETINGS AND PRESENTATIONS\BOARD MEETING\6-27-2013\COORDINATED SRTP\ATTACHMENT A. SOLTRANS FINAL DRAFT SRTP.DOCX
Page 23
# Vehicle ID Vendor Model Service Type
Length (ft) Seats Purchase
Year
Replace-ment Year
2 IM8PDMPA91PO53962 MCI D4500 Diesel Inter-city 45 57 2001 2013 3 1M8PDMPA83P055611 MCI D4500 Diesel Inter-city 45 57 2003 2015 4 1M8PDMPA53P055615 MCI D4500 Diesel Inter-city 45 57 2003 2015 5 1M8PDMPA23P055619 MCI D4500 Diesel Inter-city 45 57 2003 2015 6 1M8PDMPA93P055620 MCI D4500 Diesel Inter-city 45 57 2003 2015 7 1M8PDMPA23P055622 MCI D4500 Diesel Inter-city 45 57 2003 2015 8 1M8PDMPA63P055624 MCI D4500 Diesel Inter-city 45 57 2003 2015 9 1M8PDMPA73P055633 MCI D4500 Diesel Inter-city 45 57 2003 2015 10 1M8PDMPA93P055634 MCI D4500 Diesel Inter-city 45 57 2003 2015 11 1VH5H3H2416501627 Orion Orion V High Floor Diesel Local 35 44 2001 2013 12 1VH5H3H2416501630 Orion Orion V High Floor Diesel Local 35 44 2001 2013 13 1VH5H3H2616501631 Orion Orion V High Floor Diesel Local 35 44 2001 2013 14 1VH5H3H2816501632 Orion Orion V High Floor Diesel Local 35 44 2001 2013 15 1VH5H3H2X16501633 Orion Orion V High Floor Diesel Local 35 44 2001 2013 16 1FDXE45S91HB3322 Ford E450 El Dorado Paratransit - 14 2001 2008 B 17 1FDXE45S21HB03324 Ford E450 El Dorado Paratransit - 14 2001 2008 B 18 1FDXE45S26DB18808 Ford E-450 DAR - 16 2006 2013 B 19 1FD4E45S68DA18541 Ford E-450 DAR - 16 2008 2015 B
VEHICLES LEASED TO CITY OF FAIRFIELD 1 1M8PDMPA13P053963 MCI D4500 Diesel Inter-city 45 57 2001 2013 2 1M8PDMPA13P055614 MCI D4500 Diesel Inter-city 45 57 2003 2015 3 1M8PDMPA13P055617 MCI D4500 Diesel Inter-city 45 57 2003 2015 4 1M8PDMPA13P055627 MCI D4500 Diesel Inter-city 45 57 2003 2015 5 1M8PDMPA33P055628 MCI D4500 Diesel Inter-city 45 57 2003 2015 6 1M8PDMPA13P055630 MCI D4500 Diesel Inter-city 45 57 2003 2015 7 1M8PDMPA13P055631 MCI D4500 Diesel Inter-city 45 57 2003 2015 8 1M8PDMPA13P055636 MCI D4500 Diesel Inter-city 45 57 2003 2015 9 1M8PDMPA13P055637 MCI D4500 Diesel Inter-city 45 57 2003 2015 10 1M8PDMPA13P055639 MCI D4500 Diesel Inter-city 45 57 2003 2015
Source: SolTrans, 2013. Note: A One Gillig is shared with intercity Route 76 (peak service) and local bus routes (mid-day service). B Useful life for DAR/paratransit vehicles is assumed to be seven years. C The number of vehicles includes active, reserve, and leased vehicles.
Solano County Transportation Authority Short Range Transit Plan SolTrans
DocRef | Issue | June 18, 2013 | Arup North America Ltd S:\SOLTRANS\ELIZABETH\MEETINGS AND PRESENTATIONS\BOARD MEETING\6-27-2013\COORDINATED SRTP\ATTACHMENT A. SOLTRANS FINAL DRAFT SRTP.DOCX
Page 24
1.8 Existing Facilities Existing facilities include the following:
Administrative/Maintenance The SolTrans Board approved a resolution accepting the transfer of assets from the City of Vallejo to SolTrans. These assets include the Downtown Vallejo Transit Center and adjacent parking lots, Sereno Transit Center, and Curtola & Lemon Park-and-Ride. SolTrans maintains a long-term lease with the City of Vallejo for the use of the Bus Maintenance and Administrative Facility at 1850 Broadway Street including the land underlying the facility. The facility was constructed in 1988 and functions as the main transit maintenance office for SolTrans. Functions that are performed at this facility include fueling, bus storage, washing, fare handling and training, and bus operator customer service and dispatching.
Park-and-Rides Located at Curtola Parkway and Lemon Street, the Curtola & Lemon Park-and-Ride is owned by SolTrans. It is being expanded to three parking structures to address overcapacity issues. It sits at the northwest and southwest corner of Curtola Parkway and Lemon Street and is currently equipped with 485 parking spaces.
Major Stations and Stops Three major transit facilities are operated in the service areas:
• Vallejo Transit Center - Located at 311 Sacramento Street in downtown Vallejo, this newly constructed facility is the main hub for all Vallejo destined bus routes and also houses the SolTrans operations and administration offices. It has 12 bus bays, 20 bike lockers, passenger amenities and adjacent parking lots. The Center has 91 total parking spaces, with plans to dedicate 17 spaces in the lot south of the transit center for SolTrans employees only. Of the remaining spaces, eight are dedicated for disabled parking.
• Vallejo Ferry Terminal - The Vallejo Ferry Terminal is located at 289 Mare Island Way in Vallejo and functions as a ferry and bus terminal, where patrons can park and access either service. Additionally, patrons can purchase ferry tickets and passes and SFMTA stickers at the ticket office. The facility was constructed in 1996 and is owned by the City of Vallejo.
• Sereno Transit Center - Located between Sonoma Blvd and Broadway St on the north sides of Sereno; the Transit Center accommodates six bus bays and was constructed in 2004.
Bus Stops There are currently 405 bus stops in the SolTrans system; approximately 113 of these have a bench, while 66 have a shelter in addition to a standard bus stop sign. Of these, 351 signed stops exist in Vallejo, 37 in Benicia, 12 in Fairfield, two in El Cerrito, two in Pleasant Hill, and one in Walnut Creek, respectively. Survey efforts to update data on the amenities at each location are on-going.
Solano County Transportation Authority Short Range Transit Plan SolTrans
DocRef | Issue | June 18, 2013 | Arup North America Ltd S:\SOLTRANS\ELIZABETH\MEETINGS AND PRESENTATIONS\BOARD MEETING\6-27-2013\COORDINATED SRTP\ATTACHMENT A. SOLTRANS FINAL DRAFT SRTP.DOCX
Page 25
Bicycle Facilities Bicycle facilities exist at the Vallejo Transit Center and Curtola & Lemon Park-and-Ride. No bicycle facilities exist at the Sereno Transit Center.
The Vallejo Transit Center has 10 bike cages and a total of 20 bike lockers. These are new bicycle facilities operated by eLock Technologies LLC (Bike Link); SolTrans pays for facility maintenance and the operator collects the revenue. Customers must pay a fee of 5 cents per hour (or 12 cents per hour if time used exceeds 10 days).
The Curtola and Lemon Park-and-Ride has four bike cages and a total of eight bike lockers. These facilities were previously operated by the City of Vallejo Transit and are currently not operated. The Curtola & Lemon Park-and-Ride Facility Expansion, to be completed by the spring of 2014, proposes new bicycle facilities.
Based on data from the agency’s historical bus stop inventory from 2007 and from recent survey efforts, SolTrans staff has estimated that there are no bicycle facilities at bus stops throughout Vallejo. Data on bicycle amenities at Benicia bus stops is limited, although several stops have bike bollards. More data collection is needed to gather updated information on existing bicycle amenities at bus stops.

Solano County Transportation Authority Short Range Transit Plan SolTrans
DocRef | Issue | June 18, 2013 | Arup North America Ltd S:\SOLTRANS\ELIZABETH\MEETINGS AND PRESENTATIONS\BOARD MEETING\6-27-2013\COORDINATED SRTP\ATTACHMENT A. SOLTRANS FINAL DRAFT SRTP.DOCX
Page 26
2 Goal, Objectives, Measures, and Standards
2.1 Introduction This section reviews and presents modifications to the adopted organizational goals, objectives, and performance measures and standards (GOMS) for SolTrans. GOMS modifications seek to provide a standard baseline to compare and enhance the goals, objectives, performance measures and standards for all operators as well as provide the basis for creating a comprehensive and consistent set of goals and objectives that respond to the individual needs and characteristics for all operators as part of the Solano County Coordinated Short Range Transit Plan (SCSRTP).
The goals, objectives, measures and standards that guide SolTrans are based on a performance measuring system grounded in the agency’s Mission Statement as adopted on May 13, 2013:
“We deliver safe, reliable and efficient transportation services that link people, jobs, and our communities.”
2.2 Definition of Terms Each operator uses unique terminology in structuring how their goals and objectives are organized. Some of the definitions are summarized below:
• Goals - Goals are broad and enduring statements of purpose that outline the reason for which transit services are operated. Goals are statements that qualify the desired results. They are the ends toward which effort is directed. They are general and timeless, but theoretically attainable.
• Objectives - Objectives are intended to be more specific statements of the methods proposed for accomplishing the goals. Objectives provide quantifiable measures of the goals. They are more precise and capable of both attainment and measurement.
• Measures - These are the criteria by which the achievement of the objectives is judged. They usually provide indications of efficiency or effectiveness. Measures and standards set quantifiable targets for achieving the objectives.
• Standards - Standards represent an acceptable level of accomplishment which demonstrates achievement of an objective. Standards may be quantitative or qualitative. Standards set quantifiable targets for achieving the adopted goals.
2.3 Prior SRTP Goals, Objectives, Measures and Standards
In addition to the mission statement, SolTrans developed seven guiding principles used to assist in the creation of the new agency. From the seven guiding principles are five core values which support the SolTrans mission and vision:
Solano County Transportation Authority Short Range Transit Plan SolTrans
DocRef | Issue | June 18, 2013 | Arup North America Ltd S:\SOLTRANS\ELIZABETH\MEETINGS AND PRESENTATIONS\BOARD MEETING\6-27-2013\COORDINATED SRTP\ATTACHMENT A. SOLTRANS FINAL DRAFT SRTP.DOCX
Page 27
• Efficiency • Effectiveness • Responsiveness • Inclusiveness • Environmental Consciousness
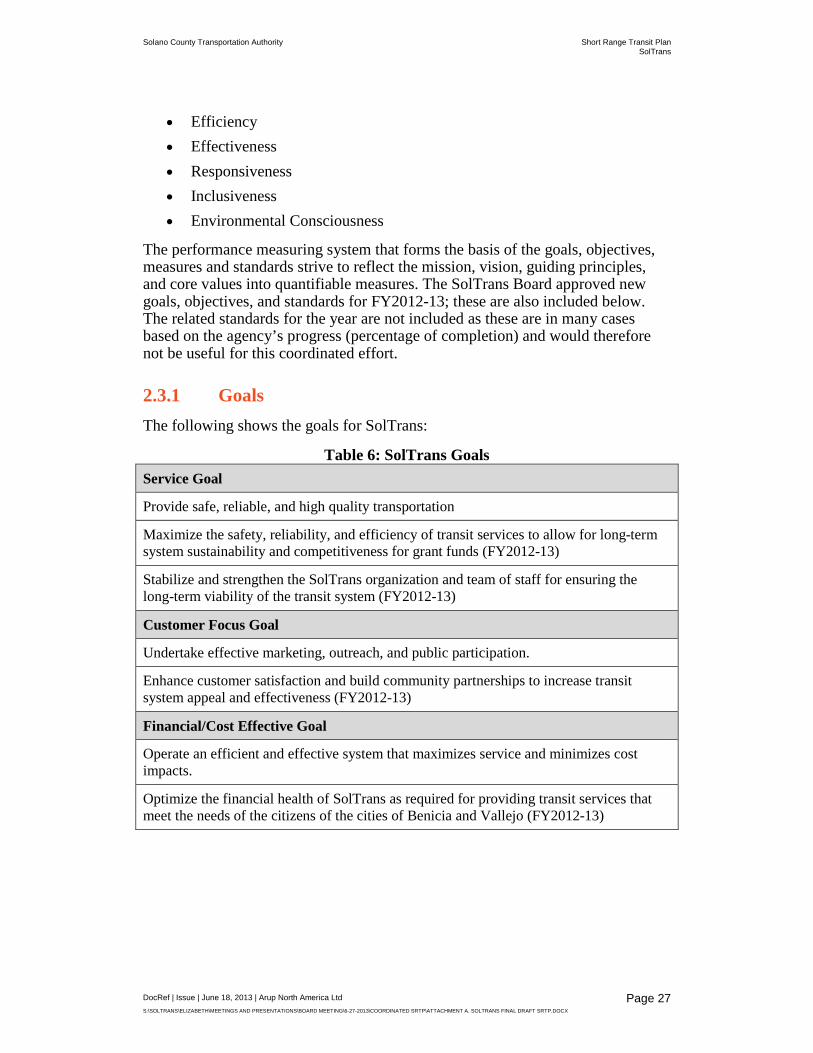
The performance measuring system that forms the basis of the goals, objectives, measures and standards strive to reflect the mission, vision, guiding principles, and core values into quantifiable measures. The SolTrans Board approved new goals, objectives, and standards for FY2012-13; these are also included below. The related standards for the year are not included as these are in many cases based on the agency’s progress (percentage of completion) and would therefore not be useful for this coordinated effort.
2.3.1 Goals The following shows the goals for SolTrans:
Table 6: SolTrans Goals Service Goal
Provide safe, reliable, and high quality transportation
Maximize the safety, reliability, and efficiency of transit services to allow for long-term system sustainability and competitiveness for grant funds (FY2012-13)
Stabilize and strengthen the SolTrans organization and team of staff for ensuring the long-term viability of the transit system (FY2012-13)
Customer Focus Goal
Undertake effective marketing, outreach, and public participation.
Enhance customer satisfaction and build community partnerships to increase transit system appeal and effectiveness (FY2012-13)
Financial/Cost Effective Goal
Operate an efficient and effective system that maximizes service and minimizes cost impacts.
Optimize the financial health of SolTrans as required for providing transit services that meet the needs of the citizens of the cities of Benicia and Vallejo (FY2012-13)
Solano County Transportation Authority Short Range Transit Plan SolTrans
DocRef | Issue | June 18, 2013 | Arup North America Ltd S:\SOLTRANS\ELIZABETH\MEETINGS AND PRESENTATIONS\BOARD MEETING\6-27-2013\COORDINATED SRTP\ATTACHMENT A. SOLTRANS FINAL DRAFT SRTP.DOCX
Page 28
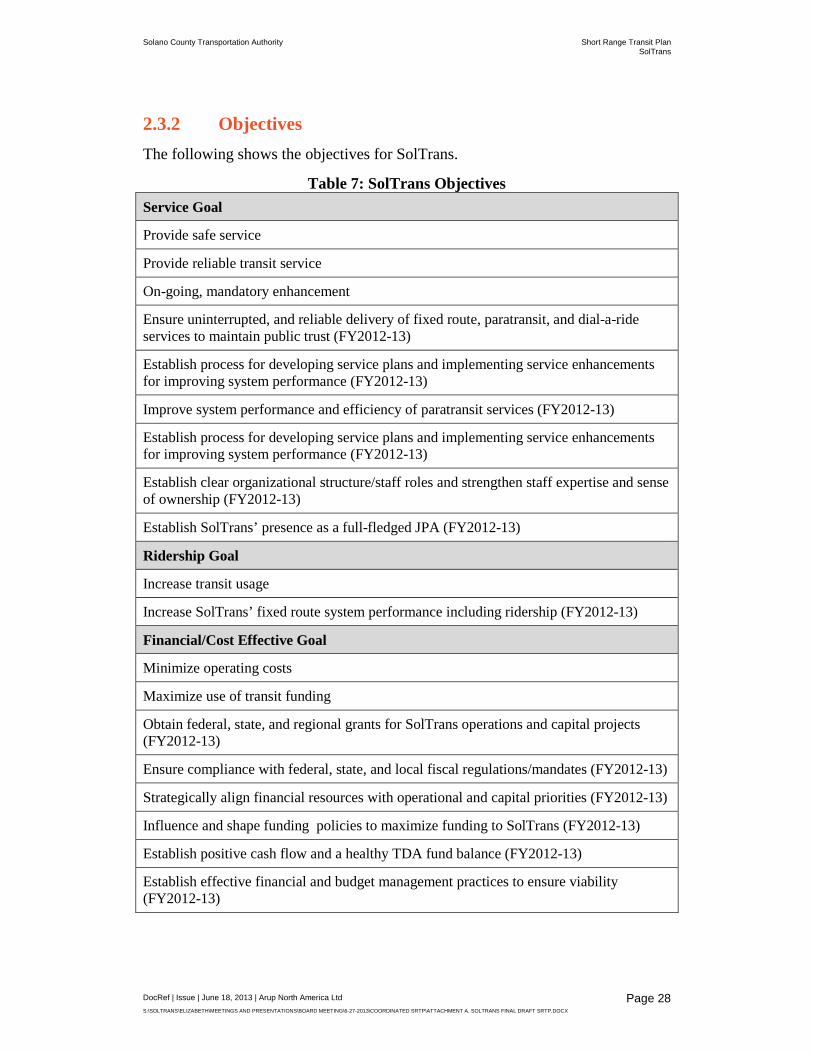
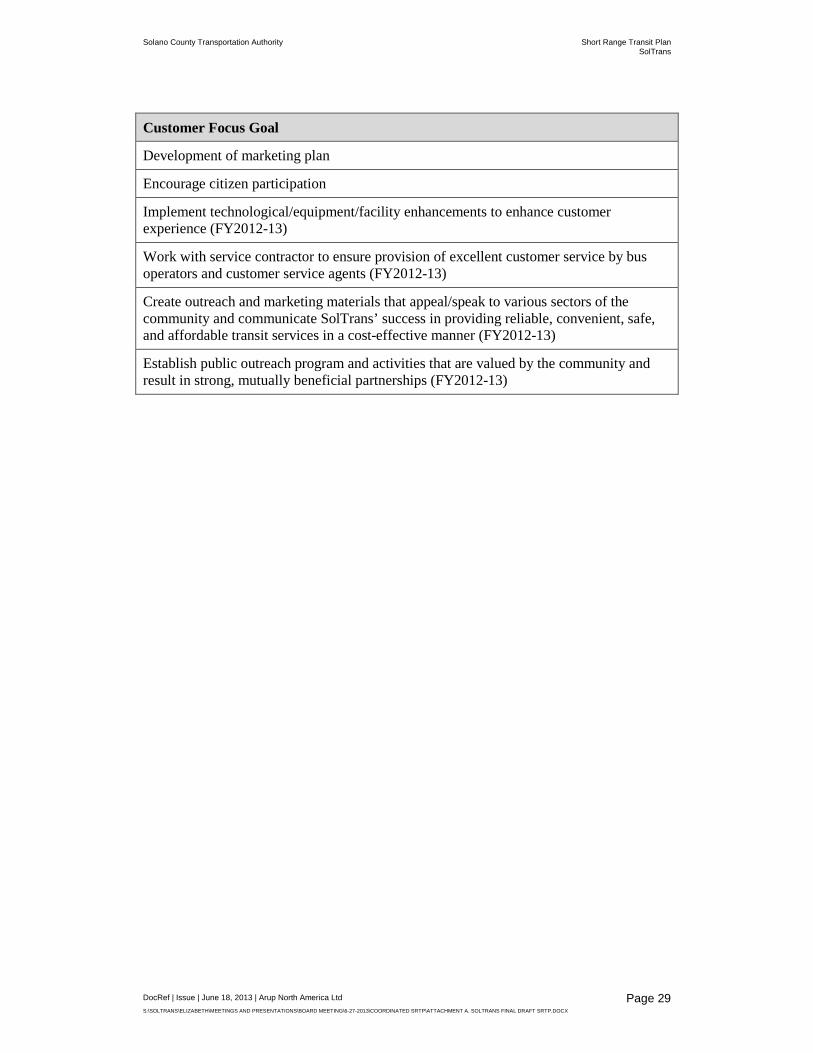
2.3.2 Objectives The following shows the objectives for SolTrans.
Table 7: SolTrans Objectives Service Goal
Provide safe service
Provide reliable transit service
On-going, mandatory enhancement
Ensure uninterrupted, and reliable delivery of fixed route, paratransit, and dial-a-ride services to maintain public trust (FY2012-13)
Establish process for developing service plans and implementing service enhancements for improving system performance (FY2012-13)
Improve system performance and efficiency of paratransit services (FY2012-13)
Establish process for developing service plans and implementing service enhancements for improving system performance (FY2012-13)
Establish clear organizational structure/staff roles and strengthen staff expertise and sense of ownership (FY2012-13)
Establish SolTrans’ presence as a full-fledged JPA (FY2012-13)
Ridership Goal
Increase transit usage
Increase SolTrans’ fixed route system performance including ridership (FY2012-13)
Financial/Cost Effective Goal
Minimize operating costs
Maximize use of transit funding
Obtain federal, state, and regional grants for SolTrans operations and capital projects (FY2012-13)
Ensure compliance with federal, state, and local fiscal regulations/mandates (FY2012-13)
Strategically align financial resources with operational and capital priorities (FY2012-13)
Influence and shape funding policies to maximize funding to SolTrans (FY2012-13)
Establish positive cash flow and a healthy TDA fund balance (FY2012-13)
Establish effective financial and budget management practices to ensure viability (FY2012-13)
Solano County Transportation Authority Short Range Transit Plan SolTrans
DocRef | Issue | June 18, 2013 | Arup North America Ltd S:\SOLTRANS\ELIZABETH\MEETINGS AND PRESENTATIONS\BOARD MEETING\6-27-2013\COORDINATED SRTP\ATTACHMENT A. SOLTRANS FINAL DRAFT SRTP.DOCX
Page 29
Customer Focus Goal
Development of marketing plan
Encourage citizen participation
Implement technological/equipment/facility enhancements to enhance customer experience (FY2012-13)
Work with service contractor to ensure provision of excellent customer service by bus operators and customer service agents (FY2012-13)
Create outreach and marketing materials that appeal/speak to various sectors of the community and communicate SolTrans’ success in providing reliable, convenient, safe, and affordable transit services in a cost-effective manner (FY2012-13)
Establish public outreach program and activities that are valued by the community and result in strong, mutually beneficial partnerships (FY2012-13)
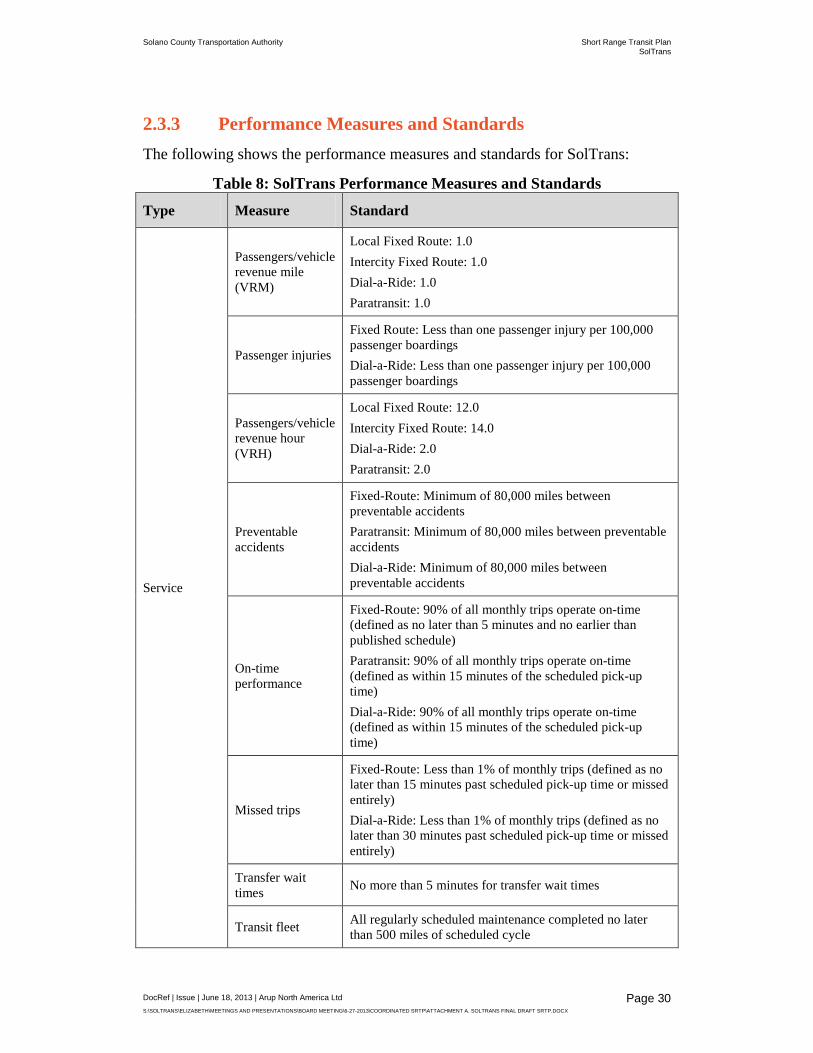
Solano County Transportation Authority Short Range Transit Plan SolTrans
DocRef | Issue | June 18, 2013 | Arup North America Ltd S:\SOLTRANS\ELIZABETH\MEETINGS AND PRESENTATIONS\BOARD MEETING\6-27-2013\COORDINATED SRTP\ATTACHMENT A. SOLTRANS FINAL DRAFT SRTP.DOCX
Page 30
2.3.3 Performance Measures and Standards The following shows the performance measures and standards for SolTrans:
Table 8: SolTrans Performance Measures and Standards
Type Measure Standard
Service
Passengers/vehicle revenue mile (VRM)
Local Fixed Route: 1.0 Intercity Fixed Route: 1.0 Dial-a-Ride: 1.0 Paratransit: 1.0
Passenger injuries
Fixed Route: Less than one passenger injury per 100,000 passenger boardings Dial-a-Ride: Less than one passenger injury per 100,000 passenger boardings
Passengers/vehicle revenue hour (VRH)
Local Fixed Route: 12.0 Intercity Fixed Route: 14.0 Dial-a-Ride: 2.0 Paratransit: 2.0
Preventable accidents
Fixed-Route: Minimum of 80,000 miles between preventable accidents Paratransit: Minimum of 80,000 miles between preventable accidents Dial-a-Ride: Minimum of 80,000 miles between preventable accidents
On-time performance
Fixed-Route: 90% of all monthly trips operate on-time (defined as no later than 5 minutes and no earlier than published schedule) Paratransit: 90% of all monthly trips operate on-time (defined as within 15 minutes of the scheduled pick-up time) Dial-a-Ride: 90% of all monthly trips operate on-time (defined as within 15 minutes of the scheduled pick-up time)
Missed trips
Fixed-Route: Less than 1% of monthly trips (defined as no later than 15 minutes past scheduled pick-up time or missed entirely) Dial-a-Ride: Less than 1% of monthly trips (defined as no later than 30 minutes past scheduled pick-up time or missed entirely)
Transfer wait times No more than 5 minutes for transfer wait times
Transit fleet All regularly scheduled maintenance completed no later than 500 miles of scheduled cycle

Solano County Transportation Authority Short Range Transit Plan SolTrans
DocRef | Issue | June 18, 2013 | Arup North America Ltd S:\SOLTRANS\ELIZABETH\MEETINGS AND PRESENTATIONS\BOARD MEETING\6-27-2013\COORDINATED SRTP\ATTACHMENT A. SOLTRANS FINAL DRAFT SRTP.DOCX
Page 31
Type Measure Standard
Transit facilities maintenance program
Implement Transit Facilities Maintenance Program
Road calls
Fixed-Route: No less than 10,000 miles between road calls (defined as incidence where service is interrupted longer than 5 minutes due to a mechanical failure (except for flat tires)) Paratransit: No less than 10,000 miles between road calls (defined as incidence where service is interrupted longer than 5 minutes due to a mechanical failure (except for flat tires)) Dial-a-Ride: No less than 10,000 miles between road calls (defined as incidence where service is interrupted longer than 5 minutes due to a mechanical failure (except for flat tires))
Demand-response trip reservations
90% of DAR customers and all ADA-eligible trips scheduled within 60 minutes of requested pick-up time
Demand-response trip denials
Zero monthly trip requests result in a denial due to capacity constraints (as defined by the Americans with Disabilities Act of 1990) No more than 3% of total monthly trip requests result in a denial due to customer refusal of a scheduled trip offered within 60-minutes of the original, requested pick-up time.
Regularly programmed service evaluations
Independent evaluations at intervals of no greater than five years
Regularly programmed data collection and reporting
Monthly performance reports no later than the 15th of each month (including such information as vehicle service hours, vehicle service mileage, passenger data, fare revenue, ridership, road calls, on-time performance, complaints, missed trips, accidents, and injuries)
Ridership Annual growth in ridership
Local Fixed-Route: 2.0% Intercity Fixed Route: 1.0% Dial-a-Ride: 1.0%
Customer Focus
Complaint resolution
Monthly reports detailing number and type of complaint as well as resolution status
Professional development
Offer mandatory and optional training opportunities to improve safety and professional development
Marketing plan development (actual expenditures)
Not less than 1.0% of SolTrans’ annual operating budget (note – specific marketing of SolanoExpress intercity commuter express routes is managed by the Solano Transportation Authority)

Solano County Transportation Authority Short Range Transit Plan SolTrans
DocRef | Issue | June 18, 2013 | Arup North America Ltd S:\SOLTRANS\ELIZABETH\MEETINGS AND PRESENTATIONS\BOARD MEETING\6-27-2013\COORDINATED SRTP\ATTACHMENT A. SOLTRANS FINAL DRAFT SRTP.DOCX
Page 32
Type Measure Standard
Provide various opportunities for customer feedback (encourage citizen participation)
Conduct recurring surveys of transit customers Conduct annual outreach prior to meetings to encourage public input on unmet transit needs (TDA Article 8)
Financial/Cost Effectiveness
Operating cost / vehicle revenue hour (VRH)
Local Fixed-Route: $99.00 Intercity Fixed Route: $115.00 Demand Response: $78.00
Operating cost / vehicle revenue mile (VRM)
Local Fixed-Route: $6.00 Intercity Fixed Route: $6.00 Demand Response: $4.50
Operating cost / passenger
Local Fixed-Route: $8.00 Intercity Fixed Route: $8.00 Demand Responsive: $35.00
Farebox recovery Local Fixed-Route: 20% Intercity Fixed Route: 27% Demand Response: 10%
2.3.4 Opportunities for Improvement It is notable that SolTrans is the only operator in Solano County that has a Mission Statement that includes a role for transit to help reduce traffic congestion. Opportunities for improvement include the following:
• Establishment of ridership goals; • Establishment of regional coordination goals, objectives, measures and
standards; • Establishment of land use goal, objectives, measures and standards; and • Establishment of measures and standards for fixed route service frequency.

Solano County Transportation Authority Short Range Transit Plan SolTrans
DocRef | Issue | June 18, 2013 | Arup North America Ltd S:\SOLTRANS\ELIZABETH\MEETINGS AND PRESENTATIONS\BOARD MEETING\6-27-2013\COORDINATED SRTP\ATTACHMENT A. SOLTRANS FINAL DRAFT SRTP.DOCX
Page 33
2.4 Modifications Incorporated in to this SRTP The following modifications are incorporated to improve SolTrans’s GOMS:
• Develop a ridership goal o Increase public transit ridership to productively utilize available
service Annually increase transit ridership
• Local Fixed Route: 2.0% • Intercity Fixed Route: 1.0% • Dial-a-Ride: 1.0%
• Develop a regional coordination goal with corresponding objectives, measures and standards
o Coordinate local and intercity public transit services Coordinate fare collection and coordinate schedules at
transit centers • Provide Clipper for transfers between local and
intercity transit services • Transfer wait times should be no more than 5
minutes between local buses and no more than 15 minutes between local and intercity buses at transit centers
• Add measures and standards for fixed route service frequency o Provide attractive service
Fixed route service frequency should be 30 minutes during peak times and 60 minutes during off-peak times unless otherwise warranted by demand
• Add goals, objectives, measures, and standards for land use o Encourage integration of public transit and land use planning
Submit public transit needs during cities’ development review and approval process
• Follow cities’ procedures for incorporating transit infrastructure
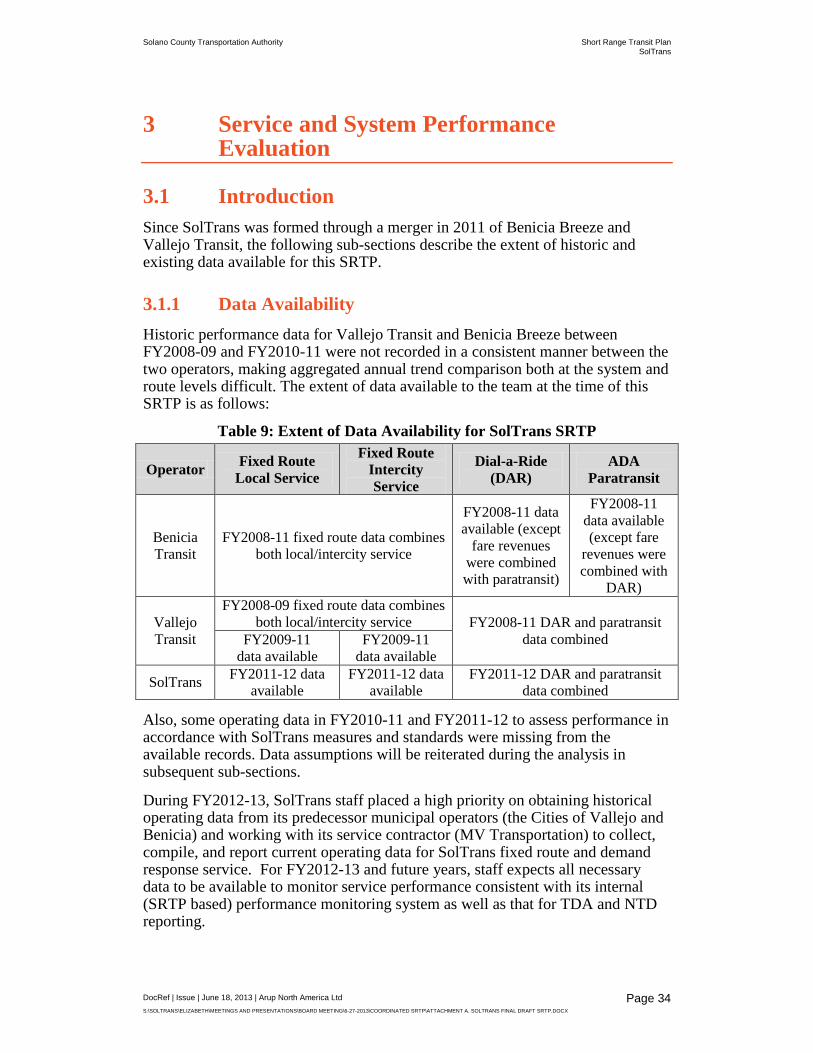
Solano County Transportation Authority Short Range Transit Plan SolTrans
DocRef | Issue | June 18, 2013 | Arup North America Ltd S:\SOLTRANS\ELIZABETH\MEETINGS AND PRESENTATIONS\BOARD MEETING\6-27-2013\COORDINATED SRTP\ATTACHMENT A. SOLTRANS FINAL DRAFT SRTP.DOCX
Page 34
3 Service and System Performance Evaluation
3.1 Introduction Since SolTrans was formed through a merger in 2011 of Benicia Breeze and Vallejo Transit, the following sub-sections describe the extent of historic and existing data available for this SRTP.
3.1.1 Data Availability Historic performance data for Vallejo Transit and Benicia Breeze between FY2008-09 and FY2010-11 were not recorded in a consistent manner between the two operators, making aggregated annual trend comparison both at the system and route levels difficult. The extent of data available to the team at the time of this SRTP is as follows:
Table 9: Extent of Data Availability for SolTrans SRTP
Operator Fixed Route Local Service
Fixed Route Intercity Service
Dial-a-Ride (DAR)
ADA Paratransit
Benicia Transit
FY2008-11 fixed route data combines both local/intercity service
FY2008-11 data available (except
fare revenues were combined with paratransit)
FY2008-11 data available (except fare
revenues were combined with
DAR)
Vallejo Transit
FY2008-09 fixed route data combines both local/intercity service FY2008-11 DAR and paratransit
data combined FY2009-11 data available
FY2009-11 data available
SolTrans FY2011-12 data available
FY2011-12 data available
FY2011-12 DAR and paratransit data combined
Also, some operating data in FY2010-11 and FY2011-12 to assess performance in accordance with SolTrans measures and standards were missing from the available records. Data assumptions will be reiterated during the analysis in subsequent sub-sections.
During FY2012-13, SolTrans staff placed a high priority on obtaining historical operating data from its predecessor municipal operators (the Cities of Vallejo and Benicia) and working with its service contractor (MV Transportation) to collect, compile, and report current operating data for SolTrans fixed route and demand response service. For FY2012-13 and future years, staff expects all necessary data to be available to monitor service performance consistent with its internal (SRTP based) performance monitoring system as well as that for TDA and NTD reporting.
Solano County Transportation Authority Short Range Transit Plan SolTrans
DocRef | Issue | June 18, 2013 | Arup North America Ltd S:\SOLTRANS\ELIZABETH\MEETINGS AND PRESENTATIONS\BOARD MEETING\6-27-2013\COORDINATED SRTP\ATTACHMENT A. SOLTRANS FINAL DRAFT SRTP.DOCX
Page 35
3.1.2 Performance Analysis Approach and Framework The 2012 SolTrans SRTP has already separately assessed performance of the Vallejo and Benicia systems up to FY2010-11. Thus, the focus of this SRTP analysis is on recent performance – particularly after the 2011 merger and service changes implemented in July 2012. The following approach is applied to SolTrans to accommodate its unique situation:
• Trend analysis over the four year period (FY2008-12), assessing ridership, fare revenue, revenue vehicle hours, and operating costs, uses combined Benicia Breeze and Vallejo Transit from FY2008-11 prior to the merger, and consolidated SolTrans information for FY2011-12.
• Quantitative SolTrans system and route level service data evaluated by assessing FY2010-11 and FY2011-12 performance compared to standards to show how SolTrans performed before and after the 2011 merger.
• Qualitative SolTrans service information evaluated by assessing FY2011-12 and to-date FY2012-13 performance compared to standards to show how SolTrans is currently performing before and after the July 2012 service change. FY2012-13 data includes the July-December 2012 period.
• STA Intercity and MTC Regional Express Bus services evaluated by assessing the most recent “full-year’ of data (FY2011-12) to show how SolTrans intercity services perform against STA Intercity Transit Funding Agreement and regional TSP and RM2 standards.
3.2 System Trends The analysis of fixed route local and intercity service as well as dial-a-ride (DAR) services for SolTrans from FY2008-09 through FY2011-12 includes consolidated performance for Vallejo Transit and Benicia Breeze for the first three years, and consolidated SolTrans performance for the last year (FY2011-12). Annual performance year-to-year is not always directly comparable (i.e., not strictly an apples-to-apples comparison) due to different accounting/recording procedures within Vallejo Transit and Benicia Breeze as noted in Table 9. Please see the notes on individual figures for assumptions underlying each performance metric.
3.2.1 Ridership Figure 4 shows total system ridership on fixed route local and intercity service as well as general public dial-a-ride (DAR) and ADA Paratransit services for SolTrans from FY2008-09 through FY2011-12 (including combined Vallejo Transit and Benicia Breeze performance from FY2008-09 through FY2010-11 and SolTrans performance after the merger for FY2011-12). SolTrans ridership peaked at around 1.78 million in FY2008-09, and, in the two years prior to the 2011 merger, fell to just over 1.58 million, about an 11% decrease. After the merger, ridership fell to 1.47 million in FY2011-12, a decline in total ridership since FY2008-09 (of nearly 310,000 riders or 17.3%) due to general economic recession and the consolidation and elimination of routes.

Solano County Transportation Authority Short Range Transit Plan SolTrans
DocRef | Issue | June 18, 2013 | Arup North America Ltd S:\SOLTRANS\ELIZABETH\MEETINGS AND PRESENTATIONS\BOARD MEETING\6-27-2013\COORDINATED SRTP\ATTACHMENT A. SOLTRANS FINAL DRAFT SRTP.DOCX
Page 36
Local fixed route service accounted for just over half of total ridership in FY2011-12, although this percentage was slightly higher in previous years (about 58%). Local fixed route ridership fell by nearly 168,000 after the merger to 768,000 in FY2011-12, a decrease of about 18%.1 Over the four year period, ridership decreased from 1,731,000 to 768,203, a 56% decrease.
Intercity fixed route service accounted for about 46% of ridership in FY2011-12, which represented a higher proportion of total ridership compared to previous years when it account for slightly less than 40%. Intercity fixed route ridership grew steadily over the past three years, increasing by 50,000 after the merger to 674,000, an increase of about 8%.2 Over the three year period, ridership increased from 604,636 to 674,026, an increase of 11%.
Combined DAR and paratransit service accounted for about 2%-3% of total ridership for SolTrans prior to the 2011 merger.3 Combined DAR and paratransit demand fell by nearly 7,000 from FY2008-09 to FY2009-10 (a decrease of 14%), but held relatively steady in FY2010-11. In FY2011-12, combined DAR and paratransit service accounted for nearly 31,000 annual riders or about 2.1% of total ridership, which is 40% decrease from FY2008-09.
1 As noted in Table 9, regional services are recorded under local fixed route service for Vallejo Transit for FY2008-09 as well as for Benicia Breeze from FY2008-09 through FY2010-11. Also, fixed local performance in FY2010-12 was derived from fixed route totals from the TSP and the intercity data provided by SolTrans. 2 See previous footnote. 3 Available Vallejo Transit data combined DAR and paratransit ridership, while Benicia Breeze separated the two. To minimize confusion, DAR and paratransit data were combined in this analysis.

Solano County Transportation Authority Short Range Transit Plan SolTrans
DocRef | Issue | June 18, 2013 | Arup North America Ltd S:\SOLTRANS\ELIZABETH\MEETINGS AND PRESENTATIONS\BOARD MEETING\6-27-2013\COORDINATED SRTP\ATTACHMENT A. SOLTRANS FINAL DRAFT SRTP.DOCX
Page 37
Figure 4: SolTrans Ridership (FY2008-12)
Sources: (i) FY2008-10 data (all modes) from SolTrans, January 2013; (ii) FY2010-12 (for inter-city buses) from SolTrans, January 2013; and (iii) FY2010-12 data (all modes, except intercity bus) from Transit Sustainability Plan (TSP), 2012. Notes: A Bold, underlined numbers represent the total per fiscal year. B Fixed local performance in FY2010-11 and FY2011-12 was derived from fixed route totals from the TSP and the intercity data provided by SolTrans.
3.2.2 Fare Revenue Figure 5 shows total fare revenue on fixed route local and intercity service as well as dial-a-ride (DAR) services for SolTrans from FY2008-09 through FY2011-12 (including combined Vallejo Transit and Benicia Breeze performance from FY2008-09 through FY2010-11 and SolTrans performance after the merger for FY2011-12). SolTrans system revenue, as of FY2011-12, is at its peak, generating $3.6 million annually. This upward trend started in FY2009-10 and fare revenues grew by almost $375,000 in the two years since (or about 11.7%) despite declining ridership.
Local fixed route service accounted for less than one-third of total fare revenues as of FY2011-12 (or $1.28 million). Local fixed route revenues have declined
Solano County Transportation Authority Short Range Transit Plan SolTrans
DocRef | Issue | June 18, 2013 | Arup North America Ltd S:\SOLTRANS\ELIZABETH\MEETINGS AND PRESENTATIONS\BOARD MEETING\6-27-2013\COORDINATED SRTP\ATTACHMENT A. SOLTRANS FINAL DRAFT SRTP.DOCX
Page 38
since FY2009-10 (accounting for about $140,000 less in fare revenue or about 9.9%).4
Intercity fixed route service accounted for 62.3% during this period or nearly $2.25 million. Intercity fixed route fare revenues increased since FY2009-10, by nearly $634,000 or 39.3% as of FY2011-12.5
Benicia Breeze, Vallejo Transit, and SolTrans all operated DAR and paratransit services, but reported fare revenues differently. Benicia Breeze and Vallejo Transit reported combined DAR and paratransit fare revenues for FY2008-09 through FY2010-11. SolTrans also reported combined DAR and paratransit revenues for FY2011-12. On average, DAR/paratransit fare revenues accounted for between 2.0% to 4.0% of total fare revenues. In FY2011-12, DAR and paratransit accounted for about $81,000 in fare revenues or 2.2% of the total. Revenues have significantly dropped since FY2009-10.
4 As noted in Table 9, regional services are recorded under local fixed route service for Vallejo Transit for FY2008-09 as well as for Benicia Breeze from FY2008-09 through FY2010-11. 5 See previous footnote.

Solano County Transportation Authority Short Range Transit Plan SolTrans
DocRef | Issue | June 18, 2013 | Arup North America Ltd S:\SOLTRANS\ELIZABETH\MEETINGS AND PRESENTATIONS\BOARD MEETING\6-27-2013\COORDINATED SRTP\ATTACHMENT A. SOLTRANS FINAL DRAFT SRTP.DOCX
Page 39
Figure 5: SolTrans Fare Revenue (FY2008-12)
Sources: (i) FY2008-10 data (all modes) from SolTrans, January 2013; (ii) FY2010-12 (for inter-city buses) from SolTrans, January 2013; and (iii) FY2010-12 data (all modes, except intercity bus) from Transit Sustainability Plan (TSP), 2012. Notes: A Bold, underlined numbers represent the total per fiscal year. B Fixed local performance in FY2010-11 and FY2011-12 was derived from fixed route totals from the TSP and the intercity data provided by SolTrans.
3.2.3 Vehicle Revenue Hours (VRH) System vehicle revenue hours (VRH) have decreased annually over the four year period starting in FY2008-09, prior to the 2011 merger. As of FY2011-12, SolTrans provided a total of 113,119 VRH, about 14,000 VRH less than that provided by both Benicia Breeze and Vallejo Transit (or a drop of 10.9%) - the result of consolidation and elimination of routes after the merger.
Local fixed route service typically accounted for just over half of total VRH between FY2008-09 and FY2010-11, but now accounted for less than half the total in FY2011-12. In overall terms, local fixed route VRH dropped by 16,000 VRH or 22.9% from FY2009-10 (69,482 VRH) to FY2011-12 (53,596 VRH).6
6 As noted in Table 9, regional services are recorded under local fixed route service for Vallejo Transit for FY2008-09 as well as for Benicia Breeze from FY2008-09 through FY2010-11.

Solano County Transportation Authority Short Range Transit Plan SolTrans
DocRef | Issue | June 18, 2013 | Arup North America Ltd S:\SOLTRANS\ELIZABETH\MEETINGS AND PRESENTATIONS\BOARD MEETING\6-27-2013\COORDINATED SRTP\ATTACHMENT A. SOLTRANS FINAL DRAFT SRTP.DOCX
Page 40
Intercity fixed route service accounted for between 30% to 40% of total VRH over the last three years (at 44,296 VRH out of 113,119 VRH in FY2011-12). VRH remained relatively steady since FY2010-11, when intercity service provision increased by 3,000 VRH (from 41,377 in FY2009-10 to 44,350 in FY2010-11).7
Benicia Breeze, Vallejo Transit, and SolTrans all operated DAR and paratransit services, but reported VRH differently. Vallejo Transit reported combined DAR and paratransit VRH for FY2008-09 through FY2010-11, while Benicia Breeze separated these two modes. SolTrans reported both DAR and paratransit VRH for FY2011-12. Collectively, DAR and paratransit service accounted for between 10-15% of total VRH over the last four years. DAR and paratransit VRH dropped from a high of 22,982 in FY2008-09 to 15,227 VRH in FY2011-12, a drop of nearly 6,500 VRH or about 33%.
Figure 6: SolTrans Vehicle Revenue Hours (FY2008-12)
Sources: (i) FY2008-10 data (all modes) from SolTrans, January 2013; (ii) FY2010-12 (for inter-city buses) from SolTrans, January 2013; and (iii) FY2010-12 data (all modes, except intercity bus) from Transit Sustainability Plan (TSP), 2012. Notes: A Bold, underlined numbers represent the total per fiscal year. B Fixed local performance in FY2010-11 and FY2011-12 was derived from fixed route totals from the TSP and the intercity data provided by SolTrans.
7 See previous footnote.
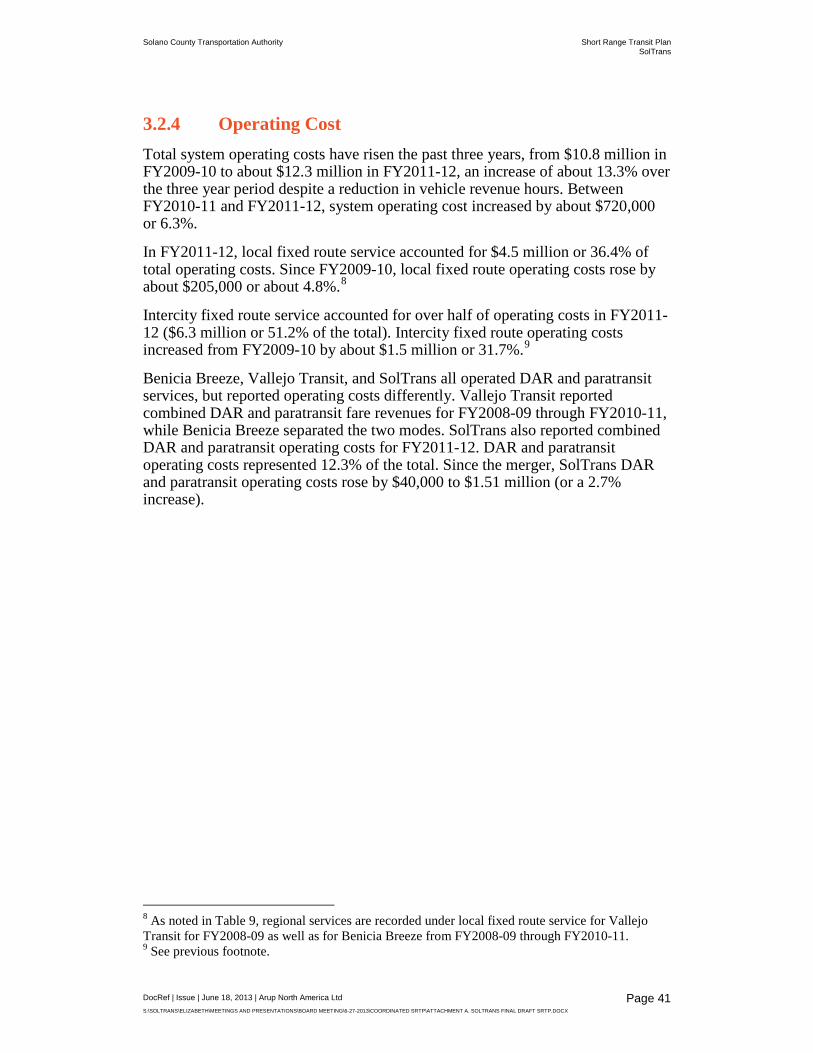
Solano County Transportation Authority Short Range Transit Plan SolTrans
DocRef | Issue | June 18, 2013 | Arup North America Ltd S:\SOLTRANS\ELIZABETH\MEETINGS AND PRESENTATIONS\BOARD MEETING\6-27-2013\COORDINATED SRTP\ATTACHMENT A. SOLTRANS FINAL DRAFT SRTP.DOCX
Page 41
3.2.4 Operating Cost Total system operating costs have risen the past three years, from $10.8 million in FY2009-10 to about $12.3 million in FY2011-12, an increase of about 13.3% over the three year period despite a reduction in vehicle revenue hours. Between FY2010-11 and FY2011-12, system operating cost increased by about $720,000 or 6.3%.
In FY2011-12, local fixed route service accounted for $4.5 million or 36.4% of total operating costs. Since FY2009-10, local fixed route operating costs rose by about $205,000 or about 4.8%.8
Intercity fixed route service accounted for over half of operating costs in FY2011-12 ($6.3 million or 51.2% of the total). Intercity fixed route operating costs increased from FY2009-10 by about $1.5 million or 31.7%.9
Benicia Breeze, Vallejo Transit, and SolTrans all operated DAR and paratransit services, but reported operating costs differently. Vallejo Transit reported combined DAR and paratransit fare revenues for FY2008-09 through FY2010-11, while Benicia Breeze separated the two modes. SolTrans also reported combined DAR and paratransit operating costs for FY2011-12. DAR and paratransit operating costs represented 12.3% of the total. Since the merger, SolTrans DAR and paratransit operating costs rose by $40,000 to $1.51 million (or a 2.7% increase).
8 As noted in Table 9, regional services are recorded under local fixed route service for Vallejo Transit for FY2008-09 as well as for Benicia Breeze from FY2008-09 through FY2010-11. 9 See previous footnote.

Solano County Transportation Authority Short Range Transit Plan SolTrans
DocRef | Issue | June 18, 2013 | Arup North America Ltd S:\SOLTRANS\ELIZABETH\MEETINGS AND PRESENTATIONS\BOARD MEETING\6-27-2013\COORDINATED SRTP\ATTACHMENT A. SOLTRANS FINAL DRAFT SRTP.DOCX
Page 42
Figure 7: SolTrans Operating Cost (FY2008-12)
Sources: (i) FY2008-10 data (all modes) from SolTrans, January 2013; (ii) FY2010-12 (for inter-city buses) from SolTrans, January 2013; and (iii) FY2010-12 data (all modes, except intercity bus) from Transit Sustainability Plan (TSP), 2012. Notes: A Bold, underlined numbers represent the total per fiscal year. B Fixed local performance in FY2010-11 and FY2011-12 was derived from fixed route totals from the TSP and the intercity data provided by SolTrans.
3.3 Service Performance The following service performance measures for fixed route local and intercity and DAR services were evaluated using available quantitative data to determine whether or not the performance standard was met. As noted, historic performance data was not recorded in a consistent manner between the two operators prior to the merger in 2011, making consistent comparison both at the system and route levels difficult. Furthermore, the 2012 SolTrans SRTP has already separately assessed performance of the Benicia Breeze and Vallejo Transit systems up to FY2010-11.
This evaluation shows how SolTrans has performed against quantitative standards after the 2011 merger, comparing FY2010-11with FY2011-12. Table 10 provides an overview of which system performance standards have been met from FY2010-11 to FY2011-12 (whereby FY2010-11 includes combined Benicia Breeze and Vallejo Transit performance and FY2011-12 includes consolidated

Solano County Transportation Authority Short Range Transit Plan SolTrans
DocRef | Issue | June 18, 2013 | Arup North America Ltd S:\SOLTRANS\ELIZABETH\MEETINGS AND PRESENTATIONS\BOARD MEETING\6-27-2013\COORDINATED SRTP\ATTACHMENT A. SOLTRANS FINAL DRAFT SRTP.DOCX
Page 43
SolTrans performance). Table 10 provides an overview of which system performance standards have been met from FY2010-11 to FY2011-12.
Please note:
• For FY2010-11, combined DAR and paratransit is analyzed to bring consistency to Benicia Breeze and Vallejo Transit data; and
• For FY2011-12, combined DAR and paratransit data from SolTrans is analyzed.
Service
• Passenger Productivity (per Vehicle Revenue Mile (VRM)): SolTrans did not meet its standard of 1.0 passenger/VRM for fixed route local service for either of the two years analyzed, both before and after the merger. SolTrans did not meet its combined DAR and paratransit standard of 1.0 passenger/VRM in either of the two years analyzed. SolTrans did not meet its intercity standard of 1.0 passenger/VRM after the merger (no data was available before the merger for intercity VRM).
• Passenger Productivity (per Vehicle Revenue Mile (VRH)): SolTrans met its standard of 12.0 passengers/VRH for fixed route service, 14.0 passengers/VRH for intercity, and 2.0 passengers/VRH for combined DAR plus paratransit for the two analysis years (before and after the merger). SolTrans local fixed route service achieved 14.3 passengers/VRH, intercity service achieved 15.2 passengers/VRH, and combined DAR and paratransit achieved 2.0 passengers/VRH figure after the merger.
• Safety: No passenger injuries data were available to assess SolTrans performance against its safety standard of 1.0 passenger injuries per 100,000 boardings for fixed route (both local and intercity) service or for DAR and paratransit service, which has the same standard.
• Preventable Accidents: SolTrans met its standard of 80,000 miles between local and intercity fixed route preventable accidents in FY2011-12 after the merger (nearly 167,000 miles between preventable accidents). No prior accident data was available. SolTrans also applies the same standard to combined DAR and paratransit service, respectively, although data was unavailable.
• Missed Trips: No data was available to assess SolTrans performance against its standard of less than 1% of total monthly trips defined as missed for both fixed route (local and intercity) and combined DAR and paratransit service.
• Road Calls: In FY2011-12, SolTrans met its standard of 10,000 miles between road calls for fixed route (local and intercity), with nearly 286,000 miles between road calls. The prior year, SolTrans failed to meet this standard (but barely at 9,632 miles between road calls). Likewise, SolTrans met its combined DAR and paratransit standard with upwards of 87,000 miles between road calls, but failed to meet this standard the

Solano County Transportation Authority Short Range Transit Plan SolTrans
DocRef | Issue | June 18, 2013 | Arup North America Ltd S:\SOLTRANS\ELIZABETH\MEETINGS AND PRESENTATIONS\BOARD MEETING\6-27-2013\COORDINATED SRTP\ATTACHMENT A. SOLTRANS FINAL DRAFT SRTP.DOCX
Page 44
previous year. It should be noted that road calls for paratransit were not available for FY2010-11 or FY2011-12.
Ridership
• Ridership Growth: SolTrans met its intercity fixed route standard of 2.0% annual ridership growth both before and after the merger (achieving 3.3% and 8.0%, respectively). SolTrans did not meet its local fixed route standard of 1.0% either before or after the merger (coming in at -14.1% growth in FY2011-12). Combined DAR and paratransit service had even lower growth against the same 1.0% annual ridership growth standard both before and after the merger (with -17.7% and -14.1% growth in FY2010-11 and FY2011-12, respectively).
Cost Effectiveness
• Operating Cost / Vehicle Revenue Hour (VRH): SolTrans met its local fixed route standard of $99.00/VRH before and after the merger ($61.01/VRH and $83.24/VRH, respectively). SolTrans did not meet its intercity standard of $115.00/VRH in either of the analysis years ($141.71 per VRH in FY2011-12). SolTrans also did not meet its combined DAR and paratransit standard of $78.00/VRH in either year (achieving $99.38 in FY2011-12).
• Operating Cost / Vehicle Revenue Mile (VRM): SolTrans met its fixed route local standard of $6.00/VRM for the year before and after the merger, achieving $5.48/VRM for FY2011-12. Intercity service met its standard of $6.00/VRM after the merger, but lacked data for FY2010-11. SolTrans failed to meet its combined DAR and paratransit standard of $4.50/VRM for either year, achieving $5.75/VRM in FY2011-12.
• Operating Cost / Passenger: SolTrans met its fixed route local standard of $8.00/passenger in both analysis years before and after the merger. SolTrans failed to meet its intercity standard of $8.00/passenger in either year, achieving $9.56/passenger in FY2010-11 and $9.31/passenger in FY2011-12. SolTrans also failed to achieve its combined DAR and paratransit standard of $35.00/ passenger in either of the analysis years, achieving $48.78/passenger in FY2011-12.
• Farebox Recovery: SolTrans met its farebox recovery standards in both analysis years (before and after the merger) for fixed route local service (20.0% standard) and intercity service (27.0% standard). SolTrans did not meet its standard for combined DAR and paratransit performance (10.0% standard).
Overall in FY2010-11 before the merger, SolTrans met only 9 of its 21 of its service performance standards, with most deficiencies in the financial cost effectiveness categories (note data was unavailable for 8 of the standards). Performance improved in FY2011-12 after the merger, as SolTrans met 13 of its 24 service performance standards, with deficiencies in similar categories (note data was unavailable for 5 of its standards).
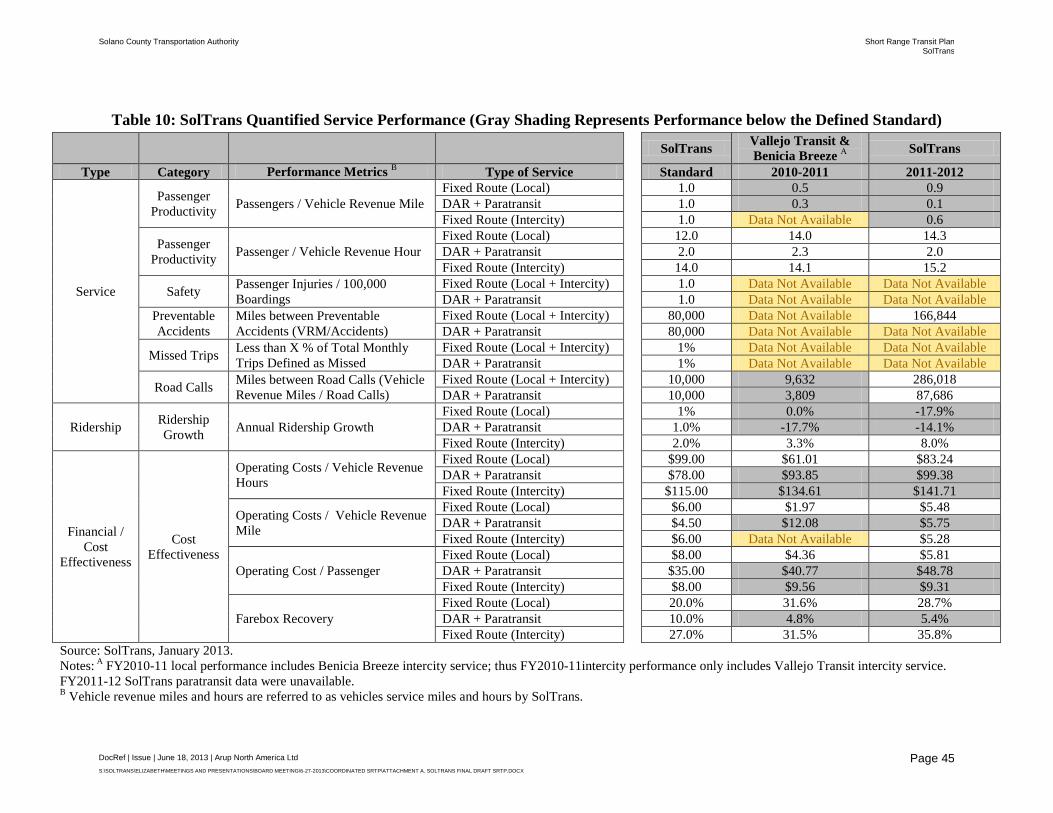
Solano County Transportation Authority Short Range Transit Plan SolTrans
DocRef | Issue | June 18, 2013 | Arup North America Ltd S:\SOLTRANS\ELIZABETH\MEETINGS AND PRESENTATIONS\BOARD MEETING\6-27-2013\COORDINATED SRTP\ATTACHMENT A. SOLTRANS FINAL DRAFT SRTP.DOCX
Page 45
Table 10: SolTrans Quantified Service Performance (Gray Shading Represents Performance below the Defined Standard)
SolTrans Vallejo Transit & Benicia Breeze A SolTrans
Type Category Performance Metrics B Type of Service Standard 2010-2011 2011-2012
Service
Passenger Productivity Passengers / Vehicle Revenue Mile
Fixed Route (Local)
1.0 0.5 0.9 DAR + Paratransit
1.0 0.3 0.1
Fixed Route (Intercity)
1.0 Data Not Available 0.6
Passenger Productivity Passenger / Vehicle Revenue Hour
Fixed Route (Local)
12.0 14.0 14.3 DAR + Paratransit
2.0 2.3 2.0
Fixed Route (Intercity)
14.0 14.1 15.2
Safety Passenger Injuries / 100,000 Boardings
Fixed Route (Local + Intercity)
1.0 Data Not Available Data Not Available DAR + Paratransit
1.0 Data Not Available Data Not Available
Preventable Accidents
Miles between Preventable Accidents (VRM/Accidents)
Fixed Route (Local + Intercity)
80,000 Data Not Available 166,844 DAR + Paratransit
80,000 Data Not Available Data Not Available
Missed Trips Less than X % of Total Monthly Trips Defined as Missed
Fixed Route (Local + Intercity)
1% Data Not Available Data Not Available DAR + Paratransit
1% Data Not Available Data Not Available
Road Calls Miles between Road Calls (Vehicle Revenue Miles / Road Calls)
Fixed Route (Local + Intercity)
10,000 9,632 286,018 DAR + Paratransit
10,000 3,809 87,686
Ridership Ridership Growth Annual Ridership Growth
Fixed Route (Local)
1% 0.0% -17.9% DAR + Paratransit
1.0% -17.7% -14.1%
Fixed Route (Intercity)
2.0% 3.3% 8.0%
Financial / Cost
Effectiveness
Cost Effectiveness
Operating Costs / Vehicle Revenue Hours
Fixed Route (Local)
$99.00 $61.01 $83.24 DAR + Paratransit
$78.00 $93.85 $99.38
Fixed Route (Intercity)
$115.00 $134.61 $141.71
Operating Costs / Vehicle Revenue Mile
Fixed Route (Local)
$6.00 $1.97 $5.48 DAR + Paratransit
$4.50 $12.08 $5.75
Fixed Route (Intercity)
$6.00 Data Not Available $5.28
Operating Cost / Passenger Fixed Route (Local)
$8.00 $4.36 $5.81
DAR + Paratransit
$35.00 $40.77 $48.78 Fixed Route (Intercity)
$8.00 $9.56 $9.31
Farebox Recovery Fixed Route (Local)
20.0% 31.6% 28.7%
DAR + Paratransit
10.0% 4.8% 5.4% Fixed Route (Intercity)
27.0% 31.5% 35.8%
Source: SolTrans, January 2013. Notes: A FY2010-11 local performance includes Benicia Breeze intercity service; thus FY2010-11intercity performance only includes Vallejo Transit intercity service. FY2011-12 SolTrans paratransit data were unavailable. B Vehicle revenue miles and hours are referred to as vehicles service miles and hours by SolTrans.

Solano County Transportation Authority Short Range Transit Plan SolTrans
DocRef | Issue | June 18, 2013 | Arup North America Ltd S:\SOLTRANS\ELIZABETH\MEETINGS AND PRESENTATIONS\BOARD MEETING\6-27-2013\COORDINATED SRTP\ATTACHMENT A. SOLTRANS FINAL DRAFT SRTP.DOCX
Page 46
3.4 System Performance This section assesses system-level performance using both qualitative and quantitative data from SolTrans to determine whether or not the performance standard was met. Since the 2012 SolTrans SRTP already covered years prior to FY2010-11, the focus of this SRTP analysis is on recent performance in FY2011-12 and FY2012-13 to-date. This analysis in particular, will illustrate how well SolTrans performed in its second year of existence as well as since July 2012 service changes.
The two analysis years include: (i) FY2011-12, which is the year that SolTrans was formed from the merger; and (ii) FY2012-13, which includes data up to the end of December 2012 (thus half the fiscal year). Table 11 provides an overview of which system performance standards have been met from FY2011-12 to FY2012-13.
Service
• On-Time Performance: In FY2011-12, SolTrans did not meet its fixed route (local and intercity) standard of 90% of all monthly trips operating on-time (no later than 5 minutes and no earlier than the published schedule), but is meeting it since July 2012. Prior to July 2012, SolTrans did not meet its paratransit or DAR standards of 90% of all monthly trips operating on-time (no earlier nor later than 15 minutes from the published schedule), but is meeting its paratransit standard since July 2012.
• Transfer Wait Times: SolTrans did not meet its standard of no more than a five minute average wait time for a transfer since July 2012. No information was available prior to July 2012.
• Vehicle Maintenance: Since July 2012, SolTrans is meeting its standard of completing regularly scheduled maintenance no later than 500 miles of the schedule cycle. No information was available prior to July 2012.
• Transit Facility Maintenance Program: No data is available currently or prior to July 2012.
• Demand Response Trip Reservations: Since July 2012, SolTrans is meeting its standard of 90% of DAR customers and all ADA-eligible trips scheduled within 60 minutes of requested pick-up time. No information was available prior to July 2012.
• Demand Response Trip Denials No data is available currently or prior to July 2012..
• ADA Paratransit Trip Denials: Since July 2012, SolTrans is meeting its standard that no trip requests are denied due to capacity constraints. No information was available prior to July 2012.
• Service Evaluation: No data is available currently or prior to July 2012. • Regular Data Collection and Reporting: Since July 2012, SolTrans is
meeting its standard of having monthly progress reports collected that

Solano County Transportation Authority Short Range Transit Plan SolTrans
DocRef | Issue | June 18, 2013 | Arup North America Ltd S:\SOLTRANS\ELIZABETH\MEETINGS AND PRESENTATIONS\BOARD MEETING\6-27-2013\COORDINATED SRTP\ATTACHMENT A. SOLTRANS FINAL DRAFT SRTP.DOCX
Page 47
include vehicle service hours, vehicle miles, fare revenue, ridership, accidents, and injuries. No information was available prior to July 2012.
Customer Focus
• Customer Focus: Since July 2012, SolTrans is meetings its standard of having monthly reports that detail the number and type of complaints as well as the resolution status, collected no later than the 15th of each month. No information was available prior to July 2012.
• Professional Development: Since July 2012, SolTrans is meeting its standard of having mandatory and optional training opportunities offered to improve safety and professional development. No information was available prior to July 2012.
• Marketing: No data is available currently or prior to July 2012. • Customer Surveys: Since July 2012, SolTrans is meeting its standard of
conducting recurring transit customer surveys. No information was available prior to July 2012,.
• Outreach: Since July 2012,, SolTrans is meeting its standard of conducting annual outreach to encourage public input on unmet transit needs prior to meetings. No information was available prior to July 2012.
• Fare Coordination: Since July 2012,, SolTrans is meeting its standard of coordinating fares with intercity services provided at transit centers (through transfers, but not through Clipper yet). No information was available prior to July 2012.
• Service Coordination: Since July 2012, SolTrans is meeting its standard of coordinating schedules with intercity operators at transit centers (with an average wait time of less than 15 minutes). No information was available prior to July 2012.
• Service Frequency: SolTrans did not meet its standard that fixed route headways be no more than 30 minutes either before or since July 2012.
• Land Use Coordination: Since July 2012,, SolTrans is meeting its standard of submitting transit needs during city development planning review processes. No information was available prior to July 2012.
In FY2010-11 before the merger, SolTrans did not meet any of its system performance standards in which data was available (with 16 out of 20 standards lacking data). Key deficiencies were in on-time performance and service frequency. Data was more readily available after the merger, thus in FY2011-12, SolTrans met 13 of its 16 standards in which data was available (only four standards lacked data to evaluate). Key deficiencies were in DAR on-time performance, fixed route system transfer waiting time, and having 30 minute minimum fixed route headways.

Solano County Transportation Authority Short Range Transit Plan SolTrans
DocRef | Issue | June 18, 2013 | Arup North America Ltd S:\SOLTRANS\ELIZABETH\MEETINGS AND PRESENTATIONS\BOARD MEETING\6-27-2013\COORDINATED SRTP\ATTACHMENT A. SOLTRANS FINAL DRAFT SRTP.DOCX
Page 48
Table 11: SolTrans Qualitative System Performance (Gray Shading Represents Performance below the Defined Standard) SolTrans SolTrans
Type Category Other Metrics/Statistics Type of Service
Standard FY2011-12 FY2012-13 (to 12/31/2013)
Service
On-Time Performance
Are 90% of all monthly trips operating on-time (no later than 5 minutes and no earlier than published schedule)?
Fixed Route (Local + Intercity)
YES NO YES
Are 90% of all monthly trips operating on-time (no earlier nor later than 15 minutes from published schedule)? Paratransit YES NO YES
Are 90% of all monthly trips operating on-time (no earlier nor later than 15 minutes from published schedule)?
Dial-a-Ride (DAR) YES NO NO
Transfer Wait Times Is average wait time no more than 5 minutes for transfers? System YES Data Not
Available NO
Maintenance Is regularly schedule maintenance completed no later than 500 miles of scheduled cycle? System YES Data Not
Available YES
Transit Facilities
Maintenance Program
Has a Transit Facilities Maintenance Program been implemented? System
YES Data Not Available
Data Not Available
Demand Response
Trip Denials
Are 90% of DAR customers and all ADA-eligible trips scheduled within 60 minutes of requested pick-up time
Dial-a-Ride (DAR) YES Data Not
Available YES
Do no more than 3% of total monthly trip requests result in refusal when offered within 60 min of requested time?
Dial-a-Ride (DAR) YES Data Not
Available Data Not Available
ADA Paratransit
Trip Denials
Are no trip requests denied due to capacity constraints (as defined by ADA)? Paratransit
YES Data Not
Available YES
Service Evaluation
Is independent evaluation of service conducted at intervals of no more than 5 years? System YES Data Not
Available Data Not Available
Regular Data Collection &
Reporting
Are monthly performance reports collected that include vehicle service hours, vehicle miles, fare revenue, ridership, accidents, and injuries? System
YES Data Not
Available YES
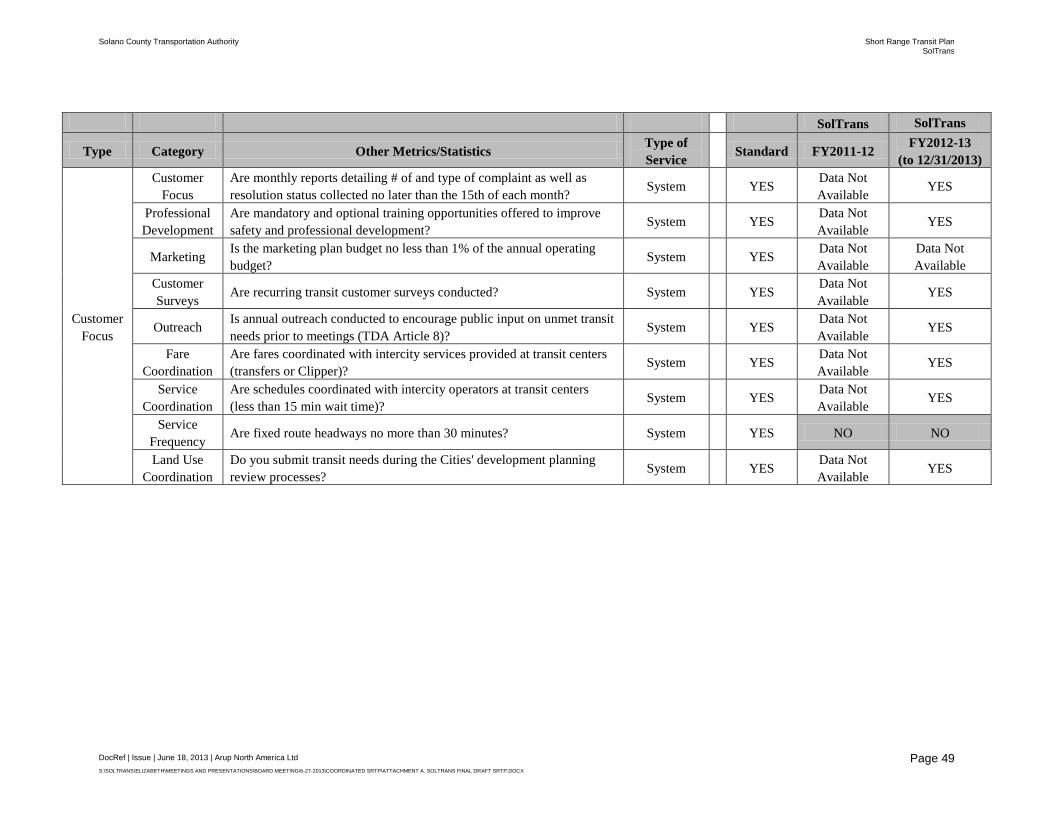
Solano County Transportation Authority Short Range Transit Plan SolTrans
DocRef | Issue | June 18, 2013 | Arup North America Ltd S:\SOLTRANS\ELIZABETH\MEETINGS AND PRESENTATIONS\BOARD MEETING\6-27-2013\COORDINATED SRTP\ATTACHMENT A. SOLTRANS FINAL DRAFT SRTP.DOCX
Page 49
SolTrans SolTrans
Type Category Other Metrics/Statistics Type of Service
Standard FY2011-12 FY2012-13 (to 12/31/2013)
Customer Focus
Customer Focus
Are monthly reports detailing # of and type of complaint as well as resolution status collected no later than the 15th of each month? System YES Data Not
Available YES
Professional Development
Are mandatory and optional training opportunities offered to improve safety and professional development? System YES Data Not
Available YES
Marketing Is the marketing plan budget no less than 1% of the annual operating budget? System YES Data Not
Available Data Not Available
Customer Surveys Are recurring transit customer surveys conducted? System YES
Data Not Available YES
Outreach Is annual outreach conducted to encourage public input on unmet transit needs prior to meetings (TDA Article 8)?
System
YES Data Not Available
YES
Fare Coordination
Are fares coordinated with intercity services provided at transit centers (transfers or Clipper)? System YES Data Not
Available YES
Service Coordination
Are schedules coordinated with intercity operators at transit centers (less than 15 min wait time)? System YES Data Not
Available YES
Service Frequency Are fixed route headways no more than 30 minutes? System YES NO NO
Land Use Coordination
Do you submit transit needs during the Cities' development planning review processes? System YES Data Not
Available YES

Solano County Transportation Authority Short Range Transit Plan SolTrans
DocRef | Issue | June 18, 2013 | Arup North America Ltd S:\SOLTRANS\ELIZABETH\MEETINGS AND PRESENTATIONS\BOARD MEETING\6-27-2013\COORDINATED SRTP\ATTACHMENT A. SOLTRANS FINAL DRAFT SRTP.DOCX
Page 50
3.5 Route Performance10 This section compares SolTrans route-level operating statistics for local and intercity fixed route services. Since the 2012 SolTrans SRTP already assessed route-level performance up to FY2010-11, this analysis focuses on performance in FY2011-12 and to-date FY2012-13. The analysis is meant to highlight how well performance has fared since the July 2012 service changes as well as how SolTrans is performing in its second year of existence.
Available data limits the extent of the route-level analysis, primarily to productivity in terms of boardings per VRH or per VRM. Fare revenues and operating costs are also provided for inter-city or express routes only (Routes 78, 80 and 85) based on a cost allocation model developed under the Intercity Transit Funding Agreement. SolTrans does not break down total operating costs on a local route-level basis. While SolTrans does record route-level fare revenues, the contractor for SolTrans services notes that the usability of farebox estimates was limited due to human and mechanical recording issues.
Table 12 presents the performance standards for intercity and local fixed route routes (as defined in the SolTrans GOMS for this SRTP). DAR performance is not included in this route-level analysis.
Table 12: SolTrans Intercity Fixed Route, Local Fixed Route and DAR Standards
Standards Boardings/ VRH
Boardings/ VRM
Farebox Recovery
Local 12.0 1.0 20.0% Intercity 14.0 1.0 27.0%
Based on data above, a comparison of current fixed routes and their relative performance against service standards was completed for both FY2011-12 and to-date FY2012-13. Table 13 presents performance of each route, while Table 14 presents productivity in terms of boardings per VRH and VRM.
Key findings are below:
• Boardings per Vehicle Revenue Hour (VRH): In FY2011-12, 9 out of 17 local routes and 1 out of 7 intercity routes surpassed the SolTrans GOMS thresholds of 12.0 and 14.0 boardings/VRH, respectively. Since July 2012, SolTrans performance has improved, with 10 out of 11 local routes and 2 out of 7 intercity routes currently surpassing the SolTrans GOMS threshold as of the end of December 2012. Among local routes, Route 17 has the best performance at 42.6 boardings/VRH and Route 4 has the lowest performance at 7.7 boardings/VRH. For intercity routes, Route 80 has the best performance at 23.5 boardings/ RVH, while Routes 76 and 78 have the lowest performance at 7.5 and 7.9 boardings/RVH, respectively.
10 Route-level data presented in this section may not collectively match the system-level data presented in Section 3.3 due to different recording and accounting procedures.

Solano County Transportation Authority Short Range Transit Plan SolTrans
DocRef | Issue | June 18, 2013 | Arup North America Ltd S:\SOLTRANS\ELIZABETH\MEETINGS AND PRESENTATIONS\BOARD MEETING\6-27-2013\COORDINATED SRTP\ATTACHMENT A. SOLTRANS FINAL DRAFT SRTP.DOCX
Page 51
• Boardings per Vehicle Revenue Mile (VRM): In FY2011-12, 11 out of 17 local routes and 1 out of 7 intercity routes surpassed the SolTrans GOMS threshold of 1.0 boardings/VRM. Since July 2012, SolTrans performance has seen improved local, but worsened intercity performance. Although 8 out of 11 local routes currently meet the standard, the three routes not meeting this standard are just below this standard at 0.9 boardings/VRM. Route 17 has the best performance at 4.0 boardings/ VRM. None of the 7 intercity routes are currently meeting the standard, with Route 80 close at 0.9 boardings/VRM and Routes 76 and 80S have the lowest performance at 0.3 boardings/VRM.
• Farebox Recovery: FY2011-12 operating costs and fare revenues have been broken down for SolTrans intercity routes funded by the Intercity Transit Funding Agreement – Routes 78, 80 and 85 (through a cost allocation model). Thus, in terms of achieving the SolTrans GOMS standard of 27% farebox recovery for intercity routes, Routes 80 and 85 achieved this standard (with 45% and 32% farebox recovery, respectively). Route 78 did not meet this standard with 19% farebox recovery. Fare recovery could not be calculated for local bus routes, since SolTrans does not allocate system costs to each individual local bus route,
Overall, it appears that since July 2012, performance has improved for local buses, although Route 4 still performs well below standard. Several intercity routes have low performance in terms of both boardings/VRH and boardings/VRM and could be candidates for modification, and/or consolidation such as Route 76, 78 and 80S.

Solano County Transportation Authority Short Range Transit Plan SolTrans
DocRef | Issue | June 18, 2013 | Arup North America Ltd S:\SOLTRANS\ELIZABETH\MEETINGS AND PRESENTATIONS\BOARD MEETING\6-27-2013\COORDINATED SRTP\ATTACHMENT A. SOLTRANS FINAL DRAFT SRTP.DOCX
Page 52
Table 13: SolTrans Route-Level Performance
FY2011-12 Performance FY2012-13 Performance (thru 12/2012)
Type Route A Boardings VRH VRM Boardings VRH VRM
Notes and Major Service Changes
Local
1 189,230 14,215 195,495 51,546 2,831 38,880
South Vallejo service provided by Route 3 since July 2012.
2 82,931 4,800 56,860 55,541 3,700 45,694
Route modified to service Gateway Plaza and Solano Community College with 45 minute headways since July 2012.
3 6,614 755 7,650 29,154 2,399 30,310
Route modified to serve South Vallejo, Beverly Hills, and Glen Cove neighborhoods since July 2012 (taking over part of Route 1's route).
4 56,717 3,599 39,355 16,568 2,141 17,859
No changes instituted in July 2012.
5 161,432 20,055 129,436 30,714 2,462 34,022
Route serves Kaiser Hospital, Sereno Drive, and Discovery Kingdom and no longer serves Plaza Drive/Target since July 2012.
6 66,149 3,959 56,340 32,208 2,467 34,473
Route modified to serve East Vallejo neighborhoods along Ascot Parkway and segment south of Benicia Road eliminated since July 2012.
7 139,001 9,760 B 99,545 56,981 3,331 47,442
Route operates as a bidirectional route between the Vallejo Transit Center and Gateway Plaza since July 2012.
11 5,834 136 1,333 0 0 0
Formerly operated weekday school trips; eliminated prior to July 2012 service changes.
12 4,396 335 2,282 2,751 128 1,797
Currently operates weekday school trips. 14 710 325 2,297 2,513 90 1,775
Currently operates weekday school trips.
15 9,670 548 6,749 4,063 206 2,446
Currently operates weekday school trips; no service changes in July 2012.
16 1,055 145 3,139 0 0 0
Formerly operated weekday school trips; eliminated prior to July 2012 service changes.
17 18,654 655 6,495 9,182 216 2,269
Currently operates weekday school trips; no service changes in July 2012.
18 115 110 2,583 0 0 0
Formerly operated weekday school trips; eliminated prior to July 2012 service changes.
20 2,883 425 1,985 0 0 0
Formerly operated weekday school trips; eliminated prior to July 2012 service changes.
21 2,094 1,263 14,647 0 0 0
Replaced with DAR for FY2012-13 since July 2012. 22 1,149 1,120 10,916 0 0 0
Replaced with DAR for FY2012-13 since July 2012.

Solano County Transportation Authority Short Range Transit Plan SolTrans
DocRef | Issue | June 18, 2013 | Arup North America Ltd S:\SOLTRANS\ELIZABETH\MEETINGS AND PRESENTATIONS\BOARD MEETING\6-27-2013\COORDINATED SRTP\ATTACHMENT A. SOLTRANS FINAL DRAFT SRTP.DOCX
Page 53
FY2011-12 Performance FY2012-13 Performance (thru 12/2012)
Type Route A Boardings VRH VRM Boardings VRH VRM
Notes and Major Service Changes
Intercity
76 9,134 1,919 26,416 2,264 302 7,323
Service reduced to only three daily roundtrips since July 2012. 78 88,754 11,494 227,555 43,974 5,592 129,676
No changes instituted in July 2012.
80 432,840 21,100 694,332 222,220 9,446 259,611
Sunday service discontinued since July 2012.
80S (82) 0 0 0 1,836 215 6,082
Provides Sunday service to Benicia and Walnut Creek BART (internally referred to as Route 82) since July 2012.
81 642 967 17,340 0 0 0
Eliminated prior to July 2012 service changes.
85 152,432 11,700 266,634 53,381 4,639 102,824
Operates on an hourly headway, with reduced stops in Vallejo since July 2012.
200 54,026 4,759 93,108 22,373 1,591 46,885
Operates AM weekday service form the Vallejo Ferry to the Ferry Building in San Francisco.
400 C 733 99 468 628 51 1,038
Route 400 was cancelled in late FY2012-13 due to low ridership. Route 400 was a seasonal service operating from mid-May to late October.
Notes: A Of the routes operated in FY2011-12, all were operated by Vallejo Transit except for Routes 15, 17, 21, 22, and 76 (operated by Benicia Breeze). B The originally reported VRH for Route 7 was 1,452 VRH, which equated to 95.7 passengers/RVH. VRH was adjusted based on the average local bus speed of 10.2 mph. C Route 400 was cancelled in late FY2012-13 due to low ridership.

Solano County Transportation Authority Short Range Transit Plan SolTrans
DocRef | Issue | June 18, 2013 | Arup North America Ltd S:\SOLTRANS\ELIZABETH\MEETINGS AND PRESENTATIONS\BOARD MEETING\6-27-2013\COORDINATED SRTP\ATTACHMENT A. SOLTRANS FINAL DRAFT SRTP.DOCX
Page 54
Table 14: SolTrans Route-Level Performance and Productivity
Boardings/VRH
Boardings/VRM
Type Route A
SolTrans Standard
FY2011-12 Performance
FY2012-13 Performance
SolTrans Standard
FY2011-12 Performance
FY2012-13 Performance
Local
1 12.0 13.3 18.2 1.0 1.0 1.3 2 12.0 17.3 15.0 1.0 1.5 1.2 3 12.0 8.8 12.2 1.0 0.9 1.0 4 12.0 15.8 7.7 1.0 1.4 0.9 5 12.0 8.0 12.5 1.0 1.2 0.9 6 12.0 16.7 13.1 1.0 1.2 0.9 7 12.0 14.2 17.1 1.0 1.4 1.2
11 12.0 42.9 Not Operated 1.0 4.4 Not Operated 12 12.0 13.1 21.5 1.0 1.9 1.5 14 12.0 2.2 27.9 1.0 0.3 1.4 15 12.0 17.6 19.7 1.0 1.4 1.7 16 12.0 7.3 Not Operated 1.0 0.3 Not Operated 17 12.0 28.5 42.6 1.0 2.9 4.0 18 12.0 1.0 Not Operated 1.0 0.0 Not Operated 20 12.0 6.8 Not Operated 1.0 1.5 Not Operated 21 12.0 1.7 Not Operated 1.0 0.1 Not Operated 22 12.0 1.0 Not Operated 1.0 0.1 Not Operated
Intercity
76 14.0 4.8 7.5 1.0 0.3 0.3 78 14.0 7.7 7.9 1.0 0.4 0.3 80 14.0 20.5 23.5 1.0 0.6 0.9
80S (82) 14.0 Not Operated 8.6 1.0 Not Operated 0.3 81 14.0 0.7 Not Operated 1.0 0.0 Not Operated 85 14.0 13.0 11.5 1.0 0.6 0.5
200 14.0 11.4 14.1 1.0 0.6 0.5 400 C 14.0 7.4 12.2 1.0 1.6 0.6
Notes: A Of routes operated in FY2011-12, all were operated by Vallejo Transit except for Routes 15, 17, 21, 22, and 76 (operated by Benicia Breeze). B The originally reported VRH for Route 7 was 1,452 VRH, which equated to 95.7 passengers/RVH. VRH was adjusted based on the average local bus speed of 10.2 mph. C Route 400 was cancelled in late FY2012-13 due to low ridership.
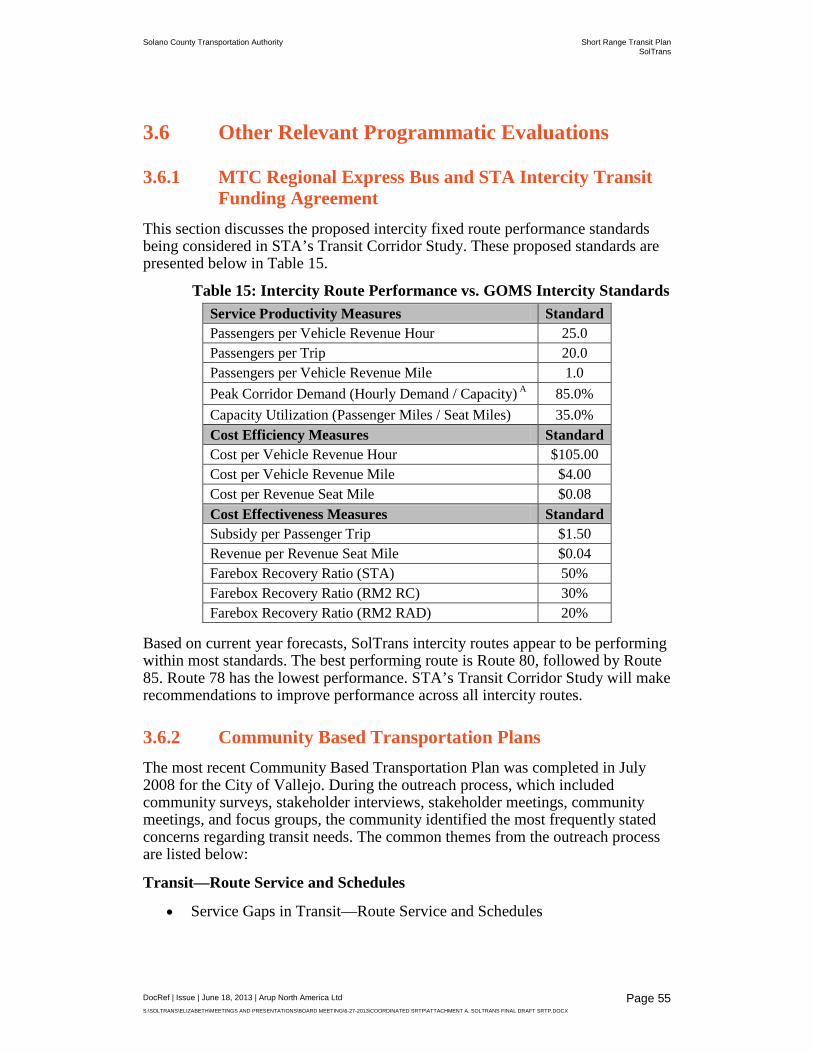
Solano County Transportation Authority Short Range Transit Plan SolTrans
DocRef | Issue | June 18, 2013 | Arup North America Ltd S:\SOLTRANS\ELIZABETH\MEETINGS AND PRESENTATIONS\BOARD MEETING\6-27-2013\COORDINATED SRTP\ATTACHMENT A. SOLTRANS FINAL DRAFT SRTP.DOCX
Page 55
3.6 Other Relevant Programmatic Evaluations
3.6.1 MTC Regional Express Bus and STA Intercity Transit Funding Agreement
This section discusses the proposed intercity fixed route performance standards being considered in STA’s Transit Corridor Study. These proposed standards are presented below in Table 15.
Table 15: Intercity Route Performance vs. GOMS Intercity Standards Service Productivity Measures Standard Passengers per Vehicle Revenue Hour 25.0 Passengers per Trip 20.0 Passengers per Vehicle Revenue Mile 1.0 Peak Corridor Demand (Hourly Demand / Capacity) A 85.0% Capacity Utilization (Passenger Miles / Seat Miles) 35.0% Cost Efficiency Measures Standard Cost per Vehicle Revenue Hour $105.00 Cost per Vehicle Revenue Mile $4.00 Cost per Revenue Seat Mile $0.08 Cost Effectiveness Measures Standard Subsidy per Passenger Trip $1.50 Revenue per Revenue Seat Mile $0.04 Farebox Recovery Ratio (STA) 50% Farebox Recovery Ratio (RM2 RC) 30% Farebox Recovery Ratio (RM2 RAD) 20%
Based on current year forecasts, SolTrans intercity routes appear to be performing within most standards. The best performing route is Route 80, followed by Route 85. Route 78 has the lowest performance. STA’s Transit Corridor Study will make recommendations to improve performance across all intercity routes.
3.6.2 Community Based Transportation Plans The most recent Community Based Transportation Plan was completed in July 2008 for the City of Vallejo. During the outreach process, which included community surveys, stakeholder interviews, stakeholder meetings, community meetings, and focus groups, the community identified the most frequently stated concerns regarding transit needs. The common themes from the outreach process are listed below:
Transit—Route Service and Schedules
• Service Gaps in Transit—Route Service and Schedules

Solano County Transportation Authority Short Range Transit Plan SolTrans
DocRef | Issue | June 18, 2013 | Arup North America Ltd S:\SOLTRANS\ELIZABETH\MEETINGS AND PRESENTATIONS\BOARD MEETING\6-27-2013\COORDINATED SRTP\ATTACHMENT A. SOLTRANS FINAL DRAFT SRTP.DOCX
Page 56
o Route 2 bus only operates once per hour and service stops too early.
o Bus stops along Magazine and Admiral Callahan are too spread out.
• Difficult to access the following locations: Wal-Mart in Vallejo and American Canyon; Fairfield, in the evening; Solano Community College, Vallejo; Mare Island, including Touro University and social service sites; Glen Cove neighborhood; Industrial parks outside Vallejo; Marin County
• Transit service reductions on Sunday have resulted in residents missing religious services.
• Long headways are inconsistent with the one-hour transfer period. • Buses, particularly on popular routes, often don’t arrive on time.
Transit—Span of Service
• Transit service span is limited: Bus service stops too early in the evening and is inadequate on the weekends and holidays. The limited service span is a barrier to employment, particularly for graveyard and swing shifts.
Transit—Costs
• Transit fares are costly, especially for families with children. • The ferry is too expensive. • The cost to take transit to Fairfield, where many jobs are located, is too
expensive. • Elimination of free school bus service means that families now have to pay
for their children to ride regular fixed-route public transit. If a family has more than one child, the cost of buses can be extremely high. The public transit buses for students are not as flexible as the yellow school bus.
Transit—Safety and Comfort
• Many people are afraid of riding the bus because of safety issues on board the bus and at bus stops.
• Rowdy bus passengers sometimes intimidate other passengers and bus drivers.
• Transfer stations are perceived as dangerous. • There are no garbage cans or bathroom facilities at Sereno Transit Station. • Many bus stops are not equipped with benches, shelters, lighting or waste
baskets. • Some bus drivers and dispatchers are rude and unhelpful when asked for
directions and transit information.
Solano County Transportation Authority Short Range Transit Plan SolTrans
DocRef | Issue | June 18, 2013 | Arup North America Ltd S:\SOLTRANS\ELIZABETH\MEETINGS AND PRESENTATIONS\BOARD MEETING\6-27-2013\COORDINATED SRTP\ATTACHMENT A. SOLTRANS FINAL DRAFT SRTP.DOCX
Page 57
• Some passengers with disabilities feel unsafe on fixed-route buses as drivers don’t always wait until riders are situated before moving the vehicle.
• Some drivers do not enforce rules about giving up seats to elderly and disabled riders. Grocery shopping is particularly difficult for public transportation users.
Transit—Coordination
• While some intercity routes run until 11 p.m., there is no service into neighborhoods at night.
• Transit services throughout Solano County are not one operator’s network. • The cost of transferring to a different provider is expensive. • Riders can become stranded if they expect all buses to end service at the
same time. • Bus connections are not timed properly. Riders have to wait a long time to
transfer.
Transit—Accessibility and Convenience
• It’s hard to travel with strollers. • Bus service to the WIC offices is too infrequent. • Monthly bus passes are available in too few locations. • Service agencies do not receive enough bus passes for all clients who need
them. • Shuttle service for seniors exists, but it does not extend beyond Vallejo or,
for example, to get to the Cancer Society in Fairfield, riders must provide three to five days’ notice.
• Frail seniors are homebound because they need door-through-door service. • Some bus drivers do not know how to load wheelchairs, which results in
delays and frustrated customers. Only two wheelchairs are permitted on buses.
• Riders can only make one stop using paratransit, even if they need to go to multiple destinations.
Education and Outreach
• Many users are confused about routes, fares and hours of service. This is particularly true for non-English speakers. There are not enough posted bus schedules.
Alternatives to Public Transportation
• Bicycling is unsafe. Bike lanes on Broadway are too narrow. • There is not enough space on bus bike racks, and drivers do not always
explain to riders how to load bicycles onto racks.
Solano County Transportation Authority Short Range Transit Plan SolTrans
DocRef | Issue | June 18, 2013 | Arup North America Ltd S:\SOLTRANS\ELIZABETH\MEETINGS AND PRESENTATIONS\BOARD MEETING\6-27-2013\COORDINATED SRTP\ATTACHMENT A. SOLTRANS FINAL DRAFT SRTP.DOCX
Page 58
• Bikes get stolen because there are inadequate storage areas. • Some taxi drivers don’t pick up senior citizens. • While many seniors use taxi scrip, the scrip program is currently
threatened with reduction. Scrip is available in too few locations.
3.6.3 Title VI SolTrans is committed to ensuring that no person shall, on the ground of race, color, national origin, religion age, marital status, sexual orientation, or disability be excluded from participation in, be denied the benefits of, or be subjected to discrimination under any program or activity provided by SolTrans. SolTrans submitted the SolTrans’ Title VI Program on November 15, 2011. This report is included in the Appendix. Elements of the program include SolTrans’ LEP Plan, Public Outreach Summary, Signed Policy, Complaint, Procedures and Notice, and Analysis of Construction Projects.
3.6.4 Results of Most Recent FTA Triennial Review and TDA Audit
FTA Triennial Review The last FTA Triennial Review of SolTrans’ transit services covered FY2011-12. The audit found that there were deficiencies in 4 out of the 24 areas: Technical, Satisfactory Continuing Control, Americans with Disabilities Act, and ARRA. Deficiencies in the Technical area were related to ARRA grant. Deficiencies in Satisfactory Continuing Control are repeat deficiencies from the last review. The following were the deficiencies and corrective actions identified:
• The City has been receiving program income from bus advertising and incidental use of ferry terminal space. The City has not been reporting this income on its FFRs. The City’s MPRs have not contained all FTA-required information including reasons for changes in milestones and identification of problem areas. By October 30, 2011, the City will submit to the FTA regional office FFRs and MPRs with all FTA required information.
• The City has a fleet of 54 fixed route vehicles and operates 37 in peak service. The result is a 45 percent spare ratio. The City has older vehicles that could be placed in a contingency fleet. By November 23, 2011, the City will provide a plan for reducing the spare ratio to 20 percent.
• The City’s no-show policy for RideAbout indicates that three no-shows in a thirty-day period will result a 14-day suspension of service. FTA requires that a no-show policy recognize a true pattern or practice, ideally taking into account frequency of service, and not use only a simple number threshold. By December 23, 2011, the City will provide a revised no-show policy that meets FTA requirements.
• The City was awarded two ARRA grants (CA-96-X034 and CA-66-X014). Projects funded by these grants are: maintenance facility

Solano County Transportation Authority Short Range Transit Plan SolTrans
DocRef | Issue | June 18, 2013 | Arup North America Ltd S:\SOLTRANS\ELIZABETH\MEETINGS AND PRESENTATIONS\BOARD MEETING\6-27-2013\COORDINATED SRTP\ATTACHMENT A. SOLTRANS FINAL DRAFT SRTP.DOCX
Page 59
rehabilitation, two ferry boat engines, Vallejo station parking structure construction, and ferry terminal rehabilitation. The finding related to MPRs lacking required information discussed in Technical applies to ARRA grants. By October 30, 2011, the City will submit MPRs with required information.
TDA Audit The last MTC Triennial Review and TDA audit was completed in May 2012. The audit focused on Vallejo Transit, covering the period of fiscal years 2009 through 2011 (from July 1, 2008 through June 30, 2011). During the audit period the City of Vallejo operated the bus service. The City also operated the Baylink Ferry service between Vallejo and San Francisco. Paratransit service, known as Vallejo Runabout, provided curb-to-curb services for persons with disabilities in the Vallejo service area. On July 1, 2011, Vallejo’s bus and paratransit services were transferred to Solano County Transit (SolTrans). The Baylink Ferry, while still owned by the City and operated by Blue & Gold, will eventually be transferred to the San Francisco Bay Area Water Emergency Transportation Authority (WETA). The following key findings and conclusions from the report are summarized below. There were no recommendations suggested based on the results summarized below:
Data Collection
• Vallejo is in compliance with the data collection and reporting requirements for all five TDA statistics.
TDA Performance Trends
• Bus Service: Vallejo’s fixed-route performance exhibited worsening trends over the six-year period of FY2006 through FY2011. Performance worsened in all areas: cost efficiency, passenger productivity, cost effectiveness and employee productivity.
• Paratransit Service: Vallejo’s paratransit performance was mostly negative over the six-year period of FY2006 through FY2011. Although improvements in passenger productivity were observed, performance in cost efficiency, cost effectiveness, and employee productivity worsened.
PUC Compliance
• Vallejo is in compliance with the five sections of the state PUC that were reviewed as part of this performance audit. These sections included CHP terminal inspections, requirements concerning labor contracts, reduced fares, revenue sharing, and evaluating passenger needs.
Status of Prior Audit Recommendations
• In light of the recent transfer of bus and paratransit services from Vallejo to SolTrans, and the scheduled transfer of Vallejo’s ferry service to WETA in the near future, all three recommendations have been closed. These

Solano County Transportation Authority Short Range Transit Plan SolTrans
DocRef | Issue | June 18, 2013 | Arup North America Ltd S:\SOLTRANS\ELIZABETH\MEETINGS AND PRESENTATIONS\BOARD MEETING\6-27-2013\COORDINATED SRTP\ATTACHMENT A. SOLTRANS FINAL DRAFT SRTP.DOCX
Page 60
recommendations were related to improving Vallejo’s performance measurement and monitoring activities.
• Vallejo staff reported that SolTrans is implementing a new performance measurement system based on its recently approved Short Range Transit Plan (SRTP). This system is being developed to include routine performance monitoring and take into consideration the current fiscal and operating environment.
3.7 Summary of Performance Ridership has been falling since FY2008-09 and continued to fall after the merger in July 2011. Overall, the trend is attributed to the decrease in local fixed route ridership. As of FY2011-12, SolTrans ridership fell by about 310,000 or 17.3% since FY2008-09. This decrease is attributable to a 56% decrease in local fixed route ridership and a 40% decrease in dial-a-ride ridership. Intercity ridership actually increased over the same period by 11%.
Fare revenues on the other hand have been climbing since FY2009-10. In its first full year since the merger, SolTrans achieved its highest overall system revenues, generating about $3.6 million annually – an increase of $375,000 or about 11.7% over the last two years. This increase in revenue is attributable to the intercity service, which had an increase in fare revenues of about 39%, compared to the local fixed route service which saw a decrease in fare revenues of about 10%.
After the merger, the amount of service provided by SolTrans dropped significantly – by nearly 14,000 vehicle revenue hours - due to consolidation and elimination of routes. As of FY2011-12, SolTrans provided about 113,000 vehicle revenue hours in total. This overall decrease is attributable to the local service which experienced a 23% decrease in local fixed route revenue hours and a 33% decrease in dial-a-ride revenue hours. During this same period intercity routes experienced a 7% increase.
Total operating costs have risen, despite the decrease in amount of service provided, from $10.8 million in FY2009-10 to about $12.3 million in FY2011-12, an increase of over 13.3% over the three year period. Both intercity and local routes experienced an increase in operating costs, however, the intercity operating costs increased by about 32%, while the local route only increased by about 5%.
In FY2010-11 before the merger, SolTrans met 9 of 13 of its service performance standards, with most deficiencies in the financial cost effectiveness categories (note data was unavailable for 8 of the standards). Performance improved in FY2011-12 after the merger, as SolTrans met 13 of its 19 service performance standards, with deficiencies in similar categories (note data was unavailable for 5 of its standards).
In FY2010-11 before the merger, SolTrans did not meet any of its system performance standards in which data was available (with 16 out of 20 standards lacking data). Key deficiencies were in on-time performance and service frequency. Data was more readily available after the merger, thus in FY2011-12, SolTrans met 13 of its 16 standards in which data was available (only four

Solano County Transportation Authority Short Range Transit Plan SolTrans
DocRef | Issue | June 18, 2013 | Arup North America Ltd S:\SOLTRANS\ELIZABETH\MEETINGS AND PRESENTATIONS\BOARD MEETING\6-27-2013\COORDINATED SRTP\ATTACHMENT A. SOLTRANS FINAL DRAFT SRTP.DOCX
Page 61
standards lacked data to evaluate). Key deficiencies were in DAR on-time performance, fixed route system transfer waiting time, and having 30 minute minimum fixed route headways.
Overall, it appears that since July 2012, performance has improved for local buses, although some still perform below the standard (Route 4 in particular). Several intercity routes are operating poorly in terms of both boardings/VRH and boardings/VRM and could be candidates for modification, and/or consolidation such as Route 76, 78 and 80S. Against proposed intercity fixed route performance standards being considered in STA’s Transit Corridor study, SolTrans intercity routes are currently performing within most standards. Route 80 has the best performance followed by Route 85. Route 78 has the lowest performance. Routes 76 and 80S are not subject to the proposed STA standards.
The 2012 CBTP revealed that the top community needs involve transit routing, service span, and schedule, as well as cost, safety/comfort, coordination, and accessibility. SolTrans submitted a Tile VI Program in November 2011. The FTA triennial review found that SolTrans was in accordance with FTA requirements in 20 of the 24 areas, with deficiencies in the Technical, Satisfactory Continuing Control, ADA, and ARRA categories. The March 2012 TDA Audit findings (for FY2006-2011) regarding SolTrans service performance trends were consistent with the performance evaluation conducted for this SRTP. The review noted that SolTrans was implementing a new performance management system based on its recently approved SRTP to rectify worsening bus and paratransit service performance.

Solano County Transportation Authority Short Range Transit Plan SolTrans
DocRef | Issue | June 18, 2013 | Arup North America Ltd S:\SOLTRANS\ELIZABETH\MEETINGS AND PRESENTATIONS\BOARD MEETING\6-27-2013\COORDINATED SRTP\ATTACHMENT A. SOLTRANS FINAL DRAFT SRTP.DOCX
Page 62
4 Operating, Financial and Capital Plan
4.1 Operations Plan SolTrans will continue to provide fixed route local bus and complementary ADA paratransit services to the 116,000 residents of Vallejo and provide local dial-a-ride (DAR) services to the 26,000 residents of Benicia on Mondays through Saturdays. In both FY2013-14 and FY2014-15, staff proposes to add about 2,000 revenue hours each year, 4,000 hours total, on the most productive local bus routes which amounts to less than 5% fixed route service expansion.
SolTrans will continue to supplement ADA paratransit by subsidizing a local taxi scrip program. In addition to these local public transit services, SolTrans will continue its funding participation in the County’s intercity taxi scrip program for ADA qualified persons. Finally, SolTrans will continue to operate a portion of SolanoExpress intercity bus services utilized by all residents of Solano County. The routes operated by SolTrans include:
• Route 76 connecting Vallejo and Benicia with Diablo Valley College, the Vallejo Transit Center, and Benicia City Park;
• Route 78 operating between Vallejo, Benicia, Pleasant Hill and Walnut Creek BART;
• Route 80 operating between Vallejo and El Cerrito del Norte BART; • Route 80S operating between Vallejo, Benicia and the Walnut Creek
BART station on Sundays; • Route 85 operating between Vallejo and Westfield Solano Mall with stops
in Fairfield at Solano Community College and Six Flags Discovery Kingdom; and
• Route 200 which is an express bus service from Vallejo to the Ferry Building in San Francisco (operated under an agreement with the Water Emergency Transit Authority).
In FY2012-13, SolTrans is expected to serve about 1.5 million riders systemwide with about 115,000 service hours, at a cost of about $11.5 million with fare revenues of about $3.3 million recovering about 29% of operating costs from fare revenues. Between FY2012-13 and FY2014-15, ridership on fixed route local service is expected to grow 3% due to the introduction of new services. After this initial increase, local ridership is forecast to be about 1% per year. Ridership on Intercity and all paratransit services is forecast to grow at 2% per year FY2021-22. Ridership increases on existing bus routes and DAR services should be able to be accommodated without any additional expansion of service.
4.2 Operating Budget and Financial Projection The Operating Budget and Financial Projection shows that SolTrans will have declining annual operating surplus over most of the 10 year forecast period, with a
Solano County Transportation Authority Short Range Transit Plan SolTrans
DocRef | Issue | June 18, 2013 | Arup North America Ltd S:\SOLTRANS\ELIZABETH\MEETINGS AND PRESENTATIONS\BOARD MEETING\6-27-2013\COORDINATED SRTP\ATTACHMENT A. SOLTRANS FINAL DRAFT SRTP.DOCX
Page 63
small operating deficit in the final year of the plan. The deficit can be covered with available TDA reserves. SolTrans will need to evaluate its expense and revenue trends and determine options for making the operating budget more sustainable over time. A baseline FY2012-13 operating budget and financial projection through FY2021-22 is provided in Table 16 through Table 18, which present budgets for fixed route and paratransit services, as well as the cumulative systemwide totals.
4.2.1 Operating Expenses SolTrans total costs will grow at a modest pace under a new operations contract that can be extended through FY2019-20. This contract provides labor and ancillary resources necessary to operate and maintain the entire SolTrans system and revenue vehicle fleet including local and intercity fixed routes, ADA complementary paratransit and Benicia DAR. One of the benefits to SolTrans of the new contract is that the cost is determined using a per revenue vehicle hour rate rather than the former per total vehicle hour rate.
SolTrans will continue to operate SolanoExpress intercity bus services utilized by all residents of Solano County and subsidized through the Intercity Transit Funding Agreement between SolTrans, FAST, Vacaville, Dixon, STA and County of Solano. The baseline financial projection assumes operating costs for intercity services will include modest inflation-based growth at the same general rate as the rest of the SolTrans operation.
SolTrans is working with STA and MTC to launch Clipper in Solano County. As of the time of this SRTP, information was not yet available on the ongoing operating and maintenance cost to the local transit operators for the use of the Clipper technology and third party revenue processing. In this operating plan, it is assumed that costs would be comparable to current expenses for fare collection & processing.
4.2.2 Program Expenses SolTrans makes financial contributions to several programs that provide County-wide services on a shared-cost basis. Specifically, SolTrans participates in both the local taxi scrip program and the Intercity taxi scrip program and it is a funding partner in the SolanoExpress intercity bus services.
The Intercity taxi scrip program has recently been renewed through a new MOU that will be effective July 1, 2013 through June 30, 2015. SolTrans’s costs for this program will be $85,000 per year for the period of the MOU, which is more than four times higher than the contribution paid in FY2012-13. In future years, program costs are forecast to grow in line with TDA apportionments.
More detail about the financial transfers to reconcile the cost of intercity bus services is included below in Section 4.2.5.

Solano County Transportation Authority Short Range Transit Plan SolTrans
DocRef | Issue | June 18, 2013 | Arup North America Ltd S:\SOLTRANS\ELIZABETH\MEETINGS AND PRESENTATIONS\BOARD MEETING\6-27-2013\COORDINATED SRTP\ATTACHMENT A. SOLTRANS FINAL DRAFT SRTP.DOCX
Page 64
4.2.3 Operating Revenues The financial projection assumes no change from current SolTrans local passenger fares of $1.75 for adults, $1.50 for youth, ages 6-18, and $0.85 for seniors age 65 and over and persons with disabilities, with day, 10 ride and monthly passes available. Transfers will not be issued except for continuing travel on intercity buses.
Clipper is expected to be implemented throughout Solano County as early as FY2013-14. The implementation plan includes installation on SolTrans, with a focus on improving inter-operator transfers. Specific business rules and pricing of Clipper will be determined in consultation with other Solano transit operators and MTC. Current fare media will likely continue to be offered, so the availability of Clipper as a new payment option is not expected to cause any significant changes in average fare per passenger or total fare revenues received by SolTrans.
4.2.4 Subsidy Revenues SolTrans has historically relied on seven primary revenue sources to subsidize transit operations: TDA LTF apportionments, STAF revenue-based apportionments, Lifeline grants funded by STAF, Regional Measure 2, FTA’s 5307 Urbanized Area funding program, and FTA’s 5311 Non-Urbanized Area funding for Intercity Operations, and FTA’s 5316 Job Access and Reverse Commute (JARC) program that supports Local Operations. The first two of these funding programs provide formula funding allocations for the exclusive use of SolTrans (as opposed to competitive grant programs or funds programmed by other agencies). The five remaining sources are awarded at the discretion of other funding partners, so funding levels could change in the future as new services come online and other needs emerge. The subsidy revenues shown in the operating plan are based on the following assumptions:
• TDA-LTF Apportionments – These are based on statewide sales tax collections, and subject to escalation due to natural inflation and increases due to underlying economic growth. TDA revenues are conservatively assumed to grow at 2% per year through FY2015-16 and 3% per year thereafter. Beginning in FY2012-13, the Benicia apportionment area is combined with Vallejo and 100% of the apportionment is available for SolTrans to claim. A little over 9% of the total SolTrans TDA allocation is dedicated to specific programs, including the local taxi scrip program, STA Planning activities, and Solano County-wide transportation programs (inter-city taxi scrip). As a simplifying assumption, the required contributions for these programs are all assumed to grow at the same rate as overall TDA apportionments.
• STAF Funding: Revenue-Based Apportionments and Lifeline – Both the formula apportionments and the Lifeline allocation come from the State Transit Assistance Fund, which is derived from taxes on fuel sales. The total amounts in the STAF tend to vary annually due to volatility in fuel sales and uncertainty around future State budget actions. As a result, no growth assumption was included for these two sources.
Solano County Transportation Authority Short Range Transit Plan SolTrans
DocRef | Issue | June 18, 2013 | Arup North America Ltd S:\SOLTRANS\ELIZABETH\MEETINGS AND PRESENTATIONS\BOARD MEETING\6-27-2013\COORDINATED SRTP\ATTACHMENT A. SOLTRANS FINAL DRAFT SRTP.DOCX
Page 65
• Regional Measure 2 (RM2) – This funding source is derived from a portion of bridge tolls collected on the seven state-owned bridges in the Bay Area. It is designated for use on projects that relieve congestion or make improvements in the bridge corridors, including intercity express bus service such as SolanoExpress. The SolanoExpress bus routes receive operating support as part of the “Regional Express Bus North Pool”, which covers all services that cross the Carquinez and Benicia Bridges. It is assumed the level of funding will be consistent with historical levels; per MTC, no growth assumption was included.
• FTA 5307 Urbanized Area Funding – Funding is assumed to be stable during the period covered by this SRTP. SolTrans claims the majority of the funds apportioned to the Vallejo Urbanized Area (UZA), which had a population of 165,074 in the 2010 Census. Because the UZA population is less than 200,000, the allocation formula is based on population and population density, and SolTrans is permitted to use the funding for operations. SolTrans also receives approximately 2% of the funding from the ADA Paratransit Operating Set-aside for the San-Francisco-Oakland UZA, which is used to support paratransit services. Though MAP-21 and future re-authorizations may alter the structure of the FTA funding programs, it is assumed that operating assistance will continue to be provided and that the level of funding support for urbanized areas will not be significantly decreased in future federal programs.
• FTA 5311 Non-Urbanized Area Funding – The 5311 program formula is currently based on land area and the decennial census population, both of which are expected to remain unchanged for the majority of the forecast period. STA works with the Solano County operators to determine the appropriate sub-allocation, so the baseline assumption is that the amount of funding received will be stable during the period covered by this SRTP. Though MAP-21 and future re-authorizations may alter the structure of the FTA funding programs, it is assumed that operating assistance will continue to be provided and that the level of funding support for rural transit services will not be significantly decreased in future federal programs.
• FTA 5316 Job Access and Reverse Commute (JARC) Funding – The 5316 program historically provided additional operating support for transit that connects suburban employment centers. Funding was distributed based on factors such as the size of each urbanized/rural area and its proportional share of low-income residents and welfare recipients. The recent restructuring of federal funding programs under MAP-21 eliminated 5316 as a separate program, but the JARC factors are now included in the allocation formulas for funding under the 5311 Non-Urbanized Area program (described above). Accordingly, it is assumed that the Vallejo and Benicia areas will continue to receive some funding based on past eligibility. For clarity, funding related to the JARC factors is shown as a separate line item from the 5311 funding.

Solano County Transportation Authority Short Range Transit Plan SolTrans
DocRef | Issue | June 18, 2013 | Arup North America Ltd S:\SOLTRANS\ELIZABETH\MEETINGS AND PRESENTATIONS\BOARD MEETING\6-27-2013\COORDINATED SRTP\ATTACHMENT A. SOLTRANS FINAL DRAFT SRTP.DOCX
Page 66
In addition to these on-going sources, SolTrans has periodically received allocations of discretionary funding from FTA sources in the past, including the 5303 Metropolitan & Long-Range Planning program and augmented 5307 funding available from the American Recovery and Reinvestment Act. Some of these funding programs have recently been re-organized under the MAP-21 re-authorization, but the activities funded under the SAFETEA-LU programs remain eligible in the new programs, and overall funding levels are reasonably equivalent to historical levels. However, given the significant competition for these funding sources, no additional support from one-time grants was assumed in the baseline financial forecast.
4.2.5 SolanoExpress As described above in Section 4.1, SolTrans plans to continue operating the same level of service on the three SolanoExpress routes that are part of the Intercity Transit Funding Agreement: Routes 78, 80, and 85.
SolTrans determines the operating cost of its Intercity services using a fully allocated Cost Allocation Model (CAM) that assigns the combined local and intercity fixed route system costs to each bus route based on each route’s share of RVH, Total Miles and Peak Buses. Fare revenues and committed subsidies are applied to compute the net operating deficit of each route. The Intercity Transit Funding Agreement specifies a population and ridership formula for distributing the net operating cost to each of the six participating agencies: SolTrans, FAST, Vacaville, Dixon, STA and County of Solano.
As one of two operators of the Intercity services, SolTrans receives contributions from the partner agencies, but also must pay its share of the services operated by FAST. Although the exact amounts can vary annually, the financial projection is based on the most recently approved annual budget for Intercity operations. The combined cost allocation plan for FY2012-13 required SolTrans to contribute a little less than 5% of its annual TDA apportionment towards its share of the net operating expenses for the FAST routes, and showed that SolTrans would receive contributions of TDA revenues from other funding partners that cover approximately 5% of the cost of SolTrans’ Intercity operations.
A separate Transit Corridor Study is being prepared to develop possible improvements to intercity bus services. The Corridor Study will be completed later this summer. Financial impacts on transit operators will be evaluated as a part of the study.
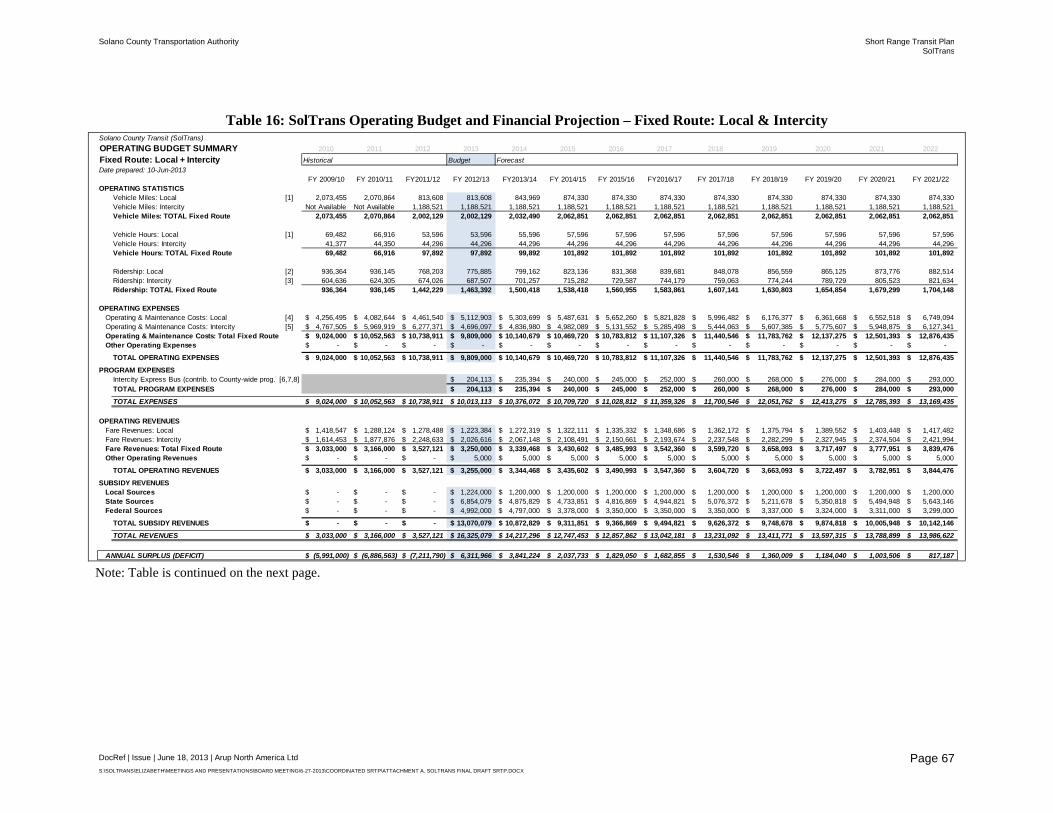
Solano County Transportation Authority Short Range Transit Plan SolTrans
DocRef | Issue | June 18, 2013 | Arup North America Ltd S:\SOLTRANS\ELIZABETH\MEETINGS AND PRESENTATIONS\BOARD MEETING\6-27-2013\COORDINATED SRTP\ATTACHMENT A. SOLTRANS FINAL DRAFT SRTP.DOCX
Page 67
Table 16: SolTrans Operating Budget and Financial Projection – Fixed Route: Local & Intercity
Note: Table is continued on the next page.
Solano County Transit (SolTrans)OPERATING BUDGET SUMMARY 2010 2011 2012 2013 2014 2015 2016 2017 2018 2019 2020 2021 2022Fixed Route: Local + Intercity Historical Budget ForecastDate prepared: 10-Jun-2013
FY 2009/10 FY 2010/11 FY2011/12 FY 2012/13 FY2013/14 FY 2014/15 FY 2015/16 FY2016/17 FY 2017/18 FY 2018/19 FY 2019/20 FY 2020/21 FY 2021/22OPERATING STATISTICS
Vehicle Miles: Local [1] 2,073,455 2,070,864 813,608 813,608 843,969 874,330 874,330 874,330 874,330 874,330 874,330 874,330 874,330 Vehicle Miles: Intercity Not Available Not Available 1,188,521 1,188,521 1,188,521 1,188,521 1,188,521 1,188,521 1,188,521 1,188,521 1,188,521 1,188,521 1,188,521 Vehicle Miles: TOTAL Fixed Route 2,073,455 2,070,864 2,002,129 2,002,129 2,032,490 2,062,851 2,062,851 2,062,851 2,062,851 2,062,851 2,062,851 2,062,851 2,062,851
Vehicle Hours: Local [1] 69,482 66,916 53,596 53,596 55,596 57,596 57,596 57,596 57,596 57,596 57,596 57,596 57,596 Vehicle Hours: Intercity 41,377 44,350 44,296 44,296 44,296 44,296 44,296 44,296 44,296 44,296 44,296 44,296 44,296 Vehicle Hours: TOTAL Fixed Route 69,482 66,916 97,892 97,892 99,892 101,892 101,892 101,892 101,892 101,892 101,892 101,892 101,892
Ridership: Local [2] 936,364 936,145 768,203 775,885 799,162 823,136 831,368 839,681 848,078 856,559 865,125 873,776 882,514 Ridership: Intercity [3] 604,636 624,305 674,026 687,507 701,257 715,282 729,587 744,179 759,063 774,244 789,729 805,523 821,634 Ridership: TOTAL Fixed Route 936,364 936,145 1,442,229 1,463,392 1,500,418 1,538,418 1,560,955 1,583,861 1,607,141 1,630,803 1,654,854 1,679,299 1,704,148
OPERATING EXPENSESOperating & Maintenance Costs: Local [4] 4,256,495$ 4,082,644$ 4,461,540$ 5,112,903$ 5,303,699$ 5,487,631$ 5,652,260$ 5,821,828$ 5,996,482$ 6,176,377$ 6,361,668$ 6,552,518$ 6,749,094$ Operating & Maintenance Costs: Intercity [5] 4,767,505$ 5,969,919$ 6,277,371$ 4,696,097$ 4,836,980$ 4,982,089$ 5,131,552$ 5,285,498$ 5,444,063$ 5,607,385$ 5,775,607$ 5,948,875$ 6,127,341$ Operating & Maintenance Costs: Total Fixed Route 9,024,000$ 10,052,563$ 10,738,911$ 9,809,000$ 10,140,679$ 10,469,720$ 10,783,812$ 11,107,326$ 11,440,546$ 11,783,762$ 12,137,275$ 12,501,393$ 12,876,435$ Other Operating Expenses -$ -$ -$ -$ -$ -$ -$ -$ -$ -$ -$ -$ -$
TOTAL OPERATING EXPENSES 9,024,000$ 10,052,563$ 10,738,911$ 9,809,000$ 10,140,679$ 10,469,720$ 10,783,812$ 11,107,326$ 11,440,546$ 11,783,762$ 12,137,275$ 12,501,393$ 12,876,435$
PROGRAM EXPENSESIntercity Express Bus (contrib. to County-wide prog.) [6,7,8] 204,113$ 235,394$ 240,000$ 245,000$ 252,000$ 260,000$ 268,000$ 276,000$ 284,000$ 293,000$ TOTAL PROGRAM EXPENSES 204,113$ 235,394$ 240,000$ 245,000$ 252,000$ 260,000$ 268,000$ 276,000$ 284,000$ 293,000$
TOTAL EXPENSES 9,024,000$ 10,052,563$ 10,738,911$ 10,013,113$ 10,376,072$ 10,709,720$ 11,028,812$ 11,359,326$ 11,700,546$ 12,051,762$ 12,413,275$ 12,785,393$ 13,169,435$
OPERATING REVENUESFare Revenues: Local 1,418,547$ 1,288,124$ 1,278,488$ 1,223,384$ 1,272,319$ 1,322,111$ 1,335,332$ 1,348,686$ 1,362,172$ 1,375,794$ 1,389,552$ 1,403,448$ 1,417,482$ Fare Revenues: Intercity 1,614,453$ 1,877,876$ 2,248,633$ 2,026,616$ 2,067,148$ 2,108,491$ 2,150,661$ 2,193,674$ 2,237,548$ 2,282,299$ 2,327,945$ 2,374,504$ 2,421,994$ Fare Revenues: Total Fixed Route 3,033,000$ 3,166,000$ 3,527,121$ 3,250,000$ 3,339,468$ 3,430,602$ 3,485,993$ 3,542,360$ 3,599,720$ 3,658,093$ 3,717,497$ 3,777,951$ 3,839,476$ Other Operating Revenues -$ -$ -$ 5,000$ 5,000$ 5,000$ 5,000$ 5,000$ 5,000$ 5,000$ 5,000$ 5,000$ 5,000$
TOTAL OPERATING REVENUES 3,033,000$ 3,166,000$ 3,527,121$ 3,255,000$ 3,344,468$ 3,435,602$ 3,490,993$ 3,547,360$ 3,604,720$ 3,663,093$ 3,722,497$ 3,782,951$ 3,844,476$
SUBSIDY REVENUESLocal Sources -$ -$ -$ 1,224,000$ 1,200,000$ 1,200,000$ 1,200,000$ 1,200,000$ 1,200,000$ 1,200,000$ 1,200,000$ 1,200,000$ 1,200,000$ State Sources -$ -$ -$ 6,854,079$ 4,875,829$ 4,733,851$ 4,816,869$ 4,944,821$ 5,076,372$ 5,211,678$ 5,350,818$ 5,494,948$ 5,643,146$ Federal Sources -$ -$ -$ 4,992,000$ 4,797,000$ 3,378,000$ 3,350,000$ 3,350,000$ 3,350,000$ 3,337,000$ 3,324,000$ 3,311,000$ 3,299,000$
TOTAL SUBSIDY REVENUES -$ -$ -$ 13,070,079$ 10,872,829$ 9,311,851$ 9,366,869$ 9,494,821$ 9,626,372$ 9,748,678$ 9,874,818$ 10,005,948$ 10,142,146$
TOTAL REVENUES 3,033,000$ 3,166,000$ 3,527,121$ 16,325,079$ 14,217,296$ 12,747,453$ 12,857,862$ 13,042,181$ 13,231,092$ 13,411,771$ 13,597,315$ 13,788,899$ 13,986,622$
ANNUAL SURPLUS (DEFICIT) (5,991,000)$ (6,886,563)$ (7,211,790)$ 6,311,966$ 3,841,224$ 2,037,733$ 1,829,050$ 1,682,855$ 1,530,546$ 1,360,009$ 1,184,040$ 1,003,506$ 817,187$

Solano County Transportation Authority Short Range Transit Plan SolTrans
DocRef | Issue | June 18, 2013 | Arup North America Ltd S:\SOLTRANS\ELIZABETH\MEETINGS AND PRESENTATIONS\BOARD MEETING\6-27-2013\COORDINATED SRTP\ATTACHMENT A. SOLTRANS FINAL DRAFT SRTP.DOCX
Page 68
Solano County Transit (SolTrans)OPERATING BUDGET SUMMARY 2010 2011 2012 2013 2014 2015 2016 2017 2018 2019 2020 2021 2022Fixed Route: Local + Intercity Historical Budget ForecastDate prepared: 10-Jun-2013
FY 2009/10 FY 2010/11 FY2011/12 FY 2012/13 FY2013/14 FY 2014/15 FY 2015/16 FY2016/17 FY 2017/18 FY 2018/19 FY 2019/20 FY 2020/21 FY 2021/22
METRICSOperating Expense Per Vehicle MILE: Local 2.05$ 1.97$ 5.48$ 6.28$ 6.28$ 6.28$ 6.46$ 6.66$ 6.86$ 7.06$ 7.28$ 7.49$ 7.72$ Operating Expense Per Vehicle MILE: Intercity n/a n/a 5.28$ 3.95$ 4.07$ 4.19$ 4.32$ 4.45$ 4.58$ 4.72$ 4.86$ 5.01$ 5.16$ Operating Expense Per Vehicle MILE: All Fixed Route 4.35$ 4.85$ 5.36$ 4.90$ 4.99$ 5.08$ 5.23$ 5.38$ 5.55$ 5.71$ 5.88$ 6.06$ 6.24$ Operating Expense Per Vehicle HOUR: Local 61.26$ 61.01$ 83.24$ 95.40$ 95.40$ 95.28$ 98.14$ 101.08$ 104.11$ 107.24$ 110.45$ 113.77$ 117.18$ Operating Expense Per Vehicle HOUR: Intercity 115.22$ 134.61$ 141.71$ 106.02$ 109.20$ 112.47$ 115.85$ 119.32$ 122.90$ 126.59$ 130.39$ 134.30$ 138.33$ Operating Expense Per Vehicle HOUR: All Fixed Route 129.88$ 150.23$ 109.70$ 100.20$ 101.52$ 102.75$ 105.84$ 109.01$ 112.28$ 115.65$ 119.12$ 122.69$ 126.37$ Operating Expense Per Passenger: Local 4.55$ 4.36$ 5.81$ 6.59$ 6.64$ 6.67$ 6.80$ 6.93$ 7.07$ 7.21$ 7.35$ 7.50$ 7.65$ Operating Expense Per Passenger: Intercity 7.88$ 9.56$ 9.31$ 6.83$ 6.90$ 6.97$ 7.03$ 7.10$ 7.17$ 7.24$ 7.31$ 7.39$ 7.46$ Operating Expense Per Passenger: All Fixed Route 9.64$ 10.74$ 7.45$ 6.70$ 6.76$ 6.81$ 6.91$ 7.01$ 7.12$ 7.23$ 7.33$ 7.44$ 7.56$ Passengers Per Vehicle HOUR: Local 13.5 14.0 14.3 14.5 14.4 14.3 14.4 14.6 14.7 14.9 15.0 15.2 15.3 Passengers Per Vehicle HOUR: Intercity 14.6 14.1 15.2 15.5 15.8 16.1 16.5 16.8 17.1 17.5 17.8 18.2 18.5 Passengers Per Vehicle HOUR: All Fixed Route 13.5 14.0 14.7 14.9 15.0 15.1 15.3 15.5 15.8 16.0 16.2 16.5 16.7 Average Fare Per Passenger: Local 1.51$ 1.38$ 1.66$ 1.58$ 1.59$ 1.61$ 1.61$ 1.61$ 1.61$ 1.61$ 1.61$ 1.61$ 1.61$ Average Fare Per Passenger: Intercity 2.67$ 3.01$ 3.34$ 2.95$ 2.95$ 2.95$ 2.95$ 2.95$ 2.95$ 2.95$ 2.95$ 2.95$ 2.95$ Average Fare Per Passenger: All Fixed Route 3.24$ 3.38$ 2.45$ 2.22$ 2.23$ 2.23$ 2.23$ 2.24$ 2.24$ 2.24$ 2.25$ 2.25$ 2.25$ Farebox Recovery (Fares as % of Oper. Exp.): Local 33.33% 31.55% 28.66% 23.93% 23.99% 24.09% 23.62% 23.17% 22.72% 22.28% 21.84% 21.42% 21.00%Farebox Recovery (Fares as % of Oper. Exp.): Intercity 33.86% 31.46% 35.82% 43.16% 42.74% 42.32% 41.91% 41.50% 41.10% 40.70% 40.31% 39.92% 39.53%Farebox Recovery (Fares as % of Oper. Exp.): All FR 33.61% 31.49% 32.84% 33.13% 32.93% 32.77% 32.33% 31.89% 31.46% 31.04% 30.63% 30.22% 29.82%Local Recovery (Fares+Local Sub. as % of Oper. Exp.) 33.61% 31.49% 32.84% 45.66% 44.81% 44.28% 43.50% 42.74% 42.00% 41.27% 40.56% 39.86% 39.18%
[1] Assumes Local service adds 2,000 additional vehicle hours each year in FY2013/14 and FY2014/15 with proportional increase in vehicle miles. Service plan unchanged thereafter.[2] Assumes Local ridership and fare growth of 3%/year due to each service expansion in FY2013/14 and FY2014/15. Thereafter, growth is at 1%, which is consistent with Solano County population forecast. (No change to fare structure.)[3] Assumes Intercity ridership and transit fares grow at 2% per year. (No change to fare structure.)[4] After near-term service increase, Local O&M costs assumed to increase at 3% per year. This includes average annual increase in vendor costs of 3.7% per year through FY2019/2020, combined with cost control measures on all other operations costs.[5] Intercity O&M costs assumed to increase at 3% per year. This includes average annual increase in vendor costs of 3.7% per year through FY2019/2020, combined with cost control measures on all other operations costs.[6] FY2012/13 amounts from Solano County TDA Matrix (June, 2012); sum of Vallejo & Benicia amounts.[7] FY2013/14 amount from Intercity Funding Agreement calculations for FY2012/13 service (May-2012) +2% escalation.[8] Assumes amounts increase consistent with growth in TDA apportionment, i.e., 2% annual growth through FY2015/16 and 3% annual growth thereafter.

Solano County Transportation Authority Short Range Transit Plan SolTrans
DocRef | Issue | June 18, 2013 | Arup North America Ltd S:\SOLTRANS\ELIZABETH\MEETINGS AND PRESENTATIONS\BOARD MEETING\6-27-2013\COORDINATED SRTP\ATTACHMENT A. SOLTRANS FINAL DRAFT SRTP.DOCX
Page 69
Table 17: SolTrans Operating Budget and Financial Projection– Paratransit & Dial-A-Ride
Solano County Transit (SolTrans)OPERATING BUDGET SUMMARY 2010 2011 2012 2013 2014 2015 2016 2017 2018 2019 2020 2021 2022Paratransit: ADA + DAR + All Taxi Scrip Historical Budget ForecastDate prepared: 10-Jun-2013
FY 2009/10 FY 2010/11 FY2011/12 FY 2012/13 FY2013/14 FY 2014/15 FY 2015/16 FY2016/17 FY 2017/18 FY 2018/19 FY 2019/20 FY 2020/21 FY 2021/22OPERATING STATISTICS -- without taxi programs
Vehicle Miles 214,088 121,900 263,057 298,990 298,990 298,990 298,990 298,990 298,990 298,990 298,990 298,990 298,990 Vehicle Hours 22,631 15,696 15,227 17,307 17,307 17,307 17,307 17,307 17,307 17,307 17,307 17,307 17,307 Ridership 43,890 36,130 31,021 40,548 41,359 42,186 43,030 43,890 44,768 45,664 46,577 47,508 48,459
OPERATING EXPENSES - without taxi programsOperating & Maintenance Costs 1,790,693$ 1,473,128$ 1,513,325$ 1,732,000$ 1,784,000$ 1,838,000$ 1,893,000$ 1,950,000$ 2,009,000$ 2,070,000$ 2,132,000$ 2,196,000$ 2,262,000$ Other Operating Expenses -$ -$ -$ -$ -$ -$ -$ -$ -$ -$ -$ -$ -$
TOTAL OPERATING EXPENSES 1,790,693$ 1,473,128$ 1,513,325$ 1,732,000$ 1,784,000$ 1,838,000$ 1,893,000$ 1,950,000$ 2,009,000$ 2,070,000$ 2,132,000$ 2,196,000$ 2,262,000$
PROGRAM EXPENSESLocal Taxi Scrip (net expense) [1] 80,934$ 83,871$ 86,797$ 90,521$ 94,228$ 97,921$ 101,600$ 106,063$ 110,509$ 114,939$ Intercity Taxi Scrip (contrib. to County-wide prog.) [2,3] 18,066$ 85,000$ 85,000$ 86,700$ 89,300$ 92,000$ 94,800$ 97,600$ 100,500$ 103,500$ TOTAL PROGRAM EXPENSES 99,000$ 168,871$ 171,797$ 177,221$ 183,528$ 189,921$ 196,400$ 203,663$ 211,009$ 218,439$
TOTAL EXPENSES 1,790,693$ 1,473,128$ 1,513,325$ 1,831,000$ 1,952,871$ 2,009,797$ 2,070,221$ 2,133,528$ 2,198,921$ 2,266,400$ 2,335,663$ 2,407,009$ 2,480,439$
OPERATING REVENUES -- without taxi programsFare Revenues 198,244$ 70,509$ 80,965$ 81,000$ 83,000$ 85,000$ 87,000$ 89,000$ 91,000$ 93,000$ 95,000$ 97,000$ 99,000$ Other Operating Revenues -$ -$ -$ -$ -$ -$ -$ -$ -$ -$ -$ -$ -$
TOTAL OPERATING REVENUES 198,244$ 70,509$ 80,965$ 81,000$ 83,000$ 85,000$ 87,000$ 89,000$ 91,000$ 93,000$ 95,000$ 97,000$ 99,000$
SUBSIDY REVENUESLocal Sources -$ -$ -$ -$ -$ -$ -$ -$ -$ -$ -$ -$ -$ State Sources -$ -$ -$ 1,082,000$ 1,078,012$ 1,099,561$ 1,121,543$ 1,155,191$ 1,189,840$ 1,225,534$ 1,262,294$ 1,300,164$ 1,339,166$ Federal Sources -$ -$ -$ 594,000$ 200,000$ 700,000$ 200,000$ 200,000$ 200,000$ 200,000$ 200,000$ 200,000$ 200,000$
TOTAL SUBSIDY REVENUES -$ -$ -$ 1,676,000$ 1,278,012$ 1,799,561$ 1,321,543$ 1,355,191$ 1,389,840$ 1,425,534$ 1,462,294$ 1,500,164$ 1,539,166$
TOTAL REVENUES 198,244$ 70,509$ 80,965$ 1,757,000$ 1,361,012$ 1,884,561$ 1,408,543$ 1,444,191$ 1,480,840$ 1,518,534$ 1,557,294$ 1,597,164$ 1,638,166$
ANNUAL SURPLUS (DEFICIT) (1,592,449)$ (1,402,619)$ (1,432,360)$ (74,000)$ (591,860)$ (125,236)$ (661,677)$ (689,337)$ (718,081)$ (747,866)$ (778,370)$ (809,845)$ (842,273)$
METRICSOperating Expense Per Vehicle HOUR 79.13$ 93.85$ 99.38$ 100.08$ 103.08$ 106.20$ 109.38$ 112.67$ 116.08$ 119.60$ 123.19$ 126.89$ 130.70$ Operating Expense Per Vehicle MILE 8.36$ 12.08$ 5.75$ 5.79$ 5.97$ 6.15$ 6.33$ 6.52$ 6.72$ 6.92$ 7.13$ 7.34$ 7.57$ Operating Expense Per Passenger 40.80$ 40.77$ 48.78$ 42.71$ 43.13$ 43.57$ 43.99$ 44.43$ 44.88$ 45.33$ 45.77$ 46.22$ 46.68$ Average Fare Per Passenger 4.52$ 1.95$ 2.61$ 2.00$ 2.01$ 2.01$ 2.02$ 2.03$ 2.03$ 2.04$ 2.04$ 2.04$ 2.04$ Passengers Per Vehicle HOUR 1.9 2.3 2.0 2.3 2.4 2.4 2.5 2.5 2.6 2.6 2.7 2.7 2.8 Farebox Recovery (Fares as % of Oper. Exp.) 11.07% 4.79% 5.35% 4.68% 4.65% 4.62% 4.60% 4.56% 4.53% 4.49% 4.46% 4.42% 4.38%Local Recovery (Fares+Local as % of Oper. Exp.) 11.07% 4.79% 5.35% 4.68% 4.65% 4.62% 4.60% 4.56% 4.53% 4.49% 4.46% 4.42% 4.38%
[1] Net expense computed as expenses less fares. Total taxi expenses pro-rated to local (vs. intercity) based on forecast fare revenues for each service. Assume growth consistent with TDA funding, i.e., +2%/year through FY2015/16 and +3%/year thereafter.[2] Amounts for FY2013/14 and FY2014/15 from new MOU (Draft dated 03-May-2013). Assume growth consistent with TDA funding, i.e., +2%/year through FY2015/16 and +3%/year thereafter.[3] Assumes TDA amounts increase consistent with growth in TDA apportionment, i.e., 2% annual growth through FY2015/16 and 3% annual growth thereafter.

Solano County Transportation Authority Short Range Transit Plan SolTrans
DocRef | Issue | June 18, 2013 | Arup North America Ltd S:\SOLTRANS\ELIZABETH\MEETINGS AND PRESENTATIONS\BOARD MEETING\6-27-2013\COORDINATED SRTP\ATTACHMENT A. SOLTRANS FINAL DRAFT SRTP.DOCX
Page 70
Table 18: SolTrans Operating Budget and Financial Projection – Systemwide Total
Solano County Transit (SolTrans) Baseline ScenarioOPERATING BUDGET SUMMARY 2010 2011 2012 2013 2014 2015 2016 2017 2018 2019 2020 2021 2022Systemwide Total Historical Budget ForecastDate prepared: 10-Jun-2013
FY 2009/10 FY 2010/11 FY2011/12 FY 2012/13 FY2013/14 FY 2014/15 FY 2015/16 FY2016/17 FY 2017/18 FY 2018/19 FY 2019/20 FY 2020/21 FY 2021/22OPERATING STATISTICS
Vehicle Miles [1] 2,287,543 2,192,764 2,265,186 2,301,119 2,331,480 2,361,841 2,361,841 2,361,841 2,361,841 2,361,841 2,361,841 2,361,841 2,361,841 Vehicle Hours [1] 92,113 82,612 113,119 115,199 117,199 119,199 119,199 119,199 119,199 119,199 119,199 119,199 119,199 Ridership [2] 980,254 972,275 1,473,250 1,503,940 1,541,777 1,580,604 1,603,985 1,627,751 1,651,909 1,676,467 1,701,430 1,726,808 1,752,606
OPERATING EXPENSESOperating & Maintenance Costs [3] 10,814,693$ 11,525,691$ 12,252,236$ 11,541,000$ 11,924,679$ 12,307,720$ 12,676,812$ 13,057,326$ 13,449,546$ 13,853,762$ 14,269,275$ 14,697,393$ 15,138,435$ Other Operating Expenses -$ -$ -$ -$ -$ -$ -$ -$ -$ -$ -$ -$ -$
TOTAL OPERATING EXPENSES 10,814,693$ 11,525,691$ 12,252,236$ 11,541,000$ 11,924,679$ 12,307,720$ 12,676,812$ 13,057,326$ 13,449,546$ 13,853,762$ 14,269,275$ 14,697,393$ 15,138,435$
PROGRAM EXPENSESLocal Taxi Scrip (net expense) [4] 80,934$ 83,871$ 86,797$ 90,521$ 94,228$ 97,921$ 101,600$ 106,063$ 110,509$ 114,939$ Intercity Taxi Scrip (contrib. to County-wide prog.) [4] 18,066$ 85,000$ 85,000$ 86,700$ 89,300$ 92,000$ 94,800$ 97,600$ 100,500$ 103,500$ Intercity Express Bus (contrib. to County-wide prog.) [4] 204,113$ 235,394$ 240,000$ 245,000$ 252,000$ 260,000$ 268,000$ 276,000$ 284,000$ 293,000$ TOTAL PROGRAM EXPENSES 303,113$ 404,265$ 411,797$ 422,221$ 435,528$ 449,921$ 464,400$ 479,663$ 495,009$ 511,439$
TOTAL EXPENSES 10,814,693$ 11,525,691$ 12,252,236$ 11,844,113$ 12,328,944$ 12,719,517$ 13,099,032$ 13,492,854$ 13,899,467$ 14,318,162$ 14,748,938$ 15,192,403$ 15,649,874$
OPERATING REVENUESFare Revenues [2] 3,231,244$ 3,236,509$ 3,608,086$ 3,331,000$ 3,422,468$ 3,515,602$ 3,572,993$ 3,631,360$ 3,690,720$ 3,751,093$ 3,812,497$ 3,874,951$ 3,938,476$ Other Operating Revenues -$ -$ -$ 5,000$ 5,000$ 5,000$ 5,000$ 5,000$ 5,000$ 5,000$ 5,000$ 5,000$ 5,000$
TOTAL OPERATING REVENUES 3,231,244$ 3,236,509$ 3,608,086$ 3,336,000$ 3,427,468$ 3,520,602$ 3,577,993$ 3,636,360$ 3,695,720$ 3,756,093$ 3,817,497$ 3,879,951$ 3,943,476$
SUBSIDY REVENUESLocal Sources -$ -$ -$ 1,224,000$ 1,200,000$ 1,200,000$ 1,200,000$ 1,200,000$ 1,200,000$ 1,200,000$ 1,200,000$ 1,200,000$ 1,200,000$ State Sources -$ -$ -$ 7,936,079$ 5,953,840$ 5,833,412$ 5,938,412$ 6,100,012$ 6,266,212$ 6,437,212$ 6,613,112$ 6,795,112$ 6,982,312$ Federal Sources -$ -$ -$ 5,586,000$ 4,997,000$ 4,078,000$ 3,550,000$ 3,550,000$ 3,550,000$ 3,537,000$ 3,524,000$ 3,511,000$ 3,499,000$
TOTAL SUBSIDY REVENUES -$ -$ -$ 14,746,079$ 12,150,840$ 11,111,412$ 10,688,412$ 10,850,012$ 11,016,212$ 11,174,212$ 11,337,112$ 11,506,112$ 11,681,312$
TOTAL REVENUES 3,231,244$ 3,236,509$ 3,608,086$ 18,082,079$ 15,578,308$ 14,632,014$ 14,266,405$ 14,486,372$ 14,711,932$ 14,930,305$ 15,154,609$ 15,386,063$ 15,624,788$
ANNUAL SURPLUS (DEFICIT) (7,583,449)$ (8,289,182)$ (8,644,150)$ 6,237,966$ 3,249,364$ 1,912,497$ 1,167,373$ 993,518$ 812,465$ 612,143$ 405,670$ 193,661$ (25,086)$
FINANCIAL CAPACITYOpening Balance
TDA Carryover [5] 594,200$ Annual Cash Flow
Beginning Balance 594,200$ 3,763,892$ 4,876,389$ 5,819,550$ 6,328,068$ 6,970,533$ 4,095,688$ 3,793,426$ 3,036,799$ Add (Less): Annual Surplus (Deficit) 3,249,364$ 1,912,497$ 1,167,373$ 993,518$ 812,465$ 612,143$ 405,670$ 193,661$ (25,086)$ Less: TDA Capital Uses (79,672)$ (800,000)$ (224,212)$ (485,000)$ (170,000)$ (3,486,988)$ (707,933)$ (950,287)$ (1,374,088)$
Equals: Cumulative Year-End Balance 3,763,892$ 4,876,389$ 5,819,550$ 6,328,068$ 6,970,533$ 4,095,688$ 3,793,426$ 3,036,799$ 1,637,625$ Capital Needs
Annual Unfunded Capital Needs, if any -$ -$ -$ -$ -$ -$ -$ -$ -$ Total 10-Year Capital Funding Gap -$
METRICSOperating Expense Per Vehicle HOUR 117.41$ 139.52$ 108.31$ 100.18$ 101.75$ 103.25$ 106.35$ 109.54$ 112.83$ 116.22$ 119.71$ 123.30$ 127.00$ Operating Expense Per Vehicle MILE 4.73$ 5.26$ 5.41$ 5.02$ 5.11$ 5.21$ 5.37$ 5.53$ 5.69$ 5.87$ 6.04$ 6.22$ 6.41$ Operating Expense Per Passenger 11.03$ 11.85$ 8.32$ 7.67$ 7.73$ 7.79$ 7.90$ 8.02$ 8.14$ 8.26$ 8.39$ 8.51$ 8.64$ Average Fare Per Passenger 3.30$ 3.33$ 2.45$ 2.21$ 2.22$ 2.22$ 2.23$ 2.23$ 2.23$ 2.24$ 2.24$ 2.24$ 2.25$ Passengers Per Vehicle HOUR 10.6 11.8 13.0 13.1 13.2 13.3 13.5 13.7 13.9 14.1 14.3 14.5 14.7 Farebox Recovery (Fares as % of Oper. Exp.) 29.88% 28.08% 29.45% 28.86% 28.70% 28.56% 28.19% 27.81% 27.44% 27.08% 26.72% 26.36% 26.02%Local Recovery (Fares+Local as % of Oper. Exp.) 59.76% 56.16% 58.90% 68.37% 67.51% 66.92% 65.88% 64.85% 63.84% 62.85% 61.88% 60.93% 59.99%
[1] Assumes fixed route local service will add 2,000 additional vehicle hours each year in FY2013/14 and FY2014/15 with proportional increase in vehicle miles. Remainder of service plan unchanged.[2] Assumes ridership & fare growth of 3% per year on fixed route local due to each service expansion in FY2013/14 and FY2014/15, followed by fixed route local growth of 1% per year. All other services have ridership & fare growth of 2% per year. (No change to fare sturcture.)[3] After near-term service increase, O&M costs assumed to increase at 3% per year. This includes average annual increase in vendor costs of 3.7% per year through FY2019/2020, combined with cost control measures on all other operations costs.[4] Assumes program growth consistent with growth in TDA funding as specified in TSP, i.e. 2% per year through FY2015/16 and 3% per year thereafter.[5] Source: MTC Fund Estimate (Reso. 4086, 2/27/2013).
Solano County Transportation Authority Short Range Transit Plan SolTrans
DocRef | Issue | June 18, 2013 | Arup North America Ltd S:\SOLTRANS\ELIZABETH\MEETINGS AND PRESENTATIONS\BOARD MEETING\6-27-2013\COORDINATED SRTP\ATTACHMENT A. SOLTRANS FINAL DRAFT SRTP.DOCX
Page 71
4.3 Capital Improvements Plans
4.3.1 Planned and Proposed Capital Projects The following are summary descriptions of the projects contained in SolTrans’ ten year capital improvement plan that support local and intercity fixed route, ADA complementary paratransit and Benicia DAR services.
Revenue Vehicle Rehab & Replacement SolTrans replaces local transit and over-the-road buses in accordance with either FTA standard service life of 12 years or MTC TCP service life of 14 years for OTR coaches. Cutaway vans are replaced on a 7 year cycle.
SolTrans local fixed route services are operated using 21 low floor, diesel-electric hybrid powered and 3 diesel powered 40’ transit buses. The peak coach requirement is currently 19 vehicles. SolTrans recently reduced the active local bus fleet by shifting 5 retired diesel buses to a contingency fleet in FY2012-13. This number is sufficient to support existing local services plus the planned expansion. SolTrans will replace the three diesel buses with new purchases made during FY2015-16. In FY2016-17, the 21 hybrid buses may require rehabilitation of their medium sized diesel engines, as recommended by CARB, at a cost of $75,000 each, or $1.58 million total. The fleet replacement schedule for local fixed route buses is shown in Table 19.
Intercity fixed route services are operated using 15 higher capacity over-the-road coaches, and one diesel-electric hybrid that is shared with local fixed route service. The peak coach requirement is 13 buses. SolTrans has an additional 10 intercity buses available in a contingency fleet in case of emergency or to support any near-term service expansion that may be recommended as part of the current Transit Corridor Study. SolTrans also owns 10 more over-the-road coaches that are leased to FAST for their intercity services. The FAST-operated vehicles are not shown within the SolTrans fleet plan or budget. Over the ten years of this SRTP, a total of 15 over-the-road coaches will be replaced within the SolTrans intercity fleet. The fleet replacement schedule for fixed route intercity buses is shown in Table 20.
ADA paratransit uses 7 cutaway vans and Benicia DAR uses 3 cutaway vans. 4 vans are being held in a contingency fleet in case of emergency. Over the period covered by this SRTP, SolTrans will need to purchase a total of ten cutaway vans to maintain the same combined fleet size. The fleet replacement schedule for paratransit-DAR vehicles is shown in Table 21.
Vehicle purchases for the local fixed route and local paratransit-DAR are funded from a combination of State Proposition 1B PTMISEA funds and local TDA funds. The total cost of local service and paratransit vehicle replacement over 10 years is estimated to be $4.0 million.
Vehicle purchases for the intercity fixed route bus services that are not included in the Intercity Transit Funding Agreement (Routes 76, 80S, and 200) are funded by SolTrans. Vehicle purchases for the intercity fixed route bus services that are

Solano County Transportation Authority Short Range Transit Plan SolTrans
DocRef | Issue | June 18, 2013 | Arup North America Ltd S:\SOLTRANS\ELIZABETH\MEETINGS AND PRESENTATIONS\BOARD MEETING\6-27-2013\COORDINATED SRTP\ATTACHMENT A. SOLTRANS FINAL DRAFT SRTP.DOCX
Page 72
included in the Intercity Transit Funding Agreement (Routes 78, 80 and 85) are funded by all participating agencies based on inter-agency agreements negotiated through the Intercity Transit Funding Working Group. As formally agreed in February 2013, the three near term replacements for SolTrans will be funded with a combination of approved federal earmarks, Proposition 1B (Lifeline & Population-Based), and TDA-STAF funding.
For the longer term replacements beginning in FY2018-19, the total capital funding requirement is split 20% by STA, 20% by MTC, and 60% by the remaining Intercity funding partners: SolTrans, FAST, Vacaville, Dixon and the County. The distribution of the 60% share is based on the same formula that determines the subsidy shares for net operating expenses. SolTrans will use TDA to fund its share of intercity bus replacement. The total net cost to SolTrans for intercity service vehicle replacements is estimated to be $6.5 million, of which $5.6 million will come due during the period covered by this SRTP.
Finally, SolTrans is partnering with STA to conduct a study of alternative fuels for its vehicle fleet in 2013-14 to inform strategies for shaping the future fleet and support facilities to coordinate with local, regional, state and federal climate change initiatives. The cost of this study is estimated at about $100,000.
Non-Revenue Vehicle Replacement SolTrans currently has ten vehicles in its non-revenue fleet, but is retiring the five oldest vehicles this year (2013). Five are used primarily for administration, and five for road supervision and maintenance. Light duty cars and trucks are replaced every 7 years. Administration vehicles have low mileage. Estimated cost to replace the five remaining supervision and maintenance support vehicles over the 10 years is $325,000. TDA revenue is the primary source of funding.

Solano County Transportation Authority Short Range Transit Plan SolTrans
DocRef | Issue | June 18, 2013 | Arup North America Ltd S:\SOLTRANS\ELIZABETH\MEETINGS AND PRESENTATIONS\BOARD MEETING\6-27-2013\COORDINATED SRTP\ATTACHMENT A. SOLTRANS FINAL DRAFT SRTP.DOCX
Page 73
Table 19: Vehicle Fleet Replacement Schedule – Fixed Route Local
Number of
VehiclesYear Model Seats
Eligible Replacement
YearFY12/13 FY13/14 FY14/15 FY15/16 FY16/17 FY17/18 FY18/19 FY19/20 FY20/21
Existing Fleet21 2011 Gill ig Low-Floor Hybrid Electric 1 39 FY 2023/24 21 21 21 21 21 21 21 21 21
3 2001 Orion V High Floor Diesel 44 FY 2013/14 * 3 3 3 332 Sub-Total Existing Fleet 24 24 24 24 21 21 21 21 21
Future Acquisitions
3 2016 Low-Floor Hybrid Electric TBD FY 2028/29 3 3 3 3 33 Sub-Total: Acquisitions 0 0 0 0 3 3 3 3 3
Sold/Salvaged 0 0 0 0 3 0 0 0 0Contingency 5 5 5 5 5 5 5 5 5Total Fixed Route Fleet - Active Fleet 24 24 24 24 24 24 24 24 24Total Fixed Route Fleet - All vehicles 29 29 29 29 29 29 29 29 29Peak Vehicle Requirement 19 19 19 19 19 19 19 19 19Spare vehicles 5 5 5 5 5 5 5 5 5Spare ratio 26% 26% 26% 26% 26% 26% 26% 26% 26%
Notes: 1 One vehicle is shared between Intercity Route 76 (peak service) and Local bus routes (mid-day service).* Eligible replacement year listed; SolTrans plans to retain vehicle(s) beyond minimum useful life.Retired buses are sold/salvaged in their replacement year, unless retained for contingency.

Solano County Transportation Authority Short Range Transit Plan SolTrans
DocRef | Issue | June 18, 2013 | Arup North America Ltd S:\SOLTRANS\ELIZABETH\MEETINGS AND PRESENTATIONS\BOARD MEETING\6-27-2013\COORDINATED SRTP\ATTACHMENT A. SOLTRANS FINAL DRAFT SRTP.DOCX
Page 74
Table 20: Vehicle Fleet Replacement Schedule – Fixed Route Intercity
Number of
VehiclesYear Model Seats
Eligible Replacement
YearFY12/13 FY13/14 FY14/15 FY15/16 FY16/17 FY17/18 FY18/19 FY19/20 FY20/21
Existing Fleet1 2011 Gill ig Low-Floor Hybrid Electric 1 39 FY 2023/24 1 1 1 1 1 1 1 1 1
15 2003 MCI Over-the-Road Diesel 57 FY 2015/16 * 15 15 15 13 13 12 12
25 Sub-Total Existing Fleet 16 16 16 14 14 13 13 1 1Future Acquisitions
2 2015 Over-the-Road coach (fuel TBD) New FY 2029/30 2 2 2 2 2 21 2017 Over-the-Road coach (fuel TBD) New FY 2031/32 1 1 1 1
12 2019 Over-the-Road coach (fuel TBD) New FY 2033/34 12 12
15 Sub-Total: Acquisitions 0 0 0 2 2 3 3 15 15Sold/Salvaged 0 0 0 2 0 1 0 12 0Contingency 10 10 10 10 10 10 10 10 10Total Intercity Fleet - Active Vehicles 16 16 16 16 16 16 16 16 16Total Intercity Fleet - All Vehicles 26 26 26 26 26 26 26 26 26Peak Vehicle Requirement 13 13 13 13 13 13 13 13 13Spare vehicles 1 3 3 3 3 3 3 3 3 3Spare ratio 23% 23% 23% 23% 23% 23% 23% 23% 23%
Notes: 1 This vehicle is shared between Intercity Route 76 (peak service) and Local bus routes (mid-day service).* FTA eligible replacement year listed; SolTrans has used mid-life engine replacement to extend vehicle life.Retired buses are sold/salvaged in their replacement year, unless retained for contingency.
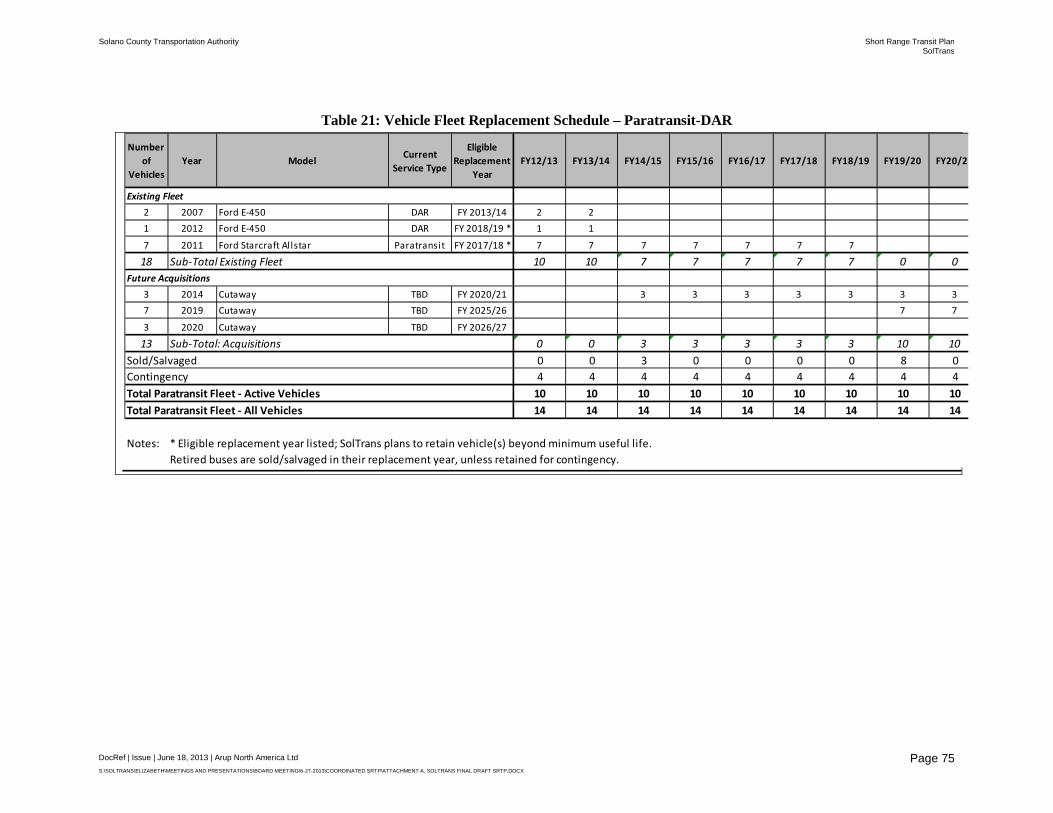
Solano County Transportation Authority Short Range Transit Plan SolTrans
DocRef | Issue | June 18, 2013 | Arup North America Ltd S:\SOLTRANS\ELIZABETH\MEETINGS AND PRESENTATIONS\BOARD MEETING\6-27-2013\COORDINATED SRTP\ATTACHMENT A. SOLTRANS FINAL DRAFT SRTP.DOCX
Page 75
Table 21: Vehicle Fleet Replacement Schedule – Paratransit-DAR
Number of
VehiclesYear Model Current
Service Type
Eligible Replacement
YearFY12/13 FY13/14 FY14/15 FY15/16 FY16/17 FY17/18 FY18/19 FY19/20 FY20/21
Existing Fleet2 2007 Ford E-450 DAR FY 2013/14 2 21 2012 Ford E-450 DAR FY 2018/19 * 1 1
7 2011 Ford Starcraft Allstar Paratransit FY 2017/18 * 7 7 7 7 7 7 7
18 Sub-Total Existing Fleet 10 10 7 7 7 7 7 0 0Future Acquisitions
3 2014 Cutaway TBD FY 2020/21 3 3 3 3 3 3 37 2019 Cutaway TBD FY 2025/26 7 7
3 2020 Cutaway TBD FY 2026/27
13 Sub-Total: Acquisitions 0 0 3 3 3 3 3 10 10Sold/Salvaged 0 0 3 0 0 0 0 8 0Contingency 4 4 4 4 4 4 4 4 4Total Paratransit Fleet - Active Vehicles 10 10 10 10 10 10 10 10 10Total Paratransit Fleet - All Vehicles 14 14 14 14 14 14 14 14 14
Notes: * Eligible replacement year listed; SolTrans plans to retain vehicle(s) beyond minimum useful life.Retired buses are sold/salvaged in their replacement year, unless retained for contingency.
Solano County Transportation Authority Short Range Transit Plan SolTrans
DocRef | Issue | June 18, 2013 | Arup North America Ltd S:\SOLTRANS\ELIZABETH\MEETINGS AND PRESENTATIONS\BOARD MEETING\6-27-2013\COORDINATED SRTP\ATTACHMENT A. SOLTRANS FINAL DRAFT SRTP.DOCX
Page 76
Capitalized Preventive Maintenance The preventive maintenance category includes labor and parts associated with capitalized maintenance work (i.e. replacement of engines, transmissions, hybrid battery packs, and other capital work that would typically exceed $5,000 in total) necessary for maintenance of federally funded assets. SolTrans has budgeted $200,000 for FY2013-14 to support the transition to the new contract operator and $125,000 per year thereafter. Unused funds in a given year will be carried-over to the next year. Therefore, actual required investment on an annual basis may be less than shown, if funding is carried-over year after year.
Facility Rehabilitation SolTrans plans to renovate and expand the existing central operations and maintenance facility on Broadway. The current project is budgeted at $1.5 million in FY2013, which would be funded with a combination of FTA 5307 grants and a local match from TDA. In addition, the City of Vallejo has roughly $500,000 in an existing FTA grant (including the local match) for the renovation, but this amount has yet to be formally transferred to SolTrans. Once the transfer is complete, additional desired elements will be added to the facility project, bringing the total cost to $2 million.
Facility Security and Maintenance Upgrade Staff proposes to upgrade security and maintenance of the heavily used Curtola Park & Ride lot in FY2014-15 at an estimated cost of $150,000. This project would be funded with TDA and federal 5307 revenues.
AVL Technology SolTrans proposes to purchase and install a new AVL-CAD system on its fixed route fleet to track on-time performance. The estimated cost is $2.16 million in FY2013-14. The project will be funded with FTA 5307 (current year and carryover) and local match from TDA and Proposition 1B CalEMA. This project is included in the “Vehicle Technology” line item on the capital plan spreadsheets.
Radio Replacement The mobile radio and dispatch communications network needs to be replaced to conform to recent regulatory changes to available narrow band frequencies that have compromised the existing radio system, forcing drivers and dispatchers to rely on Nextel and cell phones. The cost of this project is estimated to be $350,000 in FY2013-14, and will be funded with TDA.
Technology Enhancements SolTrans is making a variety of technology enhancements such as information technology equipment, communications, farebox upgrade, and security cameras. The following elements are contained in a single TIP project:
• Security Cameras – These are being replaced in FY2012-13 at a cost of over $400,000. This project will be paid with multiple years’ allocation of Proposition 1B CalEMA funding.
• Fareboxes - Fareboxes are being upgraded in FY2012-13. The estimated cost is $309,000 to add trim units to the Odyssey fareboxes on three older

Solano County Transportation Authority Short Range Transit Plan SolTrans
DocRef | Issue | June 18, 2013 | Arup North America Ltd S:\SOLTRANS\ELIZABETH\MEETINGS AND PRESENTATIONS\BOARD MEETING\6-27-2013\COORDINATED SRTP\ATTACHMENT A. SOLTRANS FINAL DRAFT SRTP.DOCX
Page 77
Gilligs used in fixed route local service, to support on-board pass sales. This project will be funded with FTA 5307 and local match from TDA.
• Clipper - Expenses have been budgeted at $20,000 in FY2015-16 to support possible additional purchases of Clipper equipment that may be necessary as part of completing deployment on all of SolTrans’ fleet. This would be funded with TDA.
• IT Systems – Expenses include $150,000 in FY2012-13 for startup equipment and $200,000 budgeted in FY2013-14 to invest in a comprehensive phone system for ADA compliance purposes and for improved customer service. Going forward, $20,000 is budgeted each year for unforeseen technology needs such as routine replacement of computers and office equipment. All items would be paid with TDA.
Branding Activities $250,000 is budgeted in FY2012-13 for SolanoExpress branding activities including bus decals and bus stop signage. These expenses are being funded with $130,000 in Regional Measure 2 funding made available through STA, with the balance funded from TDA.
Curtola Transit Center Expansion Although not yet a Board-approved project, SolTrans staff proposes to reconfigure and expand the existing Curtola Park & Ride lot to create a full-featured transit center. A new bus hub would be developed to coordinate local and intercity bus services with an expanded park and ride function. Passenger amenities would be enhanced such as shelters, rest rooms, and security. Planning for this project is still at a very preliminary stage. Initial estimates suggest that engineering and design activities would cost approximately $500,000 (in FY2012-13), with a construction budget of $9.5 million shown in the draft budget for FY2013-14 and additional budget of $20,000 in FY2014-15 for final finishes consistent with other bus stop amenities planned to be installed elsewhere in the SolTrans service area. This project would request funding from Regional Measure 2. If RM2 funding were not awarded, the project would be deferred or canceled.
Benicia Industrial Way Intermodal Center The Association of Bay Area Governments (ABAG) recently approved the City of Benicia’s application to create a Priority Development Area (PDA) in the current Industrial Park on the eastern edge of the City. Preliminary plans for the area call for a new Intermodal Center that will serve as a park & ride lot and transit hub, primarily, for commuters to Contra Costa County. When completed, SolTrans' Routes 78 and 80S, as well as FAST's Route 40, could serve the facility. It may also create an opportunity to streamline and improve the efficiency of Routes 78 and 80S by shifting the routes off of Military in Benicia, where they also couple as a local route, and keeping buses primarily on the freeway between Vallejo and Walnut Creek. At this time, no specific timeline, scope, or budget for the Intermodal Center has been identified, so this project is not shown in the Capital Plan, and possible bus services are not included in the Operating Plan.

Solano County Transportation Authority Short Range Transit Plan SolTrans
DocRef | Issue | June 18, 2013 | Arup North America Ltd S:\SOLTRANS\ELIZABETH\MEETINGS AND PRESENTATIONS\BOARD MEETING\6-27-2013\COORDINATED SRTP\ATTACHMENT A. SOLTRANS FINAL DRAFT SRTP.DOCX
Page 78
4.3.2 Ten-Year Capital Plan Table 22 presents the capital projects discussed above in a spreadsheet layout, with anticipated funding amounts for the full program shown in sub-categories for local, state, and federal sources.
Many of the capital projects listed above already have committed funding plans from previously approved state and federal grants or designated funding programmed by STA and-or MTC. In particular, the cost of intercity vehicle replacements is subject to a pending inter-agency funding agreement that details the exact sources and uses. As shown in the table, committed revenues come from multiple sources including Regional Measure 2, Proposition 1B, FTA 5307 Urbanized Area formula allocations, and FTA discretionary grants. SolTrans also plans to use over $9 million in TDA-LTF funding towards its share of the capital costs.
However, the capital plan also relies on $14 million in future unspecified local and federal sources to complete several projects. For example, the current capital plan assumes SolTrans will request and receive $10 million in future local/regional funds for the Curtola park-and-ride expansion. If the local funds are not received, the project would be deferred. Similarly, the plan assumes that SolTrans would apply for and receive $4 million in funding to pay for 80% of the cost to replace local and paratransit vehicles in FY2015-16 through FY2021-22. If federal funding is not received, SolTrans has sufficient TDA reserves to pay the full cost of the vehicles scheduled for replacement through FY2018-19. However, TDA reserves would be completely depleted that year, compromising SolTrans’ ability to pay for capital projects in later years. As a result, it is recommended that SolTrans continue to pursue external funding sources to maximize reserves of more flexible TDA funding.
4.4 Summary of Operating & Capital Plans Under the current baseline assumptions, the operating plan generates an annual surplus every year until the last year of the plan. The operating deficit in the final year is small enough that it can be covered with available TDA reserves. However, the trend in operating results is for increasing deficits after the forecast horizon. At the same time, the capital plan relies on unspecified future funding sources to avoid depleting available TDA reserves. Beyond the horizon year, additional operating subsidy from TDA would be required, which could constrain SolTrans’s ability to meet future capital needs.

Solano County Transportation Authority Short Range Transit Plan SolTrans
DocRef | Issue | June 18, 2013 | Arup North America Ltd S:\SOLTRANS\ELIZABETH\MEETINGS AND PRESENTATIONS\BOARD MEETING\6-27-2013\COORDINATED SRTP\ATTACHMENT A. SOLTRANS FINAL DRAFT SRTP.DOCX
Page 79
Table 22: SolTrans Capital Plan Budget
Notes for this table are included on the next page.
Solano County Transit (SolTrans) Baseline ScenarioCAPITAL PLAN BUDGET 2013 2014 2015 2016 2017 2018 2019 2020 2021 2022Prepared on 13-Jun-2013 Budget Forecast
FY 2012/13 FY2013/14 FY 2014/15 FY 2015/16 FY2016/17 FY 2017/18 FY 2018/19 FY 2019/20 FY 2020/21 FY 2021/22Capital Expenses By Project Type
Revenue Vehicles: Local Fleet Rehab/Overhaul [1] -$ -$ -$ -$ 1,575,000$ -$ -$ -$ -$ -$ Revenue Vehicles: Local Fleet Replacement [2] -$ 246,000$ -$ 2,671,061$ -$ -$ 700,000$ -$ 360,000$ -$ Revenue Vehicles: Intercity Fleet - Expense [3] 1,900,000$ -$ -$ 980,556$ -$ -$ 12,242,048$ -$ -$ -$ Revenue Vehicles: Intercity Fleet - Contribution [4,5] -$ -$ -$ -$ -$ -$ 3,176,988$ 462,933$ 708,287$ 1,204,088$ Non-Revenue Vehicles -$ 120,000$ 130,000$ -$ -$ -$ -$ 75,000$ -$ -$ Vehicle Technology (Farebox, APC, etc.) [6] 308,750$ 1,888,876$ 135,562$ 155,562$ -$ -$ -$ -$ -$ -$ Preventive Maintenance - Bus [7] -$ 200,000$ 125,000$ 125,000$ 125,000$ 125,000$ 125,000$ 125,000$ 125,000$ 125,000$ Facilities: Stops / Stations [8] 500,000$ 9,525,000$ 45,000$ 25,000$ 25,000$ 25,000$ 25,000$ 25,000$ 25,000$ 25,000$ Facilities: Maintenance / Yards [9] 1,500,000$ 100,000$ 500,000$ -$ -$ -$ -$ -$ -$ -$ Communications [10] -$ 350,000$ -$ -$ -$ -$ -$ -$ -$ -$ Security [11] 406,686$ 150,000$ -$ -$ -$ -$ -$ -$ -$ -$ IT / Software [12] 150,000$ 200,000$ -$ 20,000$ 20,000$ 20,000$ 20,000$ 20,000$ 20,000$ 20,000$ Other: branding (SolanoExpress decals/signage) 250,000$ -$ -$ -$ -$ -$ -$ -$ -$ -$
TOTAL CAPITAL EXPENSES 5,015,436$ 12,779,876$ 935,562$ 3,977,179$ 1,745,000$ 170,000$ 16,289,036$ 707,933$ 1,238,287$ 1,374,088$
Capital Revenues -- LocalRegional Measure 2 Capital [13] 130,000$ -$ -$ -$ -$ -$ -$ -$ -$ -$ Unspecified Local Funds (Source TBD) [14] 500,000$ 9,500,000$ -$ -$ -$ -$ -$ -$ -$ -$ Subtotal: LOCAL Revenue 630,000$ 9,500,000$ -$ -$ -$ -$ -$ -$ -$ -$
Capital Revenues -- StateTDA: LTF 1,142,626$ 79,672$ 800,000$ 224,212$ 485,000$ 170,000$ 3,486,988$ 707,933$ 950,287$ 1,374,088$ TDA: STAF [15,16] -$ -$ -$ 193,822$ -$ -$ -$ -$ -$ -$ Prop 1B (e.g., PTMISEA, CTAF) [16,17] 1,446,287$ 435,562$ 135,562$ 1,422,296$ -$ -$ -$ -$ -$ -$ ITFWG Fleet Replacement Contributions [18] -$ -$ -$ -$ -$ -$ 12,242,048$ -$ -$ -$ Subtotal: STATE Revenue 2,588,913$ 515,234$ 935,562$ 1,840,330$ 485,000$ 170,000$ 15,729,036$ 707,933$ 950,287$ 1,374,088$
Capital Revenues -- FederalFTA5307: Urbanized Area (PM) 1,071,686$ 2,103,314$ -$ -$ -$ -$ -$ -$ -$ -$ FTA5307: ARRA (carryover) -$ 120,000$ -$ -$ -$ -$ -$ -$ -$ -$ FTA5309: Bus Program [16,19] 860,399$ -$ -$ -$ -$ -$ -$ -$ -$ -$ FTA5339: Bus & Bus Facilties -$ 541,328$ -$ -$ -$ -$ -$ -$ -$ -$ Unspecified Federal Funds (Source TBD) [20] -$ -$ -$ 2,136,848$ 1,260,000$ -$ 560,000$ -$ 288,000$ -$ Subtotal: FEDERAL Revenue 1,932,085$ 2,764,642$ -$ 2,136,848$ 1,260,000$ -$ 560,000$ -$ 288,000$ -$
TOTAL EXPECTED REVENUES 5,150,998$ 12,779,876$ 935,562$ 3,977,179$ 1,745,000$ 170,000$ 16,289,036$ 707,933$ 1,238,287$ 1,374,088$
ANNUAL CAPITAL SURPLUS (DEFICIT) 135,562$ -$ -$ -$ -$ -$ -$ -$ -$ -$ CUMULATIVE CAPITAL SURPLUS (DEFICIT) 135,562$ 135,562$ 135,562$ 135,562$ 135,562$ 135,562$ 135,562$ 135,562$ 135,562$ 135,562$
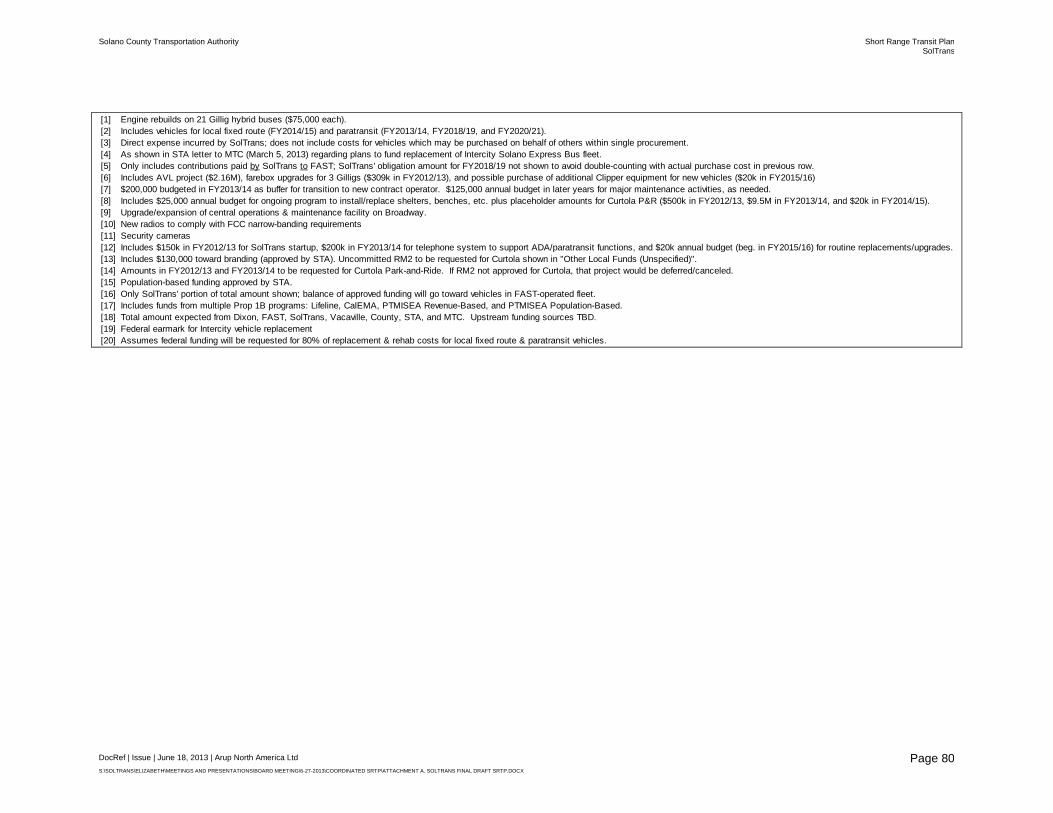
Solano County Transportation Authority Short Range Transit Plan SolTrans
DocRef | Issue | June 18, 2013 | Arup North America Ltd S:\SOLTRANS\ELIZABETH\MEETINGS AND PRESENTATIONS\BOARD MEETING\6-27-2013\COORDINATED SRTP\ATTACHMENT A. SOLTRANS FINAL DRAFT SRTP.DOCX
Page 80
[1] Engine rebuilds on 21 Gillig hybrid buses ($75,000 each).[2] Includes vehicles for local fixed route (FY2014/15) and paratransit (FY2013/14, FY2018/19, and FY2020/21).[3] Direct expense incurred by SolTrans; does not include costs for vehicles which may be purchased on behalf of others within single procurement.[4] As shown in STA letter to MTC (March 5, 2013) regarding plans to fund replacement of Intercity Solano Express Bus fleet.[5] Only includes contributions paid by SolTrans to FAST; SolTrans' obligation amount for FY2018/19 not shown to avoid double-counting with actual purchase cost in previous row.[6] Includes AVL project ($2.16M), farebox upgrades for 3 Gilligs ($309k in FY2012/13), and possible purchase of additional Clipper equipment for new vehicles ($20k in FY2015/16)[7] $200,000 budgeted in FY2013/14 as buffer for transition to new contract operator. $125,000 annual budget in later years for major maintenance activities, as needed.[8] Includes $25,000 annual budget for ongoing program to install/replace shelters, benches, etc. plus placeholder amounts for Curtola P&R ($500k in FY2012/13, $9.5M in FY2013/14, and $20k in FY2014/15).[9] Upgrade/expansion of central operations & maintenance facility on Broadway.[10] New radios to comply with FCC narrow-banding requirements[11] Security cameras[12] Includes $150k in FY2012/13 for SolTrans startup, $200k in FY2013/14 for telephone system to support ADA/paratransit functions, and $20k annual budget (beg. in FY2015/16) for routine replacements/upgrades.[13] Includes $130,000 toward branding (approved by STA). Uncommitted RM2 to be requested for Curtola shown in "Other Local Funds (Unspecified)".[14] Amounts in FY2012/13 and FY2013/14 to be requested for Curtola Park-and-Ride. If RM2 not approved for Curtola, that project would be deferred/canceled.[15] Population-based funding approved by STA. [16] Only SolTrans' portion of total amount shown; balance of approved funding will go toward vehicles in FAST-operated fleet.[17] Includes funds from multiple Prop 1B programs: Lifeline, CalEMA, PTMISEA Revenue-Based, and PTMISEA Population-Based.[18] Total amount expected from Dixon, FAST, SolTrans, Vacaville, County, STA, and MTC. Upstream funding sources TBD.[19] Federal earmark for Intercity vehicle replacement[20] Assumes federal funding will be requested for 80% of replacement & rehab costs for local fixed route & paratransit vehicles.
Appendix A
Operating Budgets and Financial Projections
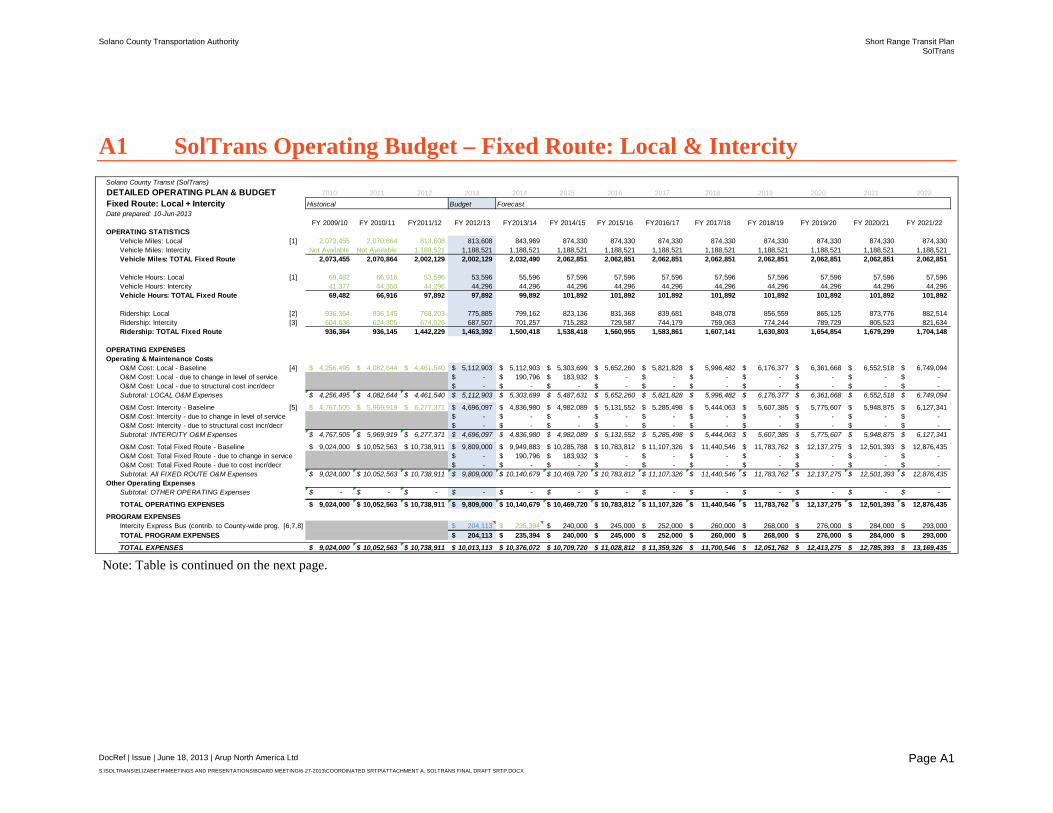
Solano County Transportation Authority Short Range Transit Plan SolTrans
DocRef | Issue | June 18, 2013 | Arup North America Ltd S:\SOLTRANS\ELIZABETH\MEETINGS AND PRESENTATIONS\BOARD MEETING\6-27-2013\COORDINATED SRTP\ATTACHMENT A. SOLTRANS FINAL DRAFT SRTP.DOCX
Page A1
A1 SolTrans Operating Budget – Fixed Route: Local & Intercity
Note: Table is continued on the next page.
Solano County Transit (SolTrans)DETAILED OPERATING PLAN & BUDGET 2010 2011 2012 2013 2014 2015 2016 2017 2018 2019 2020 2021 2022Fixed Route: Local + Intercity Historical Budget ForecastDate prepared: 10-Jun-2013
FY 2009/10 FY 2010/11 FY2011/12 FY 2012/13 FY2013/14 FY 2014/15 FY 2015/16 FY2016/17 FY 2017/18 FY 2018/19 FY 2019/20 FY 2020/21 FY 2021/22OPERATING STATISTICS
Vehicle Miles: Local [1] 2,073,455 2,070,864 813,608 813,608 843,969 874,330 874,330 874,330 874,330 874,330 874,330 874,330 874,330 Vehicle Miles: Intercity Not Available Not Available 1,188,521 1,188,521 1,188,521 1,188,521 1,188,521 1,188,521 1,188,521 1,188,521 1,188,521 1,188,521 1,188,521 Vehicle Miles: TOTAL Fixed Route 2,073,455 2,070,864 2,002,129 2,002,129 2,032,490 2,062,851 2,062,851 2,062,851 2,062,851 2,062,851 2,062,851 2,062,851 2,062,851
Vehicle Hours: Local [1] 69,482 66,916 53,596 53,596 55,596 57,596 57,596 57,596 57,596 57,596 57,596 57,596 57,596 Vehicle Hours: Intercity 41,377 44,350 44,296 44,296 44,296 44,296 44,296 44,296 44,296 44,296 44,296 44,296 44,296 Vehicle Hours: TOTAL Fixed Route 69,482 66,916 97,892 97,892 99,892 101,892 101,892 101,892 101,892 101,892 101,892 101,892 101,892
Ridership: Local [2] 936,364 936,145 768,203 775,885 799,162 823,136 831,368 839,681 848,078 856,559 865,125 873,776 882,514 Ridership: Intercity [3] 604,636 624,305 674,026 687,507 701,257 715,282 729,587 744,179 759,063 774,244 789,729 805,523 821,634 Ridership: TOTAL Fixed Route 936,364 936,145 1,442,229 1,463,392 1,500,418 1,538,418 1,560,955 1,583,861 1,607,141 1,630,803 1,654,854 1,679,299 1,704,148
OPERATING EXPENSESOperating & Maintenance Costs
O&M Cost: Local - Baseline [4] 4,256,495$ 4,082,644$ 4,461,540$ 5,112,903$ 5,112,903$ 5,303,699$ 5,652,260$ 5,821,828$ 5,996,482$ 6,176,377$ 6,361,668$ 6,552,518$ 6,749,094$ O&M Cost: Local - due to change in level of service -$ 190,796$ 183,932$ -$ -$ -$ -$ -$ -$ -$ O&M Cost: Local - due to structural cost incr/decr -$ -$ -$ -$ -$ -$ -$ -$ -$ -$ Subtotal: LOCAL O&M Expenses 4,256,495$ 4,082,644$ 4,461,540$ 5,112,903$ 5,303,699$ 5,487,631$ 5,652,260$ 5,821,828$ 5,996,482$ 6,176,377$ 6,361,668$ 6,552,518$ 6,749,094$
O&M Cost: Intercity - Baseline [5] 4,767,505$ 5,969,919$ 6,277,371$ 4,696,097$ 4,836,980$ 4,982,089$ 5,131,552$ 5,285,498$ 5,444,063$ 5,607,385$ 5,775,607$ 5,948,875$ 6,127,341$ O&M Cost: Intercity - due to change in level of service -$ -$ -$ -$ -$ -$ -$ -$ -$ -$ O&M Cost: Intercity - due to structural cost incr/decr -$ -$ -$ -$ -$ -$ -$ -$ -$ -$ Subtotal: INTERCITY O&M Expenses 4,767,505$ 5,969,919$ 6,277,371$ 4,696,097$ 4,836,980$ 4,982,089$ 5,131,552$ 5,285,498$ 5,444,063$ 5,607,385$ 5,775,607$ 5,948,875$ 6,127,341$
O&M Cost: Total Fixed Route - Baseline 9,024,000$ 10,052,563$ 10,738,911$ 9,809,000$ 9,949,883$ 10,285,788$ 10,783,812$ 11,107,326$ 11,440,546$ 11,783,762$ 12,137,275$ 12,501,393$ 12,876,435$ O&M Cost: Total Fixed Route - due to change in service -$ 190,796$ 183,932$ -$ -$ -$ -$ -$ -$ -$ O&M Cost: Total Fixed Route - due to cost incr/decr -$ -$ -$ -$ -$ -$ -$ -$ -$ -$ Subtotal: All FIXED ROUTE O&M Expenses 9,024,000$ 10,052,563$ 10,738,911$ 9,809,000$ 10,140,679$ 10,469,720$ 10,783,812$ 11,107,326$ 11,440,546$ 11,783,762$ 12,137,275$ 12,501,393$ 12,876,435$
Other Operating ExpensesSubtotal: OTHER OPERATING Expenses -$ -$ -$ -$ -$ -$ -$ -$ -$ -$ -$ -$ -$
TOTAL OPERATING EXPENSES 9,024,000$ 10,052,563$ 10,738,911$ 9,809,000$ 10,140,679$ 10,469,720$ 10,783,812$ 11,107,326$ 11,440,546$ 11,783,762$ 12,137,275$ 12,501,393$ 12,876,435$
PROGRAM EXPENSESIntercity Express Bus (contrib. to County-wide prog.) [6,7,8] 204,113$ 235,394$ 240,000$ 245,000$ 252,000$ 260,000$ 268,000$ 276,000$ 284,000$ 293,000$ TOTAL PROGRAM EXPENSES 204,113$ 235,394$ 240,000$ 245,000$ 252,000$ 260,000$ 268,000$ 276,000$ 284,000$ 293,000$
TOTAL EXPENSES 9,024,000$ 10,052,563$ 10,738,911$ 10,013,113$ 10,376,072$ 10,709,720$ 11,028,812$ 11,359,326$ 11,700,546$ 12,051,762$ 12,413,275$ 12,785,393$ 13,169,435$
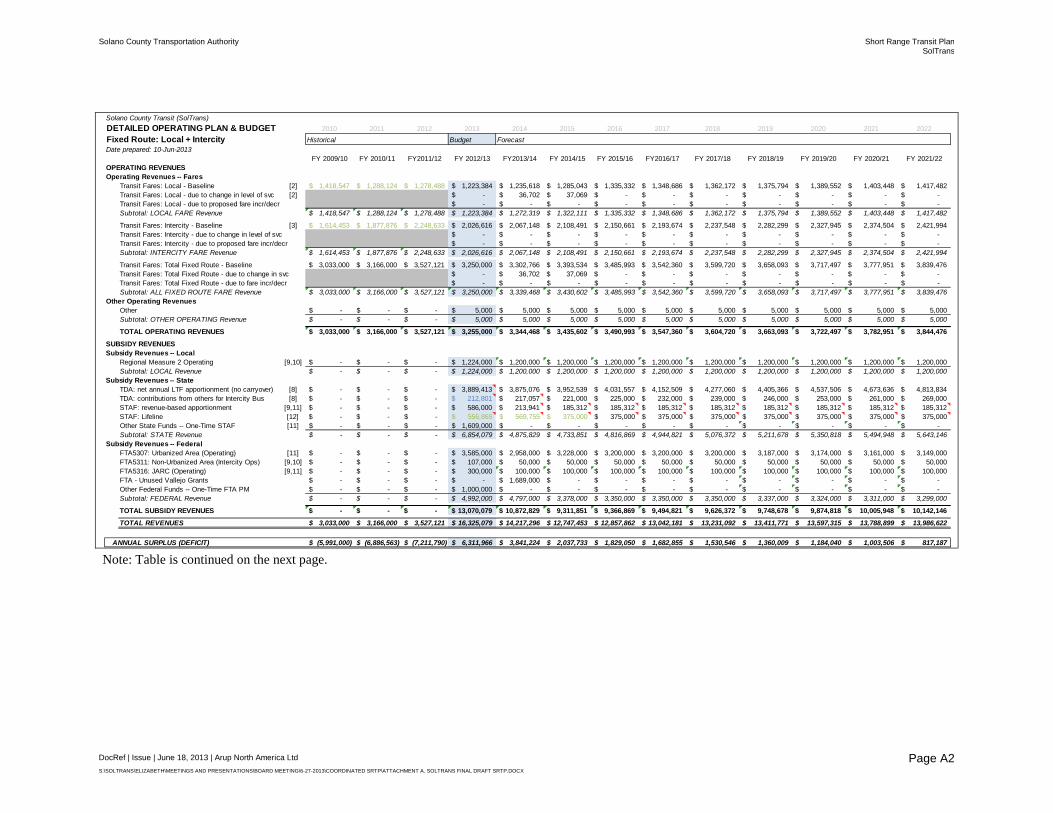
Solano County Transportation Authority Short Range Transit Plan SolTrans
DocRef | Issue | June 18, 2013 | Arup North America Ltd S:\SOLTRANS\ELIZABETH\MEETINGS AND PRESENTATIONS\BOARD MEETING\6-27-2013\COORDINATED SRTP\ATTACHMENT A. SOLTRANS FINAL DRAFT SRTP.DOCX
Page A2
Note: Table is continued on the next page.
Solano County Transit (SolTrans)DETAILED OPERATING PLAN & BUDGET 2010 2011 2012 2013 2014 2015 2016 2017 2018 2019 2020 2021 2022Fixed Route: Local + Intercity Historical Budget ForecastDate prepared: 10-Jun-2013
FY 2009/10 FY 2010/11 FY2011/12 FY 2012/13 FY2013/14 FY 2014/15 FY 2015/16 FY2016/17 FY 2017/18 FY 2018/19 FY 2019/20 FY 2020/21 FY 2021/22OPERATING REVENUESOperating Revenues -- Fares
Transit Fares: Local - Baseline [2] 1,418,547$ 1,288,124$ 1,278,488$ 1,223,384$ 1,235,618$ 1,285,043$ 1,335,332$ 1,348,686$ 1,362,172$ 1,375,794$ 1,389,552$ 1,403,448$ 1,417,482$ Transit Fares: Local - due to change in level of svc [2] -$ 36,702$ 37,069$ -$ -$ -$ -$ -$ -$ -$ Transit Fares: Local - due to proposed fare incr/decr -$ -$ -$ -$ -$ -$ -$ -$ -$ -$ Subtotal: LOCAL FARE Revenue 1,418,547$ 1,288,124$ 1,278,488$ 1,223,384$ 1,272,319$ 1,322,111$ 1,335,332$ 1,348,686$ 1,362,172$ 1,375,794$ 1,389,552$ 1,403,448$ 1,417,482$
Transit Fares: Intercity - Baseline [3] 1,614,453$ 1,877,876$ 2,248,633$ 2,026,616$ 2,067,148$ 2,108,491$ 2,150,661$ 2,193,674$ 2,237,548$ 2,282,299$ 2,327,945$ 2,374,504$ 2,421,994$ Transit Fares: Intercity - due to change in level of svc -$ -$ -$ -$ -$ -$ -$ -$ -$ -$ Transit Fares: Intercity - due to proposed fare incr/decr -$ -$ -$ -$ -$ -$ -$ -$ -$ -$ Subtotal: INTERCITY FARE Revenue 1,614,453$ 1,877,876$ 2,248,633$ 2,026,616$ 2,067,148$ 2,108,491$ 2,150,661$ 2,193,674$ 2,237,548$ 2,282,299$ 2,327,945$ 2,374,504$ 2,421,994$
Transit Fares: Total Fixed Route - Baseline 3,033,000$ 3,166,000$ 3,527,121$ 3,250,000$ 3,302,766$ 3,393,534$ 3,485,993$ 3,542,360$ 3,599,720$ 3,658,093$ 3,717,497$ 3,777,951$ 3,839,476$ Transit Fares: Total Fixed Route - due to change in svc -$ 36,702$ 37,069$ -$ -$ -$ -$ -$ -$ -$ Transit Fares: Total Fixed Route - due to fare incr/decr -$ -$ -$ -$ -$ -$ -$ -$ -$ -$ Subtotal: ALL FIXED ROUTE FARE Revenue 3,033,000$ 3,166,000$ 3,527,121$ 3,250,000$ 3,339,468$ 3,430,602$ 3,485,993$ 3,542,360$ 3,599,720$ 3,658,093$ 3,717,497$ 3,777,951$ 3,839,476$
Other Operating RevenuesOther -$ -$ -$ 5,000$ 5,000$ 5,000$ 5,000$ 5,000$ 5,000$ 5,000$ 5,000$ 5,000$ 5,000$ Subtotal: OTHER OPERATING Revenue -$ -$ -$ 5,000$ 5,000$ 5,000$ 5,000$ 5,000$ 5,000$ 5,000$ 5,000$ 5,000$ 5,000$
TOTAL OPERATING REVENUES 3,033,000$ 3,166,000$ 3,527,121$ 3,255,000$ 3,344,468$ 3,435,602$ 3,490,993$ 3,547,360$ 3,604,720$ 3,663,093$ 3,722,497$ 3,782,951$ 3,844,476$
SUBSIDY REVENUESSubsidy Revenues -- Local
Regional Measure 2 Operating [9,10] -$ -$ -$ 1,224,000$ 1,200,000$ 1,200,000$ 1,200,000$ 1,200,000$ 1,200,000$ 1,200,000$ 1,200,000$ 1,200,000$ 1,200,000$ Subtotal: LOCAL Revenue -$ -$ -$ 1,224,000$ 1,200,000$ 1,200,000$ 1,200,000$ 1,200,000$ 1,200,000$ 1,200,000$ 1,200,000$ 1,200,000$ 1,200,000$
Subsidy Revenues -- StateTDA: net annual LTF apportionment (no carryover) [8] -$ -$ -$ 3,889,413$ 3,875,076$ 3,952,539$ 4,031,557$ 4,152,509$ 4,277,060$ 4,405,366$ 4,537,506$ 4,673,636$ 4,813,834$ TDA: contributions from others for Intercity Bus [8] -$ -$ -$ 212,801$ 217,057$ 221,000$ 225,000$ 232,000$ 239,000$ 246,000$ 253,000$ 261,000$ 269,000$ STAF: revenue-based apportionment [9,11] -$ -$ -$ 586,000$ 213,941$ 185,312$ 185,312$ 185,312$ 185,312$ 185,312$ 185,312$ 185,312$ 185,312$ STAF: Lifeline [12] -$ -$ -$ 556,865$ 569,755$ 375,000$ 375,000$ 375,000$ 375,000$ 375,000$ 375,000$ 375,000$ 375,000$ Other State Funds -- One-Time STAF [11] -$ -$ -$ 1,609,000$ -$ -$ -$ -$ -$ -$ -$ -$ -$ Subtotal: STATE Revenue -$ -$ -$ 6,854,079$ 4,875,829$ 4,733,851$ 4,816,869$ 4,944,821$ 5,076,372$ 5,211,678$ 5,350,818$ 5,494,948$ 5,643,146$
Subsidy Revenues -- FederalFTA5307: Urbanized Area (Operating) [11] -$ -$ -$ 3,585,000$ 2,958,000$ 3,228,000$ 3,200,000$ 3,200,000$ 3,200,000$ 3,187,000$ 3,174,000$ 3,161,000$ 3,149,000$ FTA5311: Non-Urbanized Area (Intercity Ops) [9,10] -$ -$ -$ 107,000$ 50,000$ 50,000$ 50,000$ 50,000$ 50,000$ 50,000$ 50,000$ 50,000$ 50,000$ FTA5316: JARC (Operating) [9,11] -$ -$ -$ 300,000$ 100,000$ 100,000$ 100,000$ 100,000$ 100,000$ 100,000$ 100,000$ 100,000$ 100,000$ FTA - Unused Vallejo Grants -$ -$ -$ -$ 1,689,000$ -$ -$ -$ -$ -$ -$ -$ -$ Other Federal Funds -- One-Time FTA PM -$ -$ -$ 1,000,000$ -$ -$ -$ -$ -$ -$ -$ -$ -$ Subtotal: FEDERAL Revenue -$ -$ -$ 4,992,000$ 4,797,000$ 3,378,000$ 3,350,000$ 3,350,000$ 3,350,000$ 3,337,000$ 3,324,000$ 3,311,000$ 3,299,000$
TOTAL SUBSIDY REVENUES -$ -$ -$ 13,070,079$ 10,872,829$ 9,311,851$ 9,366,869$ 9,494,821$ 9,626,372$ 9,748,678$ 9,874,818$ 10,005,948$ 10,142,146$
TOTAL REVENUES 3,033,000$ 3,166,000$ 3,527,121$ 16,325,079$ 14,217,296$ 12,747,453$ 12,857,862$ 13,042,181$ 13,231,092$ 13,411,771$ 13,597,315$ 13,788,899$ 13,986,622$
ANNUAL SURPLUS (DEFICIT) (5,991,000)$ (6,886,563)$ (7,211,790)$ 6,311,966$ 3,841,224$ 2,037,733$ 1,829,050$ 1,682,855$ 1,530,546$ 1,360,009$ 1,184,040$ 1,003,506$ 817,187$

Solano County Transportation Authority Short Range Transit Plan SolTrans
DocRef | Issue | June 18, 2013 | Arup North America Ltd S:\SOLTRANS\ELIZABETH\MEETINGS AND PRESENTATIONS\BOARD MEETING\6-27-2013\COORDINATED SRTP\ATTACHMENT A. SOLTRANS FINAL DRAFT SRTP.DOCX
Page A3
Solano County Transit (SolTrans)DETAILED OPERATING PLAN & BUDGET 2010 2011 2012 2013 2014 2015 2016 2017 2018 2019 2020 2021 2022Fixed Route: Local + Intercity Historical Budget ForecastDate prepared: 10-Jun-2013
FY 2009/10 FY 2010/11 FY2011/12 FY 2012/13 FY2013/14 FY 2014/15 FY 2015/16 FY2016/17 FY 2017/18 FY 2018/19 FY 2019/20 FY 2020/21 FY 2021/22METRICS
Operating Expense Per Vehicle MILE: Local 2.05$ 1.97$ 5.48$ 6.28$ 6.28$ 6.28$ 6.46$ 6.66$ 6.86$ 7.06$ 7.28$ 7.49$ 7.72$ Operating Expense Per Vehicle MILE: Intercity n/a n/a 5.28$ 3.95$ 4.07$ 4.19$ 4.32$ 4.45$ 4.58$ 4.72$ 4.86$ 5.01$ 5.16$ Operating Expense Per Vehicle MILE: All Fixed Route 4.35$ 4.85$ 5.36$ 4.90$ 4.99$ 5.08$ 5.23$ 5.38$ 5.55$ 5.71$ 5.88$ 6.06$ 6.24$ Operating Expense Per Vehicle HOUR: Local 61.26$ 61.01$ 83.24$ 95.40$ 95.40$ 95.28$ 98.14$ 101.08$ 104.11$ 107.24$ 110.45$ 113.77$ 117.18$ Operating Expense Per Vehicle HOUR: Intercity 115.22$ 134.61$ 141.71$ 106.02$ 109.20$ 112.47$ 115.85$ 119.32$ 122.90$ 126.59$ 130.39$ 134.30$ 138.33$ Operating Expense Per Vehicle HOUR: All Fixed Route 129.88$ 150.23$ 109.70$ 100.20$ 101.52$ 102.75$ 105.84$ 109.01$ 112.28$ 115.65$ 119.12$ 122.69$ 126.37$ Operating Expense Per Passenger: Local 4.55$ 4.36$ 5.81$ 6.59$ 6.64$ 6.67$ 6.80$ 6.93$ 7.07$ 7.21$ 7.35$ 7.50$ 7.65$ Operating Expense Per Passenger: Intercity 7.88$ 9.56$ 9.31$ 6.83$ 6.90$ 6.97$ 7.03$ 7.10$ 7.17$ 7.24$ 7.31$ 7.39$ 7.46$ Operating Expense Per Passenger: All Fixed Route 9.64$ 10.74$ 7.45$ 6.70$ 6.76$ 6.81$ 6.91$ 7.01$ 7.12$ 7.23$ 7.33$ 7.44$ 7.56$ Passengers Per Vehicle HOUR: Local 13.5 14.0 14.3 14.5 14.4 14.3 14.4 14.6 14.7 14.9 15.0 15.2 15.3 Passengers Per Vehicle HOUR: Intercity 14.6 14.1 15.2 15.5 15.8 16.1 16.5 16.8 17.1 17.5 17.8 18.2 18.5 Passengers Per Vehicle HOUR: All Fixed Route 13.5 14.0 14.7 14.9 15.0 15.1 15.3 15.5 15.8 16.0 16.2 16.5 16.7 Average Fare Per Passenger: Local 1.51$ 1.38$ 1.66$ 1.58$ 1.59$ 1.61$ 1.61$ 1.61$ 1.61$ 1.61$ 1.61$ 1.61$ 1.61$ Average Fare Per Passenger: Intercity 2.67$ 3.01$ 3.34$ 2.95$ 2.95$ 2.95$ 2.95$ 2.95$ 2.95$ 2.95$ 2.95$ 2.95$ 2.95$ Average Fare Per Passenger: All Fixed Route 3.24$ 3.38$ 2.45$ 2.22$ 2.23$ 2.23$ 2.23$ 2.24$ 2.24$ 2.24$ 2.25$ 2.25$ 2.25$ Farebox Recovery (Fares as % of Oper. Exp.): Local 33.33% 31.55% 28.66% 23.93% 23.99% 24.09% 23.62% 23.17% 22.72% 22.28% 21.84% 21.42% 21.00%Farebox Recovery (Fares as % of Oper. Exp.): Intercity 33.86% 31.46% 35.82% 43.16% 42.74% 42.32% 41.91% 41.50% 41.10% 40.70% 40.31% 39.92% 39.53%Farebox Recovery (Fares as % of Oper. Exp.): All FR 33.61% 31.49% 32.84% 33.13% 32.93% 32.77% 32.33% 31.89% 31.46% 31.04% 30.63% 30.22% 29.82%Local Recovery (Fares+Local Sub. as % of Oper. Exp.) 33.61% 31.49% 32.84% 45.66% 44.81% 44.28% 43.50% 42.74% 42.00% 41.27% 40.56% 39.86% 39.18%
[1] Assumes Local service adds 2,000 additional vehicle hours each year in FY2013/14 and FY2014/15 with proportional increase in vehicle miles. Service plan unchanged thereafter.[2] Assumes Local ridership and fare growth of 3%/year due to each service expansion in FY2013/14 and FY2014/15. Thereafter, growth is at 1%, which is consistent with Solano County population forecast. (No change to fare structure.)[3] Assumes Intercity ridership and transit fares grow at 2% per year. (No change to fare structure.)[4] After near-term service increase, Local O&M costs assumed to increase at 3% per year. This includes average annual increase in vendor costs of 3.7% per year through FY2019/2020, combined with cost control measures on all other operations costs.[5] Intercity O&M costs assumed to increase at 3% per year. This includes average annual increase in vendor costs of 3.7% per year through FY2019/2020, combined with cost control measures on all other operations costs.[6] FY2012/13 amounts from Solano County TDA Matrix (June, 2012); sum of Vallejo & Benicia amounts.[7] FY2013/14 amount from Intercity Funding Agreement calculations for FY2012/13 service (May-2012) +2% escalation.[8] Assumes amounts increase consistent with growth in TDA apportionment, i.e., 2% annual growth through FY2015/16 and 3% annual growth thereafter.[9] No long-term growth assumption applied to this funding source.[10] This funding source designated for Intercity operations only.[11] This funding source designated for Local operations only.[12] Per Solano County 2012 Lifeline award: Route 1, Route 85, and Sustaining Span of Service. Assume subsidies for Routes 1 & 85 continue indefinitely.
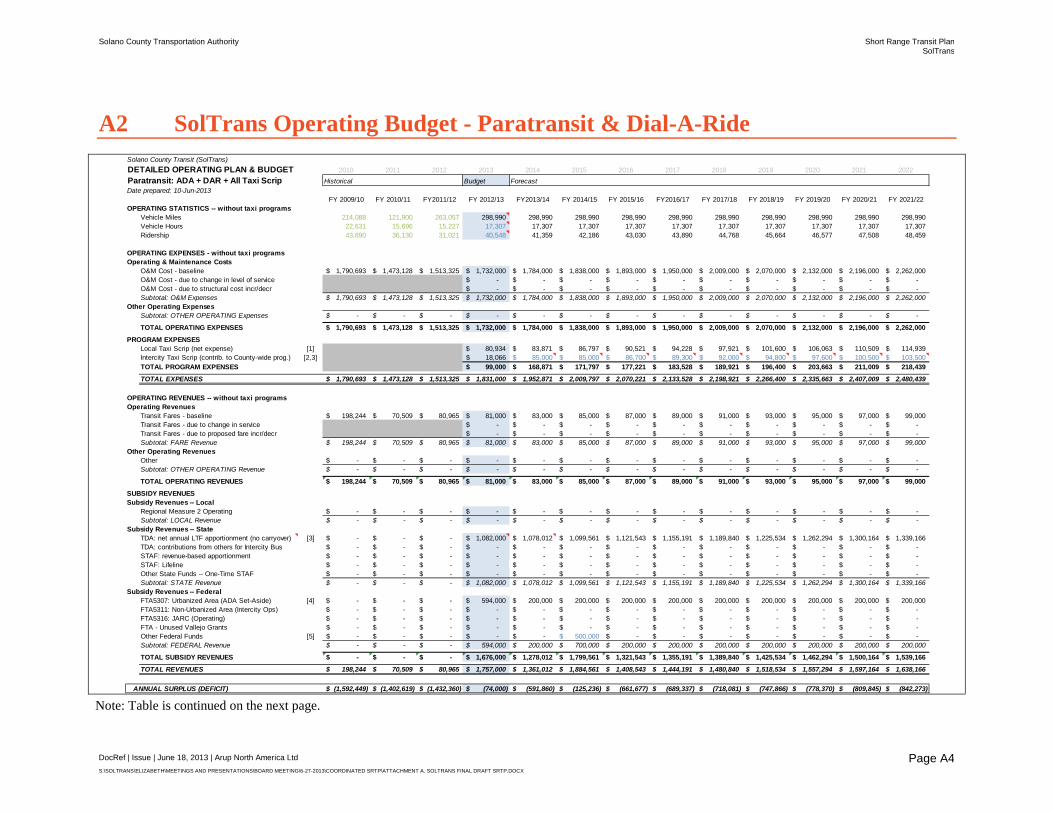
Solano County Transportation Authority Short Range Transit Plan SolTrans
DocRef | Issue | June 18, 2013 | Arup North America Ltd S:\SOLTRANS\ELIZABETH\MEETINGS AND PRESENTATIONS\BOARD MEETING\6-27-2013\COORDINATED SRTP\ATTACHMENT A. SOLTRANS FINAL DRAFT SRTP.DOCX
Page A4
A2 SolTrans Operating Budget - Paratransit & Dial-A-Ride
Note: Table is continued on the next page.
Solano County Transit (SolTrans)DETAILED OPERATING PLAN & BUDGET 2010 2011 2012 2013 2014 2015 2016 2017 2018 2019 2020 2021 2022Paratransit: ADA + DAR + All Taxi Scrip Historical Budget ForecastDate prepared: 10-Jun-2013
FY 2009/10 FY 2010/11 FY2011/12 FY 2012/13 FY2013/14 FY 2014/15 FY 2015/16 FY2016/17 FY 2017/18 FY 2018/19 FY 2019/20 FY 2020/21 FY 2021/22OPERATING STATISTICS -- without taxi programs
Vehicle Miles 214,088 121,900 263,057 298,990 298,990 298,990 298,990 298,990 298,990 298,990 298,990 298,990 298,990 Vehicle Hours 22,631 15,696 15,227 17,307 17,307 17,307 17,307 17,307 17,307 17,307 17,307 17,307 17,307 Ridership 43,890 36,130 31,021 40,548 41,359 42,186 43,030 43,890 44,768 45,664 46,577 47,508 48,459
OPERATING EXPENSES - without taxi programsOperating & Maintenance Costs
O&M Cost - baseline 1,790,693$ 1,473,128$ 1,513,325$ 1,732,000$ 1,784,000$ 1,838,000$ 1,893,000$ 1,950,000$ 2,009,000$ 2,070,000$ 2,132,000$ 2,196,000$ 2,262,000$ O&M Cost - due to change in level of service -$ -$ -$ -$ -$ -$ -$ -$ -$ -$ O&M Cost - due to structural cost incr/decr -$ -$ -$ -$ -$ -$ -$ -$ -$ -$ Subtotal: O&M Expenses 1,790,693$ 1,473,128$ 1,513,325$ 1,732,000$ 1,784,000$ 1,838,000$ 1,893,000$ 1,950,000$ 2,009,000$ 2,070,000$ 2,132,000$ 2,196,000$ 2,262,000$
Other Operating ExpensesSubtotal: OTHER OPERATING Expenses -$ -$ -$ -$ -$ -$ -$ -$ -$ -$ -$ -$ -$
TOTAL OPERATING EXPENSES 1,790,693$ 1,473,128$ 1,513,325$ 1,732,000$ 1,784,000$ 1,838,000$ 1,893,000$ 1,950,000$ 2,009,000$ 2,070,000$ 2,132,000$ 2,196,000$ 2,262,000$
PROGRAM EXPENSESLocal Taxi Scrip (net expense) [1] 80,934$ 83,871$ 86,797$ 90,521$ 94,228$ 97,921$ 101,600$ 106,063$ 110,509$ 114,939$ Intercity Taxi Scrip (contrib. to County-wide prog.) [2,3] 18,066$ 85,000$ 85,000$ 86,700$ 89,300$ 92,000$ 94,800$ 97,600$ 100,500$ 103,500$ TOTAL PROGRAM EXPENSES 99,000$ 168,871$ 171,797$ 177,221$ 183,528$ 189,921$ 196,400$ 203,663$ 211,009$ 218,439$
TOTAL EXPENSES 1,790,693$ 1,473,128$ 1,513,325$ 1,831,000$ 1,952,871$ 2,009,797$ 2,070,221$ 2,133,528$ 2,198,921$ 2,266,400$ 2,335,663$ 2,407,009$ 2,480,439$
OPERATING REVENUES -- without taxi programsOperating Revenues
Transit Fares - baseline 198,244$ 70,509$ 80,965$ 81,000$ 83,000$ 85,000$ 87,000$ 89,000$ 91,000$ 93,000$ 95,000$ 97,000$ 99,000$ Transit Fares - due to change in service -$ -$ -$ -$ -$ -$ -$ -$ -$ -$ Transit Fares - due to proposed fare incr/decr -$ -$ -$ -$ -$ -$ -$ -$ -$ -$ Subtotal: FARE Revenue 198,244$ 70,509$ 80,965$ 81,000$ 83,000$ 85,000$ 87,000$ 89,000$ 91,000$ 93,000$ 95,000$ 97,000$ 99,000$
Other Operating RevenuesOther -$ -$ -$ -$ -$ -$ -$ -$ -$ -$ -$ -$ -$ Subtotal: OTHER OPERATING Revenue -$ -$ -$ -$ -$ -$ -$ -$ -$ -$ -$ -$ -$
TOTAL OPERATING REVENUES 198,244$ 70,509$ 80,965$ 81,000$ 83,000$ 85,000$ 87,000$ 89,000$ 91,000$ 93,000$ 95,000$ 97,000$ 99,000$
SUBSIDY REVENUESSubsidy Revenues -- Local
Regional Measure 2 Operating -$ -$ -$ -$ -$ -$ -$ -$ -$ -$ -$ -$ -$ Subtotal: LOCAL Revenue -$ -$ -$ -$ -$ -$ -$ -$ -$ -$ -$ -$ -$
Subsidy Revenues -- StateTDA: net annual LTF apportionment (no carryover) [3] -$ -$ -$ 1,082,000$ 1,078,012$ 1,099,561$ 1,121,543$ 1,155,191$ 1,189,840$ 1,225,534$ 1,262,294$ 1,300,164$ 1,339,166$ TDA: contributions from others for Intercity Bus -$ -$ -$ -$ -$ -$ -$ -$ -$ -$ -$ -$ -$ STAF: revenue-based apportionment -$ -$ -$ -$ -$ -$ -$ -$ -$ -$ -$ -$ -$ STAF: Lifeline -$ -$ -$ -$ -$ -$ -$ -$ -$ -$ -$ -$ -$ Other State Funds -- One-Time STAF -$ -$ -$ -$ -$ -$ -$ -$ -$ -$ -$ -$ -$ Subtotal: STATE Revenue -$ -$ -$ 1,082,000$ 1,078,012$ 1,099,561$ 1,121,543$ 1,155,191$ 1,189,840$ 1,225,534$ 1,262,294$ 1,300,164$ 1,339,166$
Subsidy Revenues -- FederalFTA5307: Urbanized Area (ADA Set-Aside) [4] -$ -$ -$ 594,000$ 200,000$ 200,000$ 200,000$ 200,000$ 200,000$ 200,000$ 200,000$ 200,000$ 200,000$ FTA5311: Non-Urbanized Area (Intercity Ops) -$ -$ -$ -$ -$ -$ -$ -$ -$ -$ -$ -$ -$ FTA5316: JARC (Operating) -$ -$ -$ -$ -$ -$ -$ -$ -$ -$ -$ -$ -$ FTA - Unused Vallejo Grants -$ -$ -$ -$ -$ -$ -$ -$ -$ -$ -$ -$ -$ Other Federal Funds [5] -$ -$ -$ -$ -$ 500,000$ -$ -$ -$ -$ -$ -$ -$ Subtotal: FEDERAL Revenue -$ -$ -$ 594,000$ 200,000$ 700,000$ 200,000$ 200,000$ 200,000$ 200,000$ 200,000$ 200,000$ 200,000$
TOTAL SUBSIDY REVENUES -$ -$ -$ 1,676,000$ 1,278,012$ 1,799,561$ 1,321,543$ 1,355,191$ 1,389,840$ 1,425,534$ 1,462,294$ 1,500,164$ 1,539,166$
TOTAL REVENUES 198,244$ 70,509$ 80,965$ 1,757,000$ 1,361,012$ 1,884,561$ 1,408,543$ 1,444,191$ 1,480,840$ 1,518,534$ 1,557,294$ 1,597,164$ 1,638,166$
ANNUAL SURPLUS (DEFICIT) (1,592,449)$ (1,402,619)$ (1,432,360)$ (74,000)$ (591,860)$ (125,236)$ (661,677)$ (689,337)$ (718,081)$ (747,866)$ (778,370)$ (809,845)$ (842,273)$

Solano County Transportation Authority Short Range Transit Plan SolTrans
DocRef | Issue | June 18, 2013 | Arup North America Ltd S:\SOLTRANS\ELIZABETH\MEETINGS AND PRESENTATIONS\BOARD MEETING\6-27-2013\COORDINATED SRTP\ATTACHMENT A. SOLTRANS FINAL DRAFT SRTP.DOCX
Page A5
Solano County Transit (SolTrans)DETAILED OPERATING PLAN & BUDGET 2010 2011 2012 2013 2014 2015 2016 2017 2018 2019 2020 2021 2022Paratransit: ADA + DAR + All Taxi Scrip Historical Budget ForecastDate prepared: 10-Jun-2013
FY 2009/10 FY 2010/11 FY2011/12 FY 2012/13 FY2013/14 FY 2014/15 FY 2015/16 FY2016/17 FY 2017/18 FY 2018/19 FY 2019/20 FY 2020/21 FY 2021/22
METRICSOperating Expense Per Vehicle HOUR 79.13$ 93.85$ 99.38$ 100.08$ 103.08$ 106.20$ 109.38$ 112.67$ 116.08$ 119.60$ 123.19$ 126.89$ 130.70$ Operating Expense Per Vehicle MILE 8.36$ 12.08$ 5.75$ 5.79$ 5.97$ 6.15$ 6.33$ 6.52$ 6.72$ 6.92$ 7.13$ 7.34$ 7.57$ Operating Expense Per Passenger 40.80$ 40.77$ 48.78$ 42.71$ 43.13$ 43.57$ 43.99$ 44.43$ 44.88$ 45.33$ 45.77$ 46.22$ 46.68$ Average Fare Per Passenger 4.52$ 1.95$ 2.61$ 2.00$ 2.01$ 2.01$ 2.02$ 2.03$ 2.03$ 2.04$ 2.04$ 2.04$ 2.04$ Passengers Per Vehicle HOUR 1.9 2.3 2.0 2.3 2.4 2.4 2.5 2.5 2.6 2.6 2.7 2.7 2.8 Farebox Recovery (Fares as % of Oper. Exp.) 11.07% 4.79% 5.35% 4.68% 4.65% 4.62% 4.60% 4.56% 4.53% 4.49% 4.46% 4.42% 4.38%Local Recovery (Fares+Local as % of Oper. Exp.) 11.07% 4.79% 5.35% 4.68% 4.65% 4.62% 4.60% 4.56% 4.53% 4.49% 4.46% 4.42% 4.38%
[1] Net expense computed as expenses less fares. Total taxi expenses pro-rated to local (vs. intercity) based on forecast fare revenues for each service. Assume growth consistent with TDA funding, i.e., +2%/year through FY2015/16 and +3%/year thereafter.[2] Amounts for FY2013/14 and FY2014/15 from new MOU (Draft dated 03-May-2013). Assume growth consistent with TDA funding, i.e., +2%/year through FY2015/16 and +3%/year thereafter.[3] Assumes TDA amounts increase consistent with growth in TDA apportionment, i.e., 2% annual growth through FY2015/16 and 3% annual growth thereafter.[4] No long-term growth assumption applied to this funding source.[5] Pending FTA grants. Funds would be designated for ADA paratransit operations

Solano County Transportation Authority Short Range Transit Plan SolTrans
DocRef | Issue | June 18, 2013 | Arup North America Ltd S:\SOLTRANS\ELIZABETH\MEETINGS AND PRESENTATIONS\BOARD MEETING\6-27-2013\COORDINATED SRTP\ATTACHMENT A. SOLTRANS FINAL DRAFT SRTP.DOCX
Page A6
A3 SolTrans Operating Budget - Systemwide Total
Note: Table is continued on the next page.
Solano County Transit (SolTrans) Baseline ScenarioDETAILED OPERATING PLAN & BUDGET 2010 2011 2012 2013 2014 2015 2016 2017 2018 2019 2020 2021 2022Systemwide Total Historical Budget ForecastDate prepared: 10-Jun-2013
FY 2009/10 FY 2010/11 FY2011/12 FY 2012/13 FY2013/14 FY 2014/15 FY 2015/16 FY2016/17 FY 2017/18 FY 2018/19 FY 2019/20 FY 2020/21 FY 2021/22OPERATING STATISTICS
Vehicle Miles [1] 2,287,543 2,192,764 2,265,186 2,301,119 2,331,480 2,361,841 2,361,841 2,361,841 2,361,841 2,361,841 2,361,841 2,361,841 2,361,841 Vehicle Hours [1] 92,113 82,612 113,119 115,199 117,199 119,199 119,199 119,199 119,199 119,199 119,199 119,199 119,199 Ridership [2] 980,254 972,275 1,473,250 1,503,940 1,541,777 1,580,604 1,603,985 1,627,751 1,651,909 1,676,467 1,701,430 1,726,808 1,752,606
OPERATING EXPENSESOperating & Maintenance Costs
O&M Cost - baseline [3] 10,814,693$ 11,525,691$ 12,252,236$ 11,541,000$ 11,733,883$ 12,123,788$ 12,676,812$ 13,057,326$ 13,449,546$ 13,853,762$ 14,269,275$ 14,697,393$ 15,138,435$ O&M Cost - due to change in level of service -$ 190,796$ 183,932$ -$ -$ -$ -$ -$ -$ -$ O&M Cost - due to structural cost incr/decr -$ -$ -$ -$ -$ -$ -$ -$ -$ -$ Subtotal: O&M Expenses 10,814,693$ 11,525,691$ 12,252,236$ 11,541,000$ 11,924,679$ 12,307,720$ 12,676,812$ 13,057,326$ 13,449,546$ 13,853,762$ 14,269,275$ 14,697,393$ 15,138,435$
Other Operating ExpensesSubtotal: OTHER OPERATING Expenses -$ -$ -$ -$ -$ -$ -$ -$ -$ -$ -$ -$ -$
TOTAL OPERATING EXPENSES 10,814,693$ 11,525,691$ 12,252,236$ 11,541,000$ 11,924,679$ 12,307,720$ 12,676,812$ 13,057,326$ 13,449,546$ 13,853,762$ 14,269,275$ 14,697,393$ 15,138,435$
PROGRAM EXPENSESLocal Taxi Scrip (net expense) [4,5] 80,934$ 83,871$ 86,797$ 90,521$ 94,228$ 97,921$ 101,600$ 106,063$ 110,509$ 114,939$ Intercity Taxi Scrip (contrib. to County-wide prog.) [4,5,6] 18,066$ 85,000$ 85,000$ 86,700$ 89,300$ 92,000$ 94,800$ 97,600$ 100,500$ 103,500$ Intercity Express Bus (contrib. to County-wide prog.)[4,5,7] 204,113$ 235,394$ 240,000$ 245,000$ 252,000$ 260,000$ 268,000$ 276,000$ 284,000$ 293,000$ TOTAL PROGRAM EXPENSES 303,113$ 404,265$ 411,797$ 422,221$ 435,528$ 449,921$ 464,400$ 479,663$ 495,009$ 511,439$
TOTAL EXPENSES 10,814,693$ 11,525,691$ 12,252,236$ 11,844,113$ 12,328,944$ 12,719,517$ 13,099,032$ 13,492,854$ 13,899,467$ 14,318,162$ 14,748,938$ 15,192,403$ 15,649,874$
OPERATING REVENUESOperating Revenues -- Fares
Transit Fares - baseline [2] 3,231,244$ 3,236,509$ 3,608,086$ 3,331,000$ 3,385,766$ 3,478,534$ 3,572,993$ 3,631,360$ 3,690,720$ 3,751,093$ 3,812,497$ 3,874,951$ 3,938,476$ Transit Fares - due to change in service -$ 36,702$ 37,069$ -$ -$ -$ -$ -$ -$ -$ Transit Fares - due to proposed fare incr/decr -$ -$ -$ -$ -$ -$ -$ -$ -$ -$ Subtotal: FARE Revenue 3,231,244$ 3,236,509$ 3,608,086$ 3,331,000$ 3,422,468$ 3,515,602$ 3,572,993$ 3,631,360$ 3,690,720$ 3,751,093$ 3,812,497$ 3,874,951$ 3,938,476$
Other Operating RevenuesOther -$ -$ -$ 5,000$ 5,000$ 5,000$ 5,000$ 5,000$ 5,000$ 5,000$ 5,000$ 5,000$ 5,000$ Subtotal: OTHER OPERATING Revenue -$ -$ -$ 5,000$ 5,000$ 5,000$ 5,000$ 5,000$ 5,000$ 5,000$ 5,000$ 5,000$ 5,000$
TOTAL OPERATING REVENUES 3,231,244$ 3,236,509$ 3,608,086$ 3,336,000$ 3,427,468$ 3,520,602$ 3,577,993$ 3,636,360$ 3,695,720$ 3,756,093$ 3,817,497$ 3,879,951$ 3,943,476$
SUBSIDY REVENUESSubsidy Revenues -- Local
Regional Measure 2 Operating [8] -$ -$ -$ 1,224,000$ 1,200,000$ 1,200,000$ 1,200,000$ 1,200,000$ 1,200,000$ 1,200,000$ 1,200,000$ 1,200,000$ 1,200,000$ Subtotal: LOCAL Revenue -$ -$ -$ 1,224,000$ 1,200,000$ 1,200,000$ 1,200,000$ 1,200,000$ 1,200,000$ 1,200,000$ 1,200,000$ 1,200,000$ 1,200,000$
Subsidy Revenues -- StateTDA: net annual LTF apportionment (no carryover) [5,9] -$ -$ -$ 4,971,413$ 4,953,087$ 5,052,100$ 5,153,100$ 5,307,700$ 5,466,900$ 5,630,900$ 5,799,800$ 5,973,800$ 6,153,000$ TDA: contributions from others for Intercity Bus [4,5,7] -$ -$ -$ 212,801$ 217,057$ 221,000$ 225,000$ 232,000$ 239,000$ 246,000$ 253,000$ 261,000$ 269,000$ STAF: revenue-based apportionment [8,9] -$ -$ -$ 586,000$ 213,941$ 185,312$ 185,312$ 185,312$ 185,312$ 185,312$ 185,312$ 185,312$ 185,312$ STAF: Lifeline [10] -$ -$ -$ 556,865$ 569,755$ 375,000$ 375,000$ 375,000$ 375,000$ 375,000$ 375,000$ 375,000$ 375,000$ Other State Funds -- One-Time STAF -$ -$ -$ 1,609,000$ -$ -$ -$ -$ -$ -$ -$ -$ -$ Subtotal: STATE Revenue -$ -$ -$ 7,936,079$ 5,953,840$ 5,833,412$ 5,938,412$ 6,100,012$ 6,266,212$ 6,437,212$ 6,613,112$ 6,795,112$ 6,982,312$
Subsidy Revenues -- FederalFTA5307: Urbanized Area (Operating) [8] -$ -$ -$ 4,179,000$ 3,158,000$ 3,428,000$ 3,400,000$ 3,400,000$ 3,400,000$ 3,387,000$ 3,374,000$ 3,361,000$ 3,349,000$ FTA5311: Non-Urbanized Area (Intercity Ops) [8] -$ -$ -$ 107,000$ 50,000$ 50,000$ 50,000$ 50,000$ 50,000$ 50,000$ 50,000$ 50,000$ 50,000$ FTA5316: JARC (Operating) -$ -$ -$ 300,000$ 100,000$ 100,000$ 100,000$ 100,000$ 100,000$ 100,000$ 100,000$ 100,000$ 100,000$ FTA - Unused Vallejo Grants -$ -$ -$ -$ 1,689,000$ -$ -$ -$ -$ -$ -$ -$ -$ Other Federal Funds -- One-Time FTA PM -$ -$ -$ 1,000,000$ -$ 500,000$ -$ -$ -$ -$ -$ -$ -$ Subtotal: FEDERAL Revenue -$ -$ -$ 5,586,000$ 4,997,000$ 4,078,000$ 3,550,000$ 3,550,000$ 3,550,000$ 3,537,000$ 3,524,000$ 3,511,000$ 3,499,000$
TOTAL SUBSIDY REVENUES -$ -$ -$ 14,746,079$ 12,150,840$ 11,111,412$ 10,688,412$ 10,850,012$ 11,016,212$ 11,174,212$ 11,337,112$ 11,506,112$ 11,681,312$
TOTAL REVENUES 3,231,244$ 3,236,509$ 3,608,086$ 18,082,079$ 15,578,308$ 14,632,014$ 14,266,405$ 14,486,372$ 14,711,932$ 14,930,305$ 15,154,609$ 15,386,063$ 15,624,788$
ANNUAL SURPLUS (DEFICIT) (7,583,449)$ (8,289,182)$ (8,644,150)$ 6,237,966$ 3,249,364$ 1,912,497$ 1,167,373$ 993,518$ 812,465$ 612,143$ 405,670$ 193,661$ (25,086)$
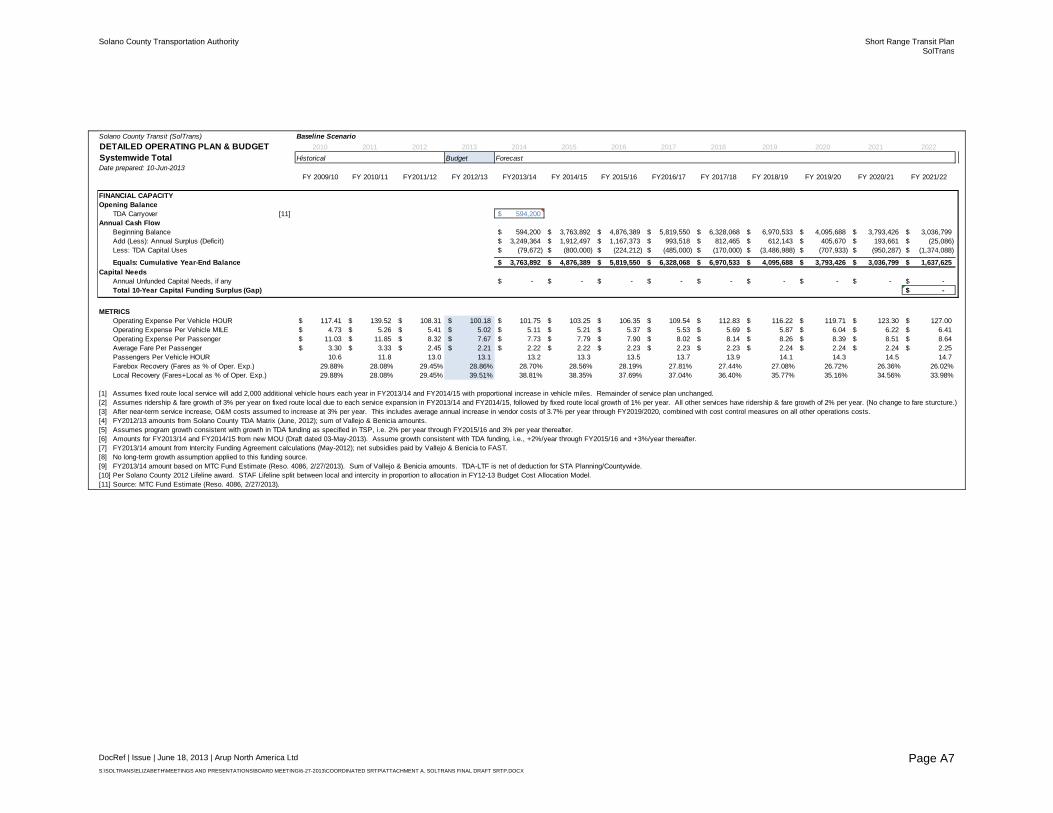
Solano County Transportation Authority Short Range Transit Plan SolTrans
DocRef | Issue | June 18, 2013 | Arup North America Ltd S:\SOLTRANS\ELIZABETH\MEETINGS AND PRESENTATIONS\BOARD MEETING\6-27-2013\COORDINATED SRTP\ATTACHMENT A. SOLTRANS FINAL DRAFT SRTP.DOCX
Page A7
Solano County Transit (SolTrans) Baseline ScenarioDETAILED OPERATING PLAN & BUDGET 2010 2011 2012 2013 2014 2015 2016 2017 2018 2019 2020 2021 2022Systemwide Total Historical Budget ForecastDate prepared: 10-Jun-2013
FY 2009/10 FY 2010/11 FY2011/12 FY 2012/13 FY2013/14 FY 2014/15 FY 2015/16 FY2016/17 FY 2017/18 FY 2018/19 FY 2019/20 FY 2020/21 FY 2021/22
FINANCIAL CAPACITYOpening Balance
TDA Carryover [11] 594,200$ Annual Cash Flow
Beginning Balance 594,200$ 3,763,892$ 4,876,389$ 5,819,550$ 6,328,068$ 6,970,533$ 4,095,688$ 3,793,426$ 3,036,799$ Add (Less): Annual Surplus (Deficit) 3,249,364$ 1,912,497$ 1,167,373$ 993,518$ 812,465$ 612,143$ 405,670$ 193,661$ (25,086)$ Less: TDA Capital Uses (79,672)$ (800,000)$ (224,212)$ (485,000)$ (170,000)$ (3,486,988)$ (707,933)$ (950,287)$ (1,374,088)$
Equals: Cumulative Year-End Balance 3,763,892$ 4,876,389$ 5,819,550$ 6,328,068$ 6,970,533$ 4,095,688$ 3,793,426$ 3,036,799$ 1,637,625$ Capital Needs
Annual Unfunded Capital Needs, if any -$ -$ -$ -$ -$ -$ -$ -$ -$ Total 10-Year Capital Funding Surplus (Gap) -$
METRICSOperating Expense Per Vehicle HOUR 117.41$ 139.52$ 108.31$ 100.18$ 101.75$ 103.25$ 106.35$ 109.54$ 112.83$ 116.22$ 119.71$ 123.30$ 127.00$ Operating Expense Per Vehicle MILE 4.73$ 5.26$ 5.41$ 5.02$ 5.11$ 5.21$ 5.37$ 5.53$ 5.69$ 5.87$ 6.04$ 6.22$ 6.41$ Operating Expense Per Passenger 11.03$ 11.85$ 8.32$ 7.67$ 7.73$ 7.79$ 7.90$ 8.02$ 8.14$ 8.26$ 8.39$ 8.51$ 8.64$ Average Fare Per Passenger 3.30$ 3.33$ 2.45$ 2.21$ 2.22$ 2.22$ 2.23$ 2.23$ 2.23$ 2.24$ 2.24$ 2.24$ 2.25$ Passengers Per Vehicle HOUR 10.6 11.8 13.0 13.1 13.2 13.3 13.5 13.7 13.9 14.1 14.3 14.5 14.7 Farebox Recovery (Fares as % of Oper. Exp.) 29.88% 28.08% 29.45% 28.86% 28.70% 28.56% 28.19% 27.81% 27.44% 27.08% 26.72% 26.36% 26.02%Local Recovery (Fares+Local as % of Oper. Exp.) 29.88% 28.08% 29.45% 39.51% 38.81% 38.35% 37.69% 37.04% 36.40% 35.77% 35.16% 34.56% 33.98%
[1] Assumes fixed route local service will add 2,000 additional vehicle hours each year in FY2013/14 and FY2014/15 with proportional increase in vehicle miles. Remainder of service plan unchanged.[2] Assumes ridership & fare growth of 3% per year on fixed route local due to each service expansion in FY2013/14 and FY2014/15, followed by fixed route local growth of 1% per year. All other services have ridership & fare growth of 2% per year. (No change to fare sturcture.)[3] After near-term service increase, O&M costs assumed to increase at 3% per year. This includes average annual increase in vendor costs of 3.7% per year through FY2019/2020, combined with cost control measures on all other operations costs.[4] FY2012/13 amounts from Solano County TDA Matrix (June, 2012); sum of Vallejo & Benicia amounts.[5] Assumes program growth consistent with growth in TDA funding as specified in TSP, i.e. 2% per year through FY2015/16 and 3% per year thereafter.[6] Amounts for FY2013/14 and FY2014/15 from new MOU (Draft dated 03-May-2013). Assume growth consistent with TDA funding, i.e., +2%/year through FY2015/16 and +3%/year thereafter.[7] FY2013/14 amount from Intercity Funding Agreement calculations (May-2012); net subsidies paid by Vallejo & Benicia to FAST.[8] No long-term growth assumption applied to this funding source.[9] FY2013/14 amount based on MTC Fund Estimate (Reso. 4086, 2/27/2013). Sum of Vallejo & Benicia amounts. TDA-LTF is net of deduction for STA Planning/Countywide.[10] Per Solano County 2012 Lifeline award. STAF Lifeline split between local and intercity in proportion to allocation in FY12-13 Budget Cost Allocation Model.[11] Source: MTC Fund Estimate (Reso. 4086, 2/27/2013).

Appendix B
Title VI and Previous Reports

Solano County Transportation Authority Short Range Transit Plan SolTrans
DocRef | Issue | June 18, 2013 | Arup North America Ltd S:\SOLTRANS\ELIZABETH\MEETINGS AND PRESENTATIONS\BOARD MEETING\6-27-2013\COORDINATED SRTP\ATTACHMENT A. SOLTRANS FINAL DRAFT SRTP.DOCX
Page B1
B1 Title VI