soil water dynamics and water use in a western juniper (juniperus occidentalis) woodland
TRANSCRIPT

lable at ScienceDirect
Journal of Arid Environments 102 (2014) 117e126
Contents lists avai
Journal of Arid Environments
journal homepage: www.elsevier .com/locate/ jar idenv
Soil water dynamics and water use in a western juniper(Juniperus occidentalis) woodland
Candy Mollnau a,*, Michael Newton b, Tamzen Stringham c
aDepartment of Rangeland Ecology and Management, College of Agricultural Sciences, Oregon State University, Corvallis, USAbDepartment of Forest Engineering, Resources and Management, College of Forestry, Oregon State University, Corvallis, USAcDepartment of Animal Biotechnology, College of Agriculture, Biotechnology and Natural Resources, University of Nevada, Reno, USA
a r t i c l e i n f o
Article history:Received 30 April 2012Received in revised form23 November 2013Accepted 26 November 2013Available online 9 January 2014
keywords:Soil waterTranspirationUnderstoryWestern juniper
* Corresponding author. HNEE e Eberswalde Univopment, Faculty of Forest and Environment, Alfred-MöEberswalde, Germany. Tel.: þ49 3334 657117; fax: þ4
E-mail address: [email protected] (C. Moll
0140-1963/$ e see front matter � 2013 Elsevier Ltd.http://dx.doi.org/10.1016/j.jaridenv.2013.11.015
a b s t r a c t
This study sought to quantify changes in landscape hydrology associated with changes in juniper coverand understory vegetation. We identified rates of surface evaporation in the absence of plant cover anddetermined rates of soil water depletion in four cover types. Vegetation treatments were installed in arandomized block design with five replications. Additionally, juniper trees were instrumented withGranier (1985) sap flow sensors to monitor transpiration rates. At the local scale juniper removal resultedin 20% greater over-winter accumulation of soil water, and demonstrated evidence of increased,generally complementary rates of transpiration in the released understory. Juniper utilizes the sameresources as understory vegetation and successfully competes for shallow soil water before tapping intodeeper resources. Stand-level estimates of transpiration for these woodlands averaged 0.4 mm per dayduring the summer months. Only 48% of the cool-season precipitation was retained in the top 90 cm invegetated treatments but little is known about relative importance of processes governing water loss anddepletion during the winter months. Resolving water use during times of low transpirational demand,will be crucial to link positive effects of juniper removal with subsurface water yield at the local scale andhelp further explain increased water availability observed at the watershed-scale.
� 2013 Elsevier Ltd. All rights reserved.
1. Introduction
Land managers are increasingly challenged to balance multipleuse objectives (crop, livestock, and forest products) with improvedwater management. Improving our understanding of sub-surfacewater yield in relation to land management practices, specificallyvegetation management, will be crucial for sustaining rural liveli-hoods in semi-arid regions, where reliable supplies of deep waterare most critical (BLM, 1994; Bedell et al., 1993).
Today, water yield and quality have become major land man-agement concerns in eastern Oregon especially in the face ofmanaging landscapes with the expansion of western juniper(Juniperus occidentalis Hook.). Among other interrelated, ecologicalfactors, historical overgrazing and changes in fire regime furtheredthe encroachment of juniper into sagebrush steppe and other plantcommunities in the northern Great Basin over the past 100 years(Bates et al., 2000; Buckhouse and Mattison, 1980; Miller and Rose,
ersity for Sustainable Devel-ller-Str. 1, Haus 10.103, 162259 3334 657162.nau).
All rights reserved.
1995; Miller and Wigand, 1994; Miller et al., 2000, 2005; Whalen,2006).
Juniper and sagebrush plant communities differ in their sea-sonal pattern and magnitude of water use such that changes inplant community composition influence hydrological cycles(Pierson et al., 2007). The complexity of responses to treatment isoften contradicting and rationales for juniper-control are stilllacking scientific evidence (Belsky, 1996). Recent studies in theNorthwest (Bates et al., 2000; DeBoodt, 2008) address this concernand investigate juniper removal in a more holistic experimentalapproach. Local studies identifying use of water by manageablecover are needed to determine which changes in plant cover wouldbe prudent and feasible to optimize allocation of water inputs to-ward sub-surface water yield (Belsky, 1996) and forage under givensite conditions.
The goal of this study was to determine summer transpirationrates for western juniper in relation to soil water depletion inmountain and Wyoming big sagebrush (Artemisia tridentata Nutt.ssp. vaseyana (Rydb.) Beetle; A. tridentata Nutt. ssp. wyomingensisBeetle and Young) communities that are facing growing competi-tionwith western juniper. The specific objectivewas to quantify thepartitioning of rainfall among surface evaporation loss from bareground vs. transpiration by shrubs and herbs with juniper present

C. Mollnau et al. / Journal of Arid Environments 102 (2014) 117e126118
compared to where juniper had been removed, with and withoutunderstory cover present during the active growing season.
2. Methods and analyses
2.1. Study sites
The study was conducted on the McCormack Ranch 24 kmnortheast of Brothers, Oregon (43�5703500 0 43�5705600N/120�27’1000
e 120�2603200W). The study sites are located within an openmaturewestern juniper woodland 70e90 years of age on mainly northeastfacing slopes at elevations between 1450 and 1600 m at the edge ofthe John Day Ecological Province (Anderson et al., 1998). Thiselevation and location provide cold winters and very-late-springonset of herbaceous cover and transpiration. Physiographically,this province consists of extensive areas of steeply and intricatelydissected hills interspersed with buttes and plateaus. The hills aremainly geologically eroded ancient lacustrine materials; plateausand buttes are capped with igneous or tuffaceous rock (Andersonet al., 1998). The 50-year mean annual precipitation (MAP) recor-ded at Barnes Butte, Prineville, averaged 320 mm over the past 50years, 80% of which occurs from September through April. Themajority of rain events have intensities of less than 4 mm h�1
(Barnes weather station 43�570N/120�130W, historical records1961e2008). Whereas winter precipitation in 2006/2007 averaged240 mm between September and April, cool season precipitationduring 2007/2008 was 315 mm; slightly above the long-termaverage. In 2008 more than 70% of the cool season precipitationoccurred between November and January, when daily maximumair temperatures range between 4 and 7 �C.
The study area has diverse micro-topography with abruptchanges in local features. Soil features reflect long histories of pe-riodic volcanic ash deposition from the Cascade Mountains be-tween which the sparseness of vegetation furthered erosion thatexposed bedrock in a fine mosaic. This created highly variable soilsin the top 90 cm. Soil families are Typic, Vitrandic, or VerticArgixerolls with a frigid temperature regime.
Ecological sites associated with the dominant soils series are JDMountain Claypan (12e16 Precipitation Zone (PZ)), MountainSwale (12e16 PZ) and SR Mountain South (12e16 PZ), all of whichare prone to juniper encroachment (NRCS 2008, Soil Survey CrookCounty Area, Draft). Depending on soil depth and aspect, historicalplant community associations within the study area are describedas mountain/Wyoming big sagebrush (A. tridentata Nutt. ssp.vaseyana (Rydb) Beetle/wyomingensis Beetle and Young) e Idahofescue (Festuca idahoensis Elmer) and mountain/Wyoming bigsagebrush e bluebunch wheatgrass (Pseudoroegneria spicata(Pursh) A. Löve) (NRCS Ecological Site Description website).
The juniper stand structure was even-aged with modestrecruitment in the understory and few isolated pre-settlementtrees (<150 years) along rock rims. Following Miller et al. (2000),this juniper stand would be in a stage of late development (Phase IIentering Phase III). Tree densities ranged from 200 to 500 trees perha, experiencing canopy closure in locations along gullies withsandy soils > 60 cm deep. Idaho fescue (F. idahoensis Elmer) andSandberg bluegrass (Poa secunda J. Presl) were the dominantperennial grasses, species whose density varied little with treedensity. Shrub density averaged 2% and Wyoming and mountainbig sagebrush were often senescent, likely a result of juniperdominance (Miller et al., 2000).
2.2. Experimental design and plot inventory
The experimental approach was to compare soil water depletionunder an array of cover conditions, and to quantify evaporation and
transpiration. Transpiration estimates relied on continuous sapflow measurements in mature juniper trees, coupled with basalarea measures of stand density (Granier, 1987). These allowedidentification of seasonal and diurnal patterns of water use by ju-niper and their linkage to environmental changes. They also pro-vide corroborative evidence of rates of soil water depletion byjuniper in various mixtures with other plant cover. Segregation andremoval of the various classes allowed examination of water use byeach via analyses of soil water dynamics in an array of depths.Removal of juniper from plots later described as “without juniper”allowed additional recharge of water, ensuring that there would besufficient water in the soil profile the following summer to obtainproper measures of potential depletion by each cover type, or waterloss from surface evaporation from bare-ground.
Experimental units were installed during late May 2007 in arandomized complete block design with four treatments in fivereplications. Sites were selected within a large stand of post-settlement juniper where the removal of western juniper hasbeen effective in increasing ground cover of forbs and grasses at thewatershed-scale (Fig. 1; DeBoodt, 2008). Individual blocks wereestablished in locations with similar aspect and slope and treat-ments were randomly assigned within blocks. Top soils weresimilar within blocks (Fig. 1), with the fine material being mostlysilty clays. Blocks one and four were skeletal and ground surfacewas frequently covered with coarse fragments. Soils in plots fiveand seven as well as block five were fine sands and fine to mediumsands at >60 cm. Treatments (Table 1) included: 1) control ¼ nomanipulation of cover, 2) understory ¼ removal of all junipers bycutting and removing trees beyond plot boundaries, 3)juniper ¼ removing only shrubs, grasses and herbs, and 4) bare-ground ¼ removal of all cover.
Plot size was 20 � 20 m with varying buffer widths betweenplots. Buffers were 6 m between plots with similar treatments injuniper. If different treatments were adjacent to each other thebuffer width was increased to 24 m to avoid confounding fromjuniper roots extending into cut treatments. In cut plots, all junipertrees were removed by June 16, 2007. The understory vegetationwas removed with a broadcast application of 2,4-D and sulfome-turon in late May 2007. Spraying was repeated in May 2008 withpicloram added to the mix to ensure control of broadleaf speciesthat had exhibited tolerance to 2,4-D. In bare treatments cut treesand large litter associated with tree removal was removed from allplots.
In 2007 and 2008 air temperature was recorded (30 cm aboveground) in each block. Records of precipitation, solar radiation andrelative humidity were obtained from the Twin Watershed studysite 5 km to the northeast (DeBoodt, 2008).
The line intercept method was used to estimate foliar cover ofunderstory species (U. S. Department of Interior.1999). In June 2007and 2008 five transects 20m in lengthwere established in each plotand direction (N to S or E to W) randomly assigned for individualplots. For grasses and shrubs foliar cover was recorded by species.Forb cover was recorded separately for annual and perennial plants.The number of juniper stems per plot was recorded and their agedetermined by tree ring count after harvest in 2008. In uncut plotsall juniper trees were inventoried. Height, base of living crown,crown diameter and diameter at breast height (DBH, measured at130 cm) were measured for individual trees. Trees less than 130 cmtall were considered part of the understory cover and wereremoved within the understory and bare treatment.
2.3. Gravimetric sampling and soil water analyses
Soil samples for gravimetric moisture determination werecollected monthly from May 20 through August in 2007 before
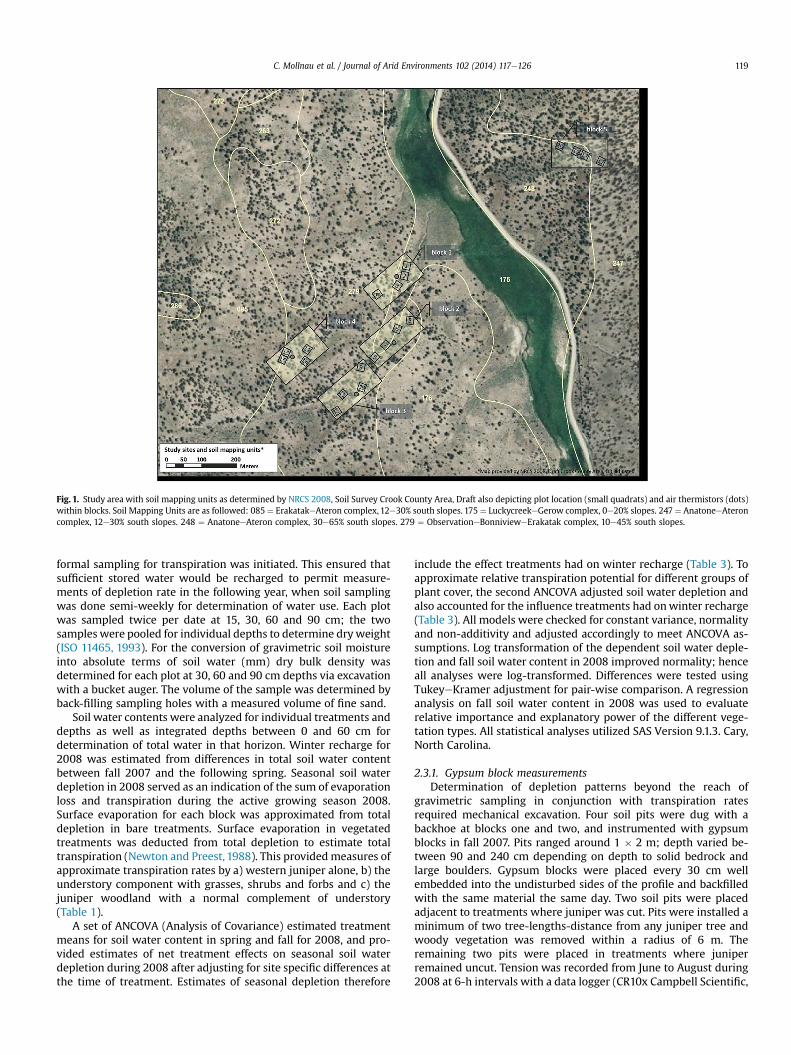
Fig. 1. Study area with soil mapping units as determined by NRCS 2008, Soil Survey Crook County Area, Draft also depicting plot location (small quadrats) and air thermistors (dots)within blocks. Soil Mapping Units are as followed: 085 ¼ ErakatakeAteron complex, 12e30% south slopes. 175 ¼ LuckycreekeGerow complex, 0e20% slopes. 247 ¼ AnatoneeAteroncomplex, 12e30% south slopes. 248 ¼ AnatoneeAteron complex, 30e65% south slopes. 279 ¼ ObservationeBonnivieweErakatak complex, 10e45% south slopes.
C. Mollnau et al. / Journal of Arid Environments 102 (2014) 117e126 119
formal sampling for transpiration was initiated. This ensured thatsufficient stored water would be recharged to permit measure-ments of depletion rate in the following year, when soil samplingwas done semi-weekly for determination of water use. Each plotwas sampled twice per date at 15, 30, 60 and 90 cm; the twosamples were pooled for individual depths to determine dryweight(ISO 11465, 1993). For the conversion of gravimetric soil moistureinto absolute terms of soil water (mm) dry bulk density wasdetermined for each plot at 30, 60 and 90 cm depths via excavationwith a bucket auger. The volume of the sample was determined byback-filling sampling holes with a measured volume of fine sand.
Soil water contents were analyzed for individual treatments anddepths as well as integrated depths between 0 and 60 cm fordetermination of total water in that horizon. Winter recharge for2008 was estimated from differences in total soil water contentbetween fall 2007 and the following spring. Seasonal soil waterdepletion in 2008 served as an indication of the sum of evaporationloss and transpiration during the active growing season 2008.Surface evaporation for each block was approximated from totaldepletion in bare treatments. Surface evaporation in vegetatedtreatments was deducted from total depletion to estimate totaltranspiration (Newton and Preest, 1988). This providedmeasures ofapproximate transpiration rates by a) western juniper alone, b) theunderstory component with grasses, shrubs and forbs and c) thejuniper woodland with a normal complement of understory(Table 1).
A set of ANCOVA (Analysis of Covariance) estimated treatmentmeans for soil water content in spring and fall for 2008, and pro-vided estimates of net treatment effects on seasonal soil waterdepletion during 2008 after adjusting for site specific differences atthe time of treatment. Estimates of seasonal depletion therefore
include the effect treatments had on winter recharge (Table 3). Toapproximate relative transpiration potential for different groups ofplant cover, the second ANCOVA adjusted soil water depletion andalso accounted for the influence treatments had onwinter recharge(Table 3). All models were checked for constant variance, normalityand non-additivity and adjusted accordingly to meet ANCOVA as-sumptions. Log transformation of the dependent soil water deple-tion and fall soil water content in 2008 improved normality; henceall analyses were log-transformed. Differences were tested usingTukeyeKramer adjustment for pair-wise comparison. A regressionanalysis on fall soil water content in 2008 was used to evaluaterelative importance and explanatory power of the different vege-tation types. All statistical analyses utilized SAS Version 9.1.3. Cary,North Carolina.
2.3.1. Gypsum block measurementsDetermination of depletion patterns beyond the reach of
gravimetric sampling in conjunction with transpiration ratesrequired mechanical excavation. Four soil pits were dug with abackhoe at blocks one and two, and instrumented with gypsumblocks in fall 2007. Pits ranged around 1 � 2 m; depth varied be-tween 90 and 240 cm depending on depth to solid bedrock andlarge boulders. Gypsum blocks were placed every 30 cm wellembedded into the undisturbed sides of the profile and backfilledwith the same material the same day. Two soil pits were placedadjacent to treatments where juniper was cut. Pits were installed aminimum of two tree-lengths-distance from any juniper tree andwoody vegetation was removed within a radius of 6 m. Theremaining two pits were placed in treatments where juniperremained uncut. Tension was recorded from June to August during2008 at 6-h intervals with a data logger (CR10x Campbell Scientific,

Table 1Treatment and components of water depletion term for individual treatment units, each block was replicated five times and treatments were randomly assigned to plots;(Fig. 1).
Treatment ID Plot number Treatment juniper Treatment shrubs, forbs and grasses Soil water depletion term
Bare-ground 2, 6, 12, 14, 18 Cut Sprayed EvaporationUnderstory 1, 8, 10, 13, 19 Cut Un-sprayed Evaporation þ understoryJuniper 3, 5, 9, 15, 17 Uncut Sprayed Evaporation þ juniperControl 4, 7, 11, 16, 20 Uncut Un-sprayed Evaporation þ juniper þ understory
Table 2aANCOVA estimates for spring soil water content (mm) at 0e60 cm for 2008 adjustedfor pre-treatment differences, different letters designate significant differences (DF10, n ¼ 20).
Treatment Estimate (mm) Std. Error LowerCLa
UpperCLa
Treatmentdifferencesa � 0.05
Bare-ground 154.38 1.09 128.25 185.84 aUnderstory 134.59 1.08 113.71 159.31 abJuniper b 114.06 1.08 96.02 135.47 bcControl b 106.31 1.08 89.81 125.83 c
a Lower and upper confidence limits (CL) based on 95% confidence interval.b At 60e90 cm soil depth treatments with juniper contained 65 mm water and
tested significantly different (DF 10, a� 0.05; n¼ 18) from both bare and understorytreatment which contained about 90 mm of soil water for that depth interval.
Table 2bANCOVA estimates of fall soil water content (mm) at 0e60 cm for 2008 adjusted forpre-treatment differences, different letters designate significant differences (DF 10,n ¼ 20).
Treatment Estimate (mm) Std. error LowerCLa
UpperCLa
Treatmentdifferencesa � 0.05
Bare-ground 138.18 1.11 107.85 177.05 aUnderstory 82.15 1.11 65.60 102.88 bJuniper 67.17 1.11 53.38 84.52 bControl 67.03 1.11 53.52 83.95 b
a Lower and upper confidence limits (CL) based on 95% confidence interval.
C. Mollnau et al. / Journal of Arid Environments 102 (2014) 117e126120
Inc., Logan, UT, USA). The empirical equation provided by Campbell(1999) and Delmhorst was valid only for soil matrix potentialslower than�1.7 or�1.0 MPa. Therefore, patterns in resistance wereused as an indicator for soil water recharge or depletion, but did notpermit quantitative analyses of these records. Data could be usedonly to confirmwhether effective root systems of transpiring coverwere present at depth and which plant types exploited thesedeeper strata.
2.4. Sap flow measurements and transpiration estimates
James et al. (2002) adaptation of Granier’s (1985) constant heatdissipation method was used to measure sap flow and derive
Table 3ANCOVA estimates for seasonal soil water depletion (mm) at 0e60 cm for 2008adjusted for pre-treatment differences, different letters designate significant dif-ferences (DF 10, n ¼ 20).
Treatment Estimate (adj.)b (mm) Std. error (adj.)b LowerCLa
UpperCLa
Treatmentdifferencesa � 0.05
Bare-ground 13.91 (8.8) 1.30 (1.32) 7.73 25.03 a (a)Understory 44.54 (39.45) 1.27 (1.22) 26.23 75.64 b (b)Juniper 39.89 (48.94) 1.28 (1.23) 23.21 68.57 b (b)Control 37.85 (50.03) 1.27 (1.24) 22.28 64.29 b (b)
a Lower and upper confidence limits (CL) based on 95% confidence interval.b adjusted soil water depletion correcting for differences in winter recharge.
transpiration rates for western juniper. Two probes linked viathermocouples (copper-constantan) were inserted radially into thehydroactive xylem about 10 cm apart and positioned below the livecrown. The upper probe was connected to a power source with acurrent constantly inducing heat into the sap stream whilerecording the temperature of the passing sap. The lower proberemained unheated. Their temperature difference (DT) reflects theamount of water passing the probes. The general methodology,various applications, and improvements arewidely discussed in theliterature (Clearwater et al., 1999; Granier and Bréda, 1996; Granieret al., 1996; James et al., 2002; Köstner et al., 1998; Lu, 1997) with arecent comprehensive technical summary by Lu et al. (2004). Forthis study we used variable-length sensors with an effectivemeasuring element of 1 cm with a constant current supply of 0.15Watts per probe as described and validated by James et al. (2002).The measured temperature difference was converted to sap fluxdensity (Fd, g m�2 s�1) using the empirical relationship proposed byGranier (1985):
Fd ¼ 118:99��DTmax � DT
DT
�1:231
(1)
where, DT is the temperature difference between upper and lowerprobe at a given Fd and DTmax is the maximum difference betweenheated and un-heated probe, when sap is not moving (Fd ¼ 0).
Sixteen trees were selected for sap flow measurements in con-trol and juniper plots in block one and two. Thirty two sensors wereinstalled and recorded sap flow continuously from June throughearly September 2008. Prior to installation each tree was cored atsensor height to determine sapwood depth and to decide on thenumber and depth of sensors per tree. Sensor height was deter-mined by the lowest living branch and varied between 80 and130 cm, where diameter was recorded. Smaller trees with asapwood radius (rsw) < 5 cm were instrumented with one sensoron the north side of the trunk, measuring sap flow at 2 cm of thehydroactive xylem. Bigger trees with sapwood radii >5 cm wereinstrumented with an additional sensor, at 5 cm depth, to quantifypotential differences in sap velocity with distance from the cam-bium and correct landscape-level estimates for differences in flowrates. Individual stems were wrapped in reflective insulation 60e100 cm above and below sensor pairs to minimize local thermaleffects of sun and ambient air. In addition, ambient gradients weremonitored throughout the season with two unheated sensors perplot to verify sensor readings (Köstner et al., 1998; �Cermák et al.,2004).
The raw data output was graphically assessed for individualsensors. Sub-sets were created for periods of night-time flow ordrift. If night-time flow was observed without drift, a seven to tenday mean for DTmax was used to calculate flux density. During pe-riods of substantial drift a double regression approach was used asproposed by Granier (1987) and re-visited by Lu et al. (2004) todetermine Fd and counter under estimation of flow rates. Effects ofcalibrations were checked against Fd calculated from daily DTmax.Sensors that did not equilibrate and could not be adjusted werediscarded from the analysis. Missing data that did not exceed 24 h

C. Mollnau et al. / Journal of Arid Environments 102 (2014) 117e126 121
were interpolated based on relationships among functional sensorswithin the same plot. Following adjustments, 13 trees (and 23sensors total) were included in the final analyses.
Diameter of sensor trees at breast height (DBH), total height,crown height, and crown diameter were recorded to describe standconditions. Sapwood basal area was estimated and age determinedfrom wood cores and measured from cross-section samples cut atsensor height after the experiment. Due to the irregular nature ofthe heartwood, two cores taken on N and S side (cross-wise) did notnecessarily improve the estimate. Sapwood basal areas derivedfrom wood cores were on average 7% greater than those derivedfrom cross-sections cut at sensor height. This difference was notsignificant (47.1 cm2, t1,48 ¼ 0.3, adj. p ¼ 0.77, n ¼ 16). Tree tran-spiration was estimated using both approaches to derive the errorassociated with circumferential differences in sapwood area. Sapflow for individual trees was calculated as:
F ¼ Fd � BASW (2)
where BAsw is the sapwood basal area (m2).For landscape-level estimates of transpiration in juniper, daily
sap flux density at the stand-level (Fd, g m�2 s�1) was determinedbased on soil water content (0e60 cm), stand density, and Julianday. Transpiration for the remaining plots in the experiment wascalculated using appropriate Fd based on the established relation-ships and corrected for the proportion of sapwood basal area withsapwood depths >5 cm. Plot transpiration (mm) was calculated forcontrol and juniper treatments to express transpiration rates forjuniper at the individual plot-level.
3. Results
3.1. Soil water
Soil water data showed significant influence of the pre-treatment tree cover. Partial-year effects of treatment in 2007contributed to water availability at the onset of sampling in 2008.Specifically, plots supporting juniper started off with a substantiallydepleted inventory of soil water. The use of covariance allowed theadjustment of 2008 depletion rates to reflect the potential for in-dividual treatments with similar inventory of soil water in spring.When compared to the control and juniper treatment, spring soilwater in the bare-ground was significantly greater but differencesfrom the understory treatment alone were not pronounced (19.79;t2,10 ¼ 1.61; p¼ 0.41, n¼ 20). Table 2a summarizes spring soil waterconditions in 2008 after adjusting for pre-treatment differences. At60e90 cm, bare and understory treatments did not differ (�2.27;t2,10 ¼ �0.24; p ¼ 0.82, n ¼ 18) but both retained significantly morewater in May 2008 than did juniper and control treatment (27.05;t2,10 ¼ 2.77; p ¼ 0.02, n ¼ 18). Subtracting soil water contentmeasured at 0e60 cm in fall 2007 from these spring estimatesprovided a crude estimate of 55 and 56 mm recharge in the bare-ground and understory treatment, respectively. Un-cut treat-ments averaged 35 mm.
The overall treatment effect for soil water depletion at 0e60 cmwas significant (F3,10¼ 6.66, p¼ 0.0095;n¼ 20). Treatments showedno effect on soil water depletion for soil depths>60 cm (F3,5 ¼ 2.71,p ¼ 0.14, n ¼ 16). It was apparent that all types of cover with un-disturbed juniper or understory species would utilize most of theavailablewater in theupper 60 cmof soil. Baregrounddidnot lead tomajor evaporative loss; evaporation alone affected depletion of soilwater only to 15 cm below ground. Differences in spring resulted inrelatively high seasonal depletion rates in the understory treatmentduring the summer 2008 (Table 3) and were indicative of a growth-release effect in herbs and shrubs following tree cutting. At the same
time juniper and control treatments started off with 20% less soilwater in 2008, which, in turn, reduced transpiration potential forjuniper trees as well as understory component in the controltreatments (Tables 2a and 3). Accordingly, depletion of the threevegetated treatments did not differ at all depths (t3,10 ¼ 0.61,p¼ 0.56, n¼ 20; Table 3). However, soil water content in September2008 was higher in understory treatments (Table 2b) and bare-ground plots retained up to 72 mm more soil water than uncuttreatments (t3,10 ¼ �4.41, p ¼ 0.0013, n ¼ 20, Table 2b).
The overall treatment effect of vegetation management was alsosignificant for potential depletion rates (F3,9 ¼ 9.8, p ¼ 0.0034;n ¼ 19), with adjusted soil water contents for spring 2008(F3,9 ¼ 9.8, p ¼ 0.0034; n ¼ 20). Adjusted estimates of seasonal soilwater depletion in juniper and control treatments averaged 48.9(SE ¼ 1.23) and 50 mm (SE ¼ 1.24) and rates in the understorytreatment were 20% lower in these projections.
Gypsum blocks provided limited data pertaining to changes insoil water potentials at soil depth to 240 cm and could not beconverted at matric potentials lower than �1.7 MPa. They didsupport data from gravimetric sampling that identified whetherdepletion was occurring, hence verifying if soil water was acces-sible to roots. Pits showed evidence of rapid depletion above 60 cm,also reflected in gravimetric data (Table 3). Soil pits with herb andgrass vegetation or little cover were depleted later in summer thanpits located in fully vegetated stands close to juniper trees andshrubs. Towards the end of July depletion was detected at greaterthan 90 cm depths in plots with juniper, and no obvious depletionwas observed below 90 cm in their absence.
Pearson correlation coefficients indicate that plot basal area (BA)was negatively correlated with winter recharge and spring soilwater content (r � �0.50; p � 0.02, n ¼ 20). Basal area and totalunderstory cover were also significantly correlated with fall soilwater for 2008. In the absence of juniper, total understory coverexplained about 60% (MSE¼ 0.21, p¼ 0.013, n¼ 10) of the variationof the depletion term but neither winter recharge nor soil watercontent prior to treatment was significant at a� 0.05. Hence, wateruse of the understory was substantial in absence of juniper, thusreflecting complementary utilization of resources. Total understory(adj. r2 ¼ 0.05, MSE ¼ 0.21, p ¼ 0.2543, n ¼ 10) cover or juniperdensity (adj. r2 ¼ 0, MSE ¼ 0.23, p ¼ 0.552, n ¼ 10) alone did notexplain differences in soil water depletion between the juniper andcontrol treatment. Pre-treatment soil water (adj. r2 ¼ 0.52,MSE ¼ 0.11, p ¼ 0.0118, n ¼ 10) and winter recharge (adj.r2 ¼ 0.58,MSE¼ 0.09, p¼ 0.0065, n¼ 10) were important parameters drivingdepletion rates in these un-cut stands.
Simple regressions on single depths (15, 30, 60 and 90 cm)showed that spring soil water was important in driving depletionrates of the following growing season. Basal area and total under-story cover explained additional variance in soilwater content at theend of 2008. The general trend was that basal area gained explan-atory strength with soil depth. It showed little influence on deple-tion rate at 0e15 cm in 2008 (adj. r2¼ 0.06, p¼ 0.16, n¼ 20) and hadgreatest significance at 60e90 cm (adj. r2¼ 0.52, p¼ 0.0007, n¼ 20).Total understory cover was an important additional driver between0 and 15 cm (adj. r2 ¼ 0.14, p ¼ 0.05, n ¼ 20) but not so at greaterdepths (15e30 cm: adj. r2 ¼ 0.08, p ¼ 0.12, n ¼ 20; 30e60 cm: adj.r2 ¼ 0.05, p ¼ 0.17, n ¼ 20; 60e90 cm: adj. r2 < 0, p ¼ 0.43, n ¼ 18).This suggests that the various components of root systems sharedthe resources of the upper 60 cmof soil, but that juniperwas drivingsoil water depletion at greater depth.
3.2. Understory dynamics
Total understory cover prior to treatment averaged 22%.Although small, there was a significant increase in total cover

Fig. 2. (a) shows the seasonal pattern of air temperature (�C) and relative humidity (%) at the site; (b) e (e) show seasonal trends of soil water content (mm) for 0e60 cm (light grayareas) and for 60e90 cm soil depth (dark gray areas) and daily rates of sap flux densities (g m2 d�1) in (black lines) that were recorded in uncut treatments (sample plots 3, 4, 5 and7) for 2008; solid lines display sap flux densities for individual trees, dotted lines depict plot means; plot 3 and 5 are juniper treatments (no understory), plot 4 and 7 are controls(Table 1); DOY ¼ day of the year.
C. Mollnau et al. / Journal of Arid Environments 102 (2014) 117e126122
(4.81%, SE ¼ 1.17, n ¼ 20) where juniper had been cut. In terms offunctional groups only perennial grasses (2.65%, SE ¼ 0.57, n ¼ 20)and perennial forbs (1.57%, SE ¼ 0.47, n ¼ 20) had increasedsignificantly in 2008. Since the control did not show differences(0.48%, SE ¼ 0.7, n ¼ 20) in cover from 2007 to 2008 this changewas attributable to juniper treatment rather than year-to-yearvariation.
3.3. Sap flow and transpiration at the tree and stand level
Determination of transpiration by direct measurement in treesprovided corroboration for soil depletion measurements for controland juniper treatments. VPD (Fig. 2a) and solar radiation affectedhourly flow rates, yet their effect on seasonal transpiration wasminimal. There was a clear seasonal decline for flux densities (Fd,

Table 4Regression model resulting a stepwise regression on daily sums of hourly sap fluxdensity (kgm�2 d�1) for 2008; Fd is sap flux density (kgm�2 d�1), Beta 0e2 are fittedregression parameters in the order of entering the regression equation (a level forentering und staying in the equation �0.05, n ¼ 1013)Fd ¼ b0 þ b1 � SM þ b2 � DOY þ 3
Parameters Estimates (Beta 0e4) Std. error Cumulative model R2
Intercept 376.61 87.74 e
SMa 15.29 0.60 0.56DOYb 42.22 3.64 0.64
a SM¼ soil moisture expressed as soil-water content (mm) between 0 and 60 cm.b DOY ¼ day of the year.
C. Mollnau et al. / Journal of Arid Environments 102 (2014) 117e126 123
g m�2 d�1), peaking in early summer and decreasing to a low butconstant rate as soil water potential increased (Fig. 2bee). Slopes ofdecline and daily fluctuations were steepest early in the season andin plots with a greater reservoir of soil water in spring. When airtemperatures remained high after sunset, hourly rates showedevidence of night time flow (Fig. 3). Once soil water at 0e60 cmwasdepleted to about 50 mm, flux densities equilibrated around2.6 � 105 g m�2 d�1 (e.g. 3.9 L per day for the average tree with asapwood area of 0.015 cm2) amounting to 0.6 mm of transpirationper day across a landscapewith an average Basal area of 10m2 ha�1.
Due to higher soil water content in spring flux density(g m�2 d�1) in block onewas about 80% higher than in block two. Inlate summer diurnal patterns of flow rates were very similar fortrees within the same blocks drawing from the same soil envi-ronment. For both dry and wetter conditions in spring 2008,maximum transpiration was observed in trees younger than 80years. Maximum transpiration rates in dominant trees with a meansapwood basal area of 0.1 cm2 ranged between 100 and 150 L d�1,during most of June. However, these rates were only maintaineduntil soil water contents between 0 and 90 cm dropped to about100 mm in mid-July and, depending on Basal area per ha andavailable soil water, decreased to about 7e21 L d�1.
There was no evidence that sapwood basal area (r2 ¼ 0.002,p ¼ 0.88, n ¼ 13) and crown surface area (r2 ¼ 0.006, p ¼ 0.81,n ¼ 13) influenced mean flow rates in these young juniper stands.Basal area per ha (r2 ¼ 0.06, p¼ 0.42, n¼ 13) and soil water content(r2 ¼ 0.06, p ¼ 0.42, n ¼ 13) were the important parameters drivingsummer flow and were therefore used to model daily sap fluxdensities (Table 4). In addition, conductivity of sapwood varied
Fig. 3. (a) shows hourly averages of environmental conditions at the site for June, July anindividual trees showing monthly averages of hourly sap flow (g m�2 h�1) for June, July and Aabout double of that in block 2, stand density was highest (>20 m2 ha�1) for the control itreatments were intermediate in juniper density (between 10 and 15 m2 ha�1).
with distance to the heartwood. In most trees the outer sapwoodwasmore conductive. Rateswere between 40 and 70% lower withinthe deep sapwood (>5 cm) and radial differences had a noticeableeffect on transpiration estimates (Fig. 4aed).
Stand level estimates using modeled sap flux densities were thebest integrators of total transpiration (Fig 4). Based on modeled sapflux density, stand level transpiration for the study area averaged0.4 mm per day and depending on juniper density ranged between0.1 and 0.6 mm in stands with Basal areas between 3.5 and 15 m-
2 ha�1, respectively. Rates of transpiration in juniper estimated fromsap flow were somewhat higher than water use estimated fromobserved soil water depletion in juniper treatments particularly ifjuniper densities were high and soil moisture levels were limitingearly in the season. This difference may be attributable to watersources below 90 cm.
d August in 2008; in correspondence (b) depicts diurnal patterns of transpiration forugust in 2008; DOY ¼ day of the year. Note: spring soil water content in block one was
n block one and the lowest for the control in block two (8 m2 ha�1), both understory

Fig. 4. Graphs show calculated transpiration rates (T) (mm d�1) for 2008 as estimated frommeasured (m), averaged (ave) and modeled (pred) sap flow velocities (Fd), in comparisonmodel outcomes are depicted for different initial soil moisture conditions and stand densities in Figures (a) e (d); dotted lines depict transpiration rates corrected for radialdifferences in flow; (a) shows transpiration rates for plot 3 (juniper) with high spring soil moisture and stand density above average, (b) shows transpiration rates for plot 4 (control)with high spring soil moisture and stand density below average, (c) shows transpiration rates for plot 5 (juniper) with low spring soil water and average stand density, and (d) showstranspiration rates for plot 7 (control) with low spring soil moisture and stand density above average. DOY ¼ day of the year measured (m) ¼ mean Fd derived from all instrumentedtrees within one plot averaged (avg) ¼ Fd mean derived from all measurement trees modeled (pred) ¼ Fd is predicted based on spring soil water and stand density within a plot(Regression coefficients see, Table 4).
C. Mollnau et al. / Journal of Arid Environments 102 (2014) 117e126124
4. Discussion
Our study is generally supported by other work in identifyingsoil water depletion from transpiration by juniper. This case studyadded information pertaining to interaction between juniper andassociated shrubs and herbs, and isolated the evaporation rate frombare ground in evaluating net transpiration by any form of plantcover during a period with no effective recharge.
Soil water content in spring and vegetative cover dictate wateruse in the following growing season where climates are governedby cool-season precipitation. In such semi-arid communities,almost any plant cover will utilize most of the available soil waterand transpirational demands of undamaged cover will reduce theprobability of significant deep percolation. Vegetation manage-ment merely determines which plants provide the conduit.
Cutting juniper alone did not reduce depletion as long as theunderstory remained. Heterogeneity of soil physical properties mayhave dampened the effect of removal and over-estimated transpi-ration rates in herbs and shrubs. Adjustment of depletion ratesaccounted for this fact and water use for the understory was esti-matedmarginally lower (Table 3) than those for juniper woodlands.However, their difference was not pronounced and rates accountedfor most of the winter recharge. Generally, juniper not onlysimultaneously exploited the available soil water with herbs andshrubs, it also appears to maintain deeper soil horizons in adepleted state to the extent recharge rarely occurs. Gypsum blockinstallations gave some indication that soils remained dry after thewinter at greater depths (>200 cm) in comparison to those occu-pied by herbs and shrubs. This suggests that removal of junipermaybe necessary to achieve a change in deep-water storage in a normalyear.
Deep soil storage capacity is charged infrequently where junipercan deplete more water than is recharged. Moreover, juniper can-opies intercept much rain or snow; hence reduce effectiveness ofsuchprecipitation as occurs (Eddleman,1984; Larsen,1993). None ofour measures evaluated net interception or sublimation from juni-per crowns, and re-location of snow by drifting or as influenced bycrown structures. Changes in vegetative cover have been shown toinfluence snow deposition and redistribution by altering location,timing and rate of snowmelt (Eddleman,1984; Larsen,1993). This inturn, will affect local variation in winter recharge and percolation(LaMalfa and Ryel, 2008; Woods et al., 2006). Interception of pre-cipitation is higher in a juniper woodland than in a shrub-steppecommunity (Eddleman et al., 1994). With crown cover ranging be-tween 20 and 40% our sites were nearly at their maximum potentialfor juniper cover at these sites (Miller et al., 2000). Young et al.(1984) estimated that, in a range of storm sizes, interception ratesduring the winter season can reach 20% at the edge of a tree canopyto 69% directly underneath the crown. Using Young’s et al. (1984)average of 42% for a juniper crown 8e17% hence, 30e60 mm ofthe cool-season precipitation in 2008 would be attributed to inter-ception in these woodlands. With recharge totals between 40 and82 mm in the top 90 cm and after accounting for interception usingYang’s approximation 65% of the water input during the cool-seasons is not accounted for. However, without in-situ data onprecipitation and interception it cannot be discerned from thesedata how much would be attributable to winter transpiration.
In juniper only 48% of the precipitation received during thewinter was retained in the top 90 cm, 52% were intercepted andpartially transpired before the onset of the growing season of herbsand shrubs. Soil water retention in the top 90 cm was at 76% withonly herbs, shrubs and grasses present. Also bare ground showed

C. Mollnau et al. / Journal of Arid Environments 102 (2014) 117e126 125
significant loss retaining about 80% of the 370 mm of cool-seasonprecipitation. However, there was no evidence that structuralchanges of the soil surface negatively affected water and snowcapture at our sites. Removal of juniper reduced interception butalso released herbs and shrubs. At the same time resource captureand retention is increased while erosion is minimized (Piersonet al., 2007; Bates et al., 2000). Pierson et al. (2007) showed thatjuniper dominated woodlands had greater potential for runoff insmall storm events than did sites where juniper had been removed.Release of herbs and shrubs on these sites (Bates et al., 2000) hadpositive effects on capture of water during large storms. There wasno evidence that surface runoff occurred in either bare or under-story treatment in this study.
Juniperdevelopsanextensive lateral root system inmost soils. Themajor lateral roots extend to radii that are at least equal to the heightof a tree along with a few roots that grow straight down at the base(Young et al.,1984). The greatest proportion of fine juniper roots havebeen found within 0e75 cm soil depths, with greatest densitiesdirectly at the base. Young et al. (1984) observed that root biomasswas lower but abundant and relatively constant at distances between1 and 6 m from the trunk and depths greater than 50 cm, whereas itdecreased with distance from the base at greater depths. Gypsumblocks indicated that juniper will compete with herbaceous vegeta-tion for available soil water above 60 cm before tapping deeper re-sources. This is much as observed for Utah juniper maximizingextraction in shallowsoils early in the season anddrawingdeeper soilwater after shallow strata had been exploited (West et al., 2007a).
Similar to this study, Miller et al. (2000) found that perennialgrasses were low in sensitivity to juniper dominance in plant as-sociations characterized by Idaho fescue, even though shrub andperennial forb cover did decrease. Negative effects of juniper weremore pronounced in shallow soils and the presence of a restrictivehorizon. Once juniper was removed, water use in the understoryincreased to about 70e80% of the seasonal water use estimated forjuniper stands, while total cover increased from 22% to 27%. Otherstudies report similar positive effects of juniper removal on her-baceous cover and production rates (Vaitkus and Eddleman, 1987;Bates et al., 2005, 2007) as well as prolonged seasonal moistureavailability which, in turn, enhanced fall herbaceous growth (Bateset al., 2000; DeBoodt, 2008). Eddleman (2002) found that removingjuniper competition had a positive long-term effect on shrubs.Whereas shrub density and cover in untreated woodlands has beenshown to decline, shrub cover on cut plots steadily increased. Thesetrends indicate that several years of data on understory develop-ment would be necessary to identify functional equilibrium be-tween water use and mature cover.
Continued transpiration at high soil water potentials and criticalwater contents in surface soils is evidence that juniper was capableof extracting considerable soil water from deeper strata. It has beenshown that western and Utah juniper maintain low but constantsap flowwhile leaf water potentials continuously decreasewith soildrying (Bates et al., 2000; Linton et al., 1998; McDowell et al., 2008;Miller and Shultz, 1987; West et al., 2008). Although there is nosingle factor governing leaf conductance in juniper (Miller andShultz, 1987) this study also found sap movement during thesummer was largely and consistently driven by available soil water.Compared to other more drought tolerant conifers, maximum flowrates in juniper are low (Barnes, 1987; West et al., 2008). Sap flowdata for western juniper also suggest that, juniper trees growingunder low moisture stress did not exhibit proportionally higherrates of transpiration compared to trees growing on drier sites.
At thewatershed scale juniper removal has been shown to have apronounced influence on sub-surface hydrology and consequentlyincreased late season water availability (DeBoodt, 2008). This studyfound no direct evidence that juniper removal decreased seasonal
soil water use during the summer (Table 3) but did suggest that adegree of water availability was prolonged after juniper cutting. Theproportion of the annual precipitation not accounted for in theabsence of juniper must be a source of deep percolation thateventually feeds sub-surface vertical and lateral runoff during thecool-season when soils are closer to saturation and transpirationaldemand is low. Resolving cool seasonwater use and local sources ofrun-off would connect effects of juniper removal with subsurfacewater yield locally and will help further explain increased wateravailability observed at the watershed-scale.
5. Conclusion
With two years of study and one full year of post-treatment datait became evident that extractable water in the top 60 cm of soil isaffected by current and recent history of occupation by plants. At thelocal scale juniper removal resulted in greater over-winter accu-mulation of soil water due to greater recharge following decreasedtranspiration and interception rates. Additional available wateraccrued was readily utilized by released understory vegetation. Thecomplementary role of trees and herbaceous cover explains thesmall differences in water use during the summer months whenjuniper woodlands are converted to shrub-grassland cover. Junipersuccessfully competes with herbaceous vegetation for available soilwater in the upper profile and is likely the dominant and perhapsonly influence at greater depth. Juniper appears likely to maintaindeep soil water in a depleted state except where local conditions,such as snowdrifts, lead to deep percolation during winter months.Soil water wasmeasurably higher in absence of juniper at the end ofthe growing season, and was available to late seasonal species ofherbs and shrubs hence, fall growth. However, case studies areneeded at both local and at thewatershed scale (e.g. DeBoodt, 2008)to evaluate the impacts of ecosystem recovery or successionalchanges on long-term trends in total deficits and potential soil watercapture and storage, especially during winter months.
Acknowledgments
The project was funded through Oregon State University,particularly the Department of Rangeland Ecology and Manage-ment and the Department of Forest Engineering, Resources andServices and was further supported by the McCormack Ranch andthe Starker Forest. Data logger equipment and support for sap flowmethodology was provided by the H.J. Andrews Airshed Project,Rick Meinzer and David Woodruff from the PNW Research Stationin Corvallis.
References
Anderson, E.W., Borman, M.M., Krueger, W.C., 1998. The Ecological Provinces ofOregon: a Treatise on the Basic Ecological Geography of the State. OregonAgricultural Experiment Station. SR 990, Corvallis, Oregon, USA.
Barnes, F.J., 1986. Carbon Gain and Water Relations in Pinyon-juniper Habitat Types(Ph.D. dissertation). New Mexico State University, Las Cruces, NM.
Bates, J.D., Miller, R.F., Svejcar, T.J., 2000. Understory dynamics in cut and uncutwestern juniper woodlands. J. Range Manag. 53, 119e126.
Bates, J.D., Miller, R.F., Svejcar, T., 2005. Long-term successional trends followingwestern juniper cutting. Rangeland Ecol. Manag. 58, 533e541.
Bates, J.D., Svejcar, T., Miller, R., 2007. Litter decomposition in juniper woodlands.J. Arid Environ. 70, 222e236.
Bedell, T.E., Eddleman, L.E., Deboodt, T., Jacks, C., 1993. Western Juniper e Its Impactand Management in Oregon Rangelands. Oregon State University ExtensionService, Corvallis, Oregon, USA.
Belsky, A.J., 1996. Viewpoint: western juniper expansion: is it a threat to aridnorthwestern ecosystems? J. Range Manag. 49 (1), 53e59.
Buckhouse, J.C., Mattison, J.L., 1980. Potential soil erosion of selected habitat types inthe high desert region of central Oregon. J. Range Manag. 33, 282e285.
Bureau of Land Management, 1994. Burns District Planning Update. BLM/OR/WA/PL-94/8e1792.

C. Mollnau et al. / Journal of Arid Environments 102 (2014) 117e126126
Campbell Scientific, 1999. Instruction Manual. Model 223 Delmhorst Cylindrical SoilMoisture Block. Campbell Scientific Inc, Logan, Utah.
�Cermák, J., Ku�cera, J., Nadezhdina, N., 2004. Sap flow measurements with somethermodynamic methods, flow integration within trees and scaling up fromsample trees to entire forest stands. Trees Struct. Funct. 18, 529e546.
Clearwater, M.J., Meinzer, F.C., Andrade, J.L., Goldstein, G., Holbrook, N.M., 1999.Potential errors in measurement of nonuniform sap flow using heat dissipationprobes. Tree Physiol. 19, 681e687.
DeBoodt, T.L., 2008. Watershed Response to Western Juniper Control (dissertation).Oregon State University, Corvallis, p. 140.
Eddleman, L.E., 1984. Ecological Studies on Western Juniper in Central Oregon. In:Western Juniper Management Short Course. Oregon State University ExtensionServices and the Department of Rangeland Resources, Oregon State University,Corvallis, pp. 27e35.
Eddleman, L.E., 2002. Long Term Vegetation Changes With and Without JuniperControl. In: Research in Rangeland Management: Management of Western Ju-niper Rangelands. Department of Rangeland Ecology and Management, Cor-vallis, Oregon, pp. 27e35.
Eddleman, L.E., Miller, R.F., Miller, P.M., Dysart, P.L., 1994. Western Juniper Wood-lands of the Pacific Northwest: Science Assessment. Department of RangelandResources, Oregon State University, Corvallis, Oregon. http://www.icbemp.gov/science/eddleman.pdf.
Granier, A., 1985. A new method of sap flow measurement in tree stems (Unenouvelle méthode pour la mesure du flux de sève brute dans le tronc desarbres). Ann. Sci. For. 42, 193e200.
Granier, A., 1987. Evaluation of transpiration in a Douglas-fir stand by means of sapflow measurements. Tree Physiol. 3, 309e319.
Granier, A., Bréda, N., 1996. Modelling canopy conductance and stand transpirationof an oak forest from sap flow measurements. Ann. Sci. For. 53, 537e546.
Granier, A., Biron, P., Bréda, N., Pontailler, J.Y., Saugier, B., 1996. Transpiration of treesand forest stands: short and long-term monitoring using sapflow methods.Glob. Chang. Biol. 2, 265e274.
ISO 11465, 1993. Soil Quality e Determination of Dry Matter andWater Content on aMass Basis e Gravimetric Method. International Organization for Standardiza-tion, Geneva, Switzerland, p. 3. Available at: www.iso.ch.
James, S.A., Clearwater, M.J., Meinzer, F.C., Goldstein, G., 2002. Heat dissipationsensors of variable length for the measurement of sap flow in trees with deepsapwood. Tree Physiol. 22, 277e283.
Köstner, B., Granier, A., Cermák, J., 1998. Sapflow measurements in forest stands:methods and uncertainties. Ann. Sci. For. Acta Bot. Sin 46, 631e646.
LaMalfa, E.M., Ryel, R.J., 2008. Differential snowpack accumulation and water dy-namics in aspen and conifer communities: implication for water yield andecosystem function. Ecosystems 11, 569e581.
Larsen, R.E., 1993. Interception and Water Holding Capacity of Western Juniper(dissertation). Oregon State University, Corvallis.
Linton, M.J., Sperry, J.S., Williams, D.G., 1998. Limits to water transport in Juniperusosteosperma and Pinus edulis: implications for drought tolerance and regula-tion of transpiration. Funct. Ecol. 12, 906e911.
Lu, P., 1997. A direct method for estimating the average sap flux density using amodified Granier measuring system. Aust. J. Plant Physiol. 24, 701e705.
Lu, P., Urban, L., Ping, Z., 2004. Granier’s thermal dissipation probe (TDP)method for measuring sap flow in trees: theory and practice. Acta Bot. Sin46, 631e646.
McDowell, N.G., White, S., Pockman, W.T., 2008. Transpiration and stomatalconductance across a steep climate gradient in the southern Rocky Mountains.Ecohydrology 1, 193e204.
Miller, R.F., Rose, J.R., 1995. Historic expansion of Juniperus occidentalis in south-eastern Oregon. Great Basin Nat. 55, 37e45.
Miller, R.F., Shultz, L.M., 1987. Water relations and leaf morphology of Juniperusoccidentalis in the northern Great Basin. For. Sci. 33, 690e706.
Miller, R.F., Wigand, P.E., 1994. Holocene changes in semiarid pinyon-juniperwoodlands. Bioscience 44, 465e473.
Miller, R.F., Svejcar, T.J., Rose, J.A., 2000. Impacts of western juniper on plant com-munity composition and structure. J. Range Manag. 53, 574e585.
Miller, R.F., Bates, J.D., Svejcar, T.J., Pierson, F.B., Eddleman, L.E., 2005. Biology,Ecology, and Management of Western Juniper. In: Technical Bulletin 152. Ore-gon State University Agricultural Experiment Station, p. 77.
Newton, M., Preest, D.S., 1988. Growth and water relations of Douglas-fir (Pseu-dotsuga menziesii) seedlings under different weed control regimes. Weed Sci.36, 653e662.
NRCS Ecological Site Description Site, 2008. http://esis.sc.egov.usda.gov.Pierson, F.B., Bates, J.D., Svejcar, T.J., Hardegree, S., 2007. Runoff and erosion after
cutting western juniper. Range Ecol. Manag. 60, 285e292.United States Department of Interior Bureau of Land Management, 1999. Sampling
Vegetation Attributes. BLM Tech. Ref. 1734e4. National Business Center, Denver,p. 158.
Vaitkus, M.R., Eddleman, L.E., 1987. Composition and productivity of a westernjuniper understory and its response to canopy removal. In: Everett, R.L.(Ed.), Proceedings: Piñon-juniper Conference. USDA Forest Service,pp. 456e460.
West, A., Hultine, K., Burtch, K., Ehleringer, J., 2007a. Seasonal variations in moistureuse in a piñonejuniper woodland. Oecologia 153, 787e798.
West, A.G., Hultine, K.R., Sperry, J.S., Bush, S.E., Ehleringer, J.R., 2008. Transpirationand hydraulic strategies in a piñon-juniper woodland. Ecol. Appl. 18, 911e927.
Whalen, A., 2006. Are Juniper Trees Loving Oregon to Death?. http://egov.oregon.gov/ODF/AGENCY_AFFAIRS/Juniper_Story.shtml.
Woods, S.W., Ahl, R., Sappington, J., McCaughey, W., 2006. Snow accumulation inthinned lodgepole pine stands. For. Ecol. Manag. 235, 202e211.
Young, J.A., Evans, R.A., Easi, D.A., 1984. Stem flow on western juniper (Juniperusoccidentalis) trees. Weed Sci. 32, 320e327.