soil & water conservation society of metro...
TRANSCRIPT
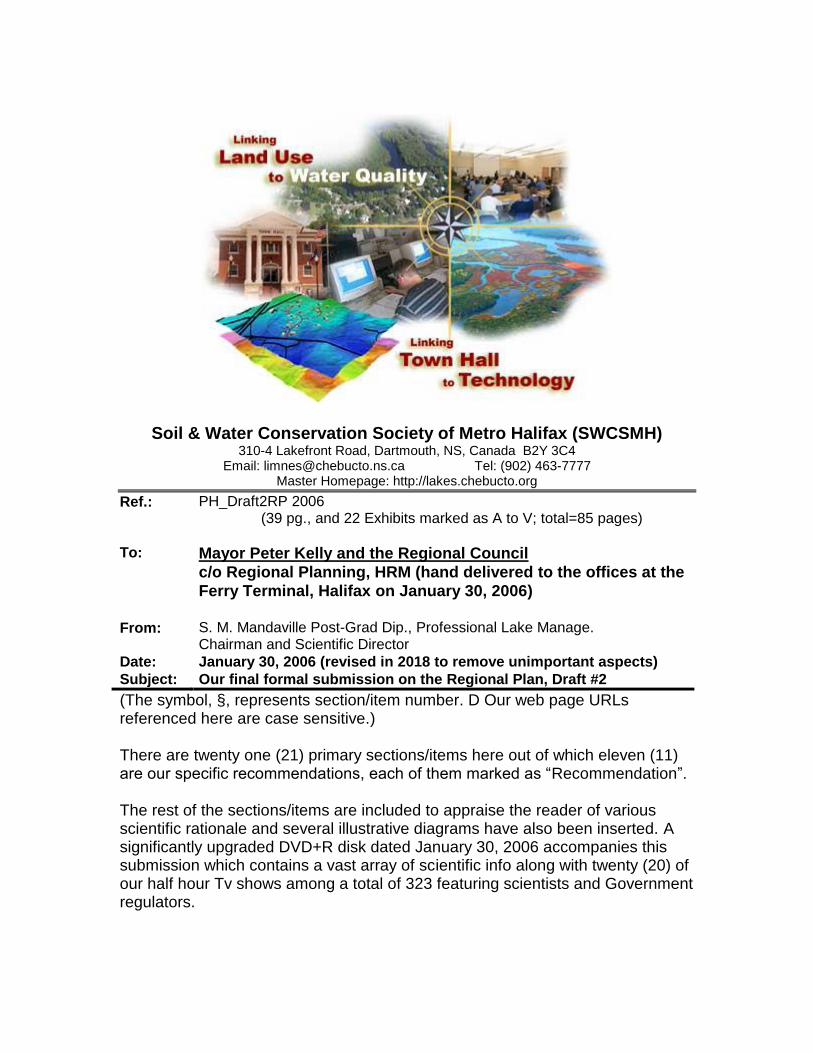
Soil amp Water Conservation Society of Metro Halifax (SWCSMH) 310-4 Lakefront Road Dartmouth NS Canada B2Y 3C4
Email limneschebuctonsca Tel (902) 463-7777 Master Homepage httplakeschebuctoorg
Ref PH_Draft2RP 2006 (39 pg and 22 Exhibits marked as A to V total=85 pages)
To Mayor Peter Kelly and the Regional Council
co Regional Planning HRM (hand delivered to the offices at the
Ferry Terminal Halifax on January 30 2006)
From S M Mandaville Post-Grad Dip Professional Lake Manage
Chairman and Scientific Director
Date January 30 2006 (revised in 2018 to remove unimportant aspects)
Subject Our final formal submission on the Regional Plan Draft 2
(The symbol sect represents sectionitem number D Our web page URLs referenced here are case sensitive) There are twenty one (21) primary sectionsitems here out of which eleven (11) are our specific recommendations each of them marked as ldquoRecommendationrdquo The rest of the sectionsitems are included to appraise the reader of various scientific rationale and several illustrative diagrams have also been inserted A significantly upgraded DVD+R disk dated January 30 2006 accompanies this submission which contains a vast array of scientific info along with twenty (20) of our half hour Tv shows among a total of 323 featuring scientists and Government regulators
Our final formal submission on the Regional Plan Draft 2 Ref PH_Draft2RP2006 January 30 2006 Page 2 (of 85)
We request the HRM implement our specific recommendations with no further delay especially since the Regional Plan has several statements stating the intent to protect lakes but the plan is very poor in specifics We had indeed made similar written recommendations on numerous occasions before
Sectionitem Table of Contents Page
1 Overview and Introduction 7
11 Our extensive submissions to HRM The scientific component of
the plan is poor and has little relevance to protecting as well as restoring lakes 7
12 Our directindirect contributions to the HRM including its formal municipal units (see also Exhibit-K) 8
2 Recommendation Set up a Lakes Authority staffed with two qualified
applied limnologists (also see sect16 and Exhibits- C amp D) 9
21 Significant shortcomings in consultantsrsquo reports further staff has never carried out scientific analyses (see also Exhibits- A amp B) 10
22 The specialty of applied (practical) limnology (science of freshwaters) see also Exhibit-K 10
3 Recommendation Consultations regarding lake and river
management should not be confined to municipal advisory boards and
other appointees alone 11
4 Recommendation Mandate the requirement of studies by `qualified
limnologistsrsquo where lakes are located at outfalls or downstream of outfalls 12
5 Recommendation Lake water sampling and the futility to track the
incremental impacts of new developments especially in shallow andor
dystrophic lakes (see also sect18) 12
6 Recommendation The CCMEs policy on cultural eutrophication
should be strictly enforced by HRM (also see sect18) 13
7 Chemical vs Biological monitoring in limnology (Exhibits- I amp J) 16
8 Recommendation Enact a Lawn Fertilizer Bylaw restricting use of
phosphorus containing fertilizers similar to the City of Minneapolis
(Exhibit-E) 17
Our final formal submission on the Regional Plan Draft 2 Ref PH_Draft2RP2006 January 30 2006 Page 3 (of 85)
9 Recommendation Advanced assessments by qualified limnologists
have to be to be carried out on sewage treatment plants (STP)s prior to
their construction andor to establish the need for upgrading 17
91 Ecological impacts of nutrients (Exhibit-N) 17
92 Investigate the endocrine disrupting compounds (EDCs) in the effluents discharging into lakes and rivers 18
10 Recommendation Mandate total stormwater treatment systems
capable of removing the myriad of post-development stressors not
siltsoils alone in new major developments (Exhibits-Q R S T amp U) 19
101 Constructed Wetlands for stormwater treatment (see also Exhibit-U) 20
11 Recommendation Buffer strips sound technical sizing and
protection in perpetuity and do not allow walkways to be constructed
within such buffers (also see Exhibit-F) 22
12 Recommendation Septic systems abandon the negative
impressions But in new developments aim for a 100-metre setback from
lakes to prevent nutrient enrichment over multi-decadal time scales (see
also sect13 and Exhibit-G) 23
13 Marine biotoxins and severe misconceptions at HRM 25
14 Marine inlets- Eutrophication research conducted by scientists at the
BIO-DFO (Exhibit-H) 26
15 Recommendation Carry out Bacterial Source Tracking (BST) before
making public statements on the fecal sources 28
16 Lake Carrying Capacities (LCCrsquos)- History at the HRM and at the
former Halifax County (also see sect6 and Exhibits- C amp D) 29
161 Predictive modelling for a multitude of parameters but focus here on the basic phosphorus modelling 29
1611 Over one thousand (1000) lakesponds within and adjacent to HRM have already been modelled by this signatory 30
162 Experience at HRM (Papermill Lake proposal Exhibit-C) 30
163 Experience at former Halifax County (Exhibit-D) 30
Our final formal submission on the Regional Plan Draft 2 Ref PH_Draft2RP2006 January 30 2006 Page 4 (of 85)
17 Limnology- selections 31
171 Primary production 31
172 Shallow Lakes 32
173 Typology of (northern) lakes based on metabolic balance and ecosystem stoichiometry 32
174 The first ever 5-year (2002-2007) paleolimnology of lakes within HRM (Exhibit-V) and a cautionary note 34
1741 An example of their research- Russell Lake Dartmouth 34
1742 Cautionary note 34
18 Scientific definition of trophic status and most are making significant
errors (see also Exhibit-B) 36
181 Shortcomings of the Fixed Boundary approach and Vollenweiders dictum on the OECD Probability Distribution Diagrams (Exhibit-L) 36
182 Example of an application of the OECD Probability Distribution Diagrams for lakes in HRM (Exhibit-M) 37
19 Phosphorus analytical inaccuracies (see also Exhibit-P) 38
20 Power boats on shallow lakes (Exhibit-O) 39
21 Effects of Golf Course Construction and Operation on the Aquatic
Environment 39
22 Exhibit-A (1 page) Sandy Lake (Hammonds Plains) model 40
23 Exhibit-B (6 pages) Scientific shortcomings in consultant reports 41
24 Exhibit-C (3 pages) Papermill Lake proposal 47
25 Exhibit-D (2 pages) St Margarets Bay plan area 50
26 Exhibit-E (3 pages) Minneapolis City Chapter 55 Lawn Fertilizer
Bylaw 52
27 Exhibit-F (2 pages) Environment Canadarsquos report on 100m and 250m
corridors around streams 55
Our final formal submission on the Regional Plan Draft 2 Ref PH_Draft2RP2006 January 30 2006 Page 5 (of 85)
28 Exhibit-G (2 pages) Monitoring of the effluent plume from an onsite
sewage disposal system 57
29 Exhibit-H (2 pages) Marine inlets 59
30 Exhibit-I (2 pages) Freshwater Benthic Ecology and Aquatic
Entomology 61
31 Exhibit-J (1 page) Chironomid mouthpart deformity frequencies as an
indicator of community health 63
32 Exhibit-K (1 page) Premier John Hammrsquos admission of the lack of any
limnologists on the staff of the NSEL 64
33 Exhibit-L (4 pages) Probability distribution diagrams 65
331 (Exhibit-L1) Probability distribution curve for yearly average lake phosphorus 65
332 (Exhibit-L2) Probability distribution curve for yearly average lake chlorophyll a 66
333 (Exhibit-L3) Probability distribution curve for yearly peak lake chlorophyll a 67
334 (Exhibit-L4) Probability distribution curve for yearly average lake Secchi disk transparency 68
34 Exhibit-M (1 page) Example of an application of the OECD Probability
Distribution Diagrams for lakes in HRM 69
35 Exhibit-N (2 pages) A lead example of the methodology to assess the
downstream impacts of a proposed STP (only 2 pages of the paper are
inserted) 70
36 Exhibit-O (2 pages) Power boats on shallow lakes 72
37 Exhibit-P (2 pages) Phosphorus analytical inaccuracies 74
38 Exhibit-Q (1 page) Street Surface Pollutants associated with various
particle sizes 76
39 Exhibit-R (4 pages) Toxicants found in Priority Pollutant Scans 77
40 Exhibit-S (1 page) Removal of Gross Pollutants From Stormwater
Runoff Using LiquidSolid Separation Structures for four in-situ
technologies 81
Our final formal submission on the Regional Plan Draft 2 Ref PH_Draft2RP2006 January 30 2006 Page 6 (of 85)
41 Exhibit-T (1 page) Integrating Constructed Wetlands With Stormwater
Management (cf Wong et al 1999) 82
42 Exhibit-U (2 pages) Location of wetlands researched and comparison
of reported removal rates for constructed and natural stormwater wetlands
(cf Strecker et al 1992) 83
43 Exhibit-V (1 page) Excerpts from the TEAMs websites on
paleolimnology 85
Our final formal submission on the Regional Plan Draft 2 Ref PH_Draft2RP2006 January 30 2006 Page 7 (of 85)
1 Overview and Introduction
We are a scientific society specializing in the Biotic Integrity and Biodiversity of freshwaters and parts of the marine ecosystems We have received international accolades for our work An upgraded DVD+R disk dated January 30 2006 accompanies this submission which contains a vast array of scientific info along with twenty (20) of our half hour Tv shows among a total of 323 featuring scientists and Government regulators The disk is formatted for use only on a DVD reader attached to a computer hence even the Tv shows have to be viewed on a computer monitor only you cannot view them on a typical DVD player Photos of a handful of leading scientists have been inserted here in celebration of their world class achievements which resulted in extensive benefits to all species inclusive of to homo sapiens sect12 has info on our major contributions to the HRM inclusive of to its hired consultants (and its academic subcontractors) numerous citizens and stakeholder groups Our membersassociates are mostly domiciled all over HRM Our team has some of the leading scientists in limnology (ie freshwater sciences) molecular biology (eg DNA fecal source tracking) medical microbiology and environmental engineering Some of these have received coveted scientific awards and are widely published Select among them have published advanced textbooks which are used at universities worldwide A few of them are domiciled in other parts of Canada and in four states of the USA
11 Our extensive submissions to HRM The scientific
component of the plan is poor and has little relevance to
protecting as well as restoring lakes We had made several submissions directly to the Regional Planning staff and supplied them with three former versions of our DVD+R disks During the public meeting held at the Michael Wallace Elementary School in Port Wallace on May 20 2004 this signatory raised the question of applied (ie practical) limnology and lake management HRMrsquos staff refused to go into the discussion although there was a lot of time since the meeting had poor attendance by the general public We were also in attendance at the extensive workshop at the Dartmouth High
School on June 06 2005 Staff had a long list of issues to be discussed and professional limnology was nowhere in it
Our final formal submission on the Regional Plan Draft 2 Ref PH_Draft2RP2006 January 30 2006 Page 8 (of 85)
Back in early year-2002 we had requested senior manager Ms Anne Muecke
MCIP to organize intense round table discussions in professional limnology and lake management There was no follow up at all
12 Our directindirect contributions to the HRM including its
formal municipal units
(see also Exhibit-K) We received around sixty (60) unsolicited emails and detailed phone calls from present and former staff of the HRM (inclusive of the formal municipal units) consulting us on a variety of science related aspects as well as asking for our donations of scientific literature and models Example emails can be found in the accompanying DVD+R disk under ldquoOur dealings with Government agenciesrdquo This signatory co-operated as much as possible and you can obtain an overview from the 5-page letter that we sent His Worship These do not include discussions generated as a result of our inquiries though Further we continuously receive requests for information from numerous stakeholders all over HRM from the local academia who work andor associated with them as well as on occasions from your own consultants
Our final formal submission on the Regional Plan Draft 2 Ref PH_Draft2RP2006 January 30 2006 Page 9 (of 85)
2 Recommendation Set up a Lakes Authority staffed with
two qualified applied limnologists
(also see sect16 and Exhibits- C amp D) Pragmatic lake management has rarely been the focus of either the HRM or of its previous municipal units some negative results are evident by advanced chemical and biological limnology datareports of ours and of other researchers Expenditure of large amount of public funds on consultants as recommended in the Regional Plan and by staff at meetings is totally futile as proven by significant failures spanning the last two (2) decades (Exhibit-B) If HRM hired applied (ie practical) limnologists then staff could carry out in-house lake and river monitoring both in chemical as well as in the more important biological limnology (sect7) prepare follow-up scientific studies and issue summaries as well as act in the capacity as a scientific scrutinizer when consultants submit data and reports to the HRM At present there are no staff members who carry out any limnological investigations This function would also include development of lake carrying capacities (LCCrsquos) prior to signing of developmentcontract agreements staff has been including such a requirement as part of certain development agreements (DArsquos) but that is not the ethical way (see sect16) In other jurisdictions in Ontario Quebec Sweden and in Kings County (NS) the LCCrsquos were developed in-house with some external scientific assistance This should have been carried out in the HRM area over the last 20 years but it is still not too late to follow the CCME and Environment Canadarsquos narratives for some subwatersheds where major developments are imminent (see also sect6)
Our final formal submission on the Regional Plan Draft 2 Ref PH_Draft2RP2006 January 30 2006 Page 10 (of 85)
21 Significant shortcomings in consultantsrsquo reports further
staff has never carried out scientific analyses
(see also Exhibits- A amp B) Indeed it was `yours trulyrsquo who filled that function and carried out scientific analyses to a considerable extent as a volunteer for an overview read the enclosure marked as Exhibit-B a 6-page letter that we had written the EMS Dept on February 22 2005 enunciating case histories Also peruse the graphical model that I developed for Sandy Lake Hammonds Plains as a major example included here as Exhibit-A Staff had a considerable amount of data supplied by the developerrsquos consultants but they did nothing with it The only (modelling) data marked as `Thrsquo belongs to this writer It is quite obvious how rapidly Sandy Lake underwent cultural enrichment in just three (3) years a process which may never have occurred in nature even in a thousand years I had published the conglomerate model in an international lakes discussion group and the respondents were literally shocked that this transpired in the first world which is usually a symptom of the third world
22 The specialty of applied (practical) limnology (science of
freshwaters) see also Exhibit-K Professional accreditation in this domain can be obtained from a handful of independent scientific societies in North America and Europe There has never been staff that addressed and solved any significant complaints from lake stakeholders indeed staff has approached `yours trulyrsquo on important issues for info and advice (see sect12) Do not rely on the Nova Scotia Department of Environment amp Labour (NSEL) either where there are no practicing andor accredited applied limnologists on staff either as gracefully admitted by Premier John Hamm MD (Exhibit-K) We had made a strong appeal on this to the Regional Council on August 21 2001 staff had responded positively to you on September 19 2001 but the HRM has not acted on it to date see staffrsquos response in our URL (httplakeschebuctoorgHRMHISTORYlakes_authorityhtmlstaff)
Our final formal submission on the Regional Plan Draft 2 Ref PH_Draft2RP2006 January 30 2006 Page 11 (of 85)
3 Recommendation Consultations regarding lake and river
management should not be confined to municipal
advisory boards and other appointees alone We request that you enshrine the enlightened tenets of the North American Lake Management Society (NALMS) which we summarized in the web page titled ldquoCommunity goals- Lake and River managementldquo with the URL of (httplakeschebuctoorgINFOSTEWARDSHIPcommunitygoalshtml) Dr Tony Blouin of HRM and Mr Darrell Taylor (Environmental Analyst) of the NSEL are indeed members of the NALMS The NS Environment Act clearly states that all natural lakes and rivers are owned by the general public The whole aspect of professional lake management is quite specialized and should not be restricted to advisory boards further the boards have never conducted any research in advanced limnology inclusive of benthology and phycology Hence how can HRM rely exclusively on such boards The public also includes some leading scientists who could be of some assistance to the HRM By involving the public even in making scientific decisions HRM will be able to develop genuine and effective partnerships
Our final formal submission on the Regional Plan Draft 2 Ref PH_Draft2RP2006 January 30 2006 Page 12 (of 85)
4 Recommendation Mandate the requirement of studies
by `qualified limnologistsrsquo where lakes are located at
outfalls or downstream of outfalls It is indeed recommended in Section V2 of the Storm Drainage Works Approval Policy (SDWAP) of the NS Dept of Environment amp Labour (NSEL) Such an enlightened requirement is nowhere to be seen in any of the planning documents or contract requirements of HRM Even prior to the Province adopting the SDWAP policy on December 10 2002 pure common sense would have dictated that the specialty of freshwaters vests primarily in the professional discipline of Limnology in the same fashion that designing of sewers streets etc vests in professional civilenvironmental engineers But HRM has never recognized this dire need
5 Recommendation Lake water sampling and the futility to
track the incremental impacts of new developments
especially in shallow andor coloured lakes
(see also sect18) The majority of lakes within HRM are shallow andor coloured In such lakes the standard limnetic (ie open-water or pelagic) trophic parameters may not represent the true trophic status of the lake See sect18 for more info The limnetic parameters may not reflect changes in the watershed unless those changes are significant in relationship to the overall size of the watershed andor in its prevailing inputs To reliably ascertain incremental inputs from new developments outflows of every storm pipe outlet in-situ devices (eg CDS Stormceptor or Vortechnics) constructed wetlands outlets and others have to be monitored almost on an hourly basis during runoff and pollutographs have to be developed Hence the large amount of public funds that HRM plans to expend on regular limnetic sampling may be an utter waste as the historical archives have already proven (Exhibit-B)
Our final formal submission on the Regional Plan Draft 2 Ref PH_Draft2RP2006 January 30 2006 Page 13 (of 85)
6 Recommendation The CCMEs policy on cultural
eutrophication should be strictly enforced by HRM
(also see sect18)
It is stressed at this point that the CCME endorses a no
degradation policy and that these values therefore do not
provide and must not be used as pollute up to levels (see
page 56 in
httplakeschebuctoorgDATAPARAMETERSTPccmepdf)
The year-2004 CCME Policy on Phosphorus (TP) clearly narrates that not adhering to the referencebackground (ie the natural pre-development value) + 50 maximum increase concept even if they fall within the reference trigger ranges could result in significant changes to the `COMMUNITY STRUCTURE References Canadian Council of Ministers of the Environment 2004 Canadian water quality
guidelines for the protection of aquatic life Phosphorus Canadian Guidance Framework for the Management of Freshwater Systems In Canadian environmental quality guidelines 2004 Canadian Council of Ministers of the Environment Winnipeg
Environment Canada 2004 Canadian Guidance Framework for the
Management of Phosphorus in Freshwater Systems Ecosystem Health Science-based Solutions Report No 1-8 National Guidelines and Standards Office Water Policy and Coordination Directorate Environment Canada pp 114
[httplakeschebuctoorgDATAPARAMETERSTPpopuphtml) has more info]
Our final formal submission on the Regional Plan Draft 2 Ref PH_Draft2RP2006 January 30 2006 Page 14 (of 85)
Our final formal submission on the Regional Plan Draft 2 Ref PH_Draft2RP2006 January 30 2006 Page 15 (of 85)
Our final formal submission on the Regional Plan Draft 2 Ref PH_Draft2RP2006 January 30 2006 Page 16 (of 85)
7 Chemical vs Biological monitoring in limnology
(Exhibits- I amp J)
Chemical measurements are like taking snapshots of the ecosystem
whereas biological measurements are like making a videotape (David M Rosenberg PhD Univ of Manitoba and the Freshwater Institute DFO
Winnipeg and lead author of the EMAN Protocol cf Bull Entomol Soc Can 1998 30(4)144-152)
By ignoring the all important chemical limnology the majority of studies carried out to date for HRM as well as for its former municipal units have failed to accurately describe the symptoms and to prevent the problems (Exhibit-B) Pollution is a semi-nebulous term used to describe changes in the physical chemical or biological characteristics of water air or soil that can affect the health survival or activities of living entities Organisms respond to pollution usually in one of two ways acutely or chronically Acute effects result in serious injury to or death of the organism shortly after exposure to high concentrations of a pollutant Chronic effects are realized following exposure to low concentrations of a pollutant the results of which appear over time often as serious diseases (eg cancers) helliphelliphelliphellipWilliams D D and Feltmate BW 1992 Aquatic Insects CAB International
ISBN 0-85198-782-6 xiii 358p
Exhibit-I is a listing of our web pages in Freshwater Benthic Ecology and Aquatic Entomology and Exhibit-J is a pictorial on Chironomid mouthpart deformity frequencies as an indicator of community health Our scientific team specializes in the aforesaid and we have been conducting extensive biological monitoring of lakes all over HRM some of our reports are in the public domain (cf httplakeschebuctoorgstudieshtml)
One of the leading experts in this domain is Prof Dr Gerrie Mackie of the University of Guelph and a co-Chair of the federal SARA his year-2004 interactive textbook published by the KendallHunt Publishing Company is a `must readrsquo (httplakeschebuctoorgreferenchtmlmackie2004)
Our final formal submission on the Regional Plan Draft 2 Ref PH_Draft2RP2006 January 30 2006 Page 17 (of 85)
8 Recommendation Enact a Lawn Fertilizer Bylaw
restricting use of phosphorus containing fertilizers
similar to the City of Minneapolis (Exhibit-E) We had submitted the bylaw to staff some time ago Without any further delay enact a Lawn Fertilizer bylaw similar or superior to that of the Minneapolis Cityrsquos bylaw this bylaw essentially prohibits application of phosphorus containing fertilizers with exceptions where soil tests prove the need This bylaw has received international accolades among the lake management and limnological community
9 Recommendation Advanced assessments by qualified
limnologists have to be to be carried out on sewage
treatment plants (STP)s prior to their construction andor
to establish the need for upgrading This specialized discipline is not the routine civilenvironmental engineering
91 Ecological impacts of nutrients (Exhibit-N) A leading example of the methodology to be followed is that illustrated in Exhibit-N as proposed by Dr Joe Kerekes Scientist-Emeritus with Environment Canada Atlantic Dartmouth Dr Kerekes was also one of the leading scientists who headed the international OECD (Organization for Economic Co-Operation amp Development) peer consensus standards-development which are the backbone of the Federal CCME policy on phosphorus management Essentially in the published paper (Exhibit-N) Dr Kerekes carries out an intensive scientific analysis of the impact of a proposed secondary-level package STP prior to its installation at a development site which drains into Freshwater Lake Cape Breton Highlands National Park He warns against secondary treatment as that would result in the Freshwater Lake becoming `Mesotrophicrsquo its management objective being `Oligotrophy [For the complete paper see our web page (httplakeschebuctoorgTPMODELSNOTESkerekes_1983html)]
Our final formal submission on the Regional Plan Draft 2 Ref PH_Draft2RP2006 January 30 2006 Page 18 (of 85)
92 Investigate the endocrine disrupting compounds (EDCs)
in the effluents discharging into lakes and rivers Carry out scientifically defensible and peer reviewed assessments of the EDCs at the outlet of STPs draining into lakes and rivers One of the most sensitive and common tools used to assess exposure to endocrine disrupting chemicals with estrogenic activity is the presence of vitellogenin (VTG) an egg yolk protein precursor in the plasma of male fish Recent studies worldwide have shown elevated plasma VTG in male fish downstream of sewage treatment plants Considerable evidence exists that aquatic organisms are being exposed to and impacted by a wide range of compounds that mimic hormones Fish exposed to these compounds often exhibit an array of responses including depressed circulating sex steroid levels reduced gonad size and fecundity and males have become feminized Because many EDCs can only be partially removed with conventional water treatment systems there is a need to evaluate alternative treatment processes The polychromatic medium-pressure (MP) UV radiation source was more effective for direct photolysis degradation as compared to conventional low-pressure (LP) UV lamps emitting monochromatic UV 254 nm radiation However in all cases the EDCs were more effectively degraded utilizing UVH2O2 advanced oxidation as compared to direct UV photolysis treatment) A good overall reference is- Rosenfeldt EJ and Linden KG 2004 Degradation of Endocrine Disrupting
Chemicals Bisphenol A Ethinyl Estradiol and Estradiol during UV Photolysis and Advanced Oxidation Processes Environ Sci Technol 38(20)5476-5483
Our final formal submission on the Regional Plan Draft 2 Ref PH_Draft2RP2006 January 30 2006 Page 19 (of 85)
10 Recommendation Mandate total stormwater treatment
systems capable of removing the myriad of post-
development stressors not siltsoils alone in new major
developments (Exhibits-Q R S T amp U) [Reference httplakeschebuctoorgSWTpollutantshtml for Typical pollutants in stormwater runoff and httplakeschebuctoorgSWTtreatmenthtml for Treatment of stormwater runoffrdquo] There are no proven total stormwater treatment systems anywhere within the urban or suburban areas of HRM The post-development stressors (or pollutants) entering our sensitive waterways are varied and multifaceted The pollutants are generated after occupation of the watershed by the end users Exhibit-Q lists street surface pollutants associated with various particle sizes from an extensive nationwide study conducted for the USEPA in 1992 Exhibit-R (4 pages) is a listing of toxicants found in priority pollutant scans from a latter study in 1993 ldquoLaser particle sizing has also indicated that a considerable proportion of the particulates in road runoff are less than 10 μm (microns) This size fraction is difficult to capture in current stormwater pollution control devices and has been shown to contain significant quantities of heavy metals which are of concern in aquatic ecosystems Exhibit-S has two scans covering the removal of gross pollutants from stormwater runoff using liquidsolid separation structures for four in-situ technologies the Stormceptor CDS Vortechnics and the baffle boxes The removal is poor for typical post development stressors A preferable methodology may be to incorporate a pre-treatment technique of pond areas to provide an opportunity for suspended materials to settle out before the flows enter the wetland Other possible options include routing inflows to the wetlands through upstream grass swales oilwater separators heavily vegetated areas (eg thick shallow cattail area) and overland flow areas Such a stormwater management system is depicted in Exhibit-T But it is necessary that the constructed wetland is adequately designed and sized as per the following sect101
Our final formal submission on the Regional Plan Draft 2 Ref PH_Draft2RP2006 January 30 2006 Page 20 (of 85)
101 Constructed Wetlands for stormwater treatment (see also
Exhibit-U) (Strecker EW Kersnar JM Driscoll ED and Horner RR 1992 The Use of
Wetlands for Controlling Stormwater Pollution Technical Advisor Thomas E Davenport US EPA Region V The Terrene Institute iv 66p)
Wetlands are receiving attention as attractive systems for removing pollutants from stormwater surface runoff before the runoff enters downstream lakes streams and other open water bodies Wetlands have long been employed for the treatment of wastewaters from municipal industrial (particularly acid mine drainage) and agricultural sources The US Environmental Protection Agency (EPA) encourages the use of constructed wetlands for water pollution control Exhibit-U (2 pages) has a listing of the wetlands that were researched for their ability to treat stormwater runoff as well as a map of the USA showing their location Some of the constructed wetlands are located in regions with harsher climate andor more intensive snow cover than in Nova Scotia
Several trends were noted First constructed systems were generally found to have a higher average removal performance than natural systems with less variability and second larger wetlands as compared to watershed size also showed the same trend a higher average removal performance
with less variability
Our final formal submission on the Regional Plan Draft 2 Ref PH_Draft2RP2006 January 30 2006 Page 21 (of 85)
People often question whether it is appropriate to use a natural healthy wetland for such purposes The concern is whether the modified flow regime and the accumulation of pollutants will result in undesirable environmental effects A general consensus from the literature is that the use of a healthy natural wetland for stormwater pollution control should be discouraged
Our final formal submission on the Regional Plan Draft 2 Ref PH_Draft2RP2006 January 30 2006 Page 22 (of 85)
11 Recommendation Buffer strips sound technical
sizing and protection in perpetuity and do not allow
walkways to be constructed within such buffers
(also see Exhibit-F) Buffer strips do not remove any appreciable amount of pollutants entering lakes via stormwater discharges But they are of value only if they are maintained in their natural state in perpetuity We request that Regional Council enact a bylaw where walkways are totally banned in buffer strips even if the local community supports such walkways Pollution does not discriminate between developers and the general public The sizing of buffers has to be based on technical factors which have to include at the least slope of the land K (soil erodibility index) and RCN (Runoff Curve
Our final formal submission on the Regional Plan Draft 2 Ref PH_Draft2RP2006 January 30 2006 Page 23 (of 85)
Number) Staffrsquos proposal of emulating the Dept of Natural Resources standards of 20 metres or so is not based on science and is only a generality Alternately follow the precautionary approach as recommended in research by Environment Canada and legislate a minimum buffer of one hundred (100) metres around lakes and rivers where possible for the long term protection (see Exhibit-F)
12 Recommendation Septic systems abandon the
negative impressions But in new developments aim for
a 100-metre setback from lakes to prevent nutrient
enrichment over multi-decadal time scales
(see also sect13 and Exhibit-G)
We submit that past history should not develop a `paranoiarsquo about the future The past (and many of the present) problematic systems may have been in areas served with what are known as ldquoarea bedsrdquo Since around late-1980s the ldquoCONTOUR SYSTEMSrdquo have become a norm in most cases
The contour systems basically involve `lateral spread of the effluent plumersquo
and utilize the reduction capacity of the whole downstream site as opposed
to the old `area bedsrsquo which utilized only the area immediately underneath
the bed We are herewith pleased to insert an email dJanuary 15 2001 that we received in support of our proposal from Engineering Scientist David Pask PEng while he was with the worldrsquos leading Small Flows Clearing House of the United States Environmental Protection Agency (USEPA) at the University of West Virginia It was indeed David Pask who was the inventordeveloper of contour systems which was his graduate project at TUNS in 1983 His primary supervisor was the now retired Prof Dan Thirumurthy PhD PEng and there were several other professors with varied expertise who also assisted David a happy acquaintance of this writer
Our final formal submission on the Regional Plan Draft 2 Ref PH_Draft2RP2006 January 30 2006 Page 24 (of 85)
Several studies conducted for the HRM and for the former Halifax County have made unscientific assumptions regarding septic systems Most of the studies did not provide credible field data to substantiate their claims of malfunction The sampling methodology utilizing piezometers and lysimeters has to be undertaken at statistically valid number of onsite systems for monitoring of the effluent plumes before one can establish failure of the systems (Exhibit-G)
Our final formal submission on the Regional Plan Draft 2 Ref PH_Draft2RP2006 January 30 2006 Page 25 (of 85)
13 Marine biotoxins and severe misconceptions at HRM
Based on statements made at the Regional Council by some councillors and staff especially at the public hearing on May 04 2004 on the Interim Growth Management Strategy Regional Planning - Amendments District 1 2 amp 3 we feel HRM is not doing its homework (we have the video taping from EastLink) Such blame on septic systems and their impact on the marine inlets have also been made by the Regional Planning staff on several occasions they allegedly obtained the info from a general web page of Environment Canada (httpwwwatlecgccaepbfactsheetssfish_wqhtml) If you read the web page in depth you will observe that it points to all potential sources of pollution not just septic systems It enunciates natural biotoxins as well To establish the scientific accuracies this signatory had a long conversation during year-2004 with Mr Amar Menon a scientist with Environment Canada Atlantic Amar did state that he did not have any scientific monitoring to prove that septic systems were the cause indeed he had no data on groundwater plumes down gradient from septic systems at all
Our final formal submission on the Regional Plan Draft 2 Ref PH_Draft2RP2006 January 30 2006 Page 26 (of 85)
14 Marine inlets- Eutrophication research conducted by
scientists at the BIO-DFO (Exhibit-H)
(Strain PM and Yeats PA 1999 The Relationships between Chemical Measures and Potential Predictors of the Eutrophication Status of Inlets Marine Pollution Bulletin Elsevier Science Ltd 38(12)1163-1170)
Some startling revelations ensued and relevant scans are included in Exhibit-H Excerpts from the paper and an email are included below ldquoSamples for these analyses were collected in 34 inlets in eastern Canada The dominant factor (31 of the variance of the dataset) from a principal component analysis of the resulting data was clearly related to eutrophication This factor included phosphate ammonia silicate dissolved oxygen iron and manganese but not cadmium and zinc It was used to rank inlets according to eutrophication Comparisons of these rankings with measures of inlet shape revealed that several measures of the significance of sills were good predictors of the eutrophication status Tidal prism flushing times and other geometric measures were poor predictors of eutrophication Measures of anthropogenic inputs to the inlets were also poor predictors of the eutrophication status apparently natural processes dominate anthropogenic inputs in these inletsrdquo
The following are select excerpts from an email that this signatory received from Dr Peter Strain of BIO in Dartmouth-
ldquoFrom Strain Peter [StrainPmardfo-mpogcca]
Sent Monday May 01 2000 853 AM
To SM Mandaville
Subject RE Thanking you a million and a question
Hi Shalom
gt -----Original Message-----
gt
gt (5) I do have a question wrt your published paper re the EI
gt (Eutrophication Index) in Table 4 on page 1168 Since the EI is
gt defined somewhat different from freshwater indices I like to know how
gt to interpret it
gt
gt For example the EI for Ship Harbour inlet was 587 How does it
gt compare on any standardised scale Or for that matter are there any
gt international (or national ie north temperate) standards for it to
gt start with or does one compare among several inlets
Our final formal submission on the Regional Plan Draft 2 Ref PH_Draft2RP2006 January 30 2006 Page 27 (of 85)
[Strain Peter] Since we were the first to define a eutrophication indicator in this
way the only direct comparisons we can make are to the other inlets in the study
But to try to give some perspective the deepest water in Ship Harbour becomes
almost totally anoxic in the fall - (this is a relatively rare occurrence in marine
inlets in the Maritimes) and has very high nutrients levels (up to 45 uM for NH3
19 uM for PO4 35 uM for Si)
These would be relatively extreme conditions in any temperate setting but still not
nearly as eutrophic as some places in the Baltic or Adriatic
gt (6) I find the statement wrt the anthropogenic inputs being poor
gt indicators as compared to the physical morphology kind of strange
gt though I AM NOT CHALLENGING THAT in the least
[Strain Peter] This was one of the most interesting and surprising results of this
study What it comes down to is the fact that the waste inputs produced by the
modest population densities we have in Nova Scotia are small compared to the
natural fluxes of organic materials and nutrients
Even in Halifax Harbour the perturbations are only just visible as far as nutrient
levels are concerned It also highlights another important difference between lakes
and the coastal marine environment lakes are (almost) closed systems marine
inlets usually exchange water freely through tidal action with waters on the
continental shelf Its only when factors that inhibit tidal mixing between inshore
and offshore waters are important that you can see the impact of anthropogenic
inputs when the wastes are trapped in the inlets This is why sills are so important
and why a eutrophication indicator based on sill geometry works
Cheers
Peterrdquo
Our final formal submission on the Regional Plan Draft 2 Ref PH_Draft2RP2006 January 30 2006 Page 28 (of 85)
15 Recommendation Carry out Bacterial Source Tracking
(BST) before making public statements on the fecal
sources Bacterial Source Tracking (BST) is a state-of-the-art methodology that is being used in advanced jurisdictions to determine the sources of fecal bacteria in environmental samples (eg from human livestock or wildlife origins) BST methodology has been described as having the ability to turn nonpoint sources into point sources BST is also called Microbiological Source Tracking (MST) fecal source tracking or fecal typing
Fecal contamination of aquatic environments afflicts many regions and may carry risks to human health For example human fecal pollution may spread dangerous bacterial and viral pathogens such as hepatitis while other human pathogens such as Cryptosporidium parvum Giardia lamblia Salmonella spp and E coli O157H7 are associated with animal fecal pollution
Further contamination of coastal and inland waters by fecal bacteria results in beach closures that suspend recreation and strike a blow to the economies of beach communities
Often the source of fecal contamination in water cannot be determined For example non-point sources such as failing septic systems overloads at sewage treatment facilities overflows from sanitary sewage pumping stations or flows from sewage pipe breaks may all be candidates In addition the contribution of bacterial pollution stored in sediments and re-suspended during storm events is unknown In order to adequately assess human health risks and develop watershed management plans it is necessary to know the sources of fecal contamination
See our web page with the URL of httplakeschebuctoorgH-2bsthtml for more info Also read the following synopses carried out for the EMS Department Mandaville SM 2002 Bacterial Source Tracking (BST)- A Review Project H-2
Soil amp Water Conservation Society of Metro Halifax X 46p Appendices A to T
Our final formal submission on the Regional Plan Draft 2 Ref PH_Draft2RP2006 January 30 2006 Page 29 (of 85)
16 Lake Carrying Capacities (LCCrsquos)- History at the HRM
and at the former Halifax County
(also see sect6 and Exhibits- C amp D)
161 Predictive modelling for a multitude of parameters but
focus here on the basic phosphorus modelling There are several predictive models available widely in international limnological literature and one can literally model for almost any parameter prior to development post-development is too late As the year-2004 CCME Policy on Phosphorus (TP) clearly narrates that not adhering to the referencebackground (ie the natural pre-development value) + 50 maximum increase concept even if they fall within the reference trigger ranges could result in significant changes to the `COMMUNITY STRUCTURE Basic common sense dictates that the modelling has to be carried out either by regulatory staff if they have the scientific competence and experience or via consultants who are eminently qualified in limnology and lake management This is nothing out of the ordinary LCCrsquos based on phosphorus have indeed been developed as `regulatory toolsrsquo since around the mid-1980s in Ontario and inaround mid-1990s in Kings County right here in Nova Scotia In each case they were developed by staff with varying levels of assistance from research scientists This signatory was consulted on aspects of them by various parties and even our NSEL asked him to carry out an independent assessment of the Kings County methodology several years ago during the tenure of the Hon Robbie Harrison But the task should not be left to consultants working for the proponents (even if they can prove they are genuine limnologists) because of potential conflicts-of-interest If the `proponentsrsquo desire to carry out independent modelling to challenge a regulatory value then it is their prerogative Once HRMrsquos regulators develop an LCC (Lake Carrying Capacity) for ex for Phosphorus then it should be discussed in a publicly advertised meeting
Our final formal submission on the Regional Plan Draft 2 Ref PH_Draft2RP2006 January 30 2006 Page 30 (of 85)
1611 Over one thousand (1000) lakesponds within and
adjacent to HRM have already been modelled by this
signatory See httplakeschebuctoorgTPMODELStpmodelshtml for more info
162 Experience at HRM (Papermill Lake proposal Exhibit-C)
By letters dated July 27 1996 and September 15 1996 addressed to the North West Community Council (NWCC) we had requested that the NWCC mandate a firm policy as ldquoManagement Objective for Paper Mill Lake Bedford= OLIGOTROPHY until the year 2050 AD (at the minimum)rdquo The Bedford Waters Advisory Committee (BWAC) fully supported our proposal At the NWCC meeting of November 28 1996 Councillors Kelly and Mitchell moved that the ldquoprocess commence and that this matter be referred to staffrdquo The motion was put and passed But nothing pragmatic has transpired over almost a whole decade alas
163 Experience at former Halifax County (Exhibit-D) Although staff (Susan Corser MCIP) had strongly supported the PAC had rejected by a tie vote our appeal to have the County set lake carrying capacities (LCCrsquos) for lakesponds within the former districts of 1 amp 3 (St Margaretrsquos Bay Plan area of HRM) HRMrsquos councillors Reg Rankin and David Hendsbee were members of that PAC We had also made similar submissions for the planning strategies of former districts of 14 amp 17 (Shubenacadie Lakes area of HRM) and former districts of 15 18 amp 19 (Hammonds PlainsUpper SackvilleBeaverbank area of HRM) The staff did not address these aspects at all for details see our URL (httplakeschebuctoorgHRMSUBMISSIONSsubmissionshtmlcounty)
Our final formal submission on the Regional Plan Draft 2 Ref PH_Draft2RP2006 January 30 2006 Page 31 (of 85)
17 Limnology- selections Limnology is a discipline that concerns the study of in-land waters (both saline and fresh) specifically lakes ponds and rivers (both natural and manmade) including their biological physical chemical and hydrological aspects Franccedilois-Alphonse Forel (February 2 1841 - August 7 1912) was a Swiss scientist who pioneered the study of lakes and is thus considered the founder of limnology Born in Morges on Lake Geneva he worked as a professor of medicine at the University of Lausanne But his real love was the lake his investigations of biology chemistry water circulation and sedimentation and most importantly their interactions established the foundation of a new discipline In his chief work Le Leacuteman published in three volumes between 1892 and 1904 he named his activity limnology in analogy with oceanography (limnography could have been confused with the limnograph which measures water level in lakes) He discovered the phenomenon of density currents in lakes and explained seiches the rhythmic oscillations observed in enclosed waters
171 Primary production All sound lake management must be based on knowledge of the processes andor mass-and energy flows in the lake ecosystems From a thermodynamic point of view a lake may be considered as an open system which exchanges materials (wastewater evaporation precipitation nitrogen bacteria) and energy (evaporation radiation) with the environment The cycles of the most important elements C N P Si O S Fe are a major part of the chemical-biological processes in a lake system In addition to the biochemical cycles some physical processes must be mentioned The flow of energy has a great influence on the system which means that light penetration formation of thermocline and evaporation must be included among the essential processes of a lake Primary production means the organic material formed and the greatest part of production in lakes and reservoirs is caused by phytoplankton Macrophytes might have a substantial standing crop but phytoplankton has generally a much shorter turnover time
Our final formal submission on the Regional Plan Draft 2 Ref PH_Draft2RP2006 January 30 2006 Page 32 (of 85)
Primary production represents the synthesis of organic matter of aquatic systems and the total process photosynthesis whose complex metabolic pathway can be oversimplified as follows
light + 6CO2 + 6H2O rarr C6H12O6 + 6O2
Plants have photosynthetic pigments one of which cholorophylla is present in almost all photosynthetic organisms Several other pigments such as chlorophyll b c d and e carotenoids xanthophylls and biliproteins can be found in plants
172 Shallow Lakes Traditionally limnology is mostly concerned with lakes that stratify in summer The impact of macrophytes on the community is relatively small in such lakes as plant growth is restricted to a relatively narrow marginal zone These lakes are not expected to stratify for long periods in summer This type of lake where the entire water column is frequently mixed is also referred to as polymictic The intense sediment-water interaction and the potentially large impact of aquatic vegetation makes the functioning of shallow lakes different from that of their deep counterparts in many aspects Shallow lakes are defined as lakes where the euphotic zone extends over the bottom Simply the euphotic zone is defined as the depth at which the light intensity of the photosynthetically active spectrum (400-700 nm) equals 1 of the subsurface light intensity
173 Typology of (northern) lakes based on metabolic balance
and ecosystem stoichiometry The humic content of waters (allochthonous loading of organic matter) should be seen as a primary characteristic of natural waters while the degree of nutrient enrichment should be seen as a secondary modifier All lakes receive some allochthonous loading of humic organic matter and have some inherent heterotrophic metabolic capacity
Net heterotrophy is arguably the natural condition of most northern lakes with net autotrophy arising only because of anthropogenic impact on catchments The natural development of many lakes (atleast of boreal lakes) is to become more dilute but richer in DOC and by inference more strongly net heterotrophic
Too many conclusions about net heterotrophy of lakes are based on the ice-free or growing seasons When continued respiration during winter conditions is taken into account even quite eutrophic lakes can be net heterotrophic on an
Our final formal submission on the Regional Plan Draft 2 Ref PH_Draft2RP2006 January 30 2006 Page 33 (of 85)
annual basis This is particularly apparent in lakes with winter ice cover in which considerable under-ice accumulation of CO2 can take place giving rise to a large springtime CO2 pulse to the atmosphere when the water degasses after ice-melt
References Environment Canada 2004 Canadian Guidance Framework for the
Management of Phosphorus in Freshwater Systems Ecosystem Health Science-based Solutions Report No 1-8 National Guidelines and Standards Office Water Policy and Coordination Directorate Environment Canada pp 114
Jones RI 2005 Limnology of humic waters special theme or universal framework Plenary lecture XXIX Congress 2004 International Association of Theoretical and Applied Limnology Verh Internat Verein Limnol 29(1)51-60
Vollenweider RA and Kerekes J 1982 Eutrophication of waters Monitoring assessment and control OECD Cooperative programme on monitoring of inland waters (Eutrophication control) Environment Directorate OECD Paris 154 p
Wetzel RG 2001 Limnology Lake and River Ecosystems Third Ed Academic Press San Diego xvi 1006 pp ISBN 0-12-744760-1
Our final formal submission on the Regional Plan Draft 2 Ref PH_Draft2RP2006 January 30 2006 Page 34 (of 85)
[See our web pages on ldquoShallow Lakesrdquo (httplakeschebuctoorgshallowhtml) and ldquoTypology of (northern) lakes based on metabolic balance and ecosystem stoichiometryrdquo (httplakeschebuctoorgINFOLIMNOLOGYstoichiometryhtml)]
174 The first ever 5-year (2002-2007) paleolimnology of lakes
within HRM (Exhibit-V) and a cautionary note 67 lakes are being studied by the PEARL Queens University and by Trent University Ontario under the NSERC funded TEAM project in addition to in-kind contributions (cf httplakeschebuctoorgPALEOhrmhtml)
1741 An example of their research- Russell Lake
Dartmouth Their diatom inferred TP values for Russell Lake ranged between 163 and 299 μgl approx for the period 1850 to 2002 with the lowest value of 163 μgl occurring in 2002 But their paleo records of chironomid head capsules indicated no improvement in the deep water oxygen levels To cite one of their completed thesis ldquoImprovements in surface water quality as indicated by diatoms do not appear be accompanied by the recovery of hypolimnetic oxygen levels and thus are not reflected in chironomid assemblagesrdquo The extremely high values of 50-90 μgl (converted to TP) reported by the Nova Scotia Environment Department (NSEL) during the 1970s were not reflected in the paleo work It seems that most phosphorus data all across Canada were overstated 2-5x prior to twenty (20) years ago (see sect19)
1742 Cautionary note The work in this NSERC project involves ascertaining certain parameters pre-industrial (1840s) but they do not ascertain the `natural background values The phosphorus management policy of the federal CCME (httplakeschebuctoorgDATAPARAMETERSTPpopuphtml) clearly requires establishing the background values in pristine conditions ie natural background values (or pre-human impact) These can only be obtained by predictive TP modelling (httplakeschebuctoorgTPMODELStpmodelshtml) utilizing phosphorus export coefficients in similar pristine subwatersheds or by
Our final formal submission on the Regional Plan Draft 2 Ref PH_Draft2RP2006 January 30 2006 Page 35 (of 85)
paleo techniques which can generate inference models to the pre-human impact era But due to time and financial constraints the Ontario researchers are only going back to the pre-industrial times approximately the 1840s They did not core deep enough to date back to the pristine times ie the pre-human impact era as recommended in the year-2004 CCME phosphorus policy But the TEAMrsquos research is still of value for comparison with the pre-industrial era approx the 1850s
Our final formal submission on the Regional Plan Draft 2 Ref PH_Draft2RP2006 January 30 2006 Page 36 (of 85)
18 Scientific definition of trophic status and most are
making significant errors (see also Exhibit-B)
Trophy of a lake refers to the rate at which
organic matter is supplied by or to the lake per
unit time (Wetzel 2001) Trophy then is an expression of the combined effects of organic matter to the lake As developed originally and as largely used today the trophic concept (eg TP Cha SD and TN) refers to the limnetic (ie open water) zone-planktonic portion of the lake ecosystem (cf Tables 41 and 42 Environment Canada-2004) The littoral flora and its often dominating supply of autochthonous organic matter to the system were and usually still are ignored
181 Shortcomings of the Fixed Boundary approach and
Vollenweiders dictum on the OECD Probability Distribution
Diagrams (Exhibit-L)
What emerged from the assessment of all information available however led to the conclusion that there is no possibility of defining strict boundary values between trophic categories Whilst the progression from oligo- to eutrophy is a gliding one- as has been stressed many times in literature- any one combination of trophic factors in terms of trophic category allocation can only be used in a probabilistic sense Objective reasons exist for the uncertainty of classifying a given lake in different categories by two or more investigators depending on the management of that body of water Average conditions expressed by average nutrient concentrations average biomass values average transparency etc do not necessarily express the degree of variability particularly with regard to peak levels frequency of their occurrence and their qualitative nature (type of phytoplankton) From the management viewpoint such situations and their frequency are as important as average conditions For this reason prediction uncertainties must be accounted for This can be achieved by reinterpreting the summary values listed in the fixed boundary in terms of classification probabilities The resulting probability distribution is given in Figures L1 to L4 for the main components average lake phosphorus average and peak chlorophyll a concentrations and average yearly Secchi disk transparency
Our final formal submission on the Regional Plan Draft 2 Ref PH_Draft2RP2006 January 30 2006 Page 37 (of 85)
Click on the 4-minute mp3 sound file (httplakeschebuctoorgTPMODELSOECDvollenweidermp3) featuring Dr Richard Vollenweider explaining the rationale of the OECD Probability Distribution Diagrams relating to the scientifically credible methodology of ascertaining trophic states which can be achieved only in a `probabilistic sense as described above The sound file is incorporated in the approx thirty (30) of the CD+R andor DVD+R disks that we gave many branches of the HRM inclusive of to thirteen (13) of the councillors and the Mayor Environment Canadas Dr Richard Vollenweider has been the first Canadian (19867) to have ever received the top international medal in limnology the Naumann-Thienemann medal Only four (4) Canadians have ever been recipient of this coveted medal which has been awarded since as long back as 1942
182 Example of an application of the OECD Probability
Distribution Diagrams for lakes in HRM (Exhibit-M) See Exhibit-M where we summarized the results of applying three of the OECD probability distribution diagrams to our first data of 27 lakes within HRM Since the data was only seasonal ie three samples per year in most cases the probability distribution diagram for peak chlorophyll a was not considered One needs more extensive yearly data to confidently ascertain peak chlorophyll a Subsequently we carried out such analysis for select indicator lakes based on a range of sampling frequencies some of them on monthly levels during all the four seasons References Environment Canada 2004 Canadian Guidance Framework for the
Management of Phosphorus in Freshwater Systems Ecosystem Health Science-based Solutions Report No 1-8 National Guidelines and Standards Office Water Policy and Coordination Directorate Environment Canada pp 114
Janus LL and RA Vollenweider 1981 The OECD Cooperative Programme On Eutrophication Summary Report Canadian Contribution Canada Center for Inland Waters Burlington
Soil amp Water Conservation Society of Metro Halifax 1991 Limnological study of twenty seven Halifax Metro lakes 136p ill maps
Vollenweider RA and Kerekes J 1982 Eutrophication of waters Monitoring assessment and control OECD Cooperative programme on monitoring of inland waters (Eutrophication control) Environment Directorate OECD Paris 154 p
Our final formal submission on the Regional Plan Draft 2 Ref PH_Draft2RP2006 January 30 2006 Page 38 (of 85)
Wetzel RG 2001 Limnology Lake and River Ecosystems Third Ed Academic Press San Diego xvi 1006 pp ISBN 0-12-744760-1
[See our web page on ldquoShallow Lakesrdquo (httplakeschebuctoorgshallowhtml)]
19 Phosphorus analytical inaccuracies
(see also Exhibit-P) There are severe concerns raised by several leading limnologists in Canada about the accuracy of phosphorus analyses This concern not only applies to the older data but somewhat to present data as well The present day inaccuracies stem primarily from a combination of questionable field sampling practices as well as the worry that contamination is commonplace as phosphorus is ubiquitous in the environment in the labs etc Indeed the only nationally accredited lab in all of HRM for the low levels of phosphorus the QEII Environmental Chemistry Labs no longer carry out the analyses and subcontract to the New Brunswick Environment Department labs The QEII lab was informed in year 2004 by the national accrediting agency (CAEAL) of severe inaccuracies in their analyses in total phosphorus at the levels that are norm in our lakes and rivers See also Exhibit-P which is an email we received from an extensively published chemical limnologist Prof Pete Dillon FRSC of Trent University and Scientist Emeritus with the Dorset Environmental Science Centre of the Ontario Ministry of Environment Pete Dillon is also one of our Scientific Directors Indeed it is primarily his science that most phosphorus models in Nova Scotia are based upon
Our final formal submission on the Regional Plan Draft 2 Ref PH_Draft2RP2006 January 30 2006 Page 39 (of 85)
20 Power boats on shallow lakes (Exhibit-O) Exhibit is part of an overview scientific paper on this politically charged issue The paper concludes as ldquoWhile this article and the scientific literature cannot resolve what may ultimately be a political issue we can state with reasonable certainty that power boating is likely to have harmful impacts on shallow lakesrdquo [See our web page (httplakeschebuctoorgINFOWATERCRAFTwatercrafthtml) for the entire article]
21 Effects of Golf Course Construction and Operation on
the Aquatic Environment Assess the impact of golf courses and follow the methodology as recommended by scientists at the Ontario Ministry of Environment The study integrates projects that investigate the impact of golf courses on physical and chemical water quality parameters with those examining lake and stream biota [The paper is in our web page (httplakeschebuctoorgINFOGOLF-COURSESwinter_golfhtml)]
Our final formal submission on the Regional Plan Draft 2 Ref PH_Draft2RP2006 January 30 2006 Page 40 (of 85)
22 Exhibit-A (1 page) Sandy Lake (Hammonds Plains)
model
Our final formal submission on the Regional Plan Draft 2 Ref PH_Draft2RP2006 January 30 2006 Page 41 (of 85)
23 Exhibit-B (6 pages) Scientific shortcomings in
consultant reports
(revised to include only relevant parts)
Soil amp Water Conservation Society of Metro Halifax (SWCSMH) 310-4 Lakefront Road Dartmouth NS Canada B2Y 3C4
Email limneschebuctonsca Tel (902) 463-7777 Master Homepage httplakeschebuctoorg
Ref ems_2005feb22 (6 pages total) To John Sheppard PEng and Tony Blouin PhD
EMS Dept HRM From S M Mandaville Post-Grad Dip Professional Lake Manage
Chairman and Scientific Director
Date February 22 2005
Subject Major errors and scientific shortcomings in many of the studies of HRM- further to your statements at the HWAB on Feb 16 2005 written informally as I know both of you well
I was quite concerned regarding some statements both of you made at the Halifax Watershed Advisory Board (HWAB) but since there was no time to address those this is the reason for this focused letter I am only pointing out here examples (not all) of events over the last 8 years or so (original in the email)
Our final formal submission on the Regional Plan Draft 2 Ref PH_Draft2RP2006 January 30 2006 Page 42 (of 85)
(original in the email)
Our final formal submission on the Regional Plan Draft 2 Ref PH_Draft2RP2006 January 30 2006 Page 43 (of 85)
(original in the email)
Our final formal submission on the Regional Plan Draft 2 Ref PH_Draft2RP2006 January 30 2006 Page 44 (of 85)
(original in the email)
Our final formal submission on the Regional Plan Draft 2 Ref PH_Draft2RP2006 January 30 2006 Page 45 (of 85)
(original in the email)
Our final formal submission on the Regional Plan Draft 2 Ref PH_Draft2RP2006 January 30 2006 Page 46 (of 85)
(original in the email)
Our final formal submission on the Regional Plan Draft 2 Ref PH_Draft2RP2006 January 30 2006 Page 47 (of 85)
24 Exhibit-C (3 pages) Papermill Lake proposal
--- Page C-1 ---
(Only relevant parts of our submission enclosed below)
Soil amp Water Conservation Society of Metro Halifax (a volunteer scientific stakeholder-group)
PO Box 911 Dartmouth NS Canada B2Y 3Z6 Email limnoschebuctonsca TelFax(call first) (902) 463-7777
Internet Homepage httpwwwccncsdalcaScienceSWCSSWCShtml
Ref NWCC02DOC (3pg)
To Chairman and Members North West Community Council HRM
From S M Mandaville Co-Ordinator
Date 27 July 1996
Subject Paper Mill lake Community of Bedford HRM
We herewith respectfully request that your esteemed NW Community Council adopt the following Policy immediately and it be incorporated in your Memorandum I will be pleased to provide further scientific rationale if needed at a public hearingmeeting and I would prefer the meetinghearing be held at the least on a quasi-scientific level as op-posed to a political one TIME IS OF THE UTMOST ESSENCE
ldquoPolicy Management Objective for Paper Mill Lake Bedford= OLIGOTROPHY until the year 2050 AD (at the
minimum)rdquo The classification should be based on the 1982 (peer reviewed) OECD Diagnostic Model (cf Appendix-A) which would involve a combination of yearly mean TP yearly mean Cha and yearly peak Cha values for diagnostic purposes (SD values will not be reliable due to suspended sediment colour light variations operator inconsistencies etc) The preferred model to be used for prediction purposes is the 1982 OECD Pre-dictive Trophic State Model (cf Appendix-B) The 1986 Ontario Trophic State Model and its updates (to 1996) can be used to predict the effect of land use changes utilizing applicable TP export and inlake retention coefficients but the 1982 OECD Predictive Model should be used to ascertain the possible result as it incorporates a safety margin These models have been developed by several of the leading world experts in Limnology (ldquoscience of study of lakesrdquo)
Note Every effort should be made if the lake is proven to be mesotrophic as there has been some conflicting recent Cha data If it is uneconomic to restore Paper Mill lake to
an oligotrophic state then a firm MAXIMUM TP VALUE OF 8-10gl (mean whole year
value) should be incorporated as the ldquoManagement Objectiverdquo One of the possibleprobable implications of this could be severe restrictions in amount of land that could be developed in the subwatersheds andor disallowing of di-rect discharge of stormwater into Paper Mill as well as Kearney and (perhaps other up-
Our final formal submission on the Regional Plan Draft 2 Ref PH_Draft2RP2006 January 30 2006 Page 48 (of 85)
stream) lakes At the worst case stormwater may have to be intercepted with lakeshore interceptors and either diverted andor treated in a treatment plant (somewhat similar to an area in the City of Nepean Ontario with TP removal incorporated) The highly touted ldquocommunity stewardshiprdquo programs may be beneficial as well though we are leery about their guaranteed effectiveness Though ldquocommunity stewardshiprdquo has been is and will always be a very pro-active approach as it concentrates on source reductions and such programs have been extensively recommended in the USEPA literature as far back as
--- Page C-2 ---
Our final formal submission on the Regional Plan Draft 2 Ref PH_Draft2RP2006 January 30 2006 Page 49 (of 85)
--- Page C-3 ---
Our final formal submission on the Regional Plan Draft 2 Ref PH_Draft2RP2006 January 30 2006 Page 50 (of 85)
25 Exhibit-D (2 pages) St Margarets Bay plan area
Our final formal submission on the Regional Plan Draft 2 Ref PH_Draft2RP2006 January 30 2006 Page 51 (of 85)
Our final formal submission on the Regional Plan Draft 2 Ref PH_Draft2RP2006 January 30 2006 Page 52 (of 85)
26 Exhibit-E (3 pages) Minneapolis City Chapter 55
Lawn Fertilizer Bylaw
Our final formal submission on the Regional Plan Draft 2 Ref PH_Draft2RP2006 January 30 2006 Page 53 (of 85)
Our final formal submission on the Regional Plan Draft 2 Ref PH_Draft2RP2006 January 30 2006 Page 54 (of 85)
Our final formal submission on the Regional Plan Draft 2 Ref PH_Draft2RP2006 January 30 2006 Page 55 (of 85)
27 Exhibit-F (2 pages) Environment Canadarsquos report on
100m and 250m corridors around streams
Our final formal submission on the Regional Plan Draft 2 Ref PH_Draft2RP2006 January 30 2006 Page 56 (of 85)
We are unaware if further research was completed that Geoff Howell was alluding to in his letter Geoff a life long resident of Dartmouth and an executive member of our group departed Mother Earth at a young age in early-2004 When he died he had the title of a Director at Environment Canada and spent half time in Ottawa and the other half at the Alderney Drive offices
Our final formal submission on the Regional Plan Draft 2 Ref PH_Draft2RP2006 January 30 2006 Page 57 (of 85)
28 Exhibit-G (2 pages) Monitoring of the effluent plume
from an onsite sewage disposal system
Our final formal submission on the Regional Plan Draft 2 Ref PH_Draft2RP2006 January 30 2006 Page 58 (of 85)
Our final formal submission on the Regional Plan Draft 2 Ref PH_Draft2RP2006 January 30 2006 Page 59 (of 85)
29 Exhibit-H (2 pages) Marine inlets
(cf Strain and Yeats 1999)
Our final formal submission on the Regional Plan Draft 2 Ref PH_Draft2RP2006 January 30 2006 Page 60 (of 85)
Our final formal submission on the Regional Plan Draft 2 Ref PH_Draft2RP2006 January 30 2006 Page 61 (of 85)
30 Exhibit-I (2 pages) Freshwater Benthic Ecology and
Aquatic Entomology
Following are our select web pages in this specialty all acccessible from the homepage on ldquoFreshwater Benthic Ecology and Aquatic Entomologyrdquo (httplakeschebuctoorgZOOBENTHBENTHOSbenthoshtml)
Taxa Tolerance Values Overall Detailed Introduction The Zoobenthos of Freshwaters Freshwater Benthic Ecology
Diversity and Biotic Indices Diagnostic features of Superphylum Arthropoda
Class Collembola (springtails) Order Ephemeroptera (mayflies) Order Odonata (dragonflies and damselflies) Order Plecoptera (stoneflies) Order Hemiptera (true bugs)
Our final formal submission on the Regional Plan Draft 2 Ref PH_Draft2RP2006 January 30 2006 Page 62 (of 85)
Order Trichoptera (caddisflies) Order Lepidoptera (butterflies and moths) Order Aquatic Coleoptera (beetles) Order Megaloptera (alderflies dobsonflies fishflies) Order Aquatic Neuroptera (spongillaflies) Order Diptera (two-winged or true flies)
Family Chironomidae (midges flies)
Chironomid mouthpart deformity frequencies as an Indicator of community health
Sublethal parameters in morphologically deformed Chironomus larvae- extracts
Family Culicidae (mosquitoes) Family Tipulidae (crane flies) Family Simuliidae (black flies) Family Chaoboridae (phantom midges)
Order Orthoptera and Grylloptera (grasshoppers crickets) Order Hymenoptera (aquatic wasps etc) Subcohort Hydrachnidia (true water mites) Subphylum Crustacea (cladocerans [water fleas] shrimps copepods
amphipods [scuds] sow bugs crayfish fish lice) Phylum Mollusca
Class Gastropoda (snails) Class Bivalvia (clams and mussels) Alien Species
Phylum Annelida (Diagnostic features of Annelida) Class Oligochaeta (aquatic worms) Class Hirudinea (leeches)
Phylum Platyhelminthes Class Turbellaria (flatworms)
Taxa Tolerance Values
Our final formal submission on the Regional Plan Draft 2 Ref PH_Draft2RP2006 January 30 2006 Page 63 (of 85)
31 Exhibit-J (1 page) Chironomid mouthpart deformity
frequencies as an indicator of community health
Our final formal submission on the Regional Plan Draft 2 Ref PH_Draft2RP2006 January 30 2006 Page 64 (of 85)
32 Exhibit-K (1 page) Premier John Hammrsquos admission of
the lack of any limnologists on the staff of the NSEL
Our final formal submission on the Regional Plan Draft 2 Ref PH_Draft2RP2006 January 30 2006 Page 65 (of 85)
33 Exhibit-L (4 pages) Probability distribution diagrams
331 (Exhibit-L1) Probability distribution curve for yearly
average lake phosphorus
Our final formal submission on the Regional Plan Draft 2 Ref PH_Draft2RP2006 January 30 2006 Page 66 (of 85)
332 (Exhibit-L2) Probability distribution curve for yearly
average lake chlorophyll a
Our final formal submission on the Regional Plan Draft 2 Ref PH_Draft2RP2006 January 30 2006 Page 67 (of 85)
333 (Exhibit-L3) Probability distribution curve for yearly peak
lake chlorophyll a
Our final formal submission on the Regional Plan Draft 2 Ref PH_Draft2RP2006 January 30 2006 Page 68 (of 85)
334 (Exhibit-L4) Probability distribution curve for yearly
average lake Secchi disk transparency
Our final formal submission on the Regional Plan Draft 2 Ref PH_Draft2RP2006 January 30 2006 Page 69 (of 85)
34 Exhibit-M (1 page) Example of an application of the
OECD Probability Distribution Diagrams for lakes in HRM Soil amp Water Conservation Society of Metro Halifax 1991 Limnological study of
twenty seven Halifax Metro lakes 136p ill maps Since the data of the 27 lakes below was only seasonal ie three samples per year in most cases peak chlorophyll a was not considered One needs more extensive yearly data to confidently ascertain peak chlorophyll a We have carried such analysis for numerous other lakes based on a range of sampling frequencies some of them on monthly levels
Our final formal submission on the Regional Plan Draft 2 Ref PH_Draft2RP2006 January 30 2006 Page 70 (of 85)
35 Exhibit-N (2 pages) A lead example of the
methodology to assess the downstream impacts of a
proposed STP (only 2 pages of the paper are inserted)
Our final formal submission on the Regional Plan Draft 2 Ref PH_Draft2RP2006 January 30 2006 Page 71 (of 85)
Our final formal submission on the Regional Plan Draft 2 Ref PH_Draft2RP2006 January 30 2006 Page 72 (of 85)
36 Exhibit-O (2 pages) Power boats on shallow lakes
Our final formal submission on the Regional Plan Draft 2 Ref PH_Draft2RP2006 January 30 2006 Page 73 (of 85)
Our final formal submission on the Regional Plan Draft 2 Ref PH_Draft2RP2006 January 30 2006 Page 74 (of 85)
37 Exhibit-P (2 pages) Phosphorus analytical
inaccuracies
From Prof Peter Dillon FRSC Trent
Univ Ontario (also Scientist-Emeritus
Dorset Centre Ontario Ministry of
Environment-OME)
Sent Monday November 14 2005 1100
AM
To Shalom M Mandaville
Cc Prof John Smol FRSC (PEARL-
Queens Univ) John K Underwood PhD
(former limnologist-NSEL) NSEL-
Water Line
Hello Shalom
However in the interim I will try to clarify a few points just to be sure
that we are all on the same page What I originally said was that P
measurements reported by many labs in the 60s and 70s were often
suspect I know this for a fact as I conducted blind QAQC tests on the
Ont Min Envir in the mid-70s and quite bluntly our lab failed miserably
Results were too high most of the time often 2 to 5x the real value I also
carried out some testing on other govt labs with poor results Detection
limits in most labs were often 001 or 002 mgL ie 10 or 20 ugL which is
of course useless if your study site has 5 ugL Part of the problem was that
the focus before this was on waste effluents (our OME started as the
Water Resources Commission and was responsible for sewage treatment in
Ontario and did virtually nothing else - the OME only began in 1971 or 1972)
Also most good chemical work was being done on oceanography then and
good results were achieved but the oceans dont have a few ugL TP as
many lakes do so those labs didnt have to push detection limits down
By about 1977 or 78 OME was producing good TP results for my studies -
we had set up a low-level P lab specifically for my work at Dorset and
Sudbury However the rest of the Ministry was getting along with much
poorer results than we were achieving - better than the early 70s but still
Our final formal submission on the Regional Plan Draft 2 Ref PH_Draft2RP2006 January 30 2006 Page 75 (of 85)
not great In the early 80s the Great Lakes group pushed for low level P
analyses as we had done earlier and finally the Ministry lab acceded and
switched to comparable methods for the rest of the Ontario work
I believe that similar situations existed in most labs There are probably a
few exceptions but bear in mind that most govt labs have large numbers of
samples to analyze and low-level P was at that time very labour-intensive -
this pre-dated standard use of auto-analyzers
Im sure that John Underwood would agree that P analyses in the 60s and
much of the 70s were often inaccurate often imprecise We all ofcourse
went through the same thing with SO4 analyses - the first of our data that
I use are from 1980 - prior to that the data are quite useless unless the
water had very low DOC eg precipitation data are good almost all lakes and
streams are not
There is a certain amount of art to P analyses Unlike some trace elements
contamination is commonplace as P is ubiquitous in the environment in the
labs etc I still routinely see consultants documents reporting P levels that
I know are ridiculous A few years ago I was involved in a study with a group
that was contesting a consultants report (one of the biggest environmental
consulting companies in the country) and it was obvious that the companys P
analyses were nonsense It was very simple to demonstrate this and their
whole argument went out the window As Im sure you are aware few
consulting companies do their own analyse any more - its now in a way
centralized in just a few companies or done for fees by govt or academic
labs
If you have any other questions Id be glad to address them
Sincerely
Peter Dillon
bccd to govt offices consultants etc
Our final formal submission on the Regional Plan Draft 2 Ref PH_Draft2RP2006 January 30 2006 Page 76 (of 85)
38 Exhibit-Q (1 page) Street Surface Pollutants
associated with various particle sizes
Our final formal submission on the Regional Plan Draft 2 Ref PH_Draft2RP2006 January 30 2006 Page 77 (of 85)
39 Exhibit-R (4 pages) Toxicants found in Priority
Pollutant Scans
(Stormceptor [Source Schueler and Shepp 1993]) Key
= Found in water column also (G) = Observed predominantly in gas station sampling
= Observed only in water column samples (NG) = Observed predominantly in non-gas station sampling
(S) = Suspected (a result of gas (AS) = Observed in both sampling chromatography testing)
Potential Toxicant Typical Use Probable Pathway to Oil-Grit Separator (OGS)
-------------------- Sediment Samples --------------------
Semi-volatile Organics
Naphthalene Component of gasoline fossil fuel Incomplete combustion of fossil fuels Atmospheric deposition of the vapours Gasoline spillage crankcase motor oil drippings (G)
2-Methylnaphthalene ldquo ldquo ldquo ldquo
Acenapthene ldquo ldquo ldquo ldquo
Fluorene ldquo ldquo ldquo ldquo
Phenanthrene ldquo ldquo ldquo ldquo
Pyrene ldquo ldquo ldquo ldquo
Chrysene ldquo ldquo ldquo ldquo
Benzo (b) fluoranthene ldquo ldquo ldquo ldquo
Indeno (123-cd) pyrene
ldquo ldquo ldquo ldquo
Benzo (ghi) perylene ldquo ldquo ldquo ldquo
Di-nbutyl phthalate Plasticizer- component of plastics polymeric substances
Leaches from plastic products such as garden hoses floor tiles plastic containers and food packaging (NG) May leach into motor oils and other automotive fluids from their plastic containers (G) Motor oil is a suspected source of compound of OGS (AS)
Butylbenzyl phthalate ldquo ldquo ldquo ldquo
Our final formal submission on the Regional Plan Draft 2 Ref PH_Draft2RP2006 January 30 2006 Page 78 (of 85)
Bis (2-Ethylhexyl) phthalate
ldquo ldquo ldquo ldquo
Di-n-cotyle-phthalate ldquo ldquo ldquo ldquo
Volatile Organics
Toluene Used as solvent and in chemical synthesis
Improper disposal of industrial waste Atmospheric deposition of vapours resulting from incomplete combustion of fuels (AS)
Ethylbenzene Intermediate in chemical synthesis solvent component of antifreeze
Antifreeze spillings (AS)
Total Xylenes ldquo ldquo ldquo ldquo
Methylene Chloride Used as refrigerant Component of PVC
Improper disposal of industrial waste Refrigerant leakage (S) Car air conditioners coolants (S)
PesticidesPCBs
Aldrin Pesticide Used in farming gardening and landscaping
44-DDT Pesticide ldquo ldquo
Metals
Antimony Component of lead alloys rubber matches ceramics enamel paints lacquers and textiles
Leaches from painted and rubber waste articles Household and industrial waste erosion from rocks and soils (G)
Arsenic Component of fossil fuel insecticide food preservatives Used in treatment of leukemia and as a tonic
Product of incomplete combustion of fossil fuels and incomplete atmospheric deposition of vapours (AS)
Beryllium Used to manufacture non-sparking alloys for tools nuclear reactors and lightweight alloys
Erosion from rocks and soils (AS)
Cadmium Used in manufacture of batteries paints and plastics Used to plate iron products such as nuts and bolts for corrosion prevention
Waste from plating processes Motor vehicle exhaust Leached from galvanized copper and plastic pipes (G)
Chromium Used to make alloys catalysts and refractories Used in plating processes Used in paints leather tanning plastics
Improper disposal of industrial waste Corrosion of alloys and plated surfaces (AS) Spillage of brake fluid
Copper Used as alloy component Sulphate salt used as algicide in water supply
Corrosion of copper pipes and fittings Improper disposal of waste from industry
Our final formal submission on the Regional Plan Draft 2 Ref PH_Draft2RP2006 January 30 2006 Page 79 (of 85)
reservoirs Component of fungicide Used in electroplating industry Found in coolant brake fluid motor oil gasoline
Algicide (AS) Spillage of listed automobile products
Lead Used as an additive to gasoline motor oil brake fluid and coolant Component of pipes paints and dyes Used in manufacture of batteries insecticide
Atmospheric deposition of motor vehicle exhaust Gasoline motor oil brake fluid and coolant leakage Leaching from paints stains plastics Improper disposal of batteries and insecticides
Nickel Used in electroplating food processing (gelatin baking powder) Present in gasoline transmission fluid motor oil brake fluid coolants
Wastewater from electroplating operations Product of incomplete combustion of fossil fuels and atmospheric deposition Gasoline leakage coolant motor oil and brake fluid spillage (AS)
Silver Used in electroplating industry Silver halides are used in photography Component of germicide antiseptic and astringent Found in diesel fuel
Improper disposal of industrial waste (AS)
Zinc Used in electroplating industry Component of bronze rubber enamel glass and paper Component of automobile tires road salt and paint
Wastewater from electroplating operations Weathering and abrasion of galvanized iron and steel Leaching from road salt automobile tires (AS)
CyanidePhenols
Phenol Product of plating operations Anticaking ingredient in road salts Intermediate in production resins
Waste from coal coking and refinery operations Leaching from road salt (AS)
-------------------- Water Column Samples --------------------
Semi-volatile Organics
Benzyl alcohol Component of gasoline fossil fuel Incomplete combustion of fossil fuel and atmospheric deposition of vapours (G)
2-Methylphenol ldquo ldquo ldquo ldquo
3-4-Methylphenol ldquo ldquo ldquo ldquo
24-Demithylphenol ldquo ldquo ldquo ldquo
Volatile Organics
Our final formal submission on the Regional Plan Draft 2 Ref PH_Draft2RP2006 January 30 2006 Page 80 (of 85)
Acetone Used as gasoline additive Solvent for paints resins lacquers and plastics
Leaching of paints and plastics Automobile product motor oil leakage
2-Butanone ldquo ldquo ldquo ldquo
Benzene ldquo ldquo ldquo ldquo
Key
= Found in water column also (G) = Observed predominantly in gas station sampling
= Observed only in water column (NG) = Observed predominantly in samples non-gas station sampling
(S) = Suspected (a result of gas (AS) = Observed in both sampling chromatography testing)
Our final formal submission on the Regional Plan Draft 2 Ref PH_Draft2RP2006 January 30 2006 Page 81 (of 85)
40 Exhibit-S (1 page) Removal of Gross Pollutants From
Stormwater Runoff Using LiquidSolid Separation
Structures for four in-situ technologies
Our final formal submission on the Regional Plan Draft 2 Ref PH_Draft2RP2006 January 30 2006 Page 82 (of 85)
41 Exhibit-T (1 page) Integrating Constructed Wetlands
With Stormwater Management (cf Wong et al 1999)
Our final formal submission on the Regional Plan Draft 2 Ref PH_Draft2RP2006 January 30 2006 Page 83 (of 85)
42 Exhibit-U (2 pages) Location of wetlands researched
and comparison of reported removal rates for
constructed and natural stormwater wetlands
(cf Strecker et al 1992)
Our final formal submission on the Regional Plan Draft 2 Ref PH_Draft2RP2006 January 30 2006 Page 84 (of 85)
Our final formal submission on the Regional Plan Draft 2 Ref PH_Draft2RP2006 January 30 2006 Page 85 (of 85)
43 Exhibit-V (1 page) Excerpts from the TEAMs
websites on paleolimnology
The two major water-quality issues facing the Maritime region of Canada
are acidification and eutrophication Due to the lack of long-term data sets
it is impossible to measure directly the extent of degradation (or possible
recovery) in water quality Fortunately new approaches are available to
reconstruct these missing data This 5-year multi-disciplinary program
combines novel paleolimnological (using information archived in lake
sediments to reconstruct environmental conditions) and biogeochemical
modeling approaches to address key issues related to water-quality changes
in Nova Scotia and Southern New Brunswick Long-term goals are to develop
pattern- and process-based models on regional scales to help address the
diversity of water-quality issues facing eastern Canada These techniques
will be widely applicable to other regions
To achieve these objectives a series of strategic projects will be
undertaken to address key processes related to acidification and
eutrophication and their interactions with other environmental stressors
(eg climate change) Consequently short-term goals are to apply new
approaches to provide detailed information on the trajectories of changes in
water quality that have occurred in specific lakes of interest to our users
This will allow us to determine if individual lakes are deteriorating or
improving in water quality and to determine what levels of stressors or
pollutants result in detrimental water-quality changes (eg what are the
critical loads for each lake At what level of sulphate deposition do we see
the first signs of acidification or at what level of watershed development
does eutrophication become a problem Are hypolimnetic oxygen levels in NS
brook trout lakes decreasing If so what are the causes) Moreover by
reconstructing pre-impact background conditions we will establish realistic
mitigation targets (ie are these lakes naturally acidic or naturally
eutrophic or do they naturally suffer from deepwater oxygen depletions)
These data will also provide insights into biogeochemical processes and
models so that more realistic assessments of environmental change will be
possible
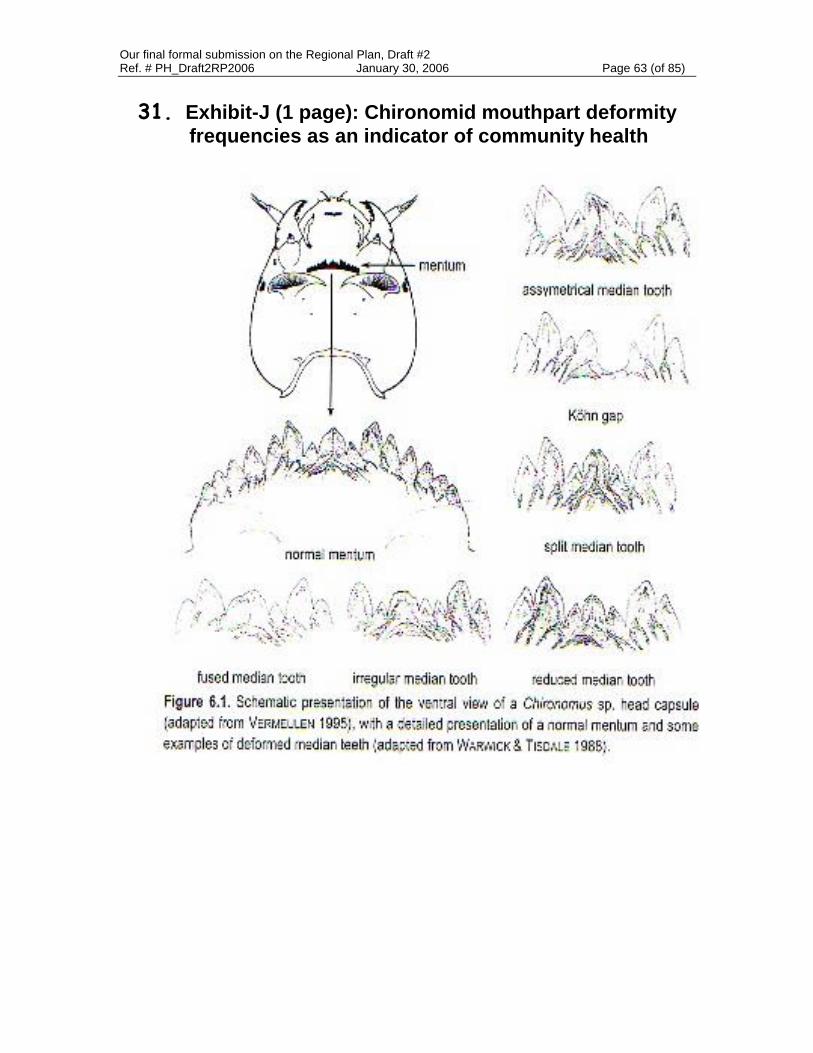
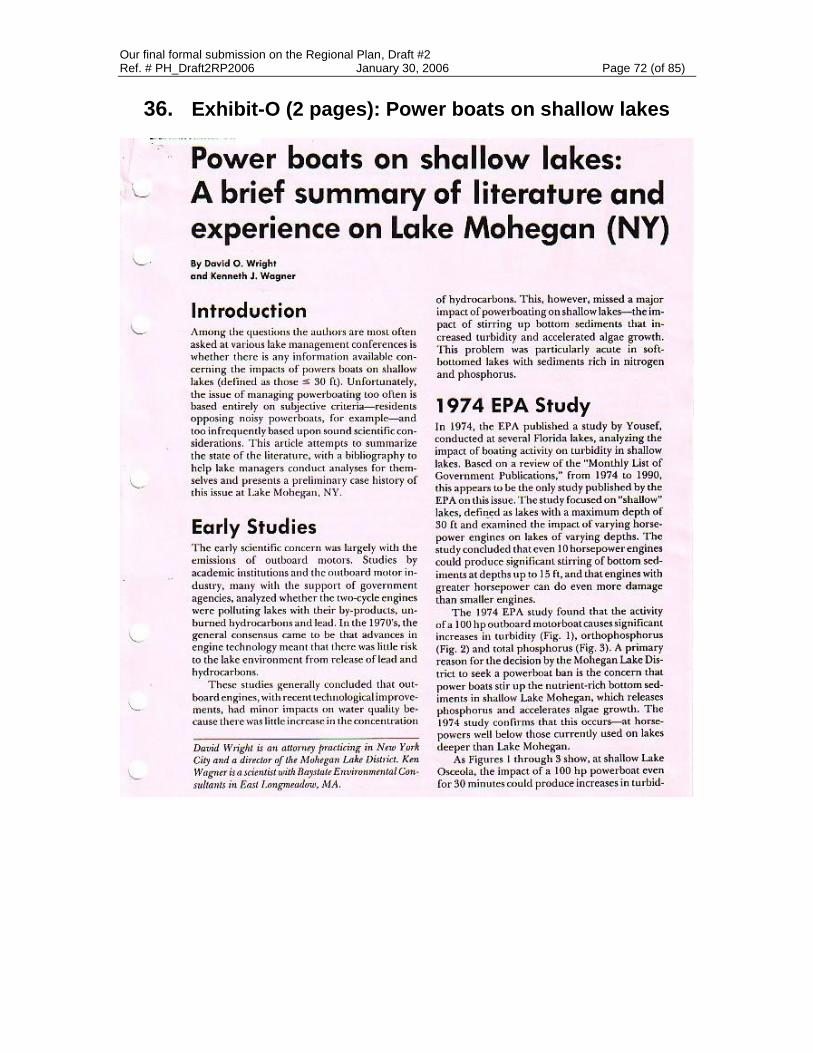