soil sement engineering...
TRANSCRIPT

SoilSoil SementSement®®
Engineering Benefits Engineering Benefits
.
““Soil Soil Sement Sement significantly improved the unconfined significantly improved the unconfined compressive strength of the SM Material . . . 58% in Dry Test compressive strength of the SM Material . . . 58% in Dry Test Condition and 208% Wet Test Condition.Condition and 208% Wet Test Condition.””
Verified by:Verified by:

9000
8000
7000
6000
5000
4000
3000
2000
1000
00.0 0.5 1.0 1.5 2.0 2.5 3.0 3.5 4.0 4.5 5.0 5.5 6.0 6.5 7.0 7.5 8.0
Application Rate by Dry Weight (%)
Un
con
fin
ed C
om
pre
ssiv
e S
tren
gth
(kP
a)
UNCONFINED COMPRESSIVE STRENGTH TEST DATAU.S. Army Corps of Engineers, CEERD-GM-A
Stabilization of Silty Sand with Traditional and Nontraditional Additives
SOIL-SEMENT®
OPTIMUM Moisture
LigninTree Resin
Asphalt Emulsion
Petroleum Resin
Cem
ent
DRY
CementAsphalt EmulsionLignosulfonateSoil SementPetroleum ResinTree ResinOPTIMUM Moisture
Graph produced by Midwest Industrial Supply, Inc. using data from the U.S. Army Engineer Researchand Development Center’s study of Nontraditional Stabilization of Silty-Sand.
Soil Sement Identified

6000
5000
4000
3000
2000
1000
00.0 0.5 1.0 1.5 2.0 2.5 3.0 3.5 4.0 4.5 5.0 5.5 6.0 6.5 7.0 7.5 8.0
Application Rate by Wet Weight (%)
Un
con
fin
ed C
om
pre
ssiv
e S
tren
gth
(kP
a)
UNCONFINED COMPRESSIVE STRENGTH TEST DATAU.S. Army Corps of Engineers, CEERD-GM-A
Stabilization of Silty Sand with Traditional and Nontraditional Additives
SOIL-SEMENT®
OPTIMUM Moisture
Lignin
Tree Resin
Asphalt
Petroleum Resin
Cem
ent
WET
Graph produced by Midwest Industrial Supply, Inc. using data from the U.S. Army Engineer Researchand Development Center’s study of Nontraditional Stabilization of Silty-Sand.
CementAsphalt EmulsionLignosulfonateSoil SementPetroleum ResinTree ResinLimeOPTIMUM Moisture
Lime
Soil Sement Identified

9000
8000
7000
6000
5000
4000
3000
2000
1000
00.0 0.5 1.0 1.5 2.0 2.5 3.0 3.5 4.0 4.5 5.0 5.5 6.0 6.5 7.0 7.5 8.0
Application Rate by Dry Weight (%)
Un
con
fin
ed C
om
pre
ssiv
e S
tren
gth
(kP
a)
UNCONFINED COMPRESSIVE STRENGTH TEST DATAU.S. Army Corps of Engineers, CEERD-GM-A
Stabilization of Silty Sand with Traditional and Nontraditional Additives
SOIL-SEMENT®
Polymer 1
Polymer 2
CONTROLLignin
Tree Resin
Asphalt Emulsion
Petroleum Resin
Cem
ent
DRY
CementAsphalt EmulsionLignosulfonatePolymer 1Polymer 2Soil SementPetroleum ResinTree ResinControl - Compacted with Water
Graph produced by Midwest Industrial Supply, Inc. using data from the U.S. Army Engineer Researchand Development Center’s study of Nontraditional Stabilization of Silty-Sand.
Products Unidentified

6000
5000
4000
3000
2000
1000
00.0 0.5 1.0 1.5 2.0 2.5 3.0 3.5 4.0 4.5 5.0 5.5 6.0 6.5 7.0 7.5 8.0
Application Rate by Wet Weight (%)
Un
con
fin
ed C
om
pre
ssiv
e S
tren
gth
(kP
a)
UNCONFINED COMPRESSIVE STRENGTH TEST DATAU.S. Army Corps of Engineers, CEERD-GM-A
Stabilization of Silty Sand with Traditional and Nontraditional Additives
SOIL-SEMENT®
Polymer 1 Polymer 2
CONTROL
Lignin
Tree Resin
Asphalt
Petroleum Resin
Cem
ent
WET
Graph produced by Midwest Industrial Supply, Inc. using data from the U.S. Army Engineer Researchand Development Center’s study of Nontraditional Stabilization of Silty-Sand.
CementAsphalt EmulsionLignosulfonatePolymer 1Polymer 2Soil SementPetroleum ResinTree ResinLimeControl - Compacted with Water
Lime
Products Unidentified

In a comprehensive studyjust released by the U.SArmy Research andDevelopment Center of 12non-traditional stabilizers and three traditional types,SOIL-SEMENT® (one of the non-traditional types)showed its potential to increase the UC strength ofsilty sand (SM) material under both “wet” and dryconditions.
The results verified that SOIL-SEMENT® polymeremulsion SIGNIFICANTLY improved the UC strengthof the SM material (58 percent in dry test conditionsand 208 percent in wet conditions). Except forcement and polymers, other traditional and non-traditional stabilizers provided no significant potential.
9000
8000
7000
6000
5000
4000
3000
2000
1000
00.0 0.5 1.0 1.5 2.0 2.5 3.0 3.5 4.0 4.5 5.0 5.5 6.0 6.5 7.0 7.5 8.0
Application Rate by Dry Weight (%)
Un
con
fin
ed C
om
pre
ssiv
e S
tren
gth
(kP
a)
UNCONFINED COMPRESSIVE STRENGTH TEST DATAU.S. Army Corps of Engineers, CEERD-GM-A
Stabilization of Silty Sand with Traditional and Nontraditional Additives
SOIL-SEMENT®
Polymer 1
Polymer 2
CONTROL
LigninTree Resin
Asphalt Emulsion
Petroleum Resin
Cem
ent
U.S. ARMY ENGINEER RESEARCH and DEVELOPMENT CENTERDETERMINE POTENT IAL ENGINEER ING BENEF ITS OF
Call today to receive a copy of the complete data and report!
1-800-321-0699
MIDWESTINDUSTRIAL SUPPLY, INC.
P.O. Box 8431 • Canton, Ohio 447111-800-321-0699 • Fax: 330-456-3247
E-Mail: [email protected]
COMING SOON...USEPA ETV and CERF HyTEC/EvTECtest results of
Midwest’s Patent-Pending E-FAMILY of Products:• ENVIROKLEEN®• ENVIROKLEEN C®• EK35®
Stay Tuned...
SOIL-SEMENT®...twenty-six years ofexperience and independent testing resultingin CERTIFIED reliability for dust controland stabilization!
DON’T GAMBLE... BUY CERTIFIED!

Nontraditional Stabilization of Silty-Sand
Submission date: August 01, 2001
Word Count: 7,381
Authors: Rosa L. Santoni
U.S. Army Engineer Research and Development Center 3909 Halls Ferry Road
CEERD-GM-A Vicksburg, MS 39180 Phone: (601) 634-3379 Fax: (601) 634-4128
E-mail: [email protected]
Jeb S. Tingle U.S. Army Engineer Research and Development Center
3909 Halls Ferry Road CEERD-GM-A
Vicksburg, MS 39180 Phone: (601) 634-2467 Fax: (601) 634-4128
E-mail: [email protected]
Steve L. Webster U.S. Army Engineer Research and Development Center
3909 Halls Ferry Road CEERD-GM-A
Vicksburg, MS 39180 Phone: (601) 634-2282 Fax: (601) 634-4128
E-mail: [email protected]

Santoni, R., Tingle, J., and Webster, S. 1
Nontraditional Stabilization of Silty-Sand Abstract A laboratory experiment was conducted to evaluate the stabilization of a silty-sand (SM) material with nontraditional chemical or liquid stabilizers. Silty-sand soil specimens were mixed with various stabilization products and compacted using a gyratory compaction machine to approximate American Society for Testing Materials (ASTM) D 1557 moisture-density compaction. Each specimen was subjected to “wet” and dry testing following the designated cure period. Twelve nontraditional stabilizers were evaluated in this experiment including acids, enzymes, lignosulfonates, petroleum emulsions, polymers, and tree resins. Additional specimens were stabilized with an asphalt emulsion, cement, and lime to provide a comparison to traditional stabilizers under the same mixing, compaction, and curing conditions. The analysis of the test data consisted of determining the average strength, in terms of sustained load, of three replicate specimens of each mixture. The average strength of the three replicates was compared to each additive’s strength, the traditional stabilization results, and a series of control specimens that were not stabilized. The results of the experiment indicate increased strength of some nontraditionally stabilized specimens when compared to both the control series and the traditional stabilization alternatives. Other nontraditional stabilizers did not demonstrate significant increased strength over the control series for the conditions of this experiment. Many of the stabilized specimens were highly moisture susceptible indicating the potential for poor performance when exposed to adverse environmental conditions, while a few specimens demonstrated excellent performance when exposed to moisture. Specific product categories are recommended for stabilizing silty-sand soils.

Santoni, R., Tingle, J., and Webster, S.
2
INTRODUCTION Materials engineers are continually confronted by the depletion of quality construction materials for road and airfield construction. Even if good quality construction materials are available, the haul costs may preclude their use. Engineers are frequently required to incorporate poor quality soil and aggregate into pavement designs. These poor quality materials typically have the potential to demonstrate undesirable engineering behavior such as, low bearing capacity, high shrink/swell potential, and poor freeze-thaw durability. Thus, material engineers frequently seek to improve the engineering properties of poor quality soils and aggregates through soil stabilization. Traditional stabilization methods include the application of various combinations of lime, cement, fly ash, and bituminous materials. These traditional stabilization techniques often require lengthy cure times and relatively large quantities of additives for significant strength improvement. Military operations often cannot be delayed to permit sufficient curing of stabilized materials or afford to allocate significant shipping volume for construction materials. Delays in private industry construction can also be costly if adequate planning has not accounted for material cure times.
Nontraditional stabilization additives have become increasingly available for commercial and military applications. These products were divided into 7 categories: salts, acids, enzymes, lignosulfonates, petroleum emulsions, polymers, and tree resins. Many of these stabilizers are advertised as requiring lower material quantities, reduced cure times, higher material strengths, and superior durability compared to traditional stabilization additives. Unfortunately, little research has been completed to distinguish between products that deliver enhanced performance and those that do not. The nature of soil stabilization dictates that products may be soil-specific and/or environment-sensitive. In other words, some products may work well in specific soil types in a given environment, but perform poorly when applied to dissimilar materials in a different environment. The rapid evolution of existing products and introduction of new stabilizers further complicate the process of defining the performance characteristics of the various nontraditional soil stabilization additives.
RESEARCH OBJECTIVES The primary objective of the research described in this paper was to screen the off-the-shelf chemical stabilizers and determine the potential engineering benefits of these products for stabilizing a silty-sand (SM) subgrade material. This research focused upon increased load-bearing capacity as the basis of performance characterization. The specific objectives included determining required additive quantities, the magnitude of strength improvement, and moisture susceptibility. Furthermore, the relative strength improvement compared to traditional stabilization additives was also evaluated. The experiment was designed to provide alternatives to traditional stabilization materials for improving the load-bearing capacity of a SM subgrade material.
The research scope included the execution of an extensive laboratory test matrix including variations in additive type, additive quantity, and cure times. Six specimens of each mix design were molded using gyratory compaction. Unconfined compression (UC) tests were used to provide an index of performance for all test specimens. A wet test procedure was developed to provide an indication of the moisture susceptibility of the stabilized specimens. Three of the six specimens for each mixture were tested under dry conditions, while the

Santoni, R., Tingle, J., and Webster, S.
3
remaining three specimens were subjected to UC tests following the wet test procedure. All stabilizers were mixed with a SM soil. It is the intention of the authors to present this data as a limited and independent evaluation of the performance of selected nontraditional stabilization additives for stabilizing a silty-sand material. LITERATURE REVIEW A review of the literature indicates that there has been a large quantity of research completed regarding the application of traditional stabilization additives such as lime, cement, and fly ash. However, little independent research has been documented pertaining to the use of nontraditional stabilization additives. A large quantity of advertisements, pamphlets, and videos has been distributed testifying to the benefits of a particular stabilization additive. Unfortunately, most of the information disclosed in these media are subjective and traditional engineering properties are poorly documented. A further concern is that of bias; do these advertising tools represent the true performance of the additive? Oldham et al. (1) developed a synthesis of potential stabilizers identified by the Corps of Engineers and contract researchers from 1946 to 1977. Their report identified acids, asphalt, cement, lime, resins, salts, silicates, and other products as potential stabilizers demonstrating varying degrees of success. The results of their investigation divided performance by soil type and demonstrated that product performance differed for varying soil types. They also noted that the stabilization mechanisms for particular stabilizing agents, such as salts, were particularly suited for specific climates and environmental conditions. A polymer resin provided the greatest increase in UC strength for the sand materials. However, most of the products evaluated under the research documented in this reference are no longer commercially available, have altered their formulas, or have changed trade names. Ajayi-Majebi et al. (2) conducted an experiment designed to determine the effects of stabilizing clay-silt soils with the combination of an epoxy resin (bisphenol A/epichlorohydrin) and a polyamide hardener. The additive mixture was composed of a 1:1 ratio of epoxy resin to polyamide hardener. Ajayi-Majebi et al. concluded that admixing up to 4 percent stabilizer into a clay-silt material produced large increases in the load-bearing capacity of the material in terms of its unsoaked California Bearing Ratio (CBR). They observed that increases in the temperature of the curing environment led to increased strength formation. Cure times for the stabilization agent were reported as low as 3 hours. Gopal et al. (3) performed comparative studies using urea-formaldehyde (UF) and its copolymers to stabilize dune sand. Specimens were prepared at different combinations of UF ratios, pH levels, and acid catalysts. All specimens were cured for 6 hours at 60oC. The results showed a maximum UC strength of 16 181 kPa. Lowering the pH of the additive mixture using phosphoric acid catalysts improved the relative strength increase of the specimens. The optimum UF ratio for their experiment was 1:2.25 urea to formaldehyde by weight. Gopal et al. recommended using 9 percent resin and 0.3 percent acid catalyst for stabilizing dune sands. Vvedenskaya et al. (4) used copolymers to consolidate sands, silts, and clays. The copolymers used were guanidine acrylate (GA), methylene bisacrylamide (MBAM), and ethylene dimethacrylamide (EDMA). The additive formula consisted of a 24:1 ratio of vinyl monomer to diene. They reported increased strength due to increased hydrogen bonding, increased copolymer yield, and increased intermolecular bonding. The combination of GA and EDMA performed best in sands and loams followed by GA combined with MBAM. They

Santoni, R., Tingle, J., and Webster, S.
4
reported an increase in UC strength of 2452 - 2942 kPa for a 5 percent additive mixture in sand. Vvedenskaya et al. reported that the formation of the polymer-soil structure in soil consolidation was completed in less than 10 days. They recommended that the additive quantity should range between 5 and 10 percent. Palmer et al. (5) conducted experiments to evaluate the strength and density modification of unpaved roads using lignin sulfonate (lignin), calcium chloride (CaCl2), and magnesium chloride (MgCl2). Additive concentrations ranged from 1.0 - 3.25 percent by dry weight. Laboratory results indicated that lignin was the only product of the three tested that increased specimen density. Laboratory tests on specimens subjected to 4 wet-dry cycles indicated reduced UC strength with increasing additive content. The maximum reported UC strength was 7661 kPa for a 7-day air-dried silty-sand (SM) specimen stabilized with lignin at a concentration of 2.5 percent by dry weight. Dry UC strength results for CaCl2 and MgCl2 stabilized soils were lower than control specimens. However, the field application of lignin performed poorly due to a combination of poor application methods and the high solubility of lignin sulfonate. Palmer et al. reported effective dust control of a lignin-modified unpaved road for a period of 28 days with nominal dust abatement for a total period of 69 days. Erosion and leaching of the lignin during exposure to moisture were identified as the primary source of strength degradation. These results suggest good performance with lignin in terms of increased strength, while poor performance in terms of moisture susceptibility. MATERIALS The stabilization additives used in the experiment were grouped into 7 categories: traditional additives, acids, enzymes, lignosulfonates, petroleum resins, polymers, and tree resins. The traditional stabilization additives included: 1 Type I Portland cement, 1 hydrated lime, and a cationic asphalt emulsion. The remaining additives consisted of 1 acid, 4 enzymes, 2 lignosulfonates, 1 petroleum emulsion, 3 polymers, and 1 tree resin. Generic product names were used in this paper. Due to the proprietary nature of the commercial stabilization additives used in this research, the chemical composition and reinforcement mechanism by which they stabilize are relatively unknown. Manufacturers and distributors of these additives claim widespread performance of these products for “most” soil types and stabilization environments. A detailed analysis of the chemical composition of these products and their reinforcement mechanisms is beyond the scope of this paper. Material data sheets can be obtained through solicitation from individual manufacturers.
The silty-sand (SM) material used in this experiment was blended from a combination of a typical “concrete” sand (SP), a loess silt (ML), and a uniform pea gravel (GP). The grain size distribution and pertinent properties of the source and blended materials are shown in Table 1. The sand used for the investigation contained approximately 34 percent gravel sizes, 46 percent of sand sizes, and 20 percent minus No. 200 U.S. standard sieve size material. It was classified as silty-sand (SM) sand, American Society for Testing and Materials (ASTM) D 2487. Forty-four percent of the worldwide surface soils are classified as SM soil (6). SM soils are the most predominant soils across all climatic zones (i.e. tropical, dry, humid mesothermal, humid microthermal, polar, and undifferentiated highlands) worldwide.
Santoni, R., Tingle, J., and Webster, S.
5
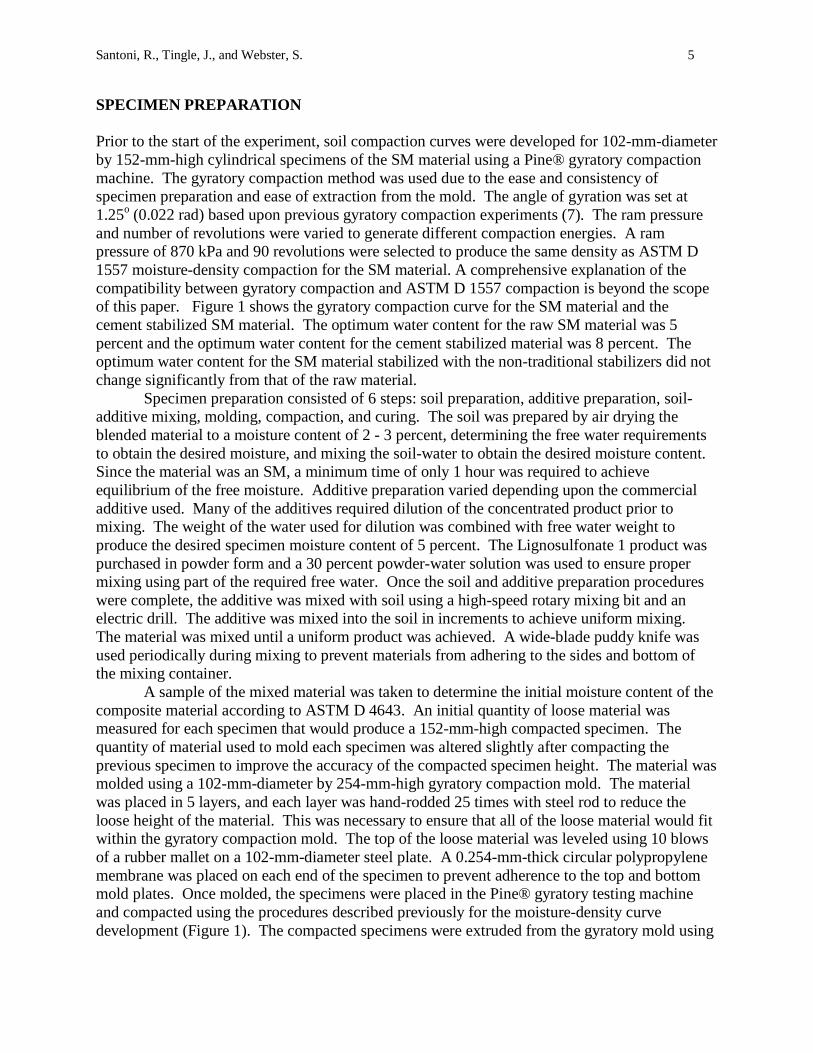
SPECIMEN PREPARATION Prior to the start of the experiment, soil compaction curves were developed for 102-mm-diameter by 152-mm-high cylindrical specimens of the SM material using a Pine® gyratory compaction machine. The gyratory compaction method was used due to the ease and consistency of specimen preparation and ease of extraction from the mold. The angle of gyration was set at 1.25o (0.022 rad) based upon previous gyratory compaction experiments (7). The ram pressure and number of revolutions were varied to generate different compaction energies. A ram pressure of 870 kPa and 90 revolutions were selected to produce the same density as ASTM D 1557 moisture-density compaction for the SM material. A comprehensive explanation of the compatibility between gyratory compaction and ASTM D 1557 compaction is beyond the scope of this paper. Figure 1 shows the gyratory compaction curve for the SM material and the cement stabilized SM material. The optimum water content for the raw SM material was 5 percent and the optimum water content for the cement stabilized material was 8 percent. The optimum water content for the SM material stabilized with the non-traditional stabilizers did not change significantly from that of the raw material.
Specimen preparation consisted of 6 steps: soil preparation, additive preparation, soil-additive mixing, molding, compaction, and curing. The soil was prepared by air drying the blended material to a moisture content of 2 - 3 percent, determining the free water requirements to obtain the desired moisture, and mixing the soil-water to obtain the desired moisture content. Since the material was an SM, a minimum time of only 1 hour was required to achieve equilibrium of the free moisture. Additive preparation varied depending upon the commercial additive used. Many of the additives required dilution of the concentrated product prior to mixing. The weight of the water used for dilution was combined with free water weight to produce the desired specimen moisture content of 5 percent. The Lignosulfonate 1 product was purchased in powder form and a 30 percent powder-water solution was used to ensure proper mixing using part of the required free water. Once the soil and additive preparation procedures were complete, the additive was mixed with soil using a high-speed rotary mixing bit and an electric drill. The additive was mixed into the soil in increments to achieve uniform mixing. The material was mixed until a uniform product was achieved. A wide-blade puddy knife was used periodically during mixing to prevent materials from adhering to the sides and bottom of the mixing container.
A sample of the mixed material was taken to determine the initial moisture content of the composite material according to ASTM D 4643. An initial quantity of loose material was measured for each specimen that would produce a 152-mm-high compacted specimen. The quantity of material used to mold each specimen was altered slightly after compacting the previous specimen to improve the accuracy of the compacted specimen height. The material was molded using a 102-mm-diameter by 254-mm-high gyratory compaction mold. The material was placed in 5 layers, and each layer was hand-rodded 25 times with steel rod to reduce the loose height of the material. This was necessary to ensure that all of the loose material would fit within the gyratory compaction mold. The top of the loose material was leveled using 10 blows of a rubber mallet on a 102-mm-diameter steel plate. A 0.254-mm-thick circular polypropylene membrane was placed on each end of the specimen to prevent adherence to the top and bottom mold plates. Once molded, the specimens were placed in the Pine® gyratory testing machine and compacted using the procedures described previously for the moisture-density curve development (Figure 1). The compacted specimens were extruded from the gyratory mold using

Santoni, R., Tingle, J., and Webster, S.
6
the hydraulic jack extrusion device mounted on the Pine® machine. The height of the compacted sample was recorded by the Pine®’s software, and the compacted sample was weighed to calculate the as-molded wet and dry densities.
The compacted specimen was then placed in a temperature-controlled room where it was allowed to cure at 22.2oC and 40 percent relative humidity for various cure times. The curing process could be considered an air-dried rather than moist curing process. This method of curing was selected to represent field conditions during military construction operations and was also preferred by the suppliers of the non-traditional stabilizers over a moist-cure process. The curing process primarily consisted of the evaporation of moisture from the specimens over time and the hardening or cementation of the additive-soil matrix. TESTS AND RESULTS Tests Six specimens of each mixture were prepared in the manner described. Three of the 6 specimens were subjected to UC tests once the designated curing period was complete. These specimens were tested according to the “dry” test procedure. The remaining 3 specimens were tested according to the “wet” test procedure. Since the probability of exposure to moisture during the stabilized materials performance life in a pavement system is extremely high, a “wet” test procedure was developed to evaluate the stabilized material’s moisture susceptibility. Several wet test procedures were evaluated, but were deemed to be either not representative of field conditions, too complicated for large numbers of repetitions, or too harsh to permit effective specimen evaluation. Thus, a simplistic “wet” test procedure was developed in which the cured specimen was placed on its side in 25.4-mm of water for a period of 15 minutes (Figures 3 and 4). The specimen was then removed from the water and allowed to drain for 5 minutes. The specimen was then subjected to UC testing. This “wet” procedure permitted a visual observation of the susceptibility to moisture, as well as, a physical evaluation of structural strength loss. The time for exposure to moisture was selected as 15 minutes, based upon the deterioration rate of the control specimens.
The UC tests were conducted using an Instron® 4208 testing system. The Instron® system consists of the test loading instrument and a computer for load-time recording of results. The test specimen was positioned in the test instrument, and a seating load of 0.45 kg was applied. This initial load was required to ensure satisfactory seating of the compression piston, and it was considered as the zero load when determining the load-deformation relationship. The load was applied to each stabilized specimen at a constant rate of 0.042 mm per second. Each specimen was compressed until it reached a preset axial strain of 0.08 or until it collapsed. Results Table 2 shows a tabulation of the results of testing the 15 stabilization additives and the control specimens. The table divides the additives into the stabilizer categories described previously based upon the general composition of the additive. The results of the unconfined compression tests were used as an index of specimen performance. The performance of test specimens relative to the performance of the control specimen, and each other, provided a means of evaluating the effects of curing time, durability in terms of wet and dry conditions, stabilizer type, and stabilizer quantities. The control specimen was a SM sand specimen prepared at the target moisture content without any stabilizer. For these experiments, significant strength

Santoni, R., Tingle, J., and Webster, S.
7
improvement was defined as a minimum increase in the compressive strength of the stabilized specimen of 345 kPa over the strength reported for the control specimens. Effect of Stabilizer Type The effect of stabilizer type was evaluated by testing six control samples, thirteen nontraditional stabilizer types, and three traditional stabilizer types (Table 2). The results of the tests indicated that some of nontraditional stabilizers significantly improved the UC strength of SM sand while others had no significant effect on the UC strength. Of the three traditional stabilizers tested, only cement improved the UC strength by more than 100 percent for both the dry and wet test conditions. The asphalt and lime did not did not improve the UC strength of the SM soil for either the dry or wet test conditions. For the nontraditional stabilizers, neither the acid, petroleum emulsion, and any of the four enzymes tested improved the UC strength of the SM soil for either the dry or wet test conditions. The Tree Resin 1 and Lignosulfonate 1 products showed improved UC strength only for the wet test condition. Polymer 1, Polymer 2, and Polymer 3 showed good potential for stabilizing the SM soil. Figure 2 illustrates typical test results identifying the effect of stabilizer types on specimen performance using the stabilizers that performed the best (i.e. cement, Lignosulfonate 1, and Polymer 1, 2, and 3). Effect of Wet and Dry Test Conditions As discussed earlier, the treated and untreated samples were tested using dry and wet test procedures to provide an indication of the material’s moisture susceptibility. After a 28-day curing period, UC tests were conducted on wet and dry specimens. Placing the specimens in 25.4 mm of water for 15 minutes provided an excellent indicator of the material’s durability under wet conditions. The deterioration of the specimens due to moisture exposure reduced the UC strength of all 120 specimens tested (i.e. control and stabilized specimens). The load bearing capacity of the control specimens were reduced by an average of 67 percent when tested under the wet condition. The 9 percent cement and asphalt specimens provided excellent resistance to moisture deterioration and did not loose any strength when tested under the wet condition; however, none of the asphalt concentrations tested provided any strength improvement over the control specimens. In addition, the control specimen and all specimens stabilized with Acid 1, Enzyme 1, Enzyme 2, Enzyme 3, Enzyme 4, and Lignosulfonate 2 began to disintegrate once they were placed in the water in preparation for the wet UC test. The disintegration reduced the UC strength and altered the cross sectional area of the specimens. Figures 3 and 4 show the Enzyme 1 sample and its disintegration during the 15-minutes soaking period. In summary, the results indicate that the polymers performed well under both dry and wet condition. The Lignosulfonate 1 and Tree Resin 1 performed good under wet conditions for SM soils.
Minimal disintegration was observed for samples stabilized with Lignosulfonate 1, Tree Resin 1, Polymer 1, Polymer 2, Polymer 3, and Petroleum Emulsion 1. Even though Lignosulfonate 1, Tree Resin 1, and Petroleum Emulsion did not disintegrate, they did not provide any improvement in the SM UC strength. While these products did not provide significant strength improvement for stabilization, these three products demonstrated potential as waterproofing or dust control products since the samples prevented loss of fines during the wet test. The results further indicated that Polymer 1, Polymer 2, and Polymer 3 provide both strength increases and increased resistance to moisture damage.

Santoni, R., Tingle, J., and Webster, S.
8
Effect of Additive Quantities Low, medium, and high additive quantities were used to evaluate each stabilizer against the untreated sample and between each other (Table 2). The low quantity was the amount of additive recommended by the manufacturer. The medium and high quantities were selected to see if an optimum quantity of stabilizer existed or if UC strength could be increased with increased quantities. The stabilizer quantities for the cement, asphalt, and lime were based on recommendations provided in Army Technical Manual 5-822-14 (8). For asphalt and lime, increasing the amount of stabilizer did not provide any benefit to SM soil strength. However, the inclusion of nine percent cement increased the UC dry strength by over 100 percent and UC wet strength by over 600 percent when compared to the control sample. For some of the nontraditional stabilizers, there was an optimum amount of stabilizer in which the UC strength and density are maximized (Figure 5). For example, the optimum amounts of Lignosulfonate 1 and Polymer 1 were 5 and 2.5 percent, respectively. Lignosulfonate 1 provided a slight increase in both, the density and strength of the stabilized SM sand when compared to the control sample. These additive quantities represent 72 percent less material when compared with cement. For Polymer 2, the additive quantity was 44 percent less than cement. The results of the laboratory testing revealed that Petroleum Emulsion 1 specimens exhibited softening characteristics when the concentration was increased from 2 to 9 percent, i.e., decreasing UC strength with a corresponding increase in stabilizer amount (Figure 6). The densities of the same specimens decreased with increasing amounts of stabilizer. The Petroleum Emulsion 1 could require additional cure time, less than 2 percent of additive, or the addition of a drying agent. Effect of Curing Time The effect of curing time is presented in Table 3. The effect was evaluated for low stabilizer concentration. Samples were cured for 1, 7, and 28 days, and all samples were tested under dry conditions. The moisture content of each sample decreased with increasing curing time as shown Table 3. More than fifty percent of the moisture had evaporated by the 7th day of curing in all the stabilizer samples with the exception of cement, which had lost 30 percent of its original moisture. For the 28-day cure period, the samples stabilized with acid, lignosulfonate, enzymes polymers, petroleum emulsion, and tree resin retained approximately 0.1, 0.7, 0.9, 0.6, 0.3, and 1.1 percent moisture, respectively. In each case, the UC strength increased with the increasing curing time and decreasing moisture content. The samples were still gaining strength after the 28-day curing period (Figure 7). The traditional stabilizers developed approximately 60 percent of its 28-day strength within the first 7 days. Then, they gained 40 percent more strength after 28 days when compared with the 7-day strength. The nontraditional stabilizers gained over 100 percent of strength in 7 days. When compared the 28 days strength with the 7-day strength, the strength was 35 percent higher. The Lignosulfonate 1, Lignosulfonate 2, and Tree Resin 1 gained more than 100 percent after 28 days. These results showed that for the same cure conditions, the nontraditional stabilizers gained their strength 40 percent faster in 7 days then did the cement or lime specimens. Repeatability of Laboratory Tests The ability to reproduce test results for specimens with similar compositions was evaluated during the laboratory experiment. The purpose of repeating the laboratory tests was to determine

Santoni, R., Tingle, J., and Webster, S.
9
the variability of the mixing, test procedures, and materials. For each condition (i.e. wet and dry conditions, stabilizer type, and stabilizer quantities), three specimens were prepared and tested. The data indicated that the standard deviations for the specimen’s height, water content, dry density, and UC strength range from ranged 2.54 – 50.8 mm, 0 – 0.5 percent, 0 – 19 kg/m3, and 0 – 110.3 kPa, respectively. The low variability can be attributed to the sample uniform mixing, consistent compaction, proper curing of specimens, and careful laboratory test procedures followed. CONCLUSIONS AND RECOMMENDATION Conclusions The results of the laboratory experiment produced several conclusions regarding stabilization of SM material with traditional and nontraditional additives. The conclusions are based only on the test conditions presented. 1. Polymers 1, 2, and 3 have good potential to increase strength of SM soils under wet and dry
conditions. The UC strength of stabilized SM soil was increased by up to 60 percent when compared with the control sample.
2. Of the three traditional stabilizers (i.e. cement, asphalt, and lime) used in this experiment, only cement provided significant strength improvement for the SM soil for both wet and dry test conditions.
3. In general, both traditional and nontraditional stabilizers (except cement) lost strength under wet conditions. The polymers, however, maintained good strength potential in both dry and wet conditions. Petroleum Emulsion 1, Tree Resin 1, and Lignosulfonate 1 provided good waterproofing potential.
4. There is an optimum additive quantity for the maximum UC strength. The optimum additive quantity for acid was not determined. For the lignosulfonate, the optimum additive quantity was 5 percent. The optimum additive quantity ranges from 2.5 to 5 percent for the polymers and less than 1 percent for the enzymes. Petroleum Emulsion and Tree Resin optimum quantities were 2.08 and 9 percent, respectively. Significant savings can be realized by using these nontraditional products since traditional stabilization additives require up to 9 percent of cement or asphalt emulsion.
5. The nontraditional stabilizers gain strength quicker than traditional stabilizers. This reduction in required cure time could minimize construction time and delays.
Recommendation
The nontraditional stabilization products identified in this experiment as demonstrating significant performance improvement should be evaluated under actual field conditions and traffic loadings. In addition, other durability tests should be conducted or developed for these products to verify long-term performance of stabilized materials. ACKNOWLEDGEMENTS The research reported herein was sponsored by the Headquarters, Department of the Army. The support of the U.S. Army Engineering Research and Development Center, Waterways Experiment Station, is gratefully acknowledged.

Santoni, R., Tingle, J., and Webster, S.
10
REFERENCES
1. J.C. Oldham, R.C. Eaves, and D.W. White. Materials Evaluated As Potential Soil Stabilizers. Miscellaneous Paper S-77-15, U.S. Army Engineer Waterways Experiment Station, Vicksburg, MS, September 1977.
2. A. Ajayi-Majebi, W.A. Grissom, L.S. Smith, and E.E. Jones. Epoxy-Resin-Based
Chemical Stabilization of a Fine, Poorly Graded Soil System. In Transportation Research Record 1295, TRB, National Research Council, Washington, D.C., 1991.
3. R. Gopal, J. Singh, and G. Das. Chemical Stabilisation of Sand Comparative Studies On
Urea-Formaldehyde Resins As Dune Sand Stabiliser and Effect Of Compaction On Strength (Part IV). In Transactions of Indian Society of Desert Technology and University Centre of Desert Studies, Vol. 8 No. 2, Indian Society of Desert Technology, Jodhpur, India, 1983, pp. 13-19.
4. V.A. Vvedenskaya, N.E. Ogneva, V.V. Korshak, L.I. Mekhant’eva, and Ts.A. Goguadze.
Translated by E.A. Inglis. Consolidation of Over-Moist Soils by Copolymers of Guanidine Acrylate and Methacryloguanidine-Urea Hydrochloride with Certain Alkylidene Bisacrylamides. In Soviet Plastics, Vol. 7, Rubber and Technical Press, London, England, 1971, pp. 55-58.
5. J.T. Palmer, T.V. Edgar, and A.P. Boresi. Strength and Density Modification of Unpaved
Road Soils Due to Chemical Additives. Master’s Thesis, University of Wyoming, Department of Civil and Architectural Engineering, Laramie, Wyoming, January 1995.
6. J.H. Robinson and C.P. Rabalais. Performance of the Combat Engineer Vehicle with
Mineplow Operating Worldwide and in Theaters of Operations. Technical Report GL-93-23, U.S. Army Engineer Waterways Experiment Station, Vicksburg, MS, 1993.
7. L.M. Womack, J.F. Sirr, and S.L. Webster. Gyratory Compaction of Soil. Technical
Report S-68-6, U.S. Army Engineer Waterways Experiment Station, Vicksburg, MS, November 1969.
8. Headquarters, Department of the Army. Soil Stabilization for Pavements. Army
Technical Manual TM 5-822-14, Department of the Army, the Navy, and the Air Force, Washington, D.C., October 1994.

Santoni, R., Tingle, J., and Webster, S.
11
LIST OF TABLES AND FIGURES FIGURE 1 SM moisture-density curve development FIGURE 2 Typical test result for SM soils stabilized with polymers FIGURE 3 Enzyme 1 stabilizer during the 15-minutes soaking period of the wet test FIGURE 4 Enzyme 1 stabilizer after the wet test FIGURE 5 Effect of additive quantity on the UC strength FIGURE 6 Unconfined compressive strength softening of Petroleum Emulsion 1 FIGURE 7 Effect of curing time on SM samples stabilized with polymers TABLE 1 Properties of Source Materials and Blended Silty-Sand (SM) TABLE 2 Unconfined Compression Test Results and Density Measurements TABLE 3 Curing Time Results for SM Soil

Santoni, R., Tingle, J., and Webster, S.
13
2120
2140
2160
2180
2200
2220
2240
2260
2280
2 3 4 5 6 7 8 9 10
Moisture Content, %
Dry
Den
sity
, kg
/m3
132
134
135
136
137
139
140
141
142
Dry
Den
sity
, pcf
SM Control Sample
SM plus 7% Cement
FIGURE 1 SM moisture-density curve development

Santoni, R., Tingle, J., and Webster, S.
14
0
1379
2758
4137
5516
6895
8274
9653
11032
Control - 0% Cement - 9% Lignosulfonate1 - 5%
Polymer 1 -2.5%
Polymer 2 - 5% Polymer 3 -2.5%
Stabilizer Type
Un
con
fin
ed C
om
pre
ssiv
e S
tres
s, k
Pa
0
200
400
600
800
1000
1200
1400
1600
Un
con
fin
ed C
om
pre
ssiv
e S
tres
s, p
si
Polymers
Lignosulfonate
Wet
Dry
FIGURE 2 Typical test results for SM soils stabilized with polymers

Santoni, R., Tingle, J., and Webster, S.
15
FIGURE 3 Enzyme 1 stabilizer during the 15-minutes soaking period of the wet test

Santoni, R., Tingle, J., and Webster, S.
16
FIGURE 4 Enzyme 1 stabilizer after the wet test

Santoni, R., Tingle, J., and Webster, S.
17
1379
2758
4137
5516
6895
8274
0 1 2 3 4 5 6 7 8
Concentration, %
Un
con
fin
ed C
om
pre
ssiv
e S
tres
s, k
Pa
200
400
600
800
1000
1200
Un
con
fin
ed C
om
pre
ssiv
e S
tres
s, p
si
Lignosulfonate 1
Polymer 1
WET
WET
DRY
DRY
FIGURE 5 Effect of additive quantity on the UC strength

Santoni, R., Tingle, J., and Webster, S.
18
0
1379
2758
4137
5516
6895
0.0 0.1 0.1 2.1 5.0 9.0
Concentration
Un
con
fin
ed C
om
pre
ssiv
e S
tres
s, k
Pa
0
200
400
600
800
1000
Un
con
fin
ed C
om
pre
ssiv
e S
tres
s, k
Pa
Petroleum Emulsion 1
Acid 1
CONTROL
Enzyme 4
DR
Y
WE
T
FIGURE 6 Unconfined compressive strength softening of Petroleum Emulsion 1

Santoni, R., Tingle, J., and Webster, S.
19
0
1000
2000
3000
4000
5000
6000
0 5 10 15 20 25 30
Cure Time,days
Un
con
fin
ed C
om
pre
ssiv
e S
tren
gth
, kP
a
0
145
290
435
580
725
870
Un
con
fin
ed C
om
pre
ssiv
e S
tren
gth
, psi
Control
Polymer 3
Polymer 2
FIGURE 7 Effect of curing time on SM samples stabilized with polymers

Santoni, R., Tingle, J., and Webster, S.
20
TABLE 1 Properties of Source Materials and Blended Silty-Sand (SM) Sieve Sizes Percent Passing by Weight a
Standard Sieve Sizes
Metric Sizes (mm)
Concrete Sand
Loess Silt
Pea Gravel
Silty Sand Blend
Desired Gradation
1 25.4 100.0 100.0 100.0 100.0 100 0.75 19.1 100.0 100.0 99.0 99.6 0.5 12.7 100.0 100.0 97.3 98.9
0.375 9.5 99.8 100.0 88.6 95.4 60-100 4 4.8 95.7 99.0 20.7 66.4 50-85 8 2.4 87.6 98.5 11.0 59.1 40-70 16 1.2 79.4 98.0 6.3 53.9 40-70 30 0.5 70.1 97.8 4.8 49.5 25-45 50 0.3 23.7 97.5 1.9 29.7 25-45
100 0.15 2.3 97.3 1.1 20.8 200 0.08 1.5 97.0 0.7 20.3 12-30
0.05 94.0 18.8 0.01 23.0 4.6 0.005 14.0 2.8 0.001 11.0 2.2
D10 0.204 0.001 2.15 0.025
D30 0.33 0.014 5.44 0.30
D60 0.50 0.031 7.52 2.70 Cu or LL 2.43 LLc = 30% 3.50 NPc
Cc or PI 1.08 PIc = 4% 1.83 NPc
Classification b: SP ML GP SM a Gradations were determined according to ASTM D 442. b Soils classified according to ASTM D 2487. c Liquid Limit (LL), Plasticity Index (PI), and Nonplasticity (NP) were determined according to ASTM D 4318.

Santoni, R., Tingle, J., and Webster, S. 21
TABLE 2 Unconfined Compression Test Results and Density Measurements DRY WET
Stabilizer Type
Concentration
WC %
Dry Density kg/m3
Unconfined Compressive Strength, kPa
UC Dry Density kg/m3
WC %
Dry Density kg/m3
Unconfined Compressive Strength, kPa
UC Dry Density Kg/m3
Control Sample and Traditional Stabilizers None 0 4.9 2241 4621 2241 4.9 2254 1539 2254 Cement 5 6.3 2254 4667 2254 7.3 2223 3170 2223 Cement 7 7.7 2215 4704 2215 8.1 2207 3613 2207 Cement 9 6.0 2254 9562 2254 6.3 2238 9621 2238 Emulsified Asphalt 7 5.8 2159 1493 2159 6.3 2156 1477 2156 Emulsified Asphalt 8 4.9 2141 1505 2141 6.3 2146 1326 2146 Emulsified Asphalt 9 5.1 2143 1267 2143 6.3 2145 1251 2145 Lime 2 7.1 2207 966 2207 7.1 2216 732 2216 Lime 5 7.6 2167 1409 2167 7.6 2176 1168 2176
Nontraditional Stabilizers Acid 1 0.1 4.9 2231 4421 2231 4.9 2226 1435 2226 Lignosulfonate 1 2.9 5.5 2265 4148 2265 5.5 2261 3523 2261 Lignosulfonate 1 5 5.3 2241 4665 2241 5.3 2244 3559 2244 Lignosulfonate 1 8 6.2 2214 3456 2214 6.2 2218 2955 2218 Lignosulfonate 2 5 6.6 2196 3524 2196 6.6 2200 2869 2200 Enzyme 1 0.1 5.6 2234 3552 2234 5.6 2244 1653 2244 Enzyme 2 0.2 5.6 2254 2005 2254 5.6 2247 1266 2247 Enzyme 3 0.11 4.7 2261 3316 2261 4.7 2254 1432 2254 Enzyme 4 0.1 6.3 2228 4418 2228 4.9 2224 1623 2224 Polymer 1 0.1 5.1 2214 3693 2214 5.1 2221 2765 2221 Polymer 1 1.5 5.5 2230 5570 2230 5.5 2242 4385 2242 Polymer 1 2.5 6.5 2208 7618 2208 6.5 2211 5229 2211 Polymer 1 4 6.3 2193 7104 2193 6.3 2194 4903 2194 Polymer 2 1.03 4.8 2266 6134 2266 4.8 2260 4903 2260 Polymer 2 2.5 6.8 2203 5900 2203 6.8 2203 4254 2203 Polymer 2 5 5.6 2187 6693 2187 5.6 2198 5284 2198 Polymer 3 0.83 5.2 2239 6477 2239 5.2 2241 4353 2241 Polymer 3 2.5 5.5 2212 7395 2212 5.5 2217 5147 2217 Polymer 3 5 6.3 2170 8005 2170 6.3 2174 4645 2174 Petroleum Emulsion 1 2.08 4.9 2260 1939 2260 4.9 2260 1780 2260 Petroleum Emulsion 1 5 5.2 2199 847 2199 5.2 2206 608 2206 Petroleum Emulsion 1 9 4.8 2150 240 2150 4.8 2145 191 2145 Tree Resin 1 7 5.8 2183 2934 2183 5.8 2186 2463 2186 Tree Resin 1 8 5.3 2188 3760 2188 5.3 2187 3314 2187 Tree Resin 1 9 5.5 2164 4114 2164 5.5 2168 3179 2168

Santoni, R., Tingle, J., and Webster, S.
23
TABLE 3 Curing Time Results for SM Soil
Stabilizer Type
Stabilizer Percent
Cure Time Days
Unconfined Compressive Strength, kPa
UC WC %
Control and Traditional Stabilizers Control None 0 324 5.2 Control None 1 1461 2.2 Control None 7 2398 0.6 Control None 28 4621 0.1 Cement 7 1 2786 5.2 Cement 7 7 4945 3.7 Cement 7 28 4704 3.0 Lime 2 1 905 4.3 Lime 2 7 1445 1.5 Lime 2 28 1493 0.8
Nontraditional Stabilizers Acid 1 3 1 1114 2.8 Acid 1 3 7 2399 0.6 Acid 1 3 28 3321 0.1 Lignosulfonate 1 2.822 1 507 3.7 Lignosulfonate 1 2.822 7 1427 2.2 Lignosulfonate 1 2.822 28 4148 0.7 Lignosulfonate 2 3 1 498 4.0 Lignosulfonate 2 3 7 1315 2.4 Lignosulfonate 2 3 28 2887 0.6 Enzyme 1 0.015 1 1610 2.1 Enzyme 1 0.015 7 2657 0.7 Enzyme 1 0.015 28 3552 0.3 Enzyme 2 0.046 1 1342 2.5 Enzyme 2 0.046 7 2593 1.1 Enzyme 2 0.046 28 3238 0.9 Enzyme 4 0.002 1 1681 2.4 Enzyme 4 0.002 7 3040 0.9 Enzyme 4 0.002 28 8005 0.4 Polymer 1 0.055 1 1241 2.0 Polymer 1 0.055 7 2429 0.5 Polymer 1 0.055 28 3349 0.2 Polymer 2 1.028 1 1198 2.6 Polymer 2 1.028 7 3064 0.9 Polymer 2 1.028 28 6134 0.3 Polymer 3 0.827 1 1543 2.2 Polymer 3 0.827 7 3697 0.8 Polymer 3 0.827 28 6477 0.6 Petroleum Emulsion 1 2.076 7 740 1.6 Petroleum Emulsion 1 2.076 28 966 0.3 Tree Resin 1 7 1 583 2.4 Tree Resin 1 7 7 1561 1.6 Tree Resin 1 7 28 2934 1.1

1
Stabilization of SiltyStabilization of Silty--Sand with Sand with Nontraditional AdditivesNontraditional Additives
Rosa L. SantoniJeb S. TingleSteve L. Webster
Research Civil Engineers
Rosa L. Santoni – [email protected](601) 634-3379
Jeb S. Tingle – [email protected](601) 634-2467
Steve L. Webster– [email protected](601) 634-2282

2
� Develop knowledge base on stabilizers
� Laboratory investigation
� Performance capabilities and guidance criteria
Stabilization of SM Sands with Nontraditional AdditivesStabilization of SM Sands with Nontraditional Additives
II ObjectivesObjectives
II ApproachApproach
� Screen off-the-shelf nontraditional stabilizers
� Determine the benefits for SM soils

3
II Nontraditional StabilizersNontraditional Stabilizers
� Cement� Asphalt� Lime
Stabilization of SM Sands with Nontraditional AdditivesStabilization of SM Sands with Nontraditional Additives
� Acids� Enzymes� Lignosulfonates� Polymers� Petroleum Emulsions� Tree Resin
II Traditional StabilizersTraditional Stabilizers
Categories

4
Stabilization of SM Sands with Nontraditional AdditivesStabilization of SM Sands with Nontraditional AdditivesWorldwide Soil Types
8SC
10CH
21CL
44SM
PercentSoil Type

5
0
10
20
30
40
50
60
70
80
90
1000
10
20
30
40
50
60
70
80
90
100
PE
RC
EN
T F
INE
R B
Y W
EIG
HT
PE
RC
EN
T C
OA
RS
ER
BY
WE
IGH
T
U. S. STANDARD SIEVE OPENING IN INCHES U. S. STANDARD SIEVE NUMBERSHYDROMETER
GRAIN SIZE IN MILLIMETERS0.0010.010.1110100 50 5 0.5 0.05 0.005
4 3 2 1 3 4 6 8 10 14 16 20 30 40 50 70 100 140 20011/2 3/ 4 3/ 81/2
Stabilization of SM Sands with Nontraditional AdditivesStabilization of SM Sands with Nontraditional AdditivesParticle Distribution
Silty Sand (SM)

6
Stabilization of SM Sands with Nontraditional AdditivesStabilization of SM Sands with Nontraditional AdditivesCompaction Curve
2120
2140
2160
2180
2200
2220
2240
2260
2280
2 4 6 8 10Moisture Content, %
Dry
Den
sity
, kg
/m3
132
134
135
136
137
139
140
141
142
Dry D
ensity, p
cf
Control Sample
SM – Cement (7%)

7
Stabilization of SM Sands with Nontraditional AdditivesStabilization of SM Sands with Nontraditional AdditivesExperiment Design
Mechanical
Mechanical
Mechanical
Mechanical
Mechanical
Chemical
Chemical
Chemical
Chemical
Mechanical
Mechanical
Chemical
Chemical
Mechanical
Mechanical/Chemical
None
REINFORCEMENT MECHANISM
XXXTree Resin 1
XXXPetroleum Emulsion 1
XXXPolymer 3
XXXPolymer 2
XXXPolymer 1
XEnzyme 4
XEnzyme 3
XEnzyme 2
XEnzyme 1
XLignosulfonate 2
XXXLignosulfonate 1
XAcid 1
XXLime
XXXAsphalt
XXXCement
Control
HIGHMEDIUMLOW
STABILIZER STABILIZER QUANTITY

8
Stabilization of SM Sands with Nontraditional AdditivesStabilization of SM Sands with Nontraditional AdditivesSpecimen Preparation
SM Soil Preparation Soil-Additive MixingAdditive Preparation
Sample Molding Sample Compaction Sample Curing

9
Stabilization of SM Sands with Nontraditional AdditivesStabilization of SM Sands with Nontraditional AdditivesLaboratory Test
UC TEST
DRY TEST
UC Test
Soak Sample
Drain Sample
WET TESTUC Test

10
Stabilization of SM Sands with Nontraditional AdditivesStabilization of SM Sands with Nontraditional AdditivesEffect of Stabilizer Type
0
14
28
41
55
69
83
97
110
Control - 0% Cement - 9% Lignosulfonate1 - 5%
Polymer 1 -2.5%
Polymer 2 - 5% Polymer 3 -2.5%
(Hundreds)
Unc
onfin
ed C
ompr
essi
ve S
tren
ght,
kPa
0
200
400
600
800
1000
1200
1400
1600 Unconfined C
ompressive S
trength, p
si
WetDry
Lig
no
sulf
on
ate
Polymers

11
Stabilization of SM Sands with Nontraditional AdditivesStabilization of SM Sands with Nontraditional AdditivesEffect of Stabilizer Type
0
14
28
41
55
69
83
97
110
Control Enzyme 1 -0.1%
Enzyme 2 -0.2%
Enzyme 3 -0.105%
Enzyme 4 -0.1%
Hundreds
Unc
onfin
ed C
ompr
essi
ve S
tren
gth,
kP
a
0
200
400
600
800
1000
1200
1400
1600 Unconfined C
ompressive S
trength, psi
Enzymes
WetDry

12
Stabilization of SM Sands with Nontraditional AdditivesStabilization of SM Sands with Nontraditional AdditivesEffect of Stabilizer Type
0
14
28
41
55
69
83
97
110
Contro
l - 0%
Cemen
t - 5%
Cemen
t - 7%
Cemen
t - 9%
CSS-1
- 7%
CSS-1
- 8%
CSS-1
- 9%
Lime -
2%
Lime -
5%
Hundreds
Un
con
fin
ed C
om
pre
ssiv
e S
tren
gth
, kP
ai
0
200
400
600
800
1000
1200
1400
1600 Un
con
fined
Co
mp
ressive Stren
gth
, psi
Asphalt Lime
Cement

13
Stabilization of SM Sands with Nontraditional AdditivesStabilization of SM Sands with Nontraditional AdditivesEffect of Wet and Dry Conditions
II DisintegrationDisintegration
� Loss UC strength
� Alter cross section areaEnzyme 2
II WaterproofingWaterproofing
� Prevent loss of fines
� Potential for dust control
Control
Tree Resin 1

14
Stabilization of SM Sands with Nontraditional AdditivesStabilization of SM Sands with Nontraditional AdditivesEffect of Wet and Dry Conditions
II Poor PerformersPoor Performers
� Enzymes� Acid 1� Lignosulfonate 2
Acid 1
Enzyme 1
Lignosulfonate 2II Excellent PerformersExcellent Performers
� Polymers� Cement

15
Stabilization of SM Sands with Nontraditional AdditivesStabilization of SM Sands with Nontraditional AdditivesEffect of Additive Quantities
14
28
41
55
69
83
0 1 2 3 4 5 6 7 8
Hundreds
Concentration
Un
con
fin
ed C
om
pre
ssiv
e S
tren
gth
, kP
a
2
4
6
8
10
12Hundreds
Un
con
fined
Co
mp
ressive S
treng
th, p
si
Lignosulfonate 1
Polymer 1
WET
WET
DRY
DRY

16
014284155698397
110
Contro
l
Acid - 0
.1%TR
- 7%
TR - 8
%
TR - 9
%
PE - 2
.1%
PE - 5
%
PE - 9
%
Hundreds
Un
con
fin
ed C
om
pre
ssiv
e S
tren
gth
, kP
a
0246810121416Hundreds
Un
con
fined
Co
mp
ressive S
treng
th, p
siStabilization of SM Sands with Nontraditional AdditivesStabilization of SM Sands with Nontraditional Additives
Effect of Additive Quantities
Petroleum Emulsion
WetDry
Acid Tree Resin

17
0
7
14
21
28
34
41
48
55
0 5 10 15 20 25 30
Hundreds
Cure Time,days
Un
con
fin
ed C
om
pre
ssiv
e S
tren
gth
, kP
a
0
1
2
3
4
5
6
7
8Hundreds
Un
con
fined
Co
mp
ressive S
treng
th, p
siStabilization of SM Sands with Nontraditional AdditivesStabilization of SM Sands with Nontraditional Additives
Effect of Curing Time
Control
Polymer 2
Polymer 3

18
Stabilization of SM Sands with Nontraditional AdditivesStabilization of SM Sands with Nontraditional AdditivesRepeatability of Tests
II VariabilityVariability� Height – 2.54 to 5.08 mm� Water Content – 0 to 0.5 %� Dry Density – 0-19 kg/m3
� UC Strength – 0-110.3 kPa
II SamplesSamples
� Wet Condition – 3 samples� Dry Condition – 3 samples

19
Stabilization of SM Sands with Nontraditional AdditivesStabilization of SM Sands with Nontraditional AdditivesSummary
II ConclusionsConclusions� Polymers and cement are excellent stabilizers� Waterproofing potential
� Optimum additive quantity
� Nontraditional stabilizers gain strength quicker
☯ Petroleum Emulsion 1☯ Tree Resin 1☯ Lignosulfonate 1
☯ Enzymes < 1☯ Lignosulfonates – 5%☯ Petroleum Emulsion – 2%☯ Polymers – 2.5 to 5%☯ Tree Resin – 9%

20
Stabilization of SM Sands with Nontraditional AdditivesStabilization of SM Sands with Nontraditional AdditivesSummary
II RecommendationsRecommendations� Evaluate long-term performance
� Conduct field condition and traffic loading
� Establish stabilization mechanisms