soil quality demonstrations and procedures dr. kris ... quality demos... · part 1: dry sieving to...
TRANSCRIPT

Soil Quality Demonstrations and Procedures Dr. Kris Nichols
[email protected] USDA-ARS-Northern Great Plains Research Laboratory
Mandan, ND January, 2011
K.A. Nichols
1
Contents
Activities ---------------------------------------------------------------------------------------------------------------------- 1-23 Soil as a Precious Resource 1
Soil Clod and Scum Test 2 Sponge and Bucket - Soil Water Movement 4 Rainfall Simulator - Soil Erosion 6 Water infiltration, Water Holding Capacity and Nitrate Leaching 9 Soil Macroaggregate Scale Model 12 Energy Soil Model 14
Soil Aggregate Stability Analysis - Method I 15 Part 1: Dry sieving to collect soil aggregates 15 Part 2: Wet Sieving to measure water stable aggregation (WSA) 17 Soil Aggregates Stability Analysis - Method II 21 Winogradsky Column - Soil Biology 24
Soil Structure - Dirt Cake 28 Soil Aggregates - Edible Stability 30
References ------------------------------------------------------------------------------------------------------------------ 3311--3322 Websites 31 Journal Articles 32
Disclaimer
The coalition of these procedures and some of the procedures themselves come from work sponsored by the United States Government. While these procedures are believed to contain correct information, neither the United States Government nor any agency thereof, nor any of their employees, makes any warranty, expressd or implied, or assumes any legal or financial responsibility for the accuracy, completeness, lack of defect, or usefulness of any information, apparatus, product, or process disclosed, or represents that its use would not infringe privately owned rights. Reference herein to any specific commercial product, process, or service by its trade name, trademark, manufacturer, or otherwise, does not necessarily constitute or imply its endorsement, recommendation, or favoring by the United States Government or any agency thereof. Some of the procedures come from other sources which have been referenced and have been used successfully by Dr. Nichols, but the above disclaimer applies to those procedures as well.
K.A. Nichols
2
USDA-Natural Resources Conservation Service, Syracuse, NY Soil Is a Precious Resource
and Dr. Elissa Levine at NASA
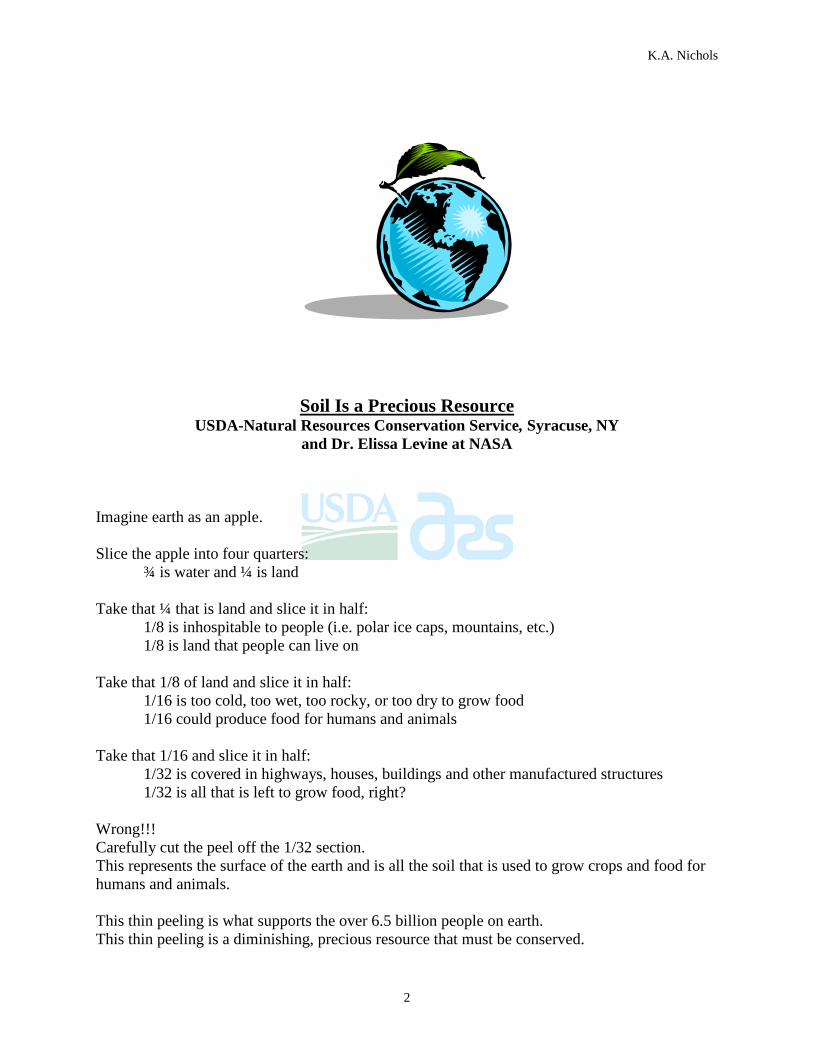
Imagine earth as an apple. Slice the apple into four quarters:
¾ is water and ¼ is land Take that ¼ that is land and slice it in half: 1/8 is inhospitable to people (i.e. polar ice caps, mountains, etc.) 1/8 is land that people can live on Take that 1/8 of land and slice it in half: 1/16 is too cold, too wet, too rocky, or too dry to grow food 1/16 could produce food for humans and animals Take that 1/16 and slice it in half: 1/32 is covered in highways, houses, buildings and other manufactured structures 1/32 is all that is left to grow food, right? Wrong!!! Carefully cut the peel off the 1/32 section. This represents the surface of the earth and is all the soil that is used to grow crops and food for humans and animals. This thin peeling is what supports the over 6.5 billion people on earth. This thin peeling is a diminishing, precious resource that must be conserved.

K.A. Nichols
3
Wright and Upadhyaya, 1998; 1999 Soil Clod and Scum Tests
Introduction: Soil structure impacts soil functions such as air and water flow, biological growth, and nutrient cycling. If this structure is not very stable and easily falls apart upon getting wet, then the soil will not be able to function well. This demonstration may be used to see how easily soil falls apart. Materials: Soil clods Large, clear beaker or jar Water Method:
1. Take one or more large soil clod(s) (the drier the clods the better) from two or more sites and drop them into a large, clear beaker, jar, or other container filled with water. Use a separate container for each site
2. Wait a few minutes and then gently shake the container to break up some more of the clod.
Observations:
1. As clods sink, observe bubbles coming out of the clods and how quickly and how much of the clods break apart. Also, observe the formation of a white scum layer on the water surface, which looks similar to a soap scum layer.
2. After shaking, again observe bubbles coming out of the clods, how quickly and how much of the clods break apart, and the formation of a white scum layer on the water surface.
What is happening:
1. Initially, bubbles will be released as the air in the pore spaces between aggregates is replaced by water. As the clods reach the bottom of the container, the amount of bubbles formed should slow, except in samples that do not have a large amount of stable soil aggregates.
2. The bubbles formed after the clod has reached the bottom of the container or after gently shaking are mostly from air trapped within the aggregates. When water rapidly enters an aggregate because there is no protection on the aggregate surface (i.e. stability), air pressure builds within the aggregate causing the aggregate to rupture. Rupturing of the aggregates within a clod causes the clod to break apart.
3. The white scum is an indicator of the presence of glomalin in the soil, but this glomalin is not attached to aggregates and forms the scum.
Alternative/Additional Method:
1. Collect soil samples from two or more sites with a shovel keeping it intact as much as possible.
2. Air-dry the sample, if possible, trying to keep it intact.
K.A. Nichols
4
3. Drop the sample into a large bucket filled with water. Alternatively, you could place the sample in a large mesh screen or fine net and gather the edges to form a bag.
4. Manually move the sample up and down in the water to break it apart as much as possible using the bag or net or holding onto a small portion of the sample, such as part of the stem from the soil surface.
Observations:
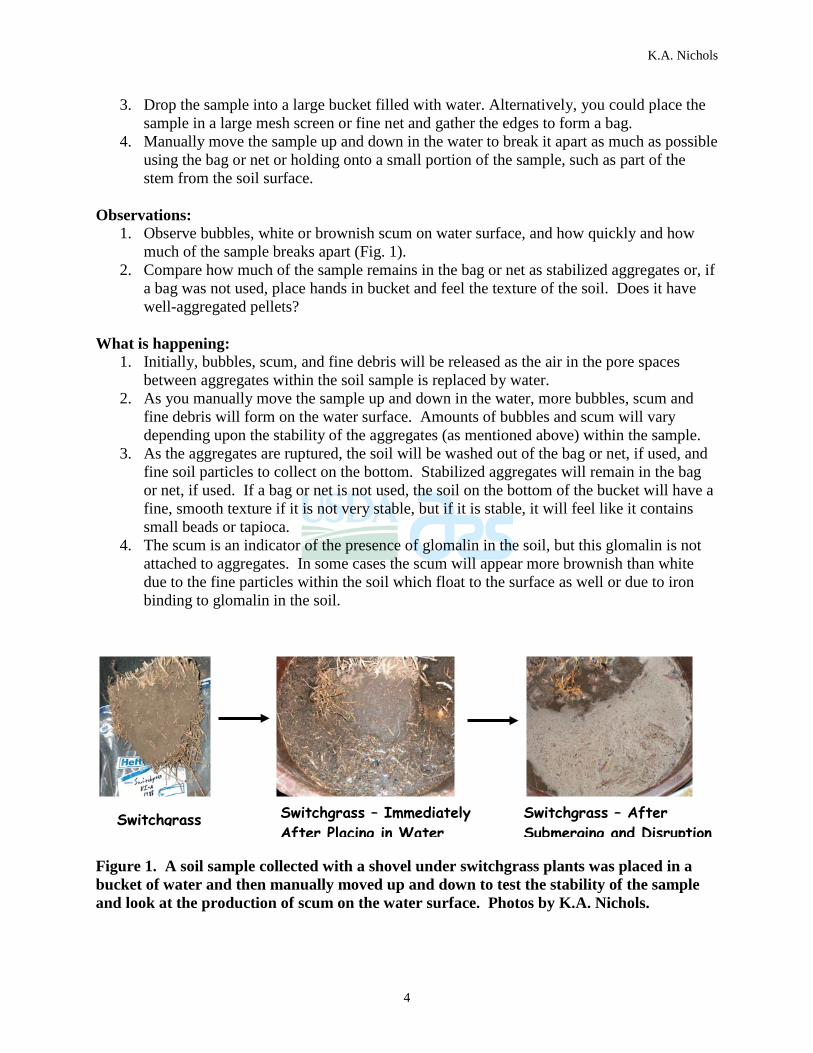
1. Observe bubbles, white or brownish scum on water surface, and how quickly and how much of the sample breaks apart (Fig. 1).
2. Compare how much of the sample remains in the bag or net as stabilized aggregates or, if a bag was not used, place hands in bucket and feel the texture of the soil. Does it have well-aggregated pellets?
What is happening:
1. Initially, bubbles, scum, and fine debris will be released as the air in the pore spaces between aggregates within the soil sample is replaced by water.
2. As you manually move the sample up and down in the water, more bubbles, scum and fine debris will form on the water surface. Amounts of bubbles and scum will vary depending upon the stability of the aggregates (as mentioned above) within the sample.
3. As the aggregates are ruptured, the soil will be washed out of the bag or net, if used, and fine soil particles to collect on the bottom. Stabilized aggregates will remain in the bag or net, if used. If a bag or net is not used, the soil on the bottom of the bucket will have a fine, smooth texture if it is not very stable, but if it is stable, it will feel like it contains small beads or tapioca.
4. The scum is an indicator of the presence of glomalin in the soil, but this glomalin is not attached to aggregates. In some cases the scum will appear more brownish than white due to the fine particles within the soil which float to the surface as well or due to iron binding to glomalin in the soil.
Figure 1. A soil sample collected with a shovel under switchgrass plants was placed in a bucket of water and then manually moved up and down to test the stability of the sample and look at the production of scum on the water surface. Photos by K.A. Nichols.
Switchgrass Switchgrass – Immediately After Placing in Water
Switchgrass – After Submerging and Disruption
K.A. Nichols
5
Sponges for Soil Properties; Sponge and Bucket; and How Soil Acts as a Water and Sponge websites
Sponge and Bucket - Soil Water Movement
Introduction: Water movement in soils is dicated by the amount, size, and continuity of soil pores or soil structure. The larger number and size of pores as well as continuous linkage between pores allows water on the surface to rapidly enter the soil. However, if pore size and number is too large, such as in very rocky or sandy soils, the water flows rapidly through the soil resulting in droughty conditions. Therefore, it is highly desirable for soil to have a balance between enough pore space to allow rapid water infiltration to prevent ponding but not so much pore space to result in little water retention for plant growth. Materials: Buckets or similar containers Sponges – use sponges of similar sizes (cut if necessary) but with differing amounts or sizes of
openings Water Food coloring, optional Graduated cylinder or measuring cup, optional Balance, optional Method:
1. Discuss how the structure of the soil is similar to the structure of soil with pore spaces and solid spaces (created by soil aggregates, minerals, organic matter, and other soil particles). Show how different sponges differ in the amounts and sizes of pores and how this impacts water movement.
2. Dip sponge in bucket and allow it to get saturated. Show how the sponges differ in getting wet.
3. Pull sponge out of water and let drip 4. Once at ‘field capacity’ or it stops dripping, squeeze to release plant available water and
collect in an empty container. (Optional) Measure the amount of water with a graduated cylinder or measuring cup.
5. Sponge is still wet indicating unavailable water 6. (Optional) Weigh the wet sponge and let it dry at room temperature over the next several
days. Weighing daily. When the weight no longer changes, the sponge is completely dry. Subtract the dry weight from the initial weight giving the weight of unavailable water. This may be converted to volume based on 1 gram equaling 1 milliliter of water.
Observations:
1. Observe how much water comes out of the sponge after removing it from the water and letting it drip.
2. Observe how much water comes out of the sponge with squeezing. 3. (Optional) Measure the amount of unavailable water.
What is happening:

K.A. Nichols
6
1. Differing amounts of pore space will impact water movement. 2. The water that drips out of the sponge is considered to be gravitational water and is water
that moves into and out of the large pore space between aggregates, root channels, earthworm casts, etc. due to gravity.
3. The water that is squeezed out of the sponge is water within the smaller pores between aggregates and other soil components. This water is available to the plants with some exertion of energy.
4. The water that is in the wet sponge is plant unavailable, because it would take too much energy to remove it from within the fine pores and aggregates where it is cohesively bound.
K.A. Nichols
7
Hold That Soil; Soil Erosion Demonstration; and Soil Education websites and USDA-NRCS protocol
Soil Erosion - Rainfall Simulator
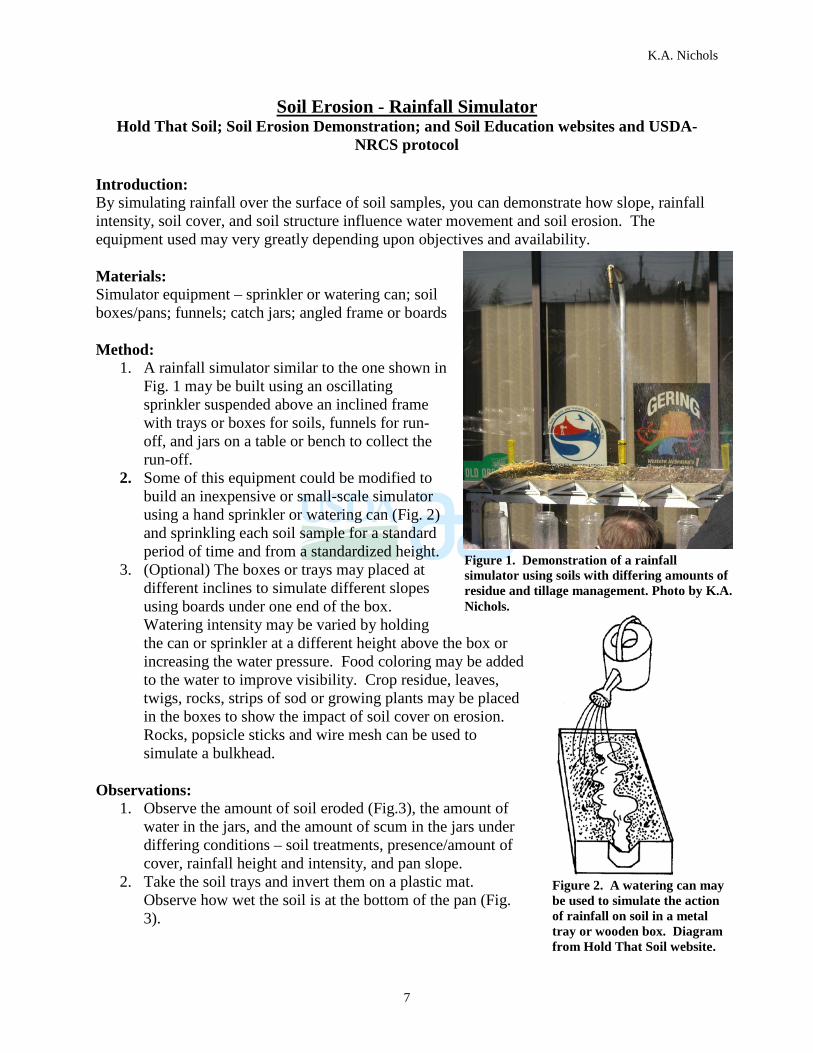
Introduction: By simulating rainfall over the surface of soil samples, you can demonstrate how slope, rainfall intensity, soil cover, and soil structure influence water movement and soil erosion. The equipment used may very greatly depending upon objectives and availability. Materials: Simulator equipment – sprinkler or watering can; soil boxes/pans; funnels; catch jars; angled frame or boards Method:
1. A rainfall simulator similar to the one shown in Fig. 1 may be built using an oscillating sprinkler suspended above an inclined frame with trays or boxes for soils, funnels for run-off, and jars on a table or bench to collect the run-off.
2. Some of this equipment could be modified to build an inexpensive or small-scale simulator using a hand sprinkler or watering can (Fig. 2) and sprinkling each soil sample for a standard period of time and from a standardized height.
3. (Optional) The boxes or trays may placed at different inclines to simulate different slopes using boards under one end of the box. Watering intensity may be varied by holding the can or sprinkler at a different height above the box or increasing the water pressure. Food coloring may be added to the water to improve visibility. Crop residue, leaves, twigs, rocks, strips of sod or growing plants may be placed in the boxes to show the impact of soil cover on erosion. Rocks, popsicle sticks and wire mesh can be used to simulate a bulkhead.
Observations:
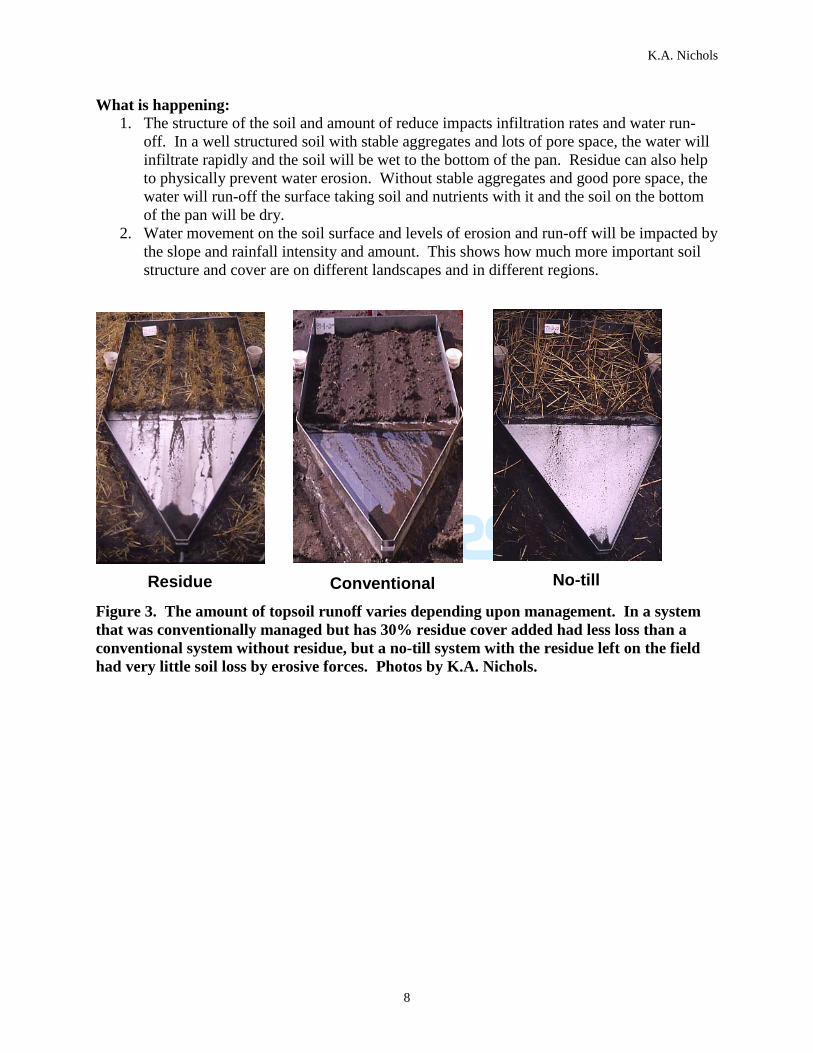
1. Observe the amount of soil eroded (Fig.3), the amount of water in the jars, and the amount of scum in the jars under differing conditions – soil treatments, presence/amount of cover, rainfall height and intensity, and pan slope.
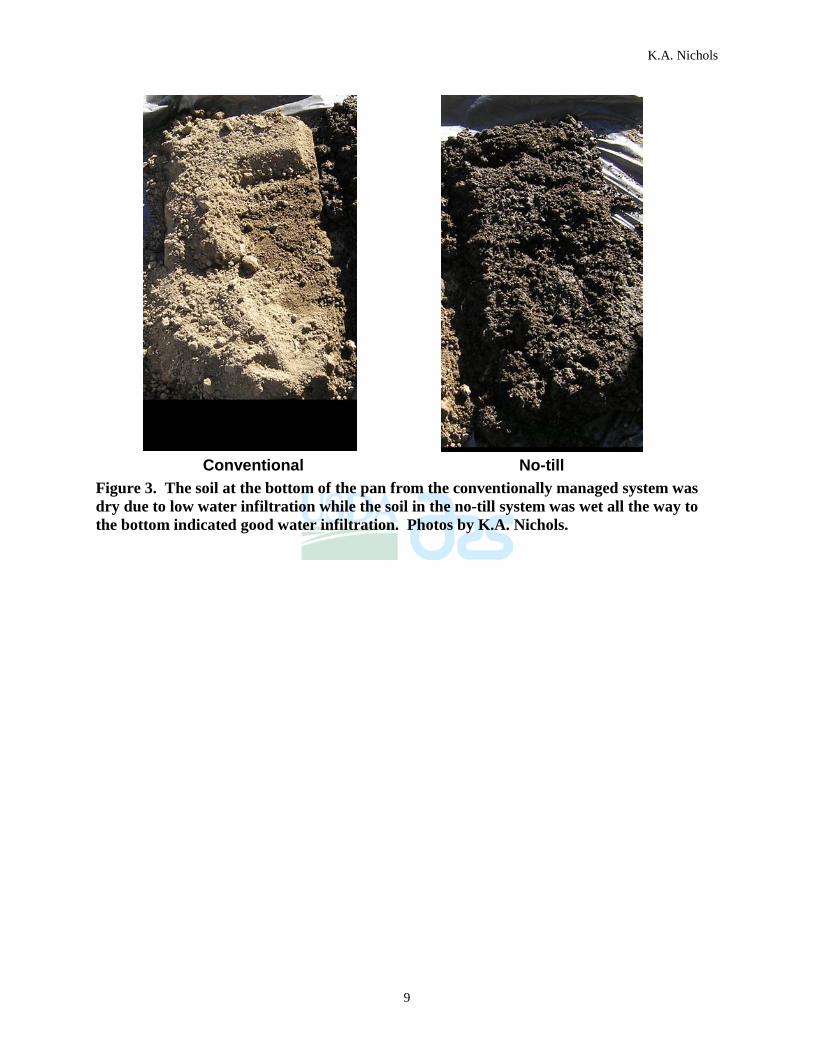
2. Take the soil trays and invert them on a plastic mat. Observe how wet the soil is at the bottom of the pan (Fig. 3).
Figure 1. Demonstration of a rainfall simulator using soils with differing amounts of residue and tillage management. Photo by K.A. Nichols.
Figure 2. A watering can may be used to simulate the action of rainfall on soil in a metal tray or wooden box. Diagram from Hold That Soil website.
K.A. Nichols
8
What is happening: 1. The structure of the soil and amount of reduce impacts infiltration rates and water run-
off. In a well structured soil with stable aggregates and lots of pore space, the water will infiltrate rapidly and the soil will be wet to the bottom of the pan. Residue can also help to physically prevent water erosion. Without stable aggregates and good pore space, the water will run-off the surface taking soil and nutrients with it and the soil on the bottom of the pan will be dry.
2. Water movement on the soil surface and levels of erosion and run-off will be impacted by the slope and rainfall intensity and amount. This shows how much more important soil structure and cover are on different landscapes and in different regions.
Figure 3. The amount of topsoil runoff varies depending upon management. In a system that was conventionally managed but has 30% residue cover added had less loss than a conventional system without residue, but a no-till system with the residue left on the field had very little soil loss by erosive forces. Photos by K.A. Nichols.
Conventional Residue No-till
K.A. Nichols
9
Figure 3. The soil at the bottom of the pan from the conventionally managed system was dry due to low water infiltration while the soil in the no-till system was wet all the way to the bottom indicated good water infiltration. Photos by K.A. Nichols.
Conventional No-till

K.A. Nichols
10
Nichols and Samson-Liebig, 2011 Water Infiltration, Water Holding Capacity, and Nitrate Leaching
Introduction: Soil structure – the size, amount, and continuity of pores with the soil matrix – is the leading factor in soil functions – water and air movement and nutrient cycling. This demonstration will be used to show how structure and function interact. Materials: Disposable paper or plastic cups – two sizes Needle or small nail Soil samples Water Graduated cylinder or measuring cup, optional Method: 1. Prepare 5 oz paper cups* (1 per sample) as follows:
a. Using an 18G needle (quilting needle) or small nail (such as a finishing or picture nail), poke 25-50 holes in the bottom of the paper cup.
b. Draw a line on the outside of the cup where the circumference equals 15.5 cm (about 3 cm from the bottom)
c. Place the 5 oz paper cup in a 3 oz paper or plastic cup.
2. If conducting the experiment in the field, use a trowel to dig a hole 10 cm deep and about 5 cm wide. If conducting the experiment in the laboratory or classroom, use field moist or air dried soil that has been pre-measured to either the same volume or weight (Fig. 1).**
3. Transfer enough soil into the 5 oz paper cup to reach the line drawn on the cup. Shake the cup gently to evenly distribute the soil and gently break-up any large clods.
4. Add 50 ml water.*** (This is equal to about 2.54 cm or 1 in.)
5. Start timing infiltration (Fig. 2). Stop and record when complete (i.e. when the surface of the soil is just glistening).****
6. Collect and examine water height in 3 oz. cup, and transfer to tubes (i.e. container with a lid) after infiltration complete.
7. Optional tests: a. Measure volume of water collected using a graduated cylinder in field or lab (Fig. 3). b. Test water for soil nitrates using nitrate test strips. c. Measure cations and anions in water using an ion chromatograph.
Figure 2. Water pools on the surface and does not infiltrate in the not well aggregated sample (A) but does infiltrate rapidly in the well aggregated sample (B). Photo by K.A. Nichols.
A B
Figure 1. Air dried soil samples of the same weight (25 g) from not well aggregated (A) and well aggregated (B) soils. Volume differences demon-strate the role that aggregation has in increasing porosity. Photo by K.A. Nichols.
B A
K.A. Nichols
11
d. Estimate water holding capacity by: i. weighing wet soil in the cup after completing the infiltration experiment, ii. incubating the sample at room temperature and weighing the soil in the cup daily until the weight no longer changes, and iii. calculating the percent water in the sample for each day and graph percent water by time to examine the water holding capacity of each sample.
* Other containers besides the paper cups may be used.
You will need one container that you can poke holes into and another container that you can fit the top container into to collect the water. The volume of water and amount of soil may have to be adjusted as described below.
** These same procedures can be used in the field, laboratory, or classroom on field moist or air-dried samples. Air-dried samples can either be measured to the same volume or weight. If weight is used, a well aggregated soil will typically have a greater volume of soil. This may be useful to demonstrate porosity. In some cases when using air-dried samples, filling tall and narrow containers to high, or in highly organic soils, may require adding a second 50 ml to have a measurable volume of water in the bottom cup.
*** Ultrapure water is preferred, but distilled or tap water may be used. However, if ions, such as nitrate, are measured, a no soil control should be used for background correction.
**** In some cases, large amounts of roots or plant material in rangeland soils may result in low infiltration rates. However, the amount of water held by these soils will be higher than in cropland soils.
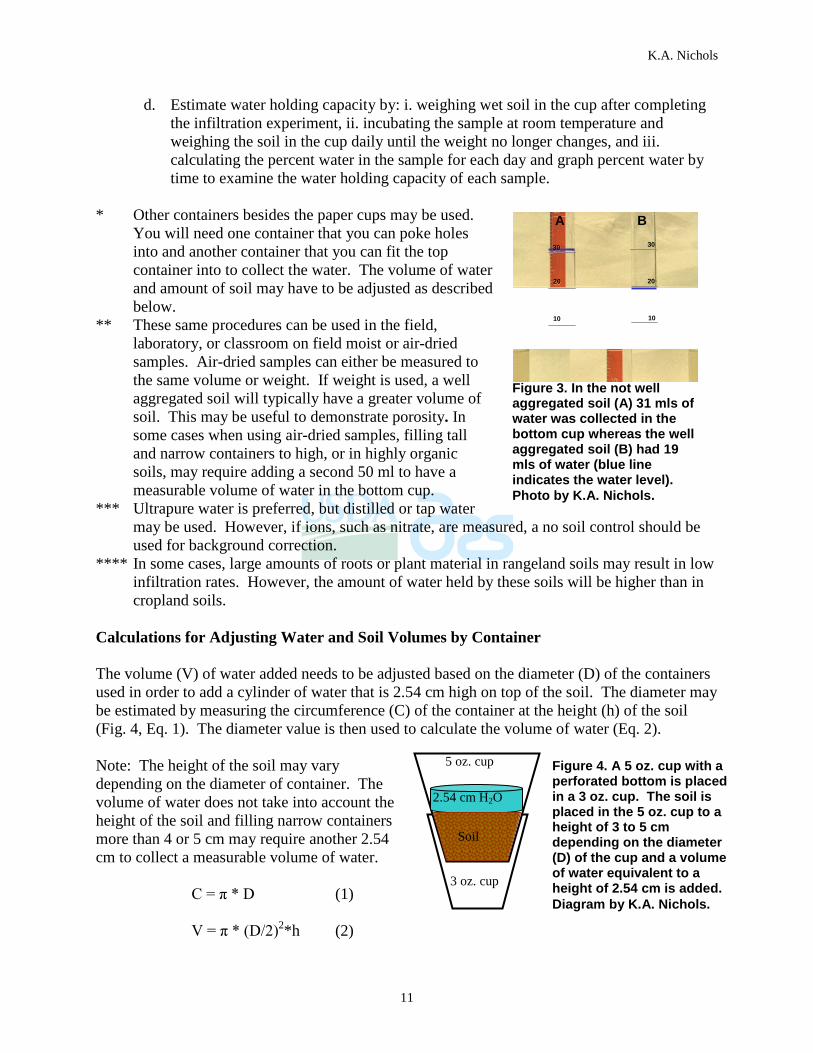
Calculations for Adjusting Water and Soil Volumes by Container The volume (V) of water added needs to be adjusted based on the diameter (D) of the containers used in order to add a cylinder of water that is 2.54 cm high on top of the soil. The diameter may be estimated by measuring the circumference (C) of the container at the height (h) of the soil (Fig. 4, Eq. 1). The diameter value is then used to calculate the volume of water (Eq. 2). Note: The height of the soil may vary depending on the diameter of container. The volume of water does not take into account the height of the soil and filling narrow containers more than 4 or 5 cm may require another 2.54 cm to collect a measurable volume of water.
C = π * D (1)
V = π * (D/2)2*h (2)
A B
10
20
10
20
30 30
Figure 3. In the not well aggregated soil (A) 31 mls of water was collected in the bottom cup whereas the well aggregated soil (B) had 19 mls of water (blue line indicates the water level). Photo by K.A. Nichols.
3 oz. cup
5 oz. cup
2.54 cm H2O
Soil
Figure 4. A 5 oz. cup with a perforated bottom is placed in a 3 oz. cup. The soil is placed in the 5 oz. cup to a height of 3 to 5 cm depending on the diameter (D) of the cup and a volume of water equivalent to a height of 2.54 cm is added. Diagram by K.A. Nichols.
K.A. Nichols
12
Observations:
1. Compare the water infiltration times for the different soil samples. 2. Estimate the water holding capacity by measuring the amount of water in the bottom cup
and subtracting from the amount added. You could also measure the soil weight before and after the addition of water.
3. Compare the estimate nitrate concentrations in the water using the nitrate test strips. What is happening:
1. In a well-aggregated soil, the spatial distribution of the aggregates gives pore space between the aggregates which allows for rapid water infiltration. If the aggregates are ruptured by the influx of water, the pores are filled with the fine soil particle released from the aggregates.
2. The pore space also provides a location for water to be held. In addition, well-aggregated soils, typically, have higher organic matter levels in and around the aggregates. This organic matter can act like a sponge and hold water.
3. The amount of nitrate in the water may show which systems have the potential for nitrate loss by erosion and leaching.

K.A. Nichols
13
Soil Macroaggregate Scale Model Bruns and Byrne, 2004
Introduction: The average composition of soil is about 45-50% mineral particles, 1-5% oragnic matter, and 50% pore space. Macropores, which are larger than 80 um, comprise the spaces between aggregates to permit movement of water, air, plant roots, and animals through the soil. Microaggregates, which are ≤ 250 um, are tightly bound by stable organic matter and iron oxides and are strong enough to remain intact even in soil subjected to conventional tillage –plowing and disking. Macroaggregates, which are ≥ 250 um, are held together by networks of fine roots and fungal hyphae and are readily disrupted by plowing. Soils containing high proportions of stable macroaggregates have undergone less physical disturbance (e.g., pasture, no-till, or reduced tillage soils) than soils dominated by microaggregates. Macroaggregates from a soil having well-defined crumb structure have larger pores, faster water infiltration, and greater aeration for plant roots. Other materials may be used as long as the relative sizes are maintained (see Table 1). For example, milk carton boxes may be used instead of styrofoam to form the aggregate core. Modifications to the overall size of the aggregate, and the amounts of materials representing soil particles – sand, silt, clay, and particulate organic matter (POM) – and soil organisms – bacteria, fungi, nematodes, protozoa, actinomycetes, and mites – may be used to demonstrate differences between large and small macroaggregates and microaggregates. Additional materials such as PVC pipe representing earthworms or roots or cut-outs of insects such as spiders and beetles may be attached to the outside of the aggregate to show the relative size of these macroscopic organisms to aggregates and microscopic organisms. Table 1. The average sizes of the different soil particles and organisms to be used in determining where to place materials which represent these soil constituents. Organism group or Soil Particle Size range (um) Bacteria 1-50 Clay minerals <2 Algae 10-100 Actinomycetes 2-10 Fungi 2-10 Silt particles 2-20 Nematodes (diametet X length) 100-200 X 900-1100 Fine Sand 20-200 Coarse Sand 200-2000 Fine roots (diameter) 300-500 Coarse roots (diameter) 2000-3000 Microarthopods - mites, amoeba, paramecium 300-600 Macroarthrods - ants, termites, spiders, beetles 3000-20,000 Microaggregates 53-250 Macroaggregates 250-9500 Ants 3000-6000 Earthworms (diametet X length) 2000-3500 X 80,000-100,000
K.A. Nichols
14
Materials: Styrofoam packing Chicken wire Paper mache Spray paint Newspaper Rice grains Seeds String Pipe cleaners Sponges Nylon fabric Nylon stockings Cardboard Paperboard Clear tubing, 1 inch internal diameter Method:
1. Use the styrofoam packing from computer boxes as the aggregate core. 2. Wrap the Styrofoam loosely with chicken wire keeping one side open to view the inside
of the aggregate. 3. Cover the chicken wire with paper mache and spray paint. 4. Glue the following materials inside the aggregate to represent the different soil particles
and organisms. a. Use rolled-up balls of newspaper of the appropriate size to represent fine sand
grains and silt particles. b. Dye rice grains with orange food coloring to resemble clay particles with iron
oxide coatings. c. Glue rice grains together in a consistent orientation to represent small
microaggregates which consist of flocculated clay particles. d. Use seeds of various sizes and shapes to represent unicellular bacteria. e. Use strings and thick pipe cleaners as actinomycetes and fungi, respectively. f. Paint irregular chunks of sponge black for particulate organic matter. g. Use bunches of black nylon fabric to depict humus and place in crevices to
demonstrate binding properties.
5. Glue the following materials to the outside of the aggregate to represent larger soil constitutents.
a. Stuff nylon stockings and glue on the outside of aggregates to represent roots. b. Cut protozoans, such as amoeba, flagellates and paramecium, out of cardboard. c. Construct springtails and mites out of paperboard and duct tape. d. Use clear tubing as nematodes.
6. Place seeds and small pieces of black sponge into indentations on the surface of the model to represent a large pore containing bacteria and organic matter.
7. Punch holes through the paper mache to create micropores and irregularities. Observations:
1. Observe the different sizes and dimensions of the various parts of a macroaggregate. 2. Ecological relationships (e.g. predator-prey, soil food web especially rhizosphere
interactions, and spatial availability) may be portrayed by careful placement of the different materials.

K.A. Nichols
15
Marcus Lewton, personnel communication Energy Soil Model
Introduction: Almost 2/3 of the carbon in crop residue is readily used as a food/energy source by soil organisms and respired as CO2. Of the remaining 1/3, about 1/5 becomes part of the bodies of microorganisms (i.e. microbial biomass) while the remaining is part of the soil organic matter (SOM) fraction which is slowly decomposed from label to recalcitrant (i.e. humic) organic matter. This procedure illustrates the differences between the initial amount of total residue and the amount which is rapidly oxidized and respired, in microbial biomass, or part of the SOM fraction. Materials: Four 1 quart ziplock bags with white label Residue: leaves, dry grass, straw, etc. Simulated residue: stirring straws Permanent marker Balance Methods: 1. Tier balance and weigh baggies 2. Fill bags with residue or simulated residue so one bag has 100 g, one 66 grams, one 29 g; and
the last one 3-5 g 3. Label the 100 g bag as Total Residue For Energy, the 66 g bag as Oxidized-Respired
Residue, the 29 g bag as Residue for Building OM, and the 3-5 g bag as Microbial Biomass 4. Choose four people from the crowd and have each person hold one bag and observe
differences 5. Describe what each bag represents. When you are explaining the process, have the person
holding the respiration bag throw it into the air to represent the CO2 lost through respiration to show how tillage destroys 29% of the residue which should go into building organic matter.
6. Toss this aside and explain that there is no organic matter building going on because the biologic fire and bacteria have respired the residue rather than letting the entire soil foodweb decompose it slowly and make nutrient rich organic matter.
What is happening: A soil beginning with 100 g of residue is rapidly decomposed and respired leaving only 1/3 in the soil, or 29 g. This shows how much energy (food/residue) is needed to build soil. Of the remaining 1/3 about 5 g is in the microbial biomass fraction with the remainder as primarily soil humus. The proportion remaining from root residues tends to be somewhat higher than that remaining from incorporated leaf litter. The 29 g bag represents the amount of residue goes into the organic matter.
K.A. Nichols
16
Kemper and Chepil, 1965; Nichols and Toro, 2010; Wright et al., 1996; 1999; Wright and Upadhyaya, 1998
Soil Aggregate Stability Analysis – Method I
Introduction: This method is adapted from Kemper and Chepil (1965). It involves two steps – a dry sieving and a wet sieving step. Part I: Dry-sieving to collect soil aggregates Materials: Balance Brushes to clean sieves Dust mask or other personal protective equipment Large roll of kraft paper (brown paper) or newspapers Plastic bags, tubes, or jars to hold aggregates Sharpie or labels Stainless steel or brass sieves of the appropriate sizes Work gloves Method: 1. Lay the soil samples out on brown paper or newspaper and leave them until dry. Paper can
also be used to cover the samples to prevent contamination. Drying times vary depending on how wet the samples were when taken and ambient humidity. If needed, the samples may be gently broken up by hand along natural fracture lines. This procedure may be repeated during the first few days of drying, but do not force the soil to break apart. Most samples will be dry within one week. To make sure that they samples are dry, check to see if the weights change with further drying. To do this, make the following measurements: 1. weigh a subset of three to five samples from the various treatments when you think that they are dry; 2. leave these samples to dry either by incubating overnight (at least 8 hours) at room temperature or drying on a slide warmer or in an oven at less than 40oC for at least 2 hours; and 3. weigh the samples again and compare weights.
2. Soil is placed on brown paper or newspaper and dried at room temperature. Soil may be weighed at this point for a total soil weight (WT) or the sum of the weights in each aggregate size class may be used for the WT value.
3. Air-dried soil is gently poured into a sieve with a screen size matching the largest sized aggregates in a size class. The soil should be added to the sieve until all the sample is used or soil just covers the entire screen, whichever comes first. If a large amount of soil is being sieved, you may have to repeat the sieving process until the whole sample is completed.
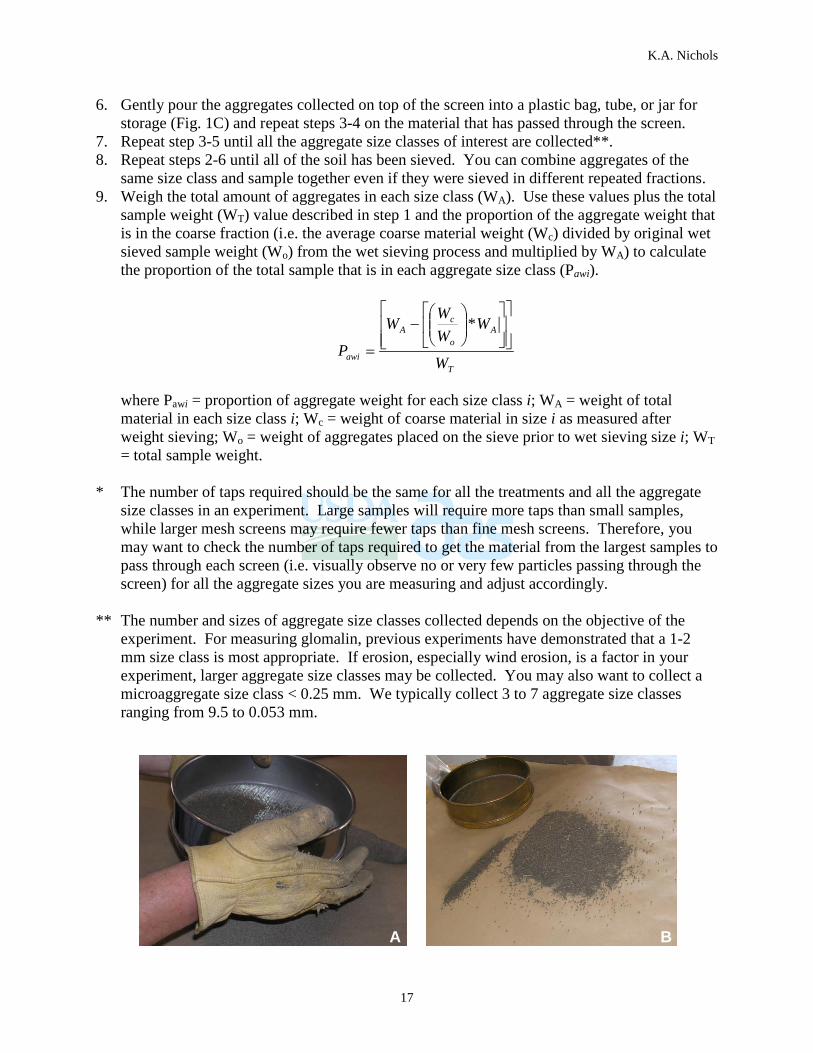
4. The sieve is held in one hand above a piece of brown paper or newspaper and tapped with the other hand (use work gloves to protect hands and mask or other personal protective equipment to protect from dust) at least 25 times for very small samples and up to 150 or more times for samples that cover the entire screen* (Fig. 1A and 1B). Soil aggregates and particles smaller than the mesh screen will pass through and be collected on the paper below.
5. Gently pour the material on the paper into a sieve with a screen size matching the smallest aggregates in the size class and repeat step 3 (Fig. 1B).
K.A. Nichols
17
6. Gently pour the aggregates collected on top of the screen into a plastic bag, tube, or jar for storage (Fig. 1C) and repeat steps 3-4 on the material that has passed through the screen.
7. Repeat step 3-5 until all the aggregate size classes of interest are collected**. 8. Repeat steps 2-6 until all of the soil has been sieved. You can combine aggregates of the
same size class and sample together even if they were sieved in different repeated fractions. 9. Weigh the total amount of aggregates in each size class (WA). Use these values plus the total
sample weight (WT) value described in step 1 and the proportion of the aggregate weight that is in the coarse fraction (i.e. the average coarse material weight (Wc) divided by original wet sieved sample weight (Wo) from the wet sieving process and multiplied by WA) to calculate the proportion of the total sample that is in each aggregate size class (Pawi).
T
Ao
cA
awi W
WWW
W
P
−
=
*
where Pawi = proportion of aggregate weight for each size class i; WA = weight of total
material in each size class i; Wc = weight of coarse material in size i as measured after weight sieving; Wo = weight of aggregates placed on the sieve prior to wet sieving size i; WT = total sample weight.
* The number of taps required should be the same for all the treatments and all the aggregate
size classes in an experiment. Large samples will require more taps than small samples, while larger mesh screens may require fewer taps than fine mesh screens. Therefore, you may want to check the number of taps required to get the material from the largest samples to pass through each screen (i.e. visually observe no or very few particles passing through the screen) for all the aggregate sizes you are measuring and adjust accordingly.
** The number and sizes of aggregate size classes collected depends on the objective of the
experiment. For measuring glomalin, previous experiments have demonstrated that a 1-2 mm size class is most appropriate. If erosion, especially wind erosion, is a factor in your experiment, larger aggregate size classes may be collected. You may also want to collect a microaggregate size class < 0.25 mm. We typically collect 3 to 7 aggregate size classes ranging from 9.5 to 0.053 mm.
A B
K.A. Nichols
18
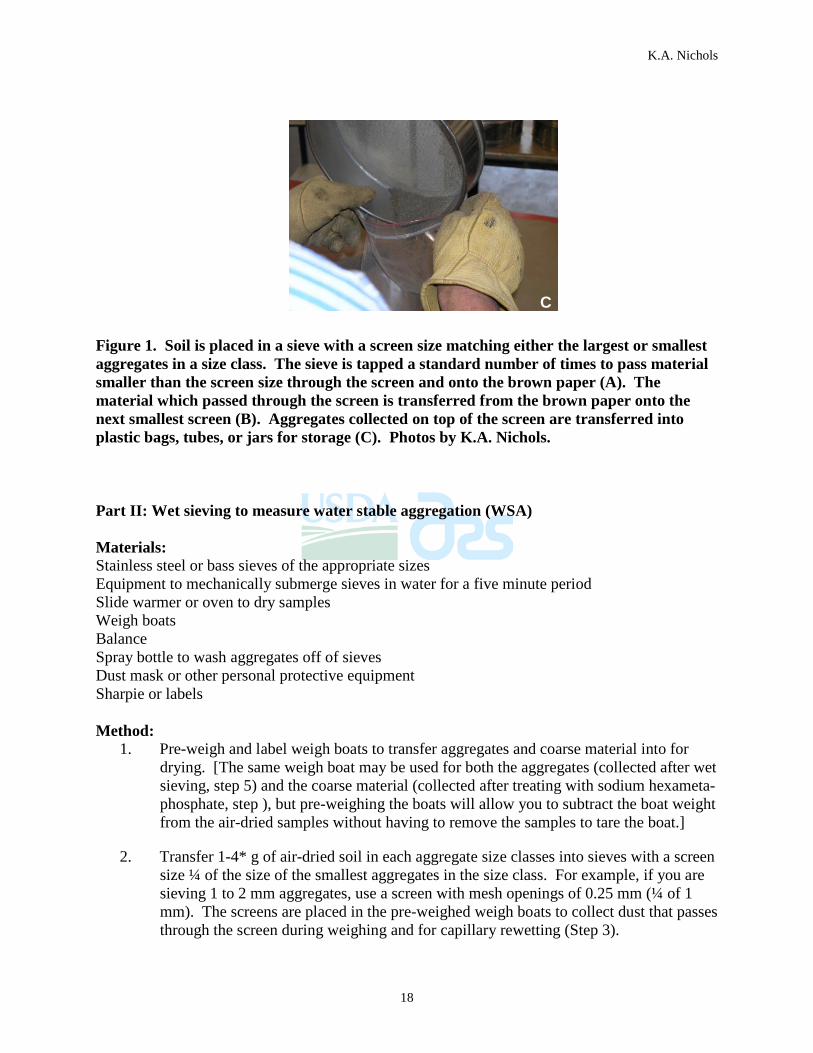
Figure 1. Soil is placed in a sieve with a screen size matching either the largest or smallest aggregates in a size class. The sieve is tapped a standard number of times to pass material smaller than the screen size through the screen and onto the brown paper (A). The material which passed through the screen is transferred from the brown paper onto the next smallest screen (B). Aggregates collected on top of the screen are transferred into plastic bags, tubes, or jars for storage (C). Photos by K.A. Nichols.
Part II: Wet sieving to measure water stable aggregation (WSA) Materials: Stainless steel or bass sieves of the appropriate sizes Equipment to mechanically submerge sieves in water for a five minute period Slide warmer or oven to dry samples Weigh boats Balance Spray bottle to wash aggregates off of sieves Dust mask or other personal protective equipment Sharpie or labels Method:
1. Pre-weigh and label weigh boats to transfer aggregates and coarse material into for drying. [The same weigh boat may be used for both the aggregates (collected after wet sieving, step 5) and the coarse material (collected after treating with sodium hexameta-phosphate, step ), but pre-weighing the boats will allow you to subtract the boat weight from the air-dried samples without having to remove the samples to tare the boat.]
2. Transfer 1-4* g of air-dried soil in each aggregate size classes into sieves with a screen size ¼ of the size of the smallest aggregates in the size class. For example, if you are sieving 1 to 2 mm aggregates, use a screen with mesh openings of 0.25 mm (¼ of 1 mm). The screens are placed in the pre-weighed weigh boats to collect dust that passes through the screen during weighing and for capillary rewetting (Step 3).
C
K.A. Nichols
19
3. Samples are capillary rewetted from underneath by adding Milli-Q (or double distilled) water to the outside of the sieve in the weigh boat and allowing water to wick up from underneath.
4. Incubate on bench top for 10 min.
5. Place sieves into an apparatus described by Kemper and Koch (1966) for mechanical wet sieving. Sieves are moved up and down in a column of water at a rate of approx. 40 cycles per minute for 5 min. The bottom of the sieve is never allowed to break the surface of the water.
6. Material collected on the sieve was washed gently into pre-weighed weigh boats, dried at 70 to 90 oC, and weighed.
7. The coarse material was removed by adding 0.5% sodium hexametaphosphate and shaking periodically (3 to 4 times) over a 5 min period to disrupt the aggregates
8. The disrupted aggregates are washed through a screen matching the smallest aggregate size in the class using forced water. For smaller aggregate sizes, a rubber policeman or similar device may be used help break up aggregates and push them through the screen. The coarse material is collected on the screen, washed into pre-weighed weigh boats, dried between 70 to 90 oC, weighed, and subtracted from the amount of aggregates collected after wet sieving
9. The formula for calculating the percentage WSA for each size class is:
( )[ ] 100×÷−= ocai WWWWSA (3)
where WSAi = water stable aggregation for each size class i; Wa = weight of material on the sieve after wet sieving size i; Wc = weight of coarse material in size i; Wo = weight of aggregates placed on the sieve prior to wet sieving size i.
* For aggregate size classes that contain aggregates >0.6 mm (i.e. 1 or 2 mm), use 4 g. If the smallest size is >0.120mm and <0.6 mm (i.e. 0.25 mm) use 2 g. If the smallest size in <0.120 mm (i.e. 0.25-0.053 mm), use 1 g. Less soil for the smaller aggregate sizes prevents clogging the fine mesh sieves. Notes: 1. It is recommended to run at least three duplicate samples from the same soil. If your
equipment only allows you to run eight samples at a time, you may want to use four duplicate samples to limit confusion.
2. Values for duplicate samples from the same soil should have a standard error (SE) of the mean of <2%. Some values, especially for larger aggregate size classes, may have a SE up to 5%.
K.A. Nichols
20
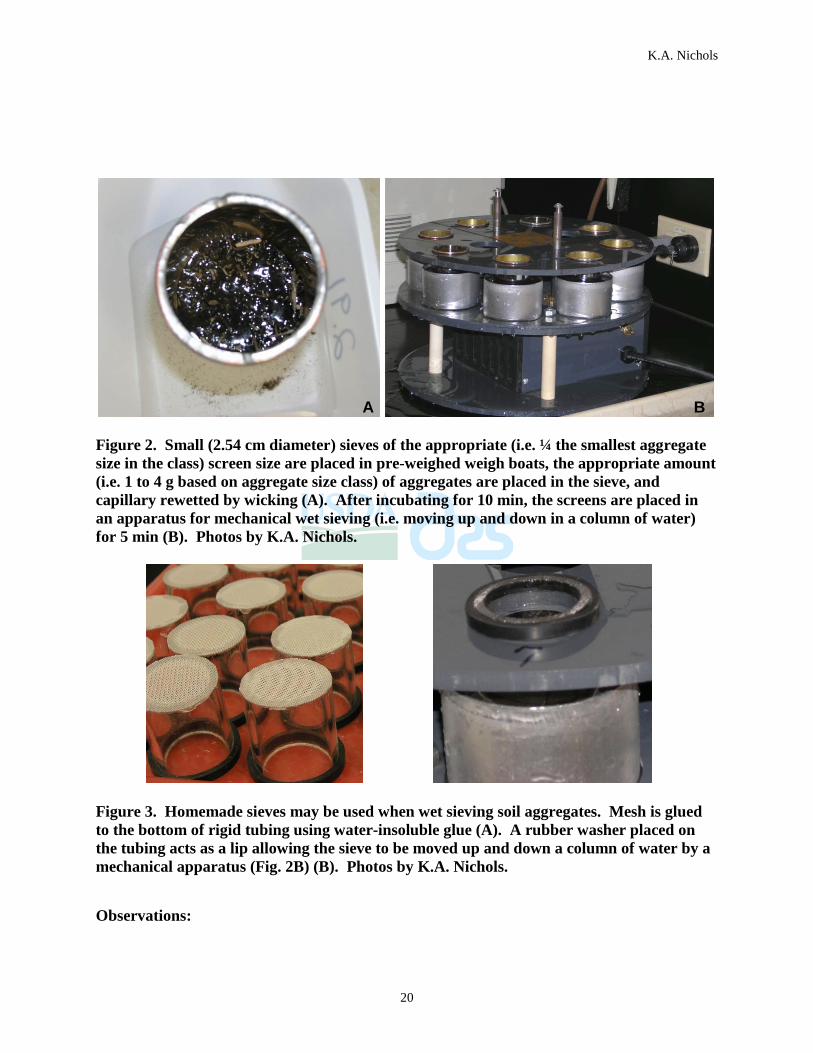
Figure 2. Small (2.54 cm diameter) sieves of the appropriate (i.e. ¼ the smallest aggregate size in the class) screen size are placed in pre-weighed weigh boats, the appropriate amount (i.e. 1 to 4 g based on aggregate size class) of aggregates are placed in the sieve, and capillary rewetted by wicking (A). After incubating for 10 min, the screens are placed in an apparatus for mechanical wet sieving (i.e. moving up and down in a column of water) for 5 min (B). Photos by K.A. Nichols.
Figure 3. Homemade sieves may be used when wet sieving soil aggregates. Mesh is glued to the bottom of rigid tubing using water-insoluble glue (A). A rubber washer placed on the tubing acts as a lip allowing the sieve to be moved up and down a column of water by a mechanical apparatus (Fig. 2B) (B). Photos by K.A. Nichols. Observations:
A B

K.A. Nichols
21
1. Observe how much water comes out of the sponge after removing it from the water and letting it drip.
2. Observe how much water comes out of the sponge with squeezing. 3. (Optional) Measure the amount of unavailable water.
What is happening: 1. Differing amounts of pore space will impact water movement. 2. The water that drips out of the sponge is considered to be gravitational water and is water
that moves into and out of the large pore space between aggregates, root channels, earthworm casts, etc. due to gravity.
3. The water that is squeezed out of the sponge is water within the smaller pores between aggregates and other soil components. This water is available to the plants with some exertion of energy.
4. The water that is in the wet sponge is plant unavailable, because it would take too much energy to remove it from within the fine pores and aggregates where it is cohesively bound.
22
Six et al., 2000; 2004 Soil Aggregate Stability Analysis – Method II
Introduction: This method for determining aggregate stability is adapted from a method described by Six et al. (2000). It is a method which does not require the use of equipment to mechanically submerge sieves, but rather is done by hand. It also does not require the pre-sieving a dry aggregates. Materials: Soil samples Stainless steel or bass sieves of the appropriate size Bucket or container 1.5 times the size of the sieve Balance Weigh boats Brushes to clean sieves Dust mask or other personal protective equipment Sharpie or labels Work gloves Method:
1. 50-g soil samples are subjected to two pretreatments prior to wet sieving: (1) immersed immediately in water (slaked) or (2) capillary rewetted at 4oC overnight.
2. Samples are wet-sieved through three screens (2, 0.25, and 0.053 mm) using the following methods:
a. The pretreated soil is submerged for 5 min atop the 2-mm screen. b. Aggregate stability is determined by manually moving the sieve submerged in a
water column 3 cm up and down 50 times during a 2-min period. c. The >2-mm aggregates are collected. d. The soil <2-mm was rinsed onto the 0.25 mm sieve. e. Aggregates are again separated by manual wet-sieving. This procedure was
repeated for the 0.053-mm screen. f. All aggregate size fractions are dried at 70oC, weighed, and corrected for coarse
material after disrupting the aggregates with 0.5% sodium hexametaphosphate. g. A normalized stability index (NSI) is calculated using the equations below.
Equations used to calculate the Normalized Stability Index (NSI) Formula for calculation of disruption level in each size class (DLSi) is:
( ) ( )( )( ) ( ) [ ]
[ ]SioPioSiPiSioPioSiPiSioPio
DLSi−
×
−−−
+−−−
=1
2

23
where DLSi = disruption level for each size class I; Pio = proportion of total sample weight in size class I before disruption (i.e. capillary rewetted); Pi = proportion of total sample weight in size class I after disruption (i.e. slaked); Sio = proportion of sand with size I in aggregates of size I (= aggregate-sized sand) before disruption; Si = proportion of sand with size I in aggregates of size I after disruption. All proportions are expressed on a soil weight basis (g fraction g-1 soil). The size classes in this study were I = 1 = 53-250 μm, I = 2 = 250-2000 μm, and I = 3 = > 2000 μm.
Formula for the whole soil disruption level (DL) is:
( )[ ]∑ ×−+=n
iDLSiInnDL 1/1
where n = number of aggregate size classes. Formula for the calculation of the maximum disruption in each size class [DLSi (max)] is:
( ) ( ) ( )[ ] [ ][ ]SioPio
PpPioPpPioDLSi
−×
−+−=
12
max
where Pp = primary sand particle content with the same size as the aggregate size class after complete disruption of the whole soil. Formula for the whole soil maximum disruption [DL(max)] is:
( )[ ] (max)1/1(max) ∑ ×−+=n
iDLSiInnDL
where n = number of aggregate size classes. Normalized stability indexed is calculated as:
−= (max)1 DLDLNSI
Observations:
1. Observe how much water comes out of the sponge after removing it from the water and letting it drip.

24
2. Observe how much water comes out of the sponge with squeezing. 3. (Optional) Measure the amount of unavailable water.
What is happening:
1. Differing amounts of pore space will impact water movement. 2. The water that drips out of the sponge is considered to be gravitational water and is water
that moves into and out of the large pore space between aggregates, root channels, earthworm casts, etc. due to gravity.
3. The water that is squeezed out of the sponge is water within the smaller pores between aggregates and other soil components. This water is available to the plants with some exertion of energy.
4. The water that is in the wet sponge is plant unavailable, because it would take too much energy to remove it from within the fine pores and aggregates where it is cohesively bound.
25
Winogradsky Column
Introduction A Winogradsky column is used to illustrate how microorganisms develop in certain habitats in response to appropriate environmental conditions and how populations exhibit succession. i.e., how one group of organisms succeeds another as conditions are created which select for them. These columns are complete, self-contained recycling systems, driven only by energy from light! Invented by Sergei Winogradsky, this method uses a deep cylindrical vessel is set up containing soil, roots, leaves, other organic matter, and water. The column incubates under natural light or a growth lamp for several months with observations being made on a weekly basis. All the organisms are present initially in low numbers, but when the tubes are incubated for 2 to 3 months the different types of microorganism proliferate and occupy distinct zones where the environmental conditions favor their specific activities. At first, a population of facultative heterotrophs uses the plant materials, carbohydrates, lignins, etc., for growth and in so doing creates an anaerobic environment especially at the bottom. Under these anaerobic conditions sulfate-reducing organisms multiply using organic carbon compounds and at the same time reducing sulfate to reduce sulfur compounds such as H2S. Such an environment now allows the development of photosynthetic bacteria requiring reduced sulfur compounds, anaerobiosis and light. Consequently, one finds the purple sulfur bacteria and the green sulfur bacteria growing deep in the vessel while at the same time it is possible to find blue-green algae growing in the surface water since they are not strict anaerobes. The photosynthetic organisms (i.e. algae, bacteria and cyanobacteria) tend to cluster at different levels since they are motile and can swim where concentrations of nutrients and degree of illumination are most appropriate for their growth - an example of both chemotactic and phototactic response. The column provides numerous gradients, depending on additive nutrients – types and amounts of organic matter or addition of synthetic nutrients – from which the variety of organisms can grow. The aerobic water phase and anaerobic soil phase are one such distinction. Due to low oxygen solubility in water the water quickly becomes anoxic towards the interface of the soil and water. Anaerobic phototrophs are still present to a large extent in the soil phase, there is still capacity for biofilm creation and colony expansion. Algae and other aerobic phototrophs are present along the surface and water of the upper half of the columns. Green growth is often attributed to these organisms. Method
1. Fill a clear glass or plastic cylinder or a bottle about 2/3 full with soil from different sites or adding differing amounts of residue.
2. The sample may be supplemented with ~0.25% w/w calcium carbonate and ~0.50% w/w calcium sulfate or sodium sulfate, shredded newspaper or hay (for cellulose), ground egg-shell and/or egg yolk.
3. Rain or tap water is added until the soil is saturated and about half the remaining volume is filled.
26
4. Cap or seal the container and incubate for several months in natural light or under a growth lamp.
Observations
1. Observe growth of organisms and formation of biofilms. See Fig. 1. 2. Record the formation of layers and changes in color. 3. Take a sample from different layers and observe under the microscope. Record
microscopic observations – organism type, shape, size, number, or other distinguishing characteristics.
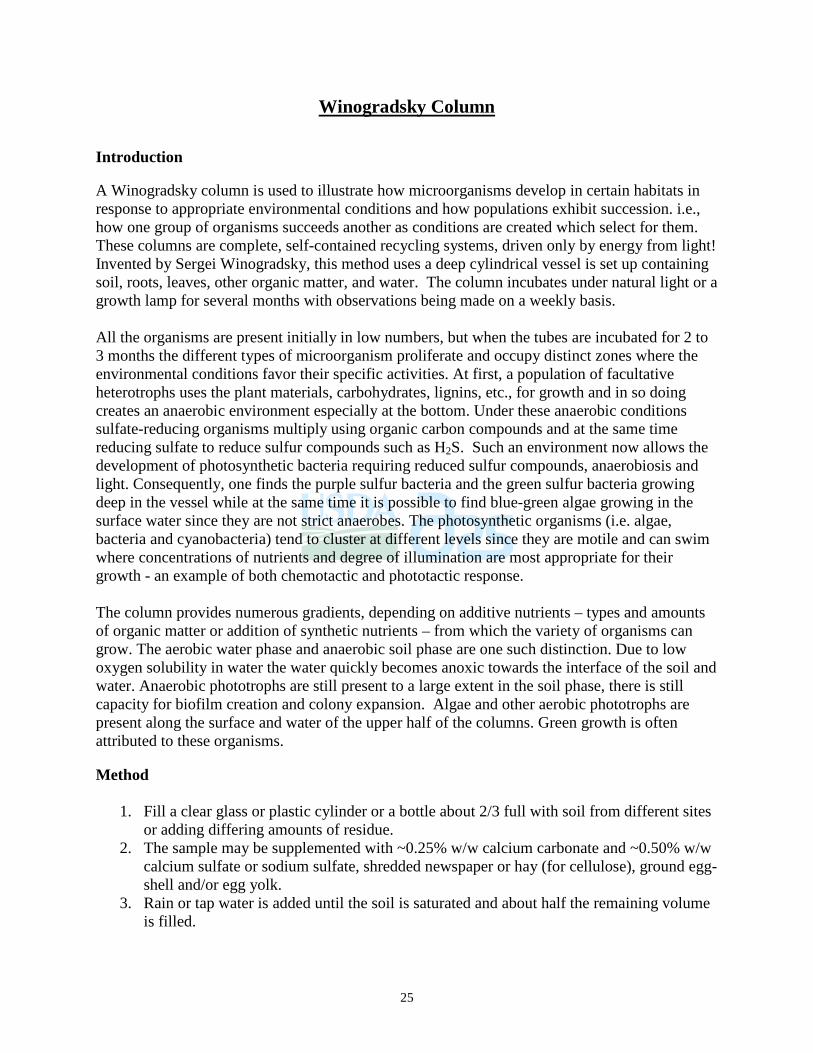
Figure 1. Winogradsky columns made in either clear cylinders (A) or bottles (B) exhibit changes in color as different organisms grow due to changes in the oxygen concentration or carbon sources. What is happening: Initially, the entire system is aerobic. As resources are consumed and the oxygen levels change throughout the column and over time, the following sequence of events occurs (Fig. 2):
1. The large amount of cellulose present initially promotes rapid microbial growth which soon depletes the oxygen in the sediment and in the water column. Only the very top of the column remains aerated because oxygen diffuses very slowly through water.
organic matter + O2 = organic acids + CO2
2. Further down in the column, the only organisms that can grow in anaerobic conditions are
those that ferment organic matter and those that perform anaerobic respiration. Fermentation is a process in which organic compounds are degraded incompletely; for example, yeasts ferment sugars to alcohol. Anaerobic respiration is a process in which organic substrates are degraded completely to CO2, but using a substance other than oxygen as the terminal electron acceptor. Some bacteria respire by using nitrate or sulfate ions, in the same way as we use oxygen as the terminal electron acceptor during
A B

27
respiration. The organic acids act as electron donors for reduction of sulfates and sulfites to hydrogen sulfide (H2S) by anaerobic sulfate reducing bacteria. The H2S will react with any iron in the soil, producing black ferrous sulfide. However, some of the H2S diffuses upwards into the water column, where it is utilized by other organisms.
organic acids + S04 = H2S + CO2
3. The diffusion of H2S from the sediment into the water column enables anaerobic photosynthetic bacteria to grow. They are seen usually as two narrow, brightly colored bands immediately above the soil - a zone of green sulfur bacteria then a zone of purple sulfur bacteria (Fig. 1). The green and purple sulfur bacteria gain energy from light reactions and produce their cellular materials from CO2 in much the same way as plants do. However, there is one essential difference: they do not generate oxygen during photosynthesis because they do not use water as the reductant; instead they use H2S. The following simplified equations show the parallel.
6 CO2 + 6 H20 = C6H12O6 + 6 O2 (plant photosynthesis)
6 CO2 + 6 H2S = C6H12O6 + 6 S (bacterial anaerobic photosynthesis)
4. Most of the water column above the photosynthetic bacteria is colored bright red by a large population of purple non-sulfur bacteria. These bacteria grow in anaerobic conditions, gaining their energy from light reactions but using organic acids as their carbon source for cellular synthesis and are called photoheterotrophs. The organic acids that they use are the fermentation products of other anaerobic bacteria, but the purple non-sulfur bacteria are intolerant of high H2S concentrations, so they occur above the zone where the green and purple sulfur bacteria are found.

28
Figure 2. In a Winogradsky column, microbial habitats change as oxygen and carbon sources change. These changes are exhibited in the formation of different colored layers as illustrated above.
29
Building Better Soil website Soil Structure – Dirt Cake
Introduction: This is a delicious and fun way to demonstrate soil structure and what things contribute to that structure. If you have done one or more of the demonstrations above link those demonstrations with soil structure and pore space. All soil starts with parent material such as weathered bedrock (e.g. limestone, sandstone, gneiss, schist, etc.) or boulders transported by glaciers. The type of parent material determines the soil texture (amount of sand, silt and clay), and thus whether the soil is a silt loam, silty clay, sand, etc. Over hundreds to thousands of years, rain, wind, growing plants, and soil organisms slowly break parent material down into smaller and smaller pieces until it eventually becomes subsoil. Topsoil is at the surface of the soil and is necessary for plant growth. As subsoil continues to be exposed to the elements of weather such as freeze-thaw cycles and the agents which broke down the parent material, it begins to develop horizons or visible layers. As plants and animals in the uppermost layer die, their remains become organic matter or the healthy dark brown or black component of soil. Organic matter and the broken down subsoil components mix to form the topsoil. Organisms such as fungi, bacteria, earthworms and plant roots live in topsoil. These organisms feed on or decompose the organic matter, manure, plant residue, etc. Crop residue is the stalks, stems, leaves of last year’s crop that is left on top of the soil. Conservation tillage is a system of farming where the soil is disturbed as little as possible, allowing lots residue to cover and protect the soil surface. Earthworms eat the residue creating tunnels in the soil to make more pore space. Materials: Crushed Chocolate Cookies Sprinkles Chocolate Pudding Candy-coated Chocolate/M&M’s/Chocolate Chips Mini Chocolate Chips White Frosting, optional Gummy Worms, optional Coconut, optional (Be aware of allergies.) Milk, optional (Be aware of allergies.) Containers for each of the ingredients Spoons Containers, utensils, etc. for each student Method:
1. Pour candy coated chocolate into a container labeled Parent Material and pudding into a container labeled Subsoil.
2. Crush chocolate sandwich cookies and pour in a container labeled Topsoil. 3. Pour sprinkles into container labeled Organisms, coconut in a container labeled Residue,
gummy worms in a container labeled Earthworms, and Mini Chocolate Chips in a container labeled Aggregates.
4. Place frosting in a tube or use frosting already in a tube and label the tube Hyphae.
30
5. Demonstrate soil structure by placing the parent material on the bottom followed by the subsoil then sprinkle a combination of topsoil, organisms, and aggregates on top with hyphae and a gummy worm running through it, and top with a sprinkle of residue.
6. Allow the audience to use the ingredients to make their own soil. 7. (Optional) Have the audience pour a small amount of milk over the top.
Observations:
1. Observe how the parent material, subsoil, and topsoil are layered. 2. Discuss how the components in the topsoil influence the pore space/open space of the
topsoil. 3. If milk is added, observe what happens when the milk encounters the different layers. If
milk is not added, ask the audience what they think might happen.

31
Soil Aggregates – Edible StablityBuilding Better Soil website
Introduction: This is a delicious and fun way to demonstrate aggregate stability and how that impacts soil structural stability. If you have done one or more of the demonstrations above link those demonstrations with aggregate stability, soil structure and pore space. Aggregates are small pellets in the soil which are like marbles of different sizes, except that these marbles act like small microbial towns. When the aggregates are water stable, these towns are protected and soil organisms can live and grow near their food sources. Soil organisms, such as fungi, make substances like glomalin which form a coating on the surface of soil aggregates to keep them stable. Materials: Crushed Chocolate Cookies Sprinkles White Frosting in a tube Chocolate pudding or frosting Coconut, optional (Be Aware of Allergies) Milk (Be Aware of Allergies) Spoons Method:
1. Make cookie aggregates as described in steps 2- with different amounts of white frosting (hyphae), sprinkles (organisms), coconut (residue), and glomalin (chocolate pudding or frosting) and place one on each spoon for each student or have the students make them themselves.
2. Take a tablespoon of crushed chocolate cookies and place in a mound on a cookie sheet. 3. Add sprinkles and coconut. 4. Make criss-crossing lines over the crushed cookie mound with the frosting in a tube and
shape into a ball. Try to make balls with little or no frosting in a tube. 5. Roll the ball in chocolate pudding or frosting. Note: Do not roll all the balls in the
pudding or frosting. Leave some without this coating. 6. Place balls (aggregates) on spoons. Chill if necessary. 7. Take spoons and have each audience member dip and swirl gently in milk. 8. Pull spoon out of milk and observe what happened.
Observations:
1. Observe how well the aggregates did or did not stay together based if the balls had a pudding or frosting coating (glomalin) and how much white frosting (hyphae) was added.
32
Resources
Websites 1. Soil Quality Test Kit Guide - http://soils.usda.gov/sqi/assessment/test_kit.html
2. Sponges for Soil Properties –
http://www.apsru.gov.au/apsru/Projects/wfs/ActionLearning/Tools_Book/SpongSoilProp1.pdf
3. Soil Science Education Home Page - http://soil.gsfc.nasa.gov/index.html
4. Soil Education - http://soils.usda.gov/education/index.html
5. Agriculture is a Science - http://www.ars.usda.gov/is/kids/fair/story.htm
6. Building Better Soil – Taste the Difference - http://www.conservationinformation.org/publications/BetterSoilRecipe.pdf
7. Hold That Soil - http://www.arlingtonecho.net/pdf_files/hld_soilgr2.PDF
8. Sponge and Bucket Demonstration - http://animalrangeextension.montana.edu/LoL/Module-2c/2-Demonstration3.htm
9. Soil Erosion Demonstration - http://soils.usda.gov/education/resources/k_12/lessons/experiments/erosion/
10. How Soil Acts as a Water and Sponge - http://waterquality.montana.edu/docs/education/4h_manual_ch9a.shtml
11. Surface Area vs. Size and Shape -
http://courses.soil.ncsu.edu/resources/physics/texture/soilgeo.swf
12. Understanding Science – http://undsci.berkeley.edu/
13. Dr. Dirt – http://www.wtamu.edu/~crobinson/DrDirt.htm
33
Journal Articles 1. Bruns, M.A. and L.B. Byrne. 2004. Scale model of a soil aggregate and associated
organisms: A teaching tool for soil ecology. J. Nat. Resour. Life Sci. Educ. 33: 85-91.
2. Kemper, W.D. and W.S. Chepil. 1965. Size distribution of aggregates. In: Methods of soil analysis, Part I. Ed: C.A. Black. Agronomy No. 9. American Society of Agronomy 499-509.
3. Nichols, K.A. and S. Samson-Liebig. 2011. An Inexpensive and Simple Method to Demonstrate Soil Quality Parameters. Journal of Natural Resources and Life Sciences Education. In press.
4. Nichols, K.A. and M. Toro. 2010. A New Index for Measuring Whole Soil Stability. Soil and Tillage Research. 111(2): 99-104.
5. Nichols, K.A. and S.F. Wright. 2004. Contributions of soil fungi to organic matter in agricultural soils. p. 179-198. In: Functions and Management of Soil Organic Matter in Agroecosystems. F. Magdoff and R. Weil (Eds.). CRC Press.
6. Six, J., H. Bossuyt, S. Degryze, and K. Denef. 2004. A history of research on the link between (micro)aggregates, soil biota, and soil organic matter dynamics. Soil and Tillage Research 79: 7-31.
7. Six, J., E.T. Elliott, and K. Paustian. 2000. Soil structure and soil organic matter. II. A normalized stability index and the effect of mineralogy. Soil Science Society of America Journal 64(3): 1042-1049.
8. Wright, S.F. 2000. A fluorescent antibody assay for hyphae and glomalin from arbuscular mycorrhizal fungi. Plant and Soil 226: 171-177.
9. Wright, S.F., M. Franke-Snyder, J.B. Morton, and A. Upadhyaya. 1996. Time-course study and partial characterization of a protein on hyphae of arbuscular mycorrhizal fungi during active colonization of roots. Plant and Soil 181: 193-203.
10. Wright, S.F., J.L. Starr, and I.C. Paltineanu. 1999. Changes in aggregate stability and concentration of glomalin during tillage management transition. Soil Science Society of America Journal 63: 1825-1829.
11. Wright, S.F. and A. Upadhyaya. 1996. Extraction of an abundant and unusual protein from soil and comparison with hyphal protein of arbuscular mycorrhizal fungi. Soil Science 161: 575-585.
12. Wright, S.F., and A. Upadhyaya. 1998. A survey of soils for aggregate stability and glomalin, a glycoproteins produced by hyphae of arbuscular mycorrhizal fungi. Plant and Soil 198: 97-107.
13. Wright, S.F., and A. Upadhyaya. 1999. Quantification of arbuscular mycorrhizal fungi activity by the glomalin concentration on hyphal traps. Mycorrhiza 8: 283-285.