soil phosphorus in isolated wetlands of subtropical beef ... · soil phosphorus in isolated...
TRANSCRIPT

SOIL PHOSPHORUS IN ISOLATED WETLANDS OF SUBTROPICAL BEEF
CATTLE PASTURES
By
CARLA M. SPERRY
A THESIS PRESENTED TO THE GRADUATE SCHOOL OF THE UNIVERSITY OF FLORIDA IN PARTIAL FULFILLMENT
OF THE REQUIREMENTS FOR THE DEGREE OF MASTER OF SCIENCE
UNIVERSITY OF FLORIDA
2004

Copyright 2004
by
Carla M. Sperry

This document is dedicated to my mom, Myra Sperry, the person who gave me life, continues to give guidance, and will always be a source of strength and love.

ACKNOWLEDGMENTS
I want to thank Dr. D.A. Graetz for his support, guidance, and advice during the
last two years. In addition, I would like to thank my committee members, Drs. V.D. Nair
and P. Bohlen. Special thanks go to Drs. P. Bohlen and S. Gathumbi for collecting soil
samples and providing pictures of Buck Island Ranch and to Dr. Littell for assisting in
statistical analysis of my data.
I would like to thank Dawn Lucas for extending her family to me, her help with
laboratory experiments and calculations, and for sharing her chocolate stash; Lacey, Kat,
and Emily for their help in the lab; LaKeisha, Travis, Leighton, and my fellow graduate
students for making my graduate experience memorable and fun. After all the work is
completed, I will cherish the friendships and look back on my time at UF with a smile. I
would also like to thank the faculty and staff of the University of Florida Soil and Water
Science Department and the University of South Florida Environmental Science and
Policy Department for their role in furthering my academic career.
My family has provided a tremendous amount of support both emotionally and
financially. I will never be able to express how much that has meant to me, I thank them
for helping to make this a reality and last but not least Bo, my dog, for keeping me sane
and making sure I took plenty of “play” breaks during my studies.
iv

TABLE OF CONTENTS Page ACKNOWLEDGMENTS ................................................................................................. iv
LIST OF TABLES............................................................................................................ vii
LIST OF FIGURES ........................................................................................................... ix
ABSTRACT....................................................................................................................... xi
CHAPTER 1 INTRODUCTION ........................................................................................................1
Rationale and Significance ...........................................................................................2 Goal and Objectives......................................................................................................3
2 LITERATURE REVIEW .............................................................................................4
Introduction...................................................................................................................4 Wetlands Role in P Landscape Dynamics ....................................................................4 Movement of P from Upland Pastures to Imbedded Wetlands ....................................6 Soil Forms.....................................................................................................................9 Fractionation of Soil Phosphorus................................................................................10 Sorption Characteristics of Wetland Soils..................................................................12
3 MATERIALS AND METHODS ...............................................................................16
Site Description ..........................................................................................................16 Total Soil and Detrital Phosphorus Content ...............................................................20 Soluble Reactive Phosphorus .....................................................................................20 Total Carbon-Nitrogen Content..................................................................................21 Fractionation ...............................................................................................................21 Double-acid Extractable P ..........................................................................................23 Phosphorus Sorption Isotherms ..................................................................................23 Resin-extractable P .....................................................................................................25 Statistical Methods......................................................................................................25
4 RESULTS AND DISCUSSION.................................................................................26
Selected Soil Characteristics.......................................................................................26
v

Total P, Soluble Reactive P, and Double-acid extractable P......................................26 Fractionation ...............................................................................................................31 Anion Exchange Membrane Extractable P.................................................................42 Langmuir Adsorption Isotherms.................................................................................44 Double-acid Extractable Al, Fe, Ca, and Mg..............................................................48 Degree of P Saturation (DPS).....................................................................................52
5 CONCLUSIONS ........................................................................................................54
LIST OF REFERENCES...................................................................................................57
BIOGRAPHICAL SKETCH .............................................................................................65
vi

LIST OF TABLES
Table page 4-1. Improved (IMP) and Semi-native (SN) pasture wetland soil characteristics by
depth. ........................................................................................................................26
4-2. ANOVA p-values for pasture type (IMPSN), stocking density (Treatment), location, and depth effects and interactions for parameters listed determined for concentration (conc.) and soil mass (mass) content. ................................................27
4-3. Total P (TP) concentrations and mass for the interior (In) and edge of improved (IMP) and semi-native (SN) pasture wetlands by depth. .........................................28
4-4. Soluble Reactive P (SRP) concentrations and mass for interior (In) and edge of improved (IMP) and semi-native (SN) pasture wetlands by depth. .........................29
4-5. Double-acid extractable P (DAP) concentrations for interior (In) and edge of improved (IMP) and semi-native (SN) pasture wetlands by depth. .........................31
4-6. ANOVA p-values for pasture type (IMPSN), stocking density (Treatment), location, and depth effects and interactions for parameters listed. .........................................32
4-7. Labile Pi concentration (mg kg-1) and mass (g m-2) for improved (IMP) and semi-native (SN) pasture wetlands at different soil depths...............................................34
4-8. Fe/Al-P and Ca/Mg-P concentration (mg kg-1) and mass (g m-2) for improved (IMP) and semi-native (SN) pasture wetlands at different soil depths. ..............................36
4-9. Organic P concentration (mg kg-1) and mass (g m-2) for improved (IMP) and semi-native (SN) pasture wetlands at different soil depths...............................................38
4-10. Residual P concentration (mg kg-1) and mass (g m-2) for improved (IMP) and semi-native (SN) pasture wetlands at different soil depths...............................................39
4-11. Anion exchange membrane extractable P for interior (In) and edge of wetlands by depth. ........................................................................................................................42
4-12. Comparison of Langmuir sorption parameters for soil depths. Smax = P sorption maximum, k = bonding energy, EPC = equilibrium P concentration. .....................45
vii

4-13. ANOVA p-values for wetland type (IMPSN), stocking density (Treatment), location, and depth effects and interactions for parameters listed. ..........................48
4-14. Mean double-acid Al (DAAl) and double-acid Fe (DAFe) concentrations (mg kg-1) and mass (g m-2) at a given depth for improved (IMP) and semi-native (SN) pastures at the interior (In) and edge of the wetlands. .............................................50
4-15. Mean double-acid calcium (DACa) and double-acid magnesium (DAMg) concentrations (mg kg-1) and mass (g m-2) at a given depth for improved (IMP) and semi-native (SN) pastures at the interior (In) and edge of the wetlands. .................51
4-16. Degree of P Saturation (DPS) values at a given depth within the interior and edge of the improved (IMP) and semi-native (SN) pasture wetlands...............................52
viii

LIST OF FIGURES
Figure page Figure 3-1. Location of Buck Island Ranch......................................................................17
Figure 3-2. Expermental pastures at the MacArthur Agro-ecology Research Center. Polygons indicate depressional wetlands within pastures........................................19
Figure 3-3. Modified fractionation scheme adopted from Hedley et al.(1982). Total P = ∑ Pi + Po (residual P); Centrifugation (10,000 g for 10 min)...................................22
Figure 3-4. Illustration of procedure used to adjust the total amount of P adsorbed by the soil, taking into consideration So, the initial P present in the soil. ...........................24
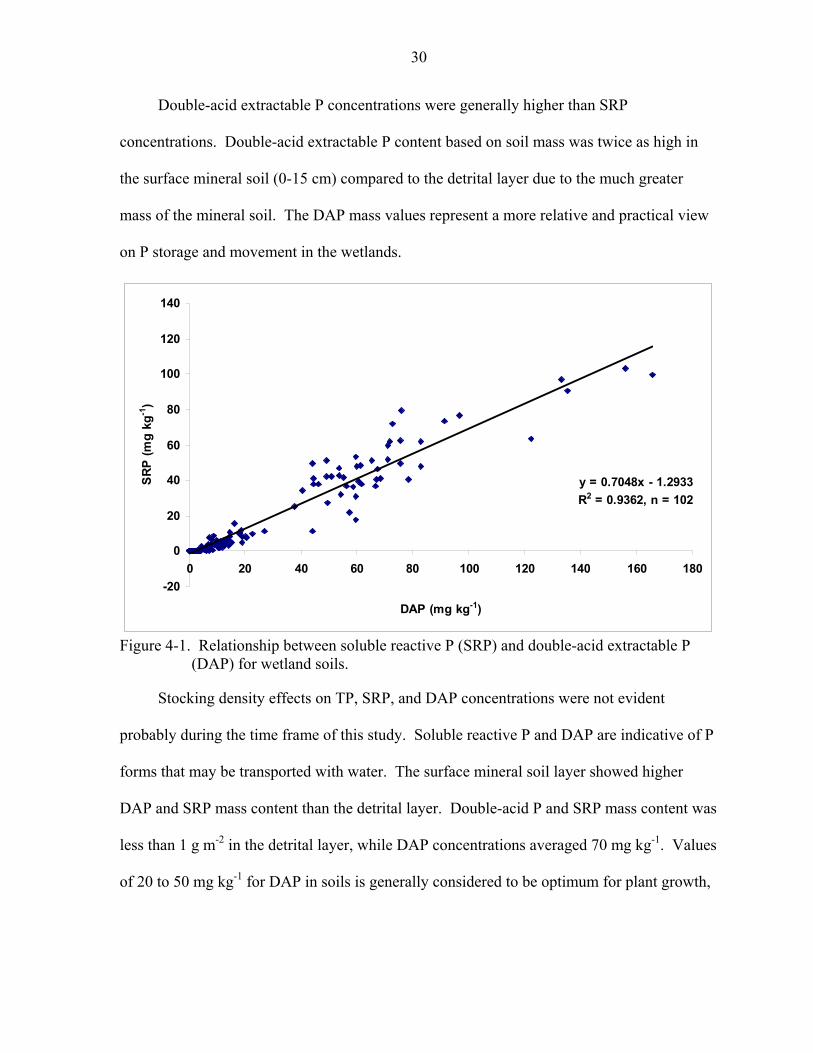
Figure 4-1. Relationship between soluble reactive P (SRP) and double-acid extractable P (DAP) for wetland soils............................................................................................30
Figure 4-2. Relationship between labile Pi and double-acid extractable P (DAP) for wetland soils. ............................................................................................................34
Figure 4-3. Relationship between labile Pi and soluble reactive P (SRP) for wetland soils...........................................................................................................................35
Figure 4-4. Phosphorus concentration fractions for wetland soils by depth.....................40
Figure 4-5. Phosphorus mass fractions for wetland soils by depth...................................41
Figure 4-6. Relationship between anion exchange membrane (AEM) extractable P and labile Pi. ....................................................................................................................43
Figure 4-7. Relationship between anion exchange membrane (AEM) extractable P and soluble reactive P (SRP)...........................................................................................43
Figure 4-8. Relationship between anion exchange membrane (AEM) extractable P and double acid-extractable P (DAP)..............................................................................44
Figure 4-9. Langmuir P sorption isotherms and P precipitation of a random 0-15 cm mineral soil layer sample..........................................................................................47
Figure 4-10. Relationship between Langmuir Smax and the single point isotherm (1000 mg P kg-1) value. ......................................................................................................47
ix

Figure 4-11. Mean degree of P saturation (DPS) percentages at a given depth for improved (IMP) and semi-native (SN) pasture wetlands.........................................53
Figure 4-12. Relationship between soluble reactive P (SRP) and degree of P saturation (DPS) for wetland soils. ...........................................................................................53
x

Abstract of Thesis Presented to the Graduate School
of the University of Florida in Partial Fulfillment of the Requirements for the Degree of Master of Science
SOIL PHOSPHORUS IN ISOLATED WETLANDS OF SUBTROPICAL BEEF CATTLE PASTURES
By
Carla M. Sperry
May 2004
Chair: Donald A. Graetz Major Department: Soil and Water Science
Wetlands within agricultural landscapes are receiving increasing attention for their
role as wildlife habitat and their ability to assimilate nutrients. To increase our
understanding of the function of wetlands in agricultural settings, it is important to
investigate key nutrient processes in wetlands and evaluate their response to various
management practices. The objective of this research was to analyze the influence of
cattle stocking densities (0, 0.46, 0.62, and 1.08 cow-calf pairs/ha) on phosphorus (P)
accumulation in soils and associated detritus of isolated freshwater wetlands in improved
(fertilized and limed) and semi-native (no fertilization or liming) pastures. Incremental
soil samples (detrital layer, 0-15, 15-30, and 30-45 cm) were collected at the interior and
edge of wetlands in pastures with the four different stocking densities. The wetlands
were sampled two years after implementation of the cattle stocking density treatments.
Samples were analyzed for total phosphorus (TP), soluble reactive phosphorus (SRP),
double-acid extractable P (DAP), Ca (DACa), Mg (DAMg), Al (DAAl), and Fe (DAFe),
xi

and resin-extractable P. A modified chemical fractionation procedure was used to
measure P forms. Soils were further characterized for P adsorption parameters and
degree of P saturation (DPS), calculated using DAP, DAFe, and DAAl concentrations.
Grazing density did not significantly affect soil P parameters in the wetlands after
two years of stocking treatments. Concentrations for all forms of soil P were greater in
the improved pasture wetlands than in the semi-native pasture wetlands and were also
higher in the interior than the edge of the wetlands. Concentrations of TP, SRP, DAP,
and resin P were highest in the detrital layer and decreased with soil depth. The degree of
P saturation values in the detrital layers was above the commonly used threshold value of
30% but the mineral soil layers were below this threshold. When calculated on a mass
basis, the greatest amounts of P were found in the surface mineral soil layer (0-15 cm).
Organic P and labile Pi (SRP plus NaHCO3-Pi) were the dominant forms of P in the
detrital and soil layers based on P fractionation.
Overall, this evaluation of soil P parameters showed that cattle stocking density did
not affect detrital and soil P concentrations in embedded wetlands two years after
implementation of the stocking density treatments. The highest stocking density used in
this study was about double that typically found in this region. Higher concentrations
and mass of P in the interior of the wetlands compared to the edge reflect the longer
period of inundation and consequent build up of organic matter in the wetland interior.
The history of past P fertilization of the improved pastures likely resulted in the higher
soil P concentrations in wetlands in those pastures.
xii

CHAPTER 1 INTRODUCTION
Phosphorus (P) is one of the key elements necessary for growth of plants and
animals. Phosphorus exists in soils and minerals, living organisms, and in the water
column of lakes and wetlands. Although wetlands generally accumulate nutrients, they
sometimes become net exporters of nutrients that had been previously taken up by plants
(Mitsch and Gosselink, 1993). Depending on hydrologic conditions, decaying vegetation
and waterfowl use, nutrient cycling within a wetland can re-dissolve soluble nutrients,
which then can be transported within or out of the wetland.
Phosphorus occurs in a sedimentary cycle with no significant gaseous loss
mechanism, so it tends to accumulate in wetland systems. Retention of P is regulated by
sedimentation and uptake and release by vegetation, periphyton, and microorganisms. In
wetland systems, P occurs as soluble and insoluble compounds in both organic and
inorganic forms (Faulkner and Richardson, 1989). The vast majority of P is tied up in
organic matter and inorganic sediments and is also rendered unavailable to plants and
microorganisms through precipitation of insoluble phosphate and the adsorption of
phosphate onto clay particles, peat, and Iron (Fe) and Aluminum (Al) hydroxides (Mitsch
and Gosselink, 1993). Conversely, P can be released from sediments by diffusion,
desorption, and resuspension.
The seasonality of subtropical wetlands causes large fluxes of nutrients from soils
and sediments to overlying waters (Mitsch and Gosselink, 1993). The most active time
of nutrient mineralization is thus likely to be associated with fluctuations in water table
1

2
levels and drying and re-wetting of soils and sediments. A sharp increase in the
concentration of P exiting a wetland, after the first major storm event of the wet season,
has been reported by several Florida researchers (Knisel et al., 1985; Hill, 1982;
McCallister and Logan, 1978). The area of convergence of aerobic and anaerobic
conditions may be the most active point of entry for shallow surface water from adjacent
upland areas into wetlands. This water may be enriched with nutrients and or energy
sources capable of enhancing nutrient transformations at the land-water interface
(Johnston, 1993).
The major sink of P in wetlands is sediment accumulation, accounting for greater
than 95% of the P in natural wetlands (Faulkner and Richardson, 1989). Much lower
amounts occur in vegetation and overlying water. Phosphorus retention is also controlled
by abiotic processes (precipitation of Fe- and Al-phosphates, adsorption of P to soil
minerals). Although soil adsorption and peat accumulation control long-term P retention,
initial uptake is controlled by microorganisms and sediments. The importance of biotic
and abiotic processes that contribute to P cycling in wetlands is dependent on water
levels, amount of available P, soil P adsorption, and seasonal changes in uptake by
microorganisms (Daniel et al., 1998).
Although wetlands have the ability to remove nutrients in the short-term, the
possibility remains that they may become nutrient saturated and serve as nutrient sources.
Thus, it is necessary to examine nutrient cycling processes in relation to grazing land use
and cattle stocking density in wetlands of subtropical pastures.
Rationale and Significance
Beef cattle ranches are the most extensive land use in the Lake Okeechobee
watershed, the main water supply for south Florida. Florida ranks second only to

3
Kentucky in total beef cattle production in the eastern United States and ranks tenth
nationally, with nearly 2 million head of cows and calves. Phosphorus loadings into the
lake have increased substantially in the past few decades, leading to increased frequency
of algal blooms and decreasing water quality. Nutrient cycling and retention in wetlands
embedded within pastures may significantly influence nutrient storage and losses from
these rangelands. Information obtained in this project will increase the understanding of
grazing cattle stocking density on nutrient cycling and biotic communities in wetland
ecosystems.
Goal and Objectives
The overall objective of this study is to evaluate the P status of soils in wetlands
embedded within improved (IMP) and semi-native (SN) pastures in south Florida. The
specific objectives are to 1) determine if there are differences in soil P status between
wetlands embedded within improved and semi-native pastures, 2) determine the
difference in soil P status between the edge and interior of the wetlands, 3) evaluate the
forms of soil P present in the wetlands, 4) evaluate the P sorption characteristics of the
wetland soils, and 5) evaluate the influence of cattle stocking density on P accumulation
in the wetlands.

CHAPTER 2 LITERATURE REVIEW
Introduction
In many natural systems, P is the limiting nutrient restricting primary productivity.
Phosphorus can originate from urban, residential, industrial, and agricultural sources
(Reynolds, 1978). Great interest has recently developed in the use of wetlands for
agricultural and urban non-point source pollutant retention (Lowe et al., 1992; Olsen and
Marshall, 1992; Baker, 1992; Mitsch, 1992). Agricultural sources of P are considered
one of the main causes of pollution of surface waters, accelerating the eutrophication of
P-sensitive surface waters (Daniel et al., 1998).
Wetlands Role in P Landscape Dynamics
Naturally occurring wetlands in agricultural landscapes receive non-point source
pollutants from groundwater flow and surface runoff (Lowrance et al., 1995) and act as
filters, retaining nutrients from agricultural or urban runoff. Wetland systems have been
shown to lower the concentration of many contaminants including nitrogen (N), P,
suspended solids, trace metals, and organics, and to decrease biochemical oxygen
demand (Mitsch, 1994). In wetland systems, P is present in soils/sediments, water, and
vegetation. The P storage of the water compartment is small compared to that of the
vegetation, and much smaller relative to the sediment compartment (Faulkner and
Richardson, 1989). Although some P may be dissolved, it is more likely to be adsorbed
onto soil particles. Processes controlling the interactions between compartments can be
physico-chemical, such as adsorption or biological, as in plant uptake and release
4

5
(Kadlec, 1987). However, increased P input into wetlands has often created an
oversaturation of soil P, leading to export of P from the wetlands. Thus, the cycling and
retention of soil P within wetland systems is of ecological interest.
Phosphorus retention in wetlands is largely controlled by the interactions of redox
potential, pH, Fe, Al, and Ca minerals, and the amount of native soil (Faulkner and
Richardson, 1989). The ability of wetlands to assimilate P depends on physical,
chemical, and biological characteristics of the wetlands. Studies of wetlands at Houghton
Lake, MI have shown steady P removal of 97% for the past 15 years (Kadlec, 1993). The
ability of wetlands to retain P is regulated by diffusion of P from the water column to the
underlying soil/sediment and vice versa. Retention occurs primarily at the soil-water
interface. The retention of P in the soil matrix is further complicated by being a two-
stage process in which an initially rapid, reversible adsorption is followed by a slow,
largely irreversible diffusion into the matrix (Sanyal and DeDatta, 1991). Initial short-
term nutrient retention rates can be quite high. However, these storage compartments are
often quickly saturated, especially in systems that have not previously received elevated
nutrient loads (Howard-Williams, 1985). Thus, wetland nutrient retention may be only
temporary, and over the long-term, some of the storage functions can break down and the
system will become a source of contaminants as it releases stored materials (Howard-
Williams, 1985).
Reddy et al. (1995) found that P retention in wetland vegetation is short-term and
dependent on macrophyte species, P loading, and wetland hydrology. Phosphorus stored
in below-ground biomass represented long-term storage of residual P. Eighty percent of
the P stored in above-ground biomass was released into the water column upon biomass
6
decomposition. The maximum P retention capacity was estimated to be approximately
70 g m-2 for wetlands (Reddy et al., 1995). Some rooted wetland plants act as nutrient
pumps, taking 60-100% of their P from sediments by root adsorption and translocating
this P to above ground structures (Adamus and Stockwell, 1983). At the end of the
growing season, most of this P is released into the water column due to leaching from
decomposing vegetation.
Drainage of agricultural fields has been associated with significant changes in
watershed hydrology and nutrient losses and the removal of wetlands from these
watersheds is responsible for increased export of nutrients. As of 1985, approximately 45
million ha of agricultural land in the United States had been artificially drained (Pavelis,
1987). About 65% of this total was drained via surface methods, a network of ditches,
while the remainder was drained by underground tiles or pipes discharging into ditches or
streams (Pavelis, 1987).
Movement of P from Upland Pastures to Imbedded Wetlands
The potential movement of P from pasture uplands to embedded wetlands is
dependent on several factors, including the surface and subsurface runoff in a watershed
area, land management, and the amount, form, and availability of P in the soil. As soil P
content increases, the potential for particulate and dissolved P transport in runoff
increases (Daniel et al., 1998). At some threshold, P removal may become asymptotic
and increased amounts may result in increased P export from the wetland. This situation
may occur as soil exchange sites fill, biological uptake is inhibited or water movement
limits physical and chemical retention processes (Nairn and Mitsch, 2000).
The main mechanisms by which P is lost from agricultural land is by runoff,
erosion, and leaching. The loss of P in runoff occurs in dissolved and particulate P

7
forms. Dissolved P is comprised mostly of orthophosphate, which is immediately
available for algal uptake (Walton and Lee, 1972). Particulate P includes P sorbed by
soil particles and organic matter eroded during runoff and constitutes the major portion of
P transported from tilled land (75-95%) (Sharpley et al., 1994a). Runoff from grass or
forest land carries little sediment and is dominated by dissolved P. The loss of dissolved
and particulate P is a function of topography, soil type, soil test P concentrations, and soil
hydrology (McDowell and Sharpley, 2001).
Desorption, dissolution, and extraction processes of soil P occur as rainfall interacts
with the thin surface soil layer before leaving an agricultural area via runoff. Once P
from runoff water is dissolved, sorption or desorption with runoff sediment may take
place. Sharpley et al. (1992) found that the relationship between erosion and particulate
P was similar for both unfertilized grassland and fertilized, tilled wheat fields. During
runoff events, finer sized soil fractions (clays and colloidal organic matter) are
preferentially eroded. This results in the eroded material having higher P content than the
source (Sharpley et al., 1994b). It has been shown that clay and organic matter in acidic
soils are correlated with P adsorption (Pierzynski et al., 1994). In addition to surface
runoff, a significant portion of dissolved P can be transported through subsurface flow as
observed in spodosols (Gilliam et al., 1994). The A and E horizons of the soil profile are
sandy and have low P sorbing capacity whereas the Bh and Bw horizons have greater P
sorbing capacity due to Fe- and Al- oxide content (Nair et al., 1998).
Applications of fertilizers and manures in many areas result in the buildup of soil P
concentrations above those required for favorable plant growth. Manure is usually land
applied with application rates based on N needs of a specific crop. This practice often
8
results in excessive P fertilization of the crop, because the P/N ratio of manure is much
higher than the P/N ratio required by plants (Pote et al., 1996; McDowell and Sharpley,
2001). Long-term nutrient application at rates exceeding crop requirements can raise soil
test P levels in areas of crop and animal production. These elevated concentrations
increase the potential for P loss.
Manure and fertilizer application can result in high P levels in soils which may
become a source of surface and groundwater pollution. Downward movement of P in
soils after P fertilizer application is small with the most P movement occurring in the first
few weeks after application (Eghball et al., 1990). Phosphorus movement can reach
greater soil depths after manure application compared to inorganic P fertilizer application
(no manure) (Eghball et al., 1996). Phosphorus movement in soil resulting from high
rates or repeated application of manure and fertilizer may contribute to contamination of
groundwater.
The cattle graze on bahiagrass (Paspalum notatum) in the improved pastures (IMP)
and on native grasses (Andropogon virginicus, Andropogon glomeratus, Paspalum leave,
Axonopus affinis) in the semi-native pastures (SN) at Buck Island Ranch (our study site).
The most common pasture grass (bahiagrass), has limited P uptake capacity. Bahiagrass
grown on unfertilized and fertilized Spodosols removed 2 g P m-2 yr-1 and 2-4 g P m-2 yr-1
respectively (Rechcigl and Bottcher, 1995). Since P bound in the grass is grazed by
cattle, much of it is returned to the soil as manure. Cycling of nutrients through grazers
may increase the readily-mineralizable pool of nutrients at the soil surface where they are
more accessible for uptake by plants and microorganisms (Botkin and Wu, 1981).

9
Many wetlands also receive net inputs of P as the cattle forage along the edges of
the wetland and then move to the interior to relieve heat stress or to graze on wetland
vegetation. During these events, cattle tend to create bare areas due to trampling and
defoliation of vegetation and also deposit urine and manure.
Soil Forms
Phosphorus is present in soils and sediments in organic and inorganic forms.
Organic P (Po) consists of undecomposed litter, microbes, and humus in the soil.
Inorganic P (Pi) may be present as phosphate minerals (fluorapatite, crandallite,
wavellite), organometallic complexes, and P bound to metal (Fe and Al) oxides and
hydroxides (Parfitt, 1978; Gale et al., 1994). Phosphorus stored in soils can be grouped
into the following major pools: (1) labile inorganic P, (2) P bound to Fe and Al minerals,
(3) P bound to Ca and Mg minerals, (4) P bound in labile organic forms, and (5) residual
organic P (Reddy et al., 1996a). Phosphorus present in the labile pool is of concern,
because this pool potentially can be removed from the soil during rainfall events. During
most runoff events, P is leached into the soil from decomposing manure and increases the
porewater concentration that temporarily increases the labile fraction (Reddy et al.,
1996b). McKeague and Day (1966) found a strong positive correlation between P
retention capacity and oxalate-extractable Fe and Al indicating the dominant role of Fe
and Al in retaining P. Phosphorus associated with Fe and Al oxyhydroxides was found to
be the dominant form of P and accounted for 17-43% of the total P in wetland soils (Flaig
and Reddy, 1995). Wetland types with predominately mineral soils and high amorphous
Al content are better P sinks (Richardson, 1985). Thus, higher soil P sorption is related
to the larger pools of Al and Fe sesquioxides that are found in conjunction with mineral
soils and aerobic soil conditions (Holford and Patrick, 1979; Wood et al., 1984).

10
In many acid soils (pH less than 5.5), the oxides, hydroxides, and oxyhydroxides of
Fe and Al are the components that predominantly influence phosphate sorption (Parfitt,
1989; Borggaard et al., 1990). Anaerobic soils and sediments have much more Fe in
solution (50-100 µg mL-1) compared to aerobic soils (< 1 µg mL-1) as well as a much
greater amount of Fe adsorbed on the exchange complex (Gotoh and Patrick, 1974).
Changes in the Fe oxides due to oxidation or reduction reactions can be expected to
change the concentration of dissolved orthophosphate (Patrick and Khalid, 1974). The
capacity of a flooded soil or marsh sediment to release orthophosphate-P to a solution
low in P and to sorb from a solution high in P is dependent on the amount of dissolved
inorganic orthophosphate within the soil/sediment (Patrick and Khalid, 1974). These
reactions determine whether the P concentration in the overlying water is adequate for the
nutritional requirements of vegetation and whether the sediments will remove enough P
from high P containing solutions to influence eutrophication.
Fractionation of Soil Phosphorus
Phosphorus fractionation is used to separate the various pools of soil P. These
forms can be grouped as follows: (1) labile (plant available) Pi, (2) inorganic P bound to
Fe and Al, (3) inorganic P bound to Ca and Mg, (4) organic P, and (5) residual P. The
Hedley fractionation procedure, developed for natural, unfertilized, and uncultivated
soils, recognizes plant-available forms (Resin Pi, Bicarb Pi, and Bicarb Po) and refractory
forms (NaOH Pi, NaOH Po, Sonic Po, HCl Pi, Residual P) of soil P (Hedley et al., 1982).
In this classification, plant-available or labile P includes the sum of Pi and Po from resin
and bicarb extractions, while refractory or unavailable P includes all of the other
fractions.

11
In fractionation, inorganic and organic P in the soil solution is removed with a
series of successively stronger reagents: resin, sodium bicarbonate (0.5 M NaHCO3),
sodium hydroxide (0.1 M NaOH), hydrochloric acid (1.0 M HCl) and an acid digestion
(Hedley et al., 1982). The labile P is available to microbial and vegetation communities
in the short term because it quickly desorbs from the surface of soil particles. Non-labile
P fractions are bound to soil particles and are not as readily available for plant uptake.
The weathering of minerals supplies P to the plant-available pool in soils. Parent
material and climate determine the overall weathering rate; these factors influence the
equilibrium between P loss and retention (Gardner, 1990). Bacteria, fungi, and higher
vegetation incorporate P into biomass (biological cycle). Decomposition and
mineralization return Pi to the soil solution. Biological processes regulate the movement
and distribution of labile forms of P (Stewart and Tiessen, 1987). Microbes can
immobilize between 20-50% of the Po of surface soils (Walbridge, 1991). Eventually,
both biological and geochemical processes modify Pi into stable forms of Po and Pi in
soil. Soils located in humid temperate and tropical regions (Ultisols) and that are highly
weathered and acidic are dominated by large quantities of sesquioxides (Johnson and
Cole, 1980). Phosphorus fractionation of wetland soils revealed that most of the P is
associated with amorphous and poorly crystalline forms of Fe and Al, and organic P
(Reddy et al., 1995). Results of soil P fractionation (Graetz and Nair, 1995) showed that
up to 90% of the total P is in stable form and only 10% is labile and potentially available
for transport. Through separation of soil P into fractions and removing the more easily
extracted fractions with weak reagents, it is possible to identify the soil P fractions that
can be altered by agricultural practices.

12
Sorption Characteristics of Wetland Soils
The assessment of continuing capacity of a soil to fix P against leaching is
becoming increasingly important. The risk of P leaching along with associated
environmental problems is related to the potential of soil to retain P (Indiati, 2000).
Phosphorus readily sorbs to soil and sediments. When P is added to soil, the soluble
forms immediately react with soil components to form less soluble compounds which
become increasingly insoluble with time. However, a large proportion of the P removed
from solution is adsorbed onto the P-reactive soil colloidal surfaces, thus the quantity of
P adsorbed will depend on the number of adsorption sites (Holford et al., 1997).
Variation in P sorption/desorption characteristics among different horizons of the soil can
affect the extent and direction of P transport (He et al., 1999).
Phosphorus movement in soils with considerable amounts of clay and low soil P
content is limited by the sorption potential of soil colloids (He et al., 1988). Phosphorus
leaching and transport can occur more readily in sandy soils (Weaver et al., 1988; Guertal
et al., 1991) and in soils with high P levels due to continuous P application (Heckrath et
al., 1995). Surface soil particle size plays an important role in the retention of P. The
variability in surface area due to particle size differences may contribute to variations in P
sorption capabilities. Atalay (2001) reported that different soil textures, ie. soil particle
size, showed differences in the P sorption capacity of soils studied. The transport of P
and other materials from the surface soil by overland flow creates an ensuing impact on
eutrophication of water bodies (Atalay, 2001). The division of P between soil solution
and the solid phase is considered to be controlled by sorption/desorption mechanisms
(Frossaed et al., 1995).
13
The sorption properties are characterized by measuring sorption isotherms in which
soils are shaken with known amounts of P in solution. The isotherm is then constructed
by plotting the amount of P removed from solution against the P concentrations
remaining in solution. The Langmuir (Langmuir, 1918) adsorption isotherm equation
provides both an estimate of sorption capacity and an estimate of the average sorption
strength of the soil. It has been suggested that no leaching will occur before an amount of
P has been applied that equals or exceeds the maximum sorption capacity (Holford et al.,
1997). Phosphorus availability and potential movement from soils to groundwater is vital
to policy-making in agricultural management.
Breeuwsma and Silva (1992) developed a test referred to as degree of P saturation
(DPS), which relates soil extractable P to P sorbing capacity of a soil with the following
relationship: DPS = (extractable soil P/P sorption maximum) * 100. Nair and Graetz
(2002) expressed DPS values as a percentage of double acid-extractable P (Mehlich-1) to
the P sorption capacity of a soil. Double-acid extractable P (DAP) may be used as an
indicator of potential P to be released from manure-impacted soils. This test is used by
soil testing laboratories to associate soil P levels to crop yield potential. Nair et al. (1999)
used soluble reactive P and DAP as possible indicators of P to be released from manure
impacted soils. This is ideal in the southeastern USA due to the routine use of Mehlich-1
as a soil test P. Recently, DPS has been used to determine the potential for P release
from soils to surface runoff and subsurface leaching (Pote et al., 1996; Sharpley et al.,
1996; Nair et al., 1998).
The equilibrium P concentration (EPC), defined as the soluble P concentration in
equilibrium with soil at which neither net sorption nor desorption occurs, is an important

14
property associated with a soil/solution mixture. Changes between soluble or dissolved P
and particulate P (P bound to soil particles) are mainly controlled by the sorption
properties of the solid phase and the direction of the exchanges depends upon the
concentration of sediment and soluble P, and the EPC of the contacted sediment
(Sharpley and Menzel, 1987). Thus, the EPC can aid in the prediction of whether soils
and sediments will gain or lose P when in contact with runoff waters or in streams or
lakes (Wolf et al., 1985). Soils with high EPC values will have a greater tendency to
desorb (release) soluble P.
At equilibrium, the rate of P sorption equals that of desorption. Theoretically, if the
P concentration of the floodwater were to increase due to some external loading, then
more P would be sorbed to reestablish this equilibrium. If the opposite were to happen
and the concentration in solution were to decrease, desorption would occur and the
particles would release P until equilibrium was again attained (Froelich, 1988).
An alternative to traditional chemical extraction of P is the use of ion sinks, such as
Fe-strips, anion exchange resins, and ion-exchange membranes. Ion sinks have given
positive results for measuring available P when applied to soils with diverse chemical and
physical properties (Menon et al., 1989; Sharpley, 1991). Resin/Exchange membranes
adsorb P onto the surface and interact minimally with the soil (Kleinman et al., 2001). In
studies performed on canola and ryegrass, the resin membranes provided a better index of
P availability than conventional extraction methods (Sharpley et al., 1994a).
Previously, resin beads placed in polyester-netting bags were used to extract P from
soils, however this procedure suffered from several disadvantages: resin bags tended to
trap fine root material and soil particles and normal use of the bags may cause tears in the

15
seamed edges resulting in loss of resin beads. Saunders (1964) found that anion
exchange membranes behave in a similar manner to the resin beads and gave an equally
good estimate of soil P. The P extracted from the exchange membranes is from the
exchangeable or labile P pool.
Wetlands contained in agricultural landscapes are receiving greater attention due to
their role as habitats for wildlife and their ability to assimilate nutrients. Total wetlands
coverage in south central Florida has decreased from 25% to 15% in the last few decades
(SFWMD, 1997). The result of these land changes has increased nutrient loading into
Lake Okeechobee. Phosphorus concentrations have doubled within the past two decades.
Although wetlands have the ability to remove nutrients short-term, the possibility remains
that they may become nutrient saturated and serve as nutrient sources. Thus it is
necessary to examine nutrient cycling processes in relation to grazing cattle stocking
density in wetlands of subtropical rangeland ecosystems.

CHAPTER 3 MATERIALS AND METHODS
Site Description
The site for this research is located on Buck Island Ranch, at the MacArthur Agro-
Ecology Research Center (MAERC), a division of the Archbold Biological Station in
south-central Florida (Figure 3-1). The Center is a 4,170 ha working cattle ranch within
the Lake Okeechobee watershed. Sixteen hydrologically separated pastures, eight each
of improved summer pasture and native winter wet prairie, have been constructed (Figure
3-2). The pastures are hydrologically separated by a ditch/berm system. In the summer
(May-Oct.), cattle are stocked on improved pastures that are planted in bahia grass
(Paspalum notatum) and fertilized with nitrogen only. In the winter (Nov.-April) cattle
are moved to wet prairies, which are dominated by native grasses (Andropogon
virginicus, Andropogon glomeratus, Paspalum laeve, Axonopus affinis) and are not
fertilized. Summer and winter pastures are 20 and 32 ha, respectively and are stocked at
four animal densities. Each pasture contains depressional wetlands characteristic of the
south Florida landscape ranging from 0.5 to 2.0 ha in size.
The climate at the site is subtropical with distinct wet and dry seasons. Average
annual rainfall is approximately 1300 mm, with 75% of the rainfall occuring during the
wet season months of May through October. Soils are dominated by Entisols, Spodosols,
and Alfisols that are poorly-drained fine sands with pH ranging from neutral to strongly
16

17
Figure 3-1. Location of Buck Island Ranch.
acidic. There are more than 600 temporary and permanent depressional wetlands
throughout the ranch, occupying approximately 6% of the ranch area and forming in
response to local variation in topography and hydrology. The wetland soils consist of
nearly level neutral, mucky fine sands with high organic content. Most are seasonal with
periods of standing water in the wet season (May-Oct.) and drying out in the dry season
(Nov.-Apr.).
Wetlands on the ranch support a diverse and productive foodweb and are a critical
resource for important wildlife species. The wetlands are characterized by a diverse array
of vegetation, vary in size and shape, hydroperiod, and still maintain similar
characteristics. Most are surrounded by a band of sedges and grasses (Juncus effuses,
Eleocharis vivapara, Panicum hemitomon, Centella asiatica, Andropogon spp.) in the
shallower regions and are dominated by emergent herbaceous macrophytes (Pontederia

18
cordata, Sagittaria lancifolia), and occasionally shrubby species (Ludwigia spp.) and
floating vegetation (Lemna spp., Salvinia minima) in the interior areas.
Stocking Rate
Pastures are stocked at four different animal densities (0, 0.46, 0.62, and 1.08
cow-calf pairs/ha). The medium stocking rate (0.62) simulates normal ranching practices
in south Florida. Each herd occupied summer pastures during May through October and
winter pastures during November through April. The study animals, 4-9 yr old Braford
cows, were randomly selected from one of the commercial herds at Buck Island Ranch.
Each animal remained with the same herd for the life of the project with replacement
animals selected from the same herd to maintain the appropriate number of cow-calf units
per hectare in the herd.
Selection of Wetland Sites
Wetlands used in this study were selected on the basis of similarities in size (0.5-
2.0 ha), vegetation and hydroperiod, within the constraints of the existing experimental
(IMP vs. SN) pastures. One to two wetlands from each of the experimental pastures were
chosen. The total number of experimental wetlands was 24; 12 summer (4 control, 3 low,
2 medium, 3 high stocking rates) and 12 winter (2 control, 4 low, 4 medium, 2 high
stocking rates). Selection of the wetlands was aided by a GIS database, which contained
the location and dimensions of the wetlands.

19
Figure 3-2. Expermental pastures at the MacArthur Agro-ecology Research Center. Polygons indicate depressional wetlands within pastures.

20
Soil Sampling
Soil samples consisted of the detrital layer plus 3 depth increments (0-15, 15-30,
and 30-45 cm) of the mineral soil. Detrital layers were sampled using a ‘pin block’
method developed for measuring soil organic horizons (Johnson et al. 1991). A 15 x 15
cm wooden template with holes in the corners was placed on the soil after removing
surface plant litter. Nails (15 cm long) were placed in the corners to stabilize the
template. The detrital layer was then cut around the edge of the block and surrounding
soil was pushed back to obtain the 15 x 15 cm layer. Bulk density was determined on the
mineral soils while soil mass was determined based on the dry weight of the detrital
sample. Mineral soil was sampled with a 10 cm diameter soil corer to the different depth
increments. Three samples each were taken from the interior and edge, then these three
samples were pooled together into a single sample for analysis. Random locations were
selected in both the edge and interior areas of each wetland in order to account for
differences within the wetlands.
Total Soil and Detrital Phosphorus Content
Total P (TP) was determined by the ignition method. One gram of dry soil was
ashed at 350oC for 3 h, 550oC for 2 h, and then digested with 6 M HCl (Anderson, 1976).
Total phosphorus in solution was determined by the Murphy-Riley method using a
Technicon TM Autoanalyzer, EPA Method 365.1 (EPA, 1993).
Soluble Reactive Phosphorus
The soluble reactive P (SRP) was determined for all samples of mineral soil and the
corresponding detrital layer using 0.01 M calcium chloride (CaCl2) as the extractant.
Approximately 2 g of dry soil was weighed out into a 50 mL centrifuge tube to which 20
mL 0.01 M CaCl2 was added to obtain a soil to CaCl2 ratio of 1:10. The samples were

21
continuously shaking on a mechanical shaker for 1 h and then vacuum filtered through a
0.45 µm filter. The SRP in solution was determined by the Murphy-Riley method using a
Technicon TM Autoanalyzer, EPA Method 365.1 (EPA, 1993).
Total Carbon-Nitrogen Content
The C and N content was determined for all samples by placing 1-2 mg of finely
ground dry soil into a tin cup. Total C and N content of the wetland soils was determined
using dry combustion-gas chromatography with a Carlo Erba NA1500 CNS Analyzer
(Milan, Italy).
Fractionation
A modified sequential fractionation scheme of Hedley et al. (1982) was adopted for
distinguishing among the various inorganic and organic P pools in the soil (Figure 3-3).
A 1:10 soil to solution ratio was used in the 0.01 M CaCl2 extraction (0.5 g soil:5 mL
CaCl2) while all other extractions were conducted using a 1:50 soil to solution ratio (0.5g
soil:25 mL 0.5 M NaHCO3, 0.1 M NaOH, and 1.0 M HCl). For each extract, samples
were shaken for 16 h, centrifuged (10,000 g for 10 min), and vacuum filtered through
0.45 µm filters. To prevent loss of soil, a needle syringe was used to remove supernatant
from centrifuge tubes. Five milliliters of the supernatant solution for 0.1 M NaOH and
0.5 M NaHCO3 samples was acidified with 5 drops of 36 M H2SO4 to precipitate organic
matter along with adjusting the pH for analysis. The samples were then centrifuged at
10,000 g for 10 min, and the extractant was placed into 20 mL scintillation vials and
stored at 4oC until analysis.
A five milliliter sample of 0.1 M NaOH and 0.5 M NaHCO3 was placed into
labeled glass digestion tubes to determine TPo. Approximately 3 g potassium persulfate

22
and 1 mL (10 drops) 5.5 M H2SO4 was placed in each sample digestion tube. The tubes
were digested on an aluminum block digester at 125oC for 2-3 h, and then the
temperature was increased to 380oC for 2-3 h. The samples were then cooled to ~100oC.
Ten milliliters of double deionized (DDI) water was added to the sample tubes, vortexed,
and placed into scintillation vials. Total P in each digested sample was determined using
the Murphy-Riley method on a Technicon autoanalyzer (EPA, 1993). Organic P (Po) of
the 0.1 M NaOH and 0.5 M NaHCO3 samples was determined by taking the difference in
TP and Pi for each sample (TP-Pi = Po).
Soil0.5 g
CaCl2-P5 mL 0.01 M CaCl2
16h shaking time
NaHCO3-P25 mL 0.5 M NaHCO3
16h shaking time
Labile P
NaOH-P25 mL 0.1 M NaOH
16h shaking time
HCl-P25 mL 1 M HCl16h shaking time
Inorg Fe/Al-P Ca/Mg-P
Residual-Pignition at 550 oC followed by acid
solubilization
Total-PKjeldahl-determined,
with Org P = Total P – Inorg P
NaOH-P25 mL 0.1 M NaOH
16h shaking time
HCl-P25 mL 1 M HCl16h shaking time
Inorg Fe/Al-P Ca/Mg-P
Residual-Pignition at 550 oC followed by acid
solubilization
Total-PKjeldahl-determined,
with Org P = Total P – Inorg P
Figure 3-3. Modified fractionation scheme adopted from Hedley et al.(1982). Total P = ∑ Pi + Po (residual P); Centrifugation (10,000 g for 10 min).
Residual P was determined using the same method as TP. Following the 1.0 M
HCl filtration, the remaining soil and solution were transferred to 50 mL beakers. The
centrifuge tubes were rinsed with small amounts of 1.0 M HCl to remove any remaining
soil particles. Samples were placed on a hot plate to evaporate 1.0 M HCl. Total P was

23
determined on soil after ashing and then digesting with 6 M HCl. All solutions were
analyzed for P using Murphy-Riley method (EPA, 1993).
Double-acid Extractable P
Double-acid extractable Ca (DACa), Mg (DAMg), Fe (DAFe), Al (DAAl), and P
(DAP) were determined on dry samples using a 1:4 soil double acid (0.0125 M H2SO4
and 0.05 M HCl) ratio for mineral soils and a 1:16 soil double acid ratio for the
corresponding detritus (Mehlich, 1953). Amount of detrital soil was decreased due to the
high water retention capacity.
Due to the common use of DAP as the soil test P in the southeastern USA
(Mehlich, 1953), values of DAFe and DAAl determined by double-acid extraction were
used to express the degree of P saturation (DPS) as the percentage of DAP to the P
sorption capacity of the soil. Degree of P saturation was used to measure P already
absorbed by the soil to its P adsorption capacity. The following method of calculation
was applied:
DPS = [DAP/(α*(DAFe + DAAl))] * 100
Phosphorus Sorption Isotherms
Phosphate sorption was measured under aerobic conditions using 2 g of dry, sieved
soil treated with 20 mL of 0.01 M KCl solution containing various levels of P (0, 0.01,
0.1, 5, 10, 25, 50, and 100 mg P L-1) in 50 mL centrifuge tubes. The tubes were place on
an end-over-end rotating shaker for a 24 h equilibration period. The soils were then
allowed to settle for 1 h. The supernatant was filtered through a 0.45 µm filter and
analyzed for soluble reactive P. All extractions and analysis were performed at room
temperature (298 + 3K).

24
Based upon the isotherm data, the maximum sorption capacity was determined
using the Langmuir equation. The linear form of the Langmuir equation is: C/S =
1/kSmax + C/Smax , where: S = the total amount of P adsorbed, mg kg-1; C = concentration
of P after 24 h equilibration, mg L-1; Smax = P sorption maximum, mg kg-1; k = constant
related to the bonding energy, L mg-1. S = So + S’, where So = P originally sorbed on the
solid phase, mg kg-1 and S’ = P sorbed by the solid phase, mg kg-1. The equilibrium P
concentration (EPC) is defined as the concentration of P where adsorption equals
desorption. The method used to obtain EPC and So is shown (Figure 3-4) using a data
point as an example of the calculations (Nair and Graetz, 1995).
Figure 3-4. Illustration of procedure used to adjust the total amount of P adsorbed by the soil, taking into consideration So, the initial P present in the soil.

25
Resin-extractable P
An anion exchange membrane sheet (AEM) (type 204-U-435, Ionics, Watertown,
MA) was cut into 1.25 cm x 5 cm strips, rinsed with DDI water, and presaturated over
night with 1 M NaCH3CO2 (sodium acetate). The strips were soaked in a sufficient
amount of solution to maintain its anion concentration at least five times greater than the
sum of an anion capacity of the strips (0.14 cmolc per strip). Membranes were stored in 1
M NaCH3CO2 in the refrigerator until needed to prevent bacterial and fungal growth.
One gram of soil was weighed out and placed in a 50 mL centrifuge tube along
with 20 mL of DDI water. One AEM strip was placed in each tube. The tubes were
shaken for 2 h on a mechanical shaker. The strips were then removed from each tube,
rinsed with DDI water, and placed into another 50 mL centrifuge tube containing 20 mL
of 1 M KCl. The tubes were then shaken for 1 h, filtered through a 0.45 µm filter, and
analyzed for labile P. The resin strips were then shaken for 2 h in a 10% bleach solution
to remove residual soil particles. Then rinsed thoroughly in DDI water and placed into
sodium acetate to recharge the anion exchange membrane.
Statistical Methods
All data were analyzed using Statistical Analysis System (SAS, 2003) V8 software.
Data was log transformed prior to statistical analysis in order to improve normality. An
analysis of variance (ANOVA) was performed on the transformed data followed by least
square means (lsmeans) procedure. Significant differences were determined at the
p<0.05 level.

CHAPTER 4 RESULTS AND DISCUSSION
Selected Soil Characteristics
The pH of all wetland soils was highly acidic with the wetlands within the SN pastures
having slightly lower pH than those within the IMP pastures (Table 4-1). Values increased
slightly (0.2 to 0.3 pH units) with soil depth. The carbon content (C) was highest in the
detrital and 0-15 cm soil layer and was generally greater in the wetlands within the SN
pasture wetlands (Table 4-1). Bulk density was not determined for the detrital layer (due to
sampling technique) however bulk density of the mineral soil layers was lowest in the top
mineral horizon and increased with depth (Table 4-1), generally reflecting the soil C content.
Table 4-1. Improved (IMP) and Semi-native (SN) pasture wetland soil characteristics by
depth. Improved Semi-native
Bulk density Bulk density
Depth (cm) pH C
(µg g-1) (g cm-3) pH C
(µg g-1) (g cm-3)
Detrital 4.56 250 N/A 4.02 220 N/A 0-15 4.43 100 0.78 3.99 150 0.59 15-30 4.60 40 1.11 4.20 50 1.08 30-45 4.67 30 1.30 4.33 20 1.30
Total P, Soluble Reactive P, and Double-acid extractable P
Total P (TP), soluble reactive P (SRP), and double-acid extractable P (DAP)
concentrations and mass were primarily affected by soil depth, sample location within the
wetlands (edge vs. interior), and pasture type (IMP vs. SN) (Table 4-2). Thus, the
presentation of the results will focus primarily on these main effects. Cattle stocking density
26

27
generally did not influence these three parameters. Possible reasons for the lack of cattle
density effects will be discussed later in this chapter.
Table 4-2. ANOVA p-values for pasture type (IMPSN), stocking density (Treatment), location, and depth effects and interactions for parameters listed determined for concentration (conc.) and soil mass (mass) content.
Source TP SRP DAP
conc. mass conc. mass conc. mass IMPSN 0.5303 0.9912 0.2726 0.7934 0.0609 0.1459
Treatment 0.8404 0.6413 0.6819 0.3416 0.8511 0.8230
Location <0.0001 0.0031 <0.0001 0.1238 0.0005 0.0196
Depth <0.0001 <0.0001 <0.0001 <0.0001 <0.0001 <0.0001
IMPSN*Treatment 0.4002 0.2010 0.9147 0.7499 0.6727 0.7790
IMPSN*Location 0.8597 0.5411 0.5128 0.6490 0.7842 0.9438
IMPSN*Depth 0.3705 <0.0001 <0.0001 0.0059 0.0797 0.0004
Treatment*Location 0.4961 0.2549 0.6026 0.4129 0.7042 0.7787
Treatment*Depth 0.9289 0.0044 0.6537 0.2576 0.9227 0.1832
Location*Depth 0.0309 0.0380 0.0808 0.7648 0.0562 0.0302
Total Phosphorus
Total phosphorus concentrations did not differ between pasture types but were higher
in the interior of the wetland than at the edge of the wetland and decreased with depth (Table
4-3). Location by depth interaction was significant in both pasture types (Table 4-2).
Concentrations of TP were generally 2-3 times higher in the detrital layer than in the 0-15 cm
mineral soil layer. Total P concentrations in the subsequent mineral soil layers continued to
decrease with depth. Previous research on the uplands and wetlands at Buck Island
performed by a colleague (L.K. Hill, 2002) showed that the wetlands contained higher
amounts of TP than the adjacent uplands. There was no effect on TP concentrations due to
cattle stocking density rates in the wetlands. The highest amount (mass) of TP, based on
bulk density values for the individual layers, was found in the surface mineral soil layer (0-15

28
cm) (Table 4-3). Even though the detrital layer had the highest TP concentration, the mass of
the detrital layer (based on soil dry weight and thickness) was considerably less than that of
the mineral soil layers resulting in less TP in this layer.
Table 4-3. Total P (TP) concentrations and mass for the interior (In) and edge of improved (IMP) and semi-native (SN) pasture wetlands by depth.
IMP SN In Edge In Edge Depth (cm)
mg kg-1 Detrital 577a*
a† 516aa 476a
a 417aa
0-15 242ab 171b
b 217ab 154b
b 15-30 77a
c 43bc 66a
c 40bc
30-45 48ad 39b
d 53ad 33b
d g m-2
Detrital 3.1aa 3.5a
a 4.5aa 4.4a
a 0-15 23a
b 22ab 17.3a
b 14ab
15-30 11ac 7.7b
c 9.1ac 6.8a
c 30-45 8.5a
c 8.3ac 9.5a
c 6.5bc
*Mean concentrations followed by the same letter superscript within a row for a given pasture type are not different (p<0.05). †Mean concentrations followed by the same letter subscript within a column are not different (p<0.05).
Soluble Reactive Phosphorus
Soluble Reactive P concentrations decreased with depth and were higher in the interior
of the wetlands compared to the edge of the wetlands (Table 4-4). Concentrations did not
differ between pasture types (Table 4-2). The greatest concentration of SRP resided in the
detrital layer of both the IMP and SN pasture wetlands. Beyond the detrital layer, SRP
concentrations in the 0-15 cm layers averaged 5 mg kg-1 while the bottom two mineral soil
layers contained less than 1 mg kg-1. The greatest amount of SRP, based on bulk density
values for the individual layers, was found in the 0-15 cm mineral soil layer (Table 4-4).

29
Table 4-4. Soluble Reactive P (SRP) concentrations and mass for interior (In) and edge of improved (IMP) and semi-native (SN) pasture wetlands by depth.
IMP SN In Edge In Edge Depth (cm)
mg kg-1 Detrital 60a*
a† 44aa 52a
a 40aa
0-15 5.5ab 2.9b
b 7.5ab 5.1a
b 15-30 0.2a
c 0.1bc 0.1a
c < 0.1bc
30-45 0.1ad 0.3b
d 0.1ad < 0.1b
d g m-2
Detrital 0.3aa 0.3a
a 0.5aa 0.4a
a 0-15 0.5a
b 0.4ab 0.6a
b 0.5ab
15-30 < 0.1ac < 0.1a
c < 0.1ac < .01a
c 30-45 < 0.1a
c < 0.1ac < 0.1a
c < 0.1ac
*Mean concentrations followed by the same letter superscript within a row for a given pasture type are not different (p<0.05). †Mean concentrations followed by the same letter subscript within a column are not different (p<0.05).
Double-acid Extractable Phosphorus
Double-acid extractable P concentrations, which could be used as an indicator of
potentially leachable P, were correlated (R2 = 0.94) to SRP concentrations (Figure 4-1).
Double-acid extractable P (DAP) concentrations followed the same trends as SRP
concentrations with IMP pasture wetlands having higher values than SN pasture wetlands.
The detrital layer contained the highest mean concentration of DAP (69 mg kg-1) followed by
the 0-15 cm mineral soil layer mean concentration (12 mg kg-1) (Table 4-5). Concentrations
of DAP declined significantly with depth and were greater in the interior than edge of the
wetlands (Table 4-2). Mean concentrations of DAP for the bottom two mineral soil layers
were < 2 mg kg-1 suggesting negligible retention or minimal movement of P with depth. Hill
(2002) also found the highest concentration of DAP in the surface soil layer (26 cm) and
minimal amounts (< 1 mg kg-1) residing in the remaining soil depths (26-108 cm). Depth by
location interaction was significant for DAP concentrations (Table 4-2).
30
Double-acid extractable P concentrations were generally higher than SRP
concentrations. Double-acid extractable P content based on soil mass was twice as high in
the surface mineral soil (0-15 cm) compared to the detrital layer due to the much greater
mass of the mineral soil. The DAP mass values represent a more relative and practical view
on P storage and movement in the wetlands.
y = 0.7048x - 1.2933R2 = 0.9362, n = 102
-20
0
20
40
60
80
100
120
140
0 20 40 60 80 100 120 140 160 180
DAP (mg kg-1)
SRP
(mg
kg-1
)
Figure 4-1. Relationship between soluble reactive P (SRP) and double-acid extractable P
(DAP) for wetland soils.
Stocking density effects on TP, SRP, and DAP concentrations were not evident
probably during the time frame of this study. Soluble reactive P and DAP are indicative of P
forms that may be transported with water. The surface mineral soil layer showed higher
DAP and SRP mass content than the detrital layer. Double-acid P and SRP mass content was
less than 1 g m-2 in the detrital layer, while DAP concentrations averaged 70 mg kg-1. Values
of 20 to 50 mg kg-1 for DAP in soils is generally considered to be optimum for plant growth,

31
although this may vary between soil types (Kamprath and Watson, 1980). On average, DAP
and SRP accounted for less than 9% of TP.
Table 4-5. Double-acid extractable P (DAP) concentrations for interior (In) and edge of improved (IMP) and semi-native (SN) pasture wetlands by depth.
IMP SN In Edge In Edge Depth (cm)
mg kg-1 Detrital 95a*
a† 62aa 66a
a 55aa
0-15 14ab 10a
b 12ab 10a
b 15-30 3.5a
c 2.2bc 2.0a
c 1.23ac
30-45 2.0ad 1.9b
d 1.6ad 0.6b
d g m-2
Detrital 0.5aa 0.5a
a 0.7aa 0.6a
a 0-15 1.4a
b 1.3ab 1.0a
b 1.0ab
15-30 0.5ac 0.4a
c 0.3ac 0.2a
c 30-45 0.4a
d 0.4bc 0.3a
c 0.1bd
*Mean concentrations followed by the same letter superscript within a row for a given pasture type are not different (p<0.05). †Mean concentrations followed by the same letter subscript within a column are not different (p<0.05).
Soil mass values for TP, SRP, and DAP reveal that the surface mineral soil layer,
followed by the detrital layer, contain the highest values for all three parameters. Total
phosphorus values were less than 5 g m-2 in the detrital layer. Release of this P form may be
dependent on hydrology or vegetation of the wetlands. In the lower Kissimmee River and
Taylor Creek/Nubbin Slough Watersheds of the Lake Okeechobee basin, P storage by
vegetation represents 2-4% of total P storage (Reddy et al., 1996b). Though this is a small
amount, the majority of P held by vegetation is potentially labile P.
Fractionation
Chemical fractionation procedures are used to characterize soils with respect to various
pools of inorganic and organic P. These pools can be indicative of the availability of P to the
biological system and to the fate and transport of P characteristics within the soil. The
fractionation procedure used herein, developed by Hedley et al. (1982), identifies various P

32
forms in soil, all which may vary in their availability to plants. Chemical fractionation has
also been used to evaluate the potential for P movement within a soil profile including the
interaction with overlying water. Phosphorus chemical fractionation data were most often
affected by soil depth, sampling location (interior vs. edge), and pasture type (IMP vs. SN)
(Table 4-6). Thus, the P fractionation data will be discussed primarily relative to the main
effects of pasture type (IMP vs. SN) and soil depth.
Table 4-6. ANOVA p-values for pasture type (IMPSN), stocking density (Treatment), location, and depth effects and interactions for parameters listed.
Source Labile P Fe/Al-P Ca/Mg-P
conc. mass conc. mass conc. mass IMPSN 0.0218 0.0047 0.0002 0.0051 0.0166 0.1445 Treatment 0.8353 0.8325 0.6216 0.9429 0.5144 0.5710 Location 0.0001 0.0770 0.0031 0.0012 0.0002 0.2525 Depth <0.0001 <0.0001 <0.0001 <0.0001 <0.0001 <0.0001 IMPSN*Treatment 0.9589 0.3231 0.6317 0.9937 0.4825 0.8338 IMPSN*Location 0.8089 0.8536 0.0863 0.9575 0.1328 0.2838 IMPSN*Depth 0.0361 0.0015 0.2240 0.0037 0.0004 0.6055 Treatment*Location 0.2405 0.1005 0.4085 0.5535 0.3314 0.9770 Treatment*Depth 0.4290 0.0008 0.7142 0.9512 0.7817 0.0726 Location*Depth 0.8486 0.0822 0.1914 0.5903 0.9616 0.4627
Residual P Organic P conc. mass conc. mass
IMPSN 0.0652 0.0075 0.2680 0.1384 Treatment 0.7109 0.4182 0.2658 0.2949 Location 0.0070 0.0986 0.0409 0.7056 Depth <0.0001 <0.0001 <0.0001 <0.0001 IMPSN*Treatment 0.4017 0.2123 0.2753 0.2805 IMPSN*Location 0.9118 0.6371 0.7785 0.4878 IMPSN*Depth 0.9540 <0.0001 0.0879 0.0002 Treatment*Location 0.7562 0.0581 0.6018 0.2509 Treatment*Depth 0.0817 0.0021 0.9005 0.9648 Location*Depth 0.6795 0.7899 0.1878 0.8023
The inorganic P pool (labile Pi + Fe/Al-P + Ca/Mg-P) was significantly greater in the
IMP pastures wetlands than in the SN pasture wetlands; depth was significant for all P forms.

33
The interior soil samples generally had greater concentrations (average of 23% greater) of the
various fractions than the edge samples with the greatest absolute differences being in the
detrital and 0-15 cm mineral soil layers. The P pools within each soil depth increment,
averaged over all treatments and wetland locations, were generally in the following order:
Ca/Mg-P < Fe/Al-P < Residual P < Labile Pi < Organic P (Figure 4-4). The trend was
generally the same based upon soil mass fractions, with residual P occasionally higher than
organic P. The surface mineral soil layer had the greatest amount (45%) of each P fraction
determined, based on soil mass (Figure 4-5). The 15-30 cm and 30-45 cm mineral soil layers
contained the next highest fraction (23% for both, respectively), with the detrital layer
containing the least total amount P (9%) determined by P mass fractions.
Labile Pi
Labile Pi is defined as the sum of CaCl2 and NaHCO3 extractable Pi. Improved
pastures contained higher amounts of labile Pi than the SN pastures, the interior was higher
than the edge of the wetlands, and labile Pi concentrations decreased with increasing soil
depth (Table 4-7). Improved pasture wetlands averaged 40 mg kg-1 of labile Pi compared to
33 mg kg-1 in the SN pasture wetlands. Concentrations averaged 111 mg kg-1 in the detrital
layers and in the mineral soil layers, by increasing depth for the 0-15 cm, 15-30 cm, and 30-
45 cm respectively, averaged 25, 6, and 4 mg kg-1 (Table 4-7).
Labile Pi was correlated positively with DAP (R2 = 0.95) and SRP (R2 = 0.91) (Figures
4-2, 3). Double-acid P was approximately two-thirds of labile Pi (Figure 4-2) even though
DAP uses stronger reagents than the labile Pi procedure. Similarly, SRP was approximately
one-half of the labile Pi (Figure 4-3). Since labile Pi is the sum of CaCl2 and NaHCO3, this
relationship shows that SRP is an approximate measure of the amount of P extracted by 0.01

34
M CaCl2 in the wetland soils. These relationships confirm that SRP and DAP measurements
may be used to determine labile Pi in soils.
Table 4-7. Labile Pi concentration (mg kg-1) and mass (g m-2) for improved (IMP) and semi-native (SN) pasture wetlands at different soil depths.
― ― ― ― Labile Pi ― ― ― ― IMP SN Depth (cm)
mg kg-1 Detrital 122a*
a† 100aa
0-15 27ab 23a
b 15-30 7.0a
c 4.2bc
30-45 5.6ad 3.1a
d g m-2
Detrital 0.8aa 0.9a
a 0-15 2.9a
b 2.0ab
15-30 1.2ac 0.7b
c 30-45 1.1a
d 0.6bd
*Mean concentrations followed by the same letter superscript within a row are not different (p<0.05). †Mean concentrations followed by the same letter subscript within a column are not different (p<0.05).
y = 0.6067x - 0.9273R2 = 0.9197, n = 102
0
20
40
60
80
100
120
140
160
180
0 50 100 150 200 250 300
Labile Pi (mg kg-1)
DAP
(mg
kg-1
)
Figure 4-2. Relationship between labile Pi and double-acid extractable P (DAP) for wetland
soils.

35
y = 0.4399x - 2.433R2 = 0.9102, n = 102
-20
0
20
40
60
80
100
120
0 50 100 150 200 250 300
Labile Pi (mg kg-1)
SRP
(mg
kg-1
)
Figure 4-3. Relationship between labile Pi and soluble reactive P (SRP) for wetland soils.
Fe/Al-P (NaOH extractable P)
Concentrations of Fe/Al-P were significantly greater in the IMP than SN pasture
wetlands and in the interior than the edge of the wetlands (Table 4-6, 8). The majority of the
Fe/Al fraction is composed of Al as suggested by Mehlich-1 Fe/Al contents. There was less
than 1 g m-2, on average, of Fe/Al-P in the wetland soils to a depth of 45 cm. The highest
concentration was located in the 0-15 cm mineral soil layer for both pasture types while the
detrital layer contained the least amount (< 0.5 g m-2). Soil mass values also decreased with
depth in the mineral soil layers (Table 4-8).
Ca/Mg-P (HCl extractable P)
Concentrations of Ca/Mg-P were the lowest of all P fractions determined.
Concentrations differed significantly between pasture type (IMP vs. SN) and location
(interior vs. edge) and decreased with depth (Table 4-8). The highest concentration of

36
Ca/Mg-P was in the detrital layers of the wetland soils, with the IMP pasture wetlands (12
mg kg-1) containing a higher mean concentration than the SN pasture wetlands (7 mg kg-1)
(Table 4-8). The mineral layers contained less than 3 mg kg-1 of Ca/Mg-P. Based on soil
mass, Ca/Mg-P values were less than 0.4 g m-2. The highest values were found in the surface
mineral soil layer (Table 4-8). This increase from the detrital layer to the 0-15 cm mineral
soil layer explains the increase seen in the DACa and DAMg concentrations shown later.
Table 4-8. Fe/Al-P and Ca/Mg-P concentration (mg kg-1) and mass (g m-2) for improved (IMP) and semi-native (SN) pasture wetlands at different soil depths.
― ― ― ― Fe/Al-P ― ― ― ― IMP SN Depth (cm)
mg kg-1 Detrital 41.97a*
a† 20.41ba
0-15 26.05ab 12.15b
b 15-30 7.75a
c 2.94bc
30-45 7.09ac 2.97b
c g m-2
Detrital 0.26aa 0.21a
a 0-15 2.82a
b 1.04ab
15-30 1.26ac 0.45b
c 30-45 1.40a
c 0.55ad
― ― ― ― Ca/Mg-P ― ― ― ― IMP SN Depth (cm)
mg kg-1 Detrital 12.20a*
a† 7.11ba
0-15 2.84ab 2.45a
b 15-30 1.23a
c 0.98ac
30-45 1.07ac 1.09a
c g m-2
Detrital 0.08aa 0.07a
a 0-15 0.32a
b 0.21bb
15-30 0.20ac 0.15a
c 30-45 0.21a
c 0.20ac
*Mean concentrations followed by the same letter superscript within a row are not different (p<0.05). †Mean concentrations followed by the same letter subscript within a column are not different (p<0.05).

37
Organic P
Organic P was determined by digesting a portion of the NaHCO3 and NaOH fractions
using a potassium persulfate method. Organic P was then calculated as the difference
between total P and inorganic P. Organic P made up 59% of the total P fraction in the
wetland soils, based on mass. This fraction constituted 58% of the total P based on P
concentration values. Thus, the majority of P located in the wetland soils is in the organic
form. Analysis of organic P showed depth and location to be significant (Table 4-6). The
mean concentrations of organic P were 130 and 97 mg kg-1 for IMP and SN pasture wetlands.
Detrital layers averaged 213 mg kg-1 while the 0-15 cm mineral soil layer averaged 147 mg
kg-1 (Table 4-9). Organic P concentrations for the lower two mineral soil layers averaged 45
and 49 mg kg-1, respectively. The IMP pasture wetlands contained a higher concentration of
organic P in the edge compared to the interior which was the only instance where the edge
contained a higher concentration of P form than the interior of the wetland soils. In the SN
pasture wetlands, the interior had higher mean concentrations of organic P.
When the P fractions were evaluated in relation to soil mass, organic P was again the
highest fraction with residual P following as the second highest fraction. This is due to the
amount of soil organic matter located in the wetlands. Carbon content was found to be
higher in the IMP pasture wetlands compared to the SN pasture wetlands by depth although
both wetland types overall averaged 11% carbon content. Comparing depths, the 15-30 cm
mineral soil layer of the SN pasture wetlands contained higher levels of carbon than the IMP
pasture wetlands. The interior was also higher in carbon than the edge of the wetlands. This
may be due to slower decomposition of organic matter as a result of water content and/or
higher primary productivity in the edge of the wetlands.

38
Table 4-9. Organic P concentration (mg kg-1) and mass (g m-2) for improved (IMP) and semi-native (SN) pasture wetlands at different soil depths.
― ― ― ― Organic P ― ― ― ― IMP SN Depth (cm)
mg kg-1 Detrital 237a*
a† 189aa
0-15 174ab 120a
b 15-30 41a
c 48ac
30-45 67ad 30b
d g m-2
Detrital 1.5aa 1.9b
a 0-15 21a
b 10bb
15-30 6ac 7a
c 30-45 14a
c 6ac
*Mean concentrations followed by the same letter superscript within a row are not different (p<0.05). †Mean concentrations followed by the same letter subscript within a column are not different (p<0.05). Residual P
Residual P is a measure of the recalcitrant, nonlabile P located within the wetlands.
Concentrations of residual P were higher in the IMP pasture (40 mg kg-1) than the SN pasture
wetlands (29 mg kg-1); concentrations were also higher in the interior than the edge of the
wetlands, and decreased with depth (Table 4-10). The detrital layers contained the greatest
residual P concentrations (66 mg kg-1). Residual P made up 20% of the total P fraction in the
wetland soils, based on bulk density. This fraction constituted 16% of the total P fraction
based on P concentration values.
Inorganic P can react with Fe, Al, and Ca to form phosphates and organic P can be
present in different forms which vary in resistance to degradation. The predominant forms of
P in the wetland soils were organic P (58%) and labile Pi (17%) (CaCl2 + NaHCO3 extracted
inorganic P). The amount of soil organic material within the wetlands contributes to the
great amount of organic P present. This fraction is utilized by the microbial population
although the more soluble inorganic P compounds are preferred. Organic and labile Pi
content averaged 113 mg kg-1 and 36 mg kg-1. Labile Pi is of importance because it is

39
considered the most readily available form of P based upon the fractionation scheme (Hedley
et. al., 1982).
Table 4-10. Residual P concentration (mg kg-1) and mass (g m-2) for improved (IMP) and semi-native (SN) pasture wetlands at different soil depths.
― ― ― ― Residual P ― ― ― ― IMP SN Depth (cm)
mg kg-1 Detrital 75a*
a† 58aa
0-15 51ab 38a
b 15-30 17a
c 12ac
30-45 15ad 10a
c g m-2
Detrital 0.5aa 0.6b
a 0-15 5.5a
b 3.2ab
15-30 2.8ac 1.9b
c 30-45 3.0a
d 1.9bd
*Mean concentrations followed by the same letter superscript within a row are not different (p<0.05). †Mean concentrations followed by the same letter subscript within a column are not different (p<0.05).
The inorganic P compounds in soils are those that contain Fe/Al and Ca/Mg. The
Fe/Al-bound phosphates are stable in acid soils and form insoluble precipitates and may
eventually become unavailable to plants. The Ca/Mg-bound phosphates are stable and
extremely insoluble at high pH levels. Due to the solubility of the compounds, Ca/Mg-P
availability tends to be low in highly acid soils of humid regions, where Fe and Al limit
phosphorus availability (Brady and Weil, 2000). The Fe/Al-P fraction was 7% of the total P
however it comprised 27% (15 mg kg-1) of the inorganic P pool. Ca/Mg-P fraction was 2%
of the total P and comprised 7% (4 mg kg-1) of the inorganic P pool. The high organic matter
tends to form complexes with metal cations in the wetland soils contributing to P retention.
Removal of Fe/Al oxides had a great effect in decreasing P sorption and increasing P
desorption in unmanured and manured grassland soils (McDowell and Condron, 2001).
Thus, retention of inorganic P is mainly due to the concentrations of Fe/Al in the soils.

40
Residual P15%
Ca/M g-P2%
Fe/Al-P7%
Labile P26%
Organic P50%
Labile P10%
Fe/Al-P8% Ca/M g-P
1%
Residual P19%Organic P
62%
Labile P8%
Fe/Al-P7%
Organic P62%
Residual P21%
Ca/M g-P2%
Labile P6%
Fe/Al-P7%
Ca/M g-P2%
Residual P18%
Organic P67%
Detrital soil layer 0-15 cm mineral soil layer(TP = 497 mg kg-1) (TP = 196 mg kg-1)
15-30 cm mineral soil layer 30-45 mineral soil layer(TP = 56 mg kg-1) (TP = 43 mg kg-1)
Figure 4-4. Phosphorus concentration fractions for wetland soils by depth.

41
0-1548%
Detrital17%
30-4517%
15-3018%
15-3021%
30-4524%
0-1549%
Detrital6%
15-3025%
0-1536%
30-4529%
Detrital10%
0-1545%15-30
25%
30-4521%
Detrital9%
Detrital5%
0-1546%
15-3024%
30-4525%
Fe/Al-P Labile Pi (g P/m-2/total depth)(g P/m-2/total depth)
Ca/Mg-P (g P/m-2/total depth)
Organic P Residual P (g P/m-2/total depth) (g P/m-2/total depth)
Figure 4-5. Phosphorus mass fractions for wetland soils by depth.
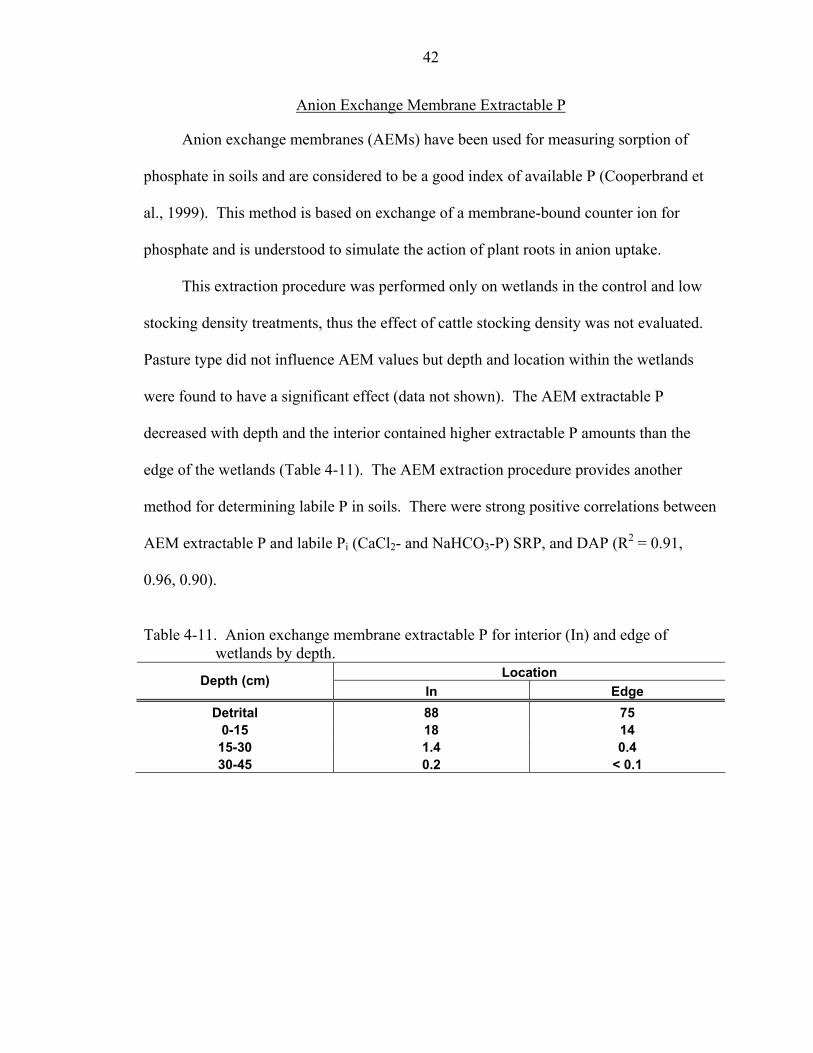
42
Anion Exchange Membrane Extractable P
Anion exchange membranes (AEMs) have been used for measuring sorption of
phosphate in soils and are considered to be a good index of available P (Cooperbrand et
al., 1999). This method is based on exchange of a membrane-bound counter ion for
phosphate and is understood to simulate the action of plant roots in anion uptake.
This extraction procedure was performed only on wetlands in the control and low
stocking density treatments, thus the effect of cattle stocking density was not evaluated.
Pasture type did not influence AEM values but depth and location within the wetlands
were found to have a significant effect (data not shown). The AEM extractable P
decreased with depth and the interior contained higher extractable P amounts than the
edge of the wetlands (Table 4-11). The AEM extraction procedure provides another
method for determining labile P in soils. There were strong positive correlations between
AEM extractable P and labile Pi (CaCl2- and NaHCO3-P) SRP, and DAP (R2 = 0.91,
0.96, 0.90).
Table 4-11. Anion exchange membrane extractable P for interior (In) and edge of
wetlands by depth. Location Depth (cm)
In Edge Detrital 88 75
0-15 18 14 15-30 1.4 0.4 30-45 0.2 < 0.1
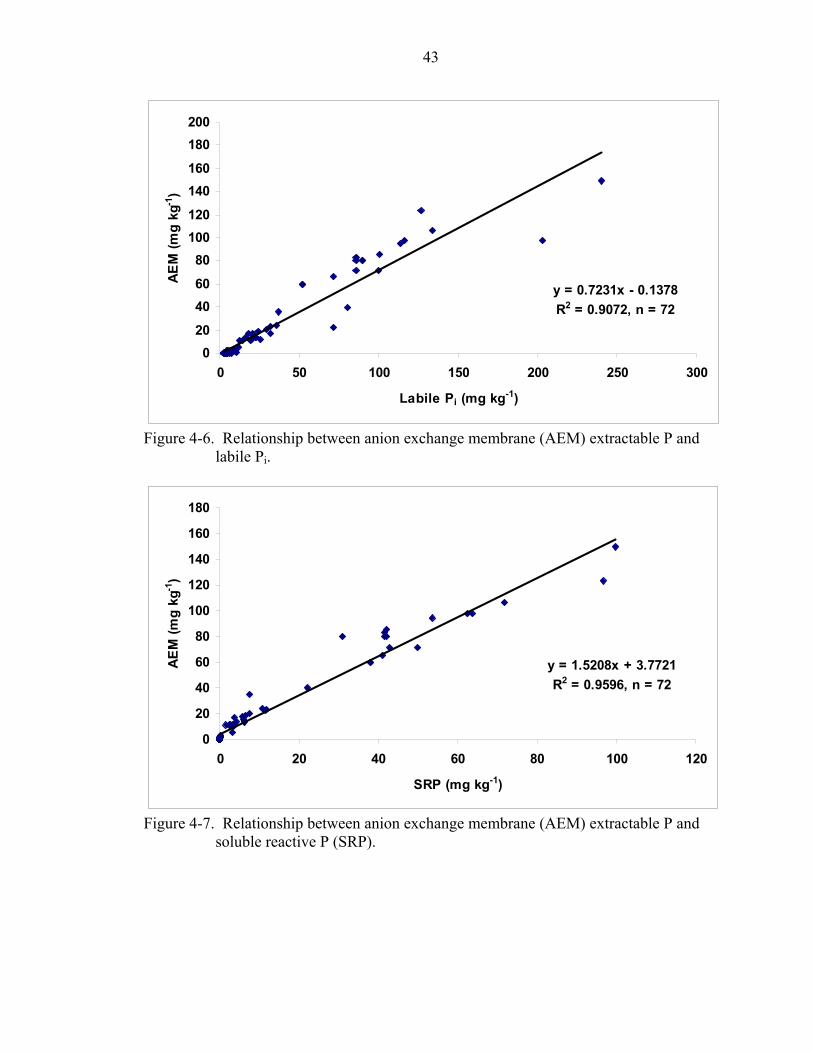
43
y = 0.7231x - 0.1378R2 = 0.9072, n = 72
020
4060
80100120
140160
180200
0 50 100 150 200 250 300
Labile Pi (mg kg-1)
AEM
(mg
kg-1
)
Figure 4-6. Relationship between anion exchange membrane (AEM) extractable P and
labile Pi.
y = 1.5208x + 3.7721R2 = 0.9596, n = 72
0
20
40
60
80
100
120
140
160
180
0 20 40 60 80 100 1
SRP (mg kg-1)
AEM
(mg
kg-1
)
20
Figure 4-7. Relationship between anion exchange membrane (AEM) extractable P and
soluble reactive P (SRP).

44
y = 1.0527x + 2.8071R2 = 0.8961, n = 72
0
2040
6080
100
120140
160180
200
0 20 40 60 80 100 120 140 160 180
DAP (mg kg-1)
AE
M (m
g kg
-1)
Figure 4-8. Relationship between anion exchange membrane (AEM) extractable P and
double acid-extractable P (DAP).
Langmuir Adsorption Isotherms
Samples were selected in the control and low treatment pastures to measure soil P
adsorption parameters. The detrital layer was not measured due to difficulties in
obtaining P sorption values due to desorption even at high levels of P addition.
Maximum P adsorption capacity (Smax) was higher in the IMP pasture wetlands than in
the SN pasture wetlands (data not shown). Phosphorus sorption capacities varied both as
a function of location within the wetland type and soil depth (Table 4-12). The Smax was
highest in the interior of the IMP pasture wetlands (particularly at 0-15 cm) whereas it
was found to be higher in the bottom mineral soil layers (15-30 cm and 30-45 cm) in the
edge of the SN pasture wetlands (Table 4-12). The time required to saturate the soils
additional P storage capacity, Smax, depends on the rate and amount of P loading into the
system.

45
Table 4-12. Comparison of Langmuir sorption parameters for soil depths. Smax = P sorption maximum, k = bonding energy, EPC = equilibrium P concentration.
Wetland Type Location Depth Smax k EPC (cm) (mg kg-1) (L mg-1) (mg L-1)
0-15 480 -0.02 0.99 15-30 477 0.26 0.02
Int
30-45 445 0.47 0.00 0-15 502 0.06 0.23 15-30 290 0.32 0.00
IMP
Edge
30-45 324 0.29 0.00 0-15 214 -0.14 -0.03 15-30 207 -0.02 0.03
Int
30-45 229 0.4 0.00 0-15 232 -0.1 1.39 15-30 245 0.22 0.01
SN
Edge
30-45 325 1.51 0.01
The bonding energy, k, calculated from the Langmuir equation increased with
depth in the IMP and SN pasture wetlands. Small k values indicate loose or poor P
bonding (Mehadi and Taylor, 1988). Due to low k values in the wetland soils, no
significant trend was determined. Determination of isotherms on fine sandy mineral soils
by He et al. (1999) revealed comparable k values and showed that P retention increased
with depth. Phosphorus retention capacity of the wetland soils suggests that the lower
depths may retain P better than the surface mineral soil layer (0-15 cm), including the
detrital layer which showed desorption at even the highest level of P added. The detrital
layers showed desorption, even at high levels of P addition. Nair et al. (1998) and Yuan
and Lucas (1982) found that the top horizon of Spodosols also showed a zero Langmuir
adsorption maximum. The high retention of P with increasing depth corresponds with the
mean Smax values, which indicates that the pasture wetlands will have a higher P retention
capacity. The difference may be due to higher observed values of Al (but not Fe)

46
concentrations in the surface mineral soil layers. Reddy et al. (1998) similarly found low
k values and greater Smax values in surface horizons as well as values decreasing with
depth in wetland soils.
The equilibrium P concentration (EPC) is the concentration of P in solution where
adsorption equals desorption. The EPC values showed decreasing concentrations with
depth. Low EPC values suggest a decreased tendency of the soils to release P. These
results concur with those of Graetz and Nair (1995) that the EPC values of beef pastures
showed decreasing concentrations with depth. Wetland soils located in the Lake
Okeechobee watershed also showed low EPC values, suggesting strong binding capacity
(Reddy et. al. 1996b). Soils having a high EPC may tend to act as sources of P at low
solution P concentrations. Some of the 0-15 cm mineral soils showed changes in slope of
the sorption isotherms when graphed (Figure 4-9). This suggests that P precipitation
began to dominate the process as concentrations increased beyond that of adsorption.
Phosphorus sorption values measured at the single-point sorption isotherm (1000
mg P kg-1) added to solution were strongly correlated to the Smax values (Figure 4-10).
There was a good relationship between the two estimates of sorption capacity (R2 = 0.86).
Similar results were found by Harris et al. (1996) and Nair et al. (1998). Zhou and Li
(2001) also found a strong association between the Langmuir P maximum sorption values
(Smax) and the single-point isotherms from wetlands from the southern Everglades. This
suggests that the addition of 1000 mg P kg-1 is sufficient to saturate all sorption sites
present in the soil.
The single-point isotherm method appears to characterize P sorption capacities of
wetland soils (Reddy et. al. 1998). Using the single-point sorption isotherm provides a

47
simple measurement for determining the P release potential from soils and it is easier to
determine than a Langmuir fit to a complete isotherm. The high level of P addition is
assumed to provide an adequate amount of P to saturate all sorption sites.
-100
0
100
200
300
400
500
0 10 20 30 40 50
P concentration after 24 h (µg mL-1)
P so
rbed
by
solid
pha
se (m
g kg
-1)
60
Experimental Data P precipitation Langmuir
Figure 4-9. Langmuir P sorption isotherms and P precipitation of a random 0-15 cm
mineral soil layer sample.
y = 0.8324x + 11.565R2 = 0.8607, n = 53
0
200
400
600
800
1000
0 100 200 300 400 500 600 700 800 900
P sorbed at 1000 mg P kg-1 added
Lang
mui
r Sm
ax, m
g P
kg-1
Experimental Data Experimental Data 1:1 relationship
Figure 4-10. Relationship between Langmuir Smax and the single point isotherm (1000
mg P kg-1) value.

48
Double-acid Extractable Al, Fe, Ca, and Mg
Double acid extracts were analyzed for Al, Fe, Ca, and Mg to provide additional
information regarding the wetland soil P retention characteristics. Concentrations and
mass of double-acid Al, Fe, Ca, and Mg elements were affected by pasture type (IMP vs.
SN), soil depth, and sampling location (interior vs. edge) within the wetlands (Table 4-
13). Consequently, results discussed will focus on these effects and their interactions (if
applicable).
Table 4-13. ANOVA p-values for wetland type (IMPSN), stocking density (Treatment), location, and depth effects and interactions for parameters listed.
Source DAAL DAFe conc. mass conc. mass
IMPSN 0.0654 0.0047 0.0024 0.0394 Treatment 0.9033 0.8325 0.9957 0.8660 Location 0.2372 0.0770 0.1925 0.0139 Depth <0.0001 <0.0001 <0.0001 <0.0001 IMPSN*Treatment 0.4620 0.3231 0.3613 0.6155 IMPSN*Location 0.5262 0.8536 0.1703 0.1668 IMPSN*Depth 0.0168 0.0015 <0.0001 <0.0001 Treatment*Location 0.3570 0.1005 0.8647 0.7403 Treatment*Depth 0.4610 0.0008 0.0006 0.0005 Location*Depth 0.0118 0.0822 0.0077 0.0675
DACa DAMg conc. mass conc. mass
IMPSN <0.0001 <0.0001 <0.0001 <0.0001 Treatment 0.1622 0.0646 0.1685 0.0335 Location 0.0001 0.1541 0.0019 0.1775 Depth <0.0001 <0.0001 <0.0001 <0.0001 IMPSN*Treatment 0.9019 0.9662 0.6554 0.8740 IMPSN*Location 0.7370 0.6685 0.9998 0.5547 IMPSN*Depth <0.0001 <0.0001 <0.0001 <0.0001 Treatment*Location 0.1819 0.0782 0.6556 0.4964 Treatment*Depth 0.5872 0.1377 0.0940 0.0194 Location*Depth 0.8785 0.9224 0.5833 0.8848
49
Double-acid Aluminum (DAAl) and Double-acid Iron (DAFe)
The main effect on DAAl was depth. Two main effect interactions, wetland type
by depth and location by depth, also were found to be significant (Table 4-13). The SN
pasture wetlands for both interior and edge had higher mean concentrations than the IMP
pasture wetlands (Table 4-14). Concentrations also increased with depth, up to 30 cm, in
both pasture types. Mass values increased with depth, where the bottom mineral soil
layers had approximately 20 times more DAAl than the detrital layers.
The main effect on DAFe was also depth. Concentrations of DAFe averaged 75
mg kg-1 in the detrital layer and 17.5 mg kg-1 in the mineral soil layers. Overall, the IMP
pasture wetlands contained approximately 2-4 times greater mass of DAFe than the SN
pasture wetlands. The IMP pasture wetlands contained 10-20 times the amount of DAFe
in the bottom mineral soil layers compared to the detrital layers, while the SN pasture
wetlands had 5 times the amount of DAFe in the bottom mineral soil layers compared to
the detrital layers. The difference in concentration and mass values of DAFe are due to
the decrease in organic material and increase in clay particle/metal component with
depth. Complexation of Fe in the detrital layer may explain the high concentrations
determined compared to the mineral soil layers (Table 4-14).
Double-acid Calcium (DACa) and Double-acid Magnesium (DAMg)
Wetland type, depth, and location were found to be highly significant (Table 4-15)
for DACa concentrations. Wetland type by depth interaction was highly significant also
and showed an increase in the 0-15 cm mineral soil layer followed by a decrease in the
remaining two mineral soil layers. The IMP pasture wetlands, at all depths, had higher
mean concentrations than the SN pasture wetlands. Concentration and mass amounts
were highest in the surface mineral soil layer for DACa.

50
Table 4-14. Mean double-acid Al (DAAl) and double-acid Fe (DAFe) concentrations (mg kg-1) and mass (g m-2) at a given depth for improved (IMP) and semi-native (SN) pastures at the interior (In) and edge of the wetlands.
― ― ― ― DAAl ― ― ― ― IMP SN
In Edge In Edge Depth (cm)
mg kg-1 Detrital 252a*
a† 238aa 250a
a 247aa
0-15 284aa 332a
b 355ab 398a
b 15-30 388a
b 300ab 426a
b 381ab
30-45 291ac 211b
c 369ab 303a
c g m-2
Detrital 1aa 2a
a 3aa 3a
a 0-15 29a
b 42bb 30a
b 39ab
15-30 56ac 54a
b 61ac 66a
c 30-45 49a
c 44ab 67a
c 60bc
― ― ― ― DAFe ― ― ― ― IMP SN
In Edge In Edge Depth (cm)
mg kg-1 Detrital 62a*
a† 95ba 72a
a 71aa
0-15 14ab 22b
b 13ab 15a
b 15-30 22a
c 23ab 17a
b 15ab
30-45 33ad 30a
c 19ab 17a
b g m-2
Detrital 0.33aa 0.68b
a 0.70aa 0.79a
a 0-15 1.63a
b 2.93bb 1.14a
b 1.50ab
15-30 3.38ac 4.16a
c 2.44ac 2.57a
c 30-45 6.08a
d 6.40ad 3.39a
c 3.46ac
*Mean concentrations followed by the same letter superscript within a row for a given pasture type are not different (p<0.05). †Mean concentrations followed by the same letter subscript within a column are not different (p<0.05).
As with DACa, DAMg was significantly affected by wetland type, depth, and
location along with wetland type by depth interaction (Table 4-13). However, unlike
DACa where the 0-15 cm mineral soil layer contained the highest concentration, the
detrital soil layer contained the highest DAMg concentration (Table 4-15). The IMP

51
pasture wetlands had higher concentrations of DAMg compared to the SN pasture
wetlands. Mass values of DAMg were 2-3 times greater in the IMP pasture compared to
the SN pasture wetlands. Higher values for DACa and DAMg in the IMP pasture
wetlands likely reflect long-term lime application to the IMP pastures.
Table 4-15. Mean double-acid calcium (DACa) and double-acid magnesium (DAMg) concentrations (mg kg-1) and mass (g m-2) at a given depth for improved (IMP) and semi-native (SN) pastures at the interior (In) and edge of the wetlands.
― ― ― ― DACa ― ― ― ― IMP SN
In Edge In Edge Depth (cm) mg kg-1
Detrital 378a*a† 248b
a 263aa 221a
a 0-15 1930a
b 1632bb 1385a
b 1049ab
15-30 903ac 659a
c 360ac 250b
c 30-45 775a
c 623ac 231a
d 184ad
g m-2 Detrital 2a
a 2aa 3a
a 2aa
0-15 195ab 207a
b 113ab 95a
b 15-30 136a
c 119ac 51a
c 43ac
30-45 137ac 131a
c 41ac 36b
c ― ― ― ― DAMg ― ― ― ―
IMP SN In Edge In Edge Depth (cm)
mg kg-1 Detrital 1068a*
a† 789aa 475a
a 305ba
0-15 269ab 189 b 148a
b 110ab
15-30 148ac 98b
c 40ac 26b
c 30-45 126a
c 103ac 28a
d 25ac
g m-2 Detrital 6a
a 5aa 4a
a 3aa
0-15 26ab 24a
b 11ab 10a
b 15-30 22a
b 18ac 5a
c 4ac
30-45 22ab 22b
c 5ac 5b
c
b
*Mean concentrations followed by the same letter superscript within a row for a given pasture type are not different (p<0.05). †Mean concentrations followed by the same letter subscript within a column are not different (p<0.05).

52
Degree of P Saturation (DPS)
Degree of P saturation (DPS) values was higher in the IMP pasture wetlands than
in the SN pasture wetlands (Table 4-16). This was most evident in the detrital layer of
the interior where the DPS values were 62% and 44% for the IMP and SN pasture
wetlands, respectively (Figure 4-10). There was no difference between the two pastures
types at the edge of the wetlands, suggesting that more P coming into the wetlands is
concentrated in the interior.
Table 4-16. Degree of P Saturation (DPS) values at a given depth within the interior and edge of the improved (IMP) and semi-native (SN) pasture wetlands.
IMP SN Interior Edge Interior Edge Depth (cm)
% Detrital 62a*
a† 39ba 44a
a 36aa
0-15 9ab 5b
b 6ab 5a
b 15-30 2a
c 1ac 1a
c 1ac
30-45 2ac 1a
c 1ac <0.3b
d *Mean concentrations followed by the same letter superscript within a row for a given pasture type are not different (p<0.10). †Mean concentrations followed by the same letter subscript within a column are not different (p<0.10).
Simple regression equations indicate a strong relationship between DPS and SRP
(R2 = 0.91) (Figure 4-11). In order to quantify the eutrophication risk of agricultural
land, DPS has been introduced as a simple index (Breeuwsma and Silva, 1992). The
potential concern for environmental impact from the wetland soils would lie in the
detrital layers, which were above the recommended 30% DPS threshold value. Soils
containing greater than 30% for DPS values have been shown to contribute to water
quality decline (Nair and Graetz, 2002). Based on non-calcareous sandy soils, Van der
Zee et al. has shown that a DPS > 25% contributed to orthophosphate levels becoming
greater than 0.1 mg P L-1 in the soil solution. Nair and Graetz (2002) also found highly

53
significant correlation between DPS and SRP concentrations, suggesting that DPS may
be used as an indicator of soluble P in surficial soils along with soils at any depth.
0
10
20
30
40
50
60
Detrital 0-15 15-30 30-45
Depth (cm)
DPS
(%)
IMPSN
Figure 4-11. Mean degree of P saturation (DPS) percentages at a given depth for
improved (IMP) and semi-native (SN) pasture wetlands.
y = 1.0322x - 0.1641R2 = 0.9062, n = 102
-20
0
20
40
60
80
100
120
0 20 40 60 80 100 120
DPS (%)
SRP
(mg
kg-1
)
Figure 4-12. Relationship between soluble reactive P (SRP) and degree of P saturation
(DPS) for wetland soils.

CHAPTER 5 CONCLUSIONS
Cattle stocking density, up to 1.08 cow-calf pairs/ha, had no effect on soil P
concentrations in embedded wetlands after two years of implementation. Because the
input/output values for P on beef cattle pastures are nearly equal, cattle stocking density,
within normal ranges, may not influence soil P concentrations. Cattle stocking density
may influence soil P concentrations primarily in areas where cattle tend to congregate
(watering and cooling (shade or wetlands) areas). Wetlands provide a natural relief to hot
temperatures for cattle while accruing P through manure deposition. Mathews et al.
(1994) stated that location of shade and water areas may contribute more to P distribution
than stocking densities.
Wetlands in IMP pastures had higher concentrations of most soil P parameters
compared to the SN pastures. The IMP pastures at Buck Island Ranch were fertilized
with P up until 1987. This fertilization likely influenced the amount of P lost in runoff
between the two pasture types. The IMP pastures released 5 to 7 times more TP in
surface water runoff than the SN pastures, averaging 1.19 and 0.18 lb acre-1, respectively
(Arthington et al., 2003).
Phosphorus concentrations were greater in the interior of the wetlands than at the
edges. Cattle movement patterns, with relation to heat regulation, are a possible cause for
the difference seen by location (interior vs. edge). During the summer, cattle tend to
gather in deeper water (wetland interior) and thus manure deposits accumulate in these
54

55
areas more than on the edge of the wetland. Also, the interior of the wetlands remain
saturated for a longer period of time than the edge.
The majority of P in the wetlands was present as organic P. Vegetation within the
wetlands may provide a mechanism for P retention however this storage is not permanent
due to die-back of the biomass resulting in the release of stored P into the water column.
Reddy et al. (1996) found annual net P storage in the aboveground biomass of emergent
macrophytes in the range 0.3 to 4.3 g m-2. For the IMP pasture and SN pasture wetlands,
approximately 0.76 and 0.99 g P m-2 would be available for transport via surface flow.
These values are based on average labile Pi which represents the most readily available
and potentially mobile P (via leaching or runoff) in the wetland soils.
Maximum P adsorption capacity was higher in the IMP than the SN pasture
wetlands. Phosphorus retention capacity of the wetland soils suggest that the mineral soil
layers will retain P better than the detrital layer due to desorption of P from the detrital
layers at the highest level of P addition. Degree of P saturation values in the detrital
layers were above the commonly used threshold value of 30%, suggesting that these
layers may contribute to water quality decline, while the mineral soil layers were below
this threshold.
Additional parameters were used to determine available P amounts in the wetlands.
Double acid-extractable P, labile Pi, resin P, and soluble reactive P all compared well
with one another and all are potentially useful indices for determining P availability in the
wetland soils. Values of these parameters were higher in the detrital and surface mineral
soil layer than in the two lower depths of the mineral soil (15-30 and 30-45 cm layers).

56
The wetlands contained higher P amounts compared to adjacent uplands (Hill,
2002), thus, the wetlands appear to be accumulating P from adjacent uplands and acting
as sinks for P. Regardless, the wetlands seem to be acting as sinks, aiding in the
containment of P from the agricultural landscape, minimizing water quality decline of
surface and/or groundwater.

LIST OF REFERENCES
Adamus, P. and L. Stockwell. 1983. A method for wetland functional assessment, Vol. 1 & 2, U.S. Dept. of Transportation, Federal Highway Administration, Office of Research, Environ. Div., Washington, D.C.
Anderson, J.M. 1976. An ignition method for determination of total phosphorus in lake
sediments. Wat. Res. 10:329-331. Arthington, J.P., P. Bohlen, and F. Roka. 2003. Effect of stocking rate on measures of
cow-calf productivity and nutrient loads in surface water runoff. Doc. # AN141, Animal Science Dept., Florida Cooperative Extension Service, IFAS, University of Florida, Gainesville, FL.
Atalay, A. 2001. Variation in phosphorus sorption with soil particle size. Soil and Sed.
Contam. 10(3):317-335. Baker, L.A. 1992. Introduction to nonpoint source pollution in the U.S. and prospects
for wetland use. Ecol. Eng. 1:1-26. Borggaard, O.K., S.S. Jorgensen, J.P. Moberg, and B. Raben-Lange. 1990. Influence of
organic matter on phosphate adsorption by aluminum and iron oxides in sandy soils. J. Soil Sci. 41:443-449.
Botkin, M.J.M. and L.S.Y. Wu. 1981. How ecosystem processes are linked to large
mammal population dynamics. In: C.W. Fowler and T.D. Smith (eds.), Dynamics of Large Mammal Populations. John Wiley & Sons, New York. 373-387.
Brady, N.C. and R.R. Weil. 2000. Elements of the nature and properties of soils.
Charles E. Stewart, Jr., pub. Prentice-Hall, Inc., Upper Saddle River, NJ. Breeuwsma, A., and S. Silva. 1992. Phosphorus fertilization and environmental effects
in the Netherlands and the Po regions (Italy). Rep. 57. Agric. Res. Dep., The Winand Staring Centre for Integrated Land, Soil, and Water Res., Wageningen, the Netherlands.
Cooperbrand, L.R., P.M. Gale, and N.B. Comerford. 1999. Refinement of the anion
exchange method for soluble phosphorus measurement. Soil Sci. Soc. Am. J. 63:58-64.
57

58
Daniel, T.C., A.N. Sharpley, and J.L. Lemunyon. 1998. Agricultural phosphorus and eutrophication: A symposium overview. J. Environ. Qual. 27:251-257.
Eghball, B., G.D. Binford, and D.D. Baltensperger. 1996. Phosphorus movement and
adsorption in a soil receiving long-term manure and fertilizer application. J. Environ. Qual. 25:1339-1343.
Eghball, B., D.H. Sander, and J. Skopp. 1990. Diffusion, adsorption, and predicted
longevity of banded phosphorus fertilizer in three soils. Soil Sci. Soc. Am. J. 54:1161-1165.
Environmental Protection Agency. 1993. Methods for the determination of inorganic
substances in environmental samples. 365.1. Faulkner, S.P. and C.J. Richardson. 1989. Physical and chemical characteristics of
freshwater wetland soils. In: D.A. Hammer (ed.), Constructed Wetlands for Wastewater Treatment. Lewis Publishers, Chelsea, MI. pp 41-72.
Flaig, E.G. and K.R. Reddy. 1995. Fate of phosphorus in the Lake Okeechobee
watershed, Florida, USA: overview and recommendations. Ecol. Eng. 5:127-142. Froelich, P.N. 1988. Kinetic control of dissolved phosphate in natural rivers and
estuaries: A primer on the phosphate buffer mechanism. Limnol. Oceanogr. 33:649-668.
Frossard, E., M. Brossard, M.J. Hedley, and Metherell. 1995. Reactions controlling the
cycling of P in soils. In: H. Tiessen (ed.) Phosphorus in the Global Environment: Transfers, Cycles, and Management. John Wiley & Sons, New York.
Gale, P.M., K.R. Reddy, and D.A. Graetz. 1994. Phosphorus retention by wetland soils
used for treated wastewater disposal. J. Environ. Qual. 23:370-377. Gardner, L.R. 1990. The role of rock weathering in the phosphorus budget of terrestrial
watersheds. Biogeochemistry. 11:97-110. Gilliam, J.W., J.L. Baker, and K.R. Reddy. 1994. Water quality effects of drainage in
humid regions. In R.W. Skaggs (ed.) Drainage. Agron. Monogr. Madison, WI. Gotoh, S. and W.H. Patrick, Jr. 1974. Transformation of iron in a waterlogged soil as
influenced by redox potential and pH. Soil Sci. Soc. Am. Proc. 38:66-71. Graetz, D.A. and V.D. Nair. 1995. Fate of phosphorus in Florida Spodosols
contaminated with cattle manure. Ecol. Eng. 5:163-182.

59
Guertal, E.A., D.J. Eckert, S.J. Traina, and T.J. Logan. 1991. Differential phosphorus retention in soil profiles under no-till crop production. Soil Sci. Soc. Am. J. 55:410-413.
Harris, W.G., R.D. Rhue, G. Kidder, R.B. Brown, and R. Littell. 1996. Phosphorus
retention as related to morphology of sandy coastal plain soil materials. Soil Sci. Soc. Am. J. 60:1513-1521.
He, Z.L., A.K. Alva, Y.C. Li, D.V. Calvert, and D.J. Banks. 1999. Sorption-Desorption
and solution concentration of phosphorus in a fertilized sandy soil. J. Environ. Qual. 28:1804-1810.
He, Z.L., Z.X. Zhu, K.N. Yuan, and C.Y. Huang. 1988. Potential phosphate sorptivity
value for Langmuir equation and its application for phosphate fertilizer recommendation. Acta Pedologica Sinica. 25:397-403.
Heckrath, G., P.C. Brookes, P.R. Poulton, and K.W.T. Goulding. 1995. Phosphorus
leaching from soils containing different phosphorus concentrations in the Broadbalk experiment. J. Environ. Qual. 24:904-910.
Hedley, M.J., J.W.B. Stewart, and B.S. Chauhan. 1982. Changes in inorganic and
organic soil phosphorus fractions by cultivation practices and by laboratory incubations. Soil Sci. Soc. Am. J. 46:970-976.
Hill, A.R. 1982. Phosphorus and major cation mass balances for two rivers during low
summer flows. Freshwater Biol. 12:293-304. Hill, L.R. 2002. Phosphorus in soil profiles of a subtropical rangeland and associated
wetlands. Masters Thesis. Holford, I.C.R., C. Hird, and R. Lawrie. 1997. Effects of animal effluents on the
phosphorus sorption characteristics of soils. Aust. J. Soil Res. 35:365-373. Holford, I.C.R. and W.H. Patrick, Jr. 1979. Effects of reduction and pH changes on
phosphate sorption and mobility in an acid soil. Soil Sci. Soc. Am. Proc. 43(2):292-297.
Howard-Williams, C. 1985. Cycling and retention of nitrogen and phosphorus in
wetlands: a theoretical and applied perspective. Freshwater Biol. 15:391-431. Indiati, R. 2000. Addition of phosphorus to soils with low to medium phosphorus
retention capacities. Effect on soil phosphorus sorption properties. Commun. Soil Sci. Plant Anal. 31(9&10):1179-1194.

60
Johnson, C.E., A.H. Johnson, T.B. Hutchinson and T.B. Siccama. 1991. Whole-tree-clear-cutting effects on soil horizons and organic-matter pools. Soil Sci. Soc. Am. J. 55:497-502.
Johnston, C.A. 1993. Material fluxes across wetland ecotones in northern landscapes.
Ecological Applications. 3:424-440. Kadlec, R.H. 1993. Natural wetland treatment at Houghton Lake, Michigan: The first
fifteen years. Presented at 66th Annual Conf. and Exposition, 3-7 Oct. 1993, Anaheim, CA, Water Environ. Foundation, Alexandria, VA.
Kadlec, R.H. 1987. The use of peatlands for wastewater treatment. Symposium 1987.
Proc. of wetland conference. Edmonton, Alberta. August. Kamprath, E.J. and M.E. Watson. 1980. Conventional soil and tissue tests for assessing
the phosphorus status of soils. In F.E. Khasawneh et al. (ed.) The Role of Phosphorus in Agriculture. ASA, CSSA, and SSSA, Madison, WI.
Kleinman, P.J.A., A.N. Sharpley, K. Gartley, W.M. Jarrell, S. Kuo, R.G. Menon,
R.Myers, K.R. Reddy, and E.O. Skogley. 2001. Interlaboratory comparison of soil phosphorus extracted by various soil test methods. Commun. Soil Sci. Plant Anal. 32(15&16):2325-2345.
Knisel, W.G., Jr., P. Yates, J.M. Sheridan, T.K. Woody, III, L.H. Allen, Jr., and L.E.
Asmussen. 1985. Hydrology and hydrogeology of upper Taylor Creek watershed, Okeechobee County, Florida: Data and analysis. USDA-ARS-25.
Langmuir, I. 1918. The adsorption of gases on plane surfaces of glass, mica, and
platinum. J. Amer. Chem. Soc. 40:1361-1403. Lowe, E.F., L.E. Battoe, D.L. Stites, and M.F. Coveney. 1992. Particulate phosphorus
removal via wetland filtration: an examination of the potential for hypereutrophic lake restoration. Environ. Manag. 16:67-74.
Lowrance, R.R., R.G. Vellidis, and K.R. Hubbard. 1995. Wetlands and aquatic
processes. J. Environ. Qual. 24:808-815. Mathews, B.W., L.E. Sollenberger, V.D. Nair, and C.R. Staples. 1994. Impact of
grazing management on soil Nitrogen, Phosphorus, Potassium, and Sulfur distribution. J. Environ. Qual. 23:1006-1013.
McCallister, D.L. and T.J. Logan. 1978. Phosphate adsorption-desorption characteristics
of soils and bottom sediments in the Maumee River basin of Ohio. J. Environ. Qual. 7:87-92.

61
McDowell, R.W. and L. Condron. 2001. Influence of soil constituents on soil phosphorus sorption and desorption. Commun. Soil Sci. Plant Anal. 32(15&16):2531-2547.
McDowell, R.W. and A.N. Sharpley. 2001. Approximating phosphorus release from
soils to surface runoff and subsurface drainage. J. Environ. Qual. 30:508-520. McKeague, J.A. and J.H. Day. 1966. Dithionite and oxalate extractable Fe and Al as
aids in differentiating various classes of soils. Can. J. Soil Sci. 46:13-22. Mehadi, A.A., and R.W. Taylor. 1988. Phosphate adsorption by two highly-weathered
soils. Soil Sci. Soc. Am. J. 52:627-632. Mehlich, A. 1953. Determination of P, Ca, Mg, K, Na, and NH4. Soil Testing Div. Pub.
1-53, North Carolina Dept. Agric., Raleigh, NC. Menon, R.G., L.L. Hammond, and H.A. Sissingh. 1989. Determination of plant-
available phosphorus by the iron hydroxide-impregnated filter paper (Pi) soil test. Soil Sci. Soc. Am. J. 52:110-115.
Mitsch, W.J. 1994. The nonpoint source pollution control function of natural and
constructed riparian wetlands. In: W.J. Mitsch (ed.), Global Wetlands: Old World and New. New York, Elsevier Science B.V. pp 351-361.
Mitsch, W.J. 1992. Landscape design and the role of created, restored, and natural
riparian wetlands in controlling nonpoint source pollution. Ecol. Eng. 1:27-47. Mitsch, W.J. and J.G. Gosselink. 1993. Wetlands, 2nd edition. Van Nostrand Reinhold
Company, NY. Nair, V.D. and D.A. Graetz. 2002. Phosphorus saturation in Spodosols impacted by
manure. J. Environ. Qual. 31(4):1279-1285. Nair, V.D., R.R. Villapando, and D.A. Graetz. 1999. Phosphorus retention capacity of
the Spodic horizon under varying environmental conditions. J. Environ. Qual. 28 :1308-1313.
Nair, V.D., D.A. Graetz, and K.R. Reddy. 1998. Dairy manure influences on phosphorus
retention capacity of Spodosols. J. Environ. Qual. 27:522-527. Nair, V.D., D.A. Graetz, and K.M. Portier. 1995. Forms of phosphorus in soil profiles
from dairies of south Florida. Soil Sci. Am. J. 59:1244-1249. Nairn, R.W. and W.J. Mitsch. 2000. Phosphorus removal in created wetland ponds
receiving river overflow. Ecol. Eng. 14:107-126.

62
Olsen, R.K. and K. Marshall. 1992. The role of created and natural wetlands in controlling nonpoint source pollution. Ecol. Eng. 1:1-170.
Pavelis, G.A. 1987. Economic survey of farm drainage. In: G.A. Pavelis (ed.), Farm
Drainage in the U.S.: History, Status, and Prospects. Washington, D.C., U.S. Gov. Printing Office, U.S. Dept. of Ag. Misc. 110-136.
Parfitt, R.L. 1989. Phosphate reactions with natural allophane, ferrihydrite, and goethite.
J. Soil Sci. 40:359-369. Parfitt, R.L. 1978. Anion adsorption by soils and soil materials. Adv. Agron. 30:1-50. Patrick, Jr., W.H. and R.A. Khalid. 1974. Phosphate release and sorption by soils and
sediments: effect of aerobic and anaerobic conditions. Science. 186(4158):53-55. Pierzynski, G.M., J.T. Sims, and G.F. Vance. 1994. Soils Environ. Qual. Boca Raton,
FL. pp 313. Lewis Pub. Pote, D.H., T.C. Daniel, A.N. Sharpley, P.A. Moore, Jr., D.R. Edwards, and D.J. Nichols.
1996. Relating extractable soil phosphorus to phosphorus losses in runoff. Soil Sci. Soc. Am. J. 60:855-859.
Rechicigl, J.E. and A.B. Bottcher. 1995. Fate of phosphorus on bahiagrass pastures.
Ecol. Eng. 5:247-260. Reddy, K.R., G.A. O’Connor, and P.M. Gale. 1998. Phosphorus sorption capacities of
wetland soils and stream sediments impacted by dairy effluent. J. Environ. Qual. 27:438-447.
Reddy, K.R., E. Flaig, L.J. Scinto, O.A. Diaz, and T.A. DeBusk. 1996a. Phosphorus
assimilation in stream systems of the Lake Okeechobee watershed. Water Resour. Bull. 32(5):901-915.
Reddy, K.R., E.G. Flaig, and D.A. Graetz. 1996b. Phosphorus storage capacity of
uplands, wetlands, and streams of the Lake Okeechobee watershed, Florida. Agr. Ecosystems & Env. 59:203-216.
Reddy, K.R., O.A. Diaz, L.J. Scinto, and M. Agami. 1995. Phosphorus dynamics in
selected wetlands and streams of the Lake Okeechobee watershed. Ecol. Eng. 5:183-208.
Reynolds, C.S. 1978. Phosphorus and the eutrophication of lakes: a personal view. Ciba Foundation Symposium. 57:201-228. Richardson, C.J. 1985. Mechanisms controlling phosphorus retention capacity of
freshwater wetlands. Science. 228:1424-1427.

63
Sanyal, S.K. and S.K. DeDatta. 1991. Chemistry of phosphorus transformations in soil.
Adv. Soil Sci. 16:1-120. Saunders, W.M.H. 1964. Extraction of soil phosphate by anion exchange membrane.
NZ J. Agric. Res. 7:427-431. South Florida Water Management District (SFWMD). 1997. Surface Water
Improvement and Management Plan – Update for Lake Okeechobee. Vol. 1: Planning document. West Palm Beach, Florida.
Sharpley, A.N. 1991. Soil phosphorus extracted by iron-aluminum-oxide-impregnated
filter paper. Soil Sci. Soc. Am. J. 55:1038-1041. Sharpley, A.N., B. Foy, and P. Withers. 2001. Practical and innovative measures for the
control of agricultural phosphorus losses to water: An overview. J. Environ. Qual. 29:1-10.
Sharpley, A.N., T.C. Daniel, J.T. Sims, and D.H. Pote. 1996. Determining
environmentally sound soil phosphorus levels. J. Soil Water Conserv. 51:160-169. Sharpley, A.N., J.T. Sims, G.M. Pierzynski. 1994a. Innovative soil phosphorus indices:
Assessing inorganic phosphorus. In New Directions in Soil Testing for nitrogen, phosphorus, and potassium; J. Havelin, J. Jacobsen, P. Fixen, G. Hergert Eds.; American Society of Agronomy: Madison, WI, 1994, 115-142.
Sharpley, A.N., S.C. Chapra, R. Wedepohl, J.T. Sims, T.C. Daniel, and K.R. Reddy.
1994b. Managing agricultural phosphorus for protection of surface waters: Issues and options. J. Environ. Qual. 23:437-451.
Sharpley, A.N., S.J. Smith, O.R. Jones, W.A. Berg, and G.A. Coleman. 1992. The
transport of bioavailable phosphorus in agricultural runoff. J. Environ. Qual. 21:30-35.
Sharpley, A.N. and R.G. Menzel. 1987. The impact of soil and fertilizer phosphorus on
the environment. Adv. Agron. 41:297-324. Stewart, J.W.B. and H. Tiessen. 1987. Dynamics of soil organic phosphorus.
Biogeochemistry. 4:41-60. Van der Ze, S.E., W.H. van Riemsdijk, and F.A.M. de Hann. 1990. Protocol phosphate
saturated soils. Department of soil science and plant nutrition, Agricultural University, Wageningen, the Netherlands. In Methods of phosphorus analysis for soils, sediments, residuals, and water. Bulletin 396, USDA-CSREES Regional Committee. Gary Pierzynski (ed.), Kansas State University, Manhattan, KS.

64
Walbridge, M.R., C.J. Richardson, and W.T. Swank. 1991. Vertical distribution of biological and geochemical phosphorus subcycle in two southern Apalachian forest soils. Biogeochemistry. 13:61-85.
Walton, C.P. and G.F. Lee. 1972. A biological evaluation of the molybdenum blue
method for orthophosphate analysis. Tech. Int. Ver. Limnol. 18:676-684. Weaver, D.M., G.S.P. Ritchie, G.S. Anderson, and C.M. Deeley. 1988. Phosphorus
leaching in sandy soils. I. Short-term effects of fertilizer application and environmental conditions. Aust. J. Soil Res. 36:151-156.
Wolf, A.M., D.E. Baker, H.B. Pionke, and H.M. Kunishi. 1985. Soil tests for estimating
labile, soluble, and algae-available phosphorus in agricultural soils. J. Environ. Qual. 14:341-348.
Wood, T., F.H. Bormann, and G.K. Voigt. 1984. Phosphorus cycling in a northern
hardwood forest: Biological and chemical control. Science. 223(4634):391-393. Yuan, T.L. and D.E. Lucas. 1982. Retention of phosphorus by sandy soils as evaluated
by adsorption isotherms. Soil Crop Sci. Soc. Fla. Proc. 11:195-201. Zhou, M. and Y. Li. 2001. Phosphorus-sorption characteristics of calcareous soils and
limestone from the southern Everglades and adjacent farmlands. Soil Sci. Soc. Am. J. 65:1404-1412.
BIOGRAPHICAL SKETCH
Carla Marie Sperry was born on August 29, 1976. She is the only child of Myra
Sperry. Carla received two undergraduate degrees from the University of South Florida
in environmental science and policy (May 1999) and interdisciplinary natural science
(December 2000). While attending USF, Carla obtained an internship with the Southwest
Florida Water Management District. Here she dealt with wetland mitigation and
restoration projects in the Surface Water Improvement and Management program. This
experience increased her interest in wetland management and prompted Carla to further
her education particularly in wetland systems. In the summer of 2001, Carla began her
master’s work in soil and water science, focusing on wetlands and aquatic systems, at the
University of Florida.
65