soil phosphorous, potassium and micronutrients
TRANSCRIPT

Soil Phosphorous, Potassium and Micronutrients

Introduction
Phosphorous is second only to N in importance for the productivity and health of ecosystems
0 P is scarce in most ecosystems
0 Excessive application of P fertilizers can lead to eutrophication of water supplies

Introduction
Potassium is abundant in most soils 0 Most is tied up and unavailable to plants
� K is required by plants in large amounts
9 of the 18 elements essential for plant growth are required in very small amounts
� Called micronutrients or trace elements

Phosphorous in Soils
Phosphorous not abundant in natural ecosystems 0 Amounts usually adequate for sustained plant growth as
all P taken up by plant is returned to soil in residue
P in agricultural systems not sustainable for
continued growth 0 Plants are harvested, P not returned to soil in residue in
sufficient quantities
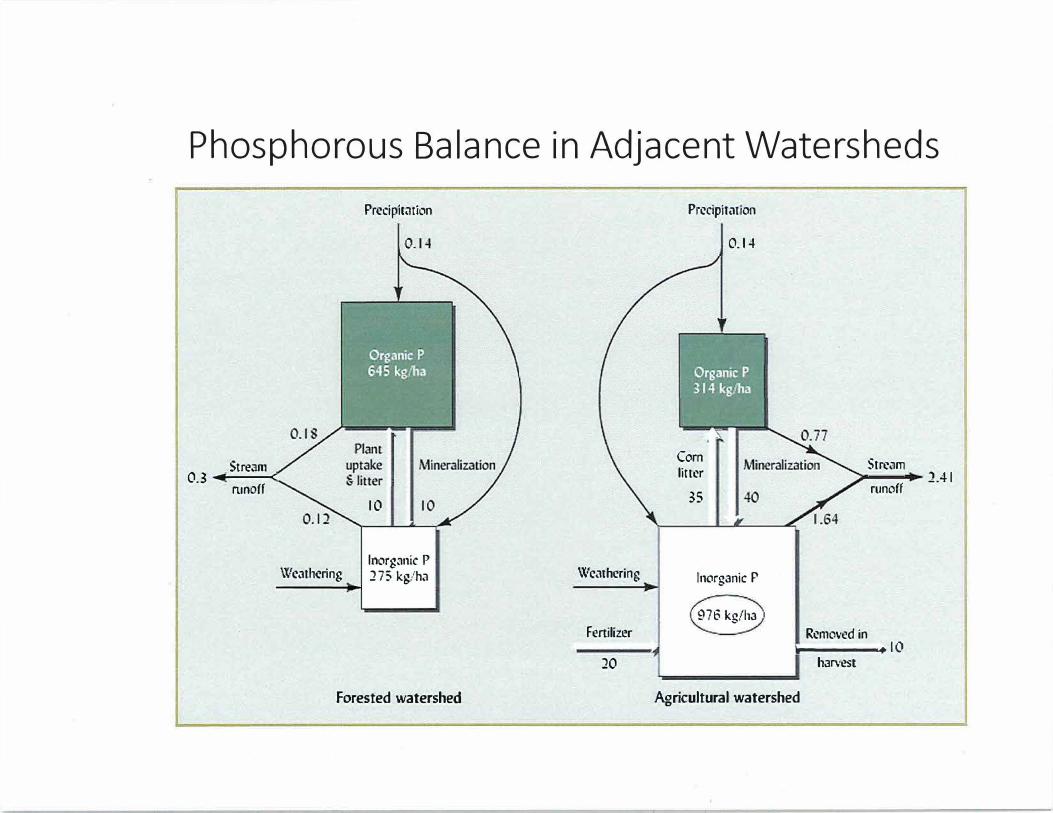
Phosphorous Balance in Adjacent Watersheds
Stream 0.3�--<
nmoff
Wcarhcring -----
Precipitation
0.14
10
Inorganic P 275 kg/ha
Forested watershed
Weathering
Fertilizer
JO
Precipitation
Corn litrer
35
0.14
'
Inorganic P
976 kg/ha Removed in
Stream
runoff
..----..,,10 harvest
AgricuJtural watershed
J.41

Phosphorous in Soils
In agricultural systems additional P is applied as
manure, fertilizer etc.
0 After fertilization, many soils have more P than can be
used by the crop
0 Runoff, leaching and erosion may move this excess P
into waterbodies triggering eutrophication
Eutroph ication
Accumulation of Phosphorous in bodies of water
0 Stimulates algae and aquatic plant growth
0 Decaying of plant matter uses up dissolved oxygen in
the water 0 resulting in fish die off

Fish kill as a result of eutrophication-anoxic condition resulting from the decay of masses of algae whose growth was stimulated by excessive Phosphorous

Phosphorous in Soils
Where P is deficient land degradation may occur
� Common in parts of Africa where soils have been mined of P for years.as result of subsistence farming 0 Plants grow sparsely and poorly, land becomes subject to erosion
{wind and water) for lack of cover
0 P deficiency indirectly causes N deficiency 0 low P inhibits effective nodulation of legumes

African Corn Field Showing Extreme Phosphorous Deficiency

Practical Management of P in Soils
1. Choose fertilizer to fit P status of soil0 This can change over time, so as P availability
increases, fertilizer should be reduced
2. Placement of P fertilizers0 Localized placement in root zone reduces amount
needed and reduces potential for P reactions and/or fixation
3. Use fertilizers containing ammonium and P0 Increases uptake of P, especially in alkaline soils
Practical Management of Pin Soils
4. Cycle organic matter0 Increases plant available Pas organic materials
decompose
5. Control soil pH0 P uptake optimized between pH 6 and 7
6. Enhance mycorrhizal symbiosis0 May need to innoculate seedlings
7. Choose P-efficient plants

Practical Management of P in Soils
8. Reduce runoff and sediment losses0 Use conservation practices, cover crops, residues etc.
0 Encourage water movement into soil rather than off it
9. Capture excess P before it enters waterbodies0 Natural or constructed wetlands help tie up P

Potassium in Soils
Potassium (K) present in soil solution only as positively charged cation -- K
+
0 Behavior in soil influenced primarily by 0 cation exchange properties
0 mineral weathering
Does not cause offsite environmental problems or
toxicity to plants

Potassium in Soils
K found in high levels in most soils except those
dominated by quartz sands 0 Quantity held in exchangeable form at any time is small
0 Most K held as part of primary mineral structure or fixed in forms unavailable to plants
K is easily lost by leaching 0 More readily leached in acid than limed soil
0 Attraction of K+
to negatively charged colloids slows leaching in
limed soils

How Liming an Acid
Soil can Reduce
Leaching Losses of
Potassium
K+
ions can more easily
replace ca2+
ions on the soil colloid in limed soil
than they can Al3+
ions in
an (unlimed) acid soil
Acid soil
H A� Ca Al --Al -- -
H Al AJ
Limed soil
Ca2+

Potassium in Soils
Plants can take up very large amounts of K
0 If K is present in sufficient quantities plants will take up more than they need 0 Termed luxury consumption
0 If plant residues are not returned to the soil luxury consumption can reduce plant available K levels dramatically

Relationship Between Available Potassium Levels in Soils, Plant Growth and Plant Uptake of Potassium
High.------------==============�
Relative plant growth Potassium
content. �------
of plants
�w.._ ______________________________________________ __
t
low High
Potassium available in soil

Practical Potassium Management
1. Understand the sources of gains and losses of
available potassium and of factors affecting them
0 Relative importance of each source will vary among
soils
2. Realize that soils can supply most of the K
required for a natural ecosystem
0 Must supplement where crops are removed

Practical Potassium Management
3. Avoid highly acid soils that permit extensive
losses of potassium
4. Recycle as much plant absorbed K to soil as
possible
5. When needed apply fertilizer in light applications0 On an annual basis is best

Typical Ga.ins and Losses of Available Soil Potassium in a Field System
Plant residues Anin1al n1anurcs
Plant removal
Con1rncrci ell f ('rtilizcrs
Available soil potassitnn
leaching Eros1ion loss ts losses
Slo\vty availabl'c pot,assi1nu rnincrals
fixation

M icronutrients As important as macronutrients
0 Required in much smaller amounts
0 All can be found in igneous rocks
0 Organic matter an important secondary source for many
micronutrients
0 Deficiencies likely to occur where total nutrient contents
are low 0 Highly leached, acid soils and organic soils usually deficient

M icronutrients
Cation micronutrients include Iron, Zinc,
Manganese, Copper, Cobalt, Nickel
0 Most are soluble and plant available under acid conditions
� Can be toxic in very acid soils
0 Deficiencies more common in calcareous soils 0 pH of 6-7 allows sufficient solubility for plants without being toxic

Micron utrients Anion micronutrients include Boron, Molybdenum,
Chlorine
� Chlorine usually available in sufficient quantities
� Can be present in toxic amounts in saline soils
0 Boron commonly most deficient of micronutrients 0 Availability related to soil pH, most available in acid soils
0 Molybdenum availability is increased with increasing pH 0 Liming acid soils will increase the availability

Page 1 Guides for Educators (May 2014)
(P) commonly is one of the most limiting nutrients for crops and forage. The primaryrole of P in plants is storage and transfer of energy produced by photosynthesis forgrowth and reproductive processes. Phosphorus cycles in soil through variousprocesses and in various forms. Some forms are readily available for plant use, andsome are not (fig. 1). Adequate P levels promote fruit, flower, and seed production;increase crop yields; promote root growth and hardiness of plants in winter; stimulatetillering; and hasten crop maturity. Phosphate soil tests assist in determining the Pcycling in soils, production potential, appropriate P levels for soil microbial processes,and potential crop response to P fertilizer. Moderate levels of P typically are adequatefor productivity and soil microbial processes. High levels indicate excessive applicationof P fertilizer; a potential for loss of soluble P in surface runoff, drainage tile, andgroundwater at a shallow depth; and a potential for leaching of P in sandy and organicsoils.
Figure 1.—Soil phosphorus cycle (Pierzinski and others, 1994).
Inherent Factors Affecting Soil Phosphorus Inherent soil properties and climate affect the growth of crops and their response to applied P fertilizer and regulate the processes that can restrict the availability of P. Climatic conditions, such as rainfall and air temperature, and site conditions, such as soil moisture and aeration
(oxygen level) and salinity (salt content/electrical conductivity) affect the rate of mineralization of P as a result of decomposition of organic matter. Organic matter decomposes, releasing P, more quickly in warm, humid climates than in cool, dry climates. Phosphorus

Soil Health – Phosphorus USDA-NRCS
Page 2 Guides for Educators (May 2014)
is released faster from well-aerated soils (higher oxygen level) than from saturated soils (lower oxygen level). Soil pH of 6 to 7.5 is ideal for the availability of P for plant use. Values of less than 5.5 and 7.5 to 8.5 limit availability of P as a result of fixation by aluminum, iron, or calcium (fig. 2), which commonly are associated with soil parent material. Moderate levels of P do not readily leach out of the root zone in most soils. Potential for loss of P in these soils is associated mainly with erosion and runoff. Soils that have a high level of P are prone to loss of soluble P in surface runoff, drainage tile, and groundwater at a shallow depth, and sandy and organic soils are prone to loss of P through leaching. To minimize sedimentation and loss of soluble P, closely manage soils that have a high or very
high level of P, are subject to erosion and runoff, or are in close proximity to streams, lakes, and other bodies of water.
Figure 2.—Phosphorus availability across pH ranges (California Fertilizer Association, 1995).
Phosphorus ManagementThe availability of P can be increased by applying lime to acid soils, using practices that increase organic matter, and properly placing P fertilizer, which affects the efficiency of use by crops. Loss of P can be minimized by limiting erosion and runoff, injecting or incorporating P, and limiting or eliminating applications of P fertilizer if the level of P in the soil is high or very high. Adequate P is essential for crop and forage production. It encourages vigorous root and shoot growth, promotes early maturity, promotes efficient use of water by plants, and increases grain yields. Phosphorus deficiency reduces yields by delaying maturity, stunting growth, and restricting energy use by plants. Soil P is relatively stable; it moves very little as compared to nitrogen, unless it is present in excessive amounts. The lack of mobility and low solubility limit the availability of P applied in fertilizer because it is fixed by P compounds in the soil. Fixed P slowly becomes available to crops over several years, depending on the
type of soil and P compounds (fig. 1). Phosphorus in eroded sediment in bodies of water is also released over several years. Purple leaf tissue is symptomatic of P deficiency (fig. 3). It appears first on the tips of leaves and progresses until the entire leaf exhibits a purple color. Lower leaves die when phosphorus deficiency is severe, especially if hot, dry, windy conditions persist. Emerging leaves commonly are green because plants mobilize available P to the youngest leaves first. Symptoms of P deficiency commonly occur as young plants are exposed to cool, wet conditions. Under these conditions, plant growth exceeds the ability of the roots to supply P. Young plants are especially vulnerable because their root systems are limited and P is immobile in the soil. Cultural or environmental factors that limit root growth contribute to the symptoms of P deficiency. These factors include cool temperatures, wet or dry conditions, compaction of the soil,

Soil Health – Phosphorus USDA-NRCS
Page 3 Guides for Educators (May 2014)
damage from herbicide use, damage from insects, salinity, and root pruning from side-dressing knives or cultivators. Once growing conditions become favorable again and further root growth occurs, leaves normally regain their green color.
Figure 3.—Phosphorus-deficient corn characterized by purple color on lower leaves.
The availability of P is controlled by three primary factors—soil pH and mineralogy, content of organic matter, and placement of P fertilizer. Lime should be applied to acid soils to achieve an ideal pH level (pH of 6 to 7). Low soil pH severely limits the availability of P for plant use. Soil pH of less than 5.5 typically limits the availability of P by 30 percent or more. Acidity also reduces root growth, which is critical for the uptake of P. High amounts of iron oxides, available aluminum, or calcium carbonates or sulfates in soil fix P, limiting its availability.
Maintaining the content of organic matter in the soil is important for controlling the availability of P. Mineralization of organic matter provides a significant portion of the P available for crop use. Phosphorus fertilizer and manure or other organic amendments can be applied to remedy P deficiency, but careful management is needed to provide a form of P that is available for plant use. Roots must come in contact with available P for uptake to occur. It commonly is recommended to apply P in the rows as a starter fertilizer to increase early growth, even if the amount of P in the soil is sufficient for grain. Phosphorus can also be injected 2 inches below the seeds of row crops, which provides a ready source of P for young seedlings. Producers should carefully evaluate the value of applying P fertilizer early in the growing season. Seedlings may look better if starter P fertilizer is applied, but yields may not be increased.
Primary P management strategies: 1. Apply lime to acid soils to increase pH to
between 6.5 and 7.0 (fig. 2).2. Apply small amounts of P fertilizer
frequently rather than large amounts all atone time.
3. Minimize the tie-up of P by banding orinjecting P fertilizer or liquid manure.
4. Place P fertilizer near rows or in furrows,where roots are most active.

Soil Health – Phosphorus USDA-NRCS
Page 4 Guides for Educators (May 2014)
Measuring Soil Phosphate (PO4)Materials needed to measure phosphate: ____ Plastic container and probe for gathering
and mixing soil samples ____ Phosphate test strips ____ 1/8-cup (29.5 mL) measuring scoop ____ Calibrated 120-mL vial with lid for
shaking ____ Squirt bottle ____ Distilled water or rainwater ____ Pen, field notebook, permanent marker,
and resealable plastic bags
Considerations: Electrical conductivity (EC) should always be measured on a sample before measuring phosphate. Soil nitrate/nitrite and soil pH can also be measured on the sample using the steps in the following paragraphs. Soil P tests, which help in determining potential crop growth and recommendations for fertilizer, are of value only if correlated and calibrated to the response of crops to applied P. Thus, soil P test results are an “index” of relative availability.
Quick in-field hand test: 1. Soil P levels in a field vary depending on
location, past management, and time ofyear. Examples of variables includeplacement of P fertilizer (broadcast orbanded; in rows or between rows), soiltexture, organic matter content, andapplication of manure or other fertilizer.Using a soil probe, gather at least 10 smallsamples to a depth of 8 inches or lessrandomly from an area that represents a
particular soil type and management history. Place samples in the small plastic container and mix. Samples gathered for no-till cropping, forage establishment, and environmental purposes can be taken to a shallower depth. Do not include large stones and plant residue. Repeat this step for each sampling area.
2. Neutralize hands by rubbing moist soilacross palms. Discard soil. Place a scoopof the mixed soil in palm of hand andsaturate with “clean” water (distilled wateror rainwater).
3. Squeeze hand gently until a soil and waterslurry forms.
4. Touch tip of phosphate test strip to the soiland water slurry. Leave until the liquid isdrawn up at least 1/8 to 3/16 inch beyondthe area covered by the soil (fig. 4).
5. After 1 to 2 minutes, compare color ofwet test strip to color chart on the teststrip container (fig. 5). The color on thechart that most closely matches the coloron the test strip indicates the amount ofphosphate in the saturated soil. Recordvalue in table 1.
Figure 4.—Quick in-field hand test.
Soil Health – Phosphorus USDA-NRCS
Page 5 Guides for Educators (May 2014)
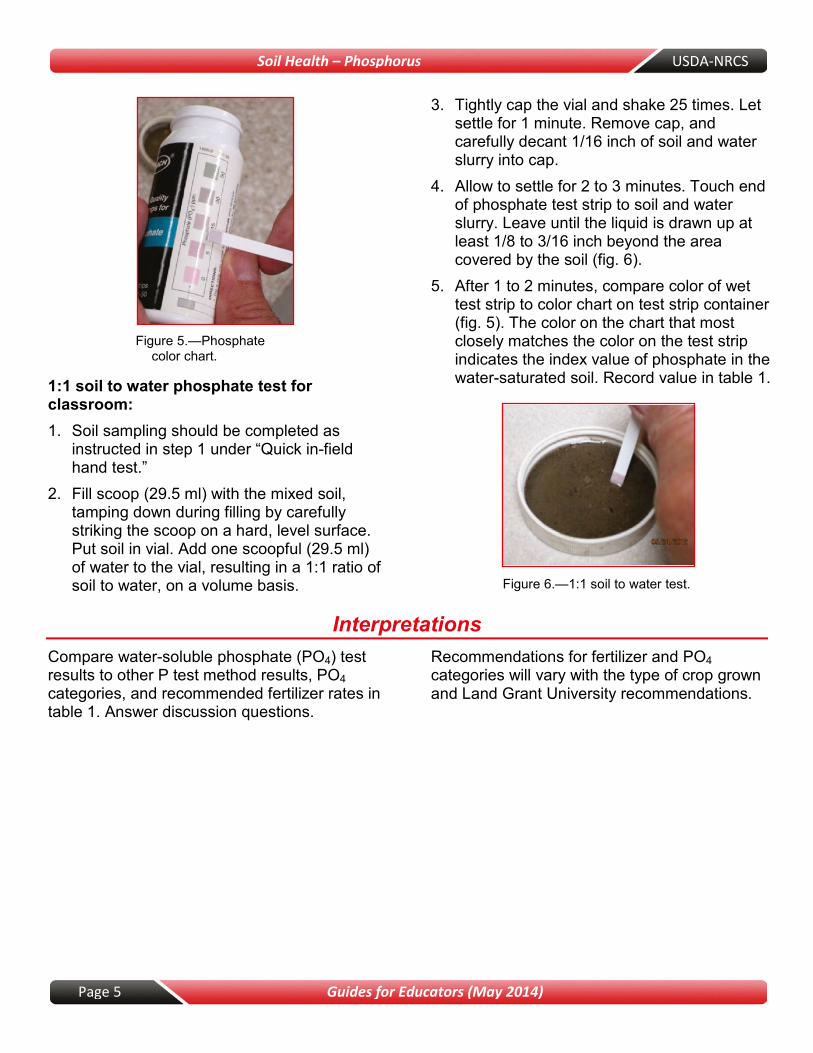
Figure 5.—Phosphate color chart.
1:1 soil to water phosphate test for classroom: 1. Soil sampling should be completed as
instructed in step 1 under “Quick in-fieldhand test.”
2. Fill scoop (29.5 ml) with the mixed soil,tamping down during filling by carefullystriking the scoop on a hard, level surface.Put soil in vial. Add one scoopful (29.5 ml)of water to the vial, resulting in a 1:1 ratio ofsoil to water, on a volume basis.
3. Tightly cap the vial and shake 25 times. Letsettle for 1 minute. Remove cap, andcarefully decant 1/16 inch of soil and waterslurry into cap.
4. Allow to settle for 2 to 3 minutes. Touch endof phosphate test strip to soil and waterslurry. Leave until the liquid is drawn up atleast 1/8 to 3/16 inch beyond the areacovered by the soil (fig. 6).
5. After 1 to 2 minutes, compare color of wettest strip to color chart on test strip container(fig. 5). The color on the chart that mostclosely matches the color on the test stripindicates the index value of phosphate in thewater-saturated soil. Record value in table 1.
Figure 6.—1:1 soil to water test.
InterpretationsCompare water-soluble phosphate (PO4) test results to other P test method results, PO4categories, and recommended fertilizer rates in table 1. Answer discussion questions.
Recommendations for fertilizer and PO4categories will vary with the type of crop grown and Land Grant University recommendations.
Soil Health – Phosphorus USDA-NRCS
Page 6 Guides for Educators (May 2014)
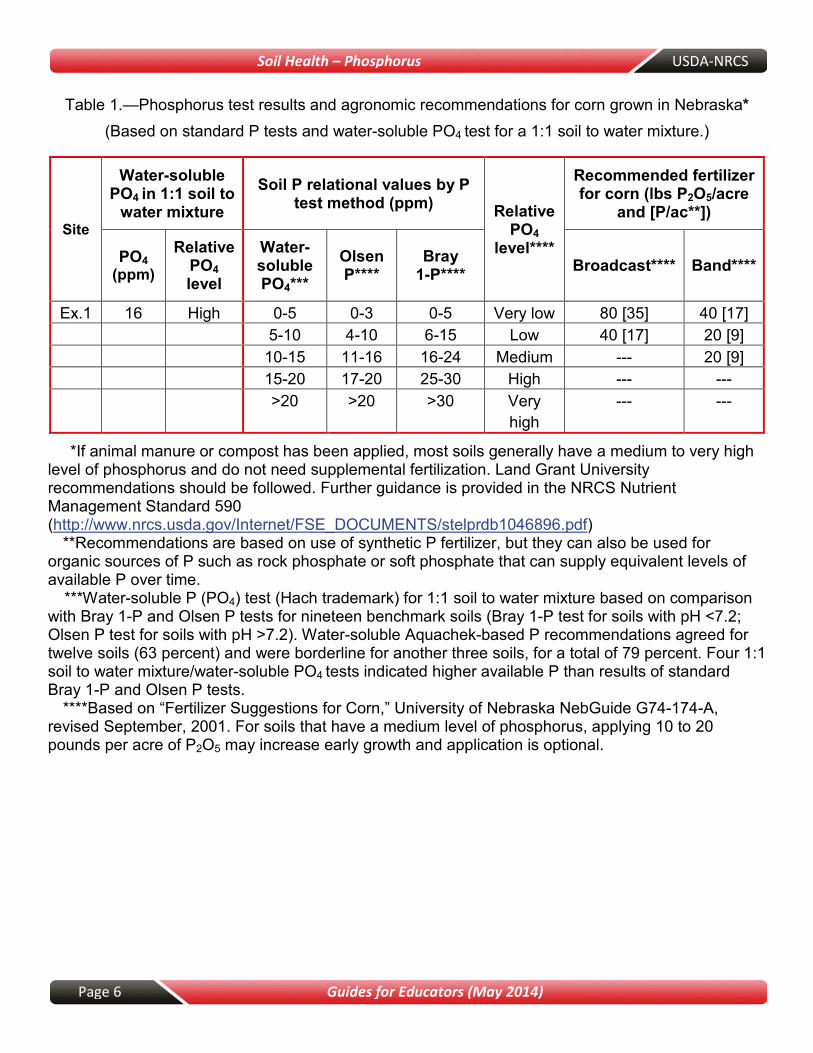
Table 1.—Phosphorus test results and agronomic recommendations for corn grown in Nebraska* (Based on standard P tests and water-soluble PO4
test for a 1:1 soil to water mixture.)
Site
Water-soluble PO4 in 1:1 soil to
water mixture Soil P relational values by P
test method (ppm) Relative PO4
level****
Recommended fertilizer for corn (lbs P2O5/acre
and [P/ac**])
PO4 (ppm)
Relative PO4level
Water-soluble PO4***
Olsen P****
Bray 1-P**** Broadcast**** Band****
Ex.1 16 High 0-5 0-3 0-5 Very low 80 [35] 40 [17] 5-10 4-10 6-15 Low 40 [17] 20 [9]
10-15 11-16 16-24 Medium --- 20 [9] 15-20 17-20 25-30 High --- --- >20 >20 >30 Very
high --- ---
*If animal manure or compost has been applied, most soils generally have a medium to very highlevel of phosphorus and do not need supplemental fertilization. Land Grant University recommendations should be followed. Further guidance is provided in the NRCS Nutrient Management Standard 590 (http://www.nrcs.usda.gov/Internet/FSE_DOCUMENTS/stelprdb1046896.pdf)
**Recommendations are based on use of synthetic P fertilizer, but they can also be used for organic sources of P such as rock phosphate or soft phosphate that can supply equivalent levels of available P over time.
***Water-soluble P (PO4) test (Hach trademark) for 1:1 soil to water mixture based on comparison with Bray 1-P and Olsen P tests for nineteen benchmark soils (Bray 1-P test for soils with pH <7.2; Olsen P test for soils with pH >7.2). Water-soluble Aquachek-based P recommendations agreed for twelve soils (63 percent) and were borderline for another three soils, for a total of 79 percent. Four 1:1 soil to water mixture/water-soluble PO4 tests indicated higher available P than results of standard Bray 1-P and Olsen P tests.
****Based on “Fertilizer Suggestions for Corn,” University of Nebraska NebGuide G74-174-A, revised September, 2001. For soils that have a medium level of phosphorus, applying 10 to 20 pounds per acre of P2O5 may increase early growth and application is optional.
Soil Health – Phosphorus USDA-NRCS
Page 7 Guides for Educators (May 2014)
Are soil phosphate levels adequate? What are the relative P levels and recommended rate of application of P2O5 fertilizer according to table 1?
_____________________________________________________________________________
_____________________________________________________________________________
_____________________________________________________________________________
Do current management practices limit phosphorus losses from erosion and sedimentation? Do they prevent soluble P in runoff or drainage tiles from reaching streams or lakes?
_____________________________________________________________________________
_____________________________________________________________________________
_____________________________________________________________________________
Are proper management practices being used to maintain soil health (compaction, pH, salinity, and organic matter content)? Do they properly manage the placement and application rate of P fertilizer or manure? Why or why not?
_____________________________________________________________________________
_____________________________________________________________________________
______________________________________________________________________________________
Glossary Immobilization.—Temporary “tying up” of water-soluble P as a result of soil micro-organisms decomposing plant residue. Immobilized P will eventually become available for plant use as decomposition progresses. Mineralization.—Conversion of nutrients in soil organic matter (e.g., phosphorus, nitrogen, and sulfur) to inorganic forms that are available for crop use; occurs during respiration. Orthophosphate.—Form of phosphorus absorbed by plants, generally H2PO4- or HPO4
2-.
Phosphorus cycle.—Circulation of many different forms of P in soil. Some forms are available for plant use, and some are not, such as those fixed to iron, aluminum, and calcium minerals (fig. 1). Phosphorus fixation.—Phosphate that is bound to iron, aluminum, and calcium minerals and sorbed on clay minerals. Fixation and availability of P vary with soil pH (fig. 2). Soil phosphate.—Form of P that is available for plant use, expressed as PO4.
USDA is an equal opportunity provider and employer.
Soil Quality Information Sheet
Soil Quality Concerns: Pesticides
USDA Natural Resources Conservation Service January 1998
What are pesticides?
Pesticides are synthetic organic chemicals used to controlweeds in fields and lawns, and unwanted or harmful pests,such as insects and mites that feed on crops. Pesticidesare divided into categories according to the target organ-isms they are designed to control (e.g., insecticidescontrol insects).
Herbicides are by far the most commonly used pesticidesin the United States. They range from non selective tohighly selective for control of specific weeds in specificcrops, with different products having postemergence,preplant, and preemergence uses. Insecticides are secondin usage, and fungicides are third.
Effects of Pesticides on SoilQuality
The capacity of the soil to filter, buffer, degrade, immobi-lize, and detoxify pesticides is a function or quality of thesoil. Soil quality also encompasses the impacts that soiluse and management can have on water and air quality,and on human and animal health. The presence andbio-availability of pesticides in soil can adversely impact
human and animal health, and beneficial plants and soilorganisms. Pesticides can move off-site contaminatingsurface and groundwater and possibly causing adverseimpacts on aquatic ecosystems.
What are pesticideformulations?
The formulation is the chemical and physical form inwhich the pesticide is sold for use. The active ingredient(a.i.) is the chemical in the formulation that has thespecific effect on the target organism. The formulationimproves the properties of the pesticides for storage,handling, application, effectiveness, or safety. Examplesof formulated products are wettable powders and water-dispersible granules. A single pesticide is often sold inseveral different formulations, depending on use require-ments and application needs.
Pesticide mode of action
Mode of action refers to the mechanism by which thepesticide kills or interacts with the target organism.
• Contact pesticides kill the target organism by weaken-ing or disrupting the cellular membranes; death can bevery rapid.
• Systemic pesticides must be absorbed or ingested bythe target organism to disrupt its physiological ormetabolic processes; generally they are slow acting.
How effective the pesticides are at killing the targetorganisms (efficacy) depends on the properties of thepesticide and the soil, formulation, application technique,agricultural management, characteristics of the crop,environmental or weather conditions, and the nature andbehavior of the target organism.

(Prepared by the National Soil Survey Center in cooperation with theSoil Quality Institute, NRCS, USDA, and the National Soil Tilth Laboratory,Agricultural Research Service, USDA).
The U. S. Department of Agriculture (USDA) prohibits discrimination in its programs on the basis of race, color, national origin, gender, religion, age,disability, political beliefs, sexual orientation, and marital or family status. (Not all prohibited bases apply to all programs.) Persons with disabilities whorequire alternative means for communication of program information (Braille, large print, audiotape, etc.) should contact USDA’s TARGET Center at (202)720-2600 (voice and TDD).
To file a complaint of discrimination, write USDA, Director, Office of Civil Rights, Room 326W, Whitten Building, 14th and Independence Avenue, SW,Washington, DC 20250-9410 or call (202) 720-5964 (voice or TDD). USDA is an equal opportunityprovider and employer.
Fate of pesticides in theenvironment
Ideally, a pesticide stays in the treated area long enough toproduce the desired effect and then degrades into harm-less materials. Three primary modes of degradation occurin soils:
• biological - breakdown by micro-organisms• chemical - breakdown by chemical reactions, such as
hydrolysis and redox reactions• photochemical - breakdown by ultraviolet or visible
light
The rate at which a chemical degrades is expressed as thehalf-life. The half-life is the amount of time it takes forhalf of the pesticide to be converted into something else,or its concentration is half of its initial level. The half-lifeof a pesticide depends on soil type, its formulation, andenvironmental conditions (e.g., temperature, moisture).Other processes that influence the fate of the chemicalinclude plant uptake, soil sorption, leaching, and volatil-ization. If pesticides move off-site (e.g., wind drift, runoff,leaching), they are considered to be pollutants. Thepotential for pesticides to move off-site depends on thechemical properties and formulation of the pesticide, soilproperties, rate and method of application, pesticidepersistence, frequency and timing of rainfall or irrigation,and depth to ground water.
Retention of pesticides in the soil
Retention refers to the ability of the soil to hold a pesti-cide in place and not allow it to be transported. Adsorp-tion is the primary process of how the soil retains apesticide and is defined as the accumulation of a pesticideon the soil particle surfaces. Pesticide adsorption to soildepends on both the chemical properties of the pesticide(i.e., water solubility, polarity) and properties of the soil(i.e., organic matter and clay contents, pH, surface chargecharacteristics, permeability). For most pesticides,organic matter is the most important soil property control-ling the degree of adsorption.
For most pesticides, the degree of adsorption is describedby an adsorption distribution coefficient (K
d), which is
mathematically defined as the amount of pesticide in soilsolution divided by the amount adsorbed to the soil.
Pesticide toxicityThe toxicity level of a pesticide depends on the deadlinessof the chemical, the dose, the length of exposure, and theroute of entry or absorption by the body. Pesticidedegradation in soil generally results in a reduction intoxicity; however, some pesticides have breakdownproducts (metabolites) that are more toxic than the parentcompound.
Pesticides are classified according to their potentialtoxicity to humans and other animals and organisms, asrestricted-use (can only be purchased and applied bycertified persons who have had training in pesticideapplication), and general use (may be purchased andapplied by any person).
Use and application considerations
• Apply pesticides at the lowest effective level.• Avoid unnecessary pesticide treatments.• Use Integrated Pest Management.• Follow all label instructions.• Apply proper rates and times as label indicates.• Calibrate application equipment.• Apply formulations that minimize drift.• Use safety equipment when handling.• Store and dispose of pesticide containers properly.• Use biological controls when appropriate.• Alter farming or cropping systems to control pests.• Use disease and insect resistant crop varieties.
Visit our Web site:
http://soils.usda.gov

Soil Quality ■ AgronomyNo. 4
United StatesDepartment ofAgriculture
NaturalResourcesConservationService
Soil Quality Institute2150 Pammel Dr.Ames, IA 50011515-294-4592
TechnicalNote No. 4
August, 1997________________
This is the fourthAgronomy factsheet in a series onon soil quality. Thisfact sheet isgeneral. For specificapplication, contactyour NRCS StateAgronomist.________________
Page 1
Effect of Soil Qualityon Nutrient Efficiency
Technical Note
Nutrient efficiency is a measure of howmuch crop is produced per unit of nutrientsupplied. The higher the efficiency, the moreproduct is produced per unit of nutrient. Thequality of soil affects nutrient use efficiency. Soilquality is measured or evaluated by a number ofindicators. This technical note will discuss how13 indicators relates to nutrient efficiency.
1. Soil Quality definition withregards to nutrients
A healthy soil functioning at nearly fullcapacity stores and cycles nutrients and allowscrops to grow and use nutrients efficiently. In ahealthy soil, nutrients become available whenthe plants need them. There is little risk for cropnutrients to move below the root zone throughleaching, off the edge of field by runoff anderosion, or above the crop canopy byvolatilization. Crop nutrients that move beyondthe crop’s zone of uptake could potentiallycontaminate the environment.
2. ErosionErosion and runoff are both detrimental to
nutrient management. Nutrients contained inthe topsoil, along with soil organic matter, canbe carried away by erosion or washed out withrunoff water. The organic matter is the first to betransported by water or wind because of itslower specific gravity. Additional nutrients arerequired to maintain productivity lost whentopsoil is carried away by erosion.
3. Deposition of SedimentSediment additions in the field can be
good or bad. Some sediment, especially thefiner clay particles and organic matter, bring innutrients. The coarser sediments, like sands, do
not have a high nutrient content and tend tocover the topsoil that is in place. Coarsertextured soils also lack moisture-holding andpesticide-retention capacity.
4. CompactionCompact soils restrict the movement of
roots. Less root volume in the soil preventsnutrient uptake. Compaction also restricts thediffusion and flow of nutrients in the soil. Fewroots and limited nutrient movement can resultin stunted growth because the plant is unable totake up the nutrients in the soil. Compacted soilsretard air movement and gas exchange in theroot zone. This can lead to nutrient losses, likedenitrification or toxic gas build-up near theroots.
5. Soil Aggregation at the SoilSurface
Good soil aggregation means better waterand nutrient movement through the soil. Moreaggregation means more of the surface area ofthe soil particles have capacity for adsorbednutrients. Surface aggregation allows pore spacefor water infiltration and gas exchanges. Goodsoil aggregation is closely tied to the amount ofactive organic matter and to biological activity.Thus soil aggregation is connected to nutrientcycling.
6. InfiltrationPlants require water. Nutrients move with
the water through the soil pores and areabsorbed into the plant. When nutrients areapplied to the soil surface, as in no-till systems,water is required to move the nutrients downinto the root zone. Good soil infiltration permitsthis to happen. Nutrients that are not carried

United StatesDepartment ofAgriculture
NaturalResourcesConservationService
Soil Quality Institute2150 Pammel Dr.Ames, IA 50011515-294-4592
TechnicalNote No. 4
August, 1997________________
Page 2
into the root zone are susceptible to runoff.Percolating water carries the nutrients deeperinto the root zone and also removes harmfulsalts that may accumulate there.
7. Soil CrustingCrusting seals the soil surface and restricts
water infiltration and gas exchange. If notallowed to infiltrate, surface applied nutrients oncrusted soils are susceptible to runoff and windtransport. Crusting also reduces seedgermination and seedling survival which directlyhas an effect on the plant population and theamount of nutrients necessary for the crop.
8. Nutrient Loss or ImbalanceNutrients need to be applied according to
the crop and soil requirements. Soil and plantanalyses are a good way to determine theamount of nutrients needed. Over-application ofnutrients can lead to plant toxicity, poor pHreaction, and excess nutrients susceptible torunoff, leaching, and volatilization. A deficiencyin nutrients will not sustain optimum plantgrowth.
9. Pesticide CarryoverPesticides with residual soil activity can
stunt growth of subsequent crops. If roots areaffected, their ability to absorb nutrients will belessened. Any effect on plant photosynthesis willreduce nutrient uptake and metabolism.Without pesticide or weed control, weeds canutilize nutrients in competition of the crop. Theweed residue may not decompose and recycleplant nutrients for the subsequent crops.
10. Organic Matter Soil organic matter is a very valuable
component of the topsoil. Organic matter storesnutrients, feeds soil organisms that decomposeorganic material, and return the basic nutrientsto the soil. Organic matter holds soil moisture forplant use. Soil organic matter is developed bycombining of carbon, oxygen, and nitrogenplus other nutrients in the soil. Nitrogen andother nutrients must be available to soilmicroorganisms for development of organicmatter.
11. Biological Activity A healthy soil has a diverse set of macro
and micro organisms that assure a wellfunctioning soil food web. Microorganismsdecompose organic material, store nutrients intheir bodies, and as they decay or become foodfor other organisms, they release nutrients.Some small animals like insects and crustaceacarry organic material and related nutrients intothe soil and aid in its decomposition. Somemicroorganisms have a symbiotic relationshipwith plants such as mycorrhiza. Mycorrhiza livein plant roots and help the plants assimilatewater and nutrients.
12. Weeds and PathogensNutrients can be used by crops or by
weeds. Weeds utilize nutrients, but fail toproduce a marketable commodity. So, thenutrients are not efficiently used to grow crops.The same is true for crops that are attacked bydisease and insects. Efficient utilization meansnutrients are converted to a harvestableproduct.
13. Extreme Soil MoistureConditions
The amount of soil moisture impactsnutrient cycling. A dry soil does not promoteroot extension in the root zone. And, sincenutrients are carried by water, plants are unableto obtain adequate nutrition. Waterlogged soilsaffect the transformation of nutrients.Phosphorus becomes more mobile and lessattached to minerals in waterlogged conditions.Nitrate nitrogen is denitrified by changing formfrom a liquid to a gas which can be lost to theatmosphere. Roots consume oxygen and respirecarbon dioxide. Because gases are transportedmuch more slowly through water (about oneten thousanth slower) than air, some gases suchas carbon dioxide can accumulate in the soiland be toxic to roots.
The United States Department of Agriculture (USDA) prohibits discrimination in its programs on the basis of race, color, national origin, sex, religion,age, disability, political beliefs and marital or familial status. (Not all prohibited bases apply to all programs.) Persons with disabilities who requirealternative means for communication of program information (Braille, large print, audiotape, etc.) should contact the USDA’s TARGET Center at(202) 720-2600 (voice and TDD).To file a complaint, write the Secretary of Agriculture, U.S. Department of Agriculture, Washington, D.C., 20250, or call 1-800-245-6340 (voice) or(202) 720-1127 (TDD). USDA is an equal opportunity employer.

Soil Quality Indicators
Soil EnzymesSoil enzymes increase the reaction rate at which plantresidues decompose and release plant available nutrients.The substance acted upon by a soil enzyme is called thesubstrate. For example, glucosidase (soil enzyme) cleavesglucose from glucoside (substrate), a compound commonin plants. Enzymes are specific to a substrate and haveactive sites that bind with the substrate to form atemporary complex. The enzymatic reaction releases aproduct, which can be a nutrient contained in the substrate.
Sources of soil enzymes include living and dead microbes,plant roots and residues, and soil animals. Enzymesstabilized in the soil matrix accumulate or form complexeswith organic matter (humus), clay, and humus-claycomplexes, but are no longer associated with viable cells.It is thought that 40 to 60% of enzyme activity can comefrom stabilized enzymes, so activity does not necessarilycorrelate highly with microbial biomass or respiration.Therefore, enzyme activity is the cumulative effect of longterm microbial activity and activity of the viablepopulation at sampling. However, an example of anenzyme that only reflects activity of viable cells isdehydrogenase, which in theory can only occur in viablecells and not in stabilized soil complexes.
Factors AffectingInherent - Soil enzymes have varying optimum pHand temperature values at which they function mosteffectively. For example, the activity of phosphatase, arylsulfatase, and amidase involved in phosphorus, sulfur, andnitrogen cycling, respectively, is strongly correlated tovariations in soil pH. Since enzyme structure and substratebinding can be altered by heat and extreme coldtemperature, enzyme activity decreases above and belowthe optimum temperature. The activity of many enzymesoften correlates with soil moisture content, as well.Drought may suppress enzyme activity. Soil textureinfluences enzyme activity, and normally enzyme activitiesare significantly and positively correlated with claycontent. Clayey soils have greater ability to store organicmatter that promotes microbial communities, and clayforms clay-enzyme complexes. In contrast, sandy soils
tend to exhibit low rates of enzyme activity because theyare naturally low in organic matter and have poor waterholding capacity which results in lower microbial biomassand therefore lower enzyme activity.
Dynamic - Addition of organic amendments andadoption of management practices that increase soilorganic matter lead to increased enzyme activity (figs 1and 2). Plant roots stimulate enzyme activity because oftheir positive effect on microbial activity and production ofexudates rich in substrates acted on by enzymes.
Elevated soil concentrations of chemical compounds thatare end products of enzymatic reactions can inhibit enzymeactivity by feedback inhibition. For example, phosphataseactivity increases in phosphorus deficient soil, but itsactivity decreases in soil with high phosphorusconcentration. Similarly, urease activity may be suppressedby ammonia-based nitrogen fertilizer because ammoniumis the product of urease activity (fig 2).
Compaction may limit the activity of enzymes involved innutrient mineralization because of decreased oxygen in thesoil for those reactions or organisms requiring an aerobicenvironment. Conversely, anaerobic conditions fromcompaction or water saturation increase enzymatic reactionrates related to denitrification. Application of materialscontaining heavy metals can reduce enzyme activity (e.g.,amidase) due to their toxic effect on soil organisms androots or direct inhibition of enzyme reactions.
USDA Natural Resources Conservation ServiceIndicatorB
TestL
FunctionD/N
Helping People Help the Land...
0
20
40
60
80
100
120
140
160
ß-gl
ucos
idas
eAct
ivity
Fescue-clover
VegetableRotation
Grass (not burned)Grass
(burned)
Figure 1. Effects of cropping systems on ß-glucosidase (adaptedfrom Dick 1994).

Relationship to Soil FunctionEnzymes respond to soil management changes long beforeother soil quality indicator changes are detectable. Soilenzymes play an important role in organic matterdecomposition and nutrient cycling (table 1). Someenzymes only facilitate the breakdown of organicmatter (e.g., hydrolase, glucosidase), while others areinvolved in nutrient mineralization (e.g., amidase, urease,phosphatase, sulfates). With the exception of phosphataseactivity, there is no strong evidence that directly relatesenzyme activity to nutrient availability or crop production.The relationship may be indirect considering nutrientmineralization to plant available forms is accomplishedwith the contribution of enzyme activity.
Problems with Poor ActivityAbsence or suppression of soil enzymes prevents orreduces processes that can affect plant nutrition. Poorenzyme activity (e.g., pesticide degrading enzymes) canresult in an accumulation of chemicals that are harmful tothe environment; some of these chemicals may furtherinhibit soil enzyme activity.
Improving Enzyme ActivityOrganic amendment applications, crop rotation, and covercrops have been shown to enhance enzyme activity (figs 1and 2). The positive effect of pasture (fig 2) is associatedwith the input of animal manure and less soil disturbance.Agricultural methods that modify soil pH (e.g., liming) canalso change enzyme activity.
Measuring Enzyme ActivityEnzymes are measured indirectly by determining theiractivity in the laboratory using biochemical assays.Enzyme assays reflect potential activity and do notrepresent true in situ activity levels and must be viewed asan index.
Interpretation and AssessmentWhen possible, compare the site of interest to samplestaken from an adjacent, undisturbed site on the same soiltype. Alternatively, for a newly implemented landmanagement system, track changes from time zero to fiveor more years with annual sampling to detect temporalchanges in activity of soil enzymes.
Specialized equipment, shortcuts, tips:A spectrophotometer, and in some cases a fume hood,centrifuge, and/or shaker. For better results, use theenzyme optimum temperature and pH.
Time needed: variable, 30 to 60 minutes
References:Bandick AK and Dick RP. 1999. Field management effects on enzymeactivities. Soil Biology and Biochemistry 31:1471-1479.
Dick RP. 1994. Soil Enzyme Activity as an Indicator of Soil Quality. In:Doran JW et al., editors. Defining soil quality for a sustainableenvironment.. Madison, WI. p107-124.
Tabatabai MA. 1994. Soil Enzymes. In: Weaver RW et al., editors.Methods of soil analysis. Part 2. Microbiological and BiochemicalProperties. p 775-833.
USDA is an equal opportunity provider and employer. October 2010
Table 1. Role of soil enzymes
Enzyme Organic MatterSubstances Acted On End Product Significance Predictor of
Soil FunctionBeta glucosidase carbon compounds glucose (sugar) energy for microorganisms organic matter decomposition
FDA hydrolysis organic matter carbon andvarious nutrients
energy and nutrients formicroorganisms, measuremicrobial biomass
organic matter decompositionnutrient cycling
Amidase carbon and nitrogen compounds ammonium (NH4) plant available NH4 nutrient cycling
Urease nitrogen (urea)ammonia (NH3) andcarbon dioxide (CO2)
plant available NH4 nutrient cycling
Phosphatase phosphorus phosphate (PO4) plant available P nutrient cycling
Sulfatase sulfur sulfate (SO4) plant available S nutrient cycling
0
50
100
150
200
250
300
Ure
aseA
ctiv
ity
No Nitrogen
80 lbs N/A
PeasManure
Pasture
Figure 2. Effects of management on urease activity (adapted fromBandick and Dick 1999).

1
SOIL QUALITY – URBAN TECHNICAL NOTE No. 3
Heavy Metal Soil ContaminationIntroduction
Soil is a crucial component of rural and urban environments, and in both places land management is the key to soil quality. This series of technical notes examines the urban activities that cause soil degradation, and the management practices that protect the functions urban societies demand from soil. This technical note focuses on heavy metal soil contamination.
Metals in Soil
Mining, manufacturing, and the use of synthetic products (e.g. pesticides, paints, batteries, industrial waste, and land application of industrial or domestic sludge) can result in heavy metal contamination of urban and agricultural soils. Heavy metals also occur naturally, but rarely at toxic levels. Potentially contaminated soils may occur at old landfill sites (particularly those that accepted industrial wastes), old orchards that used insecticides containing arsenic as an active ingredient, fields that had past applications of waste water or municipal sludge, areas in or around mining waste piles and tailings, industrial areas where chemicals may have been dumped on the ground, or in areas downwind from industrial sites.
Excess heavy metal accumulation in soils is toxic to humans and other animals. Exposure to heavy metals is normally chronic (exposure over a longer period of time), due to food chain transfer. Acute (immediate) poisoning from heavy metals is rare through ingestion or dermal contact, but is possible. Chronic problems associated with long-term heavy metal exposures are:
! Lead – mental lapse.! Cadmium – affects kidney, liver, and GI tract.! Arsenic – skin poisoning, affects kidneys and central nervous system.
The most common problem causing cationic metals (metallic elements whose forms in soil are positively charged cations e.g., Pb2+) are mercury, cadmium, lead, nickel, copper, zinc, chromium, and manganese. The most common anionic compounds (elements whose forms in soil are combined with oxygen and are negatively charged e.g., MoO4
2-) are arsenic, molybdenum, selenium, and boron.
United States Department of Agriculture
Natural Resources Conservation Service
Soil Quality Institute 411 S. Donahue Dr. Auburn, AL 36832 334-844-4741X-177Urban TechnicalNote No. 3
September, 2000
This is the third note in a series of Soil Quality-Urban technical notes on the effects of land management on soil quality.

2
Prevention of Heavy Metal Contamination
Preventing heavy metal pollution is critical because cleaning contaminated soils is extremely expensive and difficult. Applicators of industrial waste or sludge must abide by the regulatory limits set by the U.S. Environmental Protection Agency (EPA) in Table 1.
Table 1. Regulatory limits on heavy metals applied to soils (Adapted from U.S. EPA, 1993).
Annual pollutant loading rates
Cumulative pollutant loading rates
Heavy metal Maximum concentration in sludge (mg/kg or ppm) (kg/ha/yr) (lb/A/yr) (kg/ha) (lb/A)
Arsenic 75 2 1.8 41 36.6 Cadmium 85 1.9 1.7 39 34.8 Chromium 3000 150 134 3000 2,679 Copper 4300 75 67 1500 1,340 Lead 420 21 14 420 375Mercury 840 15 13.4 300 268 Molybdenum 57 0.85 0.80 17 15 Nickel 75 0.90 0.80 18 16Selenium 100 5 4 100 89 Zinc 7500 140 125 2800 2500
Prevention is the best method to protect the environment from contamination by heavy metals. With the above table, a simple equation is used to show the maximum amount of sludge that can be applied. For example, suppose city officials want to apply the maximum amount of sludge (kg/ha) on some agricultural land. The annual pollutant-loading rate for zinc is 140 kg/ha/yr (from Table 1). The lab analysis of the sludge shows a zinc concentration of 7500 mg/kg (mg/kg is the same as parts per million). How much can the applicator apply (tons/A) without exceeding the 140 kg/ha/yr?
Solution:
(1) Convert mg to kg (1,000,000 mg = 1kg) so all units are the same:7500 mg X (1 kg/1,000,000 mg) = 0.0075 kg
(2) Divide the amount of zinc that can be applied by the concentration of zincin the sludge:(140 kg Zn/ha) / (0.0075 kg Zn/kg sludge) =18,667 kg sludge/ha
(3) Convert to lb/A: 18,667 kg/ha X 0.893 = 16,669 lbs/AConvert lbs to tons: 16,669 lb/A / 2,000 lb/T = 8.3 T sludge per acre

3
Traditional Remediation of Contaminated Soil
Once metals are introduced and contaminate the environment, they will remain. Metals do not degrade like carbon-based (organic) molecules. The only exceptions are mercury and selenium, which can be transformed and volatilized by microorganisms. However, in general it is very difficult to eliminate metals from the environment.
Traditional treatments for metal contamination in soils are expensive and cost prohibitive when large areas of soil are contaminated. Treatments can be done in situ (on-site), or ex situ (removed and treated off-site). Both are extremely expensive. Some treatments that are available include:
1. High temperature treatments (produce a vitrified, granular, non-leachablematerial).
2. Solidifying agents (produce cement-like material).3. Washing process (leaches out contaminants).
Management of Contaminated Soil
Soil and crop management methods can help prevent uptake of pollutants by plants, leaving them in the soil. The soil becomes the sink, breaking the soil-plant-animal or human cycle through which the toxin exerts its toxic effects (Brady and Weil, 1999).
The following management practices will not remove the heavy metal contaminants, but will help to immobilize them in the soil and reduce the potential for adverse effects from the metals – Note that the kind of metal (cation or anion) must be considered:
1. Increasing the soil pH to 6.5 or higher.
Cationic metals are more soluble at lower pH levels, so increasing the pHmakes them less available to plants and therefore less likely to be incorporatedin their tissues and ingested by humans. Raising pH has the opposite effect onanionic elements.
2. Draining wet soils.
Drainage improves soil aeration and will allow metals to oxidize, makingthem less soluble. Therefore when aerated, these metals are less available. Theopposite is true for chromium, which is more available in oxidized forms.Active organic matter is effective in reducing the availability of chromium.
3. Applying phosphate.
Heavy phosphate applications reduce the availability of cationic metals, buthave the opposite effect on anionic compounds like arsenic. Care should betaken with phosphorus applications because high levels of phosphorus in thesoil can result in water pollution.

4
4. Carefully selecting plants for use on metal-contaminated soils
Plants translocate larger quantities of metals to their leaves than to their fruitsor seeds. The greatest risk of food chain contamination is in leafy vegetableslike lettuce or spinach. Another hazard is forage eaten by livestock.
Plants for Environmental Cleanup
Research has demonstrated that plants are effective in cleaning up contaminated soil (Wenzel et al., 1999). Phytoremediation is a general term for using plants to remove, degrade, or contain soil pollutants such as heavy metals, pesticides, solvents, crude oil, polyaromatic hydrocarbons, and landfill leacheates For example, prairie grasses can stimulate breakdown of petroleum products. Wildflowers were recently used to degrade hydrocarbons from an oil spill in Kuwait. Hybrid poplars can remove ammunition compounds such as TNT as well as high nitrates and pesticides (Brady and Weil, 1999).
Plants for Treating Metal Contaminated Soils
Plants have been used to stabilize or remove metals from soil and water. The three mechanisms used are phytoextraction, rhizofiltration, and phytostabilization. This technical note will define rhizofiltration and phytostabilization but will focus on phytoextraction.
Rhizofiltration is the adsorption onto plant roots or absorption into plant roots of contaminants that are in solution surrounding the root zone (rhizosphere). Rhizofiltration is used to decontaminate groundwater. Plants are grown in greenhouses in water instead of soil. Contaminated water from the site is used to acclimate the plants to the environment. The plants are then planted on the site of contaminated ground water where the roots take up the water and contaminants. Once the roots are saturated with the contaminant, the plants are harvested including the roots. In Chernobyl, Ukraine, sunflowers were used in this way to remove radioactive contaminants from groundwater (EPA, 1998).
Phytostabilization is the use of perennial, non-harvested plants to stabilize or immobilize contaminants in the soil and groundwater. Metals are absorbed and accumulated by roots, adsorbed onto roots, or precipitated within the rhizosphere. Metal-tolerant plants can be used to restore vegetation where natural vegetation is lacking, thus reducing the risk of water and wind erosion and leaching. Phytostabilization reduces the mobility of the contaminant and prevents further movement of the contaminant into groundwater or the air and reduces the bioavailability for entry into the food chain.
Phytoextraction
Phytoextraction is the process of growing plants in metal contaminated soil . Plant roots then translocate the metals into aboveground portions of the plant. After plants have grown for some time, they are harvested and incinerated or composted to recycle the metals. Several crop growth cycles may be needed to decrease

5
contaminant levels to allowable limits. If the plants are incinerated, the ash must be disposed of in a hazardous waste landfill, but the volume of the ash is much smaller than the volume of contaminated soil if dug out and removed for treatment. (See box.)
Example of Disposal
Excavating and landfilling a 10-acre contaminated site to a depth of 1 foot requires handling roughly 20,000 tons of soil. Phytoextraction of the same site would result in the need to handle about 500 tons of biomass, which is about 1/40 of the mass of the contaminated soil. In this example, if we assume the soil was contaminated with a lead concentration of 400 ppm, six to eight crops would be needed, growing four crops per season (Phytotech, 2000).
Phytoextraction is done with plants called hyperaccumulators, which absorb unusually large amounts of metals in comparison to other plants. Hyperaccumulators contain more than 1,000 milligrams per kilogram of cobalt, copper, chromium, lead, or nickel; or 10,000 milligrams per kilogram (1 %) of manganese or zinc in dry matter (Baker and Brooks, 1989). One or more of these plant types are planted at a particular site based on the kinds of metals present and site conditions. Tables 2 and 3 demonstrate the importance of using hyperaccumulators.
Table 2. Percentage decrease in water-extractable zinc and cadmium in three soils after growth of Alpine pennycress (Thlaspi caerulescens) (McGrath, 1998). Site Sampled Zn Cd Farm 28 10Garden 17 22Mountain 64 70
Table 3. Removal of zinc in a hypothetical 4.5 T/A (dry matter) crop growing in soil contaminated with 1000 (ppm) zinc with a target of 50 ppm, showing the importance of hyperaccumulation (>10,000 ppm zinc) (McGrath, 1998).
ppm Zn Lbs. of Zn % of soil total years to target in plant removed in one crop 100 0.9 0.04 2470.0 1000 9 0.38 247.0 10,000 90 3.85 24.7 20,000 179 7.69 12.4 30,000 268 11.54 8.2
Phytoextraction is easiest with metals such as nickel, zinc, and copper because these metals are preferred by a majority of the 400 hyperaccumlator plants. Several plants in the genus Thlaspi (pennycress) have been known to take up more than 30,000 ppm (3%)of zinc in their tissues. These plants can be used as ore because of the high metal concentration (Brady and Weil, 1999).

6
Of all the metals, lead is the most common soil contaminant (EPA, 1993). Unfortunately, plants do not accumulate lead under natural conditions. A chelator such as EDTA (ethylenediaminetetraacetic acid) has to be added to the soil as an amendment. The EDTA makes the lead available to the plant. The most common plant used for lead extraction is Indian mustard (Brassisa juncea). Phytotech (a private research company) has reported that they have cleaned up lead-contaminated sites in New Jersey to below the industrial standards in 1 to 2 summers using Indian mustard (Wantanabe, 1997).
Plants are available to remove zinc, cadmium, lead, selenium, and nickel from soils at rates that are medium to long-term, but rapid enough to be useful. Many of the plants that hyperaccumulate metals produce low biomass, and need to be bred for much higher biomass production.
Current genetic engineering efforts at USDA in Beltsville, MD, are aimed toward developing pennycress (Thlaspi) that is extremely zinc tolerant. These taller-than-normal plants would have more biomass, thereby taking up larger quantities of contaminating metals (Watanabe, 1997).
Traditional cleanup in situ may cost between $10.00 and $100.00 per cubic meter (m3), whereas removal of contaminated material (ex situ) may cost as high $30.00 to $300/ m3. In comparison, phytoremediation may only cost $0.05/ m3 (Watanabe, 1997).
Future Prospects
Phytoremediation has been studied extensively in research and small-scale demonstrations, but in only a few full-scale applications. Phytoremediation is moving into the realm of commercialization (Watanabe, 1997). It is predicted that the phytoremediation market will reach $214 to $370 million by the year 2005 (Environmental Science & Technology, 1998).
Given the current effectiveness, phytoremediation is best suited for cleanup over a wide area in which contaminants are present at low to medium concentrations. Before phytoremediation is fully commercialized, further research is needed to assure that tissues of plants used for phytoremediation do not have adverse environmental effects if eaten by wildlife or used by humans for things such as mulch or firewood (EPA, 1998). Research is also needed to find more efficient bioaccumulators, hyperaccumulators that produce more biomass, and to further monitor current field trials to ensure a thorough understanding. There is the need for a commercialized smelting method to extract the metals from plant biomass so they can be recycled.
Phytoremediation is slower than traditional methods of removing heavy metals from soil but much less costly. Prevention of soil contamination is far less expensive than any kind of remediation and much better for the environment.

7
References
Baker, A.J.M., and R.R. Brooks. 1989. Terrestrial plants which hyperaccumulate metallic elements – a review of their distribution, ecology, and phytochemistry. Biorecovery 1:81:126.
Brady, N.C., and R.R. Weil. 1999. The nature and properties of soils. 12th ed. Prentice Hall. Upper Saddle River, NJ.
Environmental Science & Technology. 1998. Phytoremediation; forecasting. Environmental Science & Technology. Vol. 32, issue 17, p.399A.
McGrath, S.P. 1998. Phytoextraction for soil remediation. p. 261-287. In R. Brooks (ed.) Plants that hyperaccumulate heavy metals their role in phytoremediation, microbiology, archaeology, mineral exploration and phytomining. CAB International, New York, NY.
Phytotech. 2000. Phytoremediation technology. http://clu-in.org/PRODUCTS/SITE/ongoing/demoong/phytotec.htm
U.S. EPA. 1993. Clean Water Act, sec. 503, vol. 58, no. 32. (U.S. Environmental Protection Agency Washington, D.C.).
U.S. EPA. 1998. A citizen’s guide to phytoremediation. http://clu- in.org/PRODUCTS/CITGUIDE/Phyto2.htm
Watanabe, M.E. 1997. Phytoremediation on the brink of commercialization. Environmental Science & Technology/News. 31:182-186.
Wenzel, W.W., Adriano, D.C., Salt, D., and Smith, R. 1999. Phytoremediation: A plant-microbe based remediation system. p. 457-508. In D.C. Adriano et al. (ed.) Bioremediation of contaminated soils. American Society of Agronomy, Madison, WI.
Disclaimer Trade names are used solely to provide specific information. Mention of a trade name does not constitute a guarantee of the product by the U.S. Department of Agriculture nor does it imply endorsement by the Department or the Natural Resources Conservation Service over comparable products that are not named.
The U. S. Department of Agriculture (USDA) prohibits discrimination in all its programs and activities on the basis of race, color, national origin, sex, religion, age, disability, political beliefs, sexual orientation, or marital or family status. (Not all prohibited bases apply to all programs.) Persons with disabilities who require alternative means for communications of program information (Braille, large print, audiotape, etc.) should contact USDA’s TARGET Center at (202) 720-2600 (voice and TDD).
To file a complaint of discrimination, write USDA, Director, Office of Civil Rights, Room 326W, Whitten Building, 14th and Independence Avenue, SW, Washington, DC 20250-9410 or call (202) 720-5964 (voice and TDD). USDA is an equal opportunity provider and employer.

Animal Manures for Increasing Organic Matter and Supplying Nutrients The quickest way to rebuild a poor soil is to practice dairy farming, growing forage crops, buying . . .grain rich in protein, handling the manure properly, and returning it to the soil promptly.
—J. L. HILLS, C. H. JONES, AND C. CUTLER, 1908
Once cheap fertilizers became widely available after World War II, many farmers, extension agents, and scientists looked down their noses at manure. People thought more about how to get rid of manure than how to put it to good use. In fact, some scientists tried to find out the absolute maximum amount of manure that could be applied to an acre without reducing crop yields. Some farmers who didn’t want to spread manure actually piled it next to a stream and hoped that next spring’s flood waters would wash it away. We now know that manure, like money, is better spread around than concentrated in a few places. The economic contribution of farm manures can be considerable. On a national basis, the manure from 100 million cattle, 60 million hogs, and 9 billion chickens contains about 23 million tons of nitrogen. At a value of 50 cents per pound, that works out to a value of about $25 billion for just the N contained in animal manures. The value of the nutrients in manure from a 100-cow dairy farm may exceed $20,000 per year; manure from a 100-sow farrow-to-finish operation is worth about $16,000; and manure from a 20,000bird broiler operation is worth about $6,000. The other benefits to soil organic matter buildup, such as enhanced soil structure and better diversity and activity of soil organisms, may double the value of the manure. If you’re not getting the full fertility benefit from manures on your farm, you may be wasting money.
Animal manures can have very different properties, depending on the animal species, feed, bedding, handling, and manure-storage practices. The amounts of nutrients in the manure that become available to crops also depend on what time of year the manure is applied and how quickly it is worked into the soil. In addition, the influence of manure on soil organic matter and plant growth is influenced by soil type. In other words, it’s impossible to give blanket manure application recommendations. They need to be tailored for every situation.
We’ll start the discussion with dairy cow manure but will also offer information about the handling, characteristics, and uses of some other animal manures.
Manure Handling Systems Solid versus Liquid
The type of barn on the farmstead frequently determines how manure is handled on a dairy farm. Dairy-cow manure containing a fair amount of bedding, usually around 20% dry matter or higher, is spread as a solid. This is most common on farms where cows are kept in individual stanchions or tie-stalls. Liquid manure-handling systems are common where animals are kept in a “free stall” barn and minimal bedding is added to the manure. Liquid manure is usually in the range of from 2% to 12% dry matter (88% or more water), with the lower dry matter if water is flushed from alleys and passed through a liquid-solid separator

or large amounts of runoff enter the storage lagoon. Manures with characteristics between solid and liquid, with dry matter between 12% and 20%, are usually referred to as semisolid.
Composting manures is becoming an increasingly popular option for farmers. By composting manure, you help stabilize nutrients (although considerable ammonium is usually lost in the process), have a smaller amount of material to spread, and have a more pleasant material to spread—a big plus if neighbors have complained about manure odors. Although it’s easier to compost manure that has been handled as a solid, it does take a lot of bedding to get fresh manure to a 20% solid level. Some farmers are separating the solids from liquid manure and then irrigating with the liquid and composting the solids. Some are separating solids following digestion for methane production and burning the gas to produce electricity or heat. Separating the liquid allows for direct composting of the solids without any added materials. It also allows for easier transport of the solid portion of the manure for sale or to apply to remote fields. For a more detailed discussion of composting, see chapter 13.
Some dairy farmers have built what are called “compost barns.” No, the barns don’t compost, but they are set up similar to a free-stall barn, where bedding and manure just build up over the winter and the pack is cleaned out in the fall or spring. However, with composting barns, the manure is stirred or turned twice daily with a modified cultivator on a skid steer loader or small tractor to a depth of 8 to 10 inches; sometimes ceiling fans are used to help aerate and dry the pack during each milking. Some farmers add a little new bedding each day, some do it weekly, and others do it every two to five weeks. In the spring and fall some or all of the bedding can be removed and spread directly or built into a traditional compost pile for finishing. Although farmers using this system tend to be satisfied with it, there is a concern about the continued availability of wood shavings and sawdust for bedding. More recently, vermicomposting has been introduced as a way to process dairy manure. In this case, worms digest the manure, and the castings provide a high-quality soil amendment.
Manure from hogs can also be handled in different ways. Farmers raising hogs on a relatively small scale sometimes use hoop houses, frequently placed in fields, with bedding on the floor. The manure mixed with bedding can be spread as a solid manure or composted first. The larger, more industrial-scale farmers mainly use little to no bedding with slatted floors over the manure pit and keep the animals clean by frequently washing the floors. The liquid manure is held in ponds for spreading, mostly in the spring before crops are planted and in the fall after crops have been harvested. Poultry manure is handled with bedding (especially for broiler production) or little to no bedding (industrial-scale egg production).
Storage of Manure
Researchers have been investigating how best to handle, store, and treat manure to reduce the problems that come with year-round manure spreading. Storage allows the farmer the opportunity to apply manure when it’s best for the crop and during appropriate weather conditions. This reduces nutrient loss from the manure, caused by water runoff from the field. However, significant losses of nutrients from stored manure also may occur. One study found that during the year dairy manure stored in uncovered piles lost 3% of the solids, 10% of the nitrogen, 3% of the phosphorus, and 20% of the potassium. Covered piles or well-contained bottom-loading liquid systems, which tend to form a crust on the surface, do a better job of conserving the nutrients and solids than unprotected piles. Poultry manure, with its high amount of ammonium, may lose 50% of its nitrogen during storage as ammonia gas volatilizes, unless precautions are

taken to conserve nitrogen. Regardless of storage method, it is important to understand how potential losses occur in order to select a storage method and location that minimize environmental impact.
Chemical Characteristics of Manures A high percentage of the nutrients in feeds passes right through animals and ends up in their manure. Depending on the ration and animal type, over 70% of the nitrogen, 60% of the phosphorus, and 80% of the potassium fed may pass through the animal as manure. These nutrients are available for recycling on cropland. In addition to the nitrogen, phosphorus, and potassium contributions given in table 12.1, manures
contain significant amounts of other nutrients, such as calcium, magnesium, and sulfur. For example, in regions that tend to lack the micronutrient zinc, there is rarely any crop deficiency found on soils receiving regular manure applications.
The values given in table 12.1 must be viewed with some caution, because the characteristics of manures from even the same type of animal may vary considerably from one farm to another. Differences in feeds, mineral supplements, bedding materials, and storage systems make manure

analyses quite variable. Yet as long as feeding, bedding, and storage practices remain relatively stable on a given farm, manure nutrient characteristics will tend to be similar from year to year. However, year-to-year differences in rainfall can affect stored manure through more or less dilution.
The major difference among all the manures is that poultry manure is significantly higher in nitrogen and phosphorus than the other manure types. This is partly due to the difference in feeds given poultry versus other farm animals. The relatively high percentage of dry matter in poultry manure is also partly responsible for the higher analyses of certain nutrients when expressed on a wet ton basis.
It is possible to take the guesswork out of estimating manure characteristics; most soil-testing laboratories will also analyze manure. Manure analysis should become a routine part of the soil fertility management program on animal-based farms. This is of critical importance for routine manure use. For example, while the average liquid dairy manure is around 25 pounds of N per 1,000 gallons, there are manures that might be 10 pounds N or less OR 40 pounds N or more per 1,000 gallons. Recent research efforts have focused on more efficient use of nutrients in dairy cows, and N and P intake can often be reduced by up to 25% without losses in productivity. This helps reduce nutrient surpluses on farms using only needed P.
Effects of Manuring on Soils Effects on Organic Matter
When considering the influence of any residue or organic material on soil organic matter, the key question is how much solids are returned to the soil. Equal amounts of different types of manures will have different effects on soil organic matter levels. Dairy and beef manures contain undigested parts of forages and may have significant quantities of bedding. They therefore have a high amount of complex substances, such as lignin, that do not decompose readily in soils. Using this type of manure results in a much greater long-term influence on soil organic matter than does a poultry or swine manure without bedding. More solids are commonly applied to soil with solid-manure-handling systems than with liquid systems, because greater amounts of bedding are usually included. A number of trends in dairy farming mean that manures may have less organic material than in the past. One is the use of sand as bedding material in free-stall barns, much of which is recovered and reused. The other is the separation of solids and liquids with the sale of solids or the use of digested solids as bedding. Under both situations much less organic solids are returned to fields. On the other hand, the bedded pack (or compost barn) does produce a manure that is high in organic solid content.
When conventional tillage is used to grow a crop such as corn silage, whose entire aboveground portion is harvested, research indicates that an annual application of 20 to 30 tons of the solid type of dairy manure per acre is needed to maintain soil organic matter (table 12.2). As discussed above, a nitrogen-demanding
FORMS OF NITROGEN IN MANURES
Nitrogen in manure occurs in three main forms: ammonium (NH4+), urea (a soluble organic form, easily converted to ammonium), and solid, organic N. Ammonium is readily available to plants, and urea is quickly converted to ammonium in soils. However, while readily available when incorporated in soil, both ammonium and urea are subject to loss as ammonia gas when left on the surface under drying conditions— with significant losses occurring within hours of applying to the soil surface. Some manures may have half or three-quarters of their N in readily available forms, while others may have 20% or less in these forms. Manure analysis reports usually contain both ammonium and total N (the difference is mainly organic N), thus indicating how much of the N is readily available—but also subject to loss if not handled carefully.

crop, such as corn, may be able to use all of the nitrogen in 20 to 30 tons of manure. If more residues are returned to the soil by just harvesting grain, lower rates of manure application will be sufficient to maintain or build up soil organic matter.
The Influence of Manure on Many Soil Properties
The application of manures causes many soil changes—biological, chemical, and physical. A few of these types of changes are indicated in table 12.2, which contains the results of a long-term experiment in Vermont with continuous corn silage on a clay soil. Manure counteracted many of the negative effects of a monoculture cropping system in which few residues are returned to the soil. Soil receiving 20 tons of dairy manure annually (wet weight, including bedding—equivalent to approximately 8,000 pounds of solids) maintained organic matter and CEC levels and close to the original pH (although acid-forming nitrogen fertilizers also were used). Manures, such as from dairy and poultry, have liming effects and actually counteract acidification. (Note: If instead of the solid manure, liquid had been used to supply N and other nutrients for the crop, there would not have been anywhere near as large a beneficial effect on soil organic matter, CEC, and pore space.)
High rates of manure addition caused a buildup of both phosphorus and potassium to high levels. Soil in plots receiving manures were better aggregated and less dense and, therefore, had greater amounts of pore space than fields receiving no manure.

An example of how a manure addition might balance annual loss is given in figure 12.1. One Holstein “cow year” worth of manure is about 20 tons. Although 20 tons of anything is a lot, when considering dairy manure, it translates into a much smaller amount of solids. If the approximately 5,200 pounds of solid material in the 20 tons is applied over the surface of one acre and mixed with the 2 million pounds of soil present to a 6-inch depth, it would raise the soil organic matter by about 0.3%. However, much of the manure will decompose during the year, so the net effect on soil organic matter will be even less. Let’s assume that 75% of the solid matter decomposes during the first year, and the carbon ends up as atmospheric CO2. At the beginning of the following year, only 25% of the original 5,200 pounds, or 1,300 pounds of organic matter, is added to the soil. The net effect is an increase in soil organic matter of 0.065% (the calculation is [1,300/2,000,000] x 100). Although this does not seem like much added organic matter, if a soil had 2.17% organic matter and 3% of that was decomposed annually during cropping, the loss would be 0.065% per year, and the manure addition would just balance that loss. Manures with lower amounts of bedding, although helping maintain organic matter and adding to the active (“dead”) portion, will not have as great an effect as manures containing a lot of bedding material.
Using Manures Manures, like other organic residues that decompose easily and rapidly release nutrients, are usually applied to soils in quantities judged to supply sufficient nitrogen for the crop being grown in the current year. It might be better for building and maintaining soil organic matter to apply manure at higher rates, but doing so may cause undesirable nitrate accumulation in leafy crops and excess nitrate leaching to groundwater. High nitrate levels in leafy vegetable crops are undesirable in terms of human health, and the leaves of many plants with high N seem more attractive to insects. In addition, salt damage to crop plants can occur from high manure application rates, especially when there is insufficient leaching by rainfall or irrigation. Very high amounts of added manures, over a period of years, also lead to high soil phosphorus levels (table 12.2). It is a waste of money and resources to add unneeded nutrients to the soil, nutrients that will only be lost by leaching or runoff instead of contributing to crop nutrition.
Application Rates
A common per-acre rate of dairy-manure application is 10 to 30 tons fresh weight of solid, or 4,000 to 11,000 gallons of liquid, manure. These rates will supply approximately 50 to 150 pounds of available nitrogen (not total) per acre, assuming that the solid manure is not too high in straw or sawdust and actually ties up soil nitrogen for a while. If you are growing crops that don’t need that much nitrogen, such as small grains, 10 to 15 tons (around 4,000 to 6,000 gallons) of solid manure should supply sufficient nitrogen per acre. For a crop that needs a lot of nitrogen, such as corn, 20 to 30 tons (around 8,000 to 12,000 gallons) per acre may be necessary to supply its nitrogen needs. Low rates of about 10 tons (around 4,000 gallons) per acre are also suggested for each of the multiple applications used on a grass hay crop. In total, grass
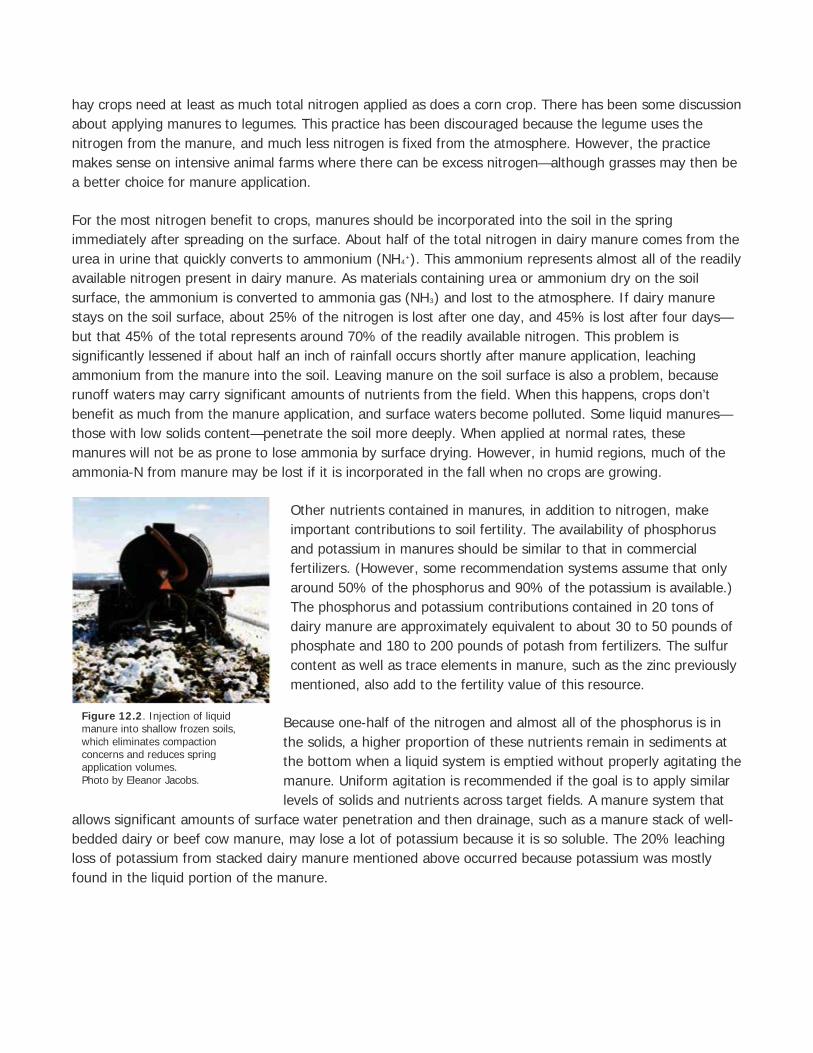
hay crops need at least as much total nitrogen applied as does a corn crop. There has been some discussion about applying manures to legumes. This practice has been discouraged because the legume uses the nitrogen from the manure, and much less nitrogen is fixed from the atmosphere. However, the practice makes sense on intensive animal farms where there can be excess nitrogen—although grasses may then be a better choice for manure application.
For the most nitrogen benefit to crops, manures should be incorporated into the soil in the spring immediately after spreading on the surface. About half of the total nitrogen in dairy manure comes from the urea in urine that quickly converts to ammonium (NH4
+). This ammonium represents almost all of the readily available nitrogen present in dairy manure. As materials containing urea or ammonium dry on the soil surface, the ammonium is converted to ammonia gas (NH3) and lost to the atmosphere. If dairy manure stays on the soil surface, about 25% of the nitrogen is lost after one day, and 45% is lost after four days—but that 45% of the total represents around 70% of the readily available nitrogen. This problem is significantly lessened if about half an inch of rainfall occurs shortly after manure application, leaching ammonium from the manure into the soil. Leaving manure on the soil surface is also a problem, because runoff waters may carry significant amounts of nutrients from the field. When this happens, crops don’t benefit as much from the manure application, and surface waters become polluted. Some liquid manures— those with low solids content—penetrate the soil more deeply. When applied at normal rates, these manures will not be as prone to lose ammonia by surface drying. However, in humid regions, much of the ammonia-N from manure may be lost if it is incorporated in the fall when no crops are growing.
Other nutrients contained in manures, in addition to nitrogen, make important contributions to soil fertility. The availability of phosphorus and potassium in manures should be similar to that in commercial fertilizers. (However, some recommendation systems assume that only around 50% of the phosphorus and 90% of the potassium is available.) The phosphorus and potassium contributions contained in 20 tons of dairy manure are approximately equivalent to about 30 to 50 pounds of phosphate and 180 to 200 pounds of potash from fertilizers. The sulfur content as well as trace elements in manure, such as the zinc previously mentioned, also add to the fertility value of this resource.
Because one-half of the nitrogen and almost all of the phosphorus is in the solids, a higher proportion of these nutrients remain in sediments at the bottom when a liquid system is emptied without properly agitating the manure. Uniform agitation is recommended if the goal is to apply similar levels of solids and nutrients across target fields. A manure system that
allows significant amounts of surface water penetration and then drainage, such as a manure stack of well-bedded dairy or beef cow manure, may lose a lot of potassium because it is so soluble. The 20% leaching loss of potassium from stacked dairy manure mentioned above occurred because potassium was mostly found in the liquid portion of the manure.
Figure 12.2. Injection of liquid manure into shallow frozen soils, which eliminates compaction concerns and reduces spring application volumes. Photo by Eleanor Jacobs.

Timing of Applications
Manures are best applied to annual crops, such as corn, small grains, and vegetables, in one dose just before soil tillage (unless a high amount of bedding is used, which might tie up nitrogen for a while—see the discussion of C:N ratios in chapter 9). This allows for rapid incorporation by plow, chisel, harrow, disk, or aerator. Even with reduced tillage systems, application close to planting time is best, because the possibility of loss by runoff and erosion is reduced. It also is possible to inject liquid manures either just before the growing season starts or as a side-dressing to row crops. Fall manure applications on annual row crops, such as corn, may result in considerable nitrogen loss, even if manure is incorporated. Losses of nitrogen from fall-applied manure in humid climates may be as much as 25% to 50%—resulting from conversion of ammonium to nitrate and then leaching and denitrification before nitrogen is available to next year’s crop. It was determined in modeling studies that fall applications of liquid manure posed the greatest risk for nitrate leaching in a dairy system in New York.
Without any added nitrogen, perennial grass hay crops are constantly nitrogen deficient. Application of a moderate rate of manure—about 50–75 pounds worth of available nitrogen—in early spring and following each harvest is the best way to apply manure. Spring applications may be at higher rates, but wet soils in early spring may not allow manure application without causing significant compaction.
Although the best use of manure is to apply it near the time when the crop needs the nutrients, sometimes time and labor management or insufficient storage capacity causes farmers to apply it at other times. In the fall, manure can be applied to grasslands that don’t flood or to tilled fields that will either be fall-plowed or planted to a winter cover crop. Although legal in most states, it is not a good practice to apply manures when the ground is frozen or covered with snow. The nutrient losses that can occur with runoff from winter-applied manure are both an economic loss to the farm and an environmental concern. Ideally, winter surface applications of manure would be done only on an emergency basis. However, research on frost tillage has shown that there are windows of opportunity for incorporating and injecting winter-applied manure during periods when the soil has a shallow frozen layer, 2 to 4 inches thick (see chapter 16). Farmers in cold climates may use those time periods to inject manure during the winter (figure 12.2), although the windows of opportunity may be limited.
Potential Problems As we all know, too much of a good thing is not necessarily good. Excessive manure applications may cause plant-growth problems. It is especially important not to apply excess poultry manure, because the high soluble salt content can harm plants.
Plant growth is sometimes retarded when high rates of fresh manure are applied to soil immediately before planting. This problem usually doesn’t occur if the fresh manure decomposes for a few weeks in the soil and can be avoided by using a solid manure that has been stored for a year or more. Injection of liquid manure sometimes causes problems when used on poorly drained soils in wet years. The extra water applied and the extra use of oxygen by microorganisms may mean less aeration for plant roots, and loss of readily plant-available nitrate by denitrification may also be occurring.

When manures are applied regularly to a field to provide enough nitrogen for a crop like corn, phosphorus and potassium may build up to levels way in excess of crop needs (see table 12.2). When ammonium is properly conserved, the manure rate necessary to meet crop nitrogen requirement is substantially reduced. Correspondingly, phosphorus and potassium applications are moderated, reducing or eliminating the accumulation of these nutrients in soil.
When manure is applied based upon needed or allowed P additions, as required by some nutrient management plans, N-conserving management means that less fertilizer N will be needed. Erosion of phosphorus-rich topsoils contributes sediments and phosphorus to streams and lakes, polluting surface waters. When very high phosphorus buildup occurs from the continual application of manure at rates to satisfy crop nitrogen needs, it may be wise to switch the application to other fields or to use strict soil conservation practices to trap sediments before they enter a stream. Including rotation crops, such as alfalfa—that do not need manure for N—allows a “draw-down” of phosphorus that accumulates from manure application to grains. (However, this may mean finding another location to apply manure. For a more detailed discussion of nitrogen and phosphorus management, see chapter 19.)
Farmers that purchase much of their animal feed may have too much manure to safely use all the nutrients on their own land. Although they don’t usually realize it, they are importing large quantities of nutrients in the feed that remain on the farm as manures. If they apply all these nutrients on a small area of land, nitrogen and phosphorus pollution of groundwater and surface water is much more likely. It is a good idea to make arrangements with neighbors for use of the excess manure. Another option, if local outlets are available, is to compost the manure (see chapter 13) and sell the product to vegetable farmers, garden centers, landscapers, and directly to home gardeners.
Poultry and hogs are routinely fed metals such as copper and arsenic that appear to stimulate animal growth. However, most of the metals end up in the manure. In addition, dairy farmers using liquid manure systems commonly dump the used copper sulfate solutions that animals walk through to protect foot health into the manure pit. The copper content of average liquid dairy manures in Vermont increased about fivefold between 1992 and the early 2000s—from about 60 to over 300 ppm on a dry matter basis—as more farmers used copper sulfate footbaths for their animals and disposed of the waste in the liquid manure. Although there are few reports of metal toxicity to either plants or animals from the use of animal manures,
E. COLI 0157:H7
The bacteria strain known as E. coli 0157: H7 has caused numerous outbreaks of severe illness in people who ate contaminated meat and a few known outbreaks from eating vegetables—once when water used to wash lettuce was contaminated with animal manure and once from spinach grown near a cattle farm. This particular bacteria is a resident of cows’ digestive systems. It does no harm to the cow, but—probably because of the customary practice of feeding low levels of antibiotics when raising cattle—it is resistant to a number of commonly used antibiotics for humans. This problem only reinforces the commonsense approach to manure use. When using manure that has not been thoroughly composted to grow crops for direct human consumption—especially leafy crops like lettuce that grow low to the ground and root crops such as carrots and potatoes— special care should be taken. Before planting your crop, avoid problems by planning a three-month period between incorporation and harvest. For short-season crops, this means that the manure should be incorporated long before planting. Although there has never been a confirmed instance of contamination of vegetables by E. coli 0157: H7 or other disease organisms from manure incorporated into the soil as a fertility amendment, being cautious and erring on the side of safety is well justified.

if large quantities of high-metal-content manure are applied over the years, soil testing should be used to track the buildup.
Another potential issue is the finding that plants can take up antibiotics from manure applied to soil. About 70% of the antibiotics used in animal agriculture ends up in the manure. Although the amounts of antibiotics taken up by plants are small, this is an issue that may be of concern when using manures from concentrated animal production facilities that use considerable amounts of these substances.
Summary and Sources Summary
Animal manures can be very useful sources of amendments for building healthy soils. They are high in nutrients needed by plants and, depending on the species and the amount of bedding used, may help build and maintain soil organic matter levels. Because of the wide variability of the characteristics of manures, even from the same species—depending on feeding, bedding, and manure handling practices—it is important to analyze manures to more accurately judge the needed application rates. When using manures, it is important to keep in mind the potential limitations—pathogen contamination of crops for direct human consumption; accumulations of potentially toxic metals from high application of certain manures; and overloading the soil with N or P by applying rates that are in excess of needs, as demonstrated by soil test and known crop uptake.
Sources
Cimitile, M. 2009. Crops absorb livestock antibiotics, science shows. Environmental Health News. http://www.environmentalhealthnews.org/ehs/news/antibiotics-in-crops.
Elliott, L.F., and F.J. Stevenson, eds. 1977. Soils for Management of Organic Wastes and Waste-waters. Madison, WI: Soil Science Society of America.
Endres, M.I., and K.A. Janni. Undated. Compost Bedded Pack Barns for Dairy Cows. http://www.extension.umn.edu/agriculture/dairy/facilities/compost-bedded-pack-barns/.
Harrison, E., J. Bonhotal, and M. Schwarz. 2008. Using Manure Solids as Bedding. Report prepared by the Cornell Waste Management Institute (Ithaca, NY) for the New York State Energy Research and Development Authority.
Madison, F., K. Kelling, J. Peterson, T. Daniel, G. Jackson, and L. Massie. 1986. Guidelines for Applying Manure to Pasture and Cropland in Wisconsin. Agricultural Bulletin A3392. Madison, WI.
Magdoff, F.R., and J.F. Amadon. 1980. Yield trends and soil chemical changes resulting from N and manure application to continuous corn. Agronomy Journal 72: 161–164. See this reference for dairy manure needed to maintain or increase organic matter and soil chemical changes under continuous cropping for silage corn.

Magdoff, F.R., J.F. Amadon, S.P. Goldberg, and G.D. Wells. 1977. Runoff from a low-cost manure storage facility. Transactions of the American Society of Agricultural Engineers 20: 658–660, 665. This is the reference for the nutrient loss that can occur from uncovered manure stacks.
Magdoff, F.R., and R.J. Villamil, Jr. 1977. The Potential of Champlain Valley Clay Soils for Waste Disposal. Proceedings of the Lake Champlain Environmental Conference, Chazy, NY, July 15, 1976.
Maryland State Soil Conservation Committee. Undated. Manure Management Handbook: A Producer’s Guide. College Park, MD: Author.
Ontario Ministry of Agriculture and Food. 1994. Livestock and Poultry Waste Management. Best Management Practices Series. Available from the Ontario Federation of Agriculture, Toronto, Ontario, Canada.
Ontario Ministry of Agriculture and Food. 1997. Nutrient Management. Best Management Practices Series. Available from the Ontario Federation of Agriculture, Toronto, Ontario, Canada.
Pimentel, D., S. Williamson, C.E. Alexander, O. Gonzalez-Pagan, C. Kontak, and S.E. Mulkey. 2008. Reducing energy inputs in the US food system. Human Ecology 36: 459–471.
Soil Conservation Society of America. 1976. Land Application of Waste Materials. Ankeny, IA: Author.
van Es, H.M., A.T. DeGaetano, and D.S. Wilks. 1998. Space-time upscaling of plot-based research information: Frost tillage. Nutrient Cycling in Agroecosystems 50: 85–90.
A Case Study: Darrell Parks Manhattan, Kansas
Even if Darrell Parks didn’t like working with hogs, he would still raise them on his 600-acre farm in the Flint Hills of Kansas, if only for the manure that makes up a key part of his soil fertility program. Each year, Parks’s farm produces forty-five sows plus corn, milo, wheat, soybeans, and alfalfa.
Parks spot-treats his land with hog manure to help areas needing extra fertility. He likes how targeting problem areas with thicker applications of manure corrects soil micronutrient deficiencies. “I’ve been working to better utilize farm-produced manure and cover crops as well as a crop rotation and management system that will allow me to eliminate purchased fertilizer, herbicides, and insecticides,” says Parks, who received a grant from USDA’s Sustainable Agriculture Research and Education (SARE) program to hone his use of manure on cropland. He was successful in that endeavor, and his cropland has been certified organic since 1996.
Parks’s crops are raised mainly in two rotations. In one rotation, alfalfa is grown for three years, followed by a year each of corn and soybeans before returning to alfalfa. In the other, he plants Austrian winter peas in

the late fall following wheat harvest. The peas, incorporated in the spring, are followed with a cash crop of milo or soybeans prior to a fallor spring-planted wheat crop.
To ensure a sufficient nutrient supply for his wheat crops, Parks typically treats his wheat fields with liquid manure at a rate of approximately 660 gallons per acre. He collects this manure in a concrete pit adjacent to a building where sows are housed for brief periods during breeding or when being sold. The liquid manure, for which he does not typically obtain a nutrient analysis, “catches a lot of rainfall and is fairly dilute—[essentially] high-powered water,” he says. “I avoid wet conditions when spreading and try to hit the wheat in March or April during a dry period on a still day, before [the wheat] is too big.”
Parks sometimes lets older sows out to pasture on some of his fields, where they spread their own manure. He cautions, however, against pasturing young pigs on alfalfa. “You’d think they’d balance their ration better,” he says, “but they don’t—they overeat.”
For most of their lives, Parks’s hogs are raised on half of a 10-acre field. He plants the remaining 5 acres to corn. Once the corn is harvested, he moves the hogs and their pens over to the “clean ground” of corn stubble. “Going back and forth like this seems to work well in keeping the worms down,” he says. And he says that the 50–60 pounds of N per acre put down with the hogs’ manure helps grow “some pretty good corn” in that field each year.
Parks notes that his tillage regime, on which he is dependent for weed control in his organic system, makes maintaining and improving his soil organic matter content especially challenging. That’s why he remains committed to integrating the use of both animal and “green” manures on his farm.
In response to organic grain and fuel price spikes, he decided recently to reduce the number of hogs he raises from sixty to forty-five. Striving for economic sustainability, he is constantly weighing the pros and cons of becoming more selfsufficient by raising his own feed for the hogs versus taking advantage of the price premiums for organic grains.
“It’s a hard decision,” he says. “Right now, if I cut down on hogs, maybe it would be better economically. But if I get out [of raising hogs entirely], it’s not easy to get back in.”
For now, he is betting that over the longer term, he’s better off keeping his hogs. “A lot of people don’t like the idea of how pigs are raised” within a conventional operation, he says. “We’re meeting [the demand of] a niche market in its infancy that is sure to grow.”
—UPDATED BY AMY KREMEN

1
Soil Test Interpretations and Recommendation Guide
Commercial Fruits, Vegetables and Turf
Manjula Nathan Director, MU Soil and Plant Testing Lab
John Stecker MU Soil and Plant Testing Lab
Other Contributors
Erik Erwin John Dunn
Michele Warmund David Trinklein
Ray Rothenberger Peter Schraf Teresa Lee
College of Agriculture, Food, and Natural Resources University of Missouri Extension
October 1999

2
Introduction This bulletin presents nutrient management information for commercial fruit and vegetable growers, and an
explanation of fertilizer recommendations that accompany soil test results that are analyzed by the University of
Missouri Soil and Plant Testing Laboratory. On the last two pages of this bulletin are copies of the Soil Sample
Information Form for Commercial Fruits, Vegetable and Turf (MP 727) used by the Soil Testing Laboratory.
Those growers who wish to have soils analyzed for commercial fruits, vegetables and turf should submit samples
with these forms. The forms can be obtained from County Extension Offices or the Soil Testing Laboratories in
Columbia or Portageville. Proper submission of samples of the requested information will result in a better
fertilizer recommendation and interpretation of the soil test results.
The nutrition of fruits and vegetables is a very important aspect of their production. Adequate nutrition is
required not only for optimum yield, but also for optimum quality. In general, production practices that lead to the
greatest yield are associated with the best quality. Proper fertilization for many fruit crops requires a balance
between vegetative and fruit growth. Proper fertilization also promotes uniform crop growth and maturity, which
are important at harvest.
With the exception of carbon, hydrogen and oxygen, plant nutrients are primarily supplied to plants by the soil.
Fertilizers, manure and amendments are often applied to soils to supplement nutrients supplied by the soil.
Responsible nutrient management considers first a soil's ability to supply plants with essential nutrients. Soil
testing is a nutrient management strategy grounded in research that measures essential plant nutrients in the soil
and relates the amounts to crop needs. Fertilizer and amendment recommendations are based on soil tests, soil
type, crop yield, crop age (for some perennial crops) and past crop management. By eliminating the guesswork of
providing nutrients, the efficiency of supplying nutrients to crops can be increased. Thus growers may benefit from
lesser costs and better yields. Also lesser amounts of nutrients are less likely to contribute to non-point source
pollution such as phosphorus contamination of surface water or nitrates leaching into groundwater.
Soil Sampling Collecting a soil sample is a very important part of soil testing. The soil sample must be representative of the
area or field to be sampled. Otherwise, interpretations and recommendations based on the results could be
misleading, inaccurate and potentially counterproductive. Errors in collecting a representative sample may be made
in choosing the area to sample or in the collection of the sample itself.
Individual samples should be taken from areas that will be managed the same and have similar properties which
could affect soil test values. Topography, slope, soil texture, drainage, topsoil color, previous fertilizer, lime and
manure applications, and cropping history all are factors to consider when selecting an area to sample. A soil
survey map may be helpful for determining areas with similar soil properties. Twenty acres may be represented by
one sample for uniform or level fields, but for non-uniform areas one sample should represent only 5 acres. When
specific crops are grown on small acreages, an even smaller area may be sampled.
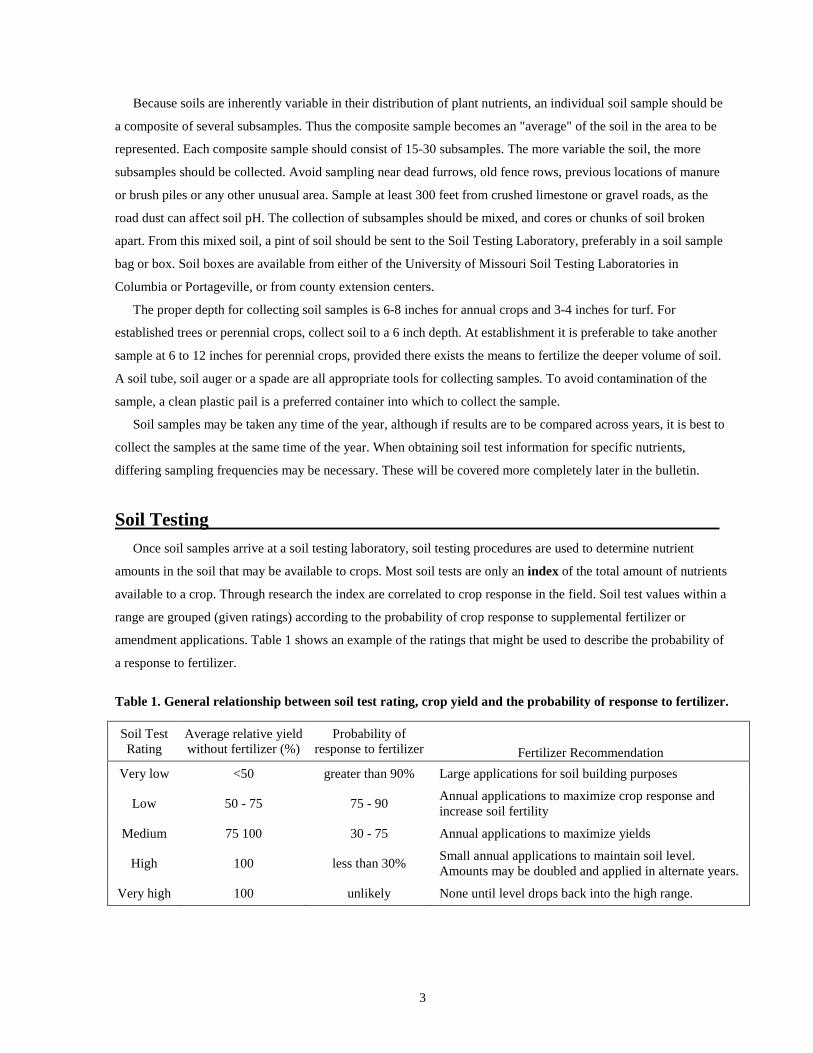
3
Because soils are inherently variable in their distribution of plant nutrients, an individual soil sample should be
a composite of several subsamples. Thus the composite sample becomes an "average" of the soil in the area to be
represented. Each composite sample should consist of 15-30 subsamples. The more variable the soil, the more
subsamples should be collected. Avoid sampling near dead furrows, old fence rows, previous locations of manure
or brush piles or any other unusual area. Sample at least 300 feet from crushed limestone or gravel roads, as the
road dust can affect soil pH. The collection of subsamples should be mixed, and cores or chunks of soil broken
apart. From this mixed soil, a pint of soil should be sent to the Soil Testing Laboratory, preferably in a soil sample
bag or box. Soil boxes are available from either of the University of Missouri Soil Testing Laboratories in
Columbia or Portageville, or from county extension centers.
The proper depth for collecting soil samples is 6-8 inches for annual crops and 3-4 inches for turf. For
established trees or perennial crops, collect soil to a 6 inch depth. At establishment it is preferable to take another
sample at 6 to 12 inches for perennial crops, provided there exists the means to fertilize the deeper volume of soil.
A soil tube, soil auger or a spade are all appropriate tools for collecting samples. To avoid contamination of the
sample, a clean plastic pail is a preferred container into which to collect the sample.
Soil samples may be taken any time of the year, although if results are to be compared across years, it is best to
collect the samples at the same time of the year. When obtaining soil test information for specific nutrients,
differing sampling frequencies may be necessary. These will be covered more completely later in the bulletin.
Soil Testing Once soil samples arrive at a soil testing laboratory, soil testing procedures are used to determine nutrient
amounts in the soil that may be available to crops. Most soil tests are only an index of the total amount of nutrients
available to a crop. Through research the index are correlated to crop response in the field. Soil test values within a
range are grouped (given ratings) according to the probability of crop response to supplemental fertilizer or
amendment applications. Table 1 shows an example of the ratings that might be used to describe the probability of
a response to fertilizer.
Table 1. General relationship between soil test rating, crop yield and the probability of response to fertilizer.
Soil Test Rating
Average relative yield without fertilizer (%)
Probability of response to fertilizer Fertilizer Recommendation
Very low <50 greater than 90% Large applications for soil building purposes
Low 50 - 75 75 - 90 Annual applications to maximize crop response and increase soil fertility
Medium 75 100 30 - 75 Annual applications to maximize yields
High 100 less than 30% Small annual applications to maintain soil level. Amounts may be doubled and applied in alternate years.
Very high 100 unlikely None until level drops back into the high range.

4
Several soil test nutrient values are reported in lb/acre. Unfortunately, this sometimes results in the incorrect
interpretation that soil test values can be directly related to recommended amounts of fertilizer in lb/acre. For
example it would be incorrect to conclude that a soil with a soil test value of 10 lb P/acre would require 35 lb
P/acre to bring the soil “up to test” to a high rating of 45 lb P/acre.
A listing of the soil test procedures used by the Soil Testing Laboratories is provided below. The first eight
listed are provided with a regular soil test analysis.
1. Soil pHs (1:1 solution:soil suspension). Solution is 0.01M CaCl2
2. Lime requirement (Neutralizable Acidity) Uses the Woodruff Buffer Solution
3. Organic Matter (%) Loss on ignition
4. Extractable Phosphorus (Bray-1 P)
5. Exchangeable Potassium (Ammonium Acetate (NH4OAc) extraction)
6. Exchangeable Calcium (NH4OAc extraction)
7. Exchangeable Magnesium (NH4OAc extraction)
8. Cation Exchange Capacity (estimated from Exchangeable K, Ca, Mg, and Neutralizable Acidity)
9. Extractable Zinc (DPTA extraction)
10. Extractable Sulfur (calcium phosphate in acetic acid extraction)
11. Extractable iron, manganese and copper (DPTA extraction)
12. Exchangeable Sodium (NH4OAc extraction)
13. Hot water extractable Boron (0.1% CaCl2.H20)
14. Nitrate-nitrogen and Ammonium-nitrogen (2 M KCl extraction)
15. Soluble salts (electrical conductivity in a 1:1 soil:water saturation extraction)
16. Particle size analysis (Hydrometer method)
Basis for Recommendations Field studies correlate the fertilizer nutrient amounts required by crops to the level of nutrients measured by
soil test. When field data are insufficient or a soil test does not reliably measure a nutrient for crop availability,
fertilizer recommendations are based on the total amount of a nutrient needed by a crop and an estimated supply by
the soil. Because different nutrients vary in the types of reactions with the soil, strategies vary to provide efficient
and economical recommendations. For example, a nutrient like nitrogen tends not to accumulate in the soil in plant
available forms. Whereas, other nutrients can be accumulated through several growing seasons that remain in plant
available forms.
Phosphorus and potassium are both nutrients that are used in large amounts by crops and tend to be held well
by the soil. This allows them to be reliably increased in the soil. Thus recommendations are based on supplying the
current year’s crop needs (maintenance) and future crop need (buildup). A maintenance amount is that amount of
the nutrient removed by the crop in a single season. A buildup amount is the amount of nutrient needed to
gradually increase the soil test value through several growing seasons. An eight year nutrient buildup period

5
provides an economical amortization of fertilizer costs and results in efficient fertilizer use by minimizing rapid
fixation of a large amount of a nutrient with the soil.
When soil test values are low, phosphorus and potassium recommendations include both maintenance and
buildup amounts. As values approach high levels, the recommended amount is increasingly based on maintenance.
At very high levels, the soil is considered to contain an excessive nutrient amount, and a gradual decline in the soil
nutrient level is desired. So not even a maintenance amount is recommended. Otherwise without an expected
increase in yield, additional fertilization would increase the potential for environmental pollution. In addition to
being environmentally hazardous and economically wasteful, excessive fertilization can lead to legislated fertilizer
management or a ban of agricultural production altogether in specific areas.
Fertilizer nutrient recommendations provided in this publication are not varied by yield goal, but rather are
varied by nutrient soil test values. Recommended amounts of fertilizer are decreased by increasing amounts of the
nutrient measured in a soil test. Higher yields are not to be expected by greater fertilization, but by better
management. Such management changes may include row width, water supply, plant population, etc. When
improved management results in greater yields, then greater amounts of phosphorus and potassium may be applied
to replace the greater amounts of nutrients removed by the harvested portion of the crop.
Fertilizers All commercially sold fertilizers report the percent of primary nutrients (nitrogen, phosphorus and potassium)
that are contained within the fertilizer. These three nutrient percentages are referred to as the fertilizer grade. It is
shown on the label of the fertilizer and is guaranteed by the manufacturer. Nitrogen is expressed on an elemental
basis (N), while phosphorus and potassium are reported on an oxide basis, P2O5 and K2O. This method of
reporting should not be confused with the chemical forms in which the nutrients are present in the fertilizer. For
instance a commonly used fertilizer, diammonium phosphate, has a grade of 18-46-0. The fertilizer has 18%
nitrogen and 46% phosphorus (as P2O5). However, the nitrogen in this fertilizer is in the ammonium form (NH4+)
and the phosphorus is in the phosphate form (HP04-2). To accommodate fertilizer grades, fertilizer
recommendations are also based on amounts of N, P2O5 and K2O per area (usually per acre or per 1000 ft2).
For each primary nutrient, many different fertilizer sources are available. Some fertilizers are sold as complete
fertilizers, i.e., they contain all three primary nutrients. Single nutrient fertilizers are also widely available. Urea
(46-0-0) and potassium chloride (0-0-60) are examples of single nutrient fertilizers for nitrogen and potassium,
respectively. Complete fertilizers are often a blend of single nutrient fertilizers. Many different fertilizer sources
exist. Aside from fertilizer grade, each has different properties which influence their management and the
situations in which they are best used.
Soil pH Soil pH is a measurement of a soil's reaction, i.e., its acidity or alkalinity. Most Missouri soils have a pH less
than 7.0 and thus have varying degrees of acidity. Alkaline soils (those with a pH greater than 7.0) are typically not
native to Missouri, but usually result from or repeated lime applications or circumstances of location (e.g. lime dust

6
from roads). As an important chemical property, a soil’s acidity level affects nutrient availability, the activity of
soil microbes and the growth of plants
The University of Missouri Soil Testing Laboratory measures soil acidity in a very dilute salt solution, and it is
reported as a salt pH (pHs). Commercial laboratories typically measure soil pH in water. Although both methods
accurately measure soil acidity, salt pH is usually 0.5 pH unit less than pH measured in water.
The acidity measured in either water or a dilute salt solution is a measure of the soil's active acidity. On soils
that are strong to very strongly acid, a much larger reserve acidity exists. A laboratory procedure different from pH
measures this acidity, which is called neutralizable acidity (NA). From this value lime recommendations are
determined. As with pH, commercial laboratories typically use a different laboratory measurement to determine
reserve acidity. Their measurement of reserve acidity is reported as a buffer pH. While both measurements are
proper methods of reserve acidity, there is not a good means for comparing the two. The method used for
calculating a lime recommendation from a value of neutralizable acidity cannot be used with a buffer pH value.
Fruit and Vegetable and Turf pHs Preferences and Limestone Recommendations Horticulture crops vary in preferable soil pHs. Most prefer a pHs between 5.5 and 6.5. Where the pHs is much
greater or lesser than the preferred range, some corrective measure is recommended. Table 2 shows preferred pHs
ranges, and the pHs values at which an amendment should be applied to correct the pHs.
Some crops benefit from either high or low pHs. Blueberries prefer acidic soil and on most Missouri soils,
lowering the pHs is necessary for economical blueberry production. Other crops grow better at high or low pHs in
response to disease suppression. Scab (Streptomyces scabies) is a soil inhabiting fungus of potatoes that is
suppressed by low pHs (< 4.7). The optimum pHs range for scab resistant potatoes is 5.1 – 5.7. When potatoes are
grown in rotation with other crops that do not prefer a low pHs, lime should be applied after the potato harvest and
before planting the rotation crop. Alternatively, the soil fungus that causes Clubroot of cole crops is increasingly
suppressed as pHs becomes greater than 6.5. Yet the preferred pHs range is no more than 6.5-7.0, as crop growth is
decreased for other reasons at greater pHs.
Table 2. Preferred pHs ranges and recommended correction.
Preferable pHs range
High pH correction Low pH correction
Most fruits and vegetables 5.5-6.5 pHs > 7.0, apply sulfur pHs < 5.5, apply limestone
Blueberries 4.3 - 5.0 pHs > 5.5, apply sulfur pHs < 3.5, apply limestone
Potatoes Asparagus
5.5 - 7.5 pHs > 7.5, apply sulfur pHs < 5.5, apply limestone Beets Cabbage Turf 5.5 - 7.2 pHs > 7.2, apply sulfur pHs < 5.5, apply limestone

7
Soil test reports provide a rating of the measured pHs (Table 3). Soils with a pHs rating of very low to low
have a definite need for limestone. The low pHs is likely limiting yield potential. A medium pHs indicates that soil
acidity is near a yield limiting point, and limestone may be needed in coming seasons, as the soil acidifies naturally
or through the application of manure and/or ammonium based fertilizers. A high pHs rating indicates that the soil
acidity is optimum for crop growth. A very high rating indicates that the pHs is above the preferred range, and
nutrient availability may be reduced. A very high pHs may also be an indicator of other soil problems that could be
limiting to growth such as salinity or excessive sodium.
Table 3. pHs rating for Vegetables, Turf and Fruit Crops
Vegetables, Fruits, Turf Blueberries, Potatoes Rating pH range Very low < 4.5 < 3.5 Low 4.5 – 5.3 3.5 – 4.3 Medium 5.3 – 6.0 4.3 – 5.0 High 6.0 – 7.5 5.0 – 6.0 Very high > 7.5 > 6.0
Guidelines for increasing pHs. Recommendations for increasing pHs are based upon a single application of lime with the objective of
increasing the pHs to the optimum range, 6.1 – 6.5, to a depth of six inches. Limestone is recommended by
amounts of lb ENM/acre. Effective neutalizable material (ENM) is used as a means for standardizing limestone.
Limestone originating from different quarries can vary in effectiveness because of purity and particle size. Both of
these variables are used to calculate an ENM value for limestone. Purity is defined by the calcium carbonate
equivalent. It represents how much acidity is neutralized by a given amount of limestone. Fineness of grind or
particle size affects how rapidly and thoroughly limestone reacts with soil. Small or finely ground particles react
with a larger soil volume and thus neutralize acidity in a lesser amount of time than larger particles. All limestone
sold in Missouri must have an ENM rating. Although limestone is the most commonly applied amendment to
increase soil pH, any liming material can be used with ENM recommendations.
The equation used to calculate ENM is given below:
+−
−= 2*629.03078.10425.41..*400
ss pHpHAcidNAcidNENM
Suppose a recommendation suggests a need of 1500 ENM (lb/ton), and limestone available at the local quarry
has an ENM rating of 500 (lb/ton). The proper amount of limestone to apply would be three tons/acre. For a more
complete discussion of ENM see UMC Ext. Pub. G09107, “Missouri Limestone Quality-What is ENM.”

8
Because it is undesirable to increase pHs for blueberries and potatoes to the pHs targeted in the above
equation, an ENM of 500 is recommended when the pHs is less than 3.5. Soil sample again in a year to determine
if the limestone application increased pHs to the desired range.
Guidelines for Lowering pHs.
Acidifying soils (lowering pH) for better crop growth is likely to be economical for acid loving blueberries.
Blueberries require acid soils for growth and respond well to amendments that decrease pH. For other crops, higher
than desired pH may not sufficiently reduce growth to warrant the cost of applying acidifying amendments to large
acreages. Few soils in Missouri have excessively high pH for horticultural crops.
Recommendations for lowering pHs are based on the application of finely ground elemental sulfur.
Application rates to decrease the pHs by one pHs unit in the surface six inches are shown in Table 4. Rates vary by
the soil’s cation exchange capacity (CEC), which can be related to soil texture. Sulfur’s effect on soil pHs is slow
and typically takes several months to react with the soil. It should be incorporated and for perennial plants applied
a year before planting.
Table 4. Soil texture and CEC effects on sulfur recommendation to lower pHs.
Soil Texture CEC Ground Sulfur* (meq/100 g) (lb/acre)
Sand, Sandy loam < 10 350 Silt loam, Loam 10 - 18 600 Clay loam, Clay > 18 1000
*Amount necessary to reduce the soil pHs by one unit.
Other materials can be used to lower soil pHs. or maintain a low soil pHs. Iron sulfate reacts faster than
elemental sulfur (within 3 to 4 weeks), yet it requires 4 to 5 times more material. Single applications should not
exceed 2 tons/acre. Greater amounts will cause salt injury. Ammonium sulfate and urea when used as nitrogen
sources will maintain low soil pHs. Although higher rates could decrease pHs, they are not recommended because
of salt injury.
Soluble Salts Soluble salts refer to electrolyte compounds in the soil that dissolve in the soil water. Soluble salt level is also
referred to as the salinity level. At high levels soluble salts can reduce water uptake in the plant, restrict root
growth, cause root tip burn and in general reduce plant growth and fruit or vegetable yield. Soluble salts compete
with plants for soil water. Plant symptoms of excessive salts are similar to those from water stress. Seed
germination and seedling growth are the most sensitive growth stages to high salinity levels. Plant species and
cultivars vary in their sensitivity to soil salts.
The soil test to measure soluble salts is electrical conductivity. It is determined from a saturated paste extract
and is reported in units of mmhos/cm. The sensitivity of plants to soluble salt levels is shown in Table 5. The salt
tolerances of specific horticultural crops is given in Table 6.

9
Most Missouri soils are sufficiently leached by precipitation such that very low salinity levels exist. Human
activities are usually the cause of high salinity levels in Missouri. Over fertilization, fertilizer spills or placing
fertilizer too close to roots can create soluble salt problems for plants.
Table 5. Soluble salt levels and relative plant sensitivity.
Electrical Conductivity Salinity Level Effect on plant growth mmhos/cm
0 to 2 non-saline none 2.1 to 4 very slightly saline sensitive plants are inhibited 4.1 to 8 moderately saline many plants are inhibited
8.1 to 16 strongly saline most cultivated plants inhibited > 16 very strongly saline few plants are tolerant
Table 6. Salt tolerances of horticultural crops.
Non-tolerant Slightly tolerant Moderately tolerant Tolerant 0 to 2 mmhos 2 to 4 mmhos 4 to 8mmhos 8 to 16mmhos
Blueberry Apple Beet Asparagus Carrot Cabbage Broccoli Beans Cucumber Musk Melon Onion Grape Spinach Pea Lettuce Squash Radish Peach Tomato Raspberry Pear Strawberry Pepper
Plum Potato Sweet Corn Sweet Potato
Primary Nutrients Nitrogen, phosphorus and potassium are referred to as primary nutrients because plants use these nutrients in
greater amounts than other nutrients. Soils typically contain these nutrients in amounts sufficient to supply many
years of crops. However, the annual supply of these nutrients may be deficient for optimum plant growth.
Nitrogen Recommendations Nitrogen is the nutrient most often limiting for crop growth. Soils generally contain large amounts of nitrogen
in soil organic matter, which releases it to plant available forms. However, the release rate is usually too slow to
adequately supply a growing crop. Within crops’ rooting zone, these forms are ephemeral because of plant uptake
and soil reactions. Consequently, a reliable soil test for determining nitrogen availability has not been developed.
Nitrogen supply to crops is estimated from variables that directly and indirectly affect nitrogen release from
organic matter. Soil organic matter content and CEC are two variables measured in the soil test that are used for
calculating available nitrogen. If a legume crop has preceded the crop to be grown, the nitrogen recommendation is

10
reduced by an amount called the nitrogen credit. Another variable is an individual crop’s requirement for nitrogen.
Crops vary in the amount of nitrogen needed to produce a marketable product and also in their ability to obtain
nitrogen from the soil.
Fruit Crops
Nitrogen recommendations for fruit crops vary only by organic matter content and whether plantings are new
or established (Table 7). Less nitrogen is recommended for high organic matter soils as they mineralize more
nitrogen than soils with lower organic matter levels. Newly planted fruit trees require little nitrogen, as at this time
roots must become established. Excess nitrogen at this time encourages top growth at the expense of root growth.
In Table 7 the Newly Established category for fruit trees refers to young non-fruiting trees. At this growth stage
higher nitrogen rates encourage rapid shoot growth. Once established and trees mature to become fruit bearing, a
decreased nitrogen rate for fruit crops maintains a balance between vegetative growth and fruit development.
Under fertilizing crops decreases yield and quality, while over-fertilization can result in poor fruit color, delayed
maturity and irregular ripening, decreased winter-hardiness and increased disposition for disease.
Table 7. Nitrogen recommendations for fruit crops.
Organic Matter Level/Rating < 2.5 % 2.5–4.5% > 4.5 %
Low Medium High Application Time Newly Established --------------- lb/acre ------------ Apples/Pears 60 45 30 ½ at planting, ½ sidedress in June Grapes 60 45 30 ½ at planting, ½ sidedress in June Blueberries 40 30 20 Sidedress when 2nd flush of growth starts Brambles† 60 50 40 ½ at planting, ½ sidedress in June Stone Fruits‡ 60 45 30 ½ at planting, ½ sidedress in June Strawberries 80 70 60 ½ at planting, ½ sidedress in August Established Apples 30 20 10 Sidedress in spring Grapes 30 20 10 Sidedress in spring Pears 30 20 10 Sidedress in spring Brambles 60 50 40 Sidedress in spring Stone Fruits 60 40 20 Sidedress in spring Strawberries 80 70 60 Topdress after renovation
Age Blueberries 1-2 year 60
3 year 80 Sidedress in spring 4 year 100
† Raspberries, Blackberries, Gooseberries, ‡ Peaches, Plums, Apricots, Cherries, Nectarines
Vegetable Crops
The calculation of nitrogen recommendations for vegetable crops is diagrammed below.
Recommended nitrogen = Maximum N amount– Organic Matter Adjustment– Legume Credit (lb/acre) (Table 8) (Table 9) (Table 10)

11
The first part of the equation determines the maximum amount of nitrogen needed by a crop (Table 8). This
amount is based on a yield goal, which is listed beside the required nitrogen amount. The other two parts of the
equation reduce the amount of nitrogen recommended. The Organic Matter Adjustment is an estimate of the
amount of nitrogen released from organic matter during a growing season. It is dependent on CEC and the percent
organic matter in the soil (Table 9). Greater amounts of nitrogen are released from soils which have greater organic
matter levels and CEC. The Legume Credit estimates the amount of nitrogen that is supplied from the breakdown
of a legume crop residue from the previous year (Table 10).
Table 8. Nitrogen needs for vegetable crops and application methods.
Crop Yield Goal
Maximum Required N.*
Suggested application times
cwt/acre lb N/acre
Asparagus (New) - ½ at planting, 2/3 sidedress during cultivation
Asparagus (Est.) 40 80 Topdress before cutting starts or after harvest Beans/Peas 80 30 Broadcast
Beets 200 100 ½ at planting, ½ sidedress 3-5 wks after planting
Broccoli 120 180 1/3 at planting,1/3 sidedress 2 wks after 1/3 sidedress 5 wks after planting
Brussels Sprout 175 140 1/3 at planting,1/3 sidedress 2 wks after 1/3 sidedress 5 wks after planting
Cabbage 400 180 1/3 at planting,1/3 sidedress 2 wks after 1/3 sidedress 5 wks after planting Carrots 400 120 ½ at planting, ½ sidedress when plants are established
Cauliflower 150 180 ½ at planting, ½ sidedress when plants are established
Cucumbers 250 100 ½ at planting, ½ sidedress when vines begin to run
Lettuce 300 120 ½ at planting, ½ sidedress 3-5 wks after planting
Melons 200 100 ½ at planting, ½ sidedress when vines begin to run
Onions, dry 500 130 ¼ banded at planting, ¾ sidedress 4-5 wks after emergence Onions, green 150 80 ¼ at planting, ½ sidedress 4-5 wks after emergence, ¼ sidedress 4 wks before harvest
Peppers 200 140 ½ at planting, ½ sidedress when fruit appear
Potatoes 180 1/5 at planting, 2/5 at emergence, 2.5 at hilling
Pumpkins/Squash 400 70 ½ at planting, ½ sidedress when vines begin to run
Radishes 70 60 At planting
Spinach 150 100 ½ at planting, ½ sidedress 4-5 weeks after planting Sweet corn 180 140 1/5 in starter, 2/5 at 4-6 leaf stage, 2/5 at 10-12 leaf stage
Sweet potatoes 60 1/5 at planting, 2/5 at emergence, 2/5 at hilling
Tomatoes 270 130 ¼ at planting, ¼ 2 wks after planting, ¼ 4 wks after planting, ¼ 6 wks after planting
*Maximum amount to apply
Plant available nitrogen primarily exists in two forms, ammonium and nitrate. Whether derived from
manufactured fertilizer, organic fertilizer, soil organic matter, manure or legume crop residue, nitrogen is
eventually converted into ammonium and then nitrate by soil microbes. In the nitrate form, nitrogen may be “lost”
from a crop’s rooting zone through volatilization or leaching. Both processes can drastically reduce fertilizer
efficiency and deprive a crop of adequate nitrogen for optimum growth and yield. Application time of nitrogen
fertilizer then becomes important. By coinciding the conversion of nitrate to ammonium with active crop growth,
more of the applied nitrogen is available to crops.

12
Table 9. Organic matter adjustment by CEC and percent soil organic matter.
CEC Soil
Organic Matter Organic Matter
Adjustment meq/100 g (%) (lb/acre)
≤ 10 ≤ 0.5 10 ≤ 10 0.5 – 1.5 20*OM* ≤ 10 ≥ 1.5 30
10 - 18 ≤ 2.0 20 10 - 18 2.0 – 4.0 10*OM 10 - 18 ≥ 4.0 40
> 18 ≤ 2.0 10 > 18 2.0 – 5.0 5.0*OM > 18 ≥ 5.0 25
*OM – percent organic mater
Table 10. Nitrogen credit for previous legume crop.
Crop Nitrogen Credit (lb/acre) Alfalfa (good stand) 50 Alfalfa (poor stand) 40 Birdsfoot Trefoil 40 Grass-Legume Hay 40 Grass-Legume Pasture 40 Red Clover 40 Beans/Peas 30
The suggested application times and methods in Table 8 are intended to optimize availability to the crop
during the growing season to produce the best quality product. Because nitrogen has such a profound effect on
plant growth, ripening, and fruit development, specific application times can greatly affect crop development, for
the benefit of the crop (e.g. greater yield or better color) or also to the detriment of the crop value (e.g. splitting of
fruit or rank vegetative growth).
Phosphorus Recommendations Phosphorus exists in the soil as rather insoluble compounds with iron and aluminum at low pH and with
calcium at high pH. Upon contact with the soil, phosphorus fertilizer is rapidly converted into these compounds.
Plants take up phosphorus in the form of the orthophosphate anion (H2PO4-). Soil phosphorus compounds supply
the soil solution with orthophosphate in relatively small amounts. The Bray-1 P soil test provides an estimate of
phosphorus released from soil compounds that are available to plants. The Bray-2 P soil test is a variation of the
Bray-1 P test. It is best used when a field has a history of rock phosphate fertilization.
The insoluble nature of soil phosphorus compounds limits movement of phosphorus in the soil to very short
distances, usually less than an inch from the point of application. Consequently for best fertilizer effectiveness,

13
phosphorus fertilizer should be incorporated into the surface soil or banded near the crop rather than topdressed.
Banding all or a portion of phosphorus fertilizer near the seed or vegetable transplants is most beneficial in the
spring when soils are cool. In such conditions, a readily available supply of phosphorus enhances root growth and
uptake of phosphorus.
Soil test phosphorus ratings are the same for both fruit crops and vegetable crops (Table 11).
Table 11. Phosphorus ratings by soil test phosphorus
Soil Test Rating Soil Test Phosphorus lb P2O5/acre
Very low < 20 Low 20 – 40 Medium 40 – 80 High 80 – 200 Very High > 200
Fruit Crops
Phosphorus fertilizer recommendations for fruit crops are given in Table 12. Recommended amounts for
blueberries and brambles are 25 lb P2O5/acre less than for the other fruit crops. New plantings receive a 25 percent
greater recommendation than established plantings. When the calculated recommendation is less than 20 lb
P205/acre but greater than zero, the recommendation is rounded up to 20 lb P205/acre.
Table 12. Phosphorus recommendations for fruit crops.
Crop Recommendation equation Maximum amount P2O5 (lb/acre)
New Plantings P2O5=Established Rec.*1.25 -
Established Blueberries P2O5=95 - 1.25*PTest 75
Brambles† P2O5=95 - 1.25*PTest 75
Apples/Pears P2O5=120 - 1.25*PTest 100
Grapes P2O5=120 - 1.25*PTest 100
Stone Fruits‡ P2O5=120 - 1.25*PTest 100
Strawberries P2O5=120 - 1.25*PTest 100 † Raspberries, Blackberries, Gooseberries, ‡ Peaches, Plums, Apricots, Cherries, Nectarines
Vegetable Crops
Ratings for soil test phosphorus for vegetables are the same as that of fruit crops. Recommendations for
fertilizer phosphorus are based on four equations, which are provided in Table 13. These recommendations provide
for a buildup when soil tests are low, maintain nutrient levels when soil tests are medium to high and allow for
gradual drawdown when soil tests are very high.

14
Table 13. Phosphorus recommendations for vegetable crops.
Soil Test Phosphorus in lb P2O5/acre
Crop Yield Goal 10 30 50 70 90 110 130 150 170 190 Equation
ton/acre Phosphorus recommendation, lb P2O5/acre
Asparagus (Est.) 2 140 110 90 60 40 10 0 0 0 0 P2O5 = 150 – 1.25*PTest
Asparagus (New) - 215 190 165 140 115 90 65 40 20* 0 P2O5 = 225 – 1.25*PTest
Beans, Lima 2 140 110 90 60 40 10 0 0 0 0 P2O5 = 150 – 1.25*PTest
Beans, Snap 4 140 110 90 60 40 10 0 0 0 0 P2O5 = 150 – 1.25*PTest
Beets 13 215 190 165 140 115 90 65 40 20* 0 P2O5 = 225 – 1.25*PTest
Broccoli 4 215 190 165 140 115 90 65 40 20* 0 P2O5 = 225 – 1.25*PTest
Brussels Sprout 5 215 190 165 140 115 90 65 40 20* 0 P2O5 = 225 – 1.25*PTest
Cabbage 20 215 190 165 140 115 90 65 40 20* 0 P2O5 = 225 – 1.25*PTest
Cantaloupes 9 215 190 165 140 115 90 65 40 20* 0 P2O5 = 225 – 1.25*PTest
Carrots 15 175 150 125 100 75 50 25 0 0 0 P2O5 = 188 – 1.25*PTest
Cauliflower 8 215 190 165 140 115 90 65 40 20* 0 P2O5 = 225 – 1.25*PTest
Cucumbers 15 215 190 165 140 115 90 65 40 20* 0 P2O5 = 225 – 1.25*PTest
Lettuce 20 175 150 125 100 75 50 25 0 0 0 P2O5 = 188 – 1.25*PTest
Onions, dry 20 250 225 200 175 150 125 100 75 50 25 P2O5 = 263 – 1.25*PTest
Onions, green 8 215 190 165 140 115 90 65 40 20* 0 P2O5 = 225 – 1.25*PTest
Peas 3 140 110 90 60 40 10 0 0 0 0 P2O5 = 150 – 1.25*PTest
Peppers 10 215 190 165 140 115 90 65 40 20* 0 P2O5 = 225 – 1.25*PTest
Potatoes 250 225 200 175 150 125 100 75 50 25 P2O5 = 263 – 1.25*PTest
Pumpkins 20 175 150 125 100 75 50 25 0 0 0 P2O5 = 188 – 1.25*PTest
Radishes 4 175 150 125 100 75 50 25 0 0 0 P2O5 = 188 – 1.25*PTest
Spinach 6 175 150 125 100 75 50 25 0 0 0 P2O5 = 188 – 1.25*PTest
Squash 15 175 150 125 100 75 50 25 0 0 0 P2O5 = 188 – 1.25*PTest

15
Sweet corn 10 175 150 125 100 75 50 25 0 0 0 P2O5 = 188 – 1.25*PTest
Sweet potatoes 10 175 150 125 100 75 50 25 0 0 0 P2O5 = 188 – 1.25*PTest
Tomatoes 30 250 225 200 175 150 125 100 75 50 25 P2O5 = 263 – 1.25*PTest
Watermelons 11 215 190 165 140 115 90 65 40 20* 0 P2O5 = 225 – 1.25*PTest
*When the calculated recommendation is less than 20 lb P2O5/acre, the recommendation is rounded up to 20 lb P2O5/acre.
Potassium Recommendations Available potassium exists in the soil as the K+ ion. Because potassium attaches to clay minerals in the soil,
movement and supply of potassium in the soil is dependent on soil texture. In soils with loam, silt loam or heavier
textures, potassium movement is greatly restricted. Thus potassium fertilizer can be applied to buildup soil
potassium levels. Also incorporation is preferred to topdressing. On sandy soils with lesser amounts of clay,
potassium moves more freely such that it can actually leach from the root zone. Fall application of potassium on
these soils is not recommended, since the potassium may leach from the root zone during the winter months.
Potassium chloride, which contains 60 percent K20, is the cheapest and most common potassium fertilizer.
Potassium, like phosphorus, can be beneficial when banded near the seed at planting. Due to the potential for salt
injury, potassium should not be applied directly with the seed, but rather 2-3 inches from the seed. On low
potassium testing soils, the bulk (at least half) of recommended potassium should be applied broadcast and the rest
in a band. No more than 50 lb K20 should be applied as a banded starter near the seed.
Potassium ratings are the same for fruit and vegetable crops (Table 14).
Table 14. Potassium ratings by soil test potassium level
Soil Test Rating Soil Test Potassium lb P2O5/acre
Very low < 65 Low 65 – 110 Medium 110 – 220 High 220 – 330 Very High > 330
Fruit Crops
Potassium fertilizer recommendations for established fruit crops are generated using three different equations
(Table 15). For some crops a set value is used at the higher soil test potassium levels. However the range of soil
test potassium at which recommendations change are not consistent across crops. So the crops are grouped below
according to their potassium recommendations. For all crops fertilizer recommendation for new plantings 1.25
times the established recommendation.

16
Table 15. Potassium recommendations for fruit crops.
Crop Recommendation equations Recommended Potassium (lb K2O/acre) Soil Test Potassium Ranges (lb K2O) # 230 > 230
Blueberries K2O=230 - 1.0*Ktest – 150 lb K20 maximum Use Equation 0
Soil Test Potassium Ranges (lb K2O) <180 180-220 220-260 >260
Brambles† K2O=210 - 1.0*KTest – 100 lb K20 maximum
Use Equation 30 20 0
Soil Test Potassium Ranges (lb K2O) < 200 220-330 >330
Other Fruits‡ K2O=250 - 1.0*KTest – 200 lb K20 maximum
Use Equation 30 0
† Raspberries, Blackberries, Gooseberries ‡ Apples, Pears, Grapes, Strawberries, Peaches, Plums, Apricots, Cherries, Nectarines
Vegetable Crops
Potassium recommendations for vegetable crops are varied according to soil texture. For sands and loamy sands,
recommendations are given in Table 16. For all heavier textured soils, recommendations are given in Table 17.
Within both recommendation tables, four equations are used for individual vegetable crops. Similar to phosphorus,
the recommended amounts provide for a buildup with low soil test values plus a maintenance amount and only
maintenance amounts at high soil test levels
Table 16. Potassium recommendations for vegetable crops on soils with CEC less than.
Soil Test Potassium Level (lb K2O/acre)
Crop Yield Goal 50 75 100 125 150 175 200 225 250 275 300 325 Equation
ton/acre Potassium recommendation, lb K2O/acre
Asparagus (Est.) 2 205 185 160 140 115 95 70 50 25 20* 0 0 K2O = 250 – 0.9*KTest Asparagus (New) - 230 210 185 165 140 120 95 75 50 30 20* 0 K2O = 275 – 0.9*KTest Beans, Lima 2 205 185 160 140 115 95 70 50 25 20* 0 0 K2O = 250 – 0.9*KTest Beans, Snap 4 205 185 160 140 115 95 70 50 25 20* 0 0 K2O = 250 – 0.9*KTest Beets 13 280 160 135 215 190 170 145 125 100 80 55 35 K2O = 325 – 0.9*KTest Broccoli 4 330 310 285 265 240 220 195 175 150 130 105 85 K2O = 375 – 0.9*KTest Brussels Sprouts 5 330 310 285 265 240 220 195 175 150 130 105 85 K2O = 375 – 0.9*KTest Cabbage 20 280 160 135 215 190 170 145 125 100 80 55 35 K2O = 325 – 0.9*KTest Cantaloupes 9 280 160 135 215 190 170 145 125 100 80 55 35 K2O = 325 – 0.9*KTest Carrots 15 230 210 185 165 140 120 95 75 50 30 20* 0 K2O = 275 – 0.9*KTest Cauliflower 8 330 310 285 265 240 220 195 175 150 130 105 85 K2O = 375 – 0.9*KTest Cucumbers 15 280 160 135 215 190 170 145 125 100 80 55 35 K2O = 325 – 0.9*KTest Lettuce 20 230 210 185 165 140 120 95 75 50 30 20* 0 K2O = 275 – 0.9*KTest Onions, dry 20 280 160 135 215 190 170 145 125 100 80 55 35 K2O = 325 – 0.9*KTest Onions, green 8 230 210 185 165 140 120 95 75 50 30 20* 0 K2O = 275 – 0.9*KTest

17
Peas 3 205 185 160 140 115 95 70 50 25 20* 0 0 K2O = 250 – 0.9*KTest Peppers 10 280 160 135 215 190 170 145 125 100 80 55 35 K2O = 325 – 0.9*KTest Potatoes 330 310 285 265 240 220 195 175 150 130 105 85 K2O = 375 – 0.9*KTest Pumpkins 20 230 210 185 165 140 120 95 75 50 30 20* 0 K2O = 275 – 0.9*KTest Radishes 4 205 185 160 140 115 95 70 50 25 20* 0 0 K2O = 250 – 0.9*KTest Spinach 10 280 160 135 215 190 170 145 125 100 80 55 35 K2O = 325 – 0.9*KTest Squash 15 230 210 185 165 140 120 95 75 50 30 20* 0 K2O = 275 – 0.9*KTest Sweet corn 10 230 210 185 165 140 120 95 75 50 30 20* 0 K2O = 275 – 0.9*KTest Sweet potatoes 280 160 135 215 190 170 145 125 100 80 55 35 K2O = 325 – 0.9*KTest Tomatoes 30 330 310 285 265 240 220 195 175 150 130 105 85 K2O = 375 – 0.9*KTest Watermelons 11 280 160 135 215 190 170 145 125 100 80 55 35 K2O = 325 – 0.9*KTest
*When the calculated recommendation is less than 20 lb K2O/acre, the recommendation is rounded up to 20 lb
K2O/acre.
Table 17. Potassium recommendations for vegetable crops on with CEC greater than.
Soil Test Potassium Level (lb K2O/acre)
Crop Yield Goal 50 75 100 125 150 175 200 225 250 275 300 325 Equation
ton/acre Potassium recommendation, lb K2O/acre
Asparagus (Est.) 2 200 175 150 125 100 75 50 25 0 0 0 0 K2O = 250 – 1.0*KTest
Asparagus (New) - 225 200 175 150 125 100 75 50 25 0 0 0 K2O = 275 – 1.0*KTest
Beans, Lima 2 200 175 150 125 100 75 50 25 0 0 0 0 K2O = 250 – 1.0*KTest
Beans, Snap 4 200 175 150 125 100 75 50 25 0 0 0 0 K2O = 250 – 1.0*KTest
Beets 13 275 250 225 200 175 150 125 100 75 50 25 0 K2O = 325 – 1.0*KTest
Broccoli 4 325 300 275 250 225 200 175 150 125 100 75 50 K2O = 375 – 1.0*KTest
Brussels Sprouts 5 325 300 275 250 225 200 175 150 125 100 75 50 K2O = 375 – 1.0*KTest
Cabbage 20 275 250 225 200 175 150 125 100 75 50 25 0 K2O = 325 – 1.0*KTest
Cantaloupes 9 275 250 225 200 175 150 125 100 75 50 25 0 K2O = 325 – 1.0*KTest
Carrots 15 225 200 175 150 125 100 75 50 25 0 0 0 K2O = 275 – 1.0*KTest
Cauliflower 8 325 300 275 250 225 200 175 150 125 100 75 50 K2O = 375 – 1.0*KTest
Cucumbers 15 275 250 225 200 175 150 125 100 75 50 25 0 K2O = 325 – 1.0*KTest
Lettuce 20 225 200 175 150 125 100 75 50 25 0 0 0 K2O = 275 – 1.0*KTest
Onions, dry 20 275 250 225 200 175 150 125 100 75 50 25 0 K2O = 325 – 1.0*KTest
Onions, green 8 225 200 175 150 125 100 75 50 25 0 0 0 K2O = 275 – 1.0*KTest
Peas 3 200 175 150 125 100 75 50 25 0 0 0 0 K2O = 250 – 1.0*KTest
Peppers 10 275 250 225 200 175 150 125 100 75 50 25 0 K2O = 325 – 1.0*KTest
Potatoes 325 300 275 250 225 200 175 150 125 100 75 50 K2O = 375 – 1.0*KTest

18
Pumpkins 20 225 200 175 150 125 100 75 50 25 0 0 0 K2O = 275 – 1.0*KTest
Radishes 4 200 175 150 125 100 75 50 25 0 0 0 0 K2O = 250 – 1.0*KTest
Spinach 10 275 250 225 200 175 150 125 100 75 50 25 0 K2O = 325 – 1.0*KTest
Squash 15 225 200 175 150 125 100 75 50 25 0 0 0 K2O = 275 – 1.0*KTest
Sweet corn 10 225 200 175 150 125 100 75 50 25 0 0 0 K2O = 275 – 1.0*KTest
Sweet potatoes 275 250 225 200 175 150 125 100 75 50 25 0 K2O = 325 – 1.0*KTest
Tomatoes 30 325 300 275 250 225 200 175 150 125 100 75 50 K2O = 375 – 1.0*KTest
Watermelons 11 275 250 225 200 175 150 125 100 75 50 25 0 K2O = 325 – 1.0*KTest
Secondary Nutrients The secondary nutrients – calcium, magnesium, and sulfur - are used by plants at amounts almost similar to
some of the primary nutrients, but they are less likely to be in deficient supply to a crop.
Calcium Recommendations for Fruits and Vegetables Available calcium exists in the soil as the Ca+ ion. It attaches to clay minerals in the soil, so the amount and
supply of calcium is dependent on soil texture. Calcium deficiency in field soils is relatively rare, but it may occur
on acid sandy soils. For most crops calcium needs can be met by liming the soil to increase soil pH. However for
blueberries and potatoes, the maintenance of a low pH can result in low calcium levels, which may require
corrective measures. For potatoes grown in rotation, a small amount of lime (1000 lb/acre) can be applied during
the cropping year out of potatoes to meet calcium needs and yet not adversely affect soil pH for the potatoes.
The calcium rating assigned to a soil is dependent on CEC and soil test calcium (Table 18). With less clay to
hold calcium on low CEC, sandy soils, less soil test calcium is necessary to obtain a high calcium rating. No
corrective Ca applications are recommended for soils with a high Ca rating.
Table 18. Calcium rating by soil test calcium and the soil CEC.
Soil CEC Rating < 10 10 - 20 > 20Low Ca ≤ 1000 Ca ≤ 3000 Ca ≤ 5000 Medium 1000 ≥ Ca ≥ 1600 3000 ≥ Ca ≥ 5000 5000 ≥ Ca ≥ 8000 High Ca > 1600 Ca > 5000 Ca > 8000
Gypsum (calcium sulfate) is an amendment that supplies calcium. Yet unlike lime it does not have a large
effect on soil pHs. Thus it can be used to supply calcium for acid loving crops. The pHs ranges for which gypsum
is recommended are given in Table 19.
Table 19. Soil pHs range for which gypsum is recommended for different crops.
Crop pHs range to recommend gypsum Blueberries, potatoes 4.3 – 5.0

19
Asparagus, Beets, Cabbage 5.5 – 7.0 All other fruits and vegetables 5.5 – 6.5
The recommended amount of gypsum to supply calcium is dependent on the soil CEC and soil test Ca. The
formula to calculate a gypsum recommendation is given below.
( )[ ] 56.43400
30*300*)/( ∗
−
=CaTestCECacrelbGypsum
Calcium deficiencies can occur with some crops despite the presence of adequate calcium in the soil. These
deficiencies are related to physiological disorders and include blossom end rot in tomatoes and peppers, tipburn in
lettuce, cabbage or cauliflower, black heart in celery, or bitter pit in apples. In soils in which the soil pH has been
corrected to 6.0 or above, soil applied calcium will not correct these disorders. Foliar sprays of calcium chloride at
a rate of 5 to 10 lb per acre or calcium nitrate at 10 to 15 lb per acre can help overcome these disorders. Solutions
of these calcium sources should be applied at a rate of 100 gallons per acre directly to the crop’s foliage.
Magnesium Recommendations for Fruits and Vegetables Magnesium is available to plants as the Mg+ ion. Similar to calcium it is primarily held in the soil by clay
particles, Its deficiency typically occurs on acid, low CEC or sandy soils. On soils with marginal magnesium
levels, deficiencies can be induced by high application rates of potassium or a heavy application of calcitic
limestone.
Soil magnesium ratings are based on the percent magnesium saturation which is calculated using soil test
magnesium and CEC (see equation below). Magnesium ratings are given in Table 20.
100*240%
CEC
MgTestSaturationMagnesium =
Table 20. Magnesium rating by soil test magnesium and the soil CEC.
Rating % Magnesium Saturation Very low < 2 Low 2 − 5 Medium 5 – 10 High 10 – 32.5 Very high 32.5 – 55 Extremely high 55

20
Magnesium recommendations are based on soil test magnesium and CEC and are calculated using the
equation below.
20)240(*)/( MgTestCECacrelbMg −
=
If CEC is less than 6, assume 6, or if greater than 20 assume 20.
Magnesium can be supplied from dolomitic limestone, which can also correct low soil pH that may be
coincident with low soil magnesium levels. Other sources of magnesium include potassium magnesium sulfate
(trade names of K-Mag or Sul-Po-Mag; 11% magnesium), magnesium sulfate (Epsom salts, 10% magnesium) and
magnesium oxides.
Sulfur Recommendations for Fruits and Vegetables Plant available sulfur exists in the soil as the sulfate ion (SO4
2-). Similar to nitrate-nitrogen, it is susceptible to
leaching. Sulfur is supplied to crops by the breakdown of organic matter and by atmospheric deposition of sulfur,
which primarily originates from the burning of coal. Sulfur deficiencies are usually found on sandy, low organic
matter soils, i.e., soils on which sulfur supply is likely to be small and on which sulfur has a greater potential to
leach beyond the root zone. Soil test sulfur ratings are given in Table 21. Fertilizer sulfur is recommended (30
lb/acre) only for soils that test low.
Table 21. Sulfur rating by soil test value.
Sulfur Rating Sulfur Soil Test Value (ppm)
Low ≤ 6 Medium 6 – 12 High >12
Micronutrients Micronutrients are used by crops in only small amounts. Yet when micronutrients are deficient, yield
reductions can be as severe as those incurred by deficiencies of the primary nutrients. Micronutrients discussed
here include: boron, copper, iron, manganese and zinc. Most soils typically supply micronutrients in sufficient
amounts for crop needs. However, some soils have a greater proclivity for micronutrient deficiencies. Crops also
vary in their demand for micronutrients and their response to applied micronutrients when deficiencies exist (Table
22).
Table 22. Relative response of fruit and vegetable crops to applied micronutrients when soil conditions favor a deficiency.
Crop Boron Copper Iron Manganese Zinc

21
Apples high medium - high high Asparagus low low medium low low Beans, Snap low low high high high Beets high high high high medium Blueberries low medium high low - Broccoli high medium high medium - Cabbage medium medium medium medium medium Carrots medium high - medium low Cauliflower high medium high medium - Cucumbers low medium - high - Grapes medium low high high medium Lettuce medium high - high medium Onions, dry low high - high high Peaches medium medium - high high Pears medium medium - - medium Peas low low - high low Peppers low low - medium - Potatoes low low - high medium Radishes medium medium - high - Raspberries medium - high high - Spinach medium high high high - Strawberries medium medium high high - Sweet corn low medium medium medium high Tomatoes high medium - medium -
Because micronutrients are required in such small amounts, they can be combined with primary nutrient
fertilizers and applied in the same fertilizer application. For dry fertilizers the micronutrients may be incorporated
at the time of granulation or impregneated onto the surface of granules. With liquid fertilizers, micronutrients are
well suited to be added to suspension fertilizers or to ammonium polyphosphate (10-34-0).
Boron Recommendations Boron is available to plants as H3BO3. It is mobile in the soil and is subject to leaching, especially on sandy
soils. It also does not accumulate in the soil, so boron responsive crops may need annual applications. Boron
availability may be reduced on neutral to alkaline soils. A deficiency should be identified by soil test or plant
analysis before a boron fertilizer application is made, because excessive boron is very toxic to plants. Soil test
ratings for boron are given in Table 23.
Table 23. Boron rating by soil test value.
Boron Rating Boron Soil Test Value (ppm) Low ≤ 0.4 Medium 0.4 – 0.9 High > 0.9
Even when deficient, boron recommendations are small. Boron recommendations are given for fruit crops in
Table 24 and for vegetable crops in Table 25. Fertilizer sources of boron include Borax (11% B), Boric acid (17%
B) and Solubor (28% B).

22
Table 24. Boron recommendations for fruit crops.
Soil Boron Rating Crop Low Medium High
lb Boron/acre recommended Apples/Pears 2 1 0 Blueberries 1 0 0 Brambles 2 1 0 Grapes 2 1 0 Stone Fruits 2 1 0 Strawberries 2 1 0
Table 25. Boron recommendations for vegetable crops.
Soil Boron Rating Crop Low Medium High
lb Boron/acre recommended Asparagus (Est.) 1 0 0 Asparagus (New) 1 0 0 Beans, Snap 0 0 0 Beets 4 2 0 Broccoli 4 2 0 Brussels Sprouts 4 2 0 Cabbage 2 1 0 Cantaloupes 1 0 0 Carrots 2 1 0 Cauliflower 4 2 0 Cucumbers 0 0 0 Lettuce 1 0 0 Onion, dry 2 1 0 Onions, green 1 0 0 Peas 0 0 0 Potatoes 1 0 0 Pumpkins 1 0 0 Radishes 2 1 0 Spinach 2 1 0 Squash 1 0 0 Sweet corn 1 0 0 Sweet potatoes 1 0 0 Tomatoes 2 1 0 Watermelons 1 0 0

23
Copper Recommendations The copper ion Cu+2 readily binds with organic matter in the soil. Copper may be available to plants as the
Cu+2 ion or as a chelated ion with organic matter. Deficiencies are most likely to occur on organic soils, rather than
the mineral soils of Missouri. No fertilizer recommendations are given for copper, but a soil test rating is given in
Table 26.
Table 26. Copper rating by soil test value.
Copper Rating Copper Soil Test Value (ppm) Low ≤ 0.2 High > 0.2
Manganese Recommendations Manganese exists in the soil as various oxides and hydroxides, but is available to plants in the Mn+2 form. This
form represents only a small fraction of the total amount of manganese in the soil. Soil pH, organic matter levels
and aeration all affect manganese availability. Neutral to alkaline soil pH and high organic matter levels decrease
manganese availability. Alternatively, very acid soils may have manganese toxicity.
As indicated in Table 22, fruit and vegetable crops are most responsive to manganese deficiency. Soil test
ratings for manganese are given in Table 27. If a manganese deficiency occurs, apply 1-2 pounds of manganese per
acre. Fertilizer sources of manganese include manganese sulfate (27% Mn) and manganese chelate (12% Mn).
Table 27. Manganese rating by soil test value.
Manganese Rating Manganese Soil Test Value Low ≤ 1.0 (ppm) High > 1.0 (ppm)
Iron Recommendations Iron is an abundant element in the soil; however, it exists in relatively small amounts in a plant available form,
Fe+2. Iron deficiency symptoms (an interveinal chlorosis) on plants occurs frequently on high pHs soils (pHs > 7.2)
in which soil iron is unavailable to plant roots. Because of the chemical reactions associated with soil iron, soil
application of iron, particularly inorganic fertilizer salts, is ineffective. Soil application of iron chelates can be
economically effective for some vegetable crops. Deficiencies are best treated by a foliar application of an iron
fertilizer solution at a rate of 0.5 to 3.0 lb/acre. Application of farmyard manure can provide a long term correction
to iron deficiency by keeping iron in an available chelate form. Ratings of soil iron are given in Table 28.
Table 28. Iron rating by soil test value.
Iron Rating Iron Soil Test Value (ppm) Low ≤ 2.1

24
Medium 2.1 – 4.5 High > 4.5
Zinc Recommendations Zinc is available to plants as the ion Zn+2. Zinc deficiencies in Missouri have been noted on sandy or low
organic matter soils. Eroded or graded soils that have had the subsoil exposed or alkaline soils may also have zinc
deficiencies. Soil application of zinc sulfate can be used to correct a zinc deficiency. These rates are shown in
Table 29. If a zinc chelate is used, the amount applied should be reduced to 1/5 that of the inorganic rate. Zinc is
relatively non-mobile in the soil, so incorporation or placement in a band is suggested. When banded zinc fertilizer
should not come in contact with the seed. A single zinc application may be effective for three to five years. In
season deficiencies can be corrected by foliar applications of chelated zinc at a rate of 2 oz of zinc per acre.
Table 29. Zinc rating by soil test value.
Zinc Rating Zinc Soil Test Value (ppm) Zinc to apply (lb/acre) Low ≤ 0.5 10
Medium 0.5 – 1.0 5 High > 1.0 0
Fertilizer Recommendations For Turf Soil pHs Turf prefers a soil pHs of 5.5 to 7.2. An acid soil is detrimental to turf growth from several perspectives. First,
an acid soil is more likely to be impervious to water. Second, microbial activity is reduced which decreases decay
of dead roots and clippings. Consequently, turf becomes root-bound. Third, acid soil can develop toxic amounts of
aluminum, iron, and manganese or drastically reduced amounts of available phosphorus. Forth, turf prefers a
supply of both ammonium and nitrate, and an acid soil decreases the microbial conversion of ammonium to nitrate.
Lime recommendations are calculated as indicated earlier. For new seedings, lime should be mixed with the
surface 6 inches of soil, and precede seeding by several months to allow the lime’s reaction with the soil. Do not
use more than 100 lb/1000 ft2 on high cut turf and 50 lb/1000 ft2 on low cut turf. Burnt lime (CaO or MgO) or
hydrated lime (Ca(OH)2 or Mg(OH)2) are not recommended for application directly to turf. These products can
burn the turf and stick to the shoes of people walking on the turf.
Nitrogen Recommendations Turf typically requires fertilizer nitrogen to enhance turf color; promote tillering which thickens turf, and
maintain plant vigor. Nitrogen requirements for turf vary according to establishment, species, and management. As
turf is often stressed through use, weather, and disease, proper nitrogen management helps turf endure stresses and
heal damaged areas. Nitrogen rate, source and fertilizer application time are all important management factors.
Establishing Turf

25
Less nitrogen is needed to establish turf than to maintain it. Recommended fertilizer amounts are intended to
supplement nitrogen released by the soil organic matter. Less nitrogen is released as soil organic matter levels
decrease, and in lower CEC soils, the rate of release is decreased. Two equations are used for determining nitrogen
recommendations: one for soils with a CEC < 11 and another for soils with a CEC > 11.
When the CEC is <11, the following equation applies:
( )[ ] 25*56.43
%2.0*621000/( 2
−−+
=OMCECftlbNitrogen
When the CEC is >11, the following equation applies:
To obtain nitrogen recommendations in lb/acre, multiply either equation by 43.56. When the calculated
recommendation is less than 0.5 and greater than 0, then the recommendation will be 0.5 lb/1000 ft2.
Maintenance Turf Nitrogen Recommendations
Turf is maintained for several different purposes. Nitrogen recommendations for the various management
objectives are based not on a prediction of nitrogen supplied by the soil, but rather on the specific nitrogen needs of
turf in relation to its management (Table 30). Fertilizer application times and amounts are coordinated primarily to
mollify effects of stress incurred through use and season.
Grass species are classified according to the season in which they grow best. Cool season grasses grow well in
the spring and fall. They are fertilized to optimize growth during these times and minimize stress during the warm
summer months. Fall fertilization is particularly important. Turf fertilized in the fall will stay green later into the
fall, build root reserves to overwinter in a healthier condition and begin growth earlier in the spring. Cool season
grasses include: bluegrass, fescue, ryegrass and bentgrass. Warm season grasses grow best and are best fertilized
during the warm summer months, and include bermudagrass, zoysiagrass and buffalograss.
Table 30. Nitrogen recommendations for turf according to application month, use and grass species.
Turf Use Grass Species March Apr. May June July Aug. Sept. Oct. Nov.
---------------------------------- lb/1000 ft2 ----------------------------------
Athletic Fields Cool Season 1 1+ 1 1 Warm Season 2 2
Commercial Sod Cool Season 1 1+ 1 Warm Season 2 2
Low maintenance Cool Season 1 1+
[ ] 25*56.43
%1.0*)11(3)1000/( 2
−−+
=OMCECftlbNitrogen

26
Warm Season 1- Golf Courses Putting Greens Bentgrass (soil) ½ ½ ½ ½ ½ ½ ½ ½ ½
Bentgrass (sand)* ¼ - ½* ¼ - ½* ¼ - ½* ¼ - ½* ¼ - ½* ¼ - ½* ¼ - ½* ½ ½ Fairways Cool Season ½ - 1 ½ - 1 ½ - 1 ½ - 2
Warm Season 1 1 1+ Tees Cool Season ½ - 1 ½ - 1 1 ½ ½ - 1 ½ - 2
Warm Season 1 1 1+ + designates an application in the early part of the month- designates an application in the late part of the month*Applied at biweekly intervals
A variety of nitrogen sources are formulated specifically for turf. They vary in the rate at which nitrogen is
released and the potential for burning grass blades when applied. Slow release products are important to avoid over
stimulation of the turf. In any one application, half of the nitrogen should be in a slow release form. Table 31 lists
some typical nitrogen sources used for turf. Most contain urea or derivatives of urea, which are generically called
ureaform. Ureaform is the product resulting from the reaction of urea and formaldehyde in which urea is formed
into chains of different length. In general, the longer the chain the slower the release. Release rates are also
described by the solubility in water (WIN) or hot water (HWIN).
Table 31. Nitrogen sources typically used for turf.
Nitrogen Source
Percent Total
Nitrogen
Percent Ammonium
Nitrate
Percent Urea
Percent SRN†
Percent WIN‡
Percent HWIN#
Speed of N release
Burn potential
UAN 28 50 50 Fast High Urea 46 100 Release Burn Methylol urea 30 50 50 Suspended Methylene Urea 18 35 40 25 5
Methylene urea 41 35 30 36 13 Methylene urea polymers 38 11 17 72 40 Slow
Release Low Burn
† Short chain soluble nitrogen, soluble reacted urea ‡ Water soluble nitrogen # Hot water soluble nitrogen
Phosphorus Recommendations For Turf Phosphorus recommendations for establishing turf are calculated using the equation below. Recommended
maintenance amounts are half that of establishment.

27
Potassium Recommendations For Turf Potassium recommendations for establishing turf are varied by soil potassium level and CEC, and are
calculated using the equations below. Recommended maintenance amounts are half that of establishment. If the
CEC is less than 6, then assume 6, and if greater than 20 then assume 20.
Secondary and Micronutrients Secondary and micronutrient recommendations for turf are the same as those detailed for fruit and vegetable
crops. The one exception is that of boron. For turf boron is rated the same as other horticulture crops. However, no
boron recommendation is given for turf.
Soil Sample Information Form On the following page is a copy of the soil sample information form that is used with the submission of
commercial horticultural crops and turf. Proper entry of grower and county information is necessary for correct
billing of the soil tests. As many as six soil samples can be submitted per form. With each sample information is
requested regarding irrigation, topography, last liming date, soil region and prior crop. This information although
not necessary for obtaining a recommendation is useful toward providing a better recommendation. Also requested
is the cropping option for which a recommendation is desired. Crop codes are chosen from the gray box above the
cropping options box. Crop age applies only when blueberries are chosen as a cropping option.
( )56.43*4
85*110)1000/( 252
PtestftlbOP −=
( )56.43*4
*101005.75)1000/( 22
KtestCECftlbOK −+=