soil nutrient levels and crop performance at varying - csbe-scgab.ca
TRANSCRIPT

Papers presented before CSAE/SCGR meetings are considered the property of the Society. In general, the Society reserves the right
of first publication of such papers, in complete form; however, CSAE/SCGR has no objections to publication, in condensed form, with credit to the Society and the author, in other publications prior to use in Society publications. Permission to publish a paper in full may be requested from the CSAE/SCGR Secretary, PO Box 316, Mansonville, QC J0E 1X0. Tel/FAX 450-292-3049. The Society is
not responsible for statements or opinions advanced in papers or discussions at its meetings.
Paper No. 05-075
SOIL NUTRIENT LEVELS AND CROP PERFORMANCE AT VARYING
POSITIONS RELATIVE TO MANURE BANDS
B. Assefa
Department of Biosystems Engineering, University of Manitoba, Winnipeg, Manitoba R3T
5V6
Y. Chen
Department of Biosystems Engineering, University of Manitoba, Winnipeg, Manitoba R3T
5V6
K. Buckley
Brandon Research Center, Agriculture & Agri-Food Canada, Brandon, Manitoba R7A
5Y3
W. Akinremi
Department of Soil Science, University of Manitoba, Winnipeg, Manitoba R3T 5V6
Written for presentation at the CSAE/SCGR 2005 Meeting
Winnipeg, Manitoba June 26 - 29, 2005

2
A field experiment was carried out to investigate nutrient distribution in the soil
and crop response at different lateral positions relative to injected manure bands. Liquid swine manure was injected at three micro-rates (r1 = 1.2 10 -3 m3 m-1 tool-1,
r2 = 2.4 10 -3 m3 m-1 tool-1, and r3 = 3.6 10 -3 m3 m-1 tool-1) achieved by varying the
spacing between manure bands. Manure application at each of the micro-rates
was performed using two types of injection tools (Coulter and Furrower). Manure nutrient distribution was characterised using measured levels of soil inorganic
nitrogen and phosphorus at varying positions relative to the centre line of manure
band during the growing season. Soil pH and EC were also determined at the same positions. Plant development characteristics (number of tillers, number of
heads, and stem length) and biomass were used as parameters for measuring and
comparing crop performance at varying positions relative to the centre line of manure band. Results indicate that nutrient levels and crop performance could be
reduced with greater distance away (farther position) from the center line of
manure bands, especially at the highest micro-rate.

3
INTRODUCTION
Injection of liquid manure into soils adds to levels of soil nutrients present in the soil
prior to injection of the manure. This brings about sharp difference in soil nutrient levels
between the spread (reach) of manure band and lateral positions beyond. Manure band is
defined as the manure that has been placed in a slot formed by an injection tool in the soil
along the direction of travel during the injection operation. Following injection, the
manure nutrients move both laterally and vertically within the soil. To some extent, the
lateral movement (towards the middle of two successive bands) of the manure nutrients
within the soil will change the sharp nature of difference in soil nutrient levels mentioned
above to a more gradual one. This process, which varies with soil type, contributes to
manure nutrient distribution in the soil.
Distribution of manure nutrients in soil is also affected by the width of the manure bands
initially placed into the soil. The width of the manure bands in turn depends on the
injection tool to be used and soil conditions. Sweep-type tools place manure in wider
bands as compared to disc and knife types (Chen 1999; Hultgreen and Stock 1999;
Sawyer et al. 1991; Warner and Godwin 1988). Such placement of manure in the soil
favours uniform distribution of nutrients within the soil. Thus the width of manure band
at the time of injection and the lateral movement of the manure nutrients after injection
determine the extent of manure nutrients distribution in the soil and hence the availability
of nutrients to plants.

4
This needs to be substantiated with scientific findings. However, there is little
documentation in the literature to address this issue and it would be appropriate to carry
out relevant experiments. Therefore, the objective of this study was to investigate nutrient
distribution in the soil and crop response at different lateral positions relative to injected
manure bands based on field experiment. The first year results of a three-year field
experiment were reported in this paper.
MATERIAL AND METHODS
Site description
The field site is located at the Brandon Research Centre, Brandon, Manitoba, Canada.
The experiment for which results are included in this paper was conducted in the growing
season of 2002. The soil is classified as the Janick series in the Orthic Black soil zone
with clay loam surface texture that was developed on moderately to strongly calcareous
silty clay to clay lacustrine deposits (Fitzmaurice et al. 1999). The field was pre-seeding
burnt-off with Roundup at an average rate of 1.55 L/ha.
Experimental design
A 2 by 3 factorial experiment set up in a randomized complete block design was used.
The factors were two types of injection tools: Furrowers (120 mm wide) and Coulters
(460 mm diameter) and three micro-rates: r1 = 1.2 10 -3
m3 m
-1 tool
-1, r2 = 2.4 10
-3 m
3
m-1
tool-1
, and r3 = 3.6 10 -3
m3 m
-1 tool
-1. Detailed definition and explanation of micro-
rate was presented in Rahman et al. (2004). The manure flow rate was kept constant by
maintaining constant pumping rate during the entire manure injection operation. Thus, on
a per hectare basis, the same manure application rate (34 m3/ha) was applied to all the

5
plots and this was considered as a macro-rate. The target micro-rates were achieved by
adjusting the forward speed of the injector and varying the spacing between individual
tools. Descriptions of equipment used and field operation procedure have been given in
detail in Assefa et al. (2004).
Sampling procedures
Soil and manure properties Soil sampling was done to a depth of 150 mm with copper
core samplers of 52 mm diameter before manure application. This was done to determine
the soil moisture content and bulk density immediately prior to manure injection. The soil
samples were collected from five random plots across the entire field site. Representative
manure samples were collected at the time of manure loading into the applicator for
characterization of the manure used in the study. Soil properties determined and
characteristics of the manure used were presented in Assefa et al. (2004).
Soil nutrients Following manure injection, soil sampling for nutrient analyses was
performed at various positions relative to manure bands (Fig. 1). One sampling position
(labelled as A1, A2, and A3) was located on the centre lines of the manure bands for the r1,
r2, and r3 micro-rate treatments, respectively. One (B1), two (B2 & C2), and three (B3, C3,
& D3) sampling positions were located between the bands for the r1, r2, and r3 treatments,
respectively. Positions within a given treatment were spaced 150 mm apart. The sampling
was done at three random locations along each position in each plot. The samples
collected from the three random locations were mixed together to form a composite
sample of the respective position.

6
The first soil sampling was carried out to a depth of 300 mm, three weeks after the
manure application. By then the crop had reached a state of full emergence. During the
first sampling, the sampling locations were flag-marked for use in subsequent samplings.
Thereafter, four successive samplings were carried out every two weeks giving a total of
five sampling times. The samples were analysed for NO3-N, NH4-N, P, pH, and electrical
conductivity (EC).
Plant development characteristics Whole plant samples were collected by randomly
uprooting 40 plants per plot for the r3 treatment, 20 from each of the plant rows (B3 and
D3) between any two random but consecutive manure bands. Row B3 represents a plant
row close to a reference manure band whereas row D3 represents plant row farther from
the reference manure band but mid way between the reference and an adjacent manure
band. This was done to study if there are any differences in the plant development
characteristics, that is, number of tillers, number of heads, and stem length due to the
varied positions of plant rows relative to manure bands. Schematic description of the
plant rows relative to manure bands and soil sampling positions are given in Fig. 1.
Another set of plant samples was collected to determine plant biomass. This set of plant
samples consists of 500-mm long crop rows cut at three random locations from each of
two different crop rows in the r3 treatments between consecutive manure bands. The
samples for each row from the three locations were combined to form a composite
sample for that row. This means that each sample represents for the biomass from a row
length of 1.5 m. The samples were labelled as B3 or D3. Samples with the label B3
represented rows close to the manure band whereas those with label D3 represented
midway crop row between the manure bands. This was done to examine difference in

7
biomass, if any, due to crop position relative to manure bands. Plant biomass was
determined on the dry matter of the plant samples using the oven-dry method, at 60ºC for
72 h (ASAE 2002).
Statistical analyses
The data were analysed using SAS software (SAS Institute Inc. 2001). Analysis of
Variance (ANOVA) using the general linear model (GLM) procedure was carried out to
calculate mean values of variables of interest at different positions within each treatment.
Least Significant Difference (LSD) test was employed to determine within treatment
mean differences at different positions. All comparisons were made at a 0.1 level of
significance.

8
RESULTS AND DISCUSSION
Inorganic nitrogen
Levels of soil NO3-N as influenced by position relative to manure band placement at
varying micro-rates using Coulter tool are given in Table 1. Three weeks after injection,
there was no significant difference in the level of soil NO3-N between positions A1 and
B1 within r1 treatment. Within r2 and r3 treatments, the levels of soil NO3-N decreased
with position away from manure band. Five weeks after injection, soil NO3-N decreased
with distance away from manure band within r1 and r3 treatments whereas it remained
unaffected by position within r2 treatment. Seven to eleven weeks after injection, soil
NO3-N remained unaffected by position within r1 and r2 treatments. Within r3 treatment,
the previous trend, decreasing in soil NO3-N with distance away from manure band was
observed at seven and nine weeks after injection whereas there was no difference at
eleven weeks after the injection.
Levels of soil NO3-N at varying positions relative to manure band following manure
placement at different micro-rates using Furrower tool are shown in Table 1. Within r1
treatment, the level of soil NO3-N was lower at position B1 than at A1 at three weeks after
injection. For the same treatment, there was no difference in soil NO3-N between the
positions at five to eleven weeks after injection. Within the r2 treatment, there were no
differences in soil NO3-N between any of the positions throughout the measurement.
Within r3 treatment, soil NO3-N decreased with distance away from the manure band
when measured at three, five, seven, and nine weeks after injection.
9
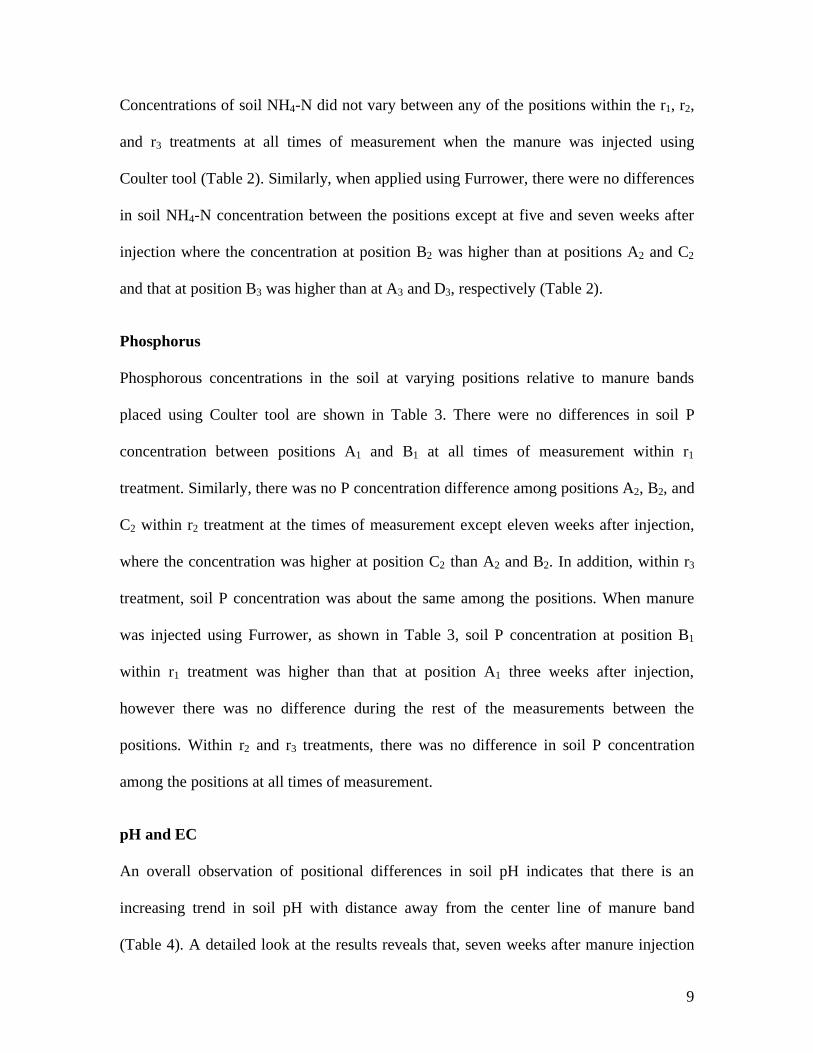
Concentrations of soil NH4-N did not vary between any of the positions within the r1, r2,
and r3 treatments at all times of measurement when the manure was injected using
Coulter tool (Table 2). Similarly, when applied using Furrower, there were no differences
in soil NH4-N concentration between the positions except at five and seven weeks after
injection where the concentration at position B2 was higher than at positions A2 and C2
and that at position B3 was higher than at A3 and D3, respectively (Table 2).
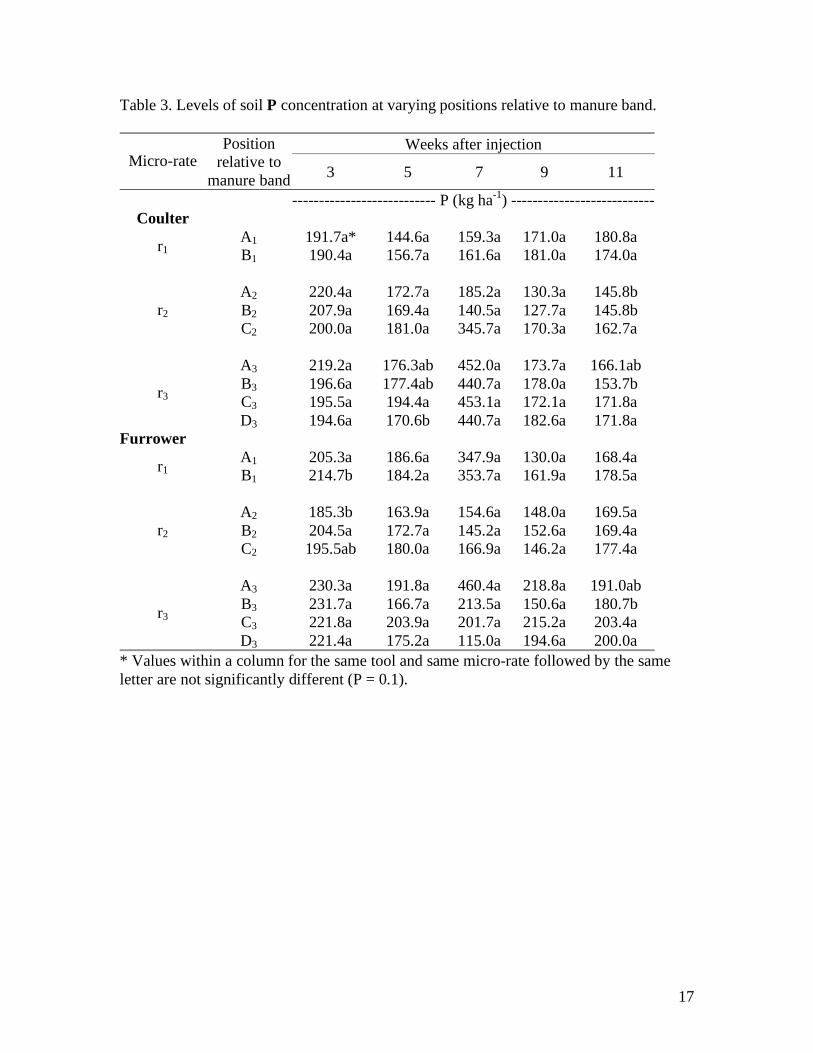
Phosphorus
Phosphorous concentrations in the soil at varying positions relative to manure bands
placed using Coulter tool are shown in Table 3. There were no differences in soil P
concentration between positions A1 and B1 at all times of measurement within r1
treatment. Similarly, there was no P concentration difference among positions A2, B2, and
C2 within r2 treatment at the times of measurement except eleven weeks after injection,
where the concentration was higher at position C2 than A2 and B2. In addition, within r3
treatment, soil P concentration was about the same among the positions. When manure
was injected using Furrower, as shown in Table 3, soil P concentration at position B1
within r1 treatment was higher than that at position A1 three weeks after injection,
however there was no difference during the rest of the measurements between the
positions. Within r2 and r3 treatments, there was no difference in soil P concentration
among the positions at all times of measurement.
pH and EC
An overall observation of positional differences in soil pH indicates that there is an
increasing trend in soil pH with distance away from the center line of manure band
(Table 4). A detailed look at the results reveals that, seven weeks after manure injection

10
using Coulter tool, position A1 had a lower soil pH than position B1 within r1 treatment.
Similarly, in the r2 treatment position A2 had lower pH than both positions B2 and C2,
three weeks after the manure injection. Within r3 treatment the soil pH at position A3 was
lower than those at B3, C3, and D3 three weeks after injection. At that same time of
sampling, position B3 had a lower soil pH than positions C3 and D3 which were similar to
each other. Five weeks after injection, soil pH at positions A3 and B3 were lower than
those at C3 and D3 whereas at the time of last sampling soil pH at position A3 was lower
than those at B3, C3, and D3.
Within the r1 treatment where manure was injected using the Furrower tool the soil pH at
position A1 was lower than that at position B1 three and five weeks after injection but not
at other times of sampling. Within the r2 treatment the pH remained unaffected by
position at all sampling times except at nine weeks after injection whereby position A2
had lower soil pH than B2 and C2. Similarly, differences in soil pH within the r3 treatment
were not consistent. Three weeks after the injection position A3 had lower soil pH than
the rest and position B3 had lower pH than C3 and D3. Seven weeks after injection,
position A3 had lower pH than B3, C3, and D3.
Unlike soil pH, soil EC followed decreasing trend with position away from the center of
manure band (Table 5). Though the general trend still holds true, within the r1 treatment
where manure was injected using Coulter tool there was no significant difference
observed between positions A1 and B1 at all sampling times. A more obvious difference
was evidenced within the r3 treatment where EC at position A3 was much higher than the
rest positions three and five weeks after injection. In contrast, in plots where manure was
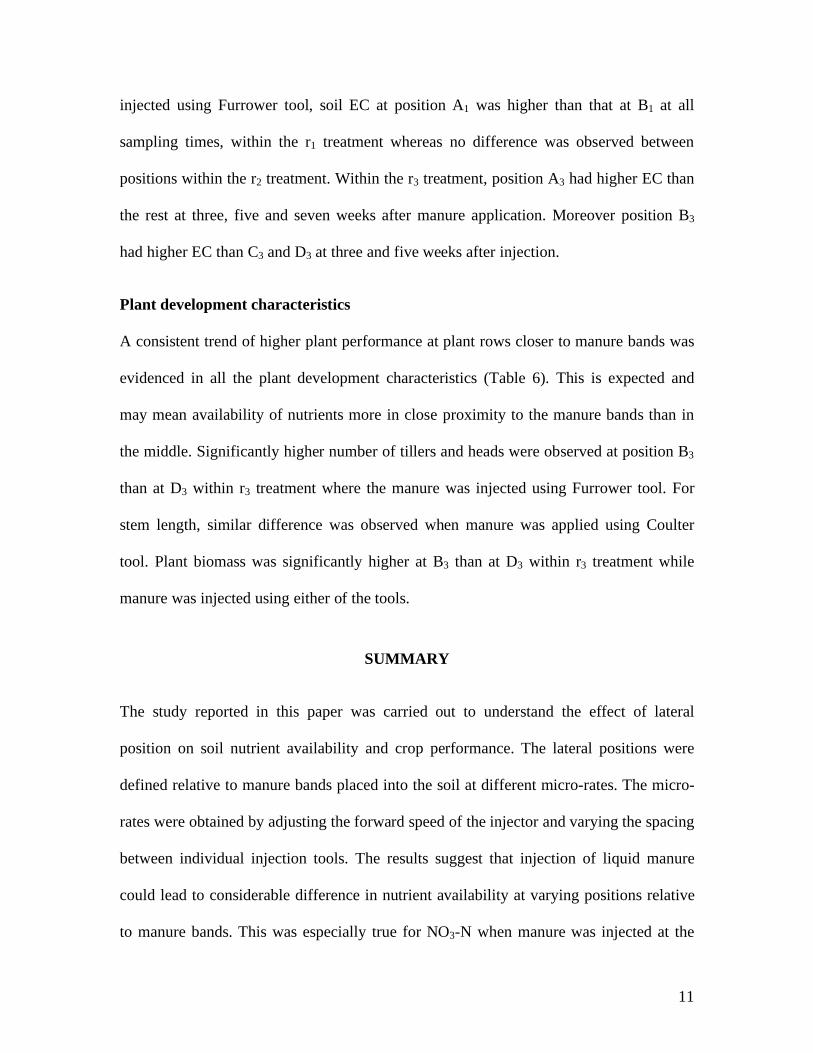
11
injected using Furrower tool, soil EC at position A1 was higher than that at B1 at all
sampling times, within the r1 treatment whereas no difference was observed between
positions within the r2 treatment. Within the r3 treatment, position A3 had higher EC than
the rest at three, five and seven weeks after manure application. Moreover position B3
had higher EC than C3 and D3 at three and five weeks after injection.
Plant development characteristics
A consistent trend of higher plant performance at plant rows closer to manure bands was
evidenced in all the plant development characteristics (Table 6). This is expected and
may mean availability of nutrients more in close proximity to the manure bands than in
the middle. Significantly higher number of tillers and heads were observed at position B3
than at D3 within r3 treatment where the manure was injected using Furrower tool. For
stem length, similar difference was observed when manure was applied using Coulter
tool. Plant biomass was significantly higher at B3 than at D3 within r3 treatment while
manure was injected using either of the tools.
SUMMARY
The study reported in this paper was carried out to understand the effect of lateral
position on soil nutrient availability and crop performance. The lateral positions were
defined relative to manure bands placed into the soil at different micro-rates. The micro-
rates were obtained by adjusting the forward speed of the injector and varying the spacing
between individual injection tools. The results suggest that injection of liquid manure
could lead to considerable difference in nutrient availability at varying positions relative
to manure bands. This was especially true for NO3-N when manure was injected at the
12
highest micro-rate (r3 = 3.6 10 -3
m3 m
-1 tool
-1). That is, the availability was reduced
with farther position from the center of the manure bands. This was also supplemented by
the crop development characteristics that generally showed a consistently decreasing
trend in crop performance with increasing distance in crop rows away from the manure
bands. However, the results of this study are subject to comparison and verification with
the other two years data within the same experiment and the literature.

13
REFERENCE
ASAE 2002. Moisture measurement-Forages. ASAE Standards. 49th
ed. St. Joseph, MI.
Assefa, B., Y. Chen, K. Buckley, and W. Akinremi. 2004. Nutrient availability and crop
response as affected by injection tool type and spacing. ASAE Paper No. MB04-
500. St. Joseph, MI: ASAE
Chen, Y. 1999. Criteria for selecting liquid manure injector. In proceedings of the
Manitoba swine manure management workshop, 18-20. K. Carman, Manitoba.
October 27.
Fitzmaurice, J., E.St. Jacques, A. Waddell, and R.G. Eilers. 1999. Soils of the Brandon
Research Centre – updated from Hopkins and St. Jacques, 1985. Report prepared by
the Land Resource Unit, Brandon Research Centre, Agriculture and Agri-Food
Canada, Special Report Series 99-2.
Hultgreen, G. and W. Stock. 1999. Injecting swine manure with minimum disturbance. In
Proceedings of tri-provincial conference on manure management, 52-65.
Saskatoon, SK. June 22-25.
Rahman, S., Y. Chen, K. Buckley, and W. Akinremi. 2004. Slurry distribution in soil as
influenced by slurry application micro-rate and injection tool type. Biosystems
Engineering 89(4): 495-504.
SAS Institute Inc. 2001. SAS (r) proprietary software release 8.2. Cary, NC.
Sawyer, J.E., M.A. Schmitt, R.G. Hoeft, J.C. Siemens, and D.H. Vanderholm. 1991. Corn
production associated with liquid beef manure application methods. Journal of
Production Agriculture 4(3): 335-344.

14
Warner, N.L. and R.J. Godwin. 1988. An experimental investigation into factors
influencing the soil injection of sewage sludge. Journal of Agricultural Engineering
Research 39(4): 287-300.
Warner, N.L. and R.J. Godwin. 1988. An experimental investigation into factors
influencing the soil injection of sewage sludge. Journal of Agricultural Engineering
Research 39(4): 287-300.
ACKNOWLEDGEMENTS
The financial support from Manitoba Livestock Manure Management Initiative
(MLMMI) and the Natural Sciences and Engineering Research Council of Canada
(NSERC) is gratefully acknowledged. Assistance of former graduate students: Shafiqur
Rahman, Faustinus Monero, and Van Doan in the fieldwork is also appreciated.

15
Table 1. Levels of soil NO3-N concentration at varying positions relative to manure band.
Weeks after injection Micro-rate
Position
relative to
manure band 3 5 7 9 11
--------------------------- NO3-N (kg ha-1
) -----------------------
Coulter
A1 199.1a* 91.0a 46.2a 16.7a 7.6a r1 B1 107.8a 46.6b 23.2a 30.7a 12.0a
A2 171.9a 25.8a 7.8a 10.3a 4.8ab
B2 59.0b 18.8a 8.3a 10.6a 4.5b r2
C2 34.0b 17.4a 24.0a 8.7a 7.0a
A3 310.9a 143.1a 36.2b 15.7ab 6.9a
B3 108.4b 67.2b 89.3a 26.2a 6.8a
C3 67.8b 11.9c 18.2c 8.8ab 6.0a
r3
D3 56.7b 7.5c 20.3b 6.4b 4.5a
Furrower
A1 191.5a 80.8a 62.8a 12.3a 8.7a r1 B1 86.1b 22.5a 36.4a 14.0a 10.7a
A2 82.3a 66.3a 8.0a 4.9a 4.5a
B2 108.5a 62.6a 17.4a 9.5a 4.8a r2
C2 89.8a 38.4a 12.7a 8.0a 4.8a
A3 299.8a 160.6a 190.4a 38.0a 10.5a
B3 116.9b 78.4b 23.4ab 14.2b 17.0a
C3 66.2bc 24.9c 13.3b 14.0b 7.2a
r3
D3 34.0c 15.5c 9.0b 7.6b 6.6a
* Values within a column for the same tool and same micro-rate followed by the same
letter are not significantly different (P = 0.1).

16
Table 2. Levels of soil NH4-N concentration at varying positions relative to manure band.
Weeks after injection Micro-rate
Position
relative to
manure band 3 5 7
------------------ NH4-N (kg ha-1
) -----------------
Coulter
A1 1.90a* 5.65a 2.15a r1 B1 2.15a 5.57a 2.14a
A2 2.38a 3.84a 2.78a
B2 2.33a 4.02a 2.51a r2
C2 2.43a 4.41a 3.20a
A3 1.88a 4.84a 2.86a
B3 1.90a 5.80a 2.98a
C3 1.90a 5.42a 2.37a
r3
D3 2.05a 5.88a 2.26a
Furrower
A1 2.03a 5.65a 2.60a r1 B1 2.13a 9.13a 2.34a
A2 2.28a 3.45b 2.10a
B2 1.90a 5.20a 2.71a r2
C2 2.65a 3.36b 2.09a
A3 2.10a 5.05a 2.16b
B3 2.10a 6.78a 3.45a
C3 2.23a 5.65a 2.41ab r3
D3 2.43a 5.09a 2.24b
* Values within a column for the same tool and same micro-rate followed by the same
letter are not significantly different (P = 0.1).
17
Table 3. Levels of soil P concentration at varying positions relative to manure band.
Weeks after injection Micro-rate
Position
relative to
manure band 3 5 7 9 11
--------------------------- P (kg ha-1
) ---------------------------
Coulter
A1 191.7a* 144.6a 159.3a 171.0a 180.8a r1 B1 190.4a 156.7a 161.6a 181.0a 174.0a
A2 220.4a 172.7a 185.2a 130.3a 145.8b
B2 207.9a 169.4a 140.5a 127.7a 145.8b r2
C2 200.0a 181.0a 345.7a 170.3a 162.7a
A3 219.2a 176.3ab 452.0a 173.7a 166.1ab
B3 196.6a 177.4ab 440.7a 178.0a 153.7b
C3 195.5a 194.4a 453.1a 172.1a 171.8a r3
D3 194.6a 170.6b 440.7a 182.6a 171.8a
Furrower
A1 205.3a 186.6a 347.9a 130.0a 168.4a r1 B1 214.7b 184.2a 353.7a 161.9a 178.5a
A2 185.3b 163.9a 154.6a 148.0a 169.5a
B2 204.5a 172.7a 145.2a 152.6a 169.4a r2
C2 195.5ab 180.0a 166.9a 146.2a 177.4a
A3 230.3a 191.8a 460.4a 218.8a 191.0ab
B3 231.7a 166.7a 213.5a 150.6a 180.7b
C3 221.8a 203.9a 201.7a 215.2a 203.4a r3
D3 221.4a 175.2a 115.0a 194.6a 200.0a
* Values within a column for the same tool and same micro-rate followed by the same
letter are not significantly different (P = 0.1).

18
Table 4. Levels of soil pH at varying positions relative to manure band.
Weeks after injection Micro-rate
Position
relative to
manure band 3 5 7 9 11
--------------------------- pH ---------------------------
Coulter
A1 7.63a* 7.63a 7.70b 7.85a 7.75a r1 B1 7.68a 7.68a 7.85a 7.80a 7.80a
A2 7.43a 7.58a 7.75a 7.73a 7.83a
B2 7.55b 7.63a 7.75a 7.68a 7.80a r2
C2 7.60b 7.68a 7.75a 7.70a 7.80a
A3 7.35c 7.53b 7.68a 7.63a 7.75a
B3 7.50b 7.55b 7.60a 7.65a 7.68b
C3 7.55ab 7.65a 7.63a 7.68a 7.65b
r3
D3 7.63a 7.65a 7.70a 7.65a 7.68b
Furrower
A1 7.53b 7.58b 7.73a 7.63a 7.85a r1 B1 7.60a 7.73a 7.78a 7.65a 7.83a
A2 7.68a 7.70a 7.75a 7.75b 7.78a
B2 7.68a 7.73a 7.75a 7.83a 7.78a r2
C2 7.70a 7.75a 7.78a 7.83a 7.78a
A3 7.40c 7.68a 7.60b 7.65a 7.83a
B3 7.53b 7.50a 7.68a 7.65a 7.80a
C3 7.58ab 7.58a 7.65ab 7.73a 7.80a r3
D3 7.60a 7.65a 7.68a 7.70a 7.75a
* Values within a column for the same tool and same micro-rate followed by the same
letter are not significantly different (P = 0.1).

19
Table 5. Levels of soil EC at varying positions relative to manure band.
Weeks after injection Micro-rate
Position
relative to
manure band 3 5 7 9 11
--------------------------- EC (dS m-1
) ---------------------------
Coulter
A1 0.84a* 0.71a 1.61a 0.52a 0.50a r1 B1 0.62a 0.63a 0.60a 0.55a 0.49a
A2 0.79a 0.63a 0.60ab 0.53a 0.50a
B2 0.56a 0.56a 0.57b 0.49a 0.48ab r2
C2 0.55a 0.61a 0.62a 0.50a 0.44b
A3 1.20a 0.78a 0.63a 0.54a 0.48ab
B3 0.59b 0.64b 1.31a 0.53a 0.47a
C3 0.56b 0.60b 0.66a 0.53a 0.39a
r3
D3 0.54b 0.58b 0.61a 0.51a 0.43a
Furrower
A1 0.83a 0.71a 0.64a 0.53b 0.52a r1 B1 0.63b 0.55b 0.57b 0.57a 0.48b
A2 0.62a 0.66a 0.63a 0.55a 0.55a
B2 0.66a 0.69a 0.62a 0.55a 0.53a r2
C2 0.63a 0.60a 0.62a 0.51a 0.47a
A3 1.12a 0.85a 0.75a 0.61a 0.50a
B3 0.70b 0.68b 0.65b 0.55ab 0.54a
C3 0.60c 0.58c 0.61b 0.50b 0.49a r3
D3 0.55c 0.55c 0.61b 0.49b 0.50a
* Values within a column for the same tool and same micro-rate followed by the same
letter are not significantly different (P = 0.1).

20
Table 6. Plant characteristics within the r3 micro-rate treatment.
Plant characteristic Position Coulter Furrower
B3 2.97a* 3.04a Number of tillers
D3 2.69a 2.40b
B3 2.71a 2.60a Number of heads
D3 2.52a 2.16b
B3 594.5a 563.7a Stem length (mm)
D3 575.1b 549.7a
B3 214.0a 218.7a Biomass (g/m)
D3 129.2b 135.7b
* Values within a column and same plant characteristic followed by the same letter are
not significantly different (P = 0.1).

21
Figure 1. A schematic diagram of manure band, soil sampling position, and plant rows:
(a) micro-rate r1, (b) micro-rate r2, and (c) micro-rate r3.
Ar
Soil sampling position Manure band
S stands for tool spacing Plant row
A1 B1
Soil Surface
S = 300 mm
(a)
A3 B3 C3 D3
S = 900 mm
(C)
A2 B2 C2
S = 600 mm
(b)