soil friability its effect on soil aggregate stability cotton soil whose value increases from 0.20%...
TRANSCRIPT

IJSRD - International Journal for Scientific Research & Development| Vol. 3, Issue 12, 2016 | ISSN (online): 2321-0613
All rights reserved by www.ijsrd.com 96
Soil Friability its Effect on Soil Aggregate Stability P Anand1 Dr.Guruprasad Hugar2 Md.Khaja Moniuddin3 S B Jagdish4
1,4P.G. Student 2,3Assistant Professor 1,3,4Department of Civil Engineering
1,2B.K.I.T. College Bhalki, District Bidar 4Government Sri Krishnarajendra Silver Jubilee Technological
Institute, K. R. Circle, Bangalore 560001Abstract— In many parts of the world the shrink-swell
characteristics of fine-grained material is of considerable
importance and of potential economic significance.
Expansive soils cause significant damage to structures and
roadways by cyclically shrinking and swelling within the
active zone, which is defined as the depth in a soil to which
periodic changes of moisture occurs. The term ‘soil
friability’ has been defined as the tendency of a mass of
unconfined soil in bulk to crumble and break down under
applied stress into smaller fragments, aggregates and
individual soil particles. There is a general concern that low
soil organic carbon (SOC) contents may deteriorate soil
physical properties. This study has been conducted to
illustrate the effect of SOC on soils shrinkage limit (Ws) and
friability index (FI) upon four of the arid soils namely black
cotton, red, marshy and mountainous soils obtained from
organic farms of the study area. Wastes like humus,
pressmud, bagasseash and flyash were used as a source of
SOC to amend with the soils. SOC inputs were made
volumetrically up to 70% in the increments of 10% of the
soil columns; there was also a control column without any
external addition of SOC. The relation between SOC,
shrinkage limits and friability index was analyzed by series
of experiments carried in triplicate in three different phases
based on the mode of application of SOC. Natural soil was
amended with humus, bagasseash, flyash, pressmud to the
percentage of 0 to 40 for first phase, 0 to 70 for second
phase and laying of amended materials on the natural soil
for the third phase. Which are test for 0, 7, 14, 21 and 28
days respectively. The friability index (FI) was tested for
black cotton soil whose value increases from 0.20% to
6.32% at 40% pressmud amended with a natural soil where
by the values increase from 1.59% to 16.81% at 40%
pressmud for the red soil and also the values increase from
0.73%to 13.77% at 70% pressmud amended with natural
soil.
Key words: Soil Friability, Soil Aggregate
I. INTRODUCTION
Organic composed soil is arable which is widely known.
This kind of soil always causes deterioration of soil
structure. In recent days the use of mixing of natural soil
with organic composed soil that is known as organic
amendments which is becoming most burning issue now
days. Organic matter (OM) helps to change the physical and
chemical properties as well as mechanical properties of the
soil like water content, plasticity, durability shrinkage
properties porosity, permeability etc. The soil organic
content will increase by adding an organic fertilizer which
indirectly helps the soil resist the deformation and
compatibility of the soil. If the aggregates lose their
structural stability the dispersed clay particles would clog up
the pores thus denying the infiltration of the rainwater into
the soil, later on they completely seal the soil surface
leading to crust formation. These crusts promote erosion
especially through surface run-off. However, this does not
mean that aggregates should always be stronger; they should
also be weak enough for the penetration of roots inside
them. Thus optimizing the statement of soil aggregation
implying strong enough to resist structural damage along
with facilitating the root penetration. Aggregate stability is
the ability of aggregates to resist disruptive forces to abate
soil erosion. This is why aggregate stability is studied
comprehensively since early 1900s. In the study of
aggregate stability, diverse opinions have come from
researchers regarding the poor performance of certain types
of organic material, or regarding the consistent effects of
certain soil factors on aggregate stability. However soil
aggregate stability can be summarized into three statements:
1) Difficulty in measuring the aggregate stability
2) Difficulty in determining the relative importance of
several aggregate stability factors and
3) Difficulty in dealing with the diverse nature of the
soil constituents that affect aggregate stability.
Although most researchers are aware of these three
problems, so far no study have come which could discuss
these three problems together with respect to aggregate
stability.
Influencing factor for aggregate stability are many
hence it very difficult to measure aggregate stability by
directly are else adequately. The indices however doesn’t
represent the aggregate stability individually it not a feasible
task however the individually indices only represents the
aggregate stability up to a certain aspects hence the indices
that index is not suitable for all circumstances thus few of
the researchers recommend the use of several indices
simultaneously with the intention that each index measures
the respective aspects of aggregate stability that are not
measured by the other indices. Thus multi indices give raise
to ambiguity of selecting the number of indices and in
particular any of the indices to stress on. As well as there is
no guarantee that selected indices have thoroughly measured
aggregate stability. It is very difficult to determine the
importance of relationship between soil factor and aggregate
stability however changes are recorded with variation of
aggregate stability. Causality can only be inferred from
control experiments have major disadvantages.
They can overestimate the effect of a factor
because other important factors of aggregate stability are
controlled but correlation studies (for measuring
associations) may measure the effect of a factor more
realistically because all factors are considered
simultaneously. Some of the engineer properties like
practical size distribution, specific gravity, compressive
parameters are extensively studied because organic matter
constitutes important aggregate stability
Soil Friability its Effect on Soil Aggregate Stability
(IJSRD/Vol. 3/Issue 12/2016/024)
All rights reserved by www.ijsrd.com 97
The aggregate model C-P-OM (clay-polyvalent
cations-organic matter), for example, shows that organic
matter needs both clay and cations to form and stabilize
aggregates. Nevertheless, an often neglected area of study is
to determine how the aggregate sizes affect aggregate
stability. The most of researchers measure aggregate
stability of whole soils, and then attempt to determine how
aggregate stability relates to the constituents or properties of
whole soils. Aggregate stability of individual aggregate size
fractions, especially aggregates smaller than 250 micron, are
often neglected. The size of the aggregates should not be
neglected because the chemical and physical properties of
aggregates vary with their sizes, and are different from
whole soils. Why this is so is related to the aggregation
process. For all soils, there exists some sort of aggregate
hierarchy, where larger aggregates are assemblages of
smaller aggregates or particles. And because of this
aggregate hierarchy, certain aggregate size fractions have
their own distinct physical and chemical properties. For
example, the distribution of some soil constituents’
especially organic matter decreases in amount with
decreasing aggregate size. Moreover aggregate stability of
aggregate size fractions may be different from one another
because the mechanism of aggregate stability varies with the
aggregate sizes.
II. OBJECTIVES OF THE STUDY
To utilize waste as a source in benefiting soil
properties.
To validate the role of organic carbon in the soil
structural stability (friability).
To verify the role of type of waste on soil friability &
shrinkage.
To test the time dependent influence in the effect of
organic carbon on soil aggregate.
Determine the role of organic carbon in minimizing
soil swell-shrink.
To validate whether SOC was the only dominant
parameter in improving soil properties.
III. LITERATURE REVIEW
A. Aggregate Stability and Size Distribution: (Kemper and
Rosenau, 1986):
The high aggregate stability values to measure aggregate
stability in soils such as the use of water-stable aggregates
(WSA) In this WSA,40g of<4.75mm air-dried soils were put
in the topmost of a nest of four sieves of 2.00,1.00, 0.50, and
0.25mm mesh size and pre-soaked for 30 min in deionized
water. Thereafter, the nest of sieves and its content were
oscillated vertically in water 20 times using 4cm amplitude
at the rate of one oscillation /sec after wet sieving the
resistance soil material on each sieve on and the unstable
aggregate were transferred into beakers, dried in the oven at
60oc until studied wait was achieved the % ratio of the
aggregate in each sieve represents water stable aggregates.
B. The Relationship between Soil Structural Stability and
Erodibility of the Soils: (Le Bissonnais, 1996):
They all observed that soils with weak aggregate stability
erode faster than those with high aggregate stability values.
Soil structure is a very important soil property, which
influences many processes in the soil. There are many
methods for aggregate stability measurement varying in the
energy applied in the treatment. The aim of this paper is to
compare two aggregate stability measurement methods on a
set of reclaimed dumpsite soils. Method proposed by Le
Bissonnias (1996) which allow distinguishing the particular
aggregate breakdown mechanisms.
C. Soil aggregate stability: its evaluation and relation to
organic matter constituents and other soil properties:
(Christopher Teh Boon Sung, 1996):
The purpose of this study was. To compare the aggregate
stability of individual aggregate size fractions. To determine
the interrelationship and efficiency of several aggregate
stability indices, and to determine the relationship and
importance of organic matter and other soil constituents on
aggregate stability. To compare the aggregate stability of
individual aggregate size fractions, a mathematical model
was developed to estimate the breakdown of individual
aggregate size fractions in the wet-sieving (using nested
sieves) method. This model was validated and calibrated by
comparing the estimation values to the actual aggregate
breakdown values by paired sample t-test, linear regression
and prediction error sum of squares. The average percentage
of stable aggregates for all aggregate size fractions were
represented in an index called average intact aggregates
(AlA). To determine the relationship between aggregate
stability and soil constituents, whole soils as well as
individual aggregate size fractions were analysed. For
analysis of whole soils, nine soil samples were analysed for
organic matter and its constituents, texture, free iron oxides,
aggregation, bulk density, cation exchange capacity and
exchangeable cations. Aggregate stability of whole soils was
measured with the same eight indices used in the factor
analysis study. For analysis of individual aggregate size
fractions, four soils were selected. Each soil was separated
into six aggregate size fractions: 1 000-2000) lm, 500- 1
000) lm, 250-500) lm, 1 50- 250) lm, 53-ISO) lm, and <53)
lm. Each aggregate size fraction was analysed as done in the
analysis of whole soils. However, additional analysis
included free aluminium oxides and the carboxyl (COOH)
and phenolic hydroxyl (OR) functional groups in humic acid
(HA) and fulvic acid (FA). Aggregate stability was
measured using WDCS (water dispersible clay) and silt,
WDC (water-dispersible clay) and TP (turbidity percentage)
indices.
D. Aggregate stability is used as an indicator of soil
structure: (Six et al, 2000):
Soil aggregation therefore results from there arrangement of
particles, flocculation and cementation Soil disturbance
from tillage is a major cause of organic matter depletion and
reduction in the number and stability of soil aggregates
when native ecosystems are converted to agriculture. No-till
(NT) cropping systems usually exhibit increased
aggregation and soil organic matter relative to conventional
tillage (CT). However, the extent of soil organic matter
changes in response to NT management varies between soils
and the mechanisms of organic matter stabilization in NT
systems are unclear. We evaluated a conceptual model
which links the turnover of aggregates to soil organic matter
dynamics in NT and CT systems; we argue that the rate of
macro aggregate formation and degradation (i.e. aggregate
Soil Friability its Effect on Soil Aggregate Stability
(IJSRD/Vol. 3/Issue 12/2016/024)
All rights reserved by www.ijsrd.com 98
turnover) is reduced under NT compared to CT and leads to
a formation of stable micro aggregates in which carbon is
stabilized and sequestered in the long term.
E. Aggregate stability as an indicator of soil susceptibility
to runoff and erosion; validation at several levels: (Bernard
barthes, Ericroose, 2001):
The evaluation of soil susceptibility to runoff and water
erosion in the field is often expensive or time-consuming.
Several author have reported that susceptibility is linked to
aggregate stability, whose determine is far easier. However,
this susceptibility has general been dand field-assessed
susceptibility to runoff and erosion.
Susceptibility to runoff and erosion was determined
at several levels first, on southern French regosol, through
measurements of runoff and soil loss from1-m2micro plots
under simulated rainfall. Second from 100-800-m2runoff
plots on a nit sol in benin a ferralsol in Cameroon and to
erosion was determined through semi-quantitative
assessment of the frequency of erosion features on vineyard
hillsides in southern france. Aggregate stability was
determined by immersion in water and wet-sieving of 2-mm
sieved, air 0to 10cm soil samples, which actually tests
aggregate resistance to slaking.
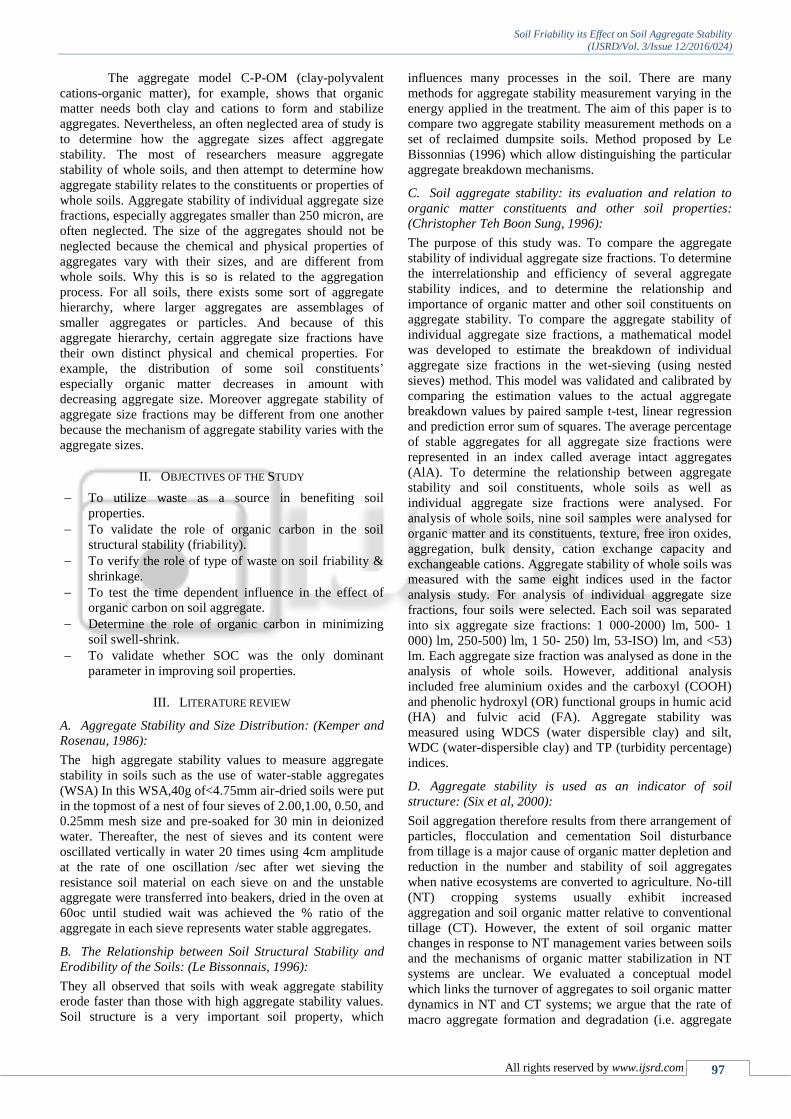
IV. MATERIALS AND METHODOLOGY
A preliminary survey was carried out in different locations
in and around Raichur, India to select the soil samples for
the present study. Raichur, a city and district head quarter in
the Indian state of Karnataka. Raichur located between
Krishna and Tungabhadra rivers. Located at 16.2°N
77.37°E. It has an average elevation of 407 meters (1335 ft).
Four classes of soils namely Black Cotton Soil, Marshy Soil,
Red Soil and Mountainous Soil were taken from different
locations by removing the top 5cm soil and collecting
samples from each location(fig.3.1:bird view of soil
sampling location). then the collected samples are analyzed
in its natural form for particle size distribution by Sieve
analyzing as per IS: 460-1962 and grouped accordingly in
soil class, determined field density by the cores taken from
the field, also analyzed for SOC and field moisture content,
and then analyzed for organic carbon walkley-black, (1934)
and moisture content. Soil amendments like Flyash
(obtained from RTPS) Raichur thermal power station and
Bagasseash, Pressmud (Obtained from Sugar Industry) and
Humus (Agri. University) were used in the study as the
source of SOC (soil organic carbon).
The collected soil samples were then tested in
laboratory for:
Constituents Flyash % Bagasse ash % Constituents Humus % Constituents Pressmud
% (Except pH)
Sio2 61.1 78.34 Water soluble fraction 7 pH 4.95
Al203 28 8.35 Hemicellulose 18.52 Total solids 27.87
Ti02 1.3 1.07 Cellulose 11.44 Volatile Solids 84.00
Fe203 4.2 3.61 Lignin 47.64 C.O.D 117.6
Mgo 0.8 - Protein 10.06 B.O.D 22.2
Cao 1.7 2.15 Ether-soluble fraction 5.34 OM 84.12
K20 0.18 3.46 pH 5.6 N 1.75
Na20 0.18 0.12 SOM 0.83 pH 0.65
LoI 2.4 7.42 SOC 0.28 K 0.28
SOC 0.89 0.85
Na 0.18
SOM 0.3 0.29
Ca 2.7
SOM 0.71
SOC 0.24
Table 5: Composition of amendments
1) Particle size distribution
2) Organic Carbon and organic matter Content
3) Density
4) Specific gravity
V. EXPERIMENTAL INVESTIGATIONS
Sieve Analysis
Carbon Content In Soils and amendments (Walkley-
Black Method)
Moisture content (Pycnometer and Oven Drying)
The collected soil samples were then tested in
laboratory for:
1) Particle size distribution
2) Organic Carbon and organic matter Content
3) Density
4) Specific gravity
A. Particle Size Analysis of Soils and Amendments
Sieve analysis was performed for all the collected soil
samples as per IS: 460-1962 and grouped accordingly in soil
class. BC soil was clayey sand with high plasticity, having
38%sand and 62% silt & clay. Red soil was clayey sand
with intermediate plasticity, having 41%sand and 59% silt &
clay. Mountainous soil was silty sand with low plasticity,
having 42%sand and 58% silt & clay.
Bagasseash particles were uniform non-granular
and average particle sizes ranged between 7μ m to 12 μ m;
Flyash had 1% clay, 12% of silt and 87% of sand content.
Pressmud was coarser than rest of the amendments with its
particle size ranging from 0.1μ to 1mm (20%), 1mm to
10mm (80%). Humus had 38% of fine sand fraction, 35%
silt sized fraction and 27%clay sized fraction
Phase I: Soil-amendment combinations were made
by replacing 0 to 40% mixed in 50% of soil volumes with
amendments by blending it with the top 15cm soil of the
column. The best performed soil amendment combinations
with amendments by blending it with the complete soil of
the column.
Phase II: Soil-amendment combinations were made
by 0 to 70% mixed in complete volume of soil with
amendments by blending it with the 30cm soil of the column
Soil Friability its Effect on Soil Aggregate Stability
(IJSRD/Vol. 3/Issue 12/2016/024)
All rights reserved by www.ijsrd.com 99
Phase III: This phase was similar to phase II with
the only difference that amendments were just stacked at top
without blending with soil.
B. Test Procedure:
Soil columns 10 cm diameter and 30 cm length were
fabricated by acrylic tubes and were then packed with the
collected soil samples to their respective densities. Soil
columns were saturated once and were kept in unsaturated
condition. The study was carried out in three phases based
on the mode of application of SOC to soil as explained
below.
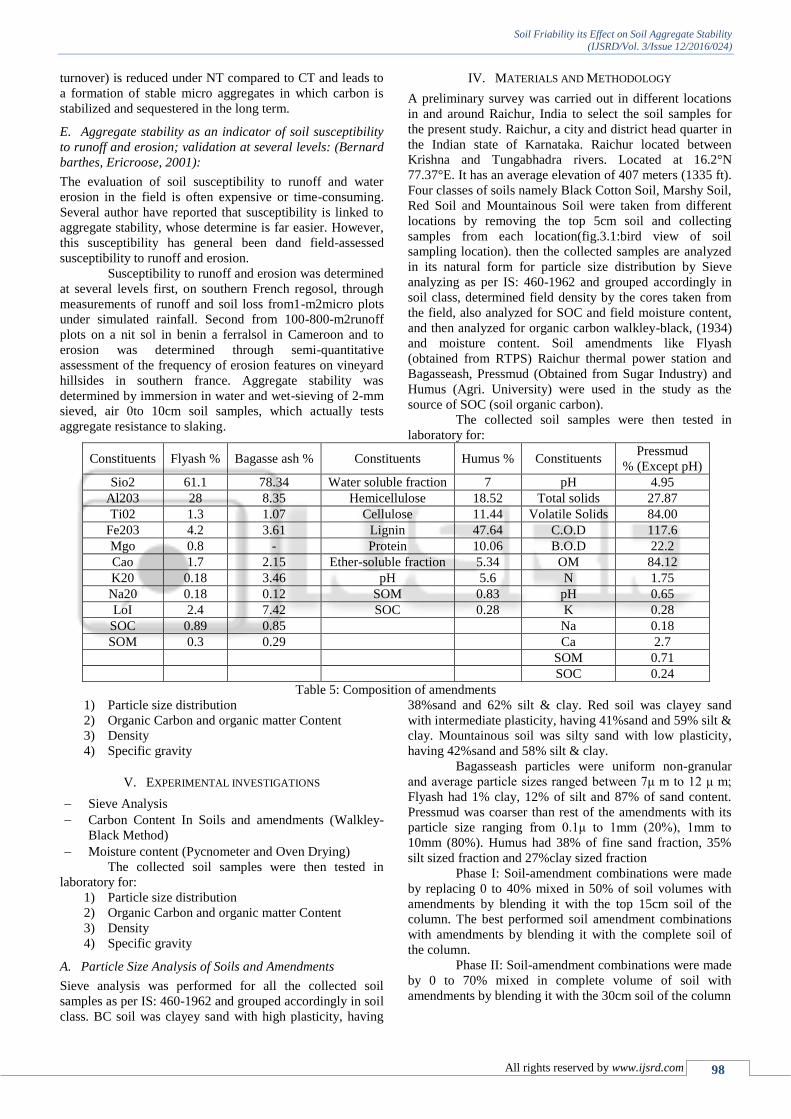
VI. RESULTS AND DISCUSSION
A. Organic Carbon and Organic Matter Present In the Soil
Samples (Walkley-Black Method)
The collected soils were tested for their soil organic carbon
and soil organic matter
Soil SOC in % SOM in %
1 Red soil 0.27% 0.80%
2 Marshy soil 0.285% 0.845%
3 Black cotton soil 0.30% 0.880%
4 Mountainous soil 0.322% 0.948%
Table 6.1: SOC & SOM in soil samples
B. Organic Carbon and Organic Matter Present in the
Amendments
The collected amendments were tested for their soil organic
carbon and soil organic matter
Sl.No. Amendments SOC in % SOM in %
1 Humus 0.277% 0.83%
2 Bagasseash 0.285% 0.845%
3 Flyash 0.30% 0.889%
4 Press mud 0.24% 0.711%
Table 6.2: SOC & SOM in soil samples
Sl.
No
Sieve
Size
Mass of Soil Retained
On Each Sieve (Gm) % Retained
Cumulative %
Retained C
% Finer
(100-C)
1 4.75 317.64 31.76 31.76 68.24
2 4.00 4.61 0.46 32.23 67.78
3 3.35 37.53 3.75 35.98 64.02
4 2.80 20.80 2.08 38.06 61.94
5 2.36 47.93 4.79 42.85 57.15
6 2.00 47.72 4.77 47.62 52.38
7 1.70 38.61 3.86 51.48 48.52
8 1.40 46.88 4.69 56.17 43.83
9 1.18 47.97 4.80 60.97 39.03
10 1.00 59.06 5.91 66.88 33.13
11 8.50E-04 46.94 4.69 71.57 28.43
12 7.70E-04 5.98 0.60 72.17 27.83
13 6.00E-04 33.76 3.38 75.54 24.46
14 5.00E-04 70.12 7.01 82.56 17.45
15 4.25E-04 52.69 5.27 87.82 12.18
16 3.55E-04 0.12 0.01 87.84 12.16
17 3.00E-04 19.08 1.91 89.74 10.26
18 2.50E-04 44.85 4.49 94.23 5.77
19 2.12E-04 19.98 2.00 96.23 3.77
20 1.80E-04 0.71 0.07 96.30 3.70
21 1.50E-04 11.27 1.13 97.43 2.57
22 7.50E-04 17.37 1.74 99.16 0.84
23 0 6.56 0.66 99.82 0.18
TOTAL = 998.18
Table 6.3: Particle Size Distribution in Black Cotton Soilv
Sieve analysis was performed for all the collected
soil sample as per IS: 460-1962 and grouped accordingly in
soil class. BC soil was clayey sand with high plasticity,
having 38%sand and 62% silt & clay.
1) Mountainous Soil:
Soil samples were sieved to determine the particle size
distribution it can determine the percentage of finer for
individual grain sizes lies between 4.75mm to 75 micron
and a pan which differentiate the coarse, fine, silt and clay
percentage of the soil retained.
SL. NO Sieve Size Mass of Soil Retained
on Each Sieve (Gm)
%
Retained
Cumulative %
Retained C
% Finer
(100-C)
1 4.75 133.00 13.30 13.30 86.70
2 4.00 6.23 0.62 13.92 86.08
3 3.35 22.20 2.22 16.14 83.86
4 2.80 14.52 1.45 17.59 82.41
5 2.36 36.92 3.69 21.29 78.71
6 2.00 58.60 5.86 27.15 72.85
7 1.70 51.75 5.18 32.32 67.68
Soil Friability its Effect on Soil Aggregate Stability
(IJSRD/Vol. 3/Issue 12/2016/024)
All rights reserved by www.ijsrd.com 100
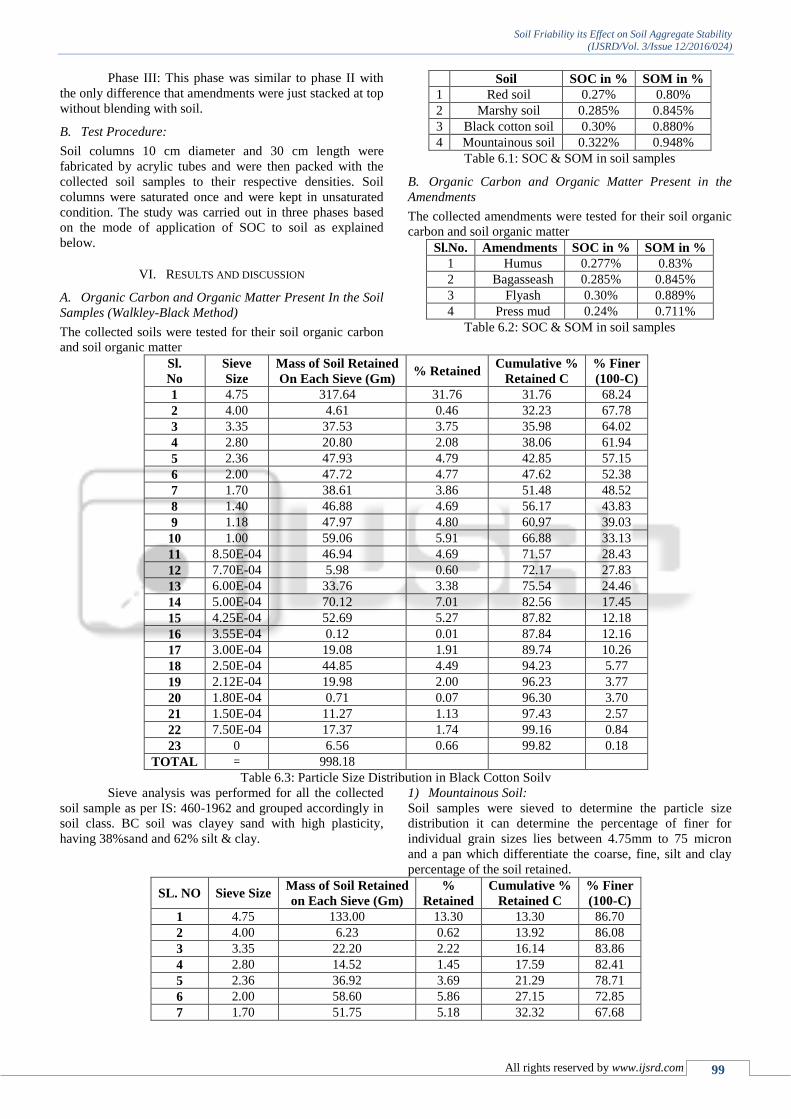
8 1.40 105.50 10.55 42.87 57.13
9 1.18 80.00 8.00 50.87 49.13
10 1.00 89.00 8.90 59.77 40.23
11 8.50E-04 75.00 7.50 67.27 32.73
12 7.70E-04 4.00 0.40 67.67 32.33
13 6.00E-04 36.60 3.66 71.33 28.67
14 5.00E-04 85.50 8.55 79.88 20.12
15 4.25E-04 38.20 3.82 83.70 16.30
16 3.55E-04 6.00 0.60 84.30 15.70
17 3.00E-04 21.50 2.15 86.45 13.55
18 2.50E-04 45.00 4.50 90.95 9.05
19 2.12E-04 25.00 2.50 93.45 6.55
20 1.80E-04 1.20 0.12 93.57 6.43
21 1.50E-04 13.30 1.33 94.90 5.10
22 7.50E-04 31.30 3.13 98.03 1.97
23 0 15.13 1.51 99.54 0.46
Total = 995.45
Table 6.4: Particle Size Distribution in Mountainous Soil.
Sieve analysis was performed for all the collected
soil sample as per IS: 460-1962 and grouped accordingly in
soil class. Mountainous soil was silty sand with low
plasticity, having 42%sand and 58% silt & clay.
2) Marshy Soil:
Soil samples were sieved to determine the particle size
distribution it can determine the percentage of finer for
individual grain sizes lies between 4.75mm to 75 micron
and a pan which differentiate the coarse, fine, silt and clay
percentage of the soil retained.
Sl. No Sieve Size Mass of Soil Retained
on Each Sieve (gm) % Retained
Cumulative %
Retained C
% Finer
(100-C)
1 4.75 51.13 5.11 5.11 94.89
2 4.00 1.04 0.10 5.22 94.78
3 3.35 70.30 7.03 12.25 87.75
4 2.80 1.69 0.17 12.42 87.58
5 2.36 7.59 0.76 13.18 86.83
6 2.00 6.22 0.62 13.80 86.20
7 1.70 5.38 0.54 14.34 85.67
8 1.40 6.58 0.66 14.99 85.01
9 1.18 6.38 0.64 15.63 84.37
10 1.00 15.37 1.54 17.17 82.83
11 8.50E-04 22.32 2.23 19.40 80.60
12 7.70E-04 4.85 0.49 19.89 80.12
13 6.00E-04 33.25 3.33 23.21 76.79
14 5.00E-04 132.05 13.21 36.42 63.59
15 4.25E-04 170.47 17.05 53.46 46.54
16 3.55E-04 0.35 0.04 53.50 46.50
17 3.00E-04 77.50 7.75 61.25 38.75
18 2.50E-04 257.40 25.74 86.99 13.01
19 2.12E-04 23.35 2.34 89.32 10.68
20 1.80E-04 3.76 0.38 89.70 10.30
21 1.50E-04 43.19 4.32 94.02 5.98
22 7.50E-04 32.94 3.29 97.31 2.69
23 0 4.29 0.43 97.74 2.26
TOTAL = 977.40
Table 6.5: Particle Size Distribution in Marshy Soil
Sieve analysis was performed for all the collected
soil sample as per IS: 460-1962 and grouped accordingly in
soil class. It bears no plasticit
3) Red Soil:
Soil samples were sieved to determine the particle size
distribution it can determine the percentage of finer for
individual grain sizes lies between 4.75mm to 75 micron
and a pan which differentiate the coarse, fine, silt and clay
percentage of the soil retained.
Sl. No Sieve Size Mass of Soil Retained
on Each Sieve (gm) % Retained
Cumulative %
Retained C
% Finer
(100-C)
1 4.75 227.94 22.79 22.79 77.21
Soil Friability its Effect on Soil Aggregate Stability
(IJSRD/Vol. 3/Issue 12/2016/024)
All rights reserved by www.ijsrd.com 101
2 4.00 1.42 0.14 22.94 77.06
3 3.35 25.94 2.59 25.53 74.47
4 2.80 12.88 1.29 26.82 73.18
5 2.36 38.85 3.89 30.70 69.30
6 2.00 49.88 4.99 35.69 64.31
7 1.70 42.52 4.25 39.94 60.06
8 1.40 70.05 7.01 46.95 53.05
9 1.18 75.63 7.56 54.51 45.49
10 1.00 60.90 6.09 60.60 39.40
11 8.50E-04 53.14 5.31 65.92 34.09
12 7.70E-04 4.08 0.41 66.32 33.68
13 6.00E-04 34.05 3.41 69.73 30.27
14 5.00E-04 59.27 5.93 75.66 24.35
15 4.25E-04 47.74 4.77 80.43 19.57
16 3.55E-04 0.52 0.05 80.48 19.52
17 3.00E-04 21.80 2.18 82.66 17.34
18 2.50E-04 45.65 4.57 87.23 12.77
19 2.12E-04 27.07 2.71 89.93 10.07
20 1.80E-04 1.36 0.14 90.07 9.93
21 1.50E-04 18.56 1.86 91.93 8.07
22 7.50E-04 34.28 3.43 95.35 4.65
23 0 22.44 2.24 97.60 2.40
TOTAL = 975.97
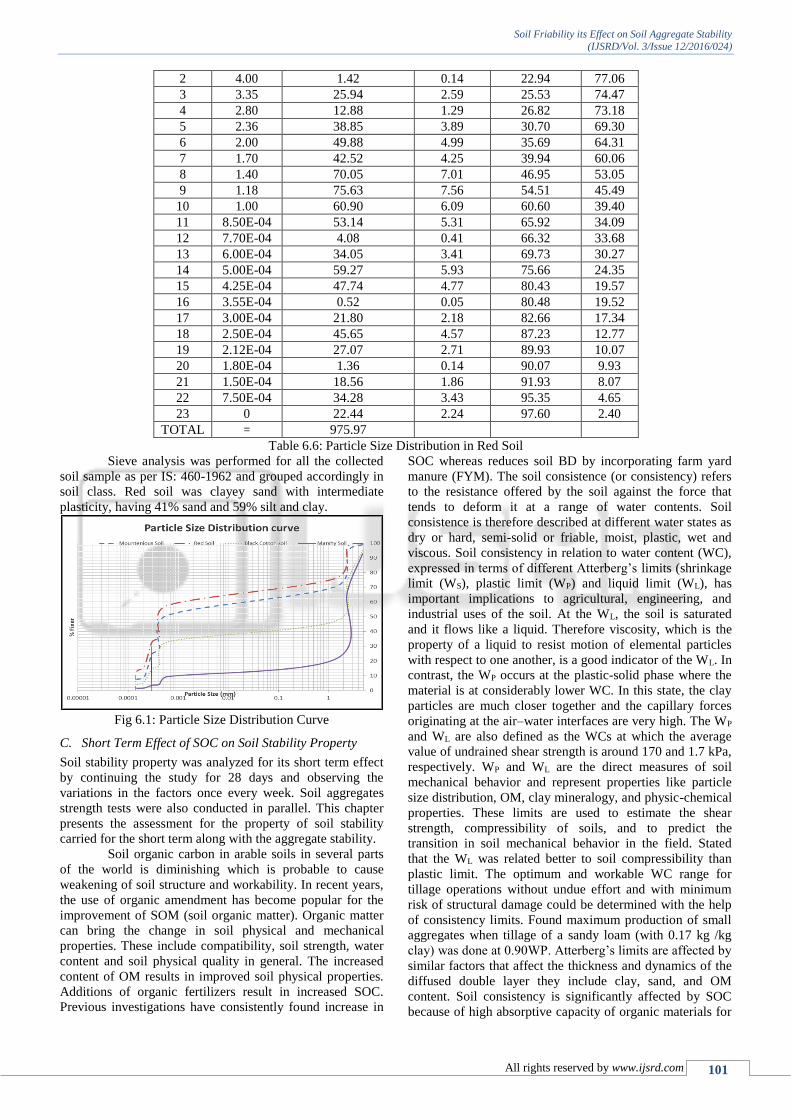
Table 6.6: Particle Size Distribution in Red Soil
Sieve analysis was performed for all the collected
soil sample as per IS: 460-1962 and grouped accordingly in
soil class. Red soil was clayey sand with intermediate
plasticity, having 41% sand and 59% silt and clay.
Fig 6.1: Particle Size Distribution Curve
C. Short Term Effect of SOC on Soil Stability Property
Soil stability property was analyzed for its short term effect
by continuing the study for 28 days and observing the
variations in the factors once every week. Soil aggregates
strength tests were also conducted in parallel. This chapter
presents the assessment for the property of soil stability
carried for the short term along with the aggregate stability.
Soil organic carbon in arable soils in several parts
of the world is diminishing which is probable to cause
weakening of soil structure and workability. In recent years,
the use of organic amendment has become popular for the
improvement of SOM (soil organic matter). Organic matter
can bring the change in soil physical and mechanical
properties. These include compatibility, soil strength, water
content and soil physical quality in general. The increased
content of OM results in improved soil physical properties.
Additions of organic fertilizers result in increased SOC.
Previous investigations have consistently found increase in
SOC whereas reduces soil BD by incorporating farm yard
manure (FYM). The soil consistence (or consistency) refers
to the resistance offered by the soil against the force that
tends to deform it at a range of water contents. Soil
consistence is therefore described at different water states as
dry or hard, semi-solid or friable, moist, plastic, wet and
viscous. Soil consistency in relation to water content (WC),
expressed in terms of different Atterberg’s limits (shrinkage
limit (WS), plastic limit (WP) and liquid limit (WL), has
important implications to agricultural, engineering, and
industrial uses of the soil. At the WL, the soil is saturated
and it flows like a liquid. Therefore viscosity, which is the
property of a liquid to resist motion of elemental particles
with respect to one another, is a good indicator of the WL. In
contrast, the WP occurs at the plastic-solid phase where the
material is at considerably lower WC. In this state, the clay
particles are much closer together and the capillary forces
originating at the air–water interfaces are very high. The WP
and WL are also defined as the WCs at which the average
value of undrained shear strength is around 170 and 1.7 kPa,
respectively. WP and WL are the direct measures of soil
mechanical behavior and represent properties like particle
size distribution, OM, clay mineralogy, and physic-chemical
properties. These limits are used to estimate the shear
strength, compressibility of soils, and to predict the
transition in soil mechanical behavior in the field. Stated
that the WL was related better to soil compressibility than
plastic limit. The optimum and workable WC range for
tillage operations without undue effort and with minimum
risk of structural damage could be determined with the help
of consistency limits. Found maximum production of small
aggregates when tillage of a sandy loam (with 0.17 kg /kg
clay) was done at 0.90WP. Atterberg’s limits are affected by
similar factors that affect the thickness and dynamics of the
diffused double layer they include clay, sand, and OM
content. Soil consistency is significantly affected by SOC
because of high absorptive capacity of organic materials for
Soil Friability its Effect on Soil Aggregate Stability
(IJSRD/Vol. 3/Issue 12/2016/024)
All rights reserved by www.ijsrd.com 102
water and their interactions with soil minerals affecting
bond strength and surface tension properties of soil. Found
that biomass incorporations significantly increased the soil
consistency limits. found that both WL and WP increased
with increasing OM. reported that the long-term application
of the farm yard manure(FYM) increases lignin and lignin-
like products in the soil organic matter whereas compost
manure increases protein and protein-like, as well as
carbohydrates content of soil organic matter. Soil friability
is the tendency of a mass of unconfined soil in bulk to
crumble and break down under applied stress into smaller
fragments with ease, without powdering. The trepidation for
deteriorating soil structure calls for better understanding of
SOM (soil organic matter) interaction with soil. Smaller
fragments, which originally comprised the larger clods, have
relatively greater strength than the larger clods, otherwise,
the soil mass could break down into dust. Found that larger
the aggregates, the smaller the mean tensile strength. The
present study thus aims to investigate the short term effect
of SOC (soil organic carbon) in different application modes
on soil shrinkage and friability.
D. Effect of Soil Organic Carbon on Soil Shrinkage Limit
and Friability Index
Since the study outcomes of were irregular and to know the
time based effect on FI this study was carried. Effect of
SOC was analyzed on soil shrinkage limit and friability
index for each soil amendment combination for 28 days with
the observations made once every 7 days.
For BC soil all the amendments brought down the
shrinkage limit (Ws) week by week indicating the
aggregation of fines. However FI Values of all the soil
amendment combinations were less than the control (8.37)
indicating reduction in period (time duration between the
first watering at the time of sowing and the last watering
before harvesting the crop). Aggregate strength increased
(as observed during soil crushing before sieve analyzing)
from week to week indicating the increased bondage within
the soil aggregate.
For Red soil, as witnessed in the above soil
amendment combinations, Ws reduced week by week
indicating the aggregation of fines this was again proved by
reduced WL. FI values of all the above combinations
increased (subjected to phase and time) in comparison with
the control (1.10) this increment was remarkably noticeable
in bagasseash and flyash amendments where the FI value
increased as high as 11.51 and 11.33 respectively.
Increments in FI values indicate increment in period when
cultivation is feasible and soil conditions are optimal for
tillage. Hence amending red soil not only gains the strengths
but also increase the period which is the added advantage
for agriculture along with soil conservation.
Like soil amendment combinations observed for
BC and red soil, Ws in mountainous soil also reduced week
by week.FI (friability index) values of all the combinations
increased (subjected to phase and time) in comparison with
the control (3.58). Except flyash amendment rest increased
FI in comparison with the control. Noticeable Increment in
FI was seen in Pressmud amended soil where the FI value
increased to 4.82. Hence amending mountainous soil with
the above is of immense importance both in agriculture
along with soil conservation.
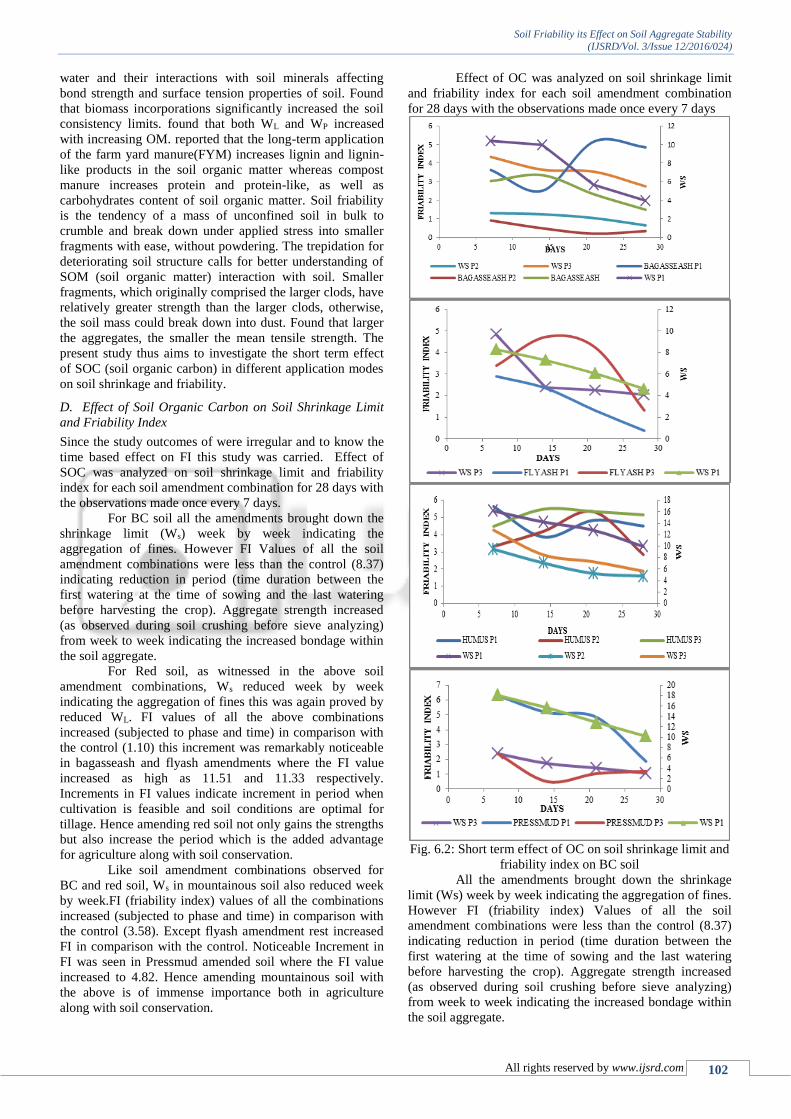
Effect of OC was analyzed on soil shrinkage limit
and friability index for each soil amendment combination
for 28 days with the observations made once every 7 days
Fig. 6.2: Short term effect of OC on soil shrinkage limit and
friability index on BC soil
All the amendments brought down the shrinkage
limit (Ws) week by week indicating the aggregation of fines.
However FI (friability index) Values of all the soil
amendment combinations were less than the control (8.37)
indicating reduction in period (time duration between the
first watering at the time of sowing and the last watering
before harvesting the crop). Aggregate strength increased
(as observed during soil crushing before sieve analyzing)
from week to week indicating the increased bondage within
the soil aggregate.
Soil Friability its Effect on Soil Aggregate Stability
(IJSRD/Vol. 3/Issue 12/2016/024)
All rights reserved by www.ijsrd.com 103
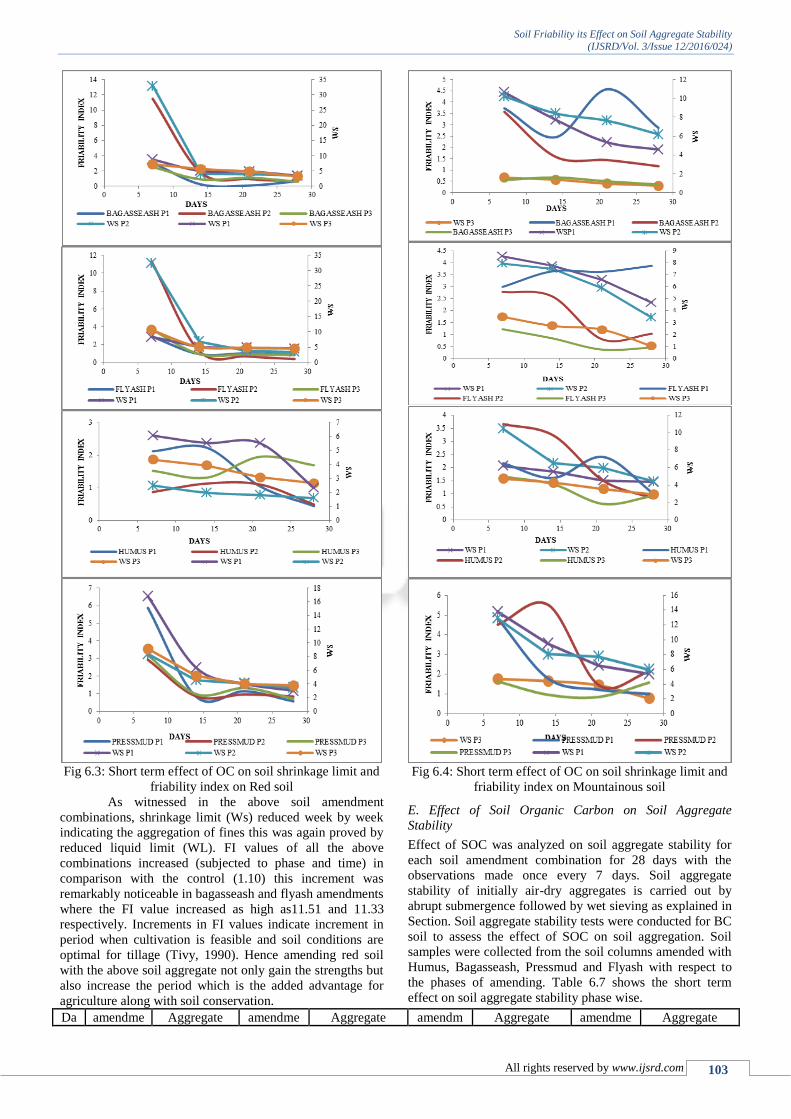
Fig 6.3: Short term effect of OC on soil shrinkage limit and
friability index on Red soil
As witnessed in the above soil amendment
combinations, shrinkage limit (Ws) reduced week by week
indicating the aggregation of fines this was again proved by
reduced liquid limit (WL). FI values of all the above
combinations increased (subjected to phase and time) in
comparison with the control (1.10) this increment was
remarkably noticeable in bagasseash and flyash amendments
where the FI value increased as high as11.51 and 11.33
respectively. Increments in FI values indicate increment in
period when cultivation is feasible and soil conditions are
optimal for tillage (Tivy, 1990). Hence amending red soil
with the above soil aggregate not only gain the strengths but
also increase the period which is the added advantage for
agriculture along with soil conservation.
Fig 6.4: Short term effect of OC on soil shrinkage limit and
friability index on Mountainous soil
E. Effect of Soil Organic Carbon on Soil Aggregate
Stability
Effect of SOC was analyzed on soil aggregate stability for
each soil amendment combination for 28 days with the
observations made once every 7 days. Soil aggregate
stability of initially air-dry aggregates is carried out by
abrupt submergence followed by wet sieving as explained in
Section. Soil aggregate stability tests were conducted for BC
soil to assess the effect of SOC on soil aggregation. Soil
samples were collected from the soil columns amended with
Humus, Bagasseash, Pressmud and Flyash with respect to
the phases of amending. Table 6.7 shows the short term
effect on soil aggregate stability phase wise.
Da amendme Aggregate amendme Aggregate amendm Aggregate amendme Aggregate

Soil Friability its Effect on Soil Aggregate Stability
(IJSRD/Vol. 3/Issue 12/2016/024)
All rights reserved by www.ijsrd.com 104
ys nt and
phase
Stability (%) nt and
phase
Stability (%) ent and
phase
Stability (%) nt and
phase
Stability (%)
Control 34.26 Control 34.26 Control 34.26 Control 34.26
7
Bagassea
sh P1
40.44
Flyash
P1
39.13
Humus
P1
34.9
Pressmud
P1
41.75
14 44.06 44.06 45.71 47.37
21 44.06 40.77 45.71 40.77
28 50.7 50.62 50.7 42.41
7
Bagassea
sh P2
35.88
Flyash
P2
36.43
Humus
P2
40.77
Pressmud
P2
45.71
14 45.71 42.41 39.13 45.71
21 42.41 42.41 44.06 42.41
28 45.71 44.06 47.33 45.71
7
Bagassea
sh P3
39.78
Flyash
P3
37.5
Humus
P3
39.13
Pressmud
P3
40.77
14 42.41 40.77 40.77 47.37
21 44.06 40.77 39.13 47.37
28 49.03 42.41 49.03 52.38
Table 6.7: Effect of SOC on aggregate stability for BC soil
Fig 6.5: Effect of SOC on aggregate stability for BC soil in I
phase
Natural soil amended with humus/bagasseash
tested for aggregate stability whose peak value increase
from 34.26 at 0% humus to 50.70% at 40% humus/
bagasseash amended with natural soil.
Fig 6.6: Effect of SOC on aggregate stability for BC soil in
II phase
Fig 6.7: Effect of SOC on aggregate stability for BC soil in
III phase
Natural soil amended with humus tested for
aggregate stability whose peak value increase from 34.26%
at 0% humus to 47.33% at 70% humus amended with
natural soil due to presence of calcium oxide which acts as a
binder with increasing for 28 days.
Natural soil amended with the pressmud for
aggregate stability whose peak value increase from 34.26%
to 52.38% at normal placing of the pressmud over the black
cotton soil for 28 days.
Similarly soil aggregate stability tests were
conducted for red soil to assess the effect of SOC on soil
aggregation. Table 4.8 shows the short term effect on soil
aggregate stability phase wise.
Days amendment and phase Aggregate Stability (%)
Control 40.77
7
Bagasse ash P1
44.72
14 39.13
21 39.13
28 42.41
7
Bagasse ash P2
42.08
14 35.88
21 40.77
28 40.77
7
Bagasse ash P3
45.71
14 37.50
21 42.41
28 52.38
Days amendment and phase Aggregate Stability (%)
Control 40.77
7
Flyash P1
44.72
14 40.77
21 44.06
28 42.41
7
Flyash P2
42.91
14 40.77
21 42.41
28 39.13
7
Flyash P3
50.70
14 39.13
21 40.77
28 40.77
Days amendment and phase Aggregate Stability (%)
Control 40.77

Soil Friability its Effect on Soil Aggregate Stability
(IJSRD/Vol. 3/Issue 12/2016/024)
All rights reserved by www.ijsrd.com 105
7
HumusP1
42.19
14 37.50
21 39.13
28 42.41
7
HumusP2
55.75
14 44.06
21 42.41
28 49.03
7
HumusP3
49.03
14 42.41
21 44.06
28 40.77
Days amendment and phase Aggregate Stability (%)
Control 40.77
7
Pressmud P1
45.71
14 44.06
21 45.71
28 44.06
7
Pressmud P2
56.43
14 42.41
21 44.06
28 42.41
7
Pressmud P3
49.03
14 39.13
21 42.41
28 44.06
Table 4.8: Effect of SOC on aggregate stability for red soil
Fig. 6.8: Effect of SOC on aggregate stability for red soil in
I phase
Fig. 6.8: Effect of SOC on aggregate stability for red soil in
I phase
Natural soil amended with pressmud tested for
aggregate stability whose peak value increase from 40.77 %
at 0% pressmud to 45.71% at 40% pressmud amended with
natural soil for 28 days.
Natural soil amended with pressmud tested for
aggregate stability whose peak value increase from 40.77 %
at 0% pressmud to 45.71% at 40% pressmud amended with
natural soil for 28 days.
Fig. 6.9: Effect of SOC on aggregate stability for red soil in
II phase
Natural soil amended with pressmud tested for
aggregate stability whose peak value increase from 40.77%
at 0% pressmud to 56.43% at 70% pressmud amended with
natural soil for 28 days
Fig. 6.10: Effect of SOC on aggregate stability for red soil in
III phase
Natural soil amended with the pressmud for
aggregate stability whose peak value increase from 40.77%
to 52.38% at normal placing of the bagasseash over the red
soil for 28 days.
Soil aggregate stability tests were conducted for
mountainous soil to assess the effect of SOC on soil
aggregation. Soil samples were collected from the soil
columns amended with Humus, Bagasseash, Pressmud and
Flyash with respect to the phases of amending. Table 4.9
shows the short term effect on soil aggregate stability phase
wise.
Da
ys
amendme
nt and
phase
Aggregate
Stability (%)
amendme
nt and
phase
Aggregate
Stability (%)
amendme
nt and
phase
Aggregate
Stability (%)
amendme
nt and
phase
Aggregate
Stability (%)
Control 39.13 Control 39.13 Control 39.13 Control 39.13
7
Bagassea
sh P1
50.7
Flyash
P1
52.38
Humus
P1
50.7
Pressmud
P1
50.7
14 49.03 45.71 42.41 45.71
21 45.71 44.06 45.71 45.71
28 50.7 45.71 45.71 55.75

Soil Friability its Effect on Soil Aggregate Stability
(IJSRD/Vol. 3/Issue 12/2016/024)
All rights reserved by www.ijsrd.com 106
7
Bagassea
sh P2
42.71
Flyash
P2
40.87
Humus
P2
57.45
Pressmud
P2
55.75
14 42.41 44.06 44.06 49.03
21 42.41 42.41 44.06 44.06
28 49.03 49.03 50.7 52.38
7
Bagassea
sh P3
54.06
Flyash
P3
54.06
Humus
P3
52.38
Pressmud
P3
52.38
14 44.06 42.41 50.7 52.38
21 47.37 50.7 52.38 47.37
28 54.06 45.71 49.03 47.37
Table 6.9: Effect of SOC on aggregate stability for mountainous soil
Fig 6.11Effect of SOC on aggregate stability for
Mountainous soil in I phase
Natural soil amended with humus tested for
aggregate stability whose peak value increase from 39.13%
at 0% pressmud to 57.45% at 40% humus amended with
natural soil for 28 days.
Fig. 6.12: Effect of SOC on aggregate stability for
Mountainous soil in II phase
Natural soil amended with flyash tested for
aggregate stability whose peak value increase from 40.77at
0% flyash to 54.06% at 70% flyash amended with natural
soil for 28 days.
Fig. 6.13: Effect of SOC on aggregate stability for Mountain
soil in III phase
Natural soil amended with the bagasseash/flyash
for aggregate stability whose peak value increase from
39.13% to 54.06% at normal placing of the
bagasseash/flyash over the mountain soil for 28 days.
VII. CONCLUSION
An aggregate is a group of primary particles that
cohere to each other more strongly than to other
surrounding soil particles.
All the soil amendment combinations increased the
aggregate stability day by day in comparison with the
respective controls as observed in Tables 4.7, 4.8 and
4.9
Aggregate stability was 34.26%, 40.77% and 39.13%
for BC, red and mountainous soils respectively;
While the mean values of aggregate stability
irrespective of phase after amending are bagasseash
with combination of bc, red and mountain soils
43.68%, 41.9% and 47.67% .
In same mean value of aggregate stability of phase
amending are flyash with combination of bc, red and
mountain soils 41.77%, 42.37% and 46.42%.
In same value of aggregate stability with combination
of humus in bc, red and mountainous soils 43.03%,
44.06% and 48.77%.
In same value of aggregate stability with combination
of pressmud in bc, red and mountainous soils 44.97%,
44.95%, 49.88%.
Indicating increment in the soil aggregate strength
which is a function the cohesive forces between
particles that can withstand the applied disruptive
force.
Irrespective of phase amending soils with organic
carbon is beneficial in aggregating fines and building the
time dependent bond within the fines of the soil aggregate.
VIII. SCOPE FOR FUTURE WORK
1) Study can be extended to different soils
2) Study can be extended to different regions
3) Study can be mode using different amendments
4) Study can be extended by addition of different
percentage like 0.5%.10%.15% etc. at regular interval
REFERENCE
[1] Agroecosyst.51, 1998, pp123–13 Ball, B.C., 16
Campbell, D.J., Hunter, E.A., “Soil compactability in
relation to physical and organic properties at 156 sites
in UK.Soil Till”. Res. 57, 2000, pp 83–91.
[2] Baldock, J.A., Nelson, P.N., 2000. “Soil organic matter.
In: Sumner, M.E. (Ed.),Handbook of Soil Science”.
CRC Press, Boca Raton, FL, pp. B25–B71.
[3] Ball, B.C., Campbell, D.J., Hunter, E.A., 2000.”Soil
compact ability in relation to physical and organic
properties at 156 sites in UK.Soil Till”. Res. 57, 83–91.
[4] Bhushan, L., Sharma, P.K., 2002.“Long-term effects of
lantana (Lantana spp. L.)residue additions on soil
physical properties under maize-wheat cropping.I.Soil
consistency, surface cracking and clod formation.Soil
Till”. Res. 65, 157–167.
[5] BODMAN. G. B. 1949. “Methods of measuring soil
consistency”. Soil Science 68, 37-56.1
[6] BRAUNACK, M. V., HEWIlT. J. S. and DEXTER, A.
R. 1979. “Brittle fracture of Soil aggregates and
compaction of aggregate beds”. Journal of Soil Science
30,653-67.
Soil Friability its Effect on Soil Aggregate Stability
(IJSRD/Vol. 3/Issue 12/2016/024)
All rights reserved by www.ijsrd.com 107
[7] Braunack, M. V., Hewilt. J. S. and Dexter, A. R.
Brittle“fracture of soilaggregates and compaction of
aggregate beds”. Journal of Soil Science 30, 1979, pp
653-67.
[8] Bhushan, L., Sharma, P.K., “Long-term effects of
lantana (Lantana spp. L.) residue additions on soil
physical properties under maize-wheat cropping. I. Soil
consistency, surface cracking and clod formation”.Soil
Till. Res. 65, 2002 pp 157–167
[9] Baldock, J.A., Nelson, P.N.,.“Soil organic matter. In
Sumner, M.E. (Ed.), Handbook of Soil Science”. CRC
Press, Boca Raton, FL, pp. B25–B71. 2000
[10] Bodman. G. B.” Methods of measuring soil
consistency”.Soil Science 68, 1949, pp 37-56..
[11] Campbell, D.J., Stafford, J.V., Blackwell, P.S., 1980.
“The plastic limit, as determinedby the drop-cone test,
in relation to the mechanical behavior of soil”. J. Soil
Sci.31, 11–24.
[12] Campbell, D.J., Stafford, J.V., Blackwell, P.S.,.“The
plastic limit, as determined by the drop-cone test, in
relation to the mechanical behavior of soil”. J. Soil Sci.
31, 1980, pp 11–24.
[13] Diaz-Zorita M., Perfect E., Grove J.H.
(2002):“Disrup¬tive methods for assessing
soistructure”. Soil Till. Res., 64: 3–22.
[14] Dexter, A.R., Bird, N.R.A.,“Methods for predicting the
optimum and the range of water contents for tillage
based on the water retention curve”. Soil Till. Res. 57,
2001, 203–212.
[15] Environmental engineering-i by b c punmia
[16] Haynes, R.J., Naidu, R., “Influence of lime, fertiliser
and manure applications on soil organic matter content
and soil physical conditions a review”, Nutr. Cycl.
[17] IS 2720 (Part V)-1985.“Procedure to determine Liquid
and plastic limits of soil”.
[18] IS 2720 (part VI)-1972.“procedure for determination of
soil shrinkage factors”
[19] Kinuthia, J.M., Wild, S., Jones, G.I.,” Effects of
monovalent and divalent metal sulphates on consistency
and compaction of lime-stabilized kaolinite”. Appl.
Clay Sci. 14, 1999, pp 27–45.
[20] Lima, D.L.D., Santos, S.M., Scherer, H.W., Schneider,
R.J., Duarte, A.C., Santos, E.B.H., Esteves, V.I.
“Effects of organic and inorganic amendments on soil
organic matter properties”. Geoderma 150, 2009, 38–
45.
[21] Lal, R., Shukla, M.K., “Principles of Soil Physics”.
Marcel Dekker, Inc, New York, 682 pp, 2004.
[22] Mosaddeghi, M.R., Hajabbasi, M.A., Hemmat, A.,
Afyuni, M.,“Soil compactibility as affected by soil
moisture content and farmyard manure in central Iran”.
Soil Till. Res. 55, 2000, pp 87–97.
[23] Mitchell, J.K., ”Fundamentals of Soil Behavior”. John
Wiley and Sons Inc, 422 pp, 1976.
[24] Nimmo, J. R., and Perkins, K.S.,“Aggregate stability
and size distribution,in Dane, J.H. and Topp, G.C.,
eds”., Methods of soil analysis, Part 4-Physical methods
Soil Science Society of America Book Series No. 5
Madison, Wisconsin, Soil Science Society of America,
pp. 317-328, 2002.
[25] Ojeniyi, S.O., Dexter, A.R.,.“Soil factors affecting the
macrostructures produced by tillage. Trans”. Am. Soc.
Agric. Eng. 22, 1979, pp 339–343.
[26] Rasool, R., Kukal, S.S., Hira, G.S.,“Soil organic carbon
and physical properties as affected by long-term
application of FYM and inorganic fertilizers in
maizewheat system”.Soil Till. Res. 101, 2008 pp 31–36.
[27] Smith, C.W., Hadas, A., Dan, J., Koyumdjisky,
H.,.“Shrinkage and Atterberg limits in relation to other
properties of principal soil types in Israel”. Geoderma
35, 1985, pp 47–65.
[28] Soane, B.D., Campbell, D.J., Herkes, S.M.,“The
characterization of some Scottish arable topsoils by
agricultural and engineering methods”. J. Soil Sci. 23,
1972, pp 93–104.
[29] Soil Survey Laboratory Methods Manual, Soil Survey
Investigations Report No. 42 Version 4.0 November
2004, pp163-164.
[30] Soil mechanics and foundation by b
cpunmia,ashokjain,arunkumarjain
[31] Sharma, B., Bora, P.K., “Plastic limit, liquid limit and
undrained shear strength of soil-reappraisal”. J.
Geotechnol. Geoenviron. Eng. 129 (8), 2003, pp 774–
777.
[32] Tivy, J., Agricultural Ecology. Longman, 296 pp, 1990.