soil forming factors - missouri land improvement...
TRANSCRIPT

Water Movement in SoilsWater Movement in Soils
Clayton E. LeeRetired NRCS State Soil Scientist
Columbia, Missouri
1) Soil Forming Factors2) Primary Properties that affect Water
Movement in Soils3) Soil Water Concepts4) Where to get additional information
Today’s Talking PointsToday’s Talking Points
Parent Material
Climate
Topography
Biological Activity
Ti
Soil Forming FactorsSoil Forming Factors
Time
MLICA 4-1

Those that formed in place - residuum Those that have been transported - In
Missouri: transported by Ice, Water, Wind and Gravity
Two Categories of Parent Two Categories of Parent MaterialMaterial
Soil that form Soil that form in placein place from the from the weathering of the underlying weathering of the underlying rock or minerals is called rock or minerals is called
ResiduumResiduum
MLICA 4-2

Soil material moved by ice or glaciers is calledGlacial Till or Till
Glacial till material consists of mixtures of rocks, sand, silt, and claythat have traveled long distances.
Soil material that has been transported by water is called Alluvium
MLICA 4-3

Slow velocitySlow velocity flooding produces clayey soils.
High velocity flooding gproduces loamy soils.
Floods can move great
amounts of soil material.
MLICA 4-4

Wind deposited Wind deposited -- the the further from the source further from the source the the loess gets loess gets thinner and has more clay (less thinner and has more clay (less silt)silt)Thickest deposits are adjacent to the Missouri Thickest deposits are adjacent to the Missouri
LoessLoess
jjand Mississippi River flood plains.and Mississippi River flood plains.
Colluvium is material Colluvium is material transported down slope by transported down slope by gravity. gravity.
MLICA 4-5

Temperature and Moisture are major Temperature and Moisture are major influences. In the US, we have influences. In the US, we have permafrost in Alaska and very warm permafrost in Alaska and very warm conditions in our southern states. conditions in our southern states. With regard to moisture we have With regard to moisture we have With regard to moisture, we have With regard to moisture, we have both deserts and rain forests.both deserts and rain forests.
ClimateClimate
The configuration of the land surface◦ Slope gradient◦ Slope shape
TopographyTopography
MLICA 4-6
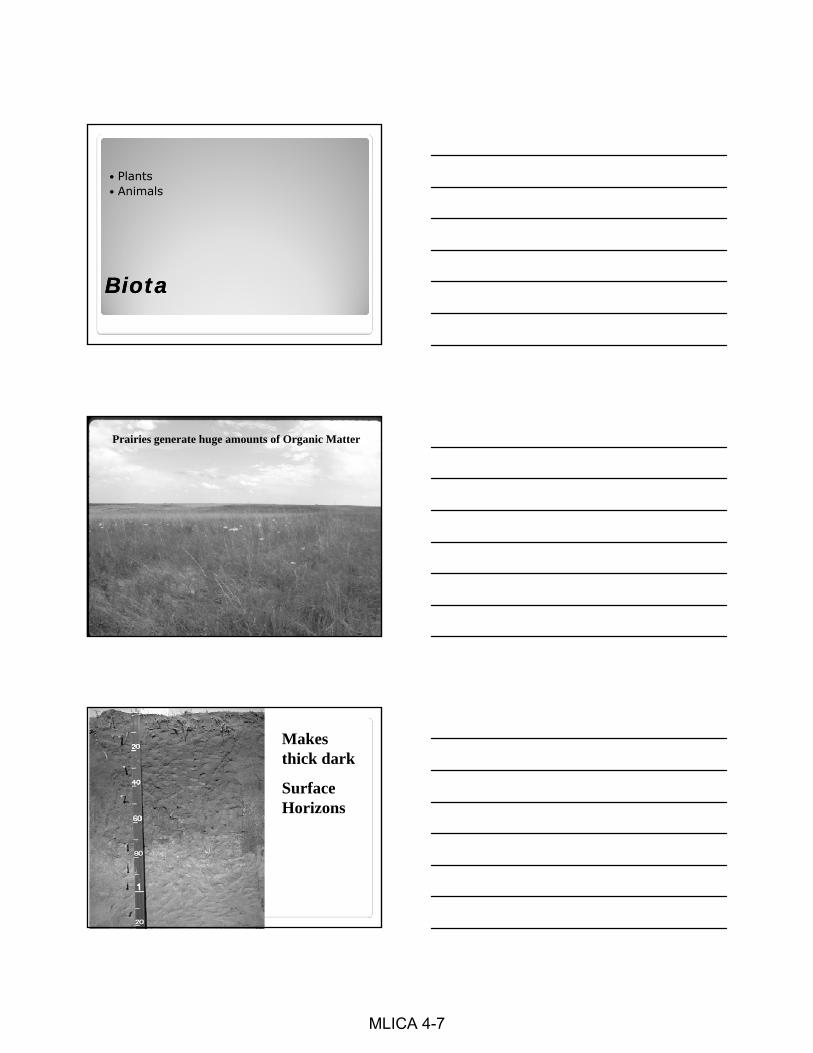
Plants Animals
BiotaBiota
Prairies generate huge amounts of Organic Matter
Makes thick dark
Surface Horizons
MLICA 4-7

Recent floods to “old” residuum
TimeTime
1) Soil Texture – particle size distribution2) Soil Structure3) Organic Matter Content4) Landform – hill slope profile
Primary Factors that influence Primary Factors that influence Water Movement through the Water Movement through the SoilSoil
MLICA 4-8

Particle Sizes
Sand: 2mm to .05mm
Silt: .05 mm to .002 mm
Clay: smaller than .002mm
MLICA 4-9
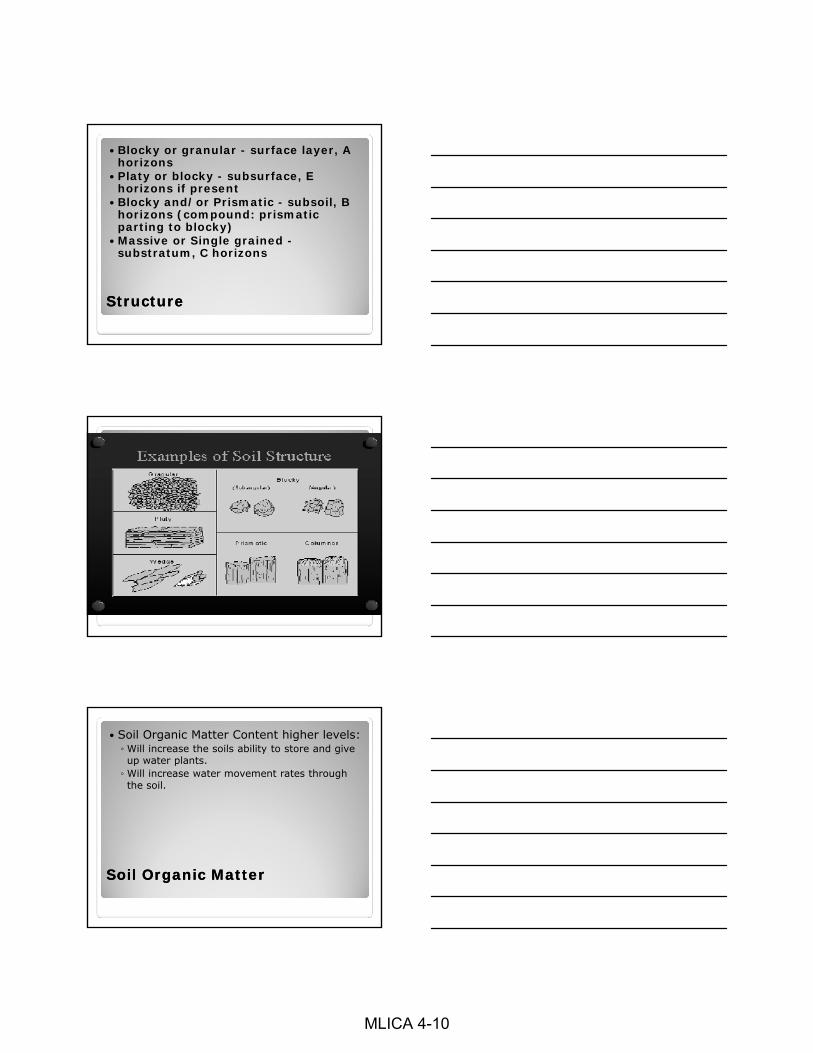
Blocky or granular - surface layer, A horizons
Platy or blocky - subsurface, E horizons if present
Blocky and/or Prismatic - subsoil, B horizons (compound: prismatic parting to blocky)
StructureStructure
Massive or Single grained -substratum, C horizons
Soil StructureSoil Structure
Soil Organic Matter Content higher levels:◦ Will increase the soils ability to store and give up water plants.◦ Will increase water movement rates through the soil.
Soil Organic MatterSoil Organic Matter
MLICA 4-10

How we can describe shapes of the land surface.
Slope shape and gradient are important considerations.
LandformsLandforms
In soil science, permeability is defined qualitatively as the ease with which gases, liquids, or plant roots penetrate or pass though a soil mass or layer. It is measured in length with no time component.
Saturated hydraulic conductivity is a quantitative measure of a saturated soil's ability to transmit water when subjected to a hydraulic gradient. It can be thought of as the ease with which pores of a saturated soil permit water movement. It is measured in both length and time.
Permeability classes and most references to permeability have been removed from the NSSH and replaced with the saturated
KsatKsatSaturated Hydraulic ConductivitySaturated Hydraulic Conductivity
been removed from the NSSH and replaced with the saturated hydraulic conductivity classes of the 1993 Soil Survey Manual.
MLICA 4-11
705.00 100.00 705.00 100.00
VERY HIGH141.14
VERY RAPID
20.00
100.00 14.17
14.11
MODERATELY RAPID 2.00
HIGH
1.417
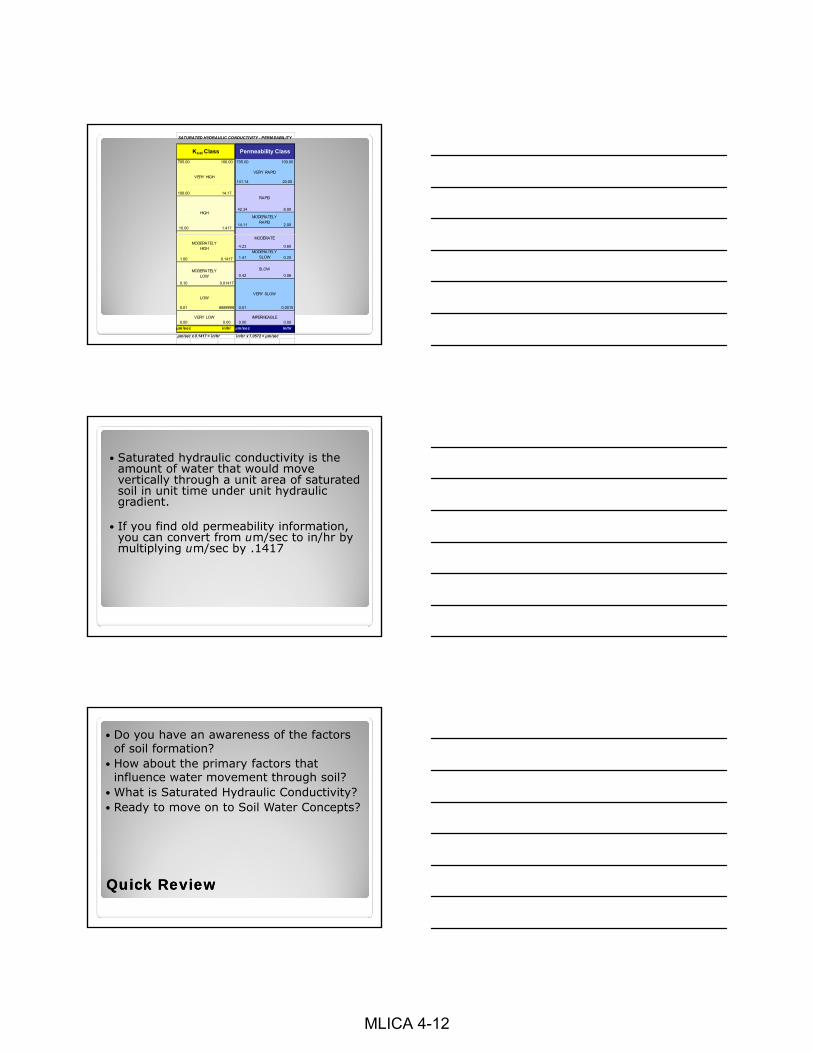
SATURATED HYDRAULIC CONDUCTIVITY - PERM EABILITY
Permeability ClassKsat Class
10.00
RAPID
42.34 6.00
VERY LOW IMPERMEABLE0.00 0.00 0.00 0.00
μm/sec in/hr μm/sec in/hr
0.60
0.20
0.06
0.0015
μm/sec x 0.1417 = in/hr in/hr x 7.0572 = μm/sec
0.01
LOW
1.41
0.42
0.1417
0.01417
MODERATELY SLOW
SLOW
0.10
VERY SLOW
0.01
MODERATELY HIGH
MODERATELY LOW
#######
4.23
1.00
MODERATE
Saturated hydraulic conductivity is the amount of water that would move vertically through a unit area of saturated soil in unit time under unit hydraulic gradient.
If you find old permeability information If you find old permeability information, you can convert from um/sec to in/hr bymultiplying um/sec by .1417
Do you have an awareness of the factors of soil formation?
How about the primary factors that influence water movement through soil?
What is Saturated Hydraulic Conductivity? Ready to move on to Soil Water Concepts?
Quick ReviewQuick Review
MLICA 4-12

Does water moves through all soils at the same rate?
Soil horizons and restrictive features. Water tables. Interpretations: Hydraulic groups &
l
Soil Water ConceptsSoil Water Concepts
Drainage classes.
clay pans abrupt texture change discontinuities bedrock
Soil Horizons and Soil Horizons and Restrictive FeaturesRestrictive Features
MLICA 4-13

Clay PanSoils
Some have drastically different
i lmaterial underneath
MLICA 4-14

WATER TABLESWATER TABLES
PERCHED (on something in thesoil profile like)
fragipansclay pansabrupt texture changediscontinuities discontinuities bedrock
APPARENT (flood plains)from the bottom up
RedoxiRedoximorphmorphic ic FeaturesFeatures
The shapes and forms of bodies resulting from the
reduction and oxidation of iron
MLICA 4-15

Gray Redox Depletion
Describe Soil Colors
Soil Matrix Color
Reddish Redox Concentration
Hydrologic Groups (a) Definition Hydrologic group is a group of soils
having similar runoff potential under similar storm and cover conditions.
(b) Classes The soils in the United States are placed into four groups, A, B, C,
and D, and three dual classes, A/D, B/D, and C/D. In the definitions of the classes, infiltration rate is the rate at which water enters the soil at the surface and is controlled by the surface conditions. Transmission rate is the rate at which water moves in the soil and is controlled by soil properties. Definitions of the classes are as follows:
A. (Low runoff potential). The soils have a high infiltration rate even when thoroughly wetted. They chiefly consist of deep, well drained to excessively drained sands or gravels. They have a high rate of water transmission.
B. The soils have a moderate infiltration rate when thoroughly wetted. They chiefly are moderately deep to deep, moderately wetted. They chiefly are moderately deep to deep, moderately well drained to well drained soils that have moderately fine to moderately coarse textures. They have a moderate rate of water transmission.
C. The soils have a slow infiltration rate when thoroughly wetted. They chiefly have a layer that impedes downward movement of water or have moderately fine to fine texture. They have a slow rate of water transmission.
D. (High runoff potential). The soils have a very slow infiltration rate when thoroughly wetted. They chiefly consist of clay soils that have a high swelling potential, soils that have a permanent high water table, soils that have a claypan or clay layer at or near the surface, and shallow soils over nearly impervious material. They have a very slow rate of water transmission.
MLICA 4-16

Dual hydrologic groups, A/D, B/D, and C/D, are given for certain wet soils that can be adequately drained. The first letter applies to the drained condition, the second to the undrained. Only soils that are rated D in their natural condition are assigned to dual classes Soils may be assigned to dual classes. Soils may be assigned to dual groups if drainage is feasible and practical.
Definition.—“Drainage class” identifies the natural drainage condition of the soil. It refers to the frequency and duration of wet periods
DRAINAGE CLASSDRAINAGE CLASS
wet periods.
MLICA 4-17

Excessively Drained >6’ Somewhat Excessively Drained >6’ Well Drained 3.5 to 6’ Moderately Well Drained 2-3.5’ Somewhat Poorly Drained 1-2’ Poorly Drained 0-1’ Very Poorly Drained +1’
7 Drainage Classes used in MO7 Drainage Classes used in MO
Very Poorly Drained +1
Saturated hydraulic conductivity or KsatPertains to the
amount of water that would move downward through a
Natural Drainage ClassRefers to the frequency
and duration of wet periods similar to those under which the soil developed.
KsatKsat vs. DRAINAGEvs. DRAINAGE
gunit area of saturated in-place soil in unit time under unit hydraulic gradient.
Air space size Air space quantity Changes impact physical processes in the
soil. Such as adhesion, cohesion, adsorption, and surface tension.
Soil Air Space & Water MovementSoil Air Space & Water Movement
MLICA 4-18

Compaction breaks down the natural soil structure.
Compaction changes the air space size and quantity.
Soil CompactionSoil Compaction
◦ Saturated flow (also called gravitational flow) occurs only under saturated conditions when the force of gravity is greater than forces holding water in the soil.
Capillary flow occurs in unsaturated soil (also called unsaturated flow). Unbroken films of
t d th h t d ill water spread through connected capillary pores.
Flow terminologyFlow terminology
MLICA 4-19

MLICA 4-20
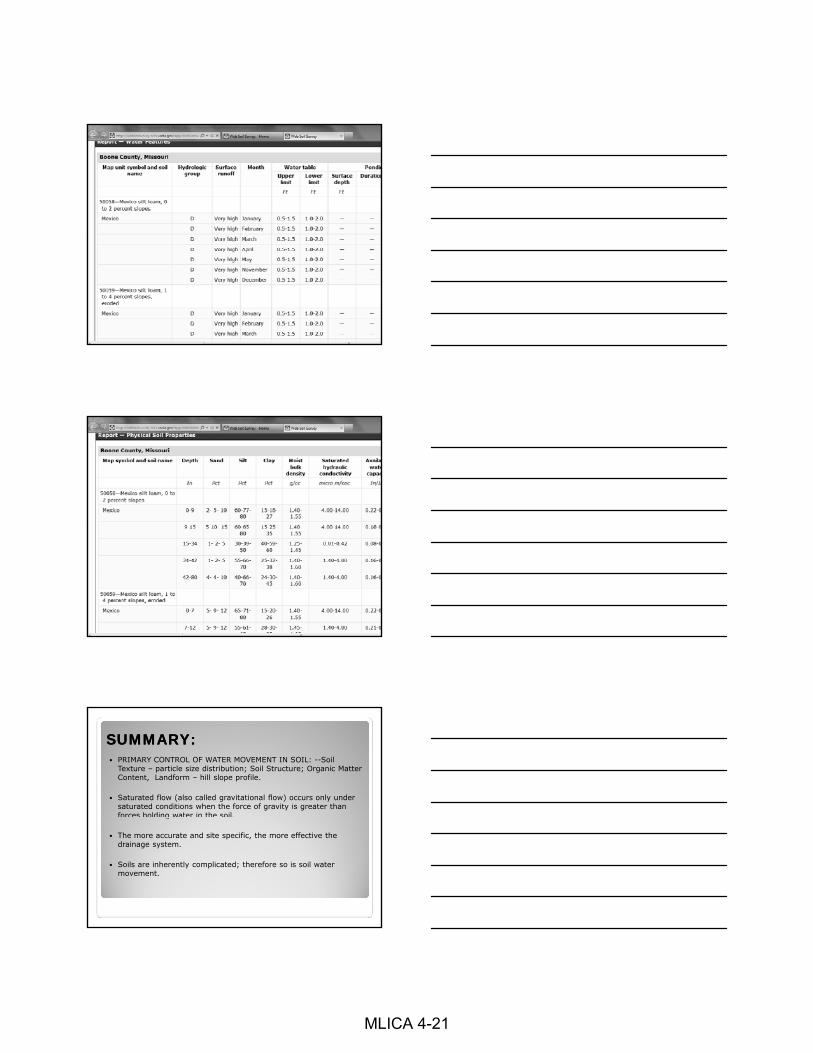
SUMMARY:SUMMARY: PRIMARY CONTROL OF WATER MOVEMENT IN SOIL: --Soil
Texture – particle size distribution; Soil Structure; Organic Matter Content, Landform – hill slope profile.
Saturated flow (also called gravitational flow) occurs only under saturated conditions when the force of gravity is greater than forces holding water in the soil.o ces o d g ate t e so
The more accurate and site specific, the more effective the drainage system.
Soils are inherently complicated; therefore so is soil water movement.
MLICA 4-21

MLICA 4-22

1/7/2013
Wetland Determinations
• Food Security Act – USDA Program Participants.
• Clean Water Act – Applies to all.
MLICA 4-23

1/7/2013
MLICA 4-24

1/7/2013
MLICA 4-25

1/7/2013
RedoxiRedoximorphmorphicicFeaturesFeatures
The shapes and forms of bodies resulting from the reduction and
oxidation of iron
Gray Redox Depletion
Describe Soil Colors
Soil Matrix Color
Reddish Redox Concentration
MLICA 4-26

1/7/2013
MLICA 4-27

1/7/2013
MLICA 4-28

1/7/2013
MLICA 4-29

1/7/2013
MLICA 4-30

14–161(210-VI-NEH, April 2001)
Figure 1 Symbols for auger-hole method of measuring hydraulic conductivity
(1) Auger-hole method
The auger-hole method is the simplest and most accu-rate way to determine soil permeability (fig. 1). Themeasurements obtained using this method are a com-bination of vertical and lateral conductivity, however,under most conditions, the measurements representthe lateral value. The most limiting obstacle for usingthis method is the need for a water table within thatpart of the soil profile to be evaluated. This limitationrequires more intensive planning. Tests must be madewhen a water table is available during the wet season.Obtaining accurate readings using this method re-quires a thorough knowledge of the procedure.
The principle of the auger-hole method is simple. Ahole is bored to a certain distance below the watertable. This should be to a depth about 1 foot below theaverage depth of drains. The depth of water in the holeshould be about 5 to 10 times the diameter of the hole.The water level is lowered by pumping or bailing, andthe rate at which the ground water flows back into thehole is measured. The hydraulic conductivity can thenbe computed by a formula that relates the geometry ofthe hole to the rate at which the water flows into it.
(i) Formulas for determination of hydraulic
conductivity by auger-hole method—Determina-tion of the hydraulic conductivity by the auger-holemethod is affected by the location of the barrier orimpermeable layer.
A barrier or impermeable layer is defined as a lesspermeable stratum, continuous over a major portion ofthe area and of such thickness as to provide a positivedeterrent to the downward movement of groundwater. The hydraulic conductivity of the barrier mustbe less than 10 percent of that of the overlying mate-rial if it is to be considered as a barrier. For the casewhere the impermeable layer coincides with thebottom of the hole, a formula for determining thehydraulic conductivity (K) has been developed by VanBavel and Kirkham (1948).
Kr
SHyt
=
2220 ∆∆
[1]
Appendix 14D Auger-hole Procedure for HydraulicConductivity
Ground water Level
H
G
yoyty
y
d
Impermeable layer
2r
MLICA 4-31

Chapter 14
(210-VI-NEH, April 2001)
Water Management (Drainage) Part 650Engineering Field Handbook
14–162
where:S = a function dependent on the geometry of the
hole, the static depth of water, and the averagedepth of water during the test
K = hydraulic conductivity (in/hr)H = depth of hole below the ground water table (in)r = radius of auger hole (in)y = distance between ground water level and the
average level of water in the hole (in) for thetime interval t (s)
∆y = rise of water (in) in auger hole during ∆tt = time interval (s)G = depth of the impermeable layer below the
bottom of the hole (in). Impermeable layer isdefined as a layer that has the permeability ofno more than a tenth of the permeability of thelayers above.
d = average depth of water in auger hole during test(in)
A sample form for use in recording field observationsand making the necessary computations is illustratedin figure 2. This includes a chart for determining thegeometric function S for use in the formula for calcula-tion of the hydraulic conductivity.
The more usual situation is where the bottom of theauger hole is some distance above the barrier. Formu-las for computing the hydraulic conductivity in homo-geneous soils by the auger-hole method have beendeveloped for both cases (Ernst, 1950). These formu-las (2 and 3) are converted to English units of mea-surement.
For the case where the impermeable layer is at thebottom of the auger-hole, G = 0:
Kr
H ryH
y
yt
=+( ) −
15 000
10 2
2, ∆∆ [2]
For the case where the impermeable layer is at a depth≥ 0.5H below the bottom of the auger hole:
Kr
H ryH
y
yt
=+( ) −
16 667
20 2
2, ∆∆ [3]
The following conditions should be met to obtainacceptable accuracy from use of the auger-holemethod:
2r > 2 1/2 and < 5 1/2 inchesH > 10 and < 80 inchesy > 0.2 HG > Hy < 1/4 yo
Charts have been prepared for solution of equation 3for auger-holes of r = 1 1/2 and 2 inches. For the casewhere the impermeable layer is at the bottom of theauger hole, the hydraulic conductivity may be deter-mined from these charts by multiplying the valueobtained by a conversion factor f as indicated onfigure 3.
MLICA 4-32

Part 650Engineering Field Handbook
14–163
Chapter 14 Water Management (Drainage)
(210-VI-NEH, April 2001)
Figure 2a Auger-hole method of measuring hydraulic conductivity—sheet 1 of 2
Distance to water surfacefrom reference point
Beforepumping
Afterpumping
Duringpumping
B A R A-R R-B
Residualdrawdown
Inches Inches Inches InchesSeconds Seconds Inches
XX
81.5
XX
79.0
77.5
76.0
74.0
72.0
XX
0.00
9.5
XX
38.5
36.0
34.5
33.0
31.0
29.0
XX
0.0
30
60
90
120
150
XX
XX
150
43
XX
Start
Elapsed
Time
10:03t y
Soil Conservation District________________________________ Field Office_________________________
Cooperator_____________________________________________ Location__________________________
SCD Agreement No.__________________Field No.____________ Farm No.__________________________
Technician_____________________________________________ Date______________________________
Boring No.__________ Salinity (EC) Soil _________ Water___________ Estimated K__________________
Field Measurement of Hydraulic ConductivityAuger-Hole Method
For use only where bottom of hole coincides with barrier.Dry River
Joe Doe - Farm No. 2
264 4 B-817
1/2 Mi. E. Big Rock Jct.
Tom Jones 1 June 64
4 — 5.6 1.0 in/hr
0 50 100 150 200Time in seconds
20
30
40
50
Res
idua
l dra
wdo
wn
(R-B
) in
inch
es
Ref. pointsurfaceGround
Water table
Residualdrawdown
y
d
RA
H
D
B
Auger hole profile
Salt Flat
MLICA 4-33

Chapter 14
(210-VI-NEH, April 2001)
Water Management (Drainage) Part 650Engineering Field Handbook
14–164
Figure 2a Auger-hole method of measuring hydraulic conductivity—sheet 2 of 2
Values of
0.0 0.2 0.4 0.6 1.0
10
8
6
4
2
0
Val
ues
of S
Ref. pointSurfaceGround
Water table
Residualdrawdown
y
d
R
A
H
D
B
Auger hole profile
Hole dia.______Hole depth___________________
D=______ r=______ H=______ d=______ y=______ t=______secondsr/H=______/ ______=______d/H=______/______=______ S=______ K=2220 x
K=________
84" Ground to Ref.=11"4"
93"25016.29.51502 50 0.04
50 0.3216.24.7
1.2 in/hr
r/H=0.02
0.10
r/H=0.30
0.06
0.04
0.8dH
0.16
r
________(4.7) (50)
2 ________1509.5
x
MLICA 4-34

Part 650Engineering Field Handbook
14–165
Chapter 14 Water Management (Drainage)
(210-VI-NEH, April 2001)
Distance to water surfacefrom reference point
Beforepumping
Afterpumping
Duringpumping
B A R A-R R-B
Residualdrawdown
Inches Inches Inches InchesSeconds Seconds Inches
Start
Elapsed
Time
10:03t y
Soil Conservation District________________________________ Field Office_________________________
Cooperator_____________________________________________ Location__________________________
SCD Agreement No.__________________Field No.____________ Farm No.__________________________
Technician_____________________________________________ Date______________________________
Boring No.__________ Salinity (EC) Soil _________ Water___________ Estimated K__________________
Field Measurement of Hydraulic ConductivityAuger-Hole Method
For use only where bottom of hole coincides with barrier.
0 50 100 150 200Time in seconds
20
30
40
50
Res
idua
l dra
wdo
wn
(R-B
) in
inch
es
Ref. pointsurfaceGround
Water table
Residualdrawdown
y
d
RA
H
D
B
Auger hole profile
Figure 2b Auger-hole method of measuring hydraulic conductivity—sheet 1 of 2 (blank)
MLICA 4-35

Chapter 14
(210-VI-NEH, April 2001)
Water Management (Drainage) Part 650Engineering Field Handbook
14–166
Figure 2b Auger-hole method of measuring hydraulic conductivity—sheet 2 of 2 (blank)
Values of
0.0 0.2 0.4 0.6 1.0
10
8
6
4
2
0
Val
ues
of S
Ref. pointSurfaceGround
Water table
Residualdrawdown
y
d
R
A
H
D
B
Auger hole profile
Hole dia.______Hole depth___________________
D=______ r=______ H=______ d=______ y=______ t=______secondsr/H=______/ ______=______d/H=______/______=______ S=______ K=2220 x
K=________
84" Ground to Ref.=11"4"
93"25016.29.51502 50 0.04
50 0.3216.24.7
1.2 in/hr
r/H=0.02
0.10
r/H=0.30
0.06
0.04
0.8dH
0.16
r
________(4.7) (50)
2 ________1509.5
x
MLICA 4-36

Part 650Engineering Field Handbook
14–167
Chapter 14 Water Management (Drainage)
(210-VI-NEH, April 2001)
Figure 3 Hydraulic conductivity—auger-hole method using the Ernst Formula
100
90
80
70
C
H
60
50
40
15 20 30 40 50 60 70 80 90 100
90
80
70
60
50
40
H
8
16
24
36
48
60
72
f
1.54
1.40
1.31
1.22
1.16
1.13
1.10
SOIL CONSERVATION SERVICE
ENGINEERING DIVISION-DRAINAGE SECTION
U.S. DEPARTMENT OF AGRICULTURESTANDARD DWG. NO.
ES-734SHEET OF
DATE
1 2
3-23-71
REFERENCE From formula L.F. Ernst
Groningen, The Netherlands
y=8
10
12
14
16
18
2022
24
27
30
33
36
42
485460
72
30
25
20
15
10
8
6
K Cyt
r= =∆∆
, 2 in
For G = 0 (bottom hole at imp. layer)
K = Kf′
H y
C
= ==
40 12
41∆∆yt
= =0 3210
0 032.
.Example
K = × =41 0 032 1 31. . in/hr
Kr
H ryH
y
yt
=+( ) −
16 667
20 2
2, ∆∆
Conditions:
and in
and in
in / hr
H, r, y, inches
seconds
2 212
512
10 80
0 2
34
r
H
y H
G H
y y
K
y
t
t o
> <
> <>>
≤
==
=
.
∆∆
MLICA 4-37

Chapter 14
(210-VI-NEH, April 2001)
Water Management (Drainage) Part 650Engineering Field Handbook
14–168
Figure 3 Hydraulic conductivity—auger-hole method by Ernst Formula—continued
40
100
90
80C
H
70
60
15 20 30 40 50 60 70 80 90 100
90
80
70
60
50
H
8
16
24
36
48
60
72
f
1.54
1.40
1.31
1.22
1.16
1.13
1.10
SOIL CONSERVATION SERVICE
ENGINEERING DIVISION-DRAINAGE SECTION
U.S. DEPARTMENT OF AGRICULTURESTANDARD DWG. NO.
ES-734SHEET OF
DATE
2 2
3-23-71
REFERENCE From formula L.F. Ernst
Groningen, The Netherlands
30
25
20
15
10
8
6
10
y=8
12
14
16
18
20
24
28
32
3640
48
Conditions:
and in
and in
in / hr
H, r, y, inches
seconds
2 212
512
10 80
0 2
34
r
H
y H
G H
y y
K
y
t
t o
> <
> <>>
≤
==
=
.
∆∆
For G = 0 (bottom hole at imp. layer)
K = Kf′
K Cyt
r
=
=
∆∆
112
inches
H
G
C
f
===
=
24
0
44
1 25.
y
yt
K
K
=
= =
= ( )( ) =
′ = ( )( ) =
10
1 420
0 07
44 0 07 3 1
3 1 1 25 3 9
∆∆
..
. .
. . . in/hr
Example
Kr
H ryH
y
yt
=+( ) −
16 667
20 2
2, ∆∆
MLICA 4-38

Part 650Engineering Field Handbook
14–169
Chapter 14 Water Management (Drainage)
(210-VI-NEH, April 2001)
Figure 4 Equipment for auger-hole method of measuring hydraulic conductivity
(ii) Equipment for auger-hole method—Thefollowing equipment is required to test hydraulicconductivity:
• suitable auger• pump or bail bucket to remove water from the
hole• watch with a second hand• device for measuring the depth of water in the
hole as it rises during recharge• well screen may be necessary for use in unstable
soils
Many operators prefer a well made, light weight boator stirrup pump that is easily disassembled for clean-ing. A small, double diaphragm barrel pump has givengood service. It can be mounted on a wooden framefor ease of handling and use.
For the depth measuring device, a light weight bam-boo fishing rod marked in feet tenths and hundredthsand that has a cork float works well. Other types offloats include a juice can with a standard soldered toone end to hold a light weight measuring rod.
A field kit for making the auger hole measurement ofhydraulic conductivity is illustrated in figure 4. Inaddition to the items indicated in this figure, a watchand a soil auger are needed.
A perforated liner for the auger-hole is used in makingthe auger-hole measurement in fluid sands. This linerkeeps the hole open and maintains the correct size.Several types of liners are used. Adequate slot open-ings or other perforations must be provided to allowfree flow into the pipe.
���������
��5 3/4"
2'-2 3/4"
1'-3 1/2"
7 1/2"
Double diaphragmbarrel pump
Top view
Mounting for pump
1 1/2"
Side view �� ��3/4"
��� ��
Measuringpoint
Pump
Exhausthose
Standard
Staticwaterlevel
Finish test
Start test
Suction hose
Tape and 2-inch float
Note: In addition to the pump,the equipment in the carrying caseincludes suction hose, tape and float,stake, and standard.
Field set-up
Carrying case–auger hole kit
9 3/16"
2'-5 7/32"
1' -1/8"
(Assembled)
MLICA 4-39

Chapter 14
(210-VI-NEH, April 2001)
Water Management (Drainage) Part 650Engineering Field Handbook
14–170
The openings in the screen should not restrict flowappreciably. The head loss through the screen shouldbe negligible, and the velocity of flow through theopenings should be small (0.3 foot per second or less)to prevent movement of fines into the hole. Thesecriteria generally are met if the area of openings is 5percent or more of the total screen area.
The Bureau of Reclamation uses 4-inch downspoutingwith 60 1/8- by 1-inch slots per foot of length. Thisworks well in a variety of soils. A screen from theNetherlands is made from a punched brass sheet 2millimeters thick with holes averaging about 0.5 milli-meter in diameter. It is rolled into a tube 8 centimetersin diameter by 1 meter long. This screen works wellbecause the sheet is rolled so that the direction inwhich the holes are punched is outward and the holesare variable in size. It has been used in many trouble-some soils, and no clogging or failure to keep fines outof the hole has been reported.
Good judgment is needed in determining how far todrawdown the water level in the auger hole for thetest. A minimum drawdown is necessary to physicallysatisfy theoretical criteria (refer to conditions given infig. 3). Generally, a larger drawdown is made forslowly permeable soils than that for more permeablesoils. A small drawdown for holes in sloughing soilsmay reduce the amount of sloughing. To preventpicking up sand in the pump, pumping should stopwhen the water level is within a few inches of thebottom of the hole.
Measurement of the rate of recovery of water in theauger hole should be completed before a fourth of thetotal amount of drawdown is recovered. Four or fivereadings should be taken at uniform short time inter-vals, and a plot of the readings made to determine auniform rate of recovery to use in the formula. Plottingof time in seconds against the residual drawdown ininches indicates those readings at the beginning andend of the test that should be discarded and the propervalues of t and y to use.
MLICA 4-40

Drainage Design Reference
Area
1 acre = 43,560 square feet
Saturated Hydraulic Conductivity
1 micrometer per second = 1 μm/sec
1 μm/sec = 0.2834 feet per day
1 μm/sec = 0.1417 inch per hour
1 inch per hour = 7.0572 μm/sec
1 inch per hour = 2 feet per day
Pipe Flow
Q = V x A and V = Q ÷ A
Where: Q = Flow discharge rate, cubic feet per second
V = Flow velocity, feet per second
A = Cross Sectional Area, square feet
Required Drainage Capacity
Q = 0.042 x DC x DA
Where Q = Flow discharge rate, cubic feet per second
DC = Drainage Coefficient, inch/day
DA = Drained Area, acres
MLICA 4-41

705.00 100.00 705.00 100.00
VERY HIGH141.14
VERY RAPID
20.00
100.00 14.17
14.11
MODERATELY RAPID 2.00
VERY LOW IMPERMEABLE0.00 0.00 0.00 0.00
μm/sec in/hr μm/sec in/hr
in/hr x 7.0572 = μm/sec
μm/sec x 0.2834 = ft/day in/hr x 2 = ft/day
4.23
6.00
1.00
MODERATEMODERATELY
HIGH
MODERATELY LOW
0.001417
0.42
SATURATED HYDRAULIC CONDUCTIVITY - PERMEABILITY
Permeability ClassKsat Class
10.00
RAPID
42.34
MODERATELY SLOW
SLOW
0.60
0.20
0.06
0.0015
VERY SLOW
μm/sec x 0.1417 = in/hr
0.01
LOW
HIGH
1.41
1.417
0.1417
0.014170.10
0.01
MLICA 4-42

Soil Water
Soil Water
Saturatio
nWilting Po
int
Field Capacity
Drainable
Water
Available
Water
Air
Soil
Water
MLICA 4-43

DRAINAB
LE W
ATER
3‐11%
PLAN
T AV
AILABLE WATER
(Weak Ca
pillary Forces)
13‐21%
UNAV
ALAB
LE W
ATER
(Stron
g Ad
sorptive Forces) 15‐24%
SOIL SOLIDS
45‐65%
← Field Capacity
← Com
pletely Dry
← W
ilting Po
int
← Saturation
Pore Volume(Air and Water)
Solids Volume(Mineral and Organic Mater)
Soil Water
Relatio
nships
(Typical fo
r Clay, Clay
Loam
and
Silty Clay)
Soil Water
Relatio
nships
(Typical fo
r Clay, Clay
Loam
and
Silty Clay)
MLICA 4-44

Typical Soil W
ater Relationships
Typical Soil W
ater Relationships
Soil Texture
WiltingPo
int
(% by vol.)
Available
Water
(% by vol.)
Drainab
leWater
(% by vol.)
clays, clay loam
s,
siltyclays
15‐24
15‐26
3‐11
well structuredloam
s8‐17
12‐22
10‐15
sand
y3‐10
7‐20
18‐35
Source: University
of M
inne
sota BU‐07644
‐S, Soil W
ater Con
cepts, Gary Sand
s
MLICA 4-45

DRAINAB
LE W
ATER
5%
PLAN
T AV
AILABLE WATER
(Weak Ca
pillary Forces)
20%
SOIL SOLIDS
55%
← Field Capacity
← Com
pletely Dry
← W
ilting Po
int
←Saturatio
nPore Volume
(Air and Water)Solids Volume
(Mineral and Organic Mater)
UNAV
ALAB
LE W
ATER
(Stron
g Ad
sorptive Forces) 20%
Soil Water
Relatio
nships
(Example Silty
Clay)
Soil Water
Relatio
nships
(Example Silty
Clay)
MLICA 4-46

How
much water do I n
eed to re
move?
How
much water do I n
eed to re
move?
Given
a so
il (silty clay) w
ith a drainable porosity
of 5
%
with
the goal of d
raining the top 12
inch layer in 48
hou
rs.
Volume of drainab
le water
= 5%
x 12 inch dep
th
= 0.6 inches
Rate of rem
oval
= 0.6 inch ÷2 day
= 0.3 inch/day
MLICA 4-47
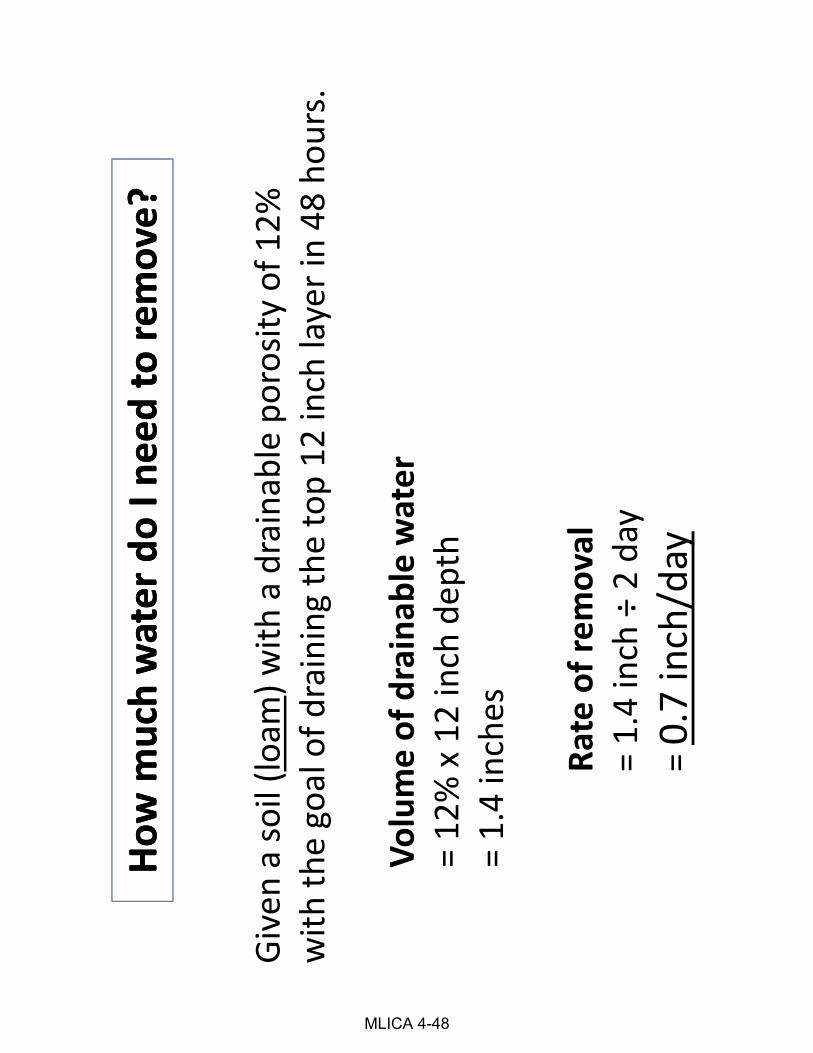
How
much water do I n
eed to re
move?
How
much water do I n
eed to re
move?
Given
a so
il (lo
am) w
ith a drainable porosity
of 1
2%
with
the goal of d
raining the top 12
inch layer in 48
hou
rs.
Volume of drainab
le water
= 12
% x 12 inch dep
th
= 1.4 inches
Rate of rem
oval
= 1.4 inch ÷2 day
= 0.7 inch/day
MLICA 4-48