soil carbon in small-holder plantain farms, uganda
TRANSCRIPT
Degree project in Biology Agriculture Programme – Soil and Plant Sciences Examensarbeten, Institutionen för mark och miljö, SLU Uppsala 2014 2014:01
Soil carbon in small-holder plantain farms, Uganda – a comparison between agroforestry and non- agroforestry Pia Björsell

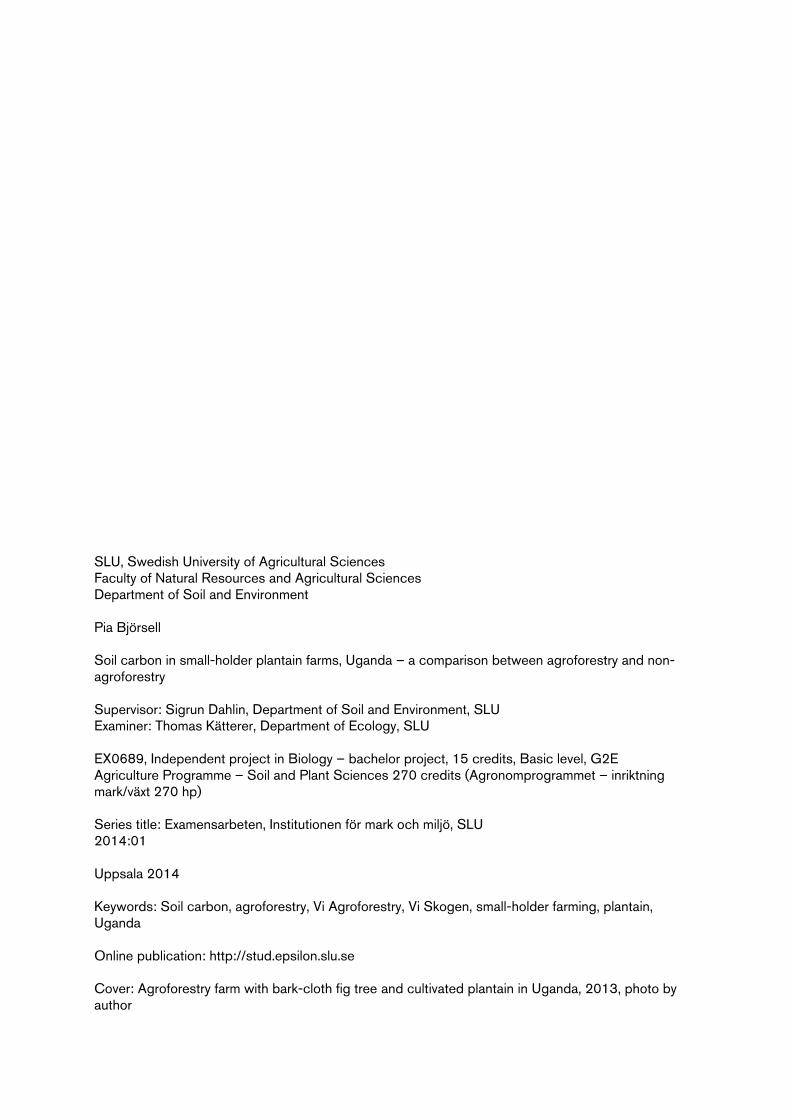
SLU, Swedish University of Agricultural Sciences Faculty of Natural Resources and Agricultural Sciences Department of Soil and Environment Pia Björsell Soil carbon in small-holder plantain farms, Uganda – a comparison between agroforestry and non- agroforestry Supervisor: Sigrun Dahlin, Department of Soil and Environment, SLU Examiner: Thomas Kätterer, Department of Ecology, SLU EX0689, Independent project in Biology – bachelor project, 15 credits, Basic level, G2E Agriculture Programme – Soil and Plant Sciences 270 credits (Agronomprogrammet – inriktning mark/växt 270 hp) Series title: Examensarbeten, Institutionen för mark och miljö, SLU 2014:01 Uppsala 2014 Keywords: Soil carbon, agroforestry, Vi Agroforestry, Vi Skogen, small-holder farming, plantain, Uganda Online publication: http://stud.epsilon.slu.se Cover: Agroforestry farm with bark-cloth fig tree and cultivated plantain in Uganda, 2013, photo by author

Abstract Smallholder farmers in Uganda suffer from declining productivity. With a rapidly
increasing population, marginal land is taken into production and the current land
management leads to loss in soil fertility and escalation in soil erosion. There are
studies indicating that the use of agroforestry increases soil organic carbon (SOC)
compared to systems without trees. Soils which are high in carbon have many ad-
vantages, for example better water holding capacity, which can reduce stress on
crops during drought.
The aim of this study was to determine the effect agroforestry has on SOC con-
centration in small-holder farming systems in Uganda. The intended system to
study was farms practicing agroforestry methods or not in intercropped plantain
(cooking banana) fields. The hypothesis was that the practice of agroforestry leads
to a higher concentration of SOC. Field work was conducted in Kkingo region,
Masaka, Uganda. Ten farms, of which five agroforestry and five non-agroforestry,
were selected in cooperation with Vi Agroforestry. At each farm, soil samplings
were taken close to a tree and in the middle of the field, respectively, to the mass
equivalent depths of 0-20 and 20-40 cm. In total, 40 samples were analysed at Mak-
erere University in Kampala for SOC concentration, water holding capacity, electri-
cal conductivity, pH and texture.
The results showed no significant difference in SOC between agroforestry and
non-agroforestry. Other uncontrolled differences between farms and random varia-
tion probably masked potential effects of the categories agroforestry respective non-
agroforestry. More comprehensive studies with a larger sample of carefully selected
pairs of farms would be needed for being able to quantify the impact of agroforestry
on SOC.

Sammanfattning Småskaliga lantbrukare i Uganda lider av produktionsnedgång i jordbruket. En
snabbt växande befolkning leder till att utmarker i allt större grad tas i bruk och
nuvarande skötselmetoder leder till förluster i markbördighet och ökad jorderosion.
Det finns studier som tyder på att agroforestry ger en ökning av kolhalten i marken
jämfört med system utan träd. Jordar med högre kolhalt har flera fördelar, som
exempelvis en bättre vattenhållande kapacitet, vilket underlättar för grödor att ut-
härda stress vid torka.
Syftet med denna studie var att undersöka effekten agroforestry har på markens
kolhalt i småskaliga lantbruk i Uganda. Systemet avsett att studera var samodlad
kokbanan med och utan agroforestry principer. Hypotesen var att agroforestry prin-
ciperna leder till högre kolhalt i marken än icke-agroforestry. Fältarbete utfördes i
Kkingo regionen, Masaka, Uganda. Tio gårdar valdes ut i samarbete med Vi Sko-
gen, varav fem agroforestry och fem icke-agroforestry. På varje gård togs jordprov-
tagningar nära ett träd respektive mitten av fältet, till mass-ekvivalenta djup på 0-20
och 20-40 cm. Totalt 40 jordprover analyserades vid Makerere Universitetet i Kam-
pala för kolkoncentration, vattenhållande förmåga, elektrisk konduktivitet, pH och
textur.
Resultaten visade inte på några signifikanta skillnader i markens kolkoncentrat-
ion mellan agroforestry och icke-agroforestry. Stor variation i andra brukningsfak-
torer mellan gårdar inom respektive grupp samt slumpmässig variation dolde trolig-
en potentiella effekter av kategorierna agroforestry respektive icke-agroforestry.
Det skulle behövas mer omfattande studier med ett större antal av noggrant utvalda
parade gårdar för att kunna kvantifiera påverkan agroforestry har på markens kol-
halt.
Table of contents
Abbreviations 5
1 Introduction 7
2 Background 8
2.1 Agriculture in Uganda 8
2.2 Agroforestry 9
2.3 Vi Agroforestry 12
2.3.1 Kkingo farmers’ cooperative 14
2.4 Soil carbon 14
2.5 The effect of agroforestry on soil carbon 15
2.6 Strategies to study soil C stocks 16
3 Materials and methods 18
3.1 Study site 18
3.2 In situ 19
3.2.1 Identification and description of sites 19
3.2.2 Soil sampling 22
3.2.3 Preparation of samples 23
3.3 Soil chemical and biological analyses 23
3.4 Statistical analysis 24
4 Results 25
4.1 Total C 25
4.2 Texture, WHC, pH and EC 25
5 Discussion 27
5.1 Limitations of the study and possible improvements 27
5.2 Future work 30
6 Conclusion 31
Acknowledgements 32
References 33
Appendix 36


5
Abbreviations
C Carbon
ESM
Equivalent soil mass
FAO Food and Agriculture Organization of the United Nations
GDP
Gross Domestic Product
ha
Hectares
ICRAF
World Agroforestry Centre (earlier International Centre for Re-
search in Agroforestry)
SIDA
Swedish International Development Cooperation Agency
SOC
Soil organic carbon
ViAFP
Vi Agroforestry Project

6
7
1 Introduction Uganda has a population of almost 35 million people and the land area (197,100
km2) is less than half the size of Sweden. The annual population growth rate is
3,32 %, which leaves Uganda amongst the top five fastest growing populations in
the world (CIA, 2013). The cultivated areas are not enough to sustain the families’
need and farmers start increasingly use marginal land. The marginal areas are for
example steep hillsides, valley bottoms, wetlands and forested land (Rusoke et al.,
2000). A large part of the population is dependent on agriculture (82 %) and many
suffer from food and fuel insecurity (CIA, 2013, Rusoke et al., 2000). The usage
of marginal land and the intensive cultivation leads to soil erosion and loss of soil
nutrients. Looking historically, data are showing that the productivity of agricul-
ture has declined (Rusoke et al., 2000). Adding to the struggles of smallholder
farmers in Uganda, the two rainy seasons are getting more unpredictable due to the
climate change. There is a need for sustainable agriculture which can provide
food, fuel, fodder, fertility and finance. Agroforestry is the practice of combining
trees with crops and/or animals on farms, and is promoted by Vi Agroforestry in
Uganda. When the farmers plant suitable trees they can establish sustainable sup-
plies of animal fodder, firewood, food crops, finance and organic fertilizers (Vi-
Skogen, 2013). They can also improve the quality of their farmland; the practice of
agroforestry has indicated an increase in the fertility of soils, by, amongst other
factors, increasing soil carbon concentrations compared to systems without trees
(Nair et al., 2009a).
Aim of the study and tested hypothesis
The aim of this study was to determine the effect agroforestry has on the soil car-
bon (C) concentration in small-holder farming systems in Uganda. The intended
system to study was farms practicing or not practicing agroforestry methods in
plantain (cooking banana) fields. The hypothesis tested was: The practice of agro-
forestry will lead to a higher concentration of soil carbon.

8
2 Background
2.1 Agriculture in Uganda
Agriculture is an important part of Uganda’s economy, employing 82 % of the
labour and contributing 23.9 % of the gross domestic product (GDP). The most
important agricultural products are coffee, tea, cotton, tobacco, cassava (tapioca),
Irish potatoes, corn, millet, pulses, cut flowers, beef, goat meat, milk and poultry.
Of these the major export crops are coffee, tea, cotton and horticultural products
(CIA, 2013). The productivity in agriculture has declined in Uganda, for example
banana yields have gone from 8.5 tonnes per hectare to 5.7 tonnes per hectare
from 1970 to 1996. This is mainly because of a decrease in soil fertility, increase
in soil erosion and pests, and overall poor land-management practices (Rusoke et
al., 2000, Vi-Skogen, 2013).
A typical farmer in Uganda is a smallholder farmer who holds around 2 hectare,
use simple technology (most commonly land hoe and machete) and applies a min-
imal amount of inputs such as fertilizers and other agrochemicals. Characteristic is
also a lack of access to financial credits and advisory services, which means that
the farmers have difficulties in acquiring modern technology and methods. The
family is an important source of labour but often it is mainly the women working
in the fields. Other problems are recirculation of low-yielding seed varieties, inse-
cure land-tenure systems, dependence of rain-fed agriculture, overuse and over-
cultivation of the smallholdings, poor and unreliable market access for both inputs
and outputs, large herds of livestock leading to overgrazing and high post-harvest
losses (Rusoke et al., 2000).
The country can be divided into four agro-ecological zones and depending on
these and the farmers’ production orientation, Uganda can also be classified in
nine different farming systems. The agro-ecological zones are the high-altitude
zone producing temperate-zone crops, the pastoral dry to semi-arid rangeland zone
practising pastorals systems, the northern and eastern short-grassland zone prac-
9
tising cotton-finger millet-mixed farming systems and the southern and western
tall-grassland zone producing perennial and annual crops in mixed farming
(Rusoke et al., 2000).
Common perennial crops in the southern and western tall-grassland zone are
banana and plantain (cooking banana). These areas have Acrisols and Ferrasols,
which are very weathered soils and crop production subsequently depends upon
nutrient input to produce high yield. Banana is a huge, herbaceous quasi-perennial
with a relatively large request for nutrients and good soil structure. As mentioned
above, farmers in Uganda seldom use fertilisers; instead tradition is to use a large
amount of organic residues. By applying surface mulch and letting it decompose,
nutrients are released and the soil structure is improved. The mulch is a mixture of
residues from different crops which banana and plantain are often intercropped
with. These are maize, beans, groundnuts, coffee, cassava, potato, yams etcetera
(Lekasi et al., 1999).
2.2 Agroforestry
The idea of combining trees, crops and animals on the same land unit is not a new
practice; on the contrary it has ancient roots. However it is only for the past three
decades it has been recognized by international development associations and the
scientific world. It has surfaced as a way to sustain agricultural production in mar-
ginal lands and far-off areas not reached by the Green Revolution (Nair et al.,
2010). Agroforestry is estimated to cover over 1 billion hectare and to be practised
by 1.5 billion farmers worldwide (Zomer et al., 2009). One definition of agrofor-
estry presented by Lundgren and Raintree in 1982 at World Agroforestry Center
(ICRAF) is:
Agroforestry is a collective name for land-use systems and technologies where
woody perennials (trees, shrubs, palms, bamboos, etc.) are deliberately used on
the same land-management units as agricultural crops and/or animals, in some
form of spatial arrangement or temporal sequence. In agroforestry systems
there are both ecological and economical interactions between the different
components (Nair, 1993).
Depending on their composition, the different kinds of agroforestry systems are
silvopastoral (trees and animals), agrisilvicultural (trees and crops), agrosilvopas-
toral (trees, crops and animals) and others like multipurpose tree-lots, aquaculture
with trees, etcetera (Nair, 1993).
10
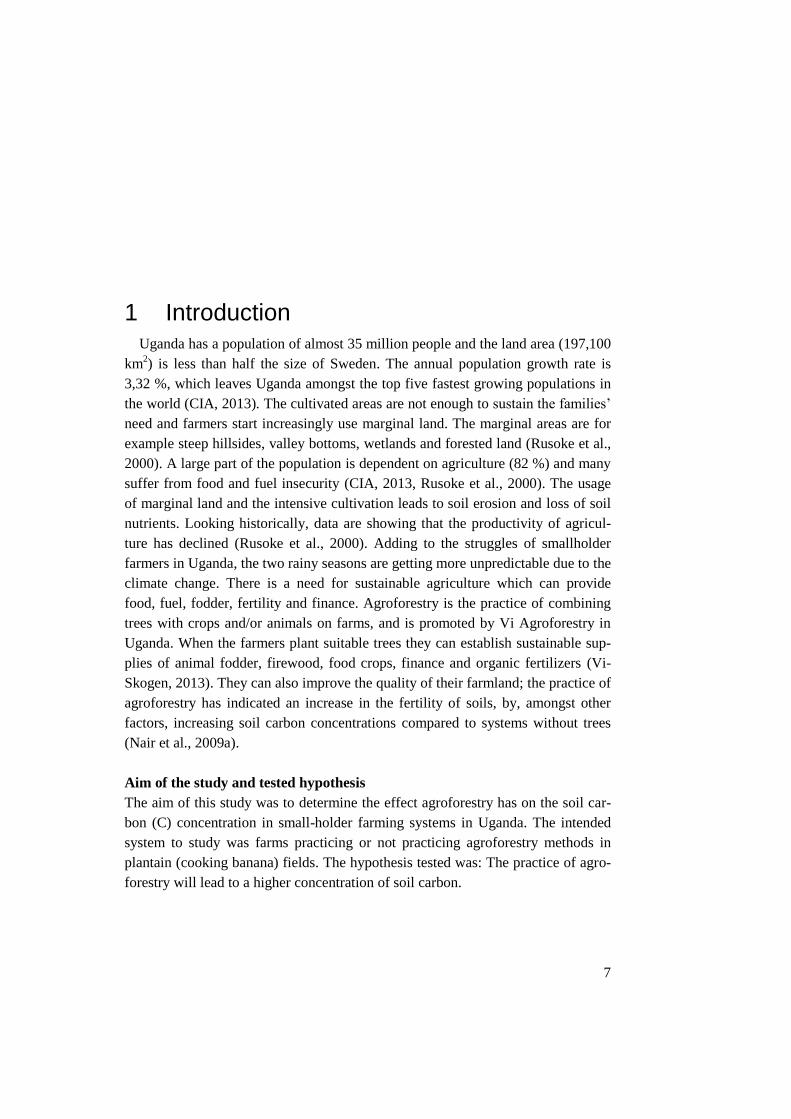
In the systems where animals are included, zero-grazing is a common practise.
Zero-grazing is a system where the animals are kept in stables and fodder is
brought to them (Figure 1). This management practice is gaining popularity espe-
cially in parts where areas for free grazing is limited. The zero-grazing practice is
considered to increase land productivity, this due to the easier collection of manure
that tends to increase the crop yields (Oluka-Akileng et al., 2000).
Figure 1.Goat under zero-grazing at Vi
Agroforestry’s Training Center in Masaka.
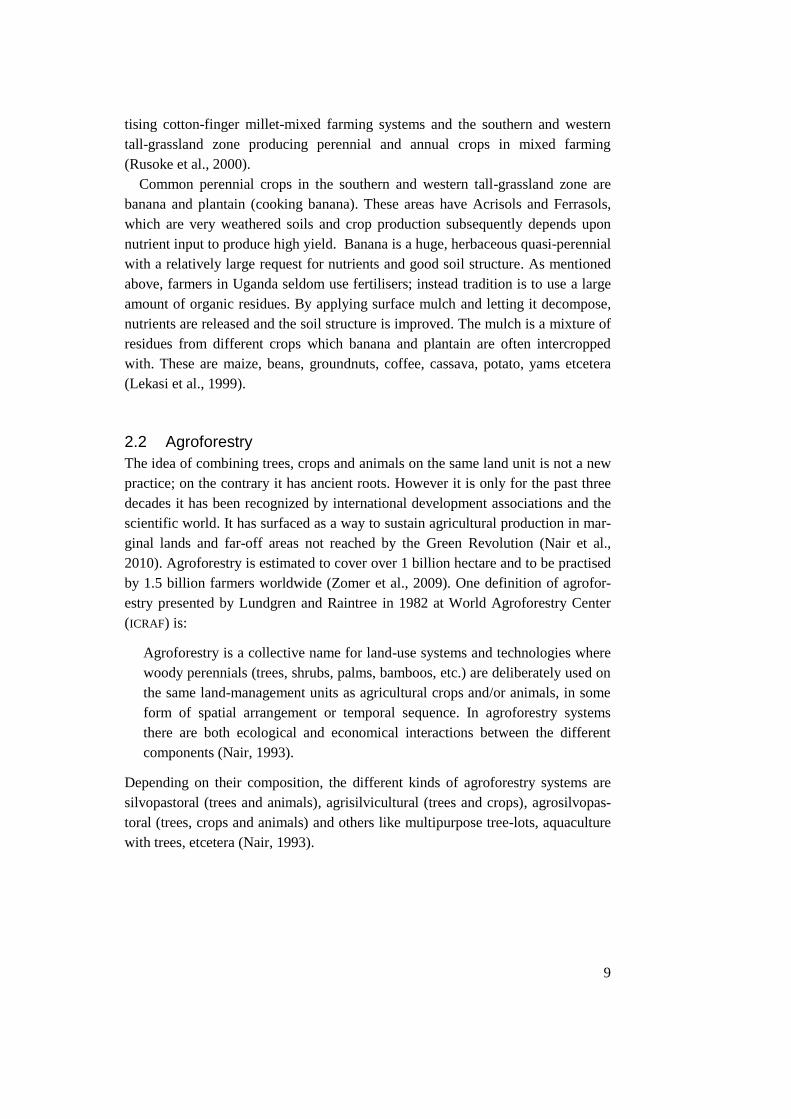
Trees can be arranged in different manners in agroforestry systems, either spatial
(in space) or temporal (in time), depending on the choice of the farmer. For exam-
ple hedges give fodder and controls soil erosion while boundary tree planting may
serve to demarcate land between neighbours and fallow can be used to restore
degraded land (Nair, 1993). Figure 2 shows some examples of how trees and crops
can be arranged in agroforestry systems.
11
Figure 2.Example of how trees and crops can be cropped both spatial and temporal.
Source: Nyberg (2013). With permission.
Agroforestry systems are divers and make farmers more able to cope with cata-
strophic events, such as diseases and natural disasters, as he/she is not relying on
one crop only. Trees contribute with litter and mulch, some species can fix nitro-
gen from the air and roots of trees and shrubs can penetrate the soil deeper than
usual crops. Deep roots decrease leaching of nutrients below the main crop root
zone as well as perform ‘mining’ of nutrients and improve soil structure. If trees
are planted in the right arrangement, soil erosion can be controlled (Lwakuba et
al., 2003, van Noordwijk et al., 2011). Studies have shown that some tree species
redistribute water in the soil profile, known as hydraulic redistribution, and there-
by prevent soil in the upper layers from drying out too fast. This complementary
effect is however dependent upon plant-plant interactions and how wet or dry the
soil is, for example the tree-crop mixture may take up more water than is redistrib-
uted (Bayala et al., 2008). Trees also have additional benefits and can be used as
timber, firewood, fruits, fibres and raw material for medicine. Trees can have the
function to regulate the microclimate, by for example acting as windbreaks, and
can be used as live fences, and thereby contribute to control land-use (Lwakuba et
al., 2003, van Noordwijk et al., 2011).
There are also downsides with trees, they can host pests and diseases and make
the field more attractive for insects, birds and/or animals (Lwakuba et al., 2003). If
not properly managed, the tree competes with the crop for light, nutrients and wa-
ter instead of increasing yield (van Noordwijk et al., 2011). This can be avoided by
pruning and other management methods, which in its turn can be time-consuming
and hard work. Most trees require long time investment, which can be a threshold
to the farmers who may need a faster return to their investments. After cutting
trees for wood, large stumps makes land preparation difficult. When introducing
new species it may thrive in its new habitat and become a difficult weed problem
(Lwakuba et al., 2003). Some species are not suitable for agroforestry, like for
example eucalyptus, which is highly water-competitive (van Noordwijk et al.,
2011).
12
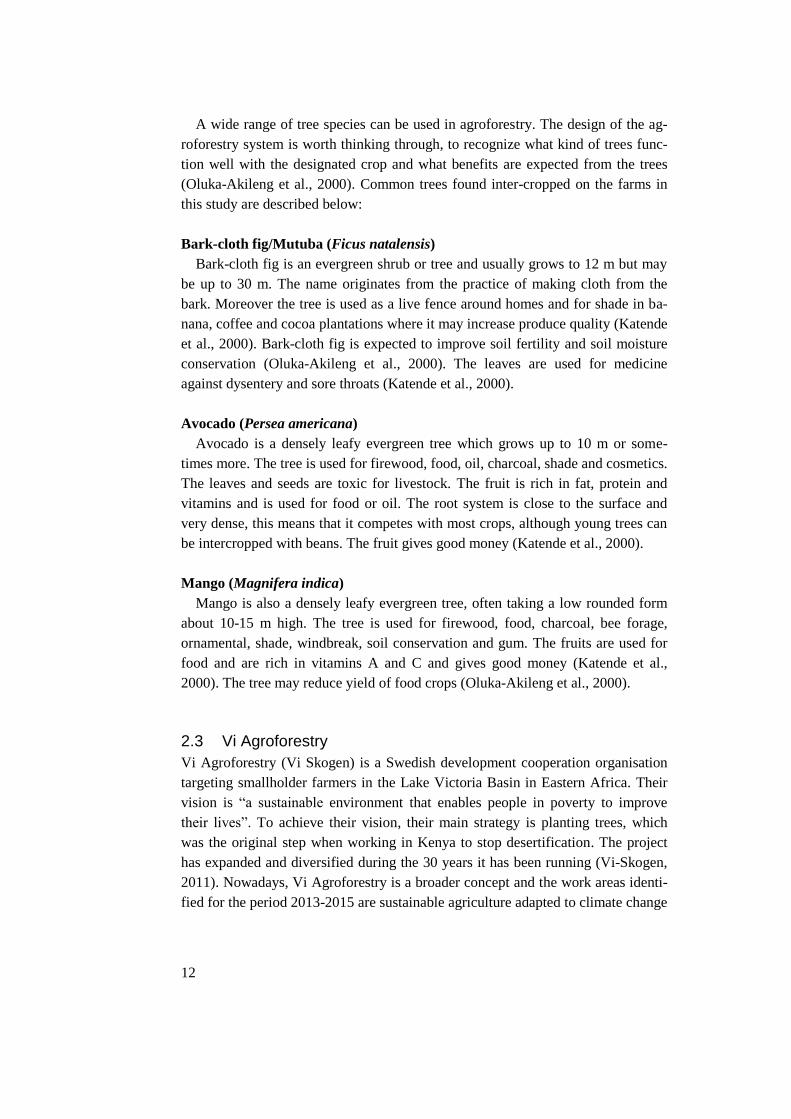
A wide range of tree species can be used in agroforestry. The design of the ag-
roforestry system is worth thinking through, to recognize what kind of trees func-
tion well with the designated crop and what benefits are expected from the trees
(Oluka-Akileng et al., 2000). Common trees found inter-cropped on the farms in
this study are described below:
Bark-cloth fig/Mutuba (Ficus natalensis)
Bark-cloth fig is an evergreen shrub or tree and usually grows to 12 m but may
be up to 30 m. The name originates from the practice of making cloth from the
bark. Moreover the tree is used as a live fence around homes and for shade in ba-
nana, coffee and cocoa plantations where it may increase produce quality (Katende
et al., 2000). Bark-cloth fig is expected to improve soil fertility and soil moisture
conservation (Oluka-Akileng et al., 2000). The leaves are used for medicine
against dysentery and sore throats (Katende et al., 2000).
Avocado (Persea americana)
Avocado is a densely leafy evergreen tree which grows up to 10 m or some-
times more. The tree is used for firewood, food, oil, charcoal, shade and cosmetics.
The leaves and seeds are toxic for livestock. The fruit is rich in fat, protein and
vitamins and is used for food or oil. The root system is close to the surface and
very dense, this means that it competes with most crops, although young trees can
be intercropped with beans. The fruit gives good money (Katende et al., 2000).
Mango (Magnifera indica)
Mango is also a densely leafy evergreen tree, often taking a low rounded form
about 10-15 m high. The tree is used for firewood, food, charcoal, bee forage,
ornamental, shade, windbreak, soil conservation and gum. The fruits are used for
food and are rich in vitamins A and C and gives good money (Katende et al.,
2000). The tree may reduce yield of food crops (Oluka-Akileng et al., 2000).
2.3 Vi Agroforestry
Vi Agroforestry (Vi Skogen) is a Swedish development cooperation organisation
targeting smallholder farmers in the Lake Victoria Basin in Eastern Africa. Their
vision is “a sustainable environment that enables people in poverty to improve
their lives”. To achieve their vision, their main strategy is planting trees, which
was the original step when working in Kenya to stop desertification. The project
has expanded and diversified during the 30 years it has been running (Vi-Skogen,
2011). Nowadays, Vi Agroforestry is a broader concept and the work areas identi-
fied for the period 2013-2015 are sustainable agriculture adapted to climate change
13
(based on agroforestry and the right to food), strong farmer organisations, gender
equality and economic security (Vi-Skogen, 2013).
The organisation is non-profit and non-governmental; funding is received from
direct donations, fundraising activities and the organisations biggest financier the
Swedish International Development Cooperation Agency (Sida). Cooperation with
companies is becoming more important, and the organisation wants to increase the
selling of climate compensation to companies (Vi-Skogen, 2013).
The cooperation works in Kenya, Tanzania, Uganda and Rwanda. In Uganda,
the Vi Agroforestry project started 1992 and has been through the same develop-
ment and diversification as the rest of the organization. The areas of the project are
concentrated around Kampala and Masaka. An important principle of Vi Agrofor-
estry is to make the areas they work in independent by building networks. When it
is time, Vi Agroforestry steps back and the area is self-sufficient in for example
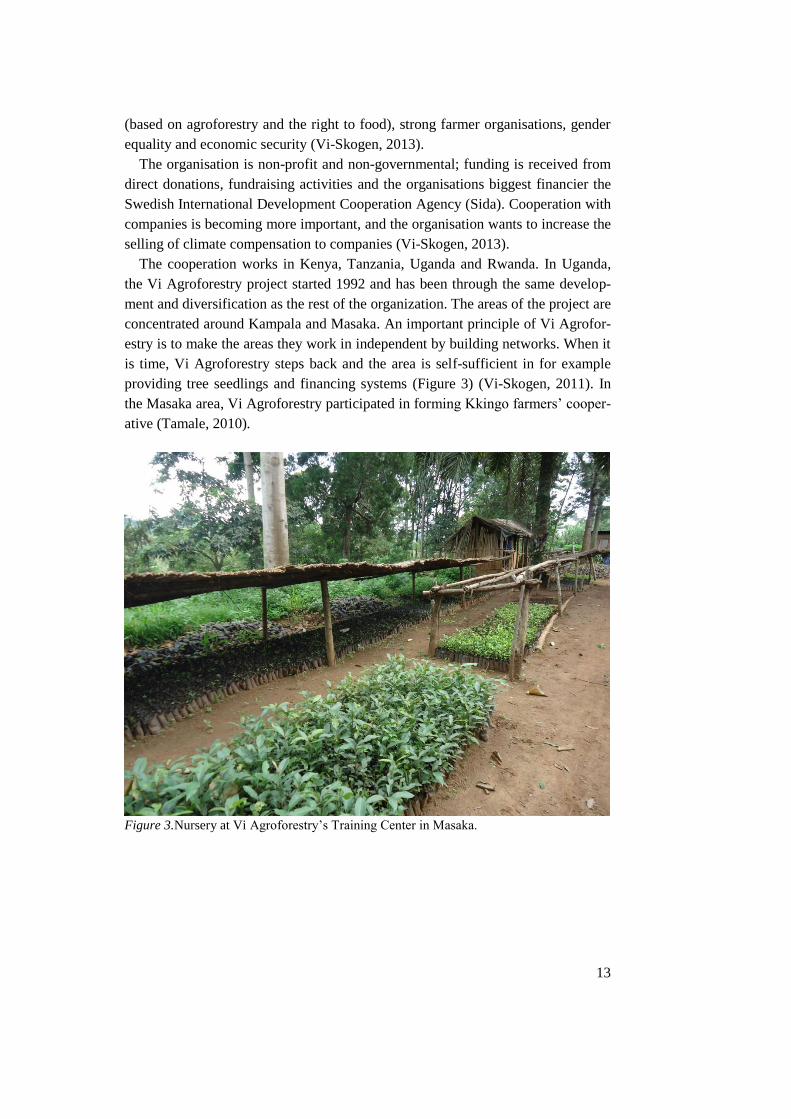
providing tree seedlings and financing systems (Figure 3) (Vi-Skogen, 2011). In
the Masaka area, Vi Agroforestry participated in forming Kkingo farmers’ cooper-
ative (Tamale, 2010).
Figure 3.Nursery at Vi Agroforestry’s Training Center in Masaka.
14
2.3.1 Kkingo farmers’ cooperative
The cooperative is located in Kyangoma village, Nkoni Parish, Kkingo sub-county
in Lwengo District. The cooperative started at the end of the Vi Agroforestry Pro-
ject, in July 2007. The cooperative first consisted of 124 farmers but has grown
and today holds around 900 members. By forming a cooperative the farmers have
more power in bargaining, planning and marketing. Their activities involve enter-
prises such as dairy cattle rearing for milk production, banana plantations and cof-
fee farming, tree planting, community savings empowerment (CO-SAVE), etc. They
affect these enterprises by offering services: agricultural extension, financial ser-
vice (CO-SAVE), artificial inseminations (AI) and collective marketing of farm pro-
duce and procurement of farm inputs. The cooperative collaborate with organisa-
tions such as East Africa Dairies Development Program (EADDP), Send a Cow and
Vi Agroforestry (Tamale, 2010).
The agricultural techniques that the cooperative promotes is land management
practices such as compost preparation and application in order to improve soil
fertility, construction of trenches to trap water to secure water availability and soil
erosion control by using crop residues as trash lines and building terraces. The
tree-growing is made easier by having a tree nursery which provides the members
with seedlings at subsidized prices. The trees are planted in agroforestry systems
including hedge planting (mostly with Calliandra), boundary tree planting, dis-
persed planting to provide shade to coffee, planting around compounds and meas-
urements for firewood conservation (Tamale, 2010).
2.4 Soil carbon
The concentration of carbon in the soil is the result of the input of new organic
material and the decomposition of new and old material. Changes in soil carbon
concentrations are slow; the effects of changed land-use can only be seen after a
long time. This is due to the fact that the largest part of the carbon occurs in stable
forms and has a very slow turn-over; new input of organic material (like leaves or
straw) gives a very small contribution in comparison to the total stock of carbon.
For example, the new input often represents only one or a few percent of the car-
bon stock. Therefore, even though its turn-over rate is fast and changes in the fresh
C stocks are faster the rate of total soil C stock change is mostly determined by the
stable forms. An expected increase or decrease in carbon concentrations after
changing soil/crop/farm management may therefore take many years before
changes are measurable (Eriksson et al., 2011).
Soil organic carbon (SOC) plays an important part in biological, chemical and
physical processes in the soil. It also is the main source of energy for most of the
soil organisms which aid the release of plant available nutrients when the organic

15
matter is decomposed (Eriksson et al., 2011). The soil organic matter and microor-
ganisms also contribute in buffering pH, help soil aggregation and degrade pollu-
tants and pesticides. SOC also adds to the soils cation exchange capacity and water
holding capacity, which is important especially in sandy soils. Soils which are
high in carbon have many advantages, for example better water holding capacity,
which can reduce stress on crops, like for instance during drought (Paterson and
Hoyle, 2011).
There is a positive correlation between carbon and clay content, for example
clay soil with 50 % clay have a minimum concentration of organic matter that is
twice as high as in sandy soil with a small amount clay (Eriksson et al., 2011).
This is partly because the clay particles and the organic matter bind strongly to
each other and increase soil aggregation, so called organo-mineral complexes. The
organic matter becomes spatially inaccessible or difficult to access for the decom-
posing soil organisms which lower the turn-over rate. Another important factor
which has a great impact on the soil carbon concentration is climate (Eriksson et
al., 2011).
2.5 The effect of agroforestry on soil carbon
As the trees are growing in the agroforestry system they sequester carbon; bind
carbon in their biomass and influence the carbon storage by litter fall and decay,
fine root dynamics, organic matter turn-over, deposition in the rhizosphere and
formation of soil aggregates and organo-mineral complexes (Nair et al., 2010). If
external effects such as wind or steep slope are absent, individual trees affect the
soil in a manner of symmetry; the highest impact is seen under the crown canopy
and declines outward. Phenomena like this have been called “islands of fertility”
or “resource islands”, with a microenvironment which leads to a positive loop for
the establishment and productivity of new vegetation (Zinke, 1962).
An estimated potential for total C sequestration in agroforestry systems is be-
tween 12 and 228 Mg C ha-1
(Albrecht and Kandji, 2003). The variation largely
depends on the kind of agroforestry system put in place. The structure and func-
tion are often determined by environmental and socio-economic variables, but also
tree species and system management influence the carbon storage.
Research indicates that when combining trees, crops and/or animals in an agro-
forestry system more carbon is generally sequestered, compared to non-
agroforestry. Nair et al. (2009a) summarized 12 reports on soil carbon-
sequestration potential under agroforestry systems and shows an overall ranking in
SOC content where forest > agroforests > tree plantations > arable crops. Because
the reports were selected in order to cover a broad spectrum of agroforestry sys-
tems in different geographical areas, the sizes of soil carbon stocks in the reports

16
vary greatly depending on the variation between the systems, ecological regions
and soil types: e.g. from 6.9 to 302 Mg C ha-1
(0-100 cm) or 45 to 162 Mg C ha-1
(0-40 cm) (Nair et al., 2009a). A fixed sampling depth was used in these studies,
and changes in bulk density were not taken into consideration (Amézquita et al.,
2004, Haile et al., 2008, Kirby and Potvin, 2007, Makumba et al., 2007,
Oelbermann et al., 2006, Parrotta, 1999, Peichl et al., 2006, Sharrow and Ismail,
2004, Swamy and Puri, 2005, Takimoto et al., 2008).
2.6 Strategies to study soil C stocks
In most literature SOC is quantified to a fixed depth, calculated as the product of
SOC concentration, bulk density, and depth. Historically this has been the main
practice and is, among others, adapted by Intergovernmental Panel on Climate
Change (IPCC) and the European Union (EU). However Wendt and Hauser (2013)
argue, as do several researchers, that the fixed depth method is inaccurate. Consid-
erable errors have been shown when using the method, due to the fact that soil
bulk density can differ between treatments like till or no-till, different land-use
systems or changes during a monitoring period. When for example comparing
tillage and no-tillage at a depth of 30 cm, tillage to a depth of 25 cm may lead to a
change in bulk density from 1.20 to 1.00 g cm-3
. The soil thus occupies 30 cm
instead of 25 cm after tillage, this means that the soil with tillage has less soil mass
to be analysed for SOC (see Figure 4). In order to avoid these errors, Wendt and
Hauser are instead promoting equivalent soil mass (ESM) to quantify SOC. This
method is based on fixed soil mass layers with given reference mass (Wendt and
Hauser, 2013) as further explained below.

17
Figure 4. Example of error fixed depth creates when soil bulk density differs. Created
after: Wendt and Hauser (2013).
18
3 Materials and methods This study included soil sampling and analysis. Field work was carried out in the
Kkingo region, Uganda. Soil samples were taken between 11th of April and 10
th of
May 2013. Samples were collected from 10 farms with continuous intercropped
plantain, five of these practiced agroforestry as identified by the Vi Agroforestry
extension officer and the board of Kkingo farmers’ cooperative. Agroforestry had
been implemented since 1995. Vi Agroforestry left the area 2006 but the farms
were still implementing agroforestry. Laboratory analyses were conducted at
Makerere University, Kampala, Uganda.
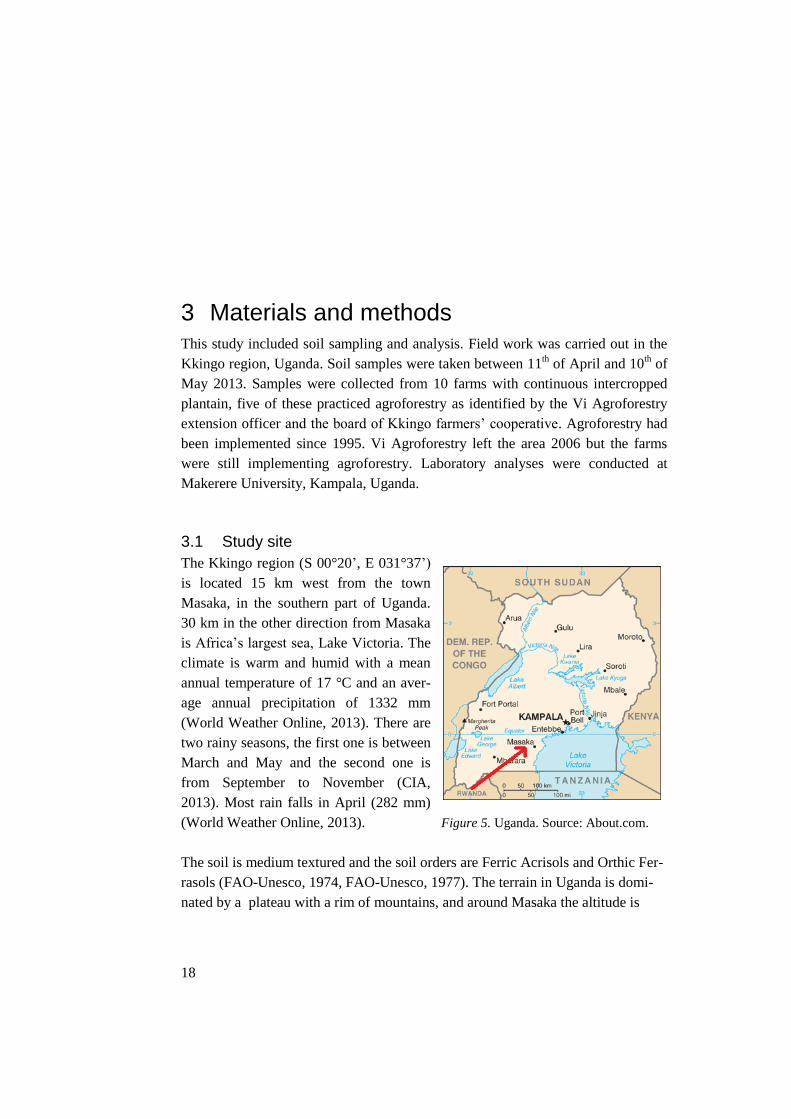
3.1 Study site
The Kkingo region (S 00°20’, E 031°37’)
is located 15 km west from the town
Masaka, in the southern part of Uganda.
30 km in the other direction from Masaka
is Africa’s largest sea, Lake Victoria. The
climate is warm and humid with a mean
annual temperature of 17 °C and an aver-
age annual precipitation of 1332 mm
(World Weather Online, 2013). There are
two rainy seasons, the first one is between
March and May and the second one is
from September to November (CIA,
2013). Most rain falls in April (282 mm)
(World Weather Online, 2013). Figure 5. Uganda. Source: About.com.
The soil is medium textured and the soil orders are Ferric Acrisols and Orthic Fer-
rasols (FAO-Unesco, 1974, FAO-Unesco, 1977). The terrain in Uganda is domi-
nated by a plateau with a rim of mountains, and around Masaka the altitude is
19
between 1200-1300 m.a.s.l. (CIA, 2013). The slopes in the area are according to
FAO classification both a- and b-class, which are level to gently undulating (0-8
percent) and rolling to hilly (8-30 percent), respectively (FAO-Unesco, 1974). The
area belongs to the southern and western tall-grasslands zone and the farming
system is intensive banana-coffee-lake shore system (Rusoke et al., 2000).
3.2 In situ
3.2.1 Identification and description of sites
Ten farms were selected after communication with Vi Agroforestry and the farm-
ers as well as observation for certain characteristics. The study was carried out in
collaboration with two other studies; therefore the farms were chosen to suit all
demands. Criteria for the farms were to have approximately the same soil type
(preferably 25-30 % clay) and to grow plantains. The agroforestry farms were
requested to have agroforestry trees planted in a dispersed manner and to practice
mulching. The non-agroforestry farms also had trees in their fields, but less and
not managed by agroforestry methods. There were no nitrogen fixing trees on any
of the farms, but three farms had beans intercropped. All farms had animals but
the agroforestry farms were implementing zero grazing whereas the other farms
had free grazing. The animals were cows, pigs, goats and chickens, in varied size
of herds (see Table 1). Truly paired farms could not be found; however as similar
micro-climate as possible was obtained for all farms by selecting farms within the
same area (see Figure 6). GPS coordinates (including elevation) were noted. At
each farm two sites were selected for soil sampling, one in the middle of a field
and one close to a tree (as affected as possible by agroforestry). This was done in
order to get as similar degree of disturbance and sun radiation as possible for the
two groups of samples. Photo documentation was done for all field activities. In-
dividual information for each farm can be seen in Table 2.
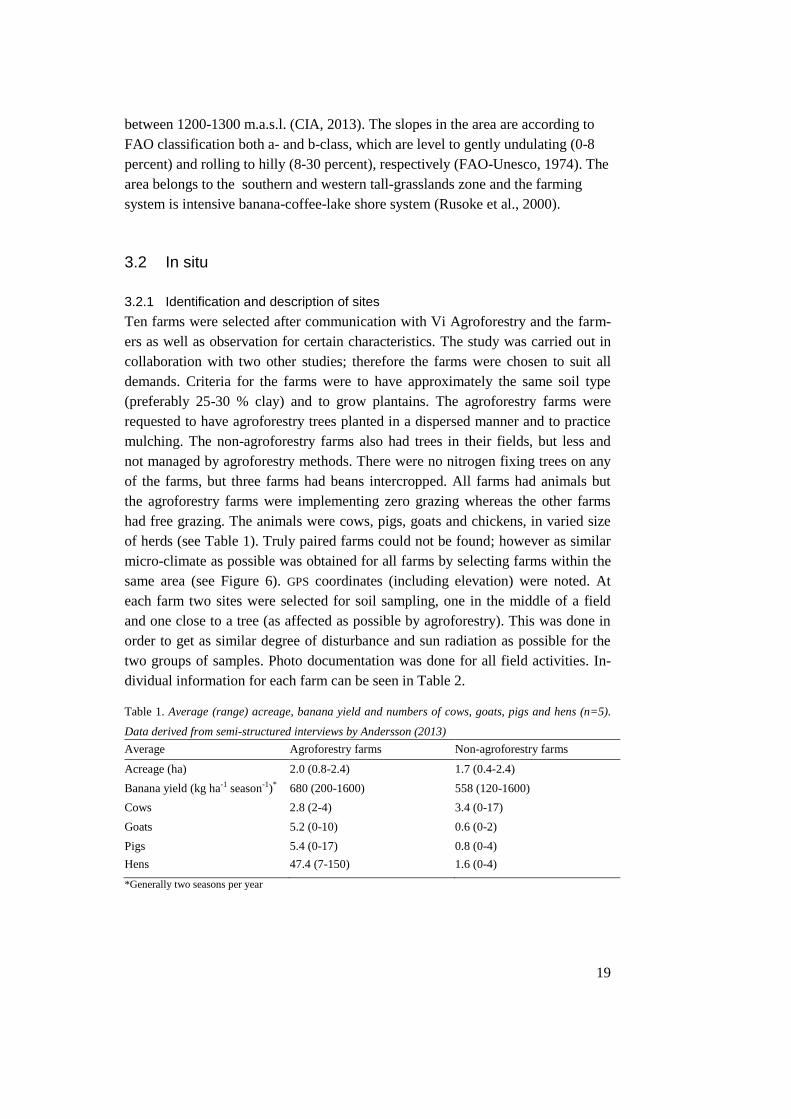
Table 1. Average (range) acreage, banana yield and numbers of cows, goats, pigs and hens (n=5).
Data derived from semi-structured interviews by Andersson (2013)
Average Agroforestry farms Non-agroforestry farms
Acreage (ha) 2.0 (0.8-2.4) 1.7 (0.4-2.4)
Banana yield (kg ha-1 season-1)* 680 (200-1600) 558 (120-1600)
Cows 2.8 (2-4) 3.4 (0-17)
Goats 5.2 (0-10) 0.6 (0-2)
Pigs 5.4 (0-17) 0.8 (0-4)
Hens 47.4 (7-150) 1.6 (0-4)
*Generally two seasons per year

20
Figure 6. Overview of the location of the farms. Graphics: Anders Larsolle, SLU. With
permission.
6
5
4
938
7
1
12
11
0 200 400 600 800 1 000Meter
Agroforestry
Non-agroforestry
21
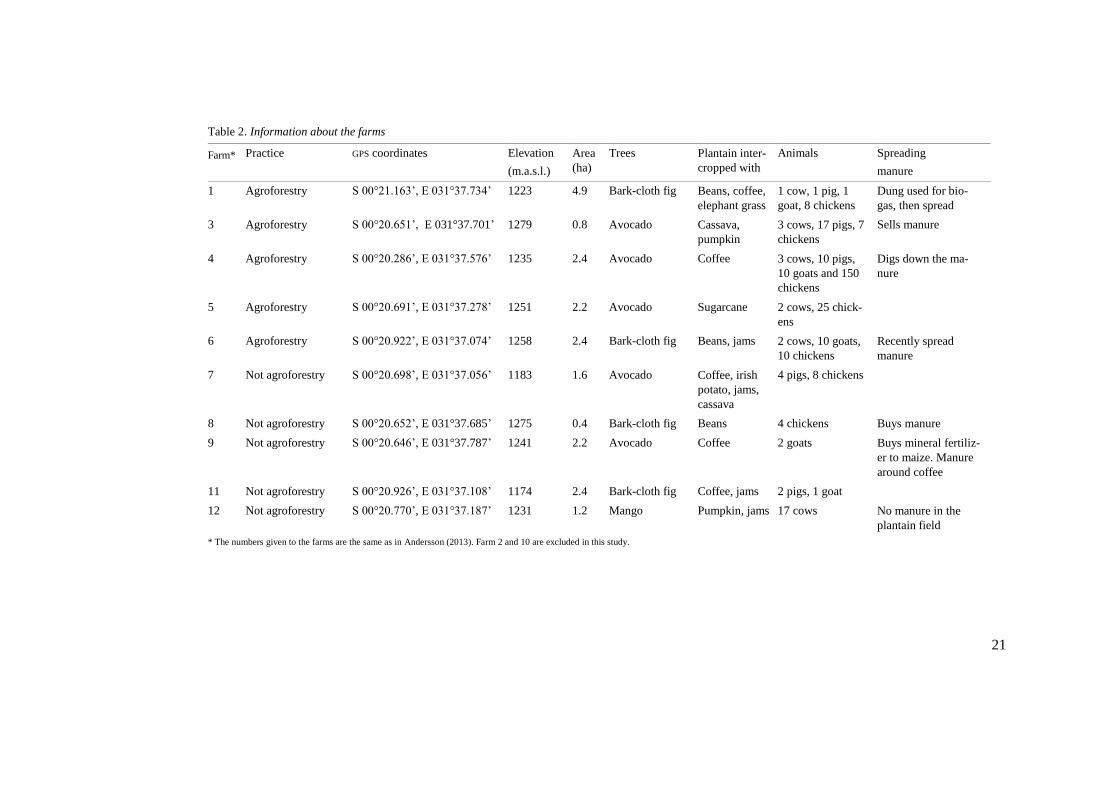
Table 2. Information about the farms
* The numbers given to the farms are the same as in Andersson (2013). Farm 2 and 10 are excluded in this study.
Farm* Practice GPS coordinates Elevation
(m.a.s.l.)
Area
(ha)
Trees Plantain inter-
cropped with
Animals Spreading
manure
1 Agroforestry S 00°21.163’, E 031°37.734’ 1223 4.9 Bark-cloth fig Beans, coffee,
elephant grass
1 cow, 1 pig, 1
goat, 8 chickens
Dung used for bio-
gas, then spread
3 Agroforestry S 00°20.651’, E 031°37.701’ 1279 0.8 Avocado Cassava,
pumpkin
3 cows, 17 pigs, 7
chickens
Sells manure
4 Agroforestry S 00°20.286’, E 031°37.576’ 1235 2.4 Avocado Coffee 3 cows, 10 pigs,
10 goats and 150
chickens
Digs down the ma-
nure
5 Agroforestry S 00°20.691’, E 031°37.278’ 1251 2.2 Avocado Sugarcane 2 cows, 25 chick-
ens
6 Agroforestry S 00°20.922’, E 031°37.074’ 1258 2.4 Bark-cloth fig Beans, jams 2 cows, 10 goats,
10 chickens
Recently spread
manure
7 Not agroforestry S 00°20.698’, E 031°37.056’ 1183 1.6 Avocado Coffee, irish
potato, jams,
cassava
4 pigs, 8 chickens
8 Not agroforestry S 00°20.652’, E 031°37.685’ 1275 0.4 Bark-cloth fig Beans 4 chickens Buys manure
9 Not agroforestry S 00°20.646’, E 031°37.787’ 1241 2.2 Avocado Coffee 2 goats Buys mineral fertiliz-
er to maize. Manure
around coffee
11 Not agroforestry S 00°20.926’, E 031°37.108’ 1174 2.4 Bark-cloth fig Coffee, jams 2 pigs, 1 goat
12 Not agroforestry S 00°20.770’, E 031°37.187’ 1231 1.2 Mango Pumpkin, jams 17 cows No manure in the
plantain field

22
3.2.2 Soil sampling
In order to capture an equivalent soil mass layer representing approximately 40 cm
of soil, six cores in each field were taken to 40 cm depth (3 cores per sampling
plot) using a soil auger. To decide the reference sample mass an average weight of
the samples was calculated after drying and weighing each core.
At each sampling plot eight new samples were subsequently taken to a total
depth of 48 cm. The cores were taken from 3 layers (0-16, 16-32 and 32-48 cm).
The eight samples from each sub-layer were pooled, dried and stored in plastic
bags (Figure 7).
Figure 7. Field work; left: emptying auger, right: example of depth 0-16.

23
3.2.3 Preparation of samples
Figure 8. Preparation of samples by sieving at Makerere University.
Soils samples were analysed at Makerere University, Kampala. In Kampala the
samples were left to further air-dry for about two days and then crushed manually
before sieving through a 2 mm sieve (Figure 8). The depth layer 0-16 was topped
up to ½ of the reference sample mass (601 g), using soil from the 16-32 cm layer.
The remaining mass from the 16-32 cm layer was then topped up to half of the
reference soil mass using the sample from 32-48 cm layer. In all cases correction
for gravel content was made. What was left of the last depth layer (32-48 cm) was
discarded. This gave 40 samples with the equivalent soil mass depth layers corre-
sponding to on average 0-20 and 20-40 cm, hereafter named depth layers 0-20 cm
and 20-40 cm.
3.3 Soil chemical and biological analyses
Organic carbon concentration was determined by using the Walkey-Black method
(Walkey and Black, 1934) with the addition of external heating as modified by
Nelson and Sommers (1975). The carbon was oxidized by a mixture of aqueous
potassium dichromate (K2Cr2O7) and sulfuric acid. After heating, the samples were
titrated with ferrous ammonium sulfate against the residual K2Cr2O7. From the
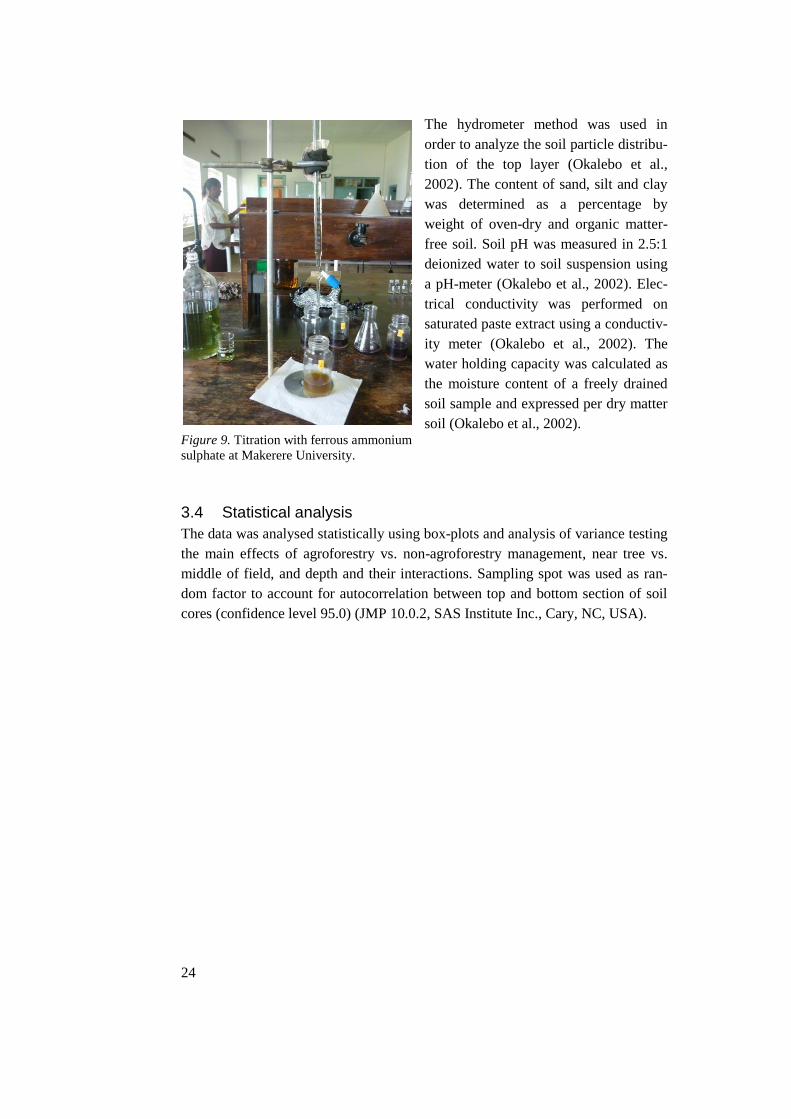
volume titrated, organic carbon was calculated (Figure 9)(Okalebo et al., 2002).
24
The hydrometer method was used in
order to analyze the soil particle distribu-
tion of the top layer (Okalebo et al.,
2002). The content of sand, silt and clay
was determined as a percentage by
weight of oven-dry and organic matter-
free soil. Soil pH was measured in 2.5:1
deionized water to soil suspension using
a pH-meter (Okalebo et al., 2002). Elec-
trical conductivity was performed on
saturated paste extract using a conductiv-
ity meter (Okalebo et al., 2002). The
water holding capacity was calculated as
the moisture content of a freely drained
soil sample and expressed per dry matter
soil (Okalebo et al., 2002). Figure 9. Titration with ferrous ammonium
sulphate at Makerere University.
3.4 Statistical analysis
The data was analysed statistically using box-plots and analysis of variance testing
the main effects of agroforestry vs. non-agroforestry management, near tree vs.
middle of field, and depth and their interactions. Sampling spot was used as ran-
dom factor to account for autocorrelation between top and bottom section of soil
cores (confidence level 95.0) (JMP 10.0.2, SAS Institute Inc., Cary, NC, USA).
25
4 Results
4.1 Total C
The null hypothesis was proved; there was no significant difference in soil carbon
for any of the depths between agroforestry and non-agroforestry (see Table 3).
Since equivalent soil mass was sampled the same relations were valid for the
amounts of soil carbon within each depth layer. When the amounts of soil carbon
were summed over the whole depth (0-40 cm), there were also no significant dif-
ferences between production systems nor sampling locations (results not shown).
The only significant result was that the carbon concentrations declined with
depth (p-value < 0.0001) (see Table 3).
4.2 Texture, WHC, pH and EC
The soils were similar in texture, water holding capacity, pH and electrical con-
ductivity; no significant difference could be found (see Table 3).

26
Table 3. Average (std) content of clay, silt and sand, water holding capacity (WHC), soil carbon concentration (in percent of air-dried soil), pH and electrical conduc-
tivity (EC) in agroforestry and non-agroforestry soils. P-value for comparison of agroforestry vs. non-agroforestry, close to tree vs. middle of field and 0-20 vs. 20-40
cm (n=5)
* not significant
Clay (%) Silt (%) Sand (%) WHC (%) C (%) pH EC (µS/cm)
Agroforestry Near tree 0-20 33.6 (8.4) 15.2 (5.7) 48.6 (5.8) 32.4 (6.8) 1.5 (0.2) 7.3 (0.9) 142.5 (20.9)
20-40 29.3 (8.1) 1.0 (0.2) 6.9 (1.3) 115.2 (31.1)
Middle of field 0-20 30.5 (10.6) 14.0 (4.2) 53.2 (9.1) 31.5 (8.2) 1.4 (0.2) 7.4 (1.3) 242.5 (174.3)
20-40 31.5 (1.2) 0.9 (0.2) 7.1 (1.7) 148.3 (126.4)
Non agroforestry Near tree 0-20 29.4 (7.1) 17.1 (6.7) 52.8 (6.0) 32.5 (2.6) 1.7 (0.2) 7.0 (1.2) 126.1 (43.3)
20-40 28.0 (5.0) 1.0 (0.2) 6.6 (0.9) 75.2 (44.6)
Middle of field 0-20 30.8 (8.9)
14.7 (4.4) 53.5 (6.1) 32.7 (7.2) 1.4 (0.2) 7.1 (0.9) 114.8 (46.1)
20-40 31.6 (4.7) 1.1 (0.1) 6.8 (0.6) 79.5 (45.9)
P-value
Agro vs. non agro 0-20 ns* ns* ns* ns* ns* ns* ns*
20-40 ns* ns* ns* ns*
Near tree vs.
middle of field
0-20 ns* ns* ns* ns* ns* ns* ns*
20-40 ns* ns* ns* ns*
0-20 vs. 20-40 ns* <0.0001 ns* ns*
27
5 Discussion The hypothesis tested was if there were any differences in soil carbon concentra-
tions between agroforestry and non-agroforestry in small-holder plantain produc-
tion. The results did not show any significant differences in soil organic carbon
concentrations between agroforestry and non-agroforestry farms in this study. In
view of earlier indications that agroforestry may increase soil C concentrations
(Nair et al., 2009a) the results may suggest that the smallholder plantain produc-
tion systems of the area have high C sequestering capacity irrespective of whether
agroforestry methods are deliberately applied or not. However, it may also be that
high data variability masked potential differences in this small study, or that differ-
ing sampling methodologies make the studies difficult to comparable.
5.1 Limitations of the study and possible improvements
A low level of difference in complexity between the systems studied
The complexity of the non-agroforestry farms was underestimated when selecting
the farms. All the farms had trees on their farm and a lot of intercropping. The
intercropped crops were often perennials, usually coffee. The main characteristic
that distinguished the agroforestry farms were that they had more trees and larger
variation in species (agroforestry 10 species/farm while non-agroforestry had 1-2
species/farm) (Andersson, 2013). Agroforestry farms practiced zero grazing and to
a varying degree also some of the agroforestry methods, e.g. trash lines and com-
post preparation. From interviews made by Andersson (2013), it was clear that all
farmers in the study had started using agroforestry eighteen years ago but that
some had stopped; this added to the fact that the differences in system characteris-
tics were small.
The tree species in the study varied between the farms, there were bark-cloth
fig, avocado- or mango trees but no nitrogen fixing trees. However, the distribu-
tion of tree species by which sampling was done was similar between agroforestry

28
and non-agroforestry in the study. The effect of agroforestry would probably have
been clearer if the agroforestry farms had had nitrogen fixing trees which could
have increased the productivity in a long-term perspective. Other nitrogen fixing
plants, legumes, were grown by some farmers this year (farm 1, 6 and 8 had
beans), but it was possible that the other farms had legumes earlier years.
Therefore, more care should have been taken in the selection of farms, so that
more distinctly different groups were created.
Differences in sampling strategy
Originally the intention was to sample whole cores with the auger. After trying to
do so at the first farm, and failing, the rest of the sampling was performed in steps.
Doing so there was a risk of getting soil from the upper layers into or at the surface
of the core sampled from the bottom layer. This was avoided by making sure that
only 16 centimeters were in the core and by controlling the color of the sample to
make sure that darker soil (with higher content of soil carbon) from the top layer
was not included.
The error potentially induced by differences in bulk density was avoided by us-
ing the equivalent soil mass method. The bulk density was for example expected
to be affected by the difference in soil tillage/management/hoeing, since the soil in
the middle of the field was likely to be more tilled than the soil below the trees. In
the studies presented in Nair et al. (2009a) all researchers used a fixed depth meth-
od. The difference in soil sampling methods may partly explain differences be-
tween this study and earlier studies.
Background noise
Generally there was a high level of background noise since the numbers of paired
farms was fewer than intended, only farm 6 and 11 and 3 and 8, respectively, were
bordering to each other. This was probably of greater importance for the results
since the study was small.
Other confounding factors
There were individual differences between the farms that may be assumed to con-
tribute to the data variability. For example, farm number 12 had the highest soil
carbon concentration value and was seen as economically richer than the rest. The
farmer had a lot of cows (17) but claimed that not much of this manure was spread
at the field of sampling. However, it might still have contributed to the higher soil
carbon concentration (see Figure 11, Appendix). Another individual difference
was the size of the trees; at farm 3 the tree by which sampling was done was con-
siderably smaller compared to the other trees in the study. The bigger and older

29
trees should have higher potential and more time to add to the soil organic matter
than the smaller ones (Nair et al., 2009b).
At some of the farms the location ‘close to a tree’ was in the outer parts of the
field, with less management (e.g. compost inputs) by the farmer compared to
‘middle of field’. This may have led to the background soil carbon concentration
being lower in the outer parts of the field compared to closer to the homestead.
Even though there was an effect from the tree, this might not have been visible in
the result since there were not equal conditions. A gradient of soil carbon and soil
fertility within a farm have been seen in earlier studies, varying with the distance
to the homestead, soil properties and the management of the farmer (Vanlauwe et
al., 2006).
The use of compost and manure was expected to give the agroforestry farms an
advantage compared with non-agroforestry farms. Due to this, the zero-grazing
management applied at the agroforestry farms was thought to contribute to the
agroforestry hypothesis. The easier collection (and use) of manure could have
shown as an increase in soil carbon concentrations in favor for agroforestry. Un-
fortunately the practice at the non-agroforestry farms was to bind the animals to
trees, which occasionally had been the same trees that were in the study. Another
aspect was the overall management of the manure. This was not covered during
storage which probably led to losses of nitrogen and other nutrients, and thus to
decreased fertilizer value and carbon input via crop production, hence decreasing
the potential differences between the systems.
There could also have been higher general levels of plant-available nitrogen in
the plantain fields than expected. Research has shown evidence of nitrogen fixing
bacteria in association with banana roots (Mia et al., 2010, Nyambura Ngamau et
al., 2012, Souza et al., 2013). If there were nitrogen fixing bacteria in association
with the plantain in this study, the effect of the addition of nitrogen through leg-
umes and manure would have been relatively less operative for the biomass pro-
duction and hence the carbon flow to the soil.
Another contributing factor could be the slow changes in soil carbon after
change of land management, but the agroforestry systems had been in place for
eighteen years. With the warm and humid climate in Uganda changes in incorpora-
tion of new organic material in the carbon pool should be measurable.
The hypothesis that agroforestry led to an increase in soil carbon concentrations
compared to non-agroforestry was not supported. However, all these factors of
variability considered made the results unreliable and did not give certainty for the
conclusion that no changes had occurred.
30
5.2 Future work
The choice of the farms involved is of great importance as could be seen in this
study. In order to study changes between agroforestry and non-agroforestry the
farms need to be considerably different in farm management, while very similar
regarding e.g. clay content and location. Considering sampling methods, there is a
need to promote ESM instead of fixed depth methods in order to be able to com-
pare between different management/land use/over longer periods of time. The ESM
method is a suitable routine if another study would want to investigate the changes
in soil carbon over time. Soil-sampling depth should be increased to go beyond the
surface soil, in order to make relevant comparisons and be able to see the effect
agroforestry have on the deeper soil horizons.
It would have been interesting to measure the yield of the crop in the vicinity of
the trees in correlation to the distance from the trees; to see the total effect of the
tree. This would have required a crop which covered the ground more homoge-
nously and which matured at the same time, like maize. Another aspect is the ni-
trogen content, which would have been interesting to measure in order to tell more
about the effect of the manure applied. Information about both carbon and nitrogen
inflows would have made it possible to tell more about the possible mineralization
or assimilation of carbon.
Both the studied systems in this study had minimum tillage and a lot of inter-
cropped perennials; this is something that might become less common in the future
Uganda. If the standard of living increases and labor becomes more expensive
agriculture may become more mechanized. The highly weathered soils, climate
and terrain of Uganda might make it difficult to retain soil fertility and avoid soil
erosion. It is therefore important to better understand the effect and contribution of
agroforestry systems to soil fertility in order to evaluate the most likely effects of
transmission into mechanized monoculture.
31
6 Conclusion Since the farms included in this study were few, it is difficult to draw any general
conclusions. The results suggested no significant difference in soil organic carbon
concentrations between the agroforestry and non-agroforestry farms. However
with all sources of errors and variability considered a conclusion cannot be formed
on these results, especially as they contrast with a number of more comprehensive
published studies. If the study was to be done again, more care would be taken in
selecting larger amount of paired farms. The farms in this study did unfortunately
not have a profound difference in management.
Other uncontrolled differences between farms and random variation probably
masked potential effects of the categories agroforestry respective non-agroforestry.
More comprehensive studies with a larger sample of carefully selected pairs of
farms would be needed for being able to quantify the impact of agroforestry on
SOC.
32
Acknowledgements I would like to thank Sigrun Dahlin, Swedish University of Agricultural Sciences,
SLU, for supervising and providing excellent help with the thesis.
Many thanks to the whole staff at Vi Agroforestry in Masaka, Uganda, for great
support with logistics, office space and contacts, and to the board of Kkingo farm-
ers’ cooperative whom helped us getting in contact with the farmers. I would like
to pay acknowledgment to the farmers in Kkingo district who kindly let us per-
form our research in their field, thank you for your patience. I would also like to
thank Dr John Baptist Tumuhairwe and soil analysis technologist Bonny Balikud-
dembe for the great hospitality and assistance at Makerere University. The two
persons who introduced us to Africa and Vi Agroforestry, Ingrid Öborn and Ylva
Nyberg, SLU, also deserve many thanks. Thank you also Anders Larsolle, SLU,
for kindly creating a graphic overview of all the farms and Claudia von Brömssen,
SLU, for statistical support. The study was founded by a Minor Field Study schol-
arship from Swedish International Development Cooperation Agency (Sida).
33
References ALBRECHT, A. & KANDJI, S. T. 2003. Review: Carbon sequestration in tropical agroforestry
systems.
AMÉZQUITA, M. C., IBRAHIM, M., LLANDERAL, T., BUURMAN, P. & AMÉZQUITA, E.
2004. Carbon Sequestration in Pastures, Silvo-Pastoral Systems and Forests in Four Regions of
the Latin American Tropics. Journal of Sustainable Forestry, 21, 31-49.
ANDERSSON, M. 2013. Cooking banana farming systems in rural Uganda: A comparison of
agroforestry and non-agroforestry farms. Bachelor, Swedish University of Agricultural Sciences.
BAYALA, J., HENG, L. K., VAN NOORDWIJK, M. & OUEDRAOGO, S. J. 2008. Hydraulic
redistribution study in two native tree species of agroforestry parklands of West African dry
savanna. Acta Oecologica, 34, 370-378.
CIA. 2013. The World Factbook [Online]. Central Intelleligence Agency. Available:
https://www.cia.gov/library/publications/the-world-factbook/geos/ug.html [Accessed 23th of May
2013].
ERIKSSON, J., DAHLIN, S., NILSSON, I. & SIMONSSON, M. 2011. Marklära, Lund,
Studentlitteratur AB.
FAO-UNESCO 1974. Soil map of the world. Volume I Legend. Paris: Unesco.
FAO-UNESCO 1977. Soil map of the world. Volume VI Africa. Paris: Unecso.
HAILE, S. G., NAIR, P. K. R. & NAIR, V. D. 2008. Carbon Storage of Different Soil-Size Fractions
in Florida Silvopastoral Systems. Journal of Environmental Quality, 37, 1789-1797.
KATENDE, A. B., BIRNIE, A. & TENGNÄS, B. 2000. Useful trees and shrubs for Uganda -
Identification, Propagation and Management for Agricultural and Pastoral Communities.
Technical handbook 10. Nairobi: Regional Land Management Unit (RELMA/Sida).
KIRBY, K. R. & POTVIN, C. 2007. Variation in carbon storage among tree species: Implications for
the management of a small-scale carbon sink project. Forest Ecology and Management, 246, 208-
221.
LEKASI, J. K., BEKUNDA, M. A., WOOMER, P. L. & TENYWA, J. S. 1999. Decomposition of
Crop Residues in Banana-Based Cropping Systems of Uganda. Biological Agriculture &
Horticulture: An International Journal for Sustainable Production Systems, 17, 1-10.
LWAKUBA, A., KAUDIA, A. A., OKORIO, J., ESEGU, J. F. & OLUKA-AKILENG, I. 2003.
Agroforestry handbook for the montane zone of Uganda. Technical handbook 31. Nairobi:
Regional Land Management Unit (RELMA/Sida).
MAKUMBA, W., AKINNIFESI, F. K., JANSSEN, B. & OENEMA, O. 2007. Long-term impact of
a gliricidia-maize intercropping system on carbon sequestration in southern Malawi. Agriculture,
Ecosystems & Environment, 118, 237-243.
34
MIA, M. A. B., SHAMSUDDIN, Z. H., WAHAB, Z. & MARZIAH, M. 2010. Rhizobacteria as
bioenhancer and biofertilizer for growth and yield of banana (Musa spp. cv. ‘Berangan’). Scientia
Horticulturae, 126, 80-87.
NAIR, P. K. R. 1993. An introduction to agroforestry, The Netherlands, Kluwer Academic
Publishers.
NAIR, P. K. R., KUMAR, B. M. & NAIR, V. D. 2009a. Agroforestry as a strategy for carbon
sequestration. Journal of Plant Nutrition and Soil Science-Zeitschrift Fur Pflanzenernahrung Und
Bodenkunde, 172, 10-23.
NAIR, P. K. R., NAIR, V. D., KUMAR, B. M. & HAILE, S. G. 2009b. Soil carbon sequestration in
tropical agroforestry systems: a feasibility appraisal. Environmental Science & Policy, 12, 1099-
1111.
NAIR, P. K. R., NAIR, V. D., KUMAR, B. M. & SHOWALTER, J. M. 2010. Carbon Sequestration
in Agroforestry Systems. Advances in Agronomy, 108, 237-307.
NELSON, D. W. & SOMMERS, L. E. 1975. A Rapid and Accurate Procedure for Estimation of
Organic Carbon in Soils. Proc. of the Indiana Academy of Science, 84, 456-462.
NYAMBURA NGAMAU, C., NJERI MATIRU, V., TANI, A. & WANGARI MUTHURI, C. 2012.
Isolation and identification of endophytic bacteria of bananas (Musa spp.) in Kenya and their
potential as biofertilizers for sustainable banana production. African Journal of Microbiology
Research, 6.
NYBERG, Y. 2013. Agroforestry - an intergrated farming system in the tropics. PowerPoint
presentation, Department of Crop Production Ecology, SLU, Uppsala.
OELBERMANN, M., VORONEY, R. P., THEVATHASAN, N., GORDON, A., KASS, D. L. &
SCHLÖNVOIGT, A. 2006. Soil carbon dynamics and residue stabilization in a Costa Rican and
southern Canadian alley cropping system. Agroforestry Systems, 68, 27-36.
OKALEBO, J. R., GATHUA, K. W. & WOOMER, P. L. 2002. Laboratory methods of soil and plant
analysis: A Working Manual. Kenya.
OLUKA-AKILENG, I., ESEGU, J. F., KAUDIA, A. A. & LWAKUBA, A. 2000. Agroforestry
handbook for the banana-coffee zone of Uganda - Farmers' practices and experiences. Technical
Handbook 21. Nairobi: Regional Land Management Unit (RELMA/Sida).
PARROTTA, J. A. 1999. Productivity, nutrient cycling and succession in single- and mixed-species
stands of Casuarina equisetifolia, Eucalyptus robusta and Leucaena leucocephala in Puerto Rico.
Forest Ecology and Management, 124, 45-77.
PATERSON, J. & HOYLE, F. 2011. Soil organic carbon: A Western Australian perspective.
Australia: Department of Agriculture and Food.
PEICHL, M., THEVATHASAN, N., GORDON, A., HUSS, J. & ABOHASSAN, R. 2006. Carbon
Sequestration Potentials in Temperate Tree-Based Intercropping Systems, Southern Ontario,
Canada. Agroforestry Systems, 66, 243-257.
RUSOKE, C., NYAKUNI, A., MWEBAZE, S., OKORIO, J., AKENA, F. & KIMARU, G. 2000.
Uganda land resources manual - A guide for extension workers. Technical handbook 20. Nairobi:
Regional Land Management Unit (RELMA/Sida).
SHARROW, S. H. & ISMAIL, S. 2004. Carbon and nitrogen storage in agroforests, tree plantations,
and pastures in western Oregon, USA. Agroforestry Systems, 60, 123-130.
SOUZA, S. A., XAVIER, A. A., COSTA, M. R., CARDOSO, A. M. S., PEREIRA, M. C. T. &
NIETSCHE, S. 2013. Endophytic bacterial diversity in banana 'Prata Anã' (Musa spp.) roots.
Genetics and molecular biology, 36, 252.
SWAMY, S. L. & PURI, S. 2005. Biomass production and C-sequestration of Gmelina arborea in
plantation and agroforestry system in India. Agroforestry Systems, 64, 181-195.
35
TAKIMOTO, A., NAIR, P. K. R. & NAIR, V. D. 2008. Carbon stock and sequestration potential of
traditional and improved agroforestry systems in the West African Sahel. Agriculture, Ecosystems
& Environment, 125, 159-166.
TAMALE, A. K. 2010. Report for the cooperative. Kkingo Farmers' Cooperative Society Ltd
RCS/8620.
WALKEY, A. & BLACK, I. A. 1934. An Examination of the Degtjareff Method for Determining
Soil Organic Matter, and A Proposed Modification of the Chromic Acid Titration Method. Soil
Science, 37, 29-38.
VAN NOORDWIJK, M., HOANG, M. H., NEUFELDT, H., ÖBORN, I. & YATICH, T. 2011. How
trees and people can co-adapt to climate change: reducing vulnerability through multifunctional
agroforestry landscapes., Nairobi, World Agroforestry Centre (ICRAF).
VANLAUWE, B., TITTONELL, P. & MUKALAMA, J. 2006. Within-farm soil fertility gradients
affect response of maize to fertiliser application in western Kenya. Nutrient Cycling in
Agroecosystems, 76, 171-182.
WENDT, J. W. & HAUSER, S. 2013. An equivalent soil mass procedure for monitoring soil organic
carbon in multiple soil layers. European Journal of Soil Science, 64, 58-65.
VI-SKOGEN 2011. Annual report. Stockholm.
VI-SKOGEN 2013. Vi Agroforestry Strategy 2013-2015. Stockholm.
WORLD WEATHER ONLINE. 2013. Masaka Weather, Uganda Weather Averages [Online]. World
Weather Online. Available: http://www.worldweatheronline.com/Masaka-weather-
averages/Masaka/UG.aspx [Accessed 8th of August 2013].
ZOMER, R. J., TRABUCCO, A., COE, R. & PLACE, F. 2009. Trees on Farm: Analysis of Global
Extent and Geographical Patterns of Agroforestry. ICRAF Working Paper no. 89. Nairobi,
Kenya: World Agroforestry Centre (ICRAF).
36
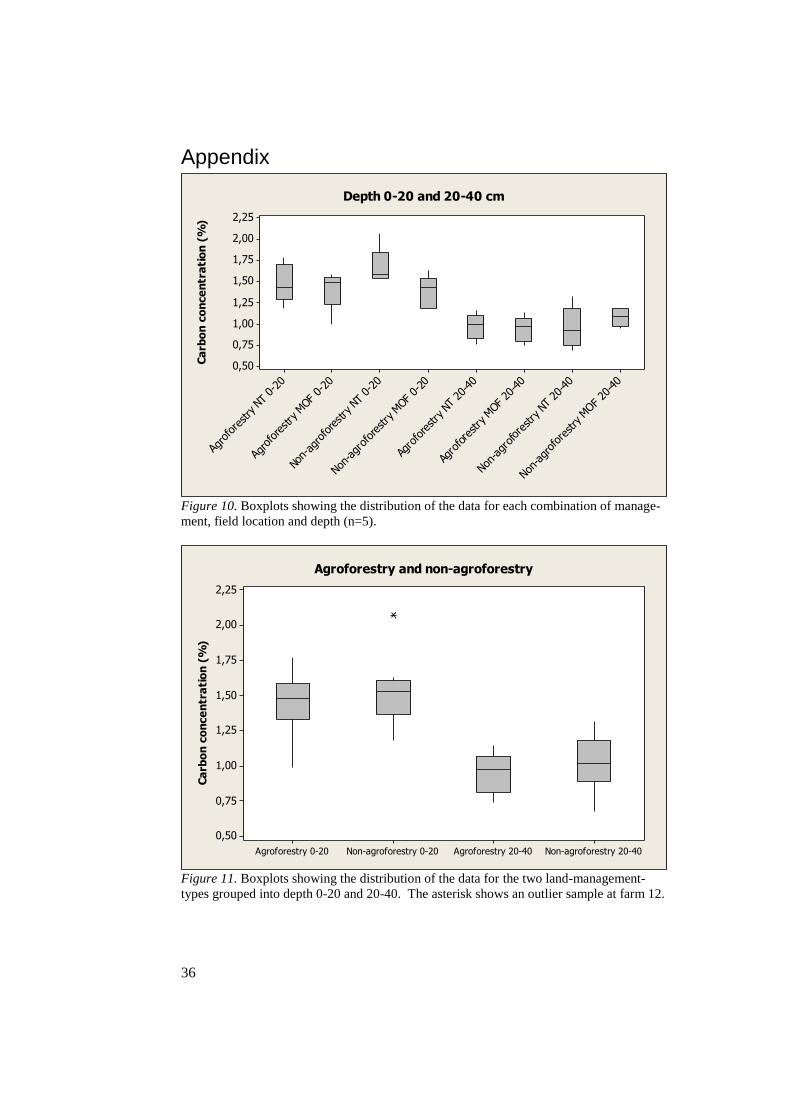
Appendix
Figure 10. Boxplots showing the distribution of the data for each combination of manage-
ment, field location and depth (n=5).
Figure 11. Boxplots showing the distribution of the data for the two land-management-
types grouped into depth 0-20 and 20-40. The asterisk shows an outlier sample at farm 12.
Non-ag
rofore
stry M
OF 20
-40
Non-ag
rofore
stry NT
20-40
Agro
fore
stry M
OF 20-40
Agro
forestry NT
20-40
Non-ag
roforestry M
OF 0-20
Non-
agroforestry N
T 0-
20
Agroforestry M
OF 0-2
0
Agrofore
stry N
T 0-
20
2,25
2,00
1,75
1,50
1,25
1,00
0,75
0,50Ca
rbo
n c
on
ce
ntr
ati
on
(%
)Depth 0-20 and 20-40 cm
Non-agroforestry 20-40Agroforestry 20-40Non-agroforestry 0-20Agroforestry 0-20
2,25
2,00
1,75
1,50
1,25
1,00
0,75
0,50
Ca
rbo
n c
on
ce
ntr
ati
on
(%
)
Agroforestry and non-agroforestry