software quality enhancement through software process ... · the strategy in robust design is to...
TRANSCRIPT
Software Quality Enhancement Through Software ProcessOptimization Using Taguchi Methods
B. KanchanaIndian Institute of Science, Bangalore, India.
Cen tre for AirBorne Systems, Defense Research and Development OrganizationE-mail: [email protected]
andV. V. S. Sarma
Indian Institute of Science, Bangalore, India.E-mail: [email protected]
AbstractThis paper presents a methodology for selection of optimal softu’are design parameters using the experimentaldesign. When an organization is at the point of taking up a new project with an objective of improving the softwarequality, Taguchi method is appliedfor the software design process with an objective that not more than one erroris found per software module. The strategy in robust design is to conduct off-line experiments using orthogonalarrays (OA) and to optimize the design by maximizing performance measures with respect to design parameters.Towards this a cause and effect diagrams for design errors was drawn with opinions from customer, production,quality personnel and engineers. This diagram gave three most likely parameter.s as candidate.for sofhzlare designerror. they are coupling, number of requirements per module and McCabe’s cyclomatic comple,xi(v. It was plannedto consider coupling parameter at two levels as low coupling at level 1 and high coupling at level 2. in case ofnumber of requirements per module parameter three levels were considered they are one requirement per moduleat level I, two requirements per module at level 2 and greater than two requirements per module as the level 3. Incase of McCabe S complexit?, value<5 is set at level I, value 5 to 10 is set at level 2 and value >I0 is set at level 3.The possible number offactorial experiment required be conducted for levels selected for the threee parameters is18. The appropriate orthogonal array based on the guidelines of Taguchi is Lg that is nine experiments need to beconducted to find the optimal software design parameters.Keywords : Quality assurance, software quality, software metrics, software process improvement, design ofexperiments and Taguchi methods.
1. IntroductionRecent literature on quality control in
manufacturing has recognized the method of quality-based design as a more efficient alternative to thetraditional approach of acceptance sampling. Inparticular, interest has been growing in the use of theconcepts of robust design, which are attributed to theJapanese quality engineer, G.Taguchi [I]. Even thoughTaguchi’s methods of data analysis have been under thescrutiny of statisticians [2], they are being applied witha fair degree of success in many industrial experiments[3] [4]. Robust design addresses two major concernsfaced by all product/process designers: i) how toeconomically reduce the variation of aproduct’s/process’ function in the user’s environment,and ii) how to ensure that decisions found to be optimalduring laboratory experimentation will prove to be
so in the anufacturing and the customer environments.The strategy in robust design is to
conduct off-line experiments using orthogonal arrays,and to optimize the design by maximizing performancemeasures, termed signal-to-noise ratios, with respect tothedesign parameters.
In this paper, we attempt to show theapplicability and relevance of Taguchi methods toengineer quality and performance into new softwareproducts and software development process. Whileapplying these methods some characteristics of thesoftware development process and its similarities anddifferences with the traditional manufacturing scenarioare to be noted. Firstly, like in manufacturing softwareis a product; but unlike in manufacturing it involvesdevelopment and not production. We do not reproducethe same object, but each product and each of its
O-7695-0028-5/99 $10.00 0 1999 IEEE188

versions are different from the previous versions,Models for statistical quality control are considerablydifferent and there is lack of usehI models that allowus to reason about the software process, the softwareproduct and the relationship between them [5] [6].
In this preliminary paper, we demonstrate theapplication of Taguchi methods, to optimize thesoftware architecture design parameters in the softwaredevelopment process especially in the design phase ofits life cycle. If the software user is experiencing anunacceptable number of faults, the common solutionwould be to improve the underlying softwaredevelopment process. But if the project manager wantsto incur this extra expense, he might have to justify itquantitatively. Problems of this nature constantly arisein software industry. Before such large investments aremade, one ought to see if the errors can be reducedthrough better design decisions. Software systemdevelopers are skillful in approximately setting ofsoftware design parameter values. Considerableadditional experimentation is necessary, to obtain theinformation needed to do a design optimization.Classical statistical experiments, called full factorialdesigns requires trials under all combinations offactors. Taguchi has shown that if one runsorthogonally designed experiments instead, manyproduct and process designs can be optimizedeconomically and effectively [7].
The paper is organized as follows: In section2, we discuss about robust design. The motivation ofusing this method in the context of an existing real-timesoftware system development is explained in section 3.The software design parameters and their levels aredescribed in section 4. Orthogonal array experiment,preliminary results, experimental verifications from thisstudy are presented in section 5 and conclusion insection 6.
2. Parameter designRobust product design aims at the selection of
proper software design techniques, testing techniques,management techniques and nominal operatingconditions so that the product will be producible atminimum cost. The three steps involved in robustdesign are [7] are:1. Planning the statistical experiments is the first step
and includes identification of the product’s mainfunction(s), constituting failure. This planning stepspells out the quality characteristics Y to beobserved, the control factors { Cl,, 02, Cl,}, theobservable noise factors ( wl, WJ, wj}, and thelevels at which they will be set during the varioustest runs (experiments). It also states whichorthogonal design will be applied to conduct
2.3.
3.
statistical experiments and how the observed data {YI> Y2? YS? Y4, . . . . . . y,,} will be analyzed.Actual conducting of the experiments.Analysis of the experimental observations todetermine the optimum settings for the controlfactors, to predict product performance at thesesettings, and to conduct the validation experimentsfor confirming the optimized design and makingplans for future actions. Taguchi has[4], [7]recommended that one should analyze this, usingspecially transformed form of the performancecharacteristics Y, known as the signal-to-noiseratio{S/N(f3),}, rather than using the observedresponse { y,} directly.
MotivationIn this section, we describe the real-time computer
system used as on-board system of an AirborneSurveillance Platform (ASP). The development of anASP involves integration of a large number of diversesubsystems which typical ly include AirborneSurveillance Sensor 1 which is active, a Navigationsystem, Sensor Data Processors, Bus Controller,Backup Bus Controller, Man Machine Interface (MMI)and display system as shown in Fig. 1.
1sen\or I
Man MachineInterface and
display \y\remDiwer
e hnk
Fig. I. ASP System Configuration
Each subsystem is configured as a RemoteTerminal (RT) on the 1553 B bus. In order to develop adependable ASP, it is necessary to check thedependability of the software resident on eachsubsystem. Sensor 1 detects targets from an elevatedplatform with a certain range. Sensor Data Processorprocesses the raw sensor data to give a cumulativedetail of the target and the data is transmitted to thedisplay system. The Man Machine Interface (MMI) anddisplay system provide the surveillance scenario to theoperator.
The organization in charge of developing ASPis presently designing an enhanced version of the ASPsoftware. The aim is to reduce the number of errorsintroduced in the design phase per module. MM1 and
189
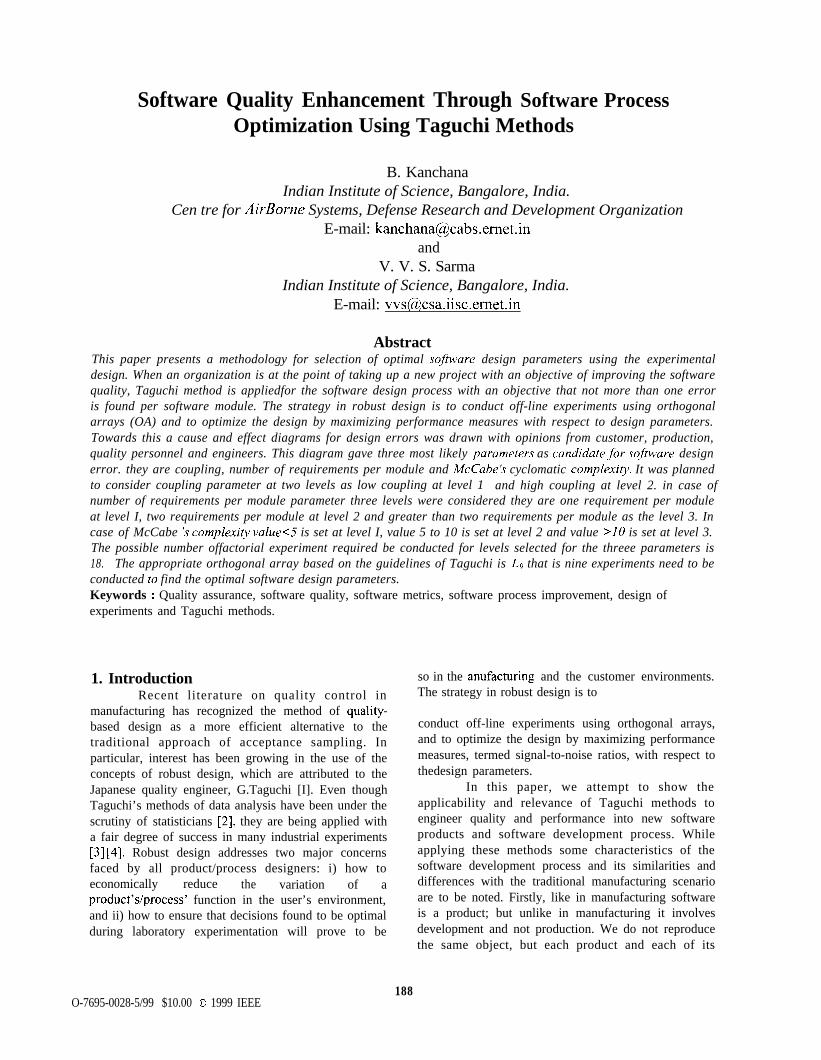
display system software architecture is shown in Fig.2. The total ASP system is controlled by the operatorfrom the MMI. The MM1 consists of user interfacedevice to provide various facilities such as, accessprotocol, equipment control and operation facility. Thedisplay system provides the air surveillance situation ona tactical display with appropriate symbology andcolour codes to indicate the sensor correlation andclassification respectively. An interactive menu displayis provided to aid the operator all through the mission.The surveillance is carried out using a tactical and atote display with a target density of the order of a fewhundreds. Target information monitored is in the orderof thousands of words per scan of a few seconds forperiod of 4 to 6 hours. This briefly gives us an idea ofthe software complexity and the timing requirements ofthe MM1 and display subsystem.
4. Quality enhancement through processoptimization
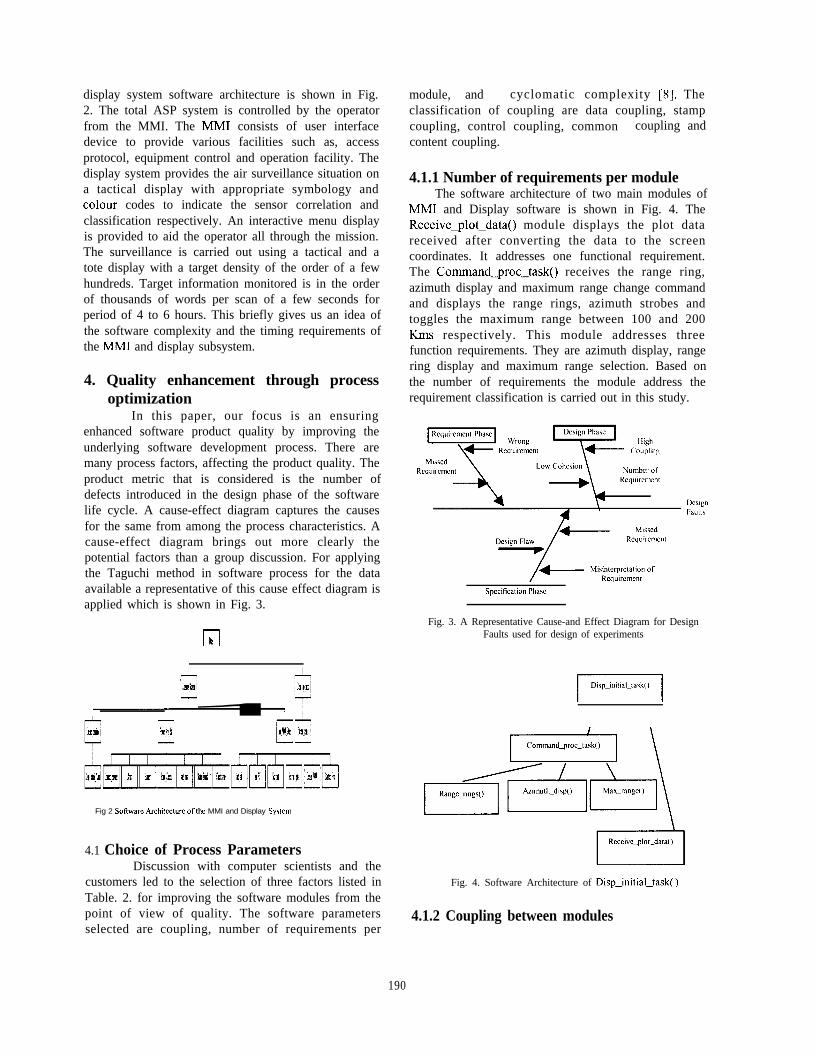
In this paper, our focus is an ensuringenhanced software product quality by improving theunderlying software development process. There aremany process factors, affecting the product quality. Theproduct metric that is considered is the number ofdefects introduced in the design phase of the softwarelife cycle. A cause-effect diagram captures the causesfor the same from among the process characteristics. Acause-effect diagram brings out more clearly thepotential factors than a group discussion. For applyingthe Taguchi method in software process for the dataavailable a representative of this cause effect diagram isapplied which is shown in Fig. 3.
h-l
Fig 2 SoAware Archirecturc ofthe MMI and Display Syucm
4.1 Choice of Process ParametersDiscussion with computer scientists and the
customers led to the selection of three factors listed inTable. 2. for improving the software modules from thepoint of view of quality. The software parametersselected are coupling, number of requirements per
module, and cyclomatic complexity [g]. Theclassification of coupling are data coupling, stampcoupling, control coupling, common coupling andcontent coupling.
4.1.1 Number of requirements per moduleThe software architecture of two main modules of
MM1 and Display software is shown in Fig. 4. TheReceive_plot_data() module displays the plot datareceived after converting the data to the screencoordinates. It addresses one functional requirement.The Commandgroc_task() receives the range ring,azimuth display and maximum range change commandand displays the range rings, azimuth strobes andtoggles the maximum range between 100 and 200Kms respectively. This module addresses threefunction requirements. They are azimuth display, rangering display and maximum range selection. Based onthe number of requirements the module address therequirement classification is carried out in this study.
Spcciticar~~~ Phare
Fig. 3. A Representative Cause-and Effect Diagram for DesignFaults used for design of experiments
Fig. 4. Software Architecture of Disp_initial_task( )
4.1.2 Coupling between modules
190

As long as a simple module parameter list ispresent i.e. simple data are passed, data coupling isexhibited in this portion of the software structure [9]. Avariation of data coupling is called stump coupling isfound when a portion of a data structure is passed via amodule interface. Control coupling is characterized bypassage of control between modules by a flag onwhich decisions are made in a subordinate orsuperordinate module. Common coupling occurs whennumber of modules reference a global data area.Diagnosing problems in structures with considerablecommon coupling is time consuming and difficult.Content coupling occurs when one module makes useof data or control information maintained with theboundary of another module. Secondarily contentcoupling occurs when branch are made into the middleof the module.
4.1.3 Cyclomatic complexityMcCabe’s classic cyclomatic complexity
metric simply evaluates the control graph of the modulegiven the source code as input [8]. Cyclomaticcomplexity is a software metric that provides aquantitative measure of the logical complexity of aprogram.
The three parameters a re number ofrequirements per module, coupling and cyclomaticcomplexity and the various levels used are displayed inTable. 2. This design parameters is broken down intoeither two or three levels as shown in the Table. 2.The first control factor is number of requirements permodule which is set at three levels. At level 1 the valueset is one requirement per module, at level 2 thenumber of requirements is set to 2 and at level 3 thenumber of requirements is set to greater than 2. Thesecond control factor is cyclomatic complexity which isset at three levels. At Level 1 the modules withcyclomatic complexity less than five are considered, atlevel 2 the modules with cyclomatic complexitybetween 5-10 is considered and at level 3 the moduleswhose cyclomatic complexity is greater than 10 isconsidered. In any application it is very difficult toprogram without any coupling hence at level 1 the data,stamp and control coupling are considered andcommon and content coupling is considered at level 2.
Table. 2. Control Factors and their Levels
Label Factor Name Level I Level 2 Level 3A Number of I 2 >2
Requirementsper module I
B 1 Cyclomatic <5 1 5-10 >I0 IComplexity
C Coupling Data, Commo CommoStamp n and n and
andControl
Content Content
5.0 Taguchi Design based on orthogonalarray
Details of Taguchi method and other possibleapplication in software engineering are discard in thePh.D thesis of the first author [lo]. The factorialexperiment to explore all possible factor levelcombinations would require 2*3’ = 18 experimentsbecause the control factor A is at 3 levels, B is at 3levels and C is at 2 levels. It is unnecessary to performml1 factorial experiment; a system’s behavior canusually be adequately characterized by relatively a fewparameters. A number of orthogonal arrays have beentabulated along with associated linear graphs whichcan be used conveniently to construct orthogonaldesigns for any experimental solution [7]. Theappropriate
Table. 3. Experimental design LS array
orthogonal array selected for the parameters in Table. 2is Lg array. This array is shown in Table. 3. Theassignments to the columns are shown in the Table. 3.The table has nine rows, each row showing differentcharacteristics. For instance, row 1 composed of level 1for each of the three control factors. As only two levelsare identified for factor C, in Table. 2 and level 3 istaken to be at level 2.
The experimental procedure followed in eachof the nine experiments is next described. For eachexperiment 3 or 4 modules were tested. The outcome ofthe testing process is the identification of presence oferrors. The errors encountered in each module duringthe testing process is recorded. The errors encounteredfor various experiment is listed in Table. 4 themodules selected were from the real-time metricsoftware and MM1 and Display software written foriRMX environment and DOS environment. Themodules are written in C- language and by theprogrammers who have an experience of 5 to 10 years.
191

In Table. 4 for instance experiment type 1 which referto modules with McCabes complexity less than 5, themodules have data coupling or stamp or controlcoupling only and they address one requirement permodule. Experiment type 1 was conducted on 5modules and only 1 error was found from thesemodules on testing. Experiment type 2 was conductedon 5 different modules and 3 errors were found ontesting of these modules. Experiment type 3 wasconducted on 5 modules and 10 errors were foundwhen they were tested. Experiment type 4 wasconducted on 2 modules and 1 error was found whenthe modules were tested. Experiment type 5 wasconducted on 3 modules and 4 errors was found whenthe modules were tested. Experiment type 6 wasconducted on 2 modules and 4 errors was found whenthe modules were tested. Experiment type 7 wasconducted on 3 modules and 3 error was found whenthe modules were tested. Experiment type 8 wasconducted on 3 modules and 4 errors was found whenthe modules were tested. Experiment type 9 wasconducted on 3 modules and 10 errors was found whenthe modules were tested.
To seek robustness one should measureperformance by software ratios. If the performancecharacteristics y happens to be such that the smaller itis the better, then one express the signal to noise ratioas follows
r iS/N@>= -10 log, cy2 / n ,
1. iwhere 8 is the vectorlof control parameter [4], [7].Where one repeats observation n times at each selectedcombination of design parameter sets in the controlorthogonal array. In design optimization one attemptsalways to maximize the S/N ratio. The best setting ofthe design parameter is at that setting where the S/Nratio is maximum. The optimum parameterconfiguration needed for developing a reliablesoftware module from Table. 4 after the analysis onthe signal to noise ratio we see that the experiment type1 gives maximum S/N ratio. Therefore in order developa quality software it is necessary that the cyclomaticcomplexity should be maintained at level 1, couplingalso be kept level 1 and number of requirement permodule at level 1. Because of the special structure oforthogonal array used here and the manner in whichone assigned the control factors A to C to OA columns,it was not difficult to calculate the effects of each of thecontrol factors, assuming that additivity (separability)of the main effects held and there were no factor-factorinteraction effects. The additive results are given isTable. 5 at the various levels. From Table. 5, we get asimilar result i.e. cyclomatic complexity should be keptless than 5, number of requirement for a module should
be one and the coupling should be low, for anobjective function not more than one error per module.The results obtained confirm the ordinary softwarepractices of cyclomatic complexity should be less than10, number of requirements module be one or two andthe coupling should be less.
5.2 Experimental verificationTo illustrate the effectiveness of the
methodology proposed, we have undertaken thefollowing experiment. As an example, we considered aparticular modules of the MM1 and display systemsoftware i.e. set_mission_time() and Security_check().
Table. 4. Experimental results.
9
Name ofthe Module,
Rc\torc_~ntcnupt( ,Azimuth( )Draw_rect_bordcr(,Drawbordel-()Calculatc_xyJ”*( 1Cm_“pt_“ptl”noDel_com()Ncw,p_coord\( 1Sect”rgroc()EndgrocC ,
Glb3_var()Fan_out()Fan_ln()Tx_sect_menuJl “c()Securlty_clcarancc( ,
Tlme_dtsplayOSys_data_in_ourO
Plot_d@ay()Prev_curr_\can_di\p(,Dafc_nme_inputl)
Elapsed_tux()Modl_nam()
Rccei\c_dataODi\play()Currcnt_mtu\()Peridoc_hlth_uk( )Handle_dbit_PRF()Gct_dblt_PRF_ack()
Err”, \
06 0
2.0 -6 02
05 3.01
I 33 -5 224
2 0 -6 9x
1.0 -2 2
I 66 -3 010
3 33 -II x9
Set_mission_time()In the present version , the characteristics of
this module is as follows: cyclomatic complexity is 18,corresponds to level 3 of this control parameter.Number of requirements are setting time and settingdate corresponds to level 2 of requirements controlparameter (2 requirements per module) and thecoupling used is common coupling corresponds to level2 of coupling control parameter. In version 1, the top
192

level designs obviously done in an ad hoc manner. Inorder to increase the software quality this module issplit into six modules using the optimal designparameters derived and t hey a r e get-input0validate_month(), validate_year(), vaildate_date(),Validate_min_sec() and validate_hr() in version 2. Theversion 2 modules are tested and one error is found asagainst six in version 1. This confirms the orthogonalarray optimized parameter when applied leads to lesserror prone modules.
Table. 5 Control Parameter details.
Security_clearance()In the present version , the characteristics of
this module is as follows: cyclomatic complexity is 12,corresponds to level 3 of this control parameter.Number of requirements is security clearance,corresponds to level 1 (1 functional requirements permodule) and the coupling used is common couplingcorresponds to level 2 of this control parameter. Inversion 1, the top level designs obviously done in an adhoc manner. In order to produce a reliable module thismodule was split into 5 modules in version 2 keepingthe module complexity less than 5 and avoided the useof common and content coupling. In version 2 thismodule was split into CompilepasswdData(),CompileUserData(), Del_invalid_user(),Del_invalidgasswd() and Display_cursor() withappropriate parameters. The version 2Security_clearance() module is tested and no errorswere found as against 2 in version 1. This confirms theorthogonal array optimized parameter when appliedleads to less error prone modules.
5. ConclusionUnderstanding the functional software design
parameter is an essential step in the improvement in thesoftware quality. The Taguchi method of experimentaldesign for the software recommends that optimaldesign parameter are one requirement per module, lowcoupling and cyclomatic complexity should be lessthan 5 in order to reduce the number of errors permodule to one or less. Most notable of all this studydemonstrates that high quality can be obtained at a lowcost, by avoiding the faults to be identified at the laterstages of the development phase, which was the centraltheme of Taguchi quality philosophy. Philosophicallyspeaking , the software programmer can do very littlealone, it is the process that has to be improved and thisrequires action from management. This method could
be applied to any radial dimension of the spiral modelto obtain the optimized parameter and to improve thequality of the final product.
AcknowledgementsThe support and encouragement given by Dr
K. Ramchand, Director, at Centre for AirBomcSystems (CABS), Bangalore is acknowledged withgratitude. Thanks are also due to Dr A Pedar ofNational Aerospace Laboratories, Bangalore for usefulsuggestion on an earlier draft of the paper. The authorsthank the MM1 and the display group of CABS fortheir support in collecting the defect data.
References[I] Song, A. A., Mathur, A. and Pattipati , K. R., ”Design of Process Parametes Using Robust DesignTechniques and Multiple Criteria Optimization”, IEEETrans on Systems, Man and Cybernetics, Vol. 25,No. 11, November 1995.[2] Nair, V. N., “ Taguchi’s Parameter design: A panelDiscussion”, Technometrics, vol. 34, no. 2, pp.127-161, May 1992.[3] Bendell, A., Disney, J., and Pridmore, W. A., Eds,“Taguchi Methods: Applications in world industry,”New York: IFS Publications and Springer-Verlag,1989.[4] Phadke, M. D., “Quality Engineering UsingRobust Design “, Englewood Cliffs, NJ: Prentice-Hall,1989.[5] Boehm, B., ” A Spiral Model for SoftwareDevelopment and Enhancement”, IEEE Computer, vol.21, no. 5, May 1988, pp. 61-72.[6] Kan, S. H., ” Metrics and Models in SoftwareQuality Engineering”, Massachusetts: Addison-Wesley, 1995.[7] Bagchi, T. P., “Taguchi methods Explained:Practical step to Robust Design,” India: Prentice-Hall,1993.[8] McCabe, T., “A Software Complexity Measure,”IEEE Trans. So&are Engineering, Vol. 2, NO . 6,December 1976, pp. 308-320.[9] Pressman, R., S., 1992, “Soffivare Engineering aPractitioner’s Approach”, Mcgraw-Hill, New York.[lo] Kanchana, B., 1998, “Software Quality andDependability Issues for the Airborne SurveillancePlatform: A Systems Engineering Study”, Ph.Ddissertation submitted to the dept. of ComputerScience and Automation, Indian Institute of Science,Bangalore, India.
193