software fault prediction metrics: a systematic literature review
TRANSCRIPT

Accepted Manuscript
Software Fault Prediction Metrics:A Systematic Literature Review
Danijel Radjenović, Marjan Heričko, Richard Torkar, Aleš Živkovič
PII: S0950-5849(13)00042-6DOI: http://dx.doi.org/10.1016/j.infsof.2013.02.009Reference: INFSOF 5329
To appear in: Information and Software Technology
Received Date: 3 September 2012Revised Date: 13 February 2013Accepted Date: 14 February 2013
Please cite this article as: D. Radjenović, M. Heričko, R. Torkar, A. Živkovič, Software Fault Prediction Metrics:ASystematic Literature Review, Information and Software Technology (2013), doi: http://dx.doi.org/10.1016/j.infsof.2013.02.009
This is a PDF file of an unedited manuscript that has been accepted for publication. As a service to our customerswe are providing this early version of the manuscript. The manuscript will undergo copyediting, typesetting, andreview of the resulting proof before it is published in its final form. Please note that during the production processerrors may be discovered which could affect the content, and all legal disclaimers that apply to the journal pertain.

Software Fault Prediction Metrics:A Systematic Literature Review
Danijel Radjenovica,b,∗, Marjan Herickob, Richard Torkarc,d, Ales Zivkovicb
aPro-bit programska oprema d.o.o., Stari trg 15, SI-3210 Slovenske Konjice, SloveniabUniversity of Maribor, Faculty of Electrical Engineering and Computer Science, Smetanova ulica 17, SI-2000 Maribor, Slovenia
cBlekinge Institute of Technology, SE-371 79 Karlskrona, SwedendChalmers University of Technology and University of Gothenburg, SE-412 96 Gothenburg, Sweden
Abstract
Context: Software metrics may be used in fault prediction models to improve software quality by predicting fault location.Objective: This paper aims to identify software metrics and to assess their applicability in software fault prediction. We investi-
gated the influence of context on metrics’ selection and performance.Method: This systematic literature review includes 106 papers published between 1991–2011. The selected papers are classified
according to metrics and context properties.Results: Object-oriented metrics (49%) were used nearly twice as often compared to traditional source code metrics (27%) or
process metrics (24%). Chidamber and Kemerer’s (CK) object-oriented metrics were most frequently used. According to theselected studies there are significant differences between the metrics used in fault prediction performance. Object-oriented andprocess metrics have been reported to be more successful in finding faults compared to traditional size and complexity metrics.Process metrics seem to be better at predicting post-release faults compared to any static code metrics.
Conclusion: More studies should be performed on large industrial software systems to find metrics more relevant for the industryand to answer the question as to which metrics should be used in a given context.
Keywords: Software metric, Software fault prediction, Systematic Literature Review
1. Introduction
Fault prediction models are used to improve software qualityand to assist software inspection by locating possible faults1.Model performance is influenced by a modeling technique[9, 16, 20, 29, 30] and metrics [89, 138, 130, 88, 66]. Theperformance difference between modeling techniques appearsto be moderate [38, 30, 60] and the choice of a modeling tech-nique seems to have lesser impact on classification accuracy ofa model than the choice of a metrics set [60]. To this end, wedecided to investigate the metrics used in software fault predic-tion and to leave the modeling techniques aside.
In software fault prediction many software metrics have beenproposed. The most frequently used ones are those of Abreuand Carapuca (MOOD metrics suite) [1, 51], Bansiya and Davis(QMOOD metrics suite) [3], Bieman and Kang [5], Briandet al. [70], Cartwright and Shepperd [74], Chidamber and Ke-merer (CK metrics suite) [12, 13], Etzkorn et al. [17], Hal-
∗Corresponding author. Tel.: +386 31 461 290Email addresses: [email protected] (Danijel
Radjenovic), [email protected] (Marjan Hericko),[email protected] (Richard Torkar), [email protected](Ales Zivkovic)
1A correct service is delivered when the service implements the systemfunction. A service failure is an event that occurs when the delivered servicedeviates from the correct/expected service. The deviation is called an error. Theadjudged or hypothesized cause of an error is called a fault [2].
stead [24], Henderson-Sellers [25], Hitz and Montazeri [26],Lee et al. [37], Li [41], Li and Henry [39, 40], Lorenz andKidd [42], McCabe [44], Tegarden et al. [49]. Many of themhave been validated only in a small number of studies. Some ofthem have been proposed but never used. Contradictory resultsacross studies have often been reported. Even within a singlestudy, different results have been obtained when different envi-ronments or methods have been used. Nevertheless, finding theappropriate set of metrics for a fault prediction model is stillimportant, because of significant differences in metrics perfor-mance. This, however, can be a difficult task to accomplishwhen there is a large choice of metrics with no clear distinctionregarding their usability.
The aim of this systematic literature review (SLR) is to de-pict current state-of-the-art software metrics in software faultprediction. We have searched in seven digital libraries, per-formed snowball sampling and consulted the authors of primarystudies to identify 106 primary studies evaluating software met-rics. The most commonly used metrics were identified and theirfault prediction capabilities were assessed to answer the ques-tion of which metrics are appropriate for fault prediction. Tenproperties were extracted from the primary studies to assess thecontext of metrics usage. We identified the most important stud-ies according to study quality and industry relevance. We ag-gregated the dispersed and contradictive findings to reach newconclusions and to provide directions for practitioners and fu-
Preprint submitted to Information and Software Technology February 19, 2013

ture research.The remainder of this paper is organized as follows: Sec-
tion 2 presents related work. In Section 3 the systematic reviewmethod that we used, is described. Section 4 contains the resultsand answers the research questions. The study is concluded inSection 5.
2. Related work
Kitchenham [34] has published a preliminary mapping studyon software metrics. The study was broad and included theoret-ical and empirical studies which were classified in the followingcategories: development, evaluation, analysis, framework, toolprograms, use and literature survey. The study was later nar-rowed to 15 studies evaluating metrics against fault proneness,effort and size. Fault proneness was used as a dependent vari-able in 9 out of 15 studies. The most frequently used metricswere object-oriented (OO) metrics and, among these, CK met-rics.
A systematic review of software fault prediction studies wasperformed by Catal and Diri [10]. Later, a literature review onthe same topic was published [11]. They included all papers(focusing on empirical studies) concerning software fault pre-diction. They classified studies with respect to metrics, methodsand data sets. Metrics were classified in six categories: method-level (60%), class-level (24%), file-level (10%), process-level(4%), component-level (1%) and quantitative-level (1%).
Recently, a review that was similar in design to Catal andDiri’s, but more comprehensive in terms of the number of in-cluded studies and analyses, was published by Hall et al. [23].In the review, papers on software fault prediction were included(focusing once again on empirical studies). The main objec-tives were to assess context, independent variables and model-ing techniques. A quantitative model across 19 studies was builtto compare metrics performance in terms of F-measure, preci-sion and recall. According to the quantitative model, modelsusing OO metrics perform better than those using complexitymetrics, while models using LOC perform just as well as thoseusing OO metrics and better than those using complexity met-rics. Models using a combined range of metrics performed thebest, while models using process metrics performed the worst.
Our study differs from the above reviews in both the aimand scope of the selected studies. The objectives of this re-view are to assess primary studies that empirically validate soft-ware metrics in software fault prediction and to assess metricsused in these studies according to several properties. In theCatal and Diri review, no assessment of software metrics wasperformed; only metrics distribution was presented. In Hall’sreview, a quantitative model was presented to assess the rawperformance of metrics, without taking into account the con-text in which the studies were performed. This is most evidentin the results of the process metrics, which are reported to bethe least successful among all metrics. This might be due tothe fact that process metrics are evaluated in post-release soft-ware, where faults are rarer and may be more difficult to detect[46, 136, 115]. Some studies suggest that process metrics are
������������� �������������� ���������������
����������
������������������������������
�������������������������������
��������������������� ������
����� ���!�������������������� �������
�����"��#������$����� ��������� �������
�����%��� �����&�����
�����'�������������������
(�����������
)������������
������� ���������������
��� ���������������
�����*������������������� ������
Figure 1: Systematic review steps.
more successful in detecting post-release faults than any staticcode metrics [88, 115, 73, 85, 60].
Of the nine studies that evaluate metrics against faults inKitchenham’s study, only one study was selected by Catal andDiri. As pointed out by Kitchenham, this reflects the differentscope of the studies. Catal and Diri were focused on the analy-sis methods used to construct fault models, whereas Kitchen-ham’s study was focused on using fault models to validate met-rics [34]. Our review is different in scope compared to Cataland Diri’s, and Hall’s study, since we are interested in studiesthat evaluate metrics and have explicitly excluded studies eval-uating modeling techniques. Our review extends Kitchenham’sstudy by continuing from the nine studies evaluating metricsagainst fault proneness.
Studies evaluating modeling techniques were excluded be-cause they focus on techniques and generally do not containsufficient information on metrics required by this review. Stud-ies evaluating modeling techniques and evaluating or discussingmetrics were included.
3. Research method
In order to summarize the current situation in the field, wehave performed a systematic literature review. We followedKitchenham’s guidelines for performing systematic literaturereviews in software engineering [32, 33] and considered recom-mendations published in [7, 48]. The review design and someof the figures in this section were also inspired by [50].
Following these guidelines, the systematic review was per-formed in three stages: planning, conducting and reporting thereview (Fig. 1). In the first step we identified the need for asystematic review (Step 1, Fig. 1). The objectives for perform-ing the review were discussed in the introduction of this paper.We identified and reviewed existing systematic reviews on the
2
topic in Section 2. None of the previously published reviewswere related to our objectives and research questions (Table 1).
The review protocol was developed to direct the execution ofthe review and reduce the possibility of researcher bias (Step2) [33]. It defined research questions, search strategy (includ-ing search string and digital libraries to search in), the studyselection process with inclusion and exclusion criteria, qualityassessment, data extraction and the data synthesis process. Thereview protocol is described in Sections 3.1–3.5.
The review protocol was developed and evaluated by two re-searchers (Step 3) and iteratively improved during the conduct-ing and reporting stage of the review.
3.1. Research questions
To keep the review focused, research questions were spec-ified. They were framed with the help of the PICOC criteria[33, 45]:
• Population: software, software application, software sys-tem, software project, information system.
• Intervention: software fault prediction models, methods,techniques, software metrics.
• Comparison: n/a
• Outcomes: prediction accuracy of software metrics, suc-cessful fault prediction metrics.
• Context: empirical studies in academia and industry, smalland large data sets.
The main goal of this systematic review is to identify soft-ware metrics used in software fault prediction (RQ1, Table 1).We searched the literature for publications performing an em-pirical validation of software metrics in the context of softwarefault prediction. From the primary studies found, we extractedsoftware metrics to answer RQ1. We analyzed the softwaremetrics to determine which metrics are, and which are not, sig-nificant fault predictors (RQ2, R2.1, RQ2.2, RQ2.3, RQ2.4,RQ2.5, RQ2.6). RQ1 and RQ2 were the main research ques-tions, whereas the remaining questions helped us assess thecontext of the primary studies.
With RQ3 we assessed the data sets used in the primarystudies. We were particularly interested in study repeatability(RQ3.1), validity (RQ3.2) and domain, in which the softwaremetrics can be used (RQ3.3).
The software development life cycle (SDLC), also known asthe software development process, was first introduced by Ben-ington [4] and was later standardized by ISO/IEC and IEEE[27]. Since there are many SDLC interpretations available, weidentified the SDLC phases found in the selected primary stud-ies (RQ4). We then analyzed the influence of the SDLC phaseson the selection of software metrics (RQ4.1) and fault predic-tion accuracy (RQ4.2).
��������������������
������� ����� ����
�������������� ����
������������������ ����������� ����� ������
!"���������#��$��������� ����� ������%
������� ����� ����
&'!�������(���������)� '�������� ��*�*
+��� ,����� ��-).
+� ��� ���-/ +�+ 0�����������������..
������������� �/��
�������(��# �1��
��������������� ����� �� ��������������� ����
����
��������������� ����� �� ��������������
�/-
�����$�������� ����� ���������
���
'������������� ����� �����
��
!#���������� �������������������� �����
�/-�2����2���3��-�
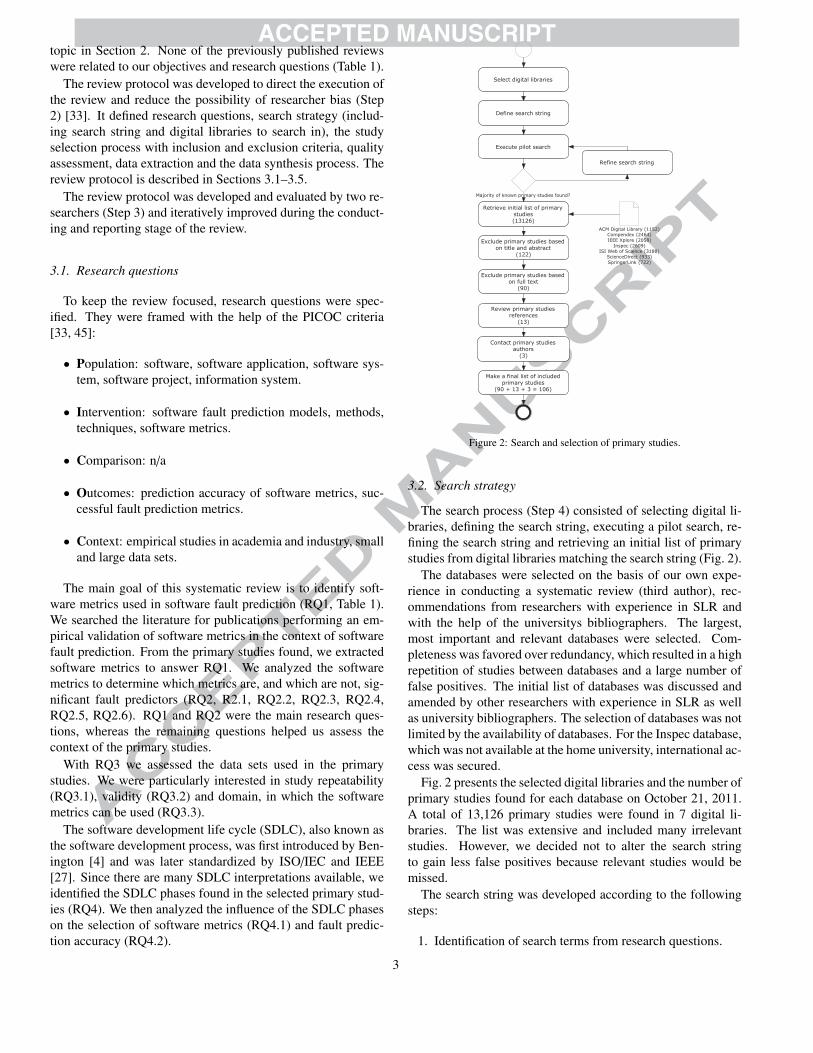
Figure 2: Search and selection of primary studies.
3.2. Search strategy
The search process (Step 4) consisted of selecting digital li-braries, defining the search string, executing a pilot search, re-fining the search string and retrieving an initial list of primarystudies from digital libraries matching the search string (Fig. 2).
The databases were selected on the basis of our own expe-rience in conducting a systematic review (third author), rec-ommendations from researchers with experience in SLR andwith the help of the universitys bibliographers. The largest,most important and relevant databases were selected. Com-pleteness was favored over redundancy, which resulted in a highrepetition of studies between databases and a large number offalse positives. The initial list of databases was discussed andamended by other researchers with experience in SLR as wellas university bibliographers. The selection of databases was notlimited by the availability of databases. For the Inspec database,which was not available at the home university, international ac-cess was secured.
Fig. 2 presents the selected digital libraries and the number ofprimary studies found for each database on October 21, 2011.A total of 13,126 primary studies were found in 7 digital li-braries. The list was extensive and included many irrelevantstudies. However, we decided not to alter the search stringto gain less false positives because relevant studies would bemissed.
The search string was developed according to the followingsteps:
1. Identification of search terms from research questions.
3

Table 1: Research questions.ID Research question MotivationRQ1 Which software metrics for fault prediction exist in literature? Identify software metrics commonly used in software fault prediction.RQ2 What kind of empirical validation was performed on the metrics found
in RQ1?Assess the fault prediction performance of software metrics.
RQ2.1 Are size metrics useful for fault prediction? Assess the appropriateness of size metrics as fault predictors.RQ2.2 Are complexity metrics useful for fault prediction? Do they have addi-
tional benefits after being adjusted for size?Assess the appropriateness of complexity metrics as fault predictors anddetermine whether they correlate with size metrics.
RQ2.3 Are OO metrics useful for fault prediction? Do they have additionalbenefits after being adjusted for size?
Assess the appropriateness of OO metrics as fault predictors and deter-mine whether they correlate with size metrics.
RQ2.4 Are process metrics superior to traditional and OO metrics? Is the an-swer dependent upon the life cycle context?
Assess the appropriateness of process metrics as fault predictors.
RQ2.5 Are there metrics reported to be significantly superior in software faultprediction; and if so, which ones?
Identify metrics reported to be appropriate for software fault prediction.
RQ2.6 Are there metrics reported to be inferior in software fault prediction;and if so, which ones?
Identify metrics reported to be inappropriate for software fault predic-tion.
RQ3 What data sets are used for evaluating metrics? Assess the data sets used in the studies and assess the studies’ validity.RQ3.1 Are the data sets publicly available? Determine whether the studies can be repeated and results can be
trusted.RQ3.2 What are the size of the data sets? Investigate the studies’ external validity.RQ3.3 What software programming languages are used to implement software
from which the data sets are extracted?Investigate the software metrics domain.
RQ4 What are the software development life cycle (SDLC) phases in whichthe data sets are gathered?
Identify the SDLC phases in which data sets are gathered.
RQ4.1 Does the SDLC phase influence the selection of software metrics? Determine whether different metrics are used in different SDLC phases.RQ4.2 Does software fault prediction accuracy differ across various SDLC
phases?Investigate the effect of an SDLC phase on software fault predictionaccuracy.
RQ5 What is the context in which the metrics were evaluated? Assess the context of the studies according to the properties ‘Re-searcher’, ‘Organization’, ‘Modeling technique’, ‘Dependent variable’and ‘Dependent variable granularity’.
2. Identification of search terms in relevant papers’ titles, ab-stracts and keywords.
3. Identification of synonyms and alternative spellings ofsearch terms.
4. Construction of sophisticated search string using identifiedsearch terms, Boolean ANDs and ORs.
The following general search string was eventually used:software AND (metric* OR measurement*) AND (fault* OR de-
fect* OR quality OR error-prone) AND (predict* OR prone* ORprobability OR assess* OR detect* OR estimat* OR classificat*)
A pilot search was performed. We had a list of nine knownrelevant studies. When searching digital libraries, eight out ofthe nine studies were found. One study [67] was not found be-cause the word metric was not used in the title or abstract. Wetried to adjust the search string, but decided to keep the originalone, since the amendment of the search string would dramati-cally increase the already extensive list of irrelevant studies.
The search string was subsequently adapted to suit the spe-cific requirements of each database. We searched databases bytitle and abstract. The search was not limited by the year ofpublication. Journal papers and conference proceedings wereincluded. The search was limited to English.
3.3. Study selection
During the systematic review, we included empirical studiesvalidating and assessing software metrics in the area of soft-ware fault prediction. For the selection of primary studies, thefollowing inclusion and exclusion criteria were used.
Inclusion criteria:
• Empirical studies (academic and industry) using large andsmall scale data sets AND
• Studies comparing software metrics performance in thearea of software fault prediction.
Exclusion criteria:
• Studies without an empirical validation or including ex-perimental results of software metrics in fault predictionOR
• Studies discussing software metrics in a context other thansoftware fault prediction (e.g. maintainability) OR
• Studies discussing modeling techniques (e.g. Naive Bayes,Random Forest) and not software metrics.
Studies discussing and comparing prediction techniqueswere excluded from the review, since the goal of this reviewwas to assess software metrics and not prediction techniques.Studies evaluating prediction techniques generally do not dis-cuss metrics. They sometimes provide a list of metrics used,but do not evaluate metrics or discuss their role in fault predic-tion. Studies evaluating prediction techniques and evaluating ordiscussing metrics were included.
Studies proposing new software metrics and not empiricallyvalidating them were also excluded, since we investigated theusefulness of software metrics in predicting software faults; thatusefulness is, to one extent, measured by the level of empiri-cism.
Before performing a study selection, the inclusion and exclu-sion criteria were tested by two researchers on a random sample
4

Table 2: Researchers’ agreement on the exclusion of the primary studies basedon title and abstract.
Researcher 1Included Excluded Totals
Researcher 2 Included 72 17 89Excluded 33 13,004 13,037
Totals 105 13,021 13,126
of a hundred studies. Although the first results looked promis-ing, there were disagreements among the researchers. A com-mon interpretation was established through dialogue and the in-clusion and exclusion criteria were refined.
The study selection process (Step 5) was performed in twosteps: the exclusion of primary studies based on the title andabstract and the exclusion of primary studies based on the fulltext (Fig. 2).
The exclusion of primary studies based on the title and ab-stract was carried out independently by two researchers. Eachdeveloped his own list of selected studies. Table 2 shows theagreement between the two researchers for the first stage. Thefirst researcher included 105, and the second one 89 studies.They agreed in 72 cases to include a study and in 13,004 casesto exclude a study. They did not agree in 50 cases. The fi-nal list of selected studies for the first stage was obtained byadding both researchers’ selected studies. It included 122 pri-mary studies.
We used inter-rater agreement analysis to determine the de-gree of agreement between the two researchers. Cohen’s Kappacoefficient [14] was calculated. According to the different lev-els, as stipulated by Landis and Koch [36], the agreement be-tween the two researchers for the exclusion of primary studiesbased on title and abstract was ‘substantial’ (0.74).
Full texts were obtained and analyzed for 122 primary stud-ies. In addition to the inclusion and exclusion criteria, the qual-ity of the studies, their relevance to the research questions andstudy similarity were considered. Similar studies published bythe same authors in various journals were removed. 90 primarystudies remained after the exclusion of studies based on the fulltext.
Grey literature was covered by snowball sampling and con-tacting the authors of primary studies (Fig. 2). The snowballsampling method [21] was used to review the references of the90 primary studies selected from the databases. It was also usedto review the references of the related studies which were notincluded in the review as primary studies [34, 10, 11, 23]. Ad-ditional 13 relevant studies were found and added to the list ofprimary studies.
We tried to contact all the authors of the primary studies bye-mail to obtain their opinion on whether we missed any stud-ies. Of the 71 e-mails sent, 23 e-mails failed to be delivered, 7authors replied and 3 new studies were brought to our attention.
Hence, the final list of 106 primary studies was compiled byadding up the primary studies found by searching the databases(90), studies found through snowball sampling (13) and studiesfound by contacting the authors of primary studies (3).
3.4. Data extraction
For each of the 106 selected primary studies, the data extrac-tion form was completed (Step 6). The data extraction formwas designed to collect data from the primary studies needed toanswer the research questions. It included the following proper-ties: ‘Title’, ‘Authors’, ‘Corresponding email address’, ‘Year ofpublication’, ‘Source of publication’, ‘Publication type’, ‘Re-sults’, ‘Note’ and ten properties listed in Table 3 and further dis-cussed in Sections 3.4.1–3.4.10. The properties were identifiedthrough the research questions and analysis we wished to intro-duce. Ten properties were used to answer the research questions(Table 3), while others were used to describe the study (proper-ties ‘Title’ and ‘Authors’); send an email to corresponding au-thors during the search process (property ‘Corresponding emailaddress’); analyze the distribution of the studies over the years(property ‘Year of publication’); analyze the number of stud-ies per source (property ‘Source of publication’); analyze thenumber of conference proceedings and journal articles (prop-erty ‘Publication type’); and analyze the metrics’ effectiveness(properties ‘Results’ and ‘Note’).
Establishing a valid set of values for all the properties is im-portant in order to summarize the results [33]. A valid set ofvalues was established for the properties ‘Data set availabil-ity’, ‘Software development life cycle’, ‘Researcher’, ‘Organi-zation’, ‘Modeling technique’, ‘Dependent variable’ and ‘De-pendent variable granularity’. The values were chosen on thebasis of preliminary research prior to this SLR. For the prop-erties ‘Metrics’, ‘Data set size’ and ‘Programming language’ itwas difficult to predict the valid set of values. Therefore, wedecided for trivial data extraction, where we extracted data aspresented in the studies [48]. After data extraction, a valid set ofvalues based on the gathered data was established for the prop-erties ‘Metrics’, ‘Data set size’ and ‘Programming language’ toenable data synthesis (Step 8).
The data extraction form was piloted on a sample of ten ran-domly selected primary studies to evaluate sets of values [33].Because not all studies could fit into predefined values, two newvalues were introduced. For the property ‘Data set availability’,the value ‘Partially public’ was added to account for studies us-ing open source projects, where source code and fault data waspublicly available, but not the metrics’ values. For the property‘Dependent variable granularity’ the value ‘Other’ was added tosupport studies with rarely used granularities (e.g. build). Af-ter the adjustment, sets of values were suitable for all the 106selected primary studies and were not altered afterwards.
3.4.1. Metrics (P1)Our initial goal was to extract all the metrics used in the pri-
mary studies. Since there were almost as many metrics usedas studies available, we were not able to draw any conclusionsfrom this. Therefore, we decided to categorize the studies ac-cording to the metrics used in the following manner:
• Traditional: size (e.g. LOC) and complexity metrics (e.g.McCabe [44] and Halstead [24]).
5

Table 3: Data extraction properties mapped to research questions and inter-rateragreement.
ID Property RQ AgreementP1 Metrics RQ1, RQ2,
RQ2.1, RQ2.2,RQ2.3, RQ2.4,RQ2.5, RQ2.6
0.82
P2 Data set availability RQ3, RQ3.1 0.71P3 Data set size RQ3, RQ3.2 0.84P4 Programming language RQ3, RQ3.3 1.00P5 Software development
life cycleRQ4, RQ4.1,RQ4.2
0.80
P6 Researcher RQ5 0.95P7 Organization RQ5 0.62P8 Modeling technique RQ5 1.00P9 Dependent variable RQ5 0.83P10 Dependent variable
granularityRQ5 1.00
• Object-oriented: coupling, cohesion and inheritancesource code metrics used at a class-level (e.g. Chidamberand Kemerer [13]).
• Process: process, code delta, code churn, history and de-veloper metrics. Metrics are usually extracted from thecombination of source code and repository. Usually theyrequire more than one version of a software item.
3.4.2. Data set availability (P2)The property ‘data set availability’ was used to assess
whether the data sets used were publicly available, which wouldallow studies to be more easily repeated. If private data setswere used, the study could not be repeated by other researchersin an easy manner, and the results would always be question-able. In our case, we categorized the studies according to dataset availability in the following manner:
• Private: neither data set, fault data or source code is avail-able. The study may not be repeatable. (If the study didnot state the data set availability it was categorized as pri-vate in order to make a conservative assessment.)
• Partially public: usually the source code of the projectand fault data is available, but not the metrics’ values,which need to be extracted from the source code andmatched with the fault data from the repository (e.g. opensource projects like Eclipse and Mozilla). Extracting met-rics values and linking them with fault data is not a trivialprocess. It can lead to different interpretations and errors.Hence, we deem the study as repeatable to some degreeonly.
• Public: the metrics values and the fault data is publiclyavailable for all the modules (e.g. the Promise Data Repos-itory [6]). The study is deemed to be repeatable.
3.4.3. Data set size (P3)We examined the data set size to determine the external va-
lidity of the studies, with the idea being that the larger the datasize, the higher the external validity. We are well aware that
this is only one aspect of external validity; however, we believeit to be an important aspect. For studies with a small data setsize there is a greater possibility that the results have been influ-enced by the data set and a generalization of the findings maybe limited. Therefore, greater validity was given to studies withlarger data set sizes.
Data set size was, of course, described differently in the 106primary studies; mostly by lines of code (LOC), number ofclasses, files and binaries. We extracted data as specified bythe studies and defined data set size categories after the data ex-traction process. We defined three groups (small, medium andlarge) and two criterions (LOC and number of classes or files).Categories were defined based on our own experience and theextracted data. If the study specified both LOC and number ofclasses, the criterion to place the study in a higher group waschosen, e.g. if the study used software with 200 KLOC and1,100 classes it would be classified as medium according to theKLOC, and as large according to the number of classes. Be-cause we applied a liberal assessment in this case, the studyshould be classified as large. If the study used more than onedata set, the sum (size) of the data sets were considered. Whenthe data set size was not stated, the study was categorized assmall per default. The studies were categorized according tothe data set size as follows:
• Small: less than 50 KLOC (thousands of LOC) OR 200classes
• Medium: between 50 KLOC OR 200 classes AND 250KLOC OR 1000 classes
• Large: more than 250 KLOC OR 1000 classes.
3.4.4. Programming language (P4)We extracted data regarding the programming languages
used to implement software from which metrics values were ob-tained. We assessed which programming languages were mostoften used in software fault prediction and if the choice of theprogramming language was associated with a choice of soft-ware metrics. Programming languages were extracted as statedand were not categorized, except for rarely used programminglanguages which were grouped as ‘Other’. The ‘Not stated’group was introduced for primary studies where the type of pro-gramming language was not described.
3.4.5. Software development life cycle (P5)According to Shatnawi and Li [136], the post-release evolu-
tion process of a system is different from the pre-release de-velopment process, because the system has been through somerigorous quality assurance checks. Post-release systems tendto have fewer faults than pre-release systems. Faults are alsoharder to locate and fix in post-release systems.
We decided to use the ‘software development life cycle(SDLC)’ property to determine whether the SDLC phase in-fluences the selection of software metrics (RQ4.1). We alsoinvestigated the effect of the SDLC phase on software fault pre-diction accuracy (RQ4.2). The studies were categorized accord-ing to SDLC into: pre-release and post-release. Pre-release
6

SDLC included all studies using software in the design, imple-mentation or testing phase. The studies performing validationon software used in production, or those having more than oneversion of software, were classified as post-release. If SDLCwas not stated, the study was categorized as pre-release.
3.4.6. Researcher (P6)To rank studies we believed to be especially relevant to the
industry we used the properties ‘Researcher’ (P6) and ‘Organi-zation’ (P7). With these two properties we want to point outresearch performed by researchers coming from the industry aswell as research performed in an industrial setting. We believethat the ultimate goal of every study validating metrics is to findmetrics, which can later be used in the industry. Therefore, it isessential that metrics are validated also in the industry.
The ‘Researcher’ property was used to analyze the share ofresearch performed by researchers coming from the industry.Studies were categorized according to the authors’ affiliationwith either academia or industry. When authors of the samepaper came from academia and from the industry, the first au-thor was considered.
3.4.7. Organization (P7)The property ‘Organization’ was introduced because many
studies were performed by researchers coming from academiaworking in an industry setting. As with the property ‘Re-searcher’, the focus here was on studies performing validationon the data sets from the industry. With this property we cat-egorized studies with regard to the origin of the data set into:academia and industry. When the domain was not stated, thestudy was categorized as academic, in order to conduct a moreconservative assessment.
3.4.8. Modeling technique (P8)The property ‘Modeling technique’ was used to examine the
influence of the modeling technique on the selection of met-rics. The studies were categorized into: statistical and ma-chine learning. The ‘statistical’ category included all the statis-tical models like logistic and linear, univariate and multivariateregression, whereas the ‘machine learning’ category includedmachine learning and genetic algorithms. (The modeling tech-niques are covered in more detail in [23, 10, 11].)
3.4.9. Dependent variable (P9)To extract data about dependent variables we introduced the
properties ‘Dependent variable’ (P9) and ‘Dependent variablegranularity’ (P10).
The studies were categorized, based on the dependent vari-able, into: detecting, ranking and severity. The ‘detecting’category included studies classifying modules as fault-proneor not. The ‘ranking’ category included studies ranking mod-ules according to the number of faults they exhibited while the‘severity’ category included studies classifying modules intodifferent fault severity levels.
3.4.10. Dependent variable granularity (P10)We used the property ‘Dependent variable granularity’ to de-
termine the level at which predictions were made. Predictionscarried out on a lower level of granularity were deemed to bemore useful than ones carried out on larger modules, since it en-abled more accurate predictions of fault location. Studies wereclassified according to the ‘Dependent variable granularity’ intothe following categories: Method, Class, File, Package andOther.
3.5. Study quality assessment
In addition to the inclusion/exclusion criteria, the quality ofeach primary study was assessed by the quality checklist forquantitative studies. The quality checklist questions were de-veloped by suggestions summarized in [33]. Each question inthe quality checklist was answered with ‘Yes’, ‘Partially’ or‘No’, and marked by 1, 0.5 and 0 respectively. The final scoreof the study ranged from 0 to 20, where 0 is the lowest score,representing lower quality, and 20 is the highest score, repre-senting high quality studies, according to our definitions. Acutoff value for excluding a study from the review was set at10 points. Since the lowest score for the study was 11, all thestudies were included on the basis of the quality checklist.
All 20 questions, with a summary of how many studies weremarked with ‘Yes’, ‘Partially’ and ‘No’ for each question, arepresented in Table B.6 (see appendix). Most of the studies weresuccessful at answering questions regarding metrics Q4, Q5 andQ6, with the exception being question Q5, where 9% of thestudies did not fully define the metrics they used. The metricswere considered as defined if it was possible to establish thedefinition or origin of the metrics. Sometimes only the numberof metrics or a group of metrics was given, without specifyingor referencing the metrics. Most of the studies poorly defin-ing the metrics were, for some reason, published in conferenceproceedings.
Questions regarding the data sets Q2, Q7, Q8 and Q20 wererated lower. The data set size (Q2) was considered not justi-fied if it was not stated or it was too small. 25% of the studiesfailed to meet this request. Many studies failed to report thedata set size. In [150, 100] the authors mention a very largetelecommunication system, but its size was never specified. In[152, 80, 140, 148] a small data set with less than 100 classeswas used, making the studies’ validity questionable, since theconclusions were based on a small sample.
Only 53% of data sets were adequately described (Q8) whenlisting information about data set size, availability, program-ming language used and context. This information is importantwhen comparing studies and when deciding on using a specificset of metrics in a system, since not every metric is suitable forevery system. The question with the lowest rate was data setavailability and repeatability of the studies (Q20). Only 21% ofall these studies used publicly available data sets, whereas 58%of the studies used a private data set. The importance of dataset availability in discussed in more detail in Section 4.4.1.
There was a noticeable difference in rates between journalpapers and papers published in conference proceedings. Con-
7

ference proceedings scored slightly worse, because they failedto report all the details, which could be due to space limitations.
For the interested reader we suggest taking into considerationfour studies in particular, [113, 137, 76, 153], which scored themaximum of 20 points.
Readers from the industry, searching for metrics to imple-ment in their systems, may be especially interested in 14 stud-ies [117, 120, 121, 119, 118, 124, 130, 131, 128, 129, 147,146, 149, 92] performed by researchers in the industry and inan industrial setting. They were performed on large data sets,but unfortunately private ones. The exception are two studies,[128, 129], which were performed using partially available datasets, and [149], which used a small data set.
3.6. Validity threats
3.6.1. Publication biasPublication bias is the tendency to publish positive results
over negative results, where studies presenting positive resultsare more likely to be published than studies with negative re-sults [33]. Although one of our objectives was to find success-ful software fault prediction metrics, we did not limit our studyprior to the search and selection process. On the contrary, wesearched for all studies performing an empirical evaluation ofsoftware metrics in software fault prediction, which was ouronly criterion. In addition, we tried to address this issue bysearching conference proceedings and Grey Literature, contact-ing the authors of the selected studies and by using snowballsampling.
The authors of the primary studies could be biased when se-lecting metrics. This might be the reason for a higher numberof studies validating OO metrics rather than traditional size andcomplexity metrics. The selected studies are from time periodwhen many organizations were adopting or already using OOsystems. The broad acceptance of the OO development para-digm could have influenced the authors to use OO metrics ingreater extent.
3.6.2. Searching for primary studiesThe search strategy was designed to find as many studies as
possible. We constructed a very wide search string, which re-sulted in 13,126 studies found in seven databases. Although theresult list was extensive and included a lot of false positives, wedecided to keep the original search string in order not to missany potentially relevant studies.
Our additional search strategy, snowball sampling, resultedin an additional thirteen relevant studies and, finally, three stud-ies were discovered by contacting the authors themselves. Outof the total of 16 studies, we were somewhat relieved to dis-cover that seven studies could not be found in any of the sevendatabases. The remaining nine studies could be found in thedatabases but were not captured by our already extensive searchstring.
We concluded that searching for primary studies in databasesis neither efficient nor effective, which is primarily due to incon-sistent terminology [19]. (Similar observations have been madein [33, 48, 7].)
In addition to searching databases, we used alternative searchstrategies to minimize the possibility of missing potentially rel-evant studies. However we cannot exclude the possibility thatwe overlooked a relevant study.
3.6.3. Study selectionThe search and exclusion of studies based on the title and ab-
stract (13,126 studies in total), was carried out independently bytwo researchers. First, a pilot selection process was performedon 100 randomly selected studies to establish a common groundof understanding regarding the inclusion/exclusion criteria andto find and resolve any potential disagreements. After the pilotsearch, the inclusion/exclusion criteria were refined.
Each researcher developed his own list of selected studies.An inter-rater agreement analysis was then used to determinethe degree of agreement between the two researchers (Table 2),which was substantial, according to Landis and Koch [36].
A final exclusion, based on full text, was carried out by asingle researcher. There is therefore a possibility that the ex-clusion was biased and that a study may have been incorrectlyexcluded.
3.6.4. Data extraction and quality assessmentDue to time constrains and the large number of studies to
review, data extraction and quality assessment were performedby one researcher and checked by a second researcher, as sug-gested in [7, 48]. In our case, the second researcher performeddata extraction and quality assessment on ten randomly selectedstudies.
As in the study selection process we used an inter-rateragreement analysis to calculate the Cohen’s Kappa coefficient.Agreement between the two researchers for each property ispresented in Table 3. The researchers were in agreement on ex-tracting the programming language (P4), modeling technique(P8) and dependent variable granularity (P10). There weresome misunderstandings about extracting data with multiplechoices and incomplete data, which were later discussed andagreed upon. Eight out of the ten properties had a Cohen’sKappa coefficient of 0.80 or higher, which is substantial, ac-cording to Landis and Koch [36].
The most bias was expected in the quality assessment, sincequestions may be hard to answer objectively. None of the tenstudies assessed by two researchers got the same final score.However, the most significant difference in the score for an indi-vidual study between the two researchers was two. The qualitychecklist may not be the most precise form of quality assess-ment, but we believe it is solid enough to distinguish betweenbetter and weaker studies.
4. Results
In this section the selected primary studies are described andthe results are provided. A short overview of the studies’ dis-tribution over the years, and per source, is presented in Sec-tion 4.1. In Sections 4.2–4.6 research questions are answered.
8

������ �� � � �
� � � � � � � � � � � � � � � � � � � � � � � � � � � � � � � � � � � � � � � � � � � � � � � � � � � � � � � � � � � � � � � � � � � � � � � � � � �� � � � � � ! "
Figure 3: The distribution of studies over the years.
4.1. Primary studiesIn this review, we have included 106 primary studies that
evaluate the performance of software metrics fault prediction.In Section 4.1.1 the distribution over the years is presented todemonstrate how the interest in metrics validation has changedover time. The most dominant publication sources are pre-sented in Section 4.1.2.
4.1.1. Publication yearOne of the oldest and well-known metrics presented by Mc-
Cabe [44] dates back to 1976. In 1991, Chidamber and Kemerer[12] presented the CK metrics suite and refined it in 1994 [13].Although we found a few studies from the 1980s, none wereincluded in the review. In Fig. 3 it can be seen that after theCK metrics suite was introduced, many studies validating soft-ware metrics were published. From 1996 until 2005, an aver-age of four studies per year were published. In 2005, when thePROMISE repository [6] was released, the number of studiesper year started to increase, reaching 14, 15 and 13 studies peryear in the years 2008, 2009 and 2010, respectively. Data isnot consistent for the year 2011, since the year was not yet fin-ished when we started searching for studies in October 2011; ittakes up to half a year for studies to appear in databases. Nev-ertheless, five studies from 2011 were included. Since 2005, 71(67%) studies were published, indicating that we have includedmore contemporary and relevant studies. It also shows that thesoftware metrics research area is still very much relevant to thisday.
4.1.2. Publication sourceThe number of selected studies per source is shown in Ta-
ble 4. Only sources having three or more publications are listed.The most dominant journal, with 19 publications, is IEEETransactions on Software Engineering, followed by the Interna-tional Conference on Software Engineering and the PROMISEconference. The first three sources contain 38% and the firstten sources contain 66% of all the selected studies. This makessearching for studies about software metrics easier, since thereare journals and conferences where studies such as these arepublished in most cases.
There were slightly more studies presented at conferences(59) than in journals (47).
Table 4: Number of studies per source and the cumulative percent of studies fortop sources.
Source # Σ %IEEE Transactions on Software Engineering 19 18International Conference on Software Engineering 13 30International Conference on Predictive Models in Soft-ware Engineering
8 38
Empirical Software Engineering 5 42Information and Software Technology 5 47International Software Metrics Symposium 5 52Journal Of Systems and Software 5 57International Symposium on Software Reliability Engi-neering
4 60
European Conference on Software Maintenance andReengineering
3 63
Software Quality Journal 3 66
4.2. RQ1: What software metrics for fault prediction exist inliterature?
In 61 (49%) studies, the object-oriented metrics were used,followed by traditional metrics, which were used in 34 (27%)studies. Object-oriented metrics were used twice as often whencompared with traditional metrics. There were many studiescomparing fault prediction performance of OO and traditionalmetrics. They used and validated OO metrics but had tradi-tional metrics (e.g. LOC) just for comparison. As we have seenfrom the distribution of studies over the years, all of the studiesexcept one were published after the CK metrics suite was intro-duced, which has had a significant impact on metrics selectionever since.
Process metrics were used in 30 (24%) studies. It is interest-ing to note that there is no significant difference in the numberof studies using process or traditional metrics.
After 2005, the use of process metrics (30%) has slightly in-creased and the use of OO metrics (43%) has slightly decreased.The number of studies using traditional metrics (27%) has re-mained the same.
The most frequently used metrics are the Chidamber and Ke-merer [13, 12] (CK). According to our primary studies, the CKmetrics were validated for the first time in 1996 [62] and mostrecently in 2011 [75, 82, 76, 105]. They were also the firstvalidated metrics in our selected studies with the exception of[102]. Their popularity is evenly distributed over the years andthere is no sign that this will change in the future. Out of 106selected studies, CK metrics were used in half of them. Themost commonly used metrics from the CK metrics suite in-clude: NOC (53), DIT (52), RFC (51), LCOM (50), CBO (48)and WMC (44). (The number in parenthesis indicates the num-ber of times the metrics were used used.)
The WMC metric (‘Weighted Methods per Class’) is definedas the sum of methods complexity [12, 13]. But, method com-plexity was deliberately not defined in the original proposal inorder to enable the most general application of the metric [13].To calculate method complexity, any traditional static size orcomplexity metric can be used. In this review, we did not makeany distinction between different implementations of WMC be-cause studies do not always report how the metric was calcu-lated.
9

There are three common implementations of the WMC met-ric found in the primary studies:
• Simple WMC: The complexity of each local method isconsidered to be unity. The WMC is equal to the numberof local methods in a class. However, it should not be mis-taken for the NLM metric (‘Number of Local Methods’),which is the number of local methods defined in a classthat are accessible outside the class (e.g. public methods)[41]. The NLM metric was used in [154, 57, 94, 129, 136].Second similar metric is the NOM metric (‘Number OfMethods’), which is the count of all methods defined ina class (including inherited methods) [3] and was used in[156, 61, 58, 77, 76, 153, 128, 94, 105, 136]. Another sim-ilar metric is the NMC metric (‘Number of Methods perClass’), which is defined as the number of public, privateand protected methods declared in a class, but does not in-clude inherited methods [15]. It was used in [149, 83, 87].When counting methods in a class, the WMC is essentiallya size measure.
• WMC LOC: The complexity of each local method is cal-culated using the LOC metric. The WMC is equal to thesum of lines of code of all local methods in a class. In thiscase, WMC is a size measure.
• WMC McCabe: The complexity of each local method iscalculated using McCabe’s cyclomatic complexity. TheWMC is equal to the sum of McCabe’s cyclomatic com-plexity of all local methods in a class. In this case, theWMC is a complexity measure.
Therefore, the WMC is not really an OO metric, but it is moreof a size or complexity metric, depending on implementation.
McCabe’s cyclomatic complexity [44] was the most fre-quently used of the traditional metrics. It was used in 43 studies.Other popular metrics include LCOM1 by Henderson-Sellers[25] (14); NOA by Lorenz and Kidd [42] (13); NOM by Ban-siya and Davis [3] (12); LCOM3 by Hitz and Montazeri [26](11); N1, N2, η1 and η2 by Halstead [24] (12); ACAIC, ACMIC,DCAEC, DCMEC and OCMEC by Briand et al. [70] (11); TCCand LCC by Bieman and Kang [5] (10).
The extensive list of the most commonly used metrics in theselected studies is presented in appendix, Table C.7.
4.3. RQ2: What empirical validation was performed on themetrics found in RQ1?
This section presents the results of metrics evaluation foundin the selected studies. The studies are grouped according tosoftware metrics into: size, complexity, OO and process met-rics.
The overall effectiveness of metrics and effectiveness in re-gard to SDLC, size and programming language is summarizedin Table 5. In overall effectiveness, all the studies were takeninto account to get a general assessment. To investigate whichmetrics were effective in a particular environment, we assessedhow the metrics’ effectiveness was influenced by pre- and post-release SDLC, small and large data sets, procedural and OO
Table 5: Metrics’ effectiveness in terms of SDLC, size, programming languageand overall.
Metric Overall SDLC Size Prog. languagePre Post Small Large Proc OO
LOC + ++ + ++ + + ++
N1 0 + 0 + 0 0 0N2 0 + 0 + 0 0 0η1 0 0 0 0 0 0 0η2 0 0 0 0 0 0 0CC + 0 + 0 + 0 +
CBO ++ ++ ++ ++ ++ ++
DIT 0 + 0 + 0 0LCOM 0 + 0 + 0 0NOC 0 - 0 - 0 0RFC ++ ++ ++ ++ ++ ++
WMC ++ ++ ++ ++ ++ ++
Delta + + + 0 +
Churn ++ ++ ++ ++ ++
Developer + + + 0 ++
Past faults + + + 0 +
Changes ++ ++ ++ ++ ++
Age ++ ++ ++ ++ ++
Change set ++ ++ ++ + ++
programming languages. For the category ‘size’, medium andlarge data sets were merged, as there were not many studiesusing medium-sized data sets. This way, a clear distinction be-tween studies using small and large data sets was made.
Metrics were selected based on their frequency of use in theselected primary studies. Including more metrics in the tablewas not possible due to a lack of use of other metrics. Nev-ertheless, we believe the selected metrics represent each of themetrics’ categories. The LOC metric was selected as the rep-resentative of size metrics, as other size measures were rarelyused. Complexity metrics were described by McCabe’s cyclo-matic complexity CC and Halstead’s total number of operatorsN1, total number of operands N2, number of unique operatorsη1 and number of unique operands η2. Chidamber and Kemerermetrics (CBO, DIT, LCOM, NOC, RFC and WMC) were se-lected as the most frequently used object-oriented metrics, sinceother OO metrics, like MOOD and QMOOD, were rarely used.Process metrics were represented by code delta, code churn, thenumber of developers, the number of past faults, the number ofchanges, the age of a module and the change set size.
Effectiveness was assessed with a five-point scale to depictthe degree of the metrics’ effectiveness. It was denoted by thesymbols ++, +, 0, - and - -, where ++ indicates a strong posi-tive, + a weak positive, 0 no, - a weak negative and - - a strongnegative correlation between the metrics and software fault pre-diction. A blank entry indicates that the estimation of a metric’seffectiveness could not be made, because there were not any (ornot enough) studies in the category. When assessing the met-rics’ effectiveness, the reliability of the studies was consideredby taking into account the results of a study quality assessment.Greater reliability was given to the studies with a higher qualityassessment score. The results of the studies with higher relia-bility were considered to a greater extent than the results of thestudies with lower reliability.
10

4.3.1. RQ2.1: Are size metrics useful for fault prediction?
The simplest, the easiest to extract and the most frequentlyused metric, i.e. LOC, is still being discussed to this day. Thereare many studies investigating the relationship between lines ofcode and number of faults. The simplest studies have rankedthe modules according to their size to find out whether a smallnumber of large modules are responsible for a large proportionof faults. E.g. in Zhang [151] three versions of Eclipse wereused to investigate pre-release and post-release ranking abilityof LOC at the package level. This study showed that 20% of thelargest modules were responsible for 51%–63% of the defects.
Ostrand et al. [130] used the negative binomial regressionmodel on two large industrial systems. In the simple model,using only LOC, the percentage of faults, contained in the 20percent of the files that were the largest in terms of the num-ber of lines of code, was on average 73% and 74% for the twosystems. In a richer model, where other metrics were used, thetop-20% of files ordered by fault count contained, on average,59% of the lines of code and 83% of the faults. The top-20%of files contained many large files, because the model predicteda large number of faults in large files. In analyzing which fileswere likely to contain the largest number of faults relative totheir size, they used the model’s predicted number of faults andthe size of each file to compute a predicted fault density. Thetop-20% of files contained, on average, only 25% of the linesof code and 62% of the faults. Sorting files by predicted faultdensity was not as effective as sorting files according to faultcount at finding large numbers of faults, but it does result inconsiderably less code in the end.
Fenton and Ohlsson [84] investigated, among many hypothe-ses, the Pareto principle [28] and the relationship between sizemetrics and the number of faults. They used a graphical tech-nique called the Alberg diagram [127] and two versions of atelecommunication software. As independent variables LOC,McCabe’s cyclomatic complexity and SigFF metrics were used.In pre-release 20% of the modules were responsible for nearly60% of the faults and contained just 30% of the code. A repli-cated study by Andersson and Runeson [59] found an evenlarger proportion of faults, in a smaller proportion of the mod-ules. This result is also in agreement with [130, 151].
Fenton and Ohlsson also tested the hypothesis of whethersize metrics (such as LOC) are good predictors of pre-releaseand post-release faults in a module and whether they are goodpredictors of a module’s pre-release and post-release fault den-sity. They showed that size metrics (such as LOC) are moderatepredictors of the number of pre-release faults in a module, al-though they do not predict the number of post-release failuresin a module, nor can they predict a module’s fault density. Eventhough the hypothesis was rejected, the authors concluded thatLOC is quite good at ranking the most fault-prone modules.Andersson and Runeson, on the other hand, got varying results.The first two projects did not indicate any particularly strongranking ability for LOC. However, in the third project, 20% ofthe largest modules were responsible for 57% of all the faults.
Koru et al. [35, 104] reported that defect proneness increaseswith size, but at a slower rate. This makes smaller modules
proportionally more problematic compared with larger ones.In [34, 59], it is noted that relating size metrics to fault den-
sity may be misleading, as there will always be a negative cor-relation between size metrics and fault density, because of thefunctional relationship between the variables [47]. However,no studies using fault density as dependent variable were ex-cluded from the review because we wanted to represent the en-tire research field. In this section, studies using fault densityare compared with LOC size ranking ability to assess the LOCpredictive capabilities.
To some extent, size correlates with the number of faults[130, 151, 154, 112, 83, 78], but there is no strong evidencethat size metrics, like LOC, are a good indicator of faults[84, 59]. A strong correlation was observed between the sizemetric LOC and fault proneness in pre-release and small stud-ies, while in post-release and large studies, only a weak associ-ation was found (Table 5). This may indicate that studies withlower validity (smaller data sets) gave greater significance to theLOC metric than studies with higher validity (larger data sets).Therefore, the reliability of the studies in terms of study qualityassessment was taken into account and the overall effectivenessof the LOC metric was estimated as moderate.
4.3.2. RQ2.2: Are complexity metrics useful for fault predic-tion? Do they have additional benefits after being ad-justed for size?
Popular complexity metrics, like McCabe’s cyclomatic com-plexity [44] and Halstead’s metrics [24], were used in 22 and12 studies, respectively. McCabe’s cyclomatic complexity wasa good predictor of software fault proneness in [127, 156, 112,111, 121, 92, 75], but not in [64, 87, 141, 148]. Cyclomaticcomplexity was fairly effective in large post-release environ-ments using OO languages but not in small pre-release envi-ronments with procedural languages (Table 5). This indicatesthat cyclomatic complexity may be more effective in large andOO environments. One potential explanation for this could bethat in large data sets, modules are more complex than in smalldata sets. We assumed that modules in small data sets (usuallyacademic and written by students) were not as complex as inlarge industrial cases. Also, the modules used in OO program-ming languages (usually class) are generally bigger than mod-ules used in procedural languages (usually method) and may,therefore, be more complex. Although the cyclomatic com-plexity was not found to be effective in all the categories, theoverall effectiveness was estimated as moderate, as there wereindividual studies reporting its usability.
Poor results were reported for Halstead’s metrics, whichwere significant in [116, 148], but not in [101, 112, 111]. Ac-cording to the evidence gathered, Halstead’s metrics were not asgood as McCabe’s cyclomatic complexity or LOC [111]. Theywere found to be somewhat effective in pre-release and smallstudies, suggesting low validity of the results. The total numberof operators N1 and the total number of operands N2 performedbetter than the number of unique operators η1 and the number ofunique operands η2 [148]. In other categories, Halstead’s met-rics were ineffective when compared to other metrics. Hence,
11

they were estimated as inappropriate for software fault predic-tion.
Fenton and Ohlsson [84] reported that complexity metrics arenot the best, but reasonable predictors of fault-prone modules.They found a high correlation between complexity metrics andLOC. Zhou et al. [154] also noted that class size has a strongconfounding effect on associations between complexity metricsand fault-proneness, and that the explanatory power of com-plexity metrics, in addition to LOC, is limited. McCabe’s andHalstead’s metrics were highly correlated to each other and tothe lines of code in [88, 18]. The high correlation between com-plex metrics and LOC is reasonable, since complexity metricsare essentially a size measurement [112]. From the evidencegathered, it seems complexity metrics are not bad fault predic-tors, but others are better [112, 84, 88, 154, 155].
4.3.3. RQ2.3: Are OO metrics useful for fault prediction? Dothey have additional benefits after being adjusted forsize?
The most frequently used and the most successful amongOO metrics were the CK metrics. However, not all CK met-rics performed equally well. According to various authors[62, 66, 67, 81, 149, 89, 153, 128, 132, 136, 53, 137] thebest metrics from the CK metrics suite are CBO, WMC andRFC, which were effective across all groups (Table 5). LCOMis somewhere in between [62, 89, 132, 137] and was found tobe effective in small pre-release studies. When all the evidenceis considered and compared to other CK metrics, LCOM is notvery successful in finding faults. DIT and NOC were reportedas untrustworthy [139, 153, 89, 128, 132, 136, 87, 83, 137].DIT was only significant in some small and pre-release studies,while NOC was unreliable and occasionally inverse significant.This means that the module has greater fault potential if it hasfewer children, which is the opposite of the NOC original defin-ition. Consequently, DIT and NOC were assessed as ineffectiveOO metrics.
Abreu and Carapuca MOOD [1, 51] and Bansiya and DavisQMOOD metric suites [3] were only validated in a few studies.Olague et al. [128] reported that the QMOOD metrics were,while the MOOD metrics were not, suitable for predicting soft-ware fault proneness. They also stated that the CK metricsperformed better than QMOOD and MOOD metrics. AmongQMOOD metrics, CIS and NOM metrics performed better thanothers. In [82], MOOD metrics were evaluated and comparedwith the Martin suite [43] and CK metrics. The MOOD metricswere outperformed by the Martin suite. In the MOOD suite, theCF metric had the highest impact.
The MOOD metrics were also theoretically evaluated in [31].This study is not included in the list of primary studies becausethere was no empirical validation. The study reported that theMOOD metrics operated at the system level, while the CK met-rics operated at the component level. Therefore, MOOD met-rics are appropriate for project managers to assess the entiresystem, and CK metrics are more appropriate for developersand monitoring units. Al Dallal [56, 55] used CAM metricsfrom the QMOOD metrics suite to compare it with other cohe-sion metrics and the proposed SSC metric. In the two studies,
both CAM and SSC performed well.The predictive performance of cohesion metrics LCC and
TCC [5] was estimated as modest by all ten studies [71, 65,69, 66, 67, 52, 109, 53, 56, 55]. They have a similar definitionand share similar performance [53, 56, 55]. LCC was found toperform slightly better than TCC [69, 52]. In [109] TCC andLCC performed the worst among ten cohesion metrics, whereasTCC was slightly better than LCC.
Briand et al. [70] studied and proposed new object-orientedmetrics. The coupling metrics were reported to be successful[70, 71, 65, 69, 66, 67, 8, 81, 54, 53]. The coupling metricswere further divided into import coupling and export coupling.The import coupling metrics were reported to be superior overexport coupling [69, 71, 66, 67, 68, 54, 53]. Only in [81] wereexport coupling metrics more successful.
El Emam et al. [80] investigated the association betweenclass size, CK metrics and Lorenz and Kidd OO metrics. Theydemonstrated that after controlling for size, metrics correlationwith faults disappeared, indicating a strong correlation betweenOO metrics and size. The association between OO metrics andsize was also observed in [60], where the cost-effectiveness ofOO metrics was studied. The OO metrics were good predictorsof faulty classes, but did not result in cost-effective predictionmodels. Subramanyam and Krishnan [138] tended to agree tosome extent with El Emam, but they suggested that the addi-tional effect of OO metrics beyond the one explained by size isstatistically significant.
Since only a few studies have taken into account the potentialcorrelation between size and OO metrics, additional validationis needed to assess the impact of software size on OO metrics.
4.3.4. RQ2.4: Are process metrics superior to traditional andOO metrics? Is the answer dependent upon the life cyclecontext?
Process metrics are computed from the software change his-tory. They can be further divided into delta metrics and codechurn metrics. Delta metrics are calculated as the difference ofmetrics values between two versions of a software. They showthe end result, i.e. how the metrics value has changed betweentwo versions, but not how much change has occurred. For ex-ample, if several lines of code have been added, this change willbe reflected in a changed delta value. But if the same number oflines have been added and removed, the delta value will remainthe same. This weakness is corrected by code churn metrics,which capture the overall change to the software between twoversions. The delta and the code churn metrics can be computedfor any metric [22].
The first study in our review to investigate the process metricswas [116]. Of the three independent variables of code churn,deltas and developer measures used in the study, code churnhad the greatest correlation with trouble reports. There was noapparent relationship between the number of developers imple-menting a change and the number of trouble reports.
Graves et al. [88] looked at how code changes over time.They reported that the number of changes to code in the past,and a measure of the average age of the code, were successfulpredictors of faults; clearly better than product measures such
12

as lines of code. Their most successful model, the weightedtime damp model, predicted fault potential using a sum of con-tributions from all the changes to the module in its history,whereas large and recent changes contribute the most to faultpotential. In [130, 93] new and changed files had more faultsthan existing, unchanged files with otherwise similar character-istics.
Moser et al. [115] compared 18 process metrics to staticcode metrics. They reported that process related metrics con-tain more discriminatory and meaningful information about thefault distribution in software than the source code itself. Theyfound four metrics to be powerful fault predictors and explainedthat files with a high revision number are by nature fault prone,while files that are part of large CVS commits are likely tobe fault free, and bug fixing activities are likely to introducenew faults. Refactoring, meanwhile, seems to improve softwarequality.
In [117], relative code churn metrics were found to be goodpredictors of binaries’ fault density, while absolute code churnwas not.
Arisholm et al. [60] performed an extensive comparison ofOO, delta and process metrics on 13 releases of a large Javasystem. They found large differences between metrics in termsof cost-effectiveness. Process metrics yielded the most cost-effective models, where models built with the delta and theOO metrics were not cost-effective. Process metrics were alsothe best predictor of faulty classes in terms of ROC area, fol-lowed by the OO and delta metrics. The differences betweenmetrics were not as significant as they were in terms of cost-effectiveness. A good prediction of faulty classes and low cost-effectiveness of the OO metrics may be explained by the afore-mentioned association with size measures [80].
Developer metrics were investigated by several studies, buttheir usability in fault prediction remains an important unan-swered research question. Schroter et al. [135] investigatedwhether specific developers are more likely to produce bugsthan others. Although they observed substantial differences infailure density in files owned by different developers in pre-release and post-release, they suspect that the results do not in-dicate developer competency, but instead reflect the complexityof the code.
Weyuker et al. [147, 146, 131] introduced three developermetrics: the number of developers who modified the file dur-ing the prior release, the number of new developers who modi-fied the file during the prior release, and the cumulative numberof distinct developers who modified the file during all releasesthrough the prior release. Only a slight improvement of pre-diction results was recorded when developer information wasincluded. Graves et al. [88] found that the number of differ-ent developers, who worked on a module, and a measure ofthe extent to which a module is connected with other mod-ules, did not improve predictions. On the other hand, developerdata did improve predictions in [118, 93, 110]. All four studieshave the same quality assessment score and are very similar inall properties, but different in the property ‘Programming lan-guage’. Graves et al. [88] used procedural programming lan-guage, while in [118, 93, 110] OO programming language was
used. However, we do not believe this is the reason for the con-tradictory results.
Source code metrics (i.e. size, complexity and OO met-rics) do not perform well in finding post-release faults [57, 128,136, 60], because these are more likely due to the developmentprocess and less likely due to the software design [136]. Faultprediction models are influenced not just by source code but bymultiple aspects, such as time constraints, process orientation,team factors and bug-fix related features [46].
Moser et al. [115] gives a simple explanation why processmetrics contain more meaningful information about fault distri-bution than source code metrics. They explain that a very com-plex file, which would be classified as faulty by a predictionmodel based on complexity metrics, can be fault free, becauseit was coded by a skilled developer who did a very prudent job.On the other hand, if a file is involved in many changes through-out its life cycle, there is a high probability that at least one ofthose changes will introduce a fault, regardless of its complex-ity.
In contrast to source code metrics, process metrics werefound to be useful in predicting post-release faults [100, 107,58, 73, 85, 91, 60, 93, 110, 88, 115, 117, 118]. Only in [150]did additional process metrics not improve classification accu-racy.
According to included studies and to our assessment of themetrics’ effectiveness (Table 5), the best process metrics arecode churn, the number of changes, the age of a module and thechange set size. They were strongly related to fault pronenessin all categories. When compared to other three metrics, thechange set size metric showed slightly poorer results in stud-ies using procedural languages. Code delta, the number of de-velopers and the number of past faults metrics exhibited someevidence relating them to fault proneness, but the results werenot as strong as with other process metrics. Code churn met-rics were found to be more appropriate than delta metrics. Thedeveloper metric showed only moderate correlation with faultsand seemed to dependent upon the environment, since differentobservations were reported. It is not immediately clear whetherpast faults are related to faults in the current release, but thereseems to be a weak connection between them.
Industry practitioners looking for effective and reliableprocess metrics should consider code churn, the number ofchanges, the age of a module and the change set size metrics.Researchers looking for poorly investigated areas may considerthe number of past faults and the change set size metrics, sincethere is not much evidence relating them to faults. Anotherchallenging area would be to find new ways to measure processrelated information and to evaluate their relationship with faultproneness.
4.3.5. RQ2.5: Are there metrics reported to be significantlysuperior for software fault prediction, and if so whichones?
Although there is evidence for each metric category asso-ciating metrics with fault proneness, we have considered howstrong the evidence is, taking into account contradictory argu-ments and studies’ reliability. According to the 106 primary
13

studies, there are metrics reported to be more successful at faultprediction than others. From the evidence gathered, it seemsOO and process metrics are more successful at fault predictionthan traditional size and complexity metrics.
In the OO category, the most frequently used and the mostsuccessful metrics are the CK metrics. The CBO, WMC andRFC were reported to be the best from the CK metrics suite.The coupling metrics were reported to be better than inheritanceand cohesion metrics.
Process metrics were found to be successful at finding post-release faults [100, 107, 58, 73, 85, 91, 60, 93, 110, 88, 115,117, 118], while source code metrics were not [57, 128, 136,60]. Metrics code churn, the number of changes, the age ofa module and the change set size have the strongest correla-tion with post-release faults among process metrics. However,it is not immediately clear whether fault prediction is also in-fluenced by having developer data available. Some studies, i.e.[118, 93, 110], found that additional developer data improvedprediction results, while others [116, 88, 135, 147, 146, 131]did not find any or found just a slight improvement of predic-tion results, when developer information was included. Onlyweak evidence supporting correlation with faults was also ex-hibited for the past faults and code delta metrics. Therefore,metrics developer, past faults and code delta are not among themost successful process metrics.
Our findings are similar to those of Hall et al. [23] for size,complexity and OO metrics, but differ regarding process met-rics. Hall reported that process metrics performed the worstamong all metrics. This could be due to the quantitative modelused, which only takes into account the raw performance of themodels, without considering the context in which the studieswere performed. Poor process metrics performance might beexplained by the fact that process metrics are usually evaluatedin post-release software, where faults are harder to find. In ad-dition, Kitchenham [34] also concluded that process metrics aremore likely to predict post-release faults than static code met-rics.
There have been many published studies that validate CKmetrics, and much attention has been paid to LOC, but there arenot that many studies using process metrics. In the future, wewould like to see more studies proposing and validating processmetrics, since they may be of great potential in software faultprediction.
4.3.6. RQ2.6: Are there metrics reported to be inferior for soft-ware fault prediction, and if so which ones?
Complexity metrics do have some predictive capabilities, butmay not be the best metrics for software fault prediction, sincethey are highly correlated with lines of code [84, 88, 112, 154].
Size measures like LOC metrics are simple and easy to ex-tract; but as with the complexity metrics, they only have limitedpredictive capabilities. They are partly successful in ranking themost fault prone modules, but are not the most reliable or suc-cessful metrics [84, 130, 59, 151].
Neither are all OO metrics good fault predictors. For exam-ple, NOC and DIT are unreliable and should not be used in faultprediction models [139, 153, 89, 128, 132, 136, 87, 83, 137].
There is also little evidence for other OO metrics like theMOOD and QMOOD metrics, but they do not promise muchon the other hand [128].
There are some metrics that could not be classified eitheras successful or unsuccessful fault predictors, due to eitherthe lack of research (e.g. MOOD, QMOOD, individual processmetrics) or conflicting results (e.g. LCOM, developer metrics).These metrics will be left for future research to determine theirusefulness.
4.4. RQ3: What data sets are used for evaluating metrics?In the case of our primary studies, data was gathered from
different software items and software development processes.This section describes what data sets were used, whether theywere publicly available, the size of the data sets, and what pro-gramming languages were used.
4.4.1. RQ3.1: Are the data sets publicly available?62 (58%) of the studies used private, 22 (21%) partially pub-
lic and only 22 (21%) public data sets. The number of stud-ies using private data sets is concerning, since 58–79% of thestudies are, in our opinion, not repeatable, and the results cantherefore be questioned. Using private data sets lowers a study’scredibility.
In 2005, the PROMISE repository [6] was introduced. It in-cludes publicly available software measurements and is free foranyone to use. One would imagine that it would help raise thequestion of publicly available data sets, but only a slight im-provement can be detected. After 2005, 41% of the selectedstudies still used private data sets, 30% used partially publicand 28% used publicly available data sets.
4.4.2. RQ3.2: What are the size of the data sets?58 (55%) studies used large and 12 (11%) used medium sized
data sets. In our estimation, these two groups have data setslarge enough to make a trustworthy conclusion. We are con-cerned with 36 (33%) studies, which used small data sets, be-cause there is a great threat of generalizing the results. Datasets were classified as small if they used less than 200 modules(classes, files, etc.), which is a low value of cases for a predic-tive model to make a reliable decision. Such a model can easilybe influenced by the underlying data sets and any conclusiondrawn from it could be misleading. Therefore, the results of thestudies with small data sets should be interpreted with caution.
After 2005, larger data sets have been used. The number oflarge data sets (72%) increased and the number of small (18%)and medium (10%) sized data sets decreased. Hence, with re-spect to the previous research question, and with respect to thisresearch question, we can discern a positive trend.
Process metrics were almost always evaluated on large datasets (Fig. 4), which increases the validity of studies usingprocess metrics. However, the validity of studies using OO met-rics is a source of concern, since half of the studies used smalldata sets. Small data sets are only strongly associated with OOmetrics, but not with two other metrics’ categories. Because ofthis phenomenon, special attention was paid to the results of thestudies using small data sets and OO metrics.
14

�� � �� ��� � � � � �
� �� �� � � � � � � � �� � � � � � � � � � � � � � � ! " # #$ %&''
( )*+,- ./0 12
Figure 4: The number of studies using metrics by data set sizes.
4.4.3. RQ3.3: What software programming languages are usedto implement software from which data sets are ex-tracted?
The mostly frequently used programming languages wereC++ (35%), Java (34%) and C (16%). Other programming lan-guages were rarely used (8% in total), while in 7% of the studiesthe programming language was not even stated. It is interestingthat, in addition to Java, not many other modern OO program-ming languages were used (two studies, [121, 107], used C#).In the future, more studies should use OO programming lan-guages other than Java (e.g. C#, Ruby, Python, not to mentionweb programming languages such as PHP and JavaScript) tosee how metrics perform in different programming languages,since the predictive capabilities of metrics may differ betweenprogramming languages [138].
The choice of the programming language is associated withthe choice of software metrics. OO metrics cannot be usedin procedural programming languages, because they do not in-clude object-oriented concepts like coupling, cohesion and in-heritance. Figure 5 shows the number of studies using metricsin procedural and OO programming languages. It confirms thatOO metrics are only used in OO programming languages. Tra-ditional and process metrics can be used in both types of pro-gramming languages, but they were more frequently used inOO programming languages, because of their prevalence. Onewould expect traditional metrics to be more often used in pro-cedural than OO programming languages, but according to Fig-ure 5, the opposite is the case. This could be due to the largenumber of studies validating OO metrics and using traditionalmetrics for comparison. The more frequent use of process met-rics in object-oriented than procedural programming languagesis expected, since process metrics are newer.
4.5. RQ4: What are the software development life cycles inwhich the data sets are gathered?
The number of studies using pre-release software (64%) islarger than the number of studies using post-release software(36%). In recent years there was a slight increase in studiesusing post-release software. Since 2005, the number of stud-ies using post-release software (47%) is about the same as the
� �� ��� � ���� � ���
�� ����� � � �� �� �� � � � � � �� � � � ! " # � $ % % & ' ( ) * + +, -./01 .-2344 567 89: ;< ;= >;
Figure 5: The number of studies using metrics by programming languages.
number of studies using pre-release software (53%).
4.5.1. RQ4.1: Are there different metrics used in different soft-ware development life cycles?
Different metrics are used in pre-release compared to post-release software. In pre-release, size, complexity and OOmetrics are used, while process metrics are not used, becauseprocess-related information is normally not available and onlyone version of software exists. In post-release, size, complexityand OO metrics can be used, but they are rarely found as theydo not predict faults very well in long, highly iterative evolu-tionary processes [57, 128, 136, 60]. In post-release, processmetrics are commonly used, because of their success in pre-dicting post-release faults [88, 115, 73, 85, 60, 93].
4.5.2. RQ4.2: Is there proof that fault prediction accuracy dif-fers across various software development life cycles?
Static code metrics were found to be reasonably effective inpredicting evolution changes of a system design in the short-cycled process, but they were largely ineffective in the long-cycled evolution process [57]. For highly iterative or agile sys-tems, the metrics will not remain effective forever [128, 136].Static code metrics are, on the one hand, suitable for observ-ing a particular state in a software iteration but, on the otherhand, their prediction accuracy decreases with each iteration[128, 136, 57, 156, 89]. One reason for this might be that thereare generally more faults in pre-release than in post-release[136]. Post-release faults are also harder to find, because theyare less influenced by design and more by development prop-erties, which cannot be easily detected by static code metrics[136].
4.6. RQ5: What is the context in which the metrics were evalu-ated?
In this section, we present the context of the selected studies(RQ5). In Sections 4.6.1–4.6.5 the distribution of studies ac-cording to the properties ‘Researcher’, ‘Organization’, ‘Model-ing technique’, ‘Dependent variable’ and ‘Dependent variablegranularity’ are presented.
15

� �� � �� � �� �� ���� ��� � � � � � �� � � � � � � � � � � � � � ! " # $ $% &'( )*+ ' , -. /01 2 3
Figure 6: The number of studies using metrics by researchers from academiaand the industry.
4.6.1. Researcher (P6)The research on software metrics used in software fault pre-
diction is driven by researchers from academia. 87% of thestudies were performed by researchers from academia and only13% by researchers from the industry. It is difficult to assessthe industrial applicability of the research, when very few re-searchers are actually from the industry. This may also point toa certain degree of disinterest from the industry’s point of view.
Academic researchers were strongly interested in OO met-rics, while the majority of researchers in the industry usedprocess metrics (Fig. 6). This could mean that process metricsare more appropriate than other categories for industrial use.We would advise academic researchers to follow researchers inthe industry and focus on process metrics.
Industry experts may be interested in the following studies[149, 117, 130, 120, 124, 119, 128, 129, 147, 118, 146, 92,131, 123]. They were performed by researchers in the indus-try on large data sets, but unfortunately private ones. Only[128, 129] used medium and partially available data sets. Ac-cording to our quality assessment, they are as reliable as thestudies performed by researchers from academia. Their aver-age quality assessment score is 16.4, while the overall averageis 16.3. The quality assessment score of the studies [128, 129]is 19.5, hence they are highly reliable. They investigate CK,MOOD, QMOOD object-oriented metrics and McCabe’s cy-clomatic complexity. Less reliable studies are [147, 92], with ascore of 13 and 13.5.
4.6.2. Organization (P7)Although the majority of researchers are from academia,
76% of the studies used industrial software to evaluate metricsperformance. Still, 24% of the studies used academic software,which was usually small and written by students.
Almost all studies performed on academic data sets used OOmetrics, while industrial data sets were equally represented byall three metrics’ groups (Fig. 7). This indicates the wide ac-ceptance of OO metrics within the academic research commu-nity. The results are in alignment with those of the property‘Researcher’, where the majority of researchers from academiaused OO metrics.
�� � � �� � �� �� ��� � � �� � � � � � �� � � � � � � � � � � � � ! " # $ % %& '() *+, ( - ./ 012 3 4
Figure 7: The number of studies using metrics by organizations.
A similar pattern regarding OO metrics was observed in Fig-ure 4, where the use of metrics was analyzed against the dataset size. Half of the studies validating OO metrics used smalldata sets. When comparing studies using academic softwareand studies using small data sets, a strong correlation was dis-covered. Out of 25 studies using academic software, 21 stud-ies used small, 4 studies used medium, and none of them usedlarge data sets. Therefore, studies using academic software usu-ally have low external validity. To get the most relevant results,from the industry’s point of view, metrics’ evaluation shouldalways be performed on large, industrial software.
4.6.3. Modeling technique (P8)In this systematic review, we focused on selecting metrics
for software fault prediction and not on selection of model-ing technique. Nevertheless, we extracted data about modelingtechniques also, just to see which modeling techniques werethe most frequently used. Statistical analyses, like logistic andlinear regression, were used in 68% of the studies, followedby machine learning algorithms (24%) and correlation analysis(8%).
4.6.4. Dependent variable (P9)The most common dependent variable used in fault predic-
tion models is detecting whether the particular module is faultyor not (70%). Predicting how many faults may be in a module(24%) and predicting the severity of faults (3%) offers more in-formation. Modules having more faults or having more severefaults can be prioritized and, thus, help to allocate and save re-sources [137]. In spite of some other proposed techniques (3%),classifying and ranking faults remain the most used dependentvariables.
4.6.5. Dependent variable granularity (P10)The prediction made for smaller modules, such as classes or
files, is more effective than the prediction made for larger mod-ules, like packages, because the fault location is more preciseand less work is required to review the module [76].
The granularities reported by the primary studies are class(55%), method (16%), file (13%), package (11%) and other
16

11
2
1
1
3
48
1
10
4
2
Granularity
Metrics
Traditional OO Process
Method Class
File
Package Other
Figure 8: The number of studies using metrics at different dependent variablegranularities.
(5%). From the selected studies, the association betweenmetrics and dependent variable granularity can be observed(Fig. 8). Traditional metrics are associated with methods, OOmetrics with classes and process metrics with files.
The above associations must be considered when choosingmetrics for fault prediction model. The selection of metrics isnot only related to metrics performance, but also to granularitylevel at which fault prediction is required. At class level, wewould probably use OO metrics. At method level, traditionalsize and complexity metrics would be used, because OO met-rics cannot be used. Process metrics are generally used at filelevel, because many are extracted from a version control sys-tem, which operates at file level.
5. Conclusions
The main objective of this systematic review was to find andassess primary studies validating software metrics used in soft-ware fault prediction. An extensive search was performed inorder to find primary studies, which included searching sevendigital libraries, snowball sampling and contacting the authorsdirectly. Out of 13,126 studies found in digital libraries, 106primary studies were included and evaluated according to anumber of research questions. For each study, ten propertieswere extracted and a quality assessment was performed in or-der to achieve new insights.
Researchers who are new to the area can find the completelist of relevant papers in the field. They will also find the mostfrequently used metrics in fault prediction, with references tothe studies in which they are used (Table C.7). The metrics’effectiveness is assessed to provide a clear distinction regard-ing their usefulness. New insights into how metrics were usedin different environments were obtained through the assessmentof the context. With this SLR, researchers have gained an over-all overview of the area and an outline for future work. Re-searchers from the industry will most likely be interested inTable 5, where the effectiveness of the most frequently usedmetrics were assessed in a five-point scale to distinguish be-tween metrics’ usefulness and to determine the degree of ef-fectiveness. The quality assessment of selected primary studies
was used as a reliability measure. Studies with a higher qualityassessment score were given greater meaning, when assessingthe metrics’ effectiveness. The effectiveness was assessed over-all and for different environments, i.e. pre- and post- releaseSDLC, small and large data sets, procedural and OO program-ming languages. This way, researchers can distinguish whichmetrics were effective in a particular environment and to whatextent.
For instance, researchers from the industry looking for met-rics for fault prediction in large, OO, post-release systemswould be advised to use process metrics, like code churn, thenumber of changes, the age of a module and the change setsize. They could also try static code metrics (e.g. CBO, RFCand WMC), but should keep in mind that they have some limi-tations in highly iterative and agile development environments.Although this SLR summarizes the metrics’ effectiveness, sev-eral different metrics should be tested to find the most appropri-ate set of metrics for each particular domain.
Object-oriented metrics (49%) were used nearly twice as of-ten as traditional source code metrics (27%) or process metrics(24%). The most popular OO metrics were the CK metrics,which were used in almost half of the studies.
According to the selected primary studies, there are consider-able differences between metrics with respect to software faultprediction accuracy. OO and process metrics were found to bemore successful at fault prediction than traditional metrics.
Traditional complexity metrics are strongly associated withsize measures like lines of code [84, 88, 112, 154]. Complex-ity metrics and size measures have been reported to have somepredictive capabilities but are not the best fault predictors ingeneral [84, 88, 112, 64, 87, 141, 148, 154, 130, 59, 151]
Object-oriented metrics are reported to be better at predictingfaults than complexity and size metrics [62, 66, 67, 81, 149,89, 153, 128, 132, 136, 53, 137]). Although they also seemto correlate to size [80, 60], they do capture some additionalproperties beyond size [138].
Static code metrics, like complexity, size and OO met-rics, are useful for observing particular software version, buttheir prediction accuracy decreases with each software iteration[128, 136, 57, 156, 89]. They were found to be inappropriate forhighly iterative, post-release software [57, 128, 136, 60], wherefaults are mainly due to the nature of the development processand not so much to design and size properties [46, 136]. Inthis kind of environment, process metrics are reported to per-form better than static code metrics in terms of fault predictionaccuracy [88, 115, 73, 85, 60, 93].
The majority of the studies used size, complexity and OOmetrics (70%), whereas process metrics, which have great po-tential, were less frequently used (23%). Researchers from theindustry used mostly process metrics, whereas researchers fromacademia preferred OO metrics. This may indicate that processmetrics are more appropriate for industrial use than static codemetrics and that process metrics are what the industry wants.Therefore, we would like to make an appeal to researchers toconsider including process metrics in their future studies. Othersuggestions for future work are discussed below.
In most cases, one of three programming languages was
17

used, i.e. C++ (35%), Java (34%) and C (15%), while oth-ers were rarely employed (8%). Future studies should con-sider other OO languages (e.g. C#) to investigate the perfor-mance of metrics in different programming languages. Themetrics’ effectiveness across different programming languagescould be further investigated, since it appears to differ betweenlanguages [138].
Collecting software metrics and fault data can be difficult.Sometimes fault data is not available. This may be the casewhen a new project is started. Future studies could try to an-swer the question as to whether a fault prediction model canbe learned on similar within company or even cross companyprojects, and used on the newly started project. Turhan et al.[143] did not find cross company models to be useful whencompared to internal company models.
Validation should be performed in the most realistic envi-ronment possible in order to acquire results relevant for the in-dustry. In realistic environments, faults are fairly random anddata sets are highly unbalanced (few faults, many correct mod-ules). The number of faults and their distribution between tworeleases can differ significantly. Validation techniques, like a10-fold cross validation, 2/3 for training and 1/3 for testing, donot take into account all the factors that real environment valida-tion does, where fault prediction models are trained on releasei and tested on release i+1. Some of the environment factorsworth investigating may be raised with the following questions:What will happen if the model is trained on release i and used topredict faults on release i+1, which has several times as manyfaults as release i? What if there are no or only a few faults inrelease i+1? How will the model cope with a large amount ofnewly added functionality between two releases? What abouta major refactoring? These may be difficult questions, but an-swers could be of great importance for practitioners in the in-dustry. Only validation, where models are trained on release iand evaluated on release i+1, can determine the impact of allthese, and other unpredictable factors, of the environment.
We noticed that 87% of researchers stem from academia, that25% of the studies used academic software, that 58% of thestudies used private data and that 33% used small data sets.Therefore, in the hope of improving industrial relevance, aswell as the quality and validity of research, we would like tosuggest that large, industrial software be used and that data setsbe made publicly available whenever possible.
Acknowledgment
We would like to thank the anonymous reviewers for theirconstructive comments and suggestions. This study was partlyfinanced by the European Union’s European Social Fund.
References
[1] F. B. E. Abreu, R. Carapuca, Object-Oriented Software Engineering:Measuring and Controlling the Development Process, in: In Proceedingsof the 4th international Conference on Software Quality, p. 0.
[2] A. Avizienis, J. Laprie, B. Randell, Dependability and its threats: ataxonomy, Building the Information Society (2004) 91–120.
[3] J. Bansiya, C. G. Davis, A hierarchical model for object-oriented de-sign quality assessment, Ieee Transactions on Software Engineering 28(2002) 4–17.
[4] H. D. Benington, Production of Large Computer Programs, IEEE An-nals of the History of Computing 5 (1983) 350–361.
[5] J. M. Bieman, B.-K. Kang, Cohesion and reuse in an object-orientedsystem, ACM SIGSOFT Software Engineering Notes 20 (1995) 259–262.
[6] G. Boetticher, T. Menzies, T. Ostrand, PROMISE Repository of empiri-cal software engineering data, 2007.
[7] P. Brereton, B. A. Kitchenham, D. Budgen, M. Turner, M. Khalil,Lessons from applying the systematic literature review process withinthe software engineering domain, Journal of Systems and Software 80(2007) 571–583.
[8] L. C. Briand, J. Wust, Empirical studies of quality models in object-oriented systems, in: Advances in Computers, Vol 56, volume 56 ofAdvances in Computers, 2002, pp. 97–166.
[9] C. Catal, B. Diri, Investigating the effect of dataset size, metrics sets,and feature selection techniques on software fault prediction problem,Information Sciences 179 (2009) 1040–1058.
[10] C. Catal, B. Diri, A systematic review of software fault prediction stud-ies, Expert Systems with Applications 36 (2009) 7346–7354.
[11] C. Catal, Software fault prediction: A literature review and currenttrends, Expert Systems with Applications 38 (2011) 4626–4636.
[12] S. R. Chidamber, C. F. Kemerer, TOWARDS A METRICS SUITE FOROBJECT ORIENTED DESIGN, Oopsla 91 Conference Proceedings :Object-Oriented Programming Systems, Languages, and Applications,ACM, 1991.
[13] S. R. Chidamber, C. F. Kemerer, A METRICS SUITE FOR OBJECT-ORIENTED DESIGN, Ieee Transactions on Software Engineering 20(1994) 476–493.
[14] J. Cohen, A Coefficient of Agreement for Nominal Scales, Educationaland Psychological Measurement 20 (1960) 37–46.
[15] Use of friends in C++ software: an empirical investigation, Journal ofSystems and Software 53 (2000) 15–21.
[16] K. O. Elish, M. O. Elish, Predicting defect-prone software modulesusing support vector machines, Journal of Systems and Software 81(2008) 649–660.
[17] L. Etzkorn, J. Bansiya, C. Davis, Design and code complexity metricsfor OO classes, Journal of Object-Oriented Programming 12 (1999) 35–40.
[18] N. Fenton, S. Pfleeger, Software Metrics: A Rigorous and Practical Ap-proach, volume 5, PWS Publishing Company (An International Thom-son Publishing Company), 1997.
[19] F. Garcia, M. Bertoa, C. Calero, A. Vallecillo, F. Ruiz, M. Piattini,M. Genero, Towards a consistent terminology for software measure-ment, Information and Software Technology 48 (2006) 631–644.
[20] I. Gondra, Applying machine learning to software fault-proneness pre-diction, Journal of Systems and Software 81 (2008) 186–195.
[21] L. A. Goodman, Snowball Sampling, The Annals of MathematicalStatistics Vol. 32 (1961) 148–170.
[22] G. a. Hall, J. C. Munson, Software evolution: code delta and code churn,Journal of Systems and Software 54 (2000) 111–118.
[23] T. Hall, S. Beecham, D. Bowes, D. Gray, S. Counsell, A SystematicLiterature Review on Fault Prediction Performance in Software Engi-neering, IEEE Transactions on Software Engineering (2011) 1–31.
[24] M. H. Halstead, Elements of Software Science, Elsevier Science Inc.,New York, NY, USA, 1977.
[25] B. Henderson-Sellers, Software Metrics, Prentice-Hall, ., Hemel Hemp-staed, UK, 1996.
[26] M. Hitz, B. Montazeri, Measuring coupling and cohesion in object-oriented systems, in: Proceedings of the International Symposium onApplied Corporate Computing, volume 50, pp. 75–76.
[27] ISO/IEC, IEEE, ISO/IEC 12207:2008 Systems and software engineeringSoftware life cycle processes, 2008.
[28] J. M. Juran, F. M. Gryna, Juran’s Quality Control Handbook, McGraw-Hill, 1988.
[29] S. Kanmani, V. R. Uthariaraj, V. Sankaranarayanan, P. Thambidurai,Object-oriented software fault prediction using neural networks, Infor-mation and Software Technology 49 (2007) 483–492.
[30] T. M. Khoshgoftaar, N. Seliya, Comparative assessment of software
18

quality classification techniques: An empirical case study, EmpiricalSoftware Engineering 9 (2004) 229–257.
[31] H. K. Kim, A study on evaluation of component metric suites, volume3481 of Lecture Notes in Computer Science, Springer-Verlag Berlin,Berlin, pp. 62–70.
[32] B. Kitchenham, Procedures for performing systematic reviews, Tech-nical Report TR/SE-0401 and 0400011T.1, Keele University, UK andNICTA, AU, 2004.
[33] B. Kitchenham, S. Charters, Guidelines for performing systematic litera-ture reviews in software engineering, Technical Report EBSE 2007-001,Keele University, UK, 2007.
[34] B. Kitchenham, Whats up with software metrics? A preliminary map-ping study, Journal of Systems and Software 83 (2010) 37–51.
[35] A. G. Koru, K. El Emam, D. S. Zhang, H. F. Liu, D. Mathew, Theoryof relative defect proneness, Empirical Software Engineering 13 (2008)473–498.
[36] J. R. Landis, G. G. Koch, MEASUREMENT OF OBSERVER AGREE-MENT FOR CATEGORICAL DATA, Biometrics 33 (1977) 159–174.
[37] Y. S. Lee, B. S. Liang, S. F. Wu, F. J. Wang, Measuring the coupling andcohesion of an object-oriented program based on information flow, in:Proc. International Conference on Software Quality, Maribor, Slovenia,pp. 81–90.
[38] S. Lessmann, B. Baesens, C. Mues, S. Pietsch, Benchmarking classifica-tion models for software defect prediction: A proposed framework andnovel findings, Ieee Transactions on Software Engineering 34 (2008)485–496.
[39] W. Li, S. Henry, Maintenance metrics for the object oriented paradigm,in: Software Metrics Symposium, 1993. Proceedings., First Interna-tional, pp. 52–60.
[40] W. Li, S. Henry, Object-oriented metrics that predict maintainability,Journal of Systems and Software 23 (1993) 111–122.
[41] W. Li, Another metric suite for object-oriented programming, Journalof Systems and Software 44 (1998) 155–162.
[42] M. Lorenz, J. Kidd, Object-Oriented Software Metrics, Prentice Hall,Englewood Cliffs, NJ, 1994.
[43] R. C. Martin, Agile Software Development, Principles, Patterns, andPractices, Prentice Hall, 2002.
[44] T. J. McCabe, A Complexity Measure, Software Engineering, IEEETransactions on SE-2 (1976) 308–320.
[45] M. Petticrew, H. Roberts, Systematic reviews in the social sciences. Apractical guide, European Psychologist 11 (2006) 244–245.
[46] EQ-Mine: Predicting short-term defects for software evolution, Funda-mental Approaches to Software Engineering (2007) 12–26.
[47] J. Rosenberg, Some misconceptions about lines of code, METRICS ’97Proceedings of the 4th International Symposium on Software Metrics(1997) 137 – 142.
[48] M. Staples, M. Niazi, Experiences using systematic review guidelines,Journal of Systems and Software 80 (2007) 1425–1437.
[49] D. P. Tegarden, S. D. Sheetz, D. E. Monarchi, A SOFTWARE COM-PLEXITY MODEL OF OBJECT-ORIENTED SYSTEMS, DecisionSupport Systems 13 (1995) 241–262.
[50] M. Unterkalmsteiner, T. Gorschek, A. Islam, C. Cheng, R. Per-madi, R. Feldt, Evaluation and Measurement of Software ProcessImprovement-A Systematic Literature Review, IEEE Transactions onSoftware Engineering X (2011) 1–29.
Systematic review references
[51] F. B. E. Abreu, W. Melo, F. Brito e Abreu, Evaluating the impact ofObject-Oriented design on software quality, Proceedings of the 3rd In-ternational Software Metrics Symposium (1996) 90–99 189.
[52] A. Abubakar, J. AlGhamdi, M. Ahmed, Can cohesion predict fault den-sity?, International Conference on Computer Systems and Applications,IEEE Computer Society, pp. 889–892.
[53] K. K. Aggarwal, Y. Singh, A. Kaur, R. Malhotra, Empirical analysis forinvestigating the effect of object-oriented metrics on fault proneness: Areplicated case study, Software Process Improvement and Practice 14(2009) 39–62.
[54] K. K. Aggarwal, Y. S. And, A. K. And, R. Malhotra, Y. Singh, A. Kaur,Investigating effect of Design Metrics on Fault Proneness in Object-Oriented Systems, Journal of Object Technology 6 (2007) 127–141.
[55] J. Al Dallal, Improving the applicability of object-oriented class cohe-sion metrics, Information and Software Technology 53 (2011) 914–928.
[56] J. Al Dallal, L. C. Briand, An object-oriented high-level design-basedclass cohesion metric, Information and Software Technology 52 (2010)1346–1361.
[57] M. Alshayeb, W. Li, An empirical validation of object-oriented met-rics in two different iterative software processes, Ieee Transactions onSoftware Engineering 29 (2003) 1043–1049.
[58] M. D. Ambros, M. Lanza, R. Robbes, M. D’Ambros, On the relationshipbetween change coupling and software defects, Working Conference onReverse Engineering (2009) 135 – 144.
[59] C. Andersson, P. Runeson, A Replicated Quantitative Analysis of FaultDistributions in Complex Software Systems, IEEE Transactions on Soft-ware Engineering 33 (2007) 273–286.
[60] E. Arisholm, L. C. Briand, E. B. Johannessen, A systematic and compre-hensive investigation of methods to build and evaluate fault predictionmodels, Journal of Systems and Software 83 (2010) 2–17.
[61] A. Bacchelli, M. D’Ambros, M. Lanza, Are popular classes more defectprone?, Proceedings of FASE 2010 (13th International Conference onFundamental Approaches to Software Engineering) (2010) 59–73.
[62] V. R. Basili, L. C. Briand, W. L. Melo, A validation of object-orienteddesign metrics as quality indicators, Ieee Transactions on Software En-gineering 22 (1996) 751–761.
[63] A. B. Binkley, S. R. Schach, S. O. C. Ieee Comp, Validation of the cou-pling dependency metric as a predictor of run-time failures and main-tenance measures, International Conference on Software Engineering,IEEE Computer Society, pp. 452–455.
[64] A. B. Binkley, S. R. Schach, Prediction of run-time failures using staticproduct quality metrics, Software Quality Journal 7 (1998) 141–147.
[65] L. C. Briand, J. Daly, V. Porter, J. Wust, Predicting fault-prone classeswith design measures in object-oriented systems, Proceedings of theInternational Symposium on Software Reliability Engineering ISSRE(1998) (1998) 334–343.
[66] L. C. Briand, J. Wust, J. W. Daly, D. V. Porter, Exploring the relation-ships between design measures and software quality in object-orientedsystems, Journal of Systems and Software 51 (2000) 245–273.
[67] L. L. C. Briand, J. Wust, H. Lounis, W. Jurgen, Replicated Case Studiesfor Investigating Quality Factors in Object-Oriented Designs, EmpiricalSoftware Engineering 6 (2001) 11–58.
[68] L. Briand, W. Melo, J. Wust, Assessing the applicability of fault-proneness models across object-oriented software projects, IEEE Trans-actions on Software Engineering 28 (2002) 706–720.
[69] L. Briand, J. Wust, S. Ikonomovski, H. Lounis, Investigating qualityfactors in object-oriented designs: an industrial case study, InternationalConference on Software Engineering (1999).
[70] L. Briand, P. Devanbu, W. Melo, An investigation into coupling mea-sures for C++, International Conference on Software Engineering, As-soc Computing Machinery, New York, pp. 412–421.
[71] L. C. Briand, J. Daly, V. Porter, J. Wuest, Comprehensive empirical val-idation of design measures for object-oriented systems, METRICS ’98Proceedings of the 5th International Symposium on Software Metrics(1998) 246 – 257.
[72] R. Burrows, F. C. Ferrari, A. Garcia, F. Taiani, An empirical evaluationof coupling metrics on aspect-oriented programs, Proceedings Interna-tional Conference on Software Engineering (2010) 53 – 58.
[73] B. Caglayan, A. Bener, S. Koch, Ieee, Merits of Using Repository Met-rics in Defect Prediction for Open Source Projects, 2009 ICSE Work-shop on Emerging Trends in Free/Libre/Open Source Software Researchand Development (2009) 31–36.
[74] M. Cartwright, M. Shepperd, An empirical investigation of an object-oriented software system, Ieee Transactions on Software Engineering26 (2000) 786–796.
[75] I. Chowdhury, M. Zulkernine, Using complexity, coupling, and cohe-sion metrics as early indicators of vulnerabilities, Journal of SystemsArchitecture 57 (2011) 294–313.
[76] M. D’Ambros, M. Lanza, R. Robbes, Evaluating defect prediction ap-proaches: a benchmark and an extensive comparison, Empirical Soft-ware Engineering (2011) 1–47.
[77] M. D’Ambros, M. Lanza, An extensive comparison of bug predictionapproaches, IEEE Working Conference on Mining Software Reposito-ries MSR 2010 (2010) 31–41.
19

[78] G. Denaro, L. Lavazza, M. Pezze, An empirical evaluation of object ori-ented metrics in industrial setting, The 5th CaberNet Plenary Workshop(2003).
[79] M. Eaddy, T. Zimmermann, K. D. Sherwood, V. Garg, G. C. Murphy,N. Nagappan, A. V. Aho, Do crosscutting concerns cause defects?, IeeeTransactions on Software Engineering 34 (2008) 497–515.
[80] K. E. El Emam, S. Benlarbi, N. Goel, S. N. Rai, The confounding effectof class size on the validity of object-oriented metrics, Ieee Transactionson Software Engineering 27 (2001) 630–650.
[81] K. El Emam, W. Melo, J. C. Machado, K. El, The prediction of faultyclasses using object-oriented design metrics, Journal of Systems andSoftware 56 (2001) 63–75.
[82] M. O. Elish, A. H. Al-Yafei, M. Al-Mulhem, Empirical comparison ofthree metrics suites for fault prediction in packages of object-orientedsystems: A case study of Eclipse, Advances in Engineering Software 42(2011) 852–859.
[83] M. English, C. Exton, I. Rigon, B. Cleary, Fault detection and predictionin an open-source software project, Proceedings of the 5th InternationalConference on Predictor Models in Software Engineering PROMISE 09(2009) (2009) 17:1–17:11.
[84] N. E. Fenton, N. Ohlsson, Quantitative analysis of faults and failures ina complex software system, Ieee Transactions on Software Engineering26 (2000) 797–814.
[85] J. Ferzund, S. N. Ahsan, F. Wotawa, Empirical Evaluation of Hunk Met-rics as Bug Predictors, volume 5891 of Lecture Notes in Computer Sci-ence, Springer, pp. 242–254.
[86] F. Fioravanti, P. Nesi, A study on fault-proneness detection of object-oriented systems, Proceedings Fifth European Conference on SoftwareMaintenance and Reengineering (2001) 121–130.
[87] B. Goel, Y. Singh, Empirical Investigation of Metrics for Fault Predic-tion on Object-Oriented Software, volume 131 of Studies in Computa-tional Intelligence, Canadian Center of Science and Education, pp. 255–265.
[88] T. L. Graves, A. F. Karr, J. S. Marron, H. Siy, Predicting fault incidenceusing software change history, Ieee Transactions on Software Engineer-ing 26 (2000) 653–661.
[89] T. Gyimothy, R. Ferenc, I. Siket, Empirical validation of object-orientedmetrics on open source software for fault prediction, Ieee Transactionson Software Engineering 31 (2005) 897–910.
[90] R. Harrison, S. Counsell, R. Nithi, Coupling metrics for object-orienteddesign, Software Metrics Symposium, 1998. Metrics 1998. Proceedings.Fifth International (1998) 150–157.
[91] A. E. Hassan, Predicting Faults Using the Complexity of Code Changes,International Conference on Software Engineering, IEEE Computer So-ciety, pp. 78–88.
[92] T. Holschuh, T. Zimmermann, M. Pauser, R. Premraj, K. Herzig,A. Zeller, S. Q. S. Ag, P. Markus, Predicting defects in SAP java code:An experience report, International Conference on Software Engineer-ing Companion Volume (2009) 172–181.
[93] T. Illes-Seifert, B. Paech, Exploring the relationship of a file’s historyand its fault-proneness: An empirical method and its application to opensource programs, Information and Software Technology 52 (2010) 539–558.
[94] A. Janes, M. Scotto, W. Pedrycz, B. Russo, M. Stefanovic, G. Succi,Identification of defect-prone classes in telecommunication softwaresystems using design metrics, Information Sciences 176 (2006) 3711–3734.
[95] Y. Jiang, B. Cukic, T. Menzies, Fault Prediction using Early LifecycleData, The 18th IEEE International Symposium on Software Reliability(ISSRE ’07) (2007) 237–246.
[96] Y. Jiang, B. Cukic, T. Menzies, N. Bartlow, B. Cuki, Comparing designand code metrics for software quality prediction, Proceedings of the4th international workshop on Predictor models in software engineeringPROMISE 08 (2008) 11 – 18.
[97] T. Kamiya, S. Kusumoto, K. Inoue, Prediction of fault-proneness at earlyphase in object-oriented development, Proceedings 2nd IEEE Interna-tional Symposium on ObjectOriented RealTime Distributed ComputingISORC99 (1999) 253–258.
[98] T. Kamiya, S. Kusumoto, K. Inoue, Y. Mohri, Empirical evaluation ofreuse sensitiveness of complexity metrics, Information and SoftwareTechnology 41 (1999) 297–305.
[99] A. Kaur, A. S. Brar, P. S. Sandhu, An empirical approach for softwarefault prediction, International Conference on Industrial and InformationSystems (ICIIS) (2010) 261–265.
[100] T. M. Khoshgoftaar, R. Q. Shan, E. B. Allen, I. C. S. Ieee ComputerSociety, Using product, process, and execution metrics to predict fault-prone software modules with classification trees, Fifth Ieee Interna-tional Symposium on High Assurance Systems Engineering, Proceed-ings, IEEE Computer Society, 2000.
[101] T. M. Khoshgoftaar, E. B. Allen, Empirical assessment of a softwaremetric: The information content of operators, Software Quality Journal9 (2001) 99–112.
[102] B. A. Kitchenham, L. M. Pickard, S. J. Linkman, Evaluation of somedesign metrics, Software engineering journal 5 (1990) 50 – 58.
[103] a. G. Koru, H. Liu, An investigation of the effect of module size on defectprediction using static measures, Proceedings of the 2005 workshop onPredictor models in software engineering - PROMISE ’05 (2005) 1–5.
[104] A. G. Koru, D. S. Zhang, K. El Emam, H. F. Liu, An Investigationinto the Functional Form of the Size-Defect Relationship for SoftwareModules, Ieee Transactions on Software Engineering 35 (2009) 293–304.
[105] S. Kpodjedo, F. Ricca, P. Galinier, Y. G. Gueheneuc, G. Antoniol, De-sign evolution metrics for defect prediction in object oriented systems,Empirical Software Engineering 16 (2011) 141–175.
[106] S. Kpodjedo, F. Ricca, G. Antoniol, P. Galinier, Evolution and searchbased metrics to improve defects prediction, Proceedings of the 2009 1stInternational Symposium on Search Based Software Engineering (2009)23–32.
[107] L. Layman, G. Kudrjavets, N. Nagappan, Iterative identification of fault-prone binaries using in-process metrics, in: Proceedings of the SecondACM-IEEE international symposium on Empirical software engineeringand measurement - ESEM ’08, ACM Press, New York, New York, USA,2008, p. 206.
[108] P. Li, J. Herbsleb, M. Shaw, Finding predictors of field defects for opensource software systems in commonly available data sources: A casestudy of openbsd, in: Software Metrics, 2005. 11th IEEE InternationalSymposium, IEEE, 2005, pp. 10–pp.
[109] A. Marcus, D. Poshyvanyk, R. Ferenc, Using the conceptual cohesionof classes for fault prediction in Object-Oriented systems, Ieee Transac-tions on Software Engineering 34 (2008) 287–300.
[110] S. Matsumoto, Y. Kamei, A. Monden, K.-i. Matsumoto, M. Nakamura,An analysis of developer metrics for fault prediction, PROMISE ’10Proceedings of the 6th International Conference on Predictive Modelsin Software Engineering (2010) 1.
[111] T. Menzies, J. Di Stefano, How good is your blind spot sampling pol-icy?, Eighth IEEE International Symposium on High Assurance SystemsEngineering, 2004. Proceedings. (2004) 129–138.
[112] T. Menzies, J. S. Di Stefano, M. Chapman, K. McGill, Metrics that mat-ter, 27th Annual Nasa Goddard/Ieee Software Engineering Workshop -Proceedings, IEEE Computer Society, 2003.
[113] T. Menzies, J. Greenwald, A. Frank, Data mining static code attributesto learn defect predictors, IEEE Transactions on Software Engineering33 (2007) 2–13.
[114] R. Moser, W. Pedrycz, G. Succi, Analysis of the Reliability of a Subsetof Change Metrics for Defect Prediction, Esem’08: Proceedings of the2008 Acm-Ieee International Symposium on Empirical Software Engi-neering and Measurement, ACM, 2008.
[115] R. Moser, W. Pedrycz, G. Succi, Acm, A Comparative Analysis of theEfficiency of Change Metrics and Static Code Attributes for Defect Pre-diction, Icse’08 Proceedings of the Thirtieth International Conferenceon Software Engineering, ACM, 2008.
[116] J. C. Munson, S. G. Elbaum, Code churn: A measure for estimating theimpact of code change, Proceedings - Ieee International Conference onSoftware Maintenance, Ieee Computer Soc, Los Alamitos, pp. 24–31.
[117] N. Nagappan, T. Ball, Acm, Use of relative code churn measures to pre-dict system defect density, International Conference on Software Engi-neering, IEEE Computer Society, pp. 284–292.
[118] N. Nagappan, B. Murphy, V. R. Basili, Acm, The Influence of Organiza-tional Structure on Software Quality: An Empirical Case Study, Icse’08Proceedings of the Thirtieth International Conference on Software En-gineering, ACM, 2008.
[119] N. Nagappan, T. Ball, Using Software Dependencies and Churn Met-
20

rics to Predict Field Failures: An Empirical Case Study, First Interna-tional Symposium on Empirical Software Engineering and Measurement(ESEM 2007) (2007) 364–373.
[120] N. Nagappan, T. Ball, B. Murphy, Using Historical In-Process and Prod-uct Metrics for Early Estimation of Software Failures, 2006 17th Inter-national Symposium on Software Reliability Engineering (2006) 62–74.
[121] N. Nagappan, T. Ball, A. Zeller, Mining metrics to predict componentfailures, Proceeding of the 28th international conference on Softwareengineering - ICSE ’06 (2006) 452.
[122] N. Nagappan, L. Williams, M. Vouk, J. Osborne, Early estimationof software quality using in-process testing metrics: a controlled casestudy, in: Proceedings of the third workshop on Software Quality, ACM,2005, pp. 1–7.
[123] N. Nagappan, A. Zeller, T. Zimmermann, K. Herzig, B. Murphy, ChangeBursts as Defect Predictors, Proceedings of the 21st IEEE InternationalSymposium on Software Reliability Engineering (ISSRE) (2010) 309–318.
[124] A. Nikora, J. Munson, Building high-quality software fault predictors,Software: Practice and Experience 36 (2006) 949–969.
[125] A. Nugroho, M. R. V. Chaudron, E. Arisholm, Assessing UML designmetrics for predicting fault-prone classes in a Java system, IEEE Work-ing Conference on Mining Software Repositories (2010) 21–30.
[126] A. Nugroho, B. Flaton, M. Chaudron, Empirical analysis of the relationbetween level of detail in UML models and defect density, Proceed-ings of the 11th International Conference on Model Driven EngineeringLanguages and Systems MODELS LNCS (2008) 600–614.
[127] N. Ohlsson, H. Alberg, Predicting fault-prone software modules in tele-phone switches, Ieee Transactions on Software Engineering 22 (1996)886–894.
[128] H. M. Olague, L. H. Etzkorn, S. Gholston, S. Quattlebaum, Empiricalvalidation of three software metrics suites to predict fault-proneness ofobject-oriented classes developed using highly iterative or agile softwaredevelopment processes, Ieee Transactions on Software Engineering 33(2007) 402–419.
[129] H. M. Olague, L. H. Etzkorn, S. L. Messimer, H. S. Delugach, An empir-ical validation of object-oriented class complexity metrics and their abil-ity to predict error-prone classes in highly iterative, or agile, software:a case study, Journal of Software Maintenance and Evolution-Researchand Practice 20 (2008) 171–197.
[130] T. J. Ostrand, E. J. Weyuker, R. M. Bell, Predicting the location andnumber of faults in large software systems, Ieee Transactions on Soft-ware Engineering 31 (2005) 340–355.
[131] T. J. Ostrand, E. J. Weyuker, R. M. Bell, Programmer-based fault pre-diction, PROMISE ’10 Proceedings of the 6th International Conferenceon Predictive Models in Software Engineering (2010) 1.
[132] G. Pai, B. Dugan, Empirical analysis of software fault content and faultproneness using Bayesian methods, IEEE Transactions on software En-gineering 33 (2007) 675–686.
[133] T.-S. Quah, Estimating software readiness using predictive models, In-formation Sciences 179 (2009) 430 – 445.
[134] Z. A. Rana, S. Shamail, M. M. Awais, Ineffectiveness of Use of SoftwareScience Metrics as Predictors of Defects in Object Oriented Software,2009 Wri World Congress on Software Engineering, Vol 4, Proceedings,IEEE Computer Society, 2009.
[135] A. Schroter, T. Zimmermann, R. Premraj, A. Zeller, If your bug data-base could talk, in: Proceedings of the 5th international symposium onempirical software engineering, volume 2, Citeseer, 2006, pp. 18–20.
[136] R. Shatnawi, W. Li, The effectiveness of software metrics in identifyingerror-prone classes in post-release software evolution process, Journalof Systems and Software 81 (2008) 1868–1882.
[137] Y. Singh, A. Kaur, R. Malhotra, Empirical validation of object-orientedmetrics for predicting fault proneness models, Software Quality Journal18 (2010) 3–35.
[138] R. Subramanyam, M. S. Krishnan, Empirical analysis of CK metrics forobject-oriented design complexity: Implications for software defects,Ieee Transactions on Software Engineering 29 (2003) 297–310.
[139] M. H. Tang, M. H. Kao, M. H. Chen, An empirical study on object-oriented metrics, in: Software Metrics Symposium, 1999. Proceedings.Sixth International, IEEE, pp. 242–249.
[140] M. Thongmak, P. Muenchaisri, Predicting faulty classes using designmetrics with discriminant analysis, Serp’03: Proceedings of the Interna-
tional Conference on Software Engineering Research and Practice, Vols1 and 2, ., 2003.
[141] P. Tomaszewski, L. Lundberg, H. k. Grahn, The accuracy of early faultprediction in modified code, in: Fifth Conference on Software Engineer-ing Research and Practice in Sweden (SERPS), p. 0.
[142] A. Tosun, B. Turhan, A. Bener, Validation of network measures as indi-cators of defective modules in software systems, Proceedings of the 5thInternational Conference on Predictor Models in Software Engineering- PROMISE ’09 (2009) 1.
[143] B. Turhan, T. Menzies, A. B. Bener, J. Di Stefano, On the relative valueof cross-company and within-company data for defect prediction, Em-pirical Software Engineering 14 (2009) 540–578.
[144] B. Ujhazi, R. Ferenc, D. Poshyvanyk, T. Gyimothy, B. Ujhazi, T. Gy-imothy, New Conceptual Coupling and cohesion metrics for object-oriented systems, Source Code Analysis and Manipulation SCAM 201010th IEEE Working Conference (2010) 33 – 42.
[145] D. Wahyudin, A. Schatten, D. Winkler, A. M. Tjoa, S. Biffl, Defect Pre-diction using Combined Product and Project Metrics A Case Study fromthe Open Source ”Apache” MyFaces Project Family, Proceedings of the34th Euromicro Conference on Software Engineering and Advanced Ap-plications, IEEE Computer Society, 2008.
[146] E. J. Weyuker, T. J. Ostrand, R. M. Bell, Do too many cooks spoil thebroth? Using the number of developers to enhance defect predictionmodels, Empirical Software Engineering 13 (2008) 539–559.
[147] E. J. Weyuker, T. J. Ostrand, R. M. Bell, Using Developer Information asa Factor for Fault Prediction, Third International Workshop on Predic-tor Models in Software Engineering (PROMISE’07: ICSE Workshops2007) (2007) 8–8.
[148] Z. Xu, X. Zheng, P. Guo, Empirically validating software metrics for riskprediction based on intelligent methods, Journal of Digital InformationManagement 5 (2007) 99 – 106.
[149] P. Yu, H. Muller, T. Systa, Predicting fault-proneness using OO metrics.An industrial case study, Proceedings of the Sixth European Conferenceon Software Maintenance and Reengineering (2002) 99–107.
[150] X. Yuan, T. Khoshgoftaar, E. Allen, K. Ganesan, An application offuzzy clustering to software quality prediction, Proceedings 3rd IEEESymposium on Application-Specific Systems and Software EngineeringTechnology (2000) 85–90.
[151] H. Y. Zhang, An Investigation of the Relationships between Lines ofCode and Defects, Proceedings - Ieee International Conference on Soft-ware Maintenance, IEEE Computer Society, pp. 274–283.
[152] M. Zhao, C. Wohlin, N. Ohlsson, M. Xie, A comparison between soft-ware design and code metrics for the prediction of software fault content,Information and Software Technology 40 (1998) 801–809.
[153] Y. M. Zhou, H. T. Leung, Empirical analysis of object-oriented designmetrics for predicting high and low severity faults, Ieee Transactions onSoftware Engineering 32 (2006) 771–789.
[154] Y. M. Zhou, B. Xu, H. Leung, B. W. Xua, On the ability of complexitymetrics to predict fault-prone classes in object-oriented systems, Journalof Systems and Software 83 (2010) 660–674.
[155] T. Zimmermann, N. Nagappan, Predicting defects using network analy-sis on dependency graphs, Proceedings of the 13th international confer-ence on Software engineering - ICSE ’08 (2008) 531.
[156] T. Zimmermann, R. Premraj, A. Zeller, Predicting Defects for Eclipse,Third International Workshop on Predictor Models in Software Engi-neering PROMISE07 ICSE Workshops 2007 (2007) 9.
Appendix A. Supplementary material
Extracted data from 106 primary studies and the final scoreof the quality assessment can be found in the online version ofthe article. The data is presented in tabular form and includesproperties describing the study (‘Title’, ‘Authors’, and ‘Yearof publication’), ten extracted properties (‘Metrics’, ‘Data setavailability’, ‘Data set size’, ‘Programming language’, ‘SDLC’,‘Researcher’, ‘Organization’, ‘Modeling technique’, ‘Depen-dent variable’ and ‘Dependent variable granularity’) and qualityassessment score (‘Quality’).
21

Appendix B. Quality checklist
Table B.6 shows the quality checklist used for the qualityassessment of primary studies and results for each question. Adetailed description of the quality checklist and analysis of theresults are presented in Section 3.5.
22

Table B.6: Quality checklist.ID Question Yes Partially No
Design1 Are the aims (research questions) clearly stated? 106 (100.0%) 0 (0.0%) 0 (0.0%)2 Was the sample size justified? 67 (63.2%) 12 (11.3%) 27 (25.5%)3 If the study involves assessment of prediction model/technique, is
model/technique clearly defined?75 (70.8%) 23 (21.7%) 8 (7.5%)
4 Are the metrics used in the study adequately measured (i.e. are themetrics likely to be valid and reliable)?
102 (96.2%) 4 (3.8%) 0 (0.0%)
5 Are the metrics used in the study fully defined? 91 (85.8%) 6 (5.7%) 9 (8.5%)6 Are the metrics used in the study the most relevant ones for answering
the research questions?102 (96.2%) 3 (2.8%) 1 (0.9%)
Conduct7 Are the data collection methods adequately described? 76 (71.7%) 25 (23.6%) 5 (4.7%)
Analysis8 Were the data sets adequately described? 56 (52.8%) 40 (37.7%) 10 (9.4%)9 Are the statistical methods described? 55 (51.9%) 46 (43.4%) 5 (4.7%)10 Are the statistical methods justified? 98 (92.5%) 7 (6.6%) 1 (0.9%)11 Is the purpose of the analysis clear? 102 (96.2%) 4 (3.8%) 0 (0.0%)12 Are scoring systems (performance evaluation metrics/techniques) de-
scribed?65 (61.3%) 39 (36.8%) 2 (1.9%)
13 Were side effects reported? 55 (51.9%) 46 (43.4%) 5 (4.7%)Conclusion
14 Are all study questions answered? 100 (94.3%) 6 (5.7%) 0 (0.0%)15 Are negative findings presented? 45 (42.5%) 59 (55.7%) 2 (1.9%)16 Are null findings interpreted? (I.e. has the possibility that sample size
is too small been considered?)46 (43.4%) 53 (50.0%) 7 (6.6%)
17 Does the study discuss how the results add to the literature? 75 (70.8%) 28 (26.4%) 3 (2.8%)18 Does the report have implications for practice? 93 (87.7%) 13 (12.3%) 0 (0.0%)19 Do the researchers explain the consequences of any problems with the
validity/reliability of their measures?52 (49.1%) 52(49.1%) 2 (1.9%)
20 Is the study repeatable? Are public data sets used? 22 (20.8%) 22 (20.8%) 62 (58.5%)
Appendix C. Metrics
The most commonly used metrics in the selected studies are presented in Table C.7. The metrics were selected on the basisof the number of appearances in the studies. We excluded metrics that were only validated in the studies in which they werepresented. Some metrics made it to the list in order to make a complete list of metrics belonging to the same suite and to make aclear distinction between used and unused metrics.
Table C.7: Metrics.
Author Metric Description Used inAbreu and Carapuca [1], Abreuet al. [51]
AHF Attribute Hiding Factor [51, 128, 82]
Abreu and Carapuca [1], Abreuet al. [51]
AIF Attribute Inheritance Factor [51, 128, 82]
Abreu and Carapuca [1], Abreuet al. [51]
COF Coupling Factor [51]
Abreu and Carapuca [1], Abreuet al. [51]
MHF Method Hiding Factor [51, 128, 82]
Abreu and Carapuca [1], Abreuet al. [51]
MIF Method Interface Factor [51, 128, 82]
Abreu and Carapuca [1], Abreuet al. [51]
POF Polymorphism Factor [51]
Al Dallal and Briand [56] SCC Similarity-based Class Cohesion [56, 55]Bansiya and Davis [3] ANA Avgrage Number of Ancestors [128]Bansiya and Davis [3] CAM Cohesion Among Methods [128, 56, 55]Bansiya and Davis [3] CIS Class Interface Size [128]
23

Table C.7: Metrics.
Author Metric Description Used inBansiya and Davis [3] DAM Data Accesss Metric [128]Bansiya and Davis [3] DCC Direct Class Coupling [128]Bansiya and Davis [3] DSC Design size in classes /
Bansiya and Davis [3] MFA Measure of Functional Abstraction [128]Bansiya and Davis [3] MOA Measure of Aggregation [128]Bansiya and Davis [3] NOH Number of hierarchies /
Bansiya and Davis [3] NOM Number of Methods [128, 94, 156, 58, 110, 61, 153, 77, 76, 136]Bansiya and Davis [3] NOP Number of polymorphic methods /
Bieman and Kang [5] LCC Loose class cohesion [71, 65, 69, 66, 67, 52, 109, 53, 56, 55]Bieman and Kang [5] TCC Tight class cohesion [71, 65, 69, 66, 67, 52, 109, 53, 56, 55]Briand et al. [70] ACAIC [70, 71, 65, 69, 66, 67, 8, 80, 81, 54, 53]Briand et al. [70] ACMIC [70, 71, 65, 69, 66, 67, 8, 80, 81, 54, 53]Briand et al. [70] AMMIC [70, 71, 65, 69, 66, 67, 54, 53]Briand et al. [70] Coh A variation on LCOM5 [71, 65, 69, 66, 67, 109, 56]Briand et al. [70] DCAEC [70, 71, 65, 69, 66, 67, 8, 80, 81, 54, 53]Briand et al. [70] DCMEC [70, 71, 65, 69, 66, 67, 8, 80, 81, 54, 53]Briand et al. [70] DMMEC [70, 71, 65, 69, 66, 67, 54, 53]Briand et al. [70] FCAEC [70, 71, 65, 69, 66, 67, 54, 53]Briand et al. [70] FCMEC [70, 71, 65, 69, 66, 67, 54, 53]Briand et al. [70] FMMEC [70, 71, 65, 69, 66, 67, 54, 53]Briand et al. [70] IFCAIC [70, 71, 65, 69, 66, 67, 54]Briand et al. [70] IFCMIC [70, 71, 65, 69, 66, 67, 80, 54]Briand et al. [70] IFMMIC [70, 71, 65, 69, 66, 67, 54]Briand et al. [70] OCAEC [70, 71, 65, 69, 66, 67, 81, 54, 53]Briand et al. [70] OCAIC [70, 71, 65, 69, 66, 67, 8, 81, 54, 53]Briand et al. [70] OCMEC [70, 71, 65, 69, 66, 67, 8, 81, 54, 53, 83]Briand et al. [70] OCMIC [70, 71, 65, 69, 66, 67, 8, 81, 54, 53]Briand et al. [70] OMMEC [70, 71, 65, 69, 66, 67, 54, 53]Briand et al. [70] OMMIC [70, 71, 65, 69, 66, 67, 54, 53]Cartwright and Shepperd [74] ATTRIB Attributes [74, 8]Cartwright and Shepperd [74] DELS Deletes [74, 8]Cartwright and Shepperd [74] EVNT Events [74, 8]Cartwright and Shepperd [74] READS Reads [74, 8]Cartwright and Shepperd [74] RWD Read/write/deletes [74, 8]Cartwright and Shepperd [74] STATES States [74, 8]Cartwright and Shepperd [74] WRITES Writes [74, 8]Chidamber and Kemerer [12, 13] CBO Coupling between object classes 48 studiesChidamber and Kemerer [12, 13] DIT Depth of inheritance tree 52 studiesChidamber and Kemerer [12, 13] LCOM Lack of cohesion in methods 50 studiesChidamber and Kemerer[13], Briand et al. [66, 67]
LCOM2 Lack of cohesion in methods [69, 55, 109, 105, 71, 54, 53, 86, 56, 67, 66, 52, 65,144]
Chidamber and Kemerer [12, 13] NOC Number of children 53 studiesChidamber and Kemerer [13] NTM Number of trivial methods [129, 154]Chidamber and Kemerer [12, 13] RFC Response for a class 51 studiesChidamber and Kemerer [12, 13] WMC Weighted methods per class 44 studiesEtzkorn et al. [17], Tang et al. [139] AMC Average method complexity [129, 139, 154, 133]Graves et al. [88] Past faults Number of past faults [88, 100, 150, 108, 130, 114, 115, 146, 60, 110]Graves et al. [88] Changes Number of times a module has been changed [88, 100, 108, 120, 135, 119, 114, 115, 58, 73, 60, 61,
77, 93, 110, 76]Graves et al. [88] Age Age of a module [88, 117, 130, 114, 115, 146, 61, 77, 110, 76]Graves et al. [88] Organization Organization [88, 118]Graves et al. [88] Change set Number of modules changed together with
the module[88, 114, 115, 60, 61, 77, 93, 76]
Halstead [24] N1 Total number of operators [116, 88, 101, 112, 111, 108, 113, 148, 96, 134, 142,124]
Halstead [24] N2 Total number of operands [116, 88, 101, 112, 111, 108, 113, 148, 96, 134, 142,124]
Halstead [24] η1 Number of unique operators [116, 88, 101, 112, 111, 108, 113, 148, 96, 134, 142,124]
Halstead [24] η2 Number of unique operands [116, 88, 101, 112, 111, 108, 113, 148, 96, 134, 142,124]
Henderson-Sellers [25] AID Average inheritance depth of a class [71, 65, 66, 67, 53, 144]Henderson-Sellers [25] LCOM1 Lack of cohesion in methods [55, 105, 54, 53, 109, 56, 67, 71, 66, 52, 69, 65, 86,
144]Henderson-Sellers [25] LCOM5 Lack of cohesion in methods [144, 55, 71, 65, 66, 67, 52, 69, 109, 105]Hitz and Montazeri [26] Co Connectivity [69, 71, 65, 109, 66, 67, 53, 56]
24

Table C.7: Metrics.
Author Metric Description Used inHitz and Montazeri [26] LCOM3 Lack of cohesion in methods [55, 69, 53, 71, 109, 65, 67, 56, 66, 52, 144]Hitz and Montazeri [26] LCOM4 Lack of cohesion in methods [55, 71, 69, 53, 66, 67, 109, 52, 65]Lee et al. [37] ICH Information-flow-based cohesion [71, 65, 66, 69, 67, 86, 53, 144]Lee et al. [37] ICP Information-flow-based coupling [71, 65, 66, 69, 67, 86, 53, 144]Lee et al. [37] IH-ICP Information-flow-based inheritance cou-
pling[71, 65, 66, 53, 69, 67]
Lee et al. [37] NIH-ICP Information-flow-based non-inheritancecoupling
[66, 71, 65, 67, 69, 53]
Li [41] CMC Class method complexity [94]Li [41] CTA Coupling through abstract data type [136, 57, 94, 129]Li [41] CTM Coupling through message passing [136, 57, 94, 129, 108]Li [41] NAC Number of ancestor [94]Li [41] NDC Number of descendent [94]Li [41] NLM Number of local methods [154, 57, 94, 129, 136]Li and Henry [40, 39] DAC Data abstraction coupling [71, 67, 53, 69, 65, 66, 90, 138]Li and Henry [40, 39] DAC1 Data abstraction coupling [53]Li and Henry [40, 39] MPC Message passing coupling [71, 69, 53, 67, 65, 66, 92, 138, 60]Lorenz and Kidd [42] NCM Number of class methods [129, 154]Lorenz and Kidd [42] NIM Number of instance methods [97, 129, 154]Lorenz and Kidd [42] NMA Number of methods added [67, 133, 53, 66, 71, 65, 80, 128]Lorenz and Kidd [42] NMI Number of methods inherited [71, 53, 65, 66, 144, 67]Lorenz and Kidd [42] NMO Number of methods overridden [53, 67, 71, 66, 65, 80, 128]Lorenz and Kidd [42] NOA Number of attributes [140, 136, 85, 53, 61, 71, 65, 66, 67, 144, 58, 77, 76]Lorenz and Kidd [42] NOAM Number of added methods [136]Lorenz and Kidd [42] NOO Number of operations [136]Lorenz and Kidd [42] NOOM Number of overridden methods [136]Lorenz and Kidd [42] NOP Number of parents [133, 71, 53, 65, 66, 67]Lorenz and Kidd [42] NPAVG Average number of parameters per method [80, 128]Lorenz and Kidd [42] SIX Specialization index [71, 65, 53, 67, 66, 53, 80]Marcus et al. [109] C3 Conceptual cohesion of Classes [109, 144]McCabe [44] CC McCabe’s Cyclomatic Complexity [127, 152, 64, 84, 112, 111, 141, 120, 121, 113, 156,
87, 128, 129, 145, 155, 92, 133, 142, 110, 75, 154,88, 148]
Munson and Elbaum [116] Delta Code delta [116, 117, 120, 119, 107, 114, 115, 60, 77, 110, 76]Munson and Elbaum [116] Churn Code churn [116, 100, 150, 108, 117, 124, 119, 107, 114, 115, 73,
77, 110, 123, 76]Munson and Elbaum [116] Change
requestChange request [116, 100, 60]
Munson and Elbaum [116] Developer Number of developers [116, 88, 100, 150, 108, 120, 135, 147, 114, 115, 118,146, 73, 60, 61, 77, 93, 110, 131, 123, 76]
Tegarden et al. [49] [66, 67] CLD Class-to-leaf depth [71, 53, 66, 67, 65]Tegarden et al. [49] [66, 67] NOA Number of ancestors [53, 71, 67, 66, 65]Tegarden et al. [49] [66, 67] NOD Number of descendants [63, 53, 71, 67, 66, 65]
LOC Lines of Code 59 studies
25