software engineering it 0301 semester v 3(1).pdf · • this context‐level dfd is next...
TRANSCRIPT

SOFTWARE ENGINEERING IT 0301
Semester V B.Nithya,G.Lakshmi Priya
Asst ProfessorSRM University, Kattankulathur
1School of Computing, Department of IT
Analysis Modeling

Cardinality and Modality
• Cardinality is the specification of the number of occurrences of one [object] that can be related to the number of occurrences of another [object].
• Cardinality is usually expressed as simply 'one' or 'many.‘
• Cardinality defines “the maximum number of objects that can participate in a relationship”.
• It does not, however, provide an indication of whether or not a particular data object must participate in the relationship. To specify this information, the data model adds modality to the object/relationship pair.

Modality
• The modality of a relationship is 0 if there is no explicit need for the relationship to occur or the relationship is optional.
• The modality is 1 if an occurrence of the relationship is mandatory.
Example• Consider software that is used by a local telephone company to
process requests for field service. A customer indicates that there is a problem. If the problem is diagnosed as relatively simple, a single repair action occurs. However, if the problem is complex, multiple repair actions may be required.
• Following figure illustrates the relationship, cardinality, and modality between the data objects customer and repair action.

Cardinality and Modality
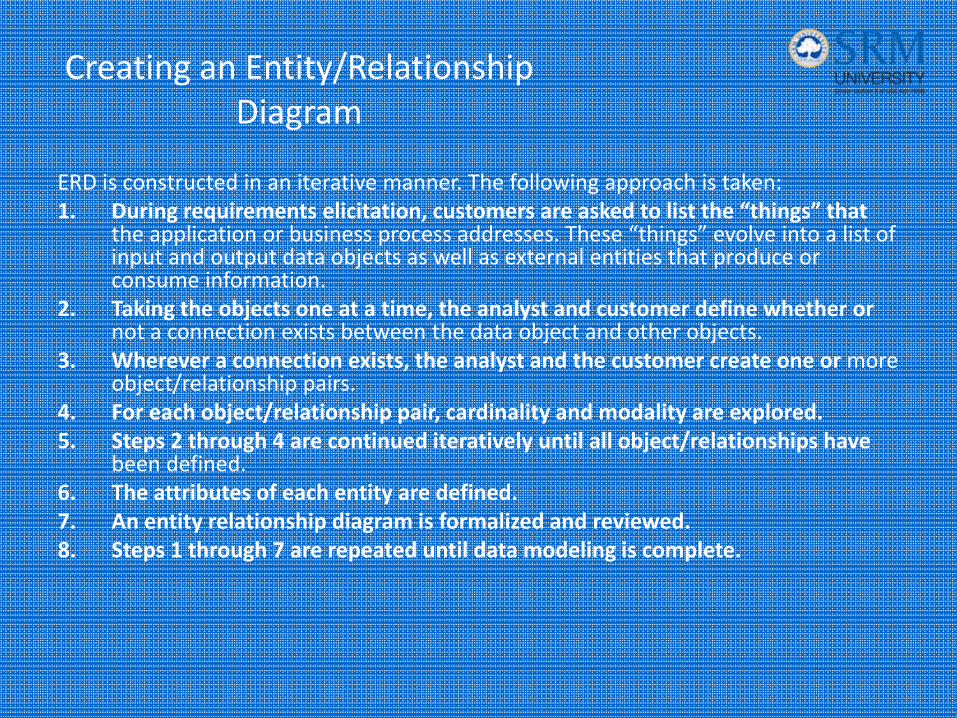
Creating an Entity/Relationship Diagram
ERD is constructed in an iterative manner. The following approach is taken:1. During requirements elicitation, customers are asked to list the “things” that
the application or business process addresses. These “things” evolve into a list of input and output data objects as well as external entities that produce or consume information.
2. Taking the objects one at a time, the analyst and customer define whether or not a connection exists between the data object and other objects.
3. Wherever a connection exists, the analyst and the customer create one or more object/relationship pairs.
4. For each object/relationship pair, cardinality and modality are explored.5. Steps 2 through 4 are continued iteratively until all object/relationships have
been defined. 6. The attributes of each entity are defined.7. An entity relationship diagram is formalized and reviewed.8. Steps 1 through 7 are repeated until data modeling is complete.

Data Flow Diagram
• A data flow diagram is a graphical representation that depicts information flow and the transforms that are applied as data move from input to output.
• The data flow diagram may be used to represent a system or software at any level of abstraction.
• DFD provides a mechanism for functional modeling as well as information flow modeling.
• A DFD shows what kinds of data will be input to and output from the system, where the data will come from and go to, and where the data will be stored.
• It does not show information about the timing of processes, or information about whether processes will operate in sequence or in parallel (which is shown on a flowchart).

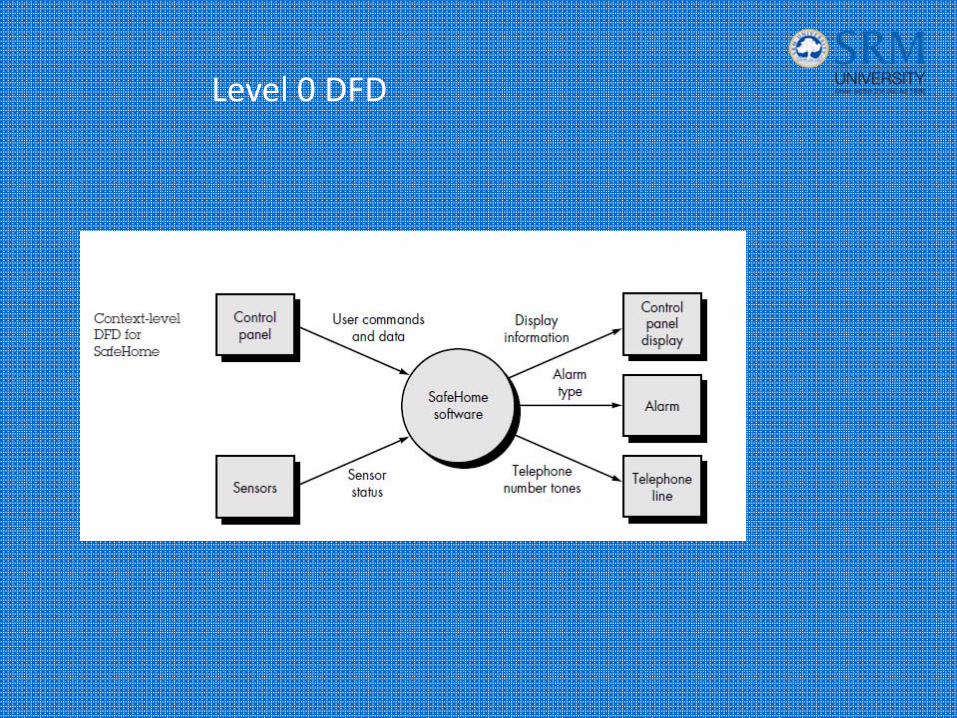
Context Level Data Flow Diagram
• Shows the interaction between the system and external agents
• The system's interactions with the outside world are modelled purely in terms of data flows across the system boundary.
• Shows the entire system as a single process, and gives no clues as to its internal organization.

Level 0 DFD
• This context‐level DFD is next "exploded", to produce a Level 0 DFD that shows some of the detail of the system being modeled.
• The Level 0 DFD shows how the system is divided into sub‐systems (processes)
• It also identifies internal data stores that must be present in order for the system to do its job
• It shows the flow of data between the various parts of the system.
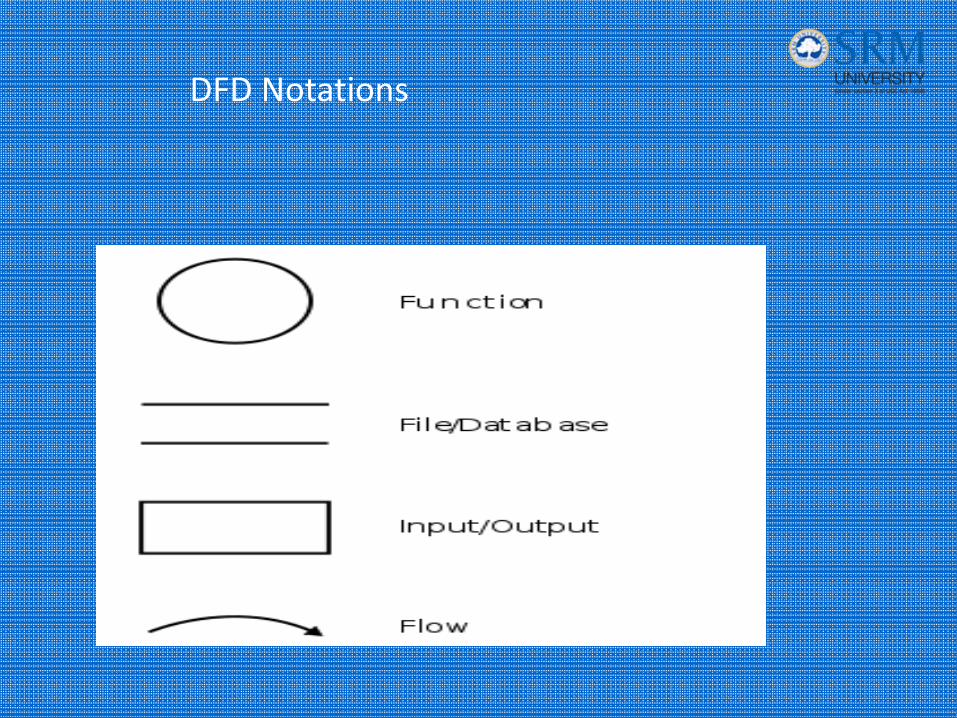
DFD Notations
DFD Notations
• A circle (bubble) represents a process or transform that is applied to data (or control).
• An arrow represents one or more data items (data objects). – All arrows on a data flow diagram should be labeled.
• The double line represents a data store—stored information that is used by the software.

Data Flow Diagram
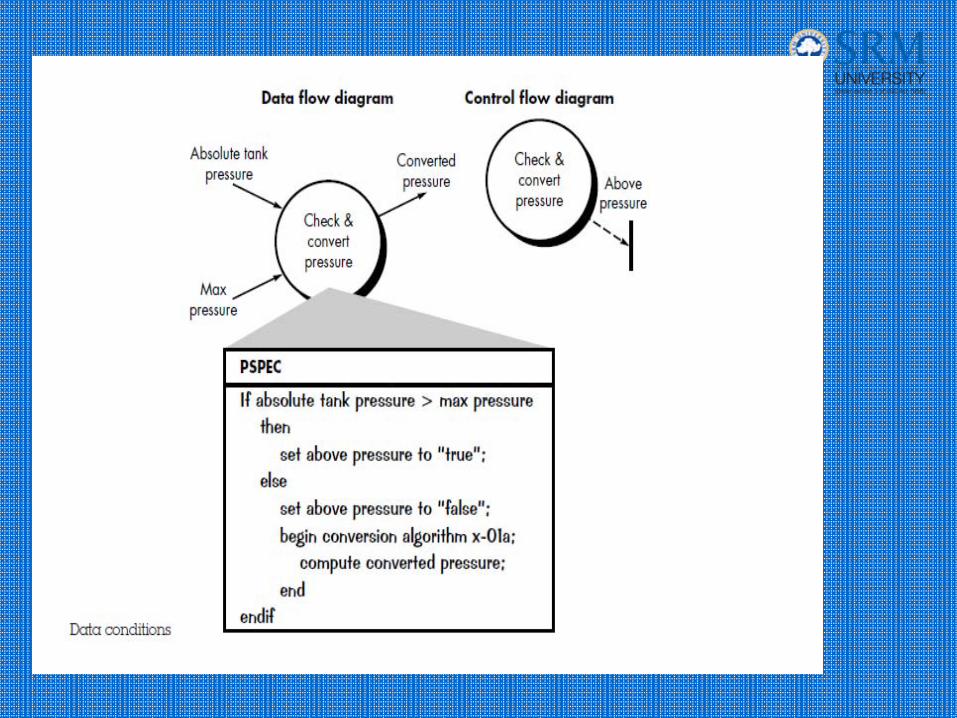
PSPEC
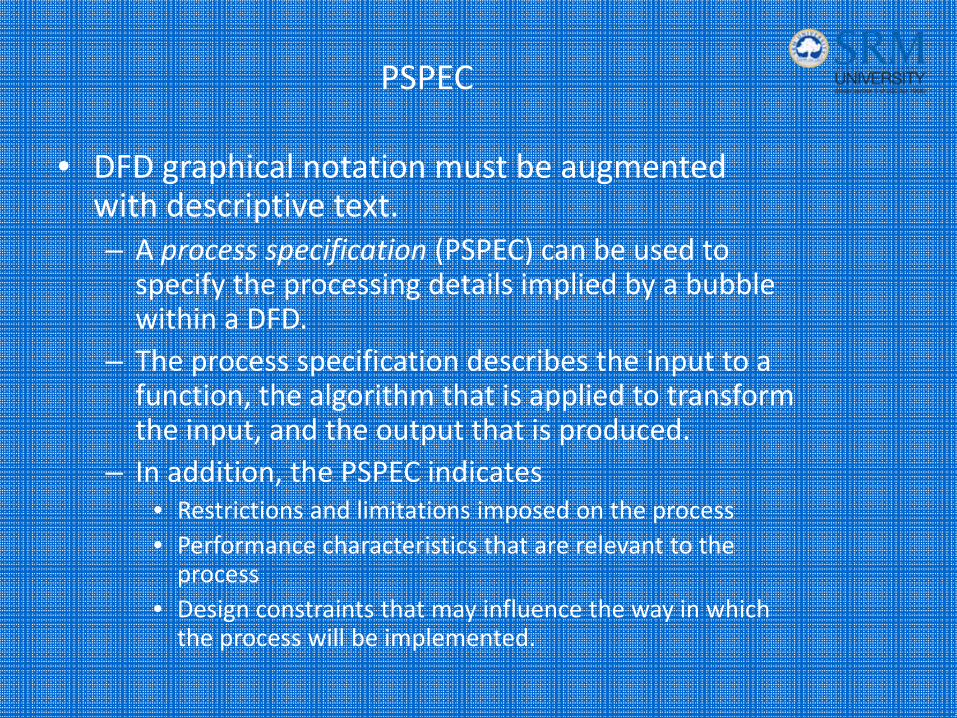
• DFD graphical notation must be augmented with descriptive text. – A process specification (PSPEC) can be used to specify the processing details implied by a bubble within a DFD.
– The process specification describes the input to a function, the algorithm that is applied to transform the input, and the output that is produced.
– In addition, the PSPEC indicates • Restrictions and limitations imposed on the process • Performance characteristics that are relevant to the process
• Design constraints that may influence the way in which the process will be implemented.
Ward and Mellor Extensions
• Ward and Mellor extend basic structured analysis notation to accommodate the following demands imposed by a real‐time system:– Information flow is gathered or produced on a time‐continuous basis.
– Control information is passed throughout the system and associated control processing.

Limitations on Conventional Notation
• Conventional data flow notation does not make a distinction between discrete data and time‐continuous data
• To adequately model a real‐time system, structured analysis notation must be available for time continuous data and event processing.
• The double headed arrow is used to represent time‐continuous flow and a single headed arrow is used to indicate discrete data flow.

• A specialized notation for representing event flows and control processing has been developed.– Data flow is represented using a solid arrow.
– Control flow is represented using a dashed arrow.
– A process that handles only control flows, called a control process, is represented using a dashed bubble.
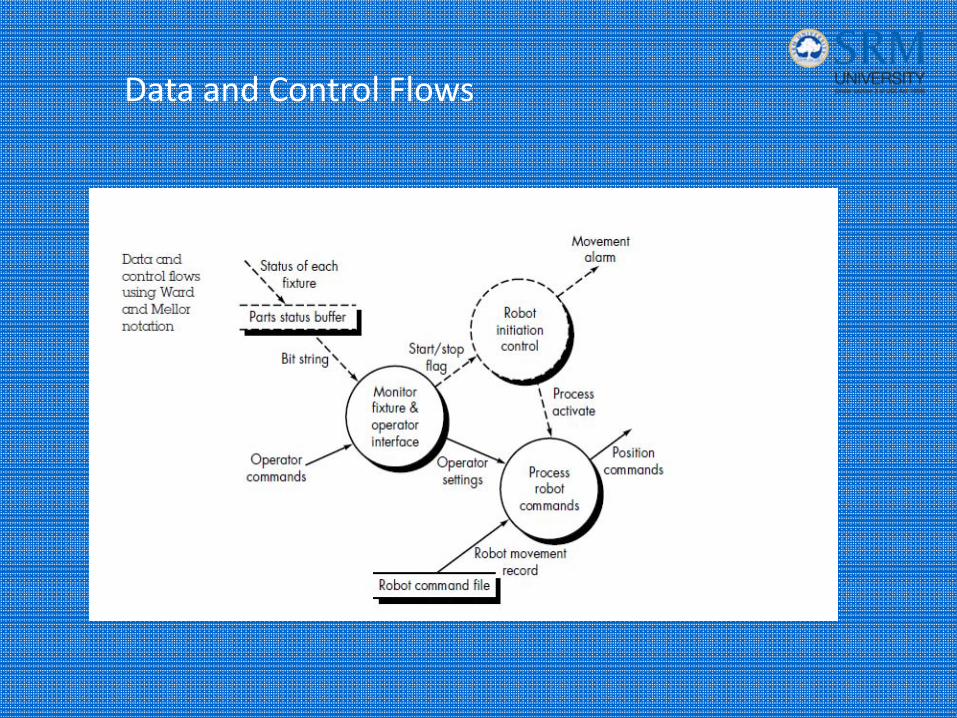
Data and Control Flows

Hatley and Pirbhai Extensions
• The CFD contains the same processes as the DFD, but shows control flow, rather than data flow.
• Instead of representing control processes directly within the flow model, a notational reference (a solid bar) to a control specification (CSPEC) is used.
• Data flow diagrams are used to represent data and the processes that manipulate it.
• Control flow diagrams show how events flow among processes and illustrate those external events that cause various processes to be activated.
• The process model is "connected" to the control model through data conditions.
• The control model is "connected" to the process model through process activation information contained in the CSPEC.

Data Models and Control Models

Guidelines for DFD
1. The level 0 data flow diagram should depict the software/system as a single bubble;
2. Primary input and output should be carefully noted;3. Refinement should begin by isolating candidate
processes, data objects, and stores to be represented at the next level;
4. All arrows and bubbles should be labeled with meaningful names;
5. Information flow continuity must be maintained from level to level
6. One bubble at a time should be refined.

Sample DFD and CFD
SafeHome software enables the homeowner to configure the security system when it isinstalled, monitors all sensors connected to the security system, and interacts with the
homeownerthrough a keypad and function keys contained in the SafeHome control panel
During installation, the SafeHome control panel is used to "program" and configure thesystem. Each sensor is assigned a number and type, a master password is programmed forarming and disarming the system, and telephone number(s) are input for dialing when asensor event occurs.
When a sensor event is recognized, the software invokes an audible alarm attached tothe system. After a delay time that is specified by the homeowner during system
configurationactivities, the software dials a telephone number of a monitoring service, provides
informationabout the location, reporting the nature of the event that has been detected. Thetelephone number will be redialed every 20 seconds until telephone connection is
obtained.
All interaction with SafeHome is managed by a user‐interaction subsystem that readsinput provided through the keypad and function keys, displays prompting messages on theLCD display, displays system status information on the LCD display.
Level 0 DFD

Level 1 DFD
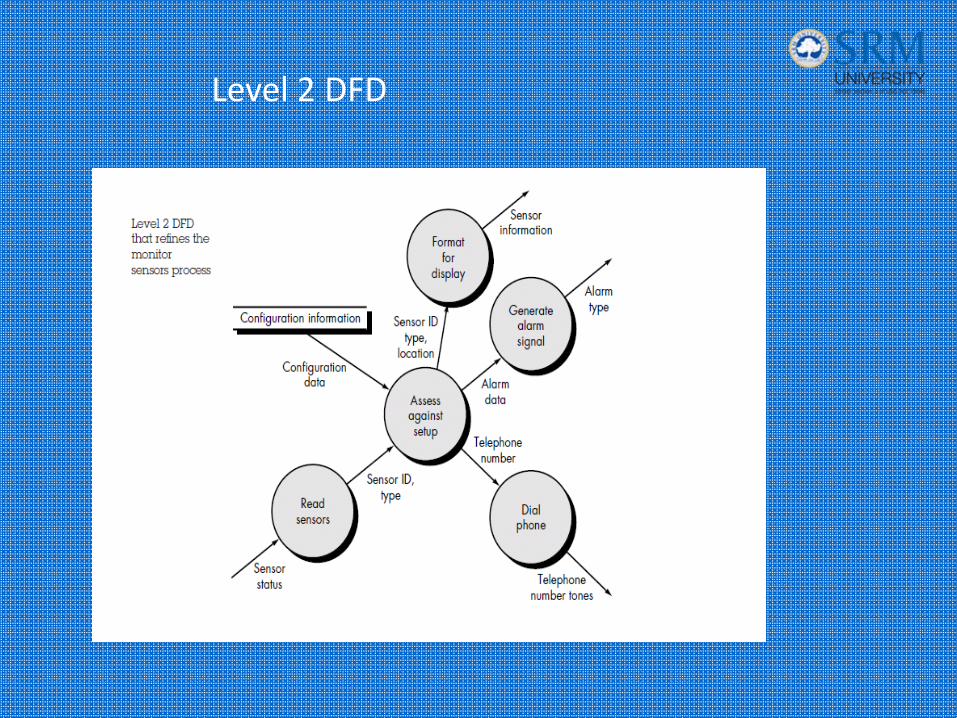
Level 2 DFD

Guidelines for CFD
• Remove all data flow arrows in DFD. • Add events and control items (dashed arrows) to the diagram• Add a "window" (a vertical bar) into the control specification
• Event Selection• An event or control item is implemented as a
– Boolean value (e.g., true or false, on or off, 1 or 0) – A discrete list of conditions (empty, jammed, full).
• To select potential candidate events, the following guidelines are suggested:– List all sensors that are "read" by the software.– List all interrupt conditions.– List all "switches" that are actuated by an operator.– List all data conditions.– Review all "control items" as possible CSPEC inputs/outputs.– Describe the behavior of a system by identifying its states; identify
how each state is reached and define the transitions between states.
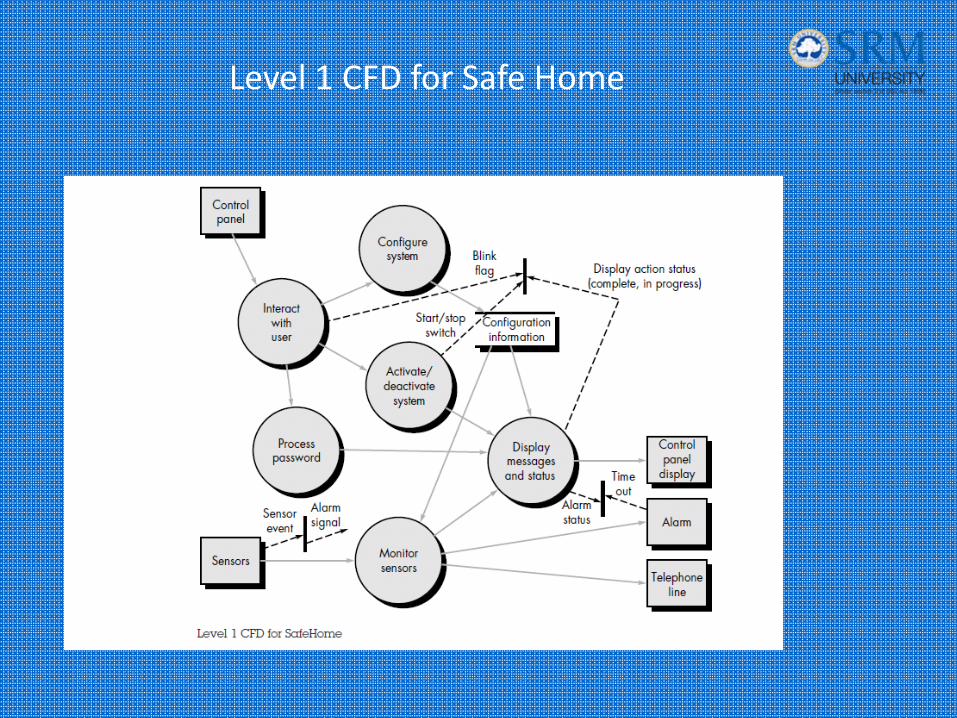
Level 1 CFD for Safe Home

bibliography
• Software Engineering, Roger Pressman, Fifth Edition
• Software Engineering, Ian Sommerville, Sixth Edition
School of Computing, Department 29
Review questions
• How is cardinality different from Modality?
• What is a DFD?
• What are the notations used in a DFD?
• What is a ER diagram used for?
School of Computing, Department 30