software cost and schedule estimation
DESCRIPTION
Software Cost and Schedule Estimation. Dr. Harry R. Erwin University of Sunderland . The Problems. Predicting software cost Predicting software schedule Controlling software risk. Criteria for a Good Model. - PowerPoint PPT PresentationTRANSCRIPT

Software Cost and Schedule Estimation
Dr. Harry R. Erwin
University of Sunderland
<http://osiris.sunderland.ac.uk/~cs0her/>
<mailto:[email protected]>
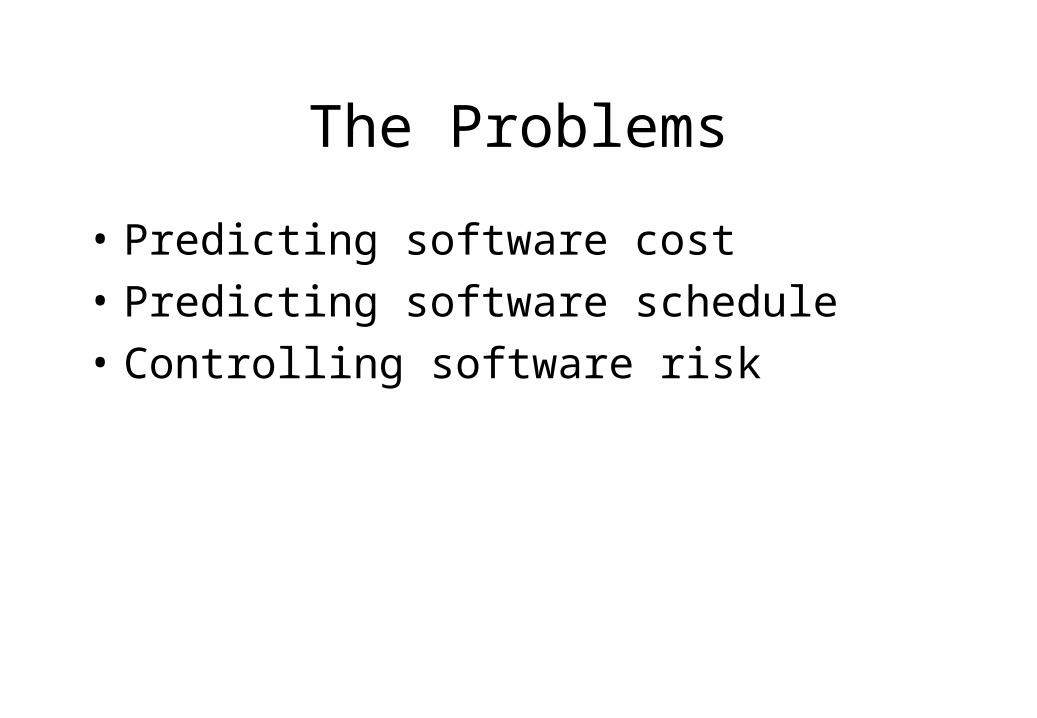
The Problems
• Predicting software cost
• Predicting software schedule
• Controlling software risk
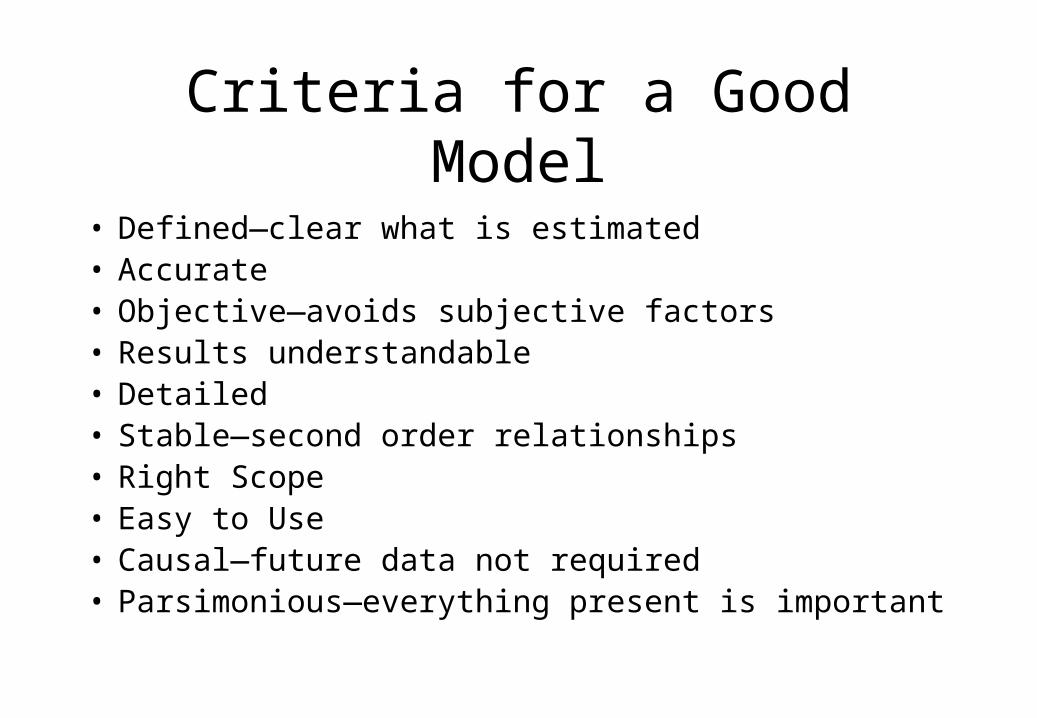
Criteria for a Good Model
• Defined—clear what is estimated• Accurate• Objective—avoids subjective factors• Results understandable• Detailed• Stable—second order relationships• Right Scope• Easy to Use• Causal—future data not required• Parsimonious—everything present is important
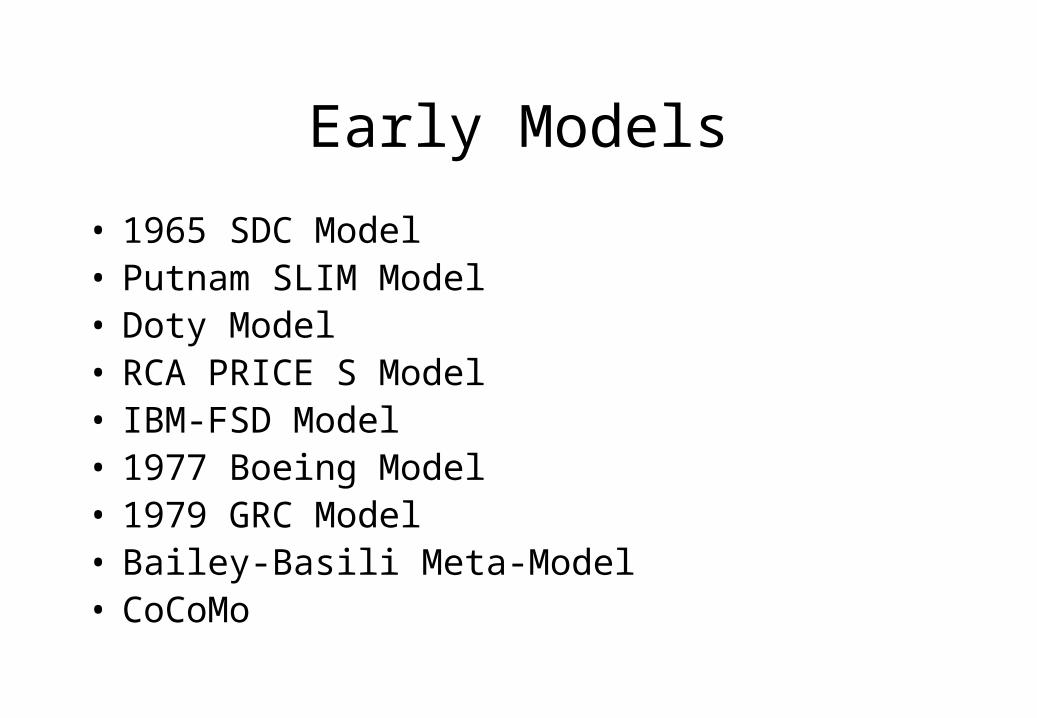
Early Models
• 1965 SDC Model• Putnam SLIM Model• Doty Model• RCA PRICE S Model• IBM-FSD Model• 1977 Boeing Model• 1979 GRC Model• Bailey-Basili Meta-Model• CoCoMo
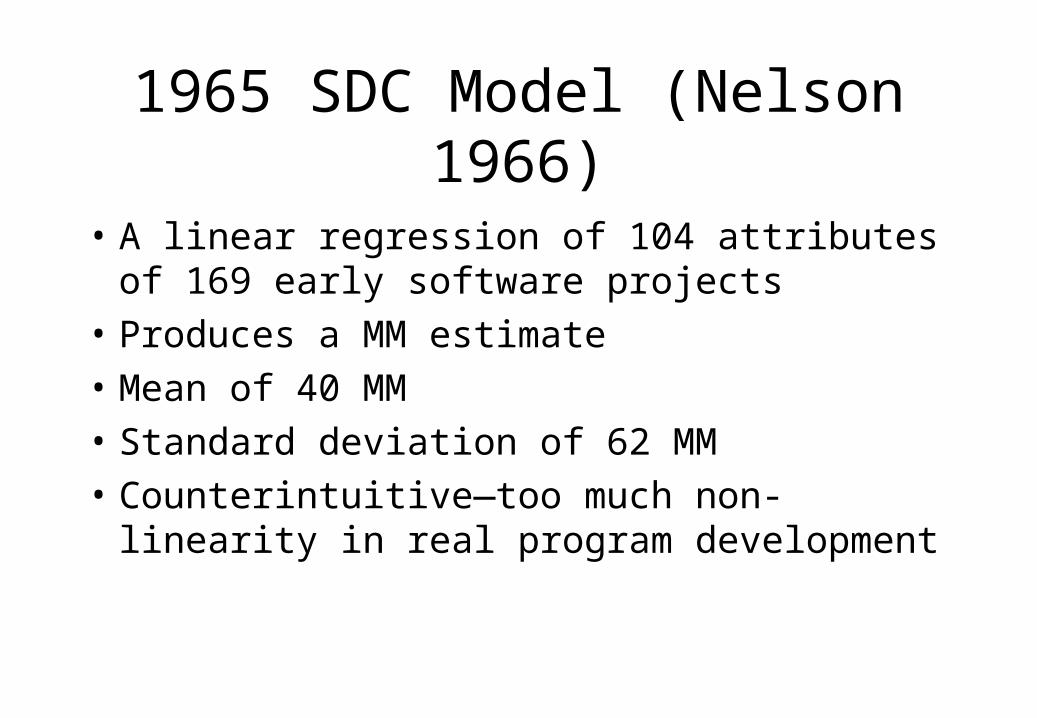
1965 SDC Model (Nelson 1966)
• A linear regression of 104 attributes of 169 early software projects
• Produces a MM estimate
• Mean of 40 MM
• Standard deviation of 62 MM
• Counterintuitive—too much non-linearity in real program development
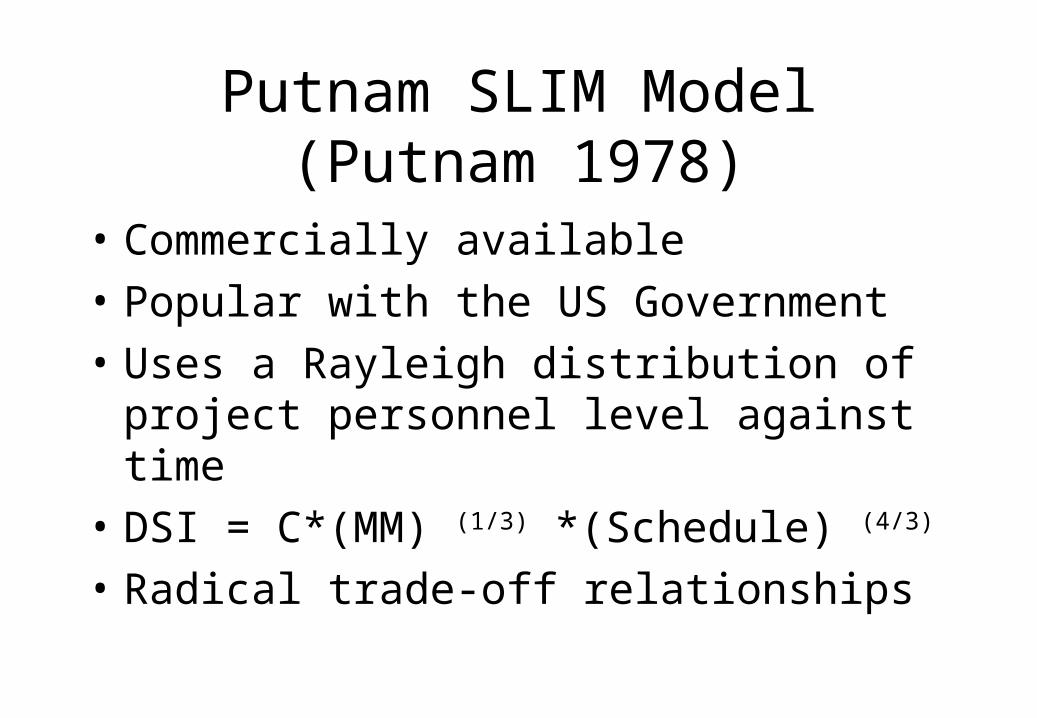
Putnam SLIM Model (Putnam 1978)
• Commercially available
• Popular with the US Government
• Uses a Rayleigh distribution of project personnel level against time
• DSI = C*(MM) (1/3) *(Schedule) (4/3)
• Radical trade-off relationships

Doty Model (Herd et al., 1977)
• Extended the SDC Model
• MM = C(special factors)*(DSI) 1.047
• Problems with stability

RCA PRICE S Model (Freiman-Park, 1979)
• Commercially available
• Aerospace applications
• Similar to CoCoMo (see below)
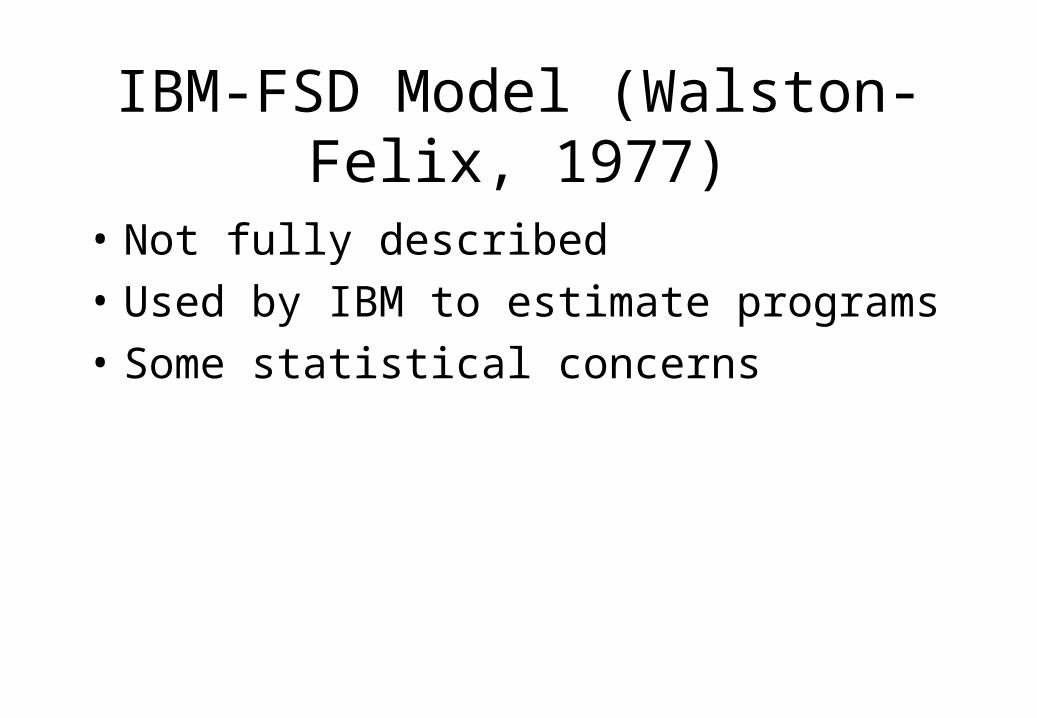
IBM-FSD Model (Walston-Felix, 1977)
• Not fully described
• Used by IBM to estimate programs
• Some statistical concerns
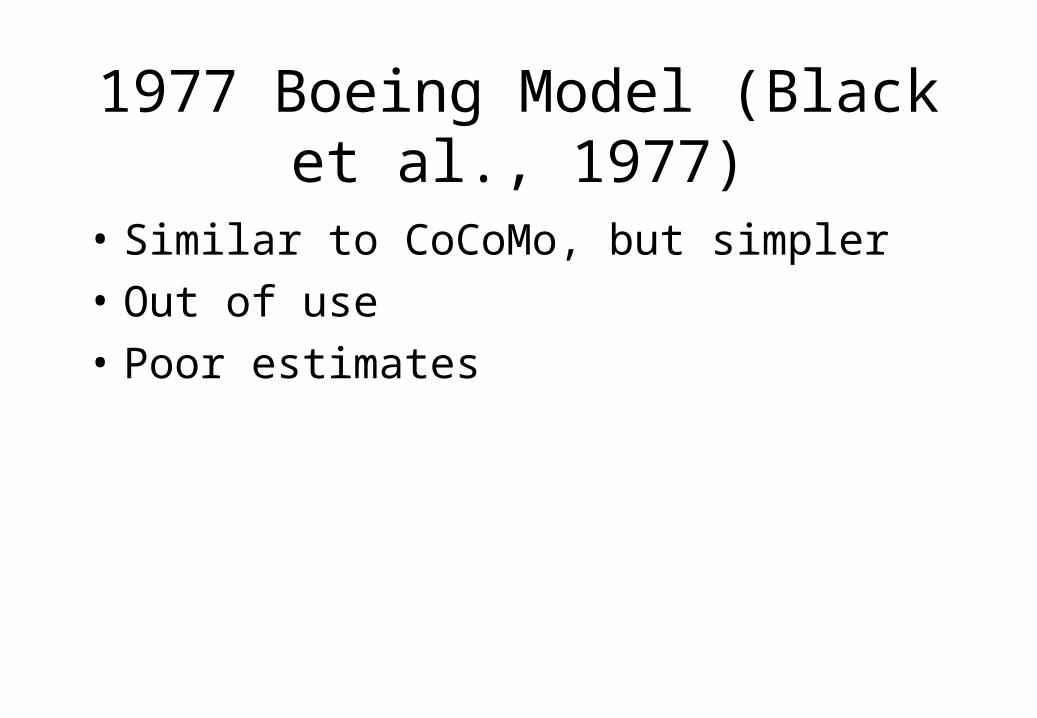
1977 Boeing Model (Black et al., 1977)
• Similar to CoCoMo, but simpler
• Out of use
• Poor estimates
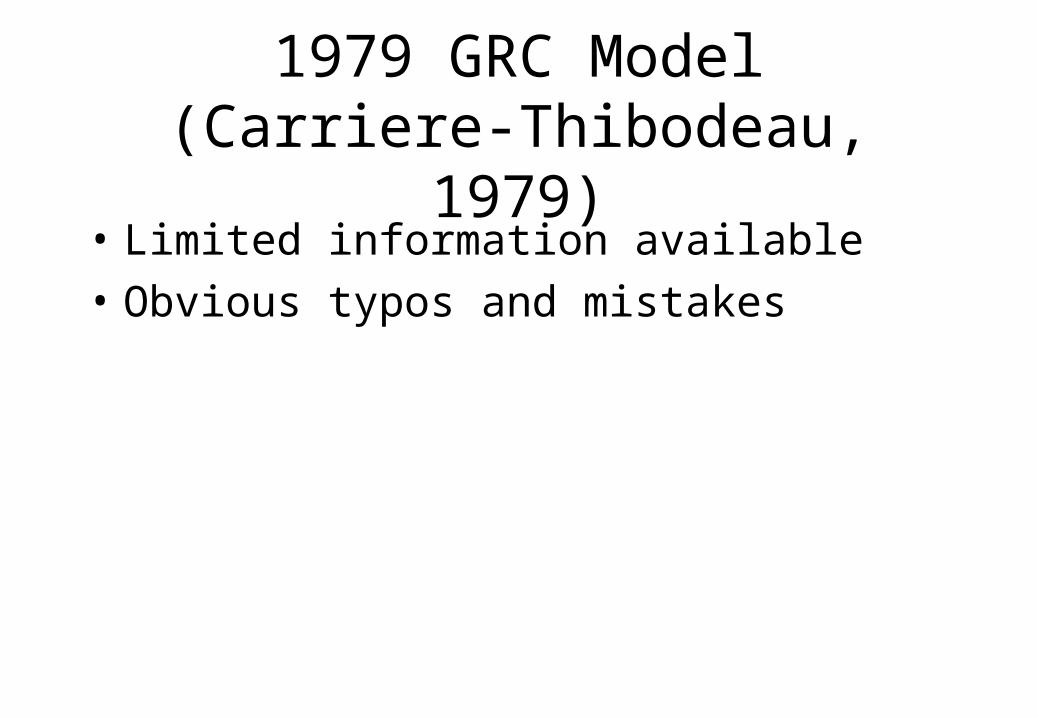
1979 GRC Model (Carriere-Thibodeau, 1979)
• Limited information available
• Obvious typos and mistakes
Bailey-Basili Meta-Model (Bailey-Basili, 1981)
• Rigorous statistical analysis of factors and size.
• Not much experience
CoCoMo
• Waterfall Model• Can be adapted to other models• Estimates:
– Requirements analysis– Product design– Programming– Test planning– Verification and validation– Project office– CM and QA– Documentation

Where to Find CoCoMo
• http://sunset.usc.edu/index.html
• Or do a Google search on Barry Boehm.
Nature of Estimates
• Man Months (or Person Months), defined as 152 man-hours of direct-charged labor
• Schedule in months (requirements complete to acceptance)
• Well-managed program
Input Data
• Delivered source instructions (DSI)
• Various scale factors:– Experience– Process maturity– Required reliability– Complexity– Developmental constraints
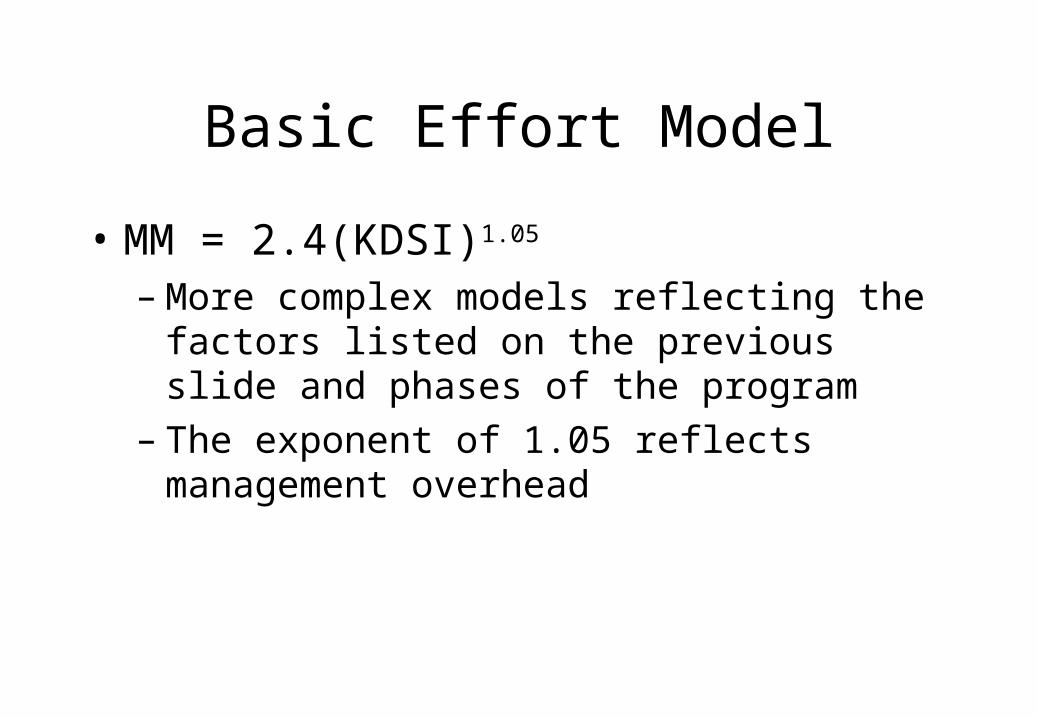
Basic Effort Model
• MM = 2.4(KDSI)1.05
– More complex models reflecting the factors listed on the previous slide and phases of the program
– The exponent of 1.05 reflects management overhead
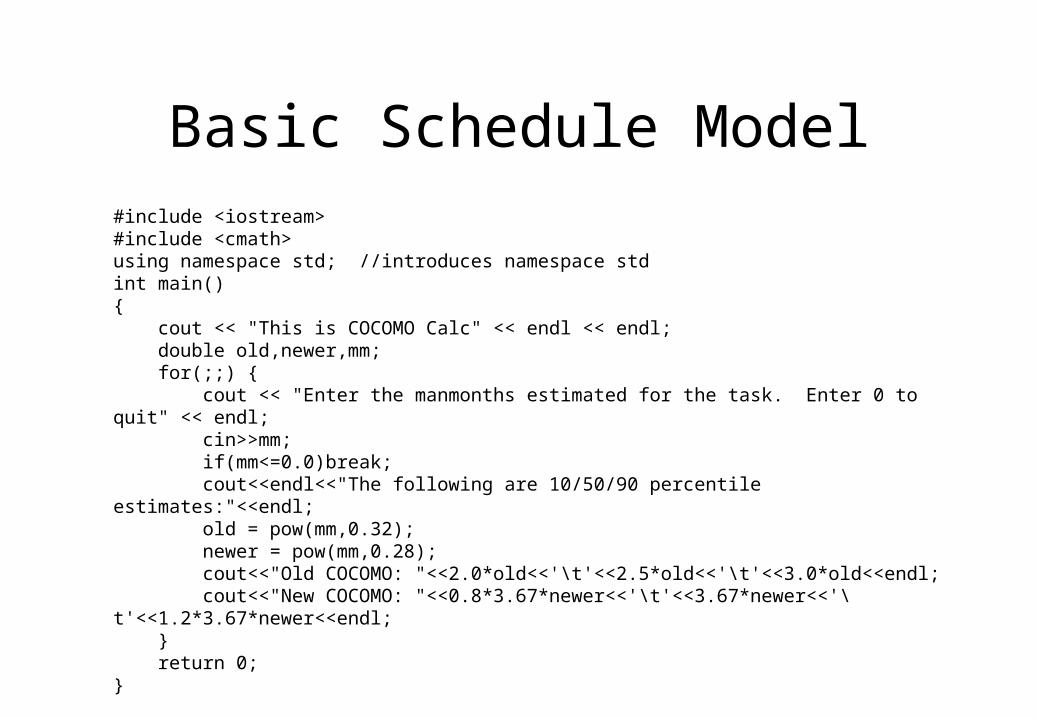
Basic Schedule Model#include <iostream>#include <cmath>using namespace std; //introduces namespace stdint main(){ cout << "This is COCOMO Calc" << endl << endl; double old,newer,mm; for(;;) { cout << "Enter the manmonths estimated for the task. Enter 0 to quit" << endl; cin>>mm; if(mm<=0.0)break; cout<<endl<<"The following are 10/50/90 percentile estimates:"<<endl; old = pow(mm,0.32); newer = pow(mm,0.28); cout<<"Old COCOMO: "<<2.0*old<<'\t'<<2.5*old<<'\t'<<3.0*old<<endl; cout<<"New COCOMO: "<<0.8*3.67*newer<<'\t'<<3.67*newer<<'\t'<<1.2*3.67*newer<<endl; } return 0;}
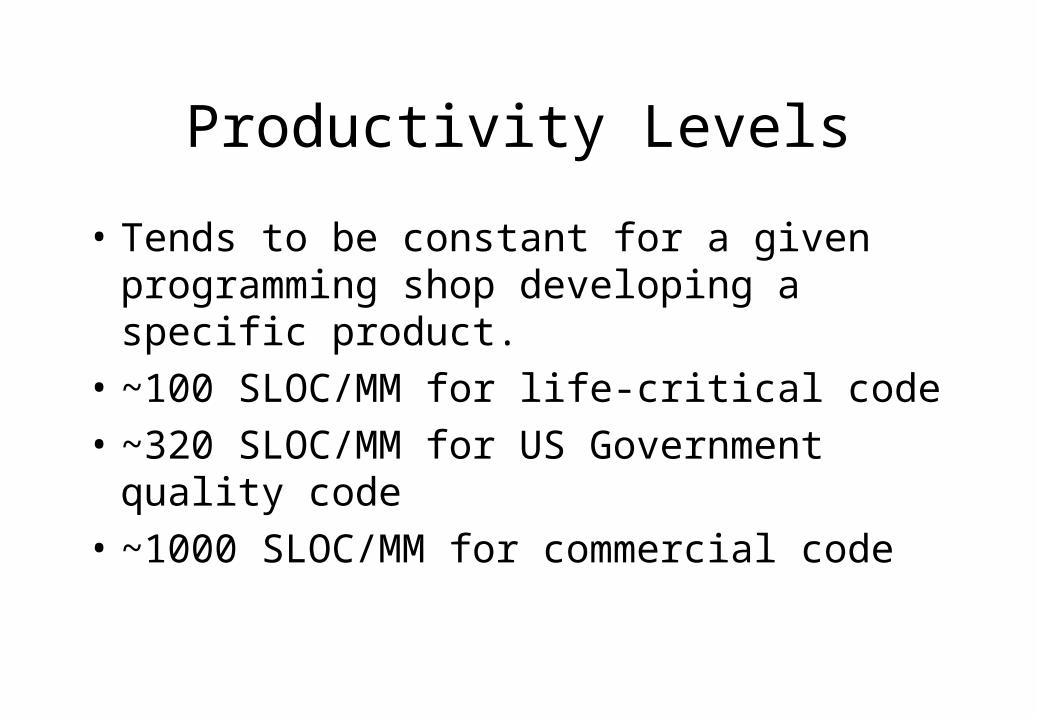
Productivity Levels
• Tends to be constant for a given programming shop developing a specific product.
• ~100 SLOC/MM for life-critical code
• ~320 SLOC/MM for US Government quality code
• ~1000 SLOC/MM for commercial code
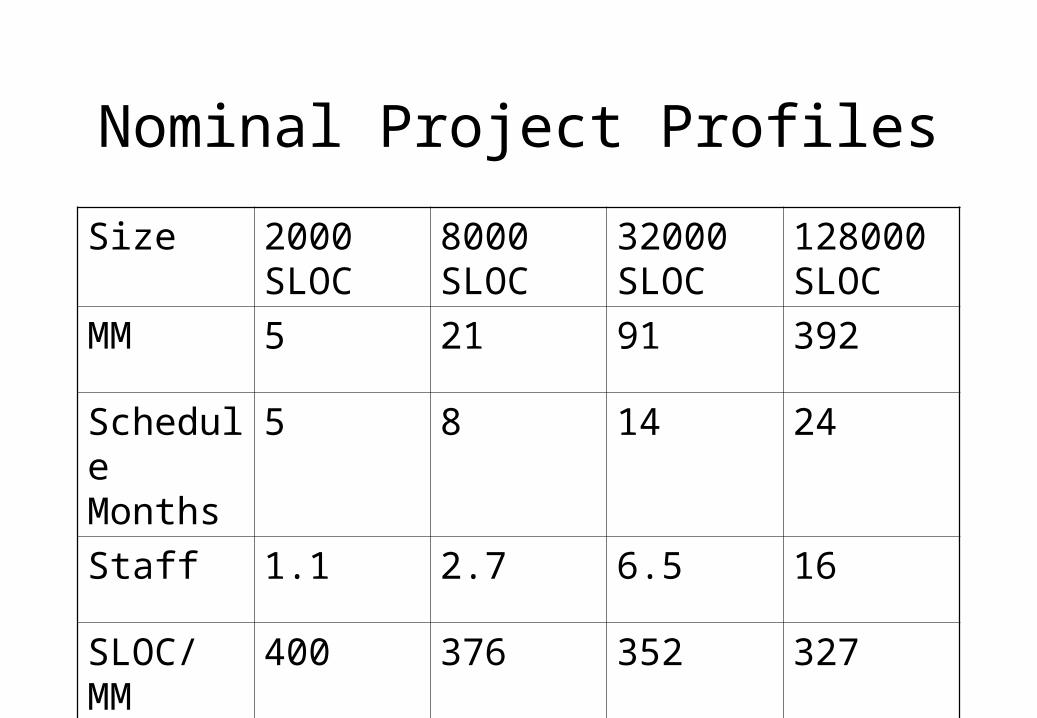
Nominal Project Profiles
Size 2000 SLOC
8000 SLOC
32000 SLOC
128000 SLOC
MM 5 21 91 392
Schedule Months
5 8 14 24
Staff 1.1 2.7 6.5 16
SLOC/ MM
400 376 352 327
What About Function Points?
• Can also be used to estimate productivity.• Capers Jones (use Google to find) provides
conversion factors between FPs and SLOC. <http://www.spr.com/>
• The development organization needs previous experience with the problem domain to estimate FPs accurately. SLOC are easier to estimate with no experience.
More Sophisticated Modeling Incorporates:
• Development Modes
• Activity Distribution
• Product Level Estimates
• Component Level Estimates
• Cost Drivers
Risk Analysis
• A risk is a vulnerability that is actually likely to happen and will result in some significant effect
• Standard software development risks:– Cost– Schedule (covaries with cost)– Technical (opposes cost)
• Approach:– Identify them– Track them– Spend money to control them (Spiral Model)
Spiral Model
• Defines early development activities to buy down risk
• Maintains the interest of stakeholders
• Takes longer and costs more
• Ends with a standard Waterfall

Effects of Parallelism
• Without parallelism, you do a critical path analysis.
• With parallelism, statistical factors affect which task completes first.
• With several parallel tasks of equal length, the mean schedule is about one standard deviation beyond that length.
• Use Monte Carlo to study this.
Conclusions
• Experience shows that seat-of-the-pants estimates of cost and schedule are only about 75% of the actuals. This amount of error is enough to get a manager fired in many companies.
• Lack of hands-on experience is associated with massive cost overruns.
• Technical risks are associated with massive cost overruns.
• Do your estimates carefully!
• Keep them up-to-date!
• Manage to them!