soe report 2009
TRANSCRIPT

ReportState of Environment
Ministry of Environment & ForestsParyavaran Bhavan
CGO Complex, Lodhi RoadNew Delhi - 110 003, India
Tel. : +91-11-2436 1669, 2436 0783Email : [email protected]
Website : http://www.moef.gov.in, http://envfor.nic.in
India20092009
lR;eso t;rs

State of Environment ReportIndia-2009
Environmental Information System (ENVIS)
Ministry of Environment & ForestsGovernment of India
http://www.moef.gov.in, http://envfor.nic.in

State of Environment ReportIndia-2009
Environmental Information System (ENVIS)
Ministry of Environment & ForestsGovernment of India
http://www.moef.gov.in, http://envfor.nic.in

© Ministry of Environment and Forests, Government of India, 2009
Material from this publication may be used for educational purposes provided due credit is given.
Material from this publication can be used for commercial purposes only with the permission from the Ministry of Environment
and Forests.
Project TeamGeorge C VarugheseDr. KVijaya LakshmiAnand KumarNeelam Rana
Prepared byDevelopment AlternativesB-32, TARA Crescent, Qutab Institutional Area, New Delhi - 110016Tel: 011- 2689 0380, 2613 4103Fax: 011-2613 0817
Cover design, Layout & Photo creditsMinistry of Environment and ForestsDevelopment AlternativesBrandStewards Pvt. Ltd.Motilal B. Soni


CONTENTS
Executive Summary
I. Overview .......................................... 1-7
II. State and Trends of the Environment .......................................... 9-71
III. Key Environmental Issues .......................................... 73-157
IV. Policy and Institutional Options .......................................... 159-167
Annexures
List of Abbreviations ........................................... 168
List of Tables ........................................... 169
List of Figures ........................................... 170
List of Boxes ........................................... 171
List of Consultation Workshop Participants ........................................... 172-179
General Profile .......................................... 2
Land .......................................... 10
Air .......................................... 20
Water .......................................... 40
Biodiversity .......................................... 50
Climate Change .......................................... 74
Food Security .......................................... 90
Water Security .......................................... 102
Energy Security .......................................... 116
Managing Urbanization .......................................... 134

In the global context of State of the Environment (SoE)
Reporting, India is probably unique. Over the last two decades,
the Indian SoE reporting experience has ranged from grassroots
initiatives like wall posters and citizens reports to media and
academic documents and more formal government documents.
While the quality of these outputs have been mixed, some of the
processes adopted and products developed have been
pioneering. Consequently, they have contributed to support
policy and decision-making within the country and also for
reporting to the global system.
With such a vast range of expertise and experience, Ministry of
Environment and Forests, Government of India initiated the SoE
reporting process with all State Governments and Union
Territories (UTs) through a plan scheme in the Tenth Five Year
Plan. The process was initiated in October 2002 and included
streamlined data collection and collation systems, cross-sectoral
consultative processes, a reporting systems using a range of
static and interactive media, and linking SoE Reporting with
logical follow-up decision and action.
The basic aim of the scheme is to bring out an overview of the
environmental scenario of the States/UTs for mainstreaming
environment in policy and decision-making. It is anticipated that
through the SoE Reports, State Governments and UT
Administrations would be able to integrate environmental
dimensions in their socio-economic planning for sustainable
development.
The present National State of Environment (SoE) Report of
India-2009 is one of the several reports emanating from the
above process. Development Alternatives, the National Host
Institute for SoE reporting process in India, has played a crucial
role in preparing this report and also carrying out the
participatory assessment processes for soliciting inputs from
various stakeholders including line ministries, state and central
governments, civil society organizations, academic institutions
and business groups. The main objective of the SoE Report of
India is to bring out an overview of the environmental scenario
of India that serves as a baseline document and assists in logical
and information-based decision-making. The SoE Report aims
to provide policy guidelines and strategies for resource
allocation for the coming decades, based on analysis of the state
and trends of the environment and provide guidance for national
environmental action planning.
The State of the Environment Report for India covers the state
and trends of the environment (land, air, water, biodiversity) and
five key issues - (1) Climate Change, (2) Food Security, (3)
Water Security, (4) Energy Security, and (5) Managing
Urbanization. Land degradation is taking place through natural
and man-made processes, resulting in the loss of invaluable
nutrients and lower food grain production. Loss of biodiversity is
of great concern since many plant and animal species are being
threatened. Air quality in cities is deteriorating due to vehicular
growth and a sharp increase in air pollution related diseases. The
issue of availability of water, which is going to be one of the
critical problems in the coming decades, needs to be addressed
on priority basis. Generation of large quantity of hazardous waste
from industries, along with the hospital waste has been affecting
public health and environment. Climate change and energy
security are major concerns which need to be addressed
strategically. The SoE Report of India on environmental issues
has been prepared, following the PSIR (Pressure-State-Impact-
Response) framework.
The report provides an insight on various priority issues for India
related to the current status of environment and natural resources,
the pressures behind environmental changes and the impacts
associated with these changes. The report also assesses the
Government's current and proposed policy initiatives or
programmes as a response to check and monitor further
degradation of environment and also suggests policy options.
The report is structured into five sections:
Section – I presents profile of India in brief with characteristics
of bio-physical profile, socio-economic and cultural pattern,
biodiversity, climate and economic base.
India is one of the oldest civilizations in the world, with
kaleidoscopic variety and rich cultural heritage. Geographically,
it accounts for a meagre 2.4 per cent of the world's total surface
area of 135.79 million sq. km. Yet, India supports and sustains a
whopping 16.7 per cent of the world population.
India covers an area of 32,87,263 sq. km., extending from the
snow covered Himalayan peaks in the North to the tropical rain
forests of the South. India's coast is 7,517 km (4,671 miles) long;
of this distance, 5,423 km (3,370 miles) belongs to peninsular
India, and 2,094 km (1,301 miles) to the Andaman & Nicobar and
Lakshadweep Islands. The rivers of India can be classified into
four groups viz., the Himalayan rivers, the Deccan rivers, the
coastal rivers, and rivers of the inland drainage basin. The
climate of India may be broadly described as tropical monsoonal
type. Its climate is affected by two seasonal winds, the North-
East monsoon and the South-West monsoon. The North-East
monsoon, commonly known as the winter monsoon blows from
land to sea, whereas the South-West monsoon, known as the
summer monsoon blows from sea to land after crossing the
Indian Ocean, the Arabian Sea, and the Bay of Bengal. The
South-West monsoon brings most of the rainfall during a year in
the country. India, a mega diverse country with only 2.4 per cent
of world’s land area, accounts for 7-8 per cent of the recorded
species of the world, including 45,500 species of plants and
91,000 species of animals. The Constitution of India, the longest
and the most exhaustive constitution of any independent nation
in the world, came into force on 26 January, 1950. India's diverse
economy encompasses traditional village farming, modern
agriculture, fisheries, handicrafts, a wide range of modern
industries, and a multitude of services.
Section – II presents the state of environment & trends and
integrated analyses of four major themes (Land, Air, Water and
Biodiversity). The state and trends have been analyzed under the
Pressure-State-Impact-Response (PSIR) framework.
LandIndia is the seventh largest country in the world, with a total land
area of 3,287,263 sq. km. It measures 3,214 km. from North to
South and 2,993 km. from East to West. It has a land frontier of
15,200 km. and a coastline of 7,517 km. Out of India's total
geographical area of 328.73 Mha., 306 Mha. comprise the
reporting area and 146.82 Mha. is degraded land. Land
degradation occurring due to the natural and human induced
causes, like wind erosion and water logging, is one of the priority
concerns in India. The varying degrees and types of degradation
stem mainly from unsustainable use and inappropriate land
management practices. Loss of vegetation occurs as a result of
deforestation, cutting beyond the silviculturally permissible
limits, unsustainable fuel-wood and fodder extraction, shifting
cultivation, encroachment into forest lands, forest fires and over-
grazing, all of which subject the land to degradational forces.
Other important factors responsible for large-scale degradation
are; non-adoption of adequate soil conservation measures,
improper crop rotation, indiscriminate use of agro-chemicals
such as fertilizers and pesticides, improper planning and
management of irrigation systems and extraction of groundwater
in excess of the recharge capacity. The strategies identified to
check land-degradation are as follows:
?Land degradation problem could be tackled to an extent by
suitable policies that would internalize the issue into proper
decision-making.
?At the macro level, the existing database on land use statistics
cannot adequately facilitate the analysis of land degradation
and its impact. Changes in the classification of land use
statistics are needed in order to study its impact. Advanced
technology like Remote Sensing could go a long way in
generating vital information on different dimensions of land
degradation.
?The information base on which farmers make decisions is
incomplete in terms of internalizing rapid changes in soil and
water quality variables; hence the need to move towards
more sustainable practices such as integrated pest
management and land-conserving crop rotations. Research
needs to be focused on measures such as integrated crop
management. An integrated approach to the problem of
degradation, linking agriculture and environment, is yet to be
attempted even at the policy level.
Air
Air pollution and the resultant impacts in India could be broadly
attributed to the emissions from vehicular, industrial and
domestic activities. Air quality has been, therefore, an issue of
concern in the backdrop of various developmental activities.
Some of the recommendations made to reduce air pollution are as
follows:
?Take an integrated approach towards energy conservation and
adoption of renewal energy technologies, including
hydropower, by appropriately linking efforts to improve
conversion, transmission, distribution, and end-use
efficiency, and R&D in (and dissemination of) renewable
energy technologies. Remove the statutory and regulatory
barriers in setting up decentralized generation and
distribution system for power and other secondary energy
forms, based on local primary energy resources.
?Accelerate the national programmes for disseminating
information on improved fuel wood stoves suited to local
cooking practices and biomass resources.
?Strengthen the monitoring and enforcement of emission
standards and prepare and implement action plans for both
point and non-point sources.
?Promote reclamation of wastelands through energy
plantations for rural energy, through multi-stakeholder
partnerships involving the land owing agencies, local
communities, and investors.
?Strengthen efforts for partial substitution of fossil fuels by
bio-fuels, through promotion of bio-fuel plantation,
promoting relevant research and development, and
strengthening regulatory certification of new technologies.
Water
From the East to the West and from the North to the South, water
has defined life in the Indian subcontinent for thousands of years.
On an average, the combination of rainfall, surface and
groundwater resources have been sufficient in providing
adequate water to the Indian population. Rise in demand and
development pressures are changing the characteristics of water
in India. Erosion in the watershed due to the fast growing
development and poor land management practices is increasing
siltation and changing stream hydraulics. Groundwater reserves
are becoming more and more depleted as surface water sources
have become too polluted for human use.
The Government of India has formulated the National Water
Policy in 1987 to address issues regarding planning, development
and allocating groundwater and surface water. It serves as a
Executive Summary
guideline to help planners and managers in developing country’s
water resources to its maximum potential.
Biodiversity
India is one of the 17 identified mega diverse countries of the
world. Out of all the hot spots in the world, India has two,
Eastern Himalaya and Western Ghats. India, with a varied
terrain, topography, land use, geographic and climatic factors,
can be divided into ten recognizable bio-geographic zones.
These zones encompass a variety of ecosystems: mountains,
plateaus, rivers, forests, deserts, wetlands, lakes, mangroves,
coral reefs, coasts and islands.
Human activities, both directly and indirectly, responsible for
current high rates of biodiversity loss are - habitat loss;
fragmentation and degradation due to agricultural activities;
extraction (including mining, fishing, logging and harvesting);
and development (human settlements, industry and associated
infrastructure). Habitat loss and fragmentation leads to the
formation of isolated, small and scattered populations.
Strategies and actions required to protect the India's rich bio-
wealth are as follows:
?Formulate conservation and prudent use strategies for each
significant catalogued wetland, with participation from local
communities, and other relevant stakeholders.
?Formulate and implement eco-tourism strategies for
identified wetlands through multi-stakeholder partnerships
involving public agencies, local communities, and investors.
?Integrate wetland conservation, including conservation of
village ponds and tanks, into sectoral development plans for
poverty alleviation and livelihood improvement, and link
efforts for conservation and sustainable use of wetlands with
the ongoing rural infrastructure development and
employment generation programmes.
Section – III focuses on key environmental issues i.e. Climate
Change, Food Security, Water Security, Energy Security and
Urbanization that threaten to cripple the efforts towards holistic
development of India. The issues are again analyzed under the
Pressure-State-Impact-Response (PSIR) framework.
Climate Change
India is a large developing country with nearly 700 million rural
population directly depending on climate-sensitive sectors
(agriculture, forests and fisheries) and natural resources (such as
water, biodiversity, mangroves, coastal zones, grasslands) for
their subsistence and livelihoods. Further, the adaptive capacity
of dry land farmers, forest dwellers, fisher folk and nomadic
shepherds is very low. Climate change may alter the distribution
and quality of India's natural resources and adversely affect the
livelihoods of its people. With an economy closely linked to its
natural resource base and climatically sensitive sectors such as
agriculture, water and forestry, India may face a major threat
because of the projected change in climate. With climate change,
there would be increasing scarcity of water, reduction in yields of
forest biomass, and increased risk to human health. The
contribution of India to the cumulative global CO emissions is 2
only five per cent. Thus, historically and at present, India's share
in the carbon stock in the atmosphere is relatively miniscule
when compared to its distribution over the nation's population.
India released its National Action Plan on Climate Change th(NAPCC) on 30 June, 2008 to outline its strategy to meet the
Climate Change challenge. The National Action Plan advocates
a strategy that promotes, firstly, the adaptation to Climate
Change and secondly, further enhancement of the ecological
sustainability of India's development path. India's National
Action Plan stresses that maintaining a high growth rate is
essential for increasing the living standards of the vast majority
of people of India and reducing their vulnerability to the impacts
of climate change. Accordingly, the Action Plan identifies
measures that promote the objectives of sustainable
development of India while also yielding to benefits for
addressing climate change. Eight National Missions, which form
the core of the National Action Plan, represent multi-pronged,
long term and integrated strategies for achieving key goals in the
context of climate change. The focus is on promoting
understanding of Climate Change, adaptation and mitigation,
energy efficiency and natural resource conservation.
Food Security
Today, there are marketable surpluses of food grains in India; the
prevalence of widespread hunger is not due to the non-
availability of food in the market but due to lack of adequate
purchasing power among the rural and urban poor. Inadequate
purchasing power, in turn, is due to insufficient opportunities for
gainful employment. The famines of jobs and of purchasing
power are becoming the primary causes for the famines of food
in the households of the poor. Poverty, increased food
consumption, land degradation, climate change are some of the
pressures of food insecurity.
Some of the measures to secure food security are as follows:
?The National Food Security Mission has been launched
recently as a centrally sponsored scheme. The objective is to
increase production and productivity of wheat, rice and
pulses on a sustainable basis so as to ensure food security of
the country.
?Boosting agricultural science and technology.
?Sustainable intensification and diversification of farming
systems and value-addition.
?Promotion of organic farming – a solution to ensure
economically sustainable agriculture.
Water Security
Water security is emerging as an increasingly important and vital
issue for India. Many Indian cities are beginning to experience
moderate to severe water shortages, brought on by the
simultaneous effects of agricultural growth, industrialization
and urbanization. These shortages would be further aggravated
by receding of glaciers and dwindling fresh water resources.
Population stress, irrigation requirements and industrialization
are the major pressures for water insecurity.
The environmental challenges of water resource development
and management in India are expected to manifest themselves
more explicitly and rapidly in the coming years. These
environmental challenges may be addressed through four broad
approaches:
?Improving efficiencies and minimizing losses
?Recharging groundwater aquifers
?Abatement and treatment of water pollution
?Reuse and recycling of wastewater
Energy Security
India is a developing country facing the critical challenge of
meeting its rapidly increasing demand for energy. With over a
billion people, India ranks sixth in the world in terms of energy
demands. India’s economy is projected to grow seven to eight per
cent over the next two decades, spurring a substantial increase in
demand for oil to fuel land, sea, and air transportation. While
India has significant reserves of coal, it is relatively poor in oil
and gas resources. India’s oil reserves amount to 0.5 per cent of
the global reserves.
In recent years, India's energy consumption has been increasing
at one of the fastest rates in the world owing to population growth
and economic development.
In the recent years, the Government of India has recognized the
energy security concerns and more importance is being placed on
energy independence. Some of the strategies for energy security
are as follows:
?Power Generation Strategy will focus on low cost generation,
optimization of capacity utilization, controlling the input
cost, optimization of fuel mix, Technology upgradation and
utilization of non-conventional energy sources.
?Transmission strategy will focus on development of National
Grid including Inter-state connections, technology
upgradation and optimization of transmission cost.
?Distribution strategy (to achieve distribution reforms) will
focus on system upgradation, loss reduction, theft control,
consumer service orientation, quality power supply
commercialization, decentralized distributed generation and
supply for rural areas.
?Conservation strategy (to optimize the utilization of
electricity) will focus on demand side management, load
management and technology upgradation to provide energy
efficient equipment / gadgets.
Managing Urbanization
Due to an uncontrolled urbanization in India, environmental
degradation has been occurring very rapidly and causing
shortages of housing, worsening of water quality, excessive air
pollution, noise, dust and heat, and the problems of disposal of
solid wastes and hazardous wastes. The situation in metropolises
like Mumbai, Kolkata, Chennai, Delhi and Bangalore, is
becoming worse year by year. Some of the strategies to manage
urbanization are as follows:
?Redirection of migration flow is required. Since the mega
cities have reached the saturation level for employment
generation and to avoid over-crowding into the over
congested slums of mega cities like Mumbai, Kolkata, Delhi
and Chennai, there is a dire need to build a strong economic
sector (Kundu and Basu, 1998) in the urban economy. Growth
efforts and investments should be directed towards small
cities which have been neglected so far so that functional base
of urban economy is strengthened. Then, the redirection of
migration to this desirable destination will be possible.
?Policy should also relate to proper urban planning where city-
planning will consist of operational, developmental and
restorative planning.
Section – IV provides the Policy and Institutional Options to
cater the emerging environmental challenges. To address these
challenges, it is essential to focus on diverse response options and
instruments for possible solutions. Emphasis must be placed on
increasing stakeholders responsibility and accountability and
promoting more cooperative efforts for ensuring a healthy
environment.
Spreading awareness and empowering people to take decisions,
at the local level, is an effective way of dealing with the
environmental problems of India. Their decisions will enable
initiatives that will benefit them as well as the local environment.
It has been seen that solutions always emerge whenever
governments involve people, using a participatory approach to
solve problems.
Community-based natural resource management initiatives,
coupled with policy reforms, can prove to be an effective
mechanism for improving access to, and improving productivity
of, natural resources. The success of joint forest management and
irrigation user groups in India, provide enough evidence that
social capital and participatory processes are as crucial to
environmental protection as financial resources and
development programmes.
Section – V provides the list of annexures.

OVERVIEWOVERVIEW
CHAPTER - 1
OVERVIEWOVERVIEW
CHAPTER - 1

Overview3
State Of Environment Report-2009 2
India is one of the oldest civilizations in the world with a
kaleidoscopic variety and rich cultural heritage. It has achieved
multifaceted socio-economic progress during the last sixty-one
years of its independence. India has become self-sufficient in
agricultural production, and is now the tenth most industrialized
country in the world and the sixth nation to have gone into outer stspace. India's population as on 1 March, 2001, was 1,028
million (532.1 million males and 496.4 million females). India
accounts for a meagre 2.4 per cent of the world surface area of
135.79 million sq. km. Yet, it supports and sustains a whopping
16.7 per cent of the world population.
It covers an area of 3,287,263 sq. km., extending from the snow-
covered Himalayan heights in the North to the tropical rain
forests of the South (Figure 1.1). As the seventh largest country
Valley of flowers
in the world, India stands apart from the rest of Asia, marked off
as it is by mountains and the sea, which give the country a distinct
geographical entity. Bounded by the Great Himalaya in the
North, it stretches southwards and at the Tropic of Cancer, tapers
off into the Indian Ocean between the Bay of Bengal in the East
and the Arabian Sea in the West. India has a land frontier of about
15,200 km. The total length of the coastline, including the
mainland, Lakshadweep Islands, and the Andaman and Nicobar
Islands is 7, 517 km.
Countries sharing a common border with India are Afghanistan
and Pakistan in the North-West, China, Bhutan and Nepal in the
North and Myanmar and Bangladesh in the East. Sri Lanka is
separated from India by a narrow channel of sea formed by the
Palk Strait and the Gulf of Mannar.
The mainland comprises of four regions, namely, the Great
Mountain Zone, the Indo-Gangetic Plains, the Desert Region and
the Southern Peninsula.
PHYSIOGRAPHY & RELIEF
The Himalaya comprises of three near parallel ranges
interspersed with large plateaus and valleys, some of which, like
the Kashmir and Kullu valleys, are fertile, extensive and of great
scenic beauty. Some of the highest peaks in the world are found
in these ranges. In the East, between India and Myanmar, and
India and Bangladesh, the hill ranges are much lower. The Garo,
Khasi, Jaintia and Naga hills, running almost East-West, join the
chain of the Mizo and Arakan hills running North-South.
The Indo-Gangetic Plains, about 2,400 km long and ranging
from 240 to 320 km in width, are formed by the basins of three
distinct river systems - the Indus, the Ganga and the
Brahmaputra. They are one of the world's greatest stretches of
flat alluvium and also one of the most densely populated areas on
Earth.
The Desert Region can be divided into two parts - the great Thar
desert and the ‘little desert’. The great Thar desert extends from
the edge of the Rann of Kutch beyond the Luni River northwards.
The whole of Rajasthan-Sind frontier runs through this. The
‘little desert’ extends from the Luni between Jaisalmer and
Jodhpur up to the Northern West. Between the great Thar desert
and the little desert, lies a zone of absolutely sterile country,
consisting of rocky land cut by limestone ridges.
The Peninsular Plateau is marked off from the plains of river
Ganga and the Indus by a mass of mountain and hill ranges,
varying from 460 to 1,220 meters in height. Prominent among
these are the Aravali, Vindhya, Satpura, Maikala and Ajanta. The
Peninsula is flanked on one side by the Eastern Ghats with an
average elevation of about 610 meters, and on the other by the
Western Ghats where the average elevation varies between 915 to
1,220 meters, rising in places to over 2,440 meters. The southern
point of the plateau, where the Eastern and the Western Ghats
meet is formed by the Nilgiri Hills. The Cardamom Hills lying
beyond may be regarded as a continuation of the Western Ghats.
India’s coast is 7,517 km (4,671 miles) long; of this distance,
5,423 km (3,370 miles) belongs to peninsular India, and 2,094
km (1,301 miles) to the Andaman, Nicobar, and Lakshadweep
Islands. According to the Indian naval hydrographic charts, the
mainland coast consists of the following: 43 per cent sandy
beaches, 11 per cent rocky coast including cliffs, and 46 per cent
mud flats or marshy coast. Notable coastal features of India
comprise the marshy Rann of Kutch in the West and the alluvial
Sundarbans Delta in the East, which India shares with
Bangladesh. India has two archipelagos - the Lakshadweep, coral
atolls beyond India’s South-Western coast, and the Andaman and Nicobar Islands, a volcanic island chain in the Andaman Sea.
The rivers of India can be classified into four groups viz., the
Himalayan rivers, the Deccan rivers, the coastal rivers, and
rivers of the inland drainage basin.
The main Himalayan River System includes the Indus and the
Ganga-Brahmaputra-Meghna system. The Indus originates near
Mansarovar in Tibet, flows through India and Pakistan, and
finally falls into the Arabian Sea near Karachi. Its important
tributaries flowing through Indian territory are Sutlej
(originating in Tibet), Beas, Ravi, Chenab and Jhelum. The
Ganga-Brahmaputra-Meghna river system creates principal sub-
basins of the Bhagirathi and the Alaknanda, which join at Dev
Prayag to form the Ganga. It then traverses through Uttarakhand,
Uttar Pradesh, Bihar, and West Bengal. Below the Rajmahal hills,
Bhagirathi, which used to be the main course in the past, takes
off, while Padma continues eastwards and enters Bangladesh.
The Yamuna, Ramganga, Ghaghra, Gandak, Kosi, Mahananda
and Sone are the important tributaries of Ganga. Rivers Chambal
and Betwa are the important sub-tributaries, which join Yamuna
before it merges with Ganga. The Padma and the Brahmaputra
COASTAL AREA
RIVERS OF INDIA
GENERALGENERALPROFILEPROFILE
Figure 1.1 : Administrative Map of India
Source: State of Environment Atlas of India 2007, MoEF
Overview5
State Of Environment Report-2009 4
(i) Winter (January-February)
(ii) Hot weather summer (March-May)
(iii) Rainy South-Western monsoon (June-September) and
(iv) Post-monsoon, also known as North-East monsoon in the
southern Peninsula (October-December)
India's climate is affected by two seasonal winds - the North-East
monsoon and the South-West monsoon. The North-East
monsoon, commonly known as the winter monsoon blows from
land to sea, whereas the South-West monsoon, known as the
summer monsoon blows from sea to land after crossing the
Indian Ocean, the Arabian Sea, and the Bay of Bengal. The
South-West monsoon brings most of the rainfall during a year in
the country.
India, a megadiverse country with only 2.4 per cent of the land
area, accounts for 7-8 per cent of the recorded species of the
world, including over 45,500 species of plants and 91,000
species of animals.
India is situated at the tri-junction of the Afro-tropical, the Indo-
Malayan and the Paleo-Arctic realms, which display significant
biodiversity. Being one of the 17 identified megadiverse
countries, it is home to 8.58 per cent of mammalians, 13.66 per
cent of avians, 7.91 per cent of reptilians, 4.66 per cent of
amphibians, 11.72 per cent of fish, and 11.80 per cent of plant
species documented so far.
BIODIVERSITY
India’s forest cover ranges from the tropical rainforest of the
Andaman Islands, Western Ghats, and North-Eastern India to the
coniferous forest of the Himalayas. Between these extremes lie
the Sal-dominated moist deciduous forest of Eastern India, the
Teak-dominated dry deciduous forest of Central and Southern
India, and the Babul-dominated thorn forest of Central Deccan
and Western Gangetic plains. Important Indian trees include
Neem, widely used in traditional Indian herbal remedies.
Among species found in India, only 12.6 per cent of mammals
and 4.5 per cent of birds are endemic, as against 45.8 per cent of
reptiles and 55.8 per cent of amphibians. Notable endemics are
the Nilgiri Leaf Monkey and the Brown and Carmine Beddome’s
Toad of the Western Ghats. India contains 172 (2.9 per cent) of
the IUCN designated threatened species. These include the
Asiatic Lion, the Bengal Tiger, and the Indian White-Rumped
Vulture, which suffered near-extinction situation from feeding
on the carrion of diclofenac-treated cattle.
Indian culture is marked by a high degree of syncretism and
cultural pluralism. It has managed to preserve established
traditions while absorbing new customs, traditions, and ideas
from invaders and immigrants and spreading its cultural
influence to other parts of Asia.
All the five major ethnic groups - Australoid, Mongoloid,
Europoid, Caucasian, and Negroid find representation among
the people of India. According to the 2001 census, out of the total
population of 1,028 million in the country, Hindus constituted
the majority with 80.5 per cent, Muslims were second at 13.4 per
cent, followed by Christians, Sikhs, Buddhists, Jains, and others.
Twenty two National Languages that have been recognized by
the Constitution of India, of which Hindi is the official union
language. Besides these, there are 844 different dialects spoken
in various parts of the country.
Architecture is one area that truly represents the diversity of
Indian culture. Much of it, including notable monuments and
heritage buildings such as the Taj Mahal, Red Fort of Agra,
Ajanta and Ellora Caves, Purana Quila, Qutub Minar, Elephanta
Caves, Jaisalmer Fort, Jantar Mantar, India Gate, Gateway of
India etc., comprises a blend of ancient and varied local
traditions from several parts of the country and abroad.
Vernacular architecture also displays notable regional variation.
Indian dance has diverse folk and classical forms. Among the
well-known folk dances are the bhangra of Punjab, the bihu of
Assam, the chhau of West Bengal, Jharkhand and Orissa and the
ghoomar of Rajasthan. Eight dance forms, many with narrative
forms and mythological elements, have been accorded the
'classical dance' status by India's National Academy of Music,
Dance, and Drama. These are: bharatanatyam of Tamil Nadu,
kathak of Uttar Pradesh, kathakali and mohiniyattam of Kerala,
kuchipudi of Andhra Pradesh, manipuri of Manipur, odissi of
Orissa and sattriya of Assam.
SOCIO - ECONOMIC & CULTURAL
PATTERN
Indian cuisine is characterized by a wide variety of regional
styles and the use of herbs and spices. The staple food in the
region is rice (especially in the South and the East) and wheat
(predominantly in the North). Spices that are native to the Indian
subcontinent are now consumed worldwide, for instance black
pepper. Indian cuisine is season specific and is based on scientific
combination of the medicinal and digestive properties of various
vegetables, pulses and spices duly balancing their positive and
negative effects on the body and digestive system. Turmeric,
saffron and other herbs for body care and Amla, Ritha, Neem etc.
for hair care and medicinal purposes have been traditionally used
for ages in India.
Traditional Indian dresses vary across the regions in their
materials, colours and styles and depend on various factors,
including climate. Popular dress-styles include draped garments
such as sari for women and dhoti or lungi for men. In addition,
stitched clothes such as salwar-kameez for women and kurta-
pyjama and European-style trousers and shirts for men, are also
popular.
Many Indian festivals are religious in origin, although several are
celebrated irrespective of caste and creed. Some popular festivals
are Diwali, Ganesh Chaturthi, Ugadi, Thai Pongal, Holi, Onam,
Vijayadasami, Durga Puja, Eid-ul-Fitr, Bakr-Id, Christmas,
Buddha Jayanti and Baisakhi. Religious practices are an integral
part of everyday life and are a public affair. Most festivals are
related to crop harvesting or with change of seasons and as such
are secular in nature.
The Constitution of India, the longest and the most exhaustive
constitution of any independent nation in the world, came into
force on 26 January, 1950.
The President of India is the Head of the State, elected indirectly
by an electoral college for a five year term. The Prime Minister is
the head of the government and exercises most executive powers.
The Prime Minister is appointed by the President and, by
POLITICAL & GOVERNANCE
STRUCTURE
India Gate
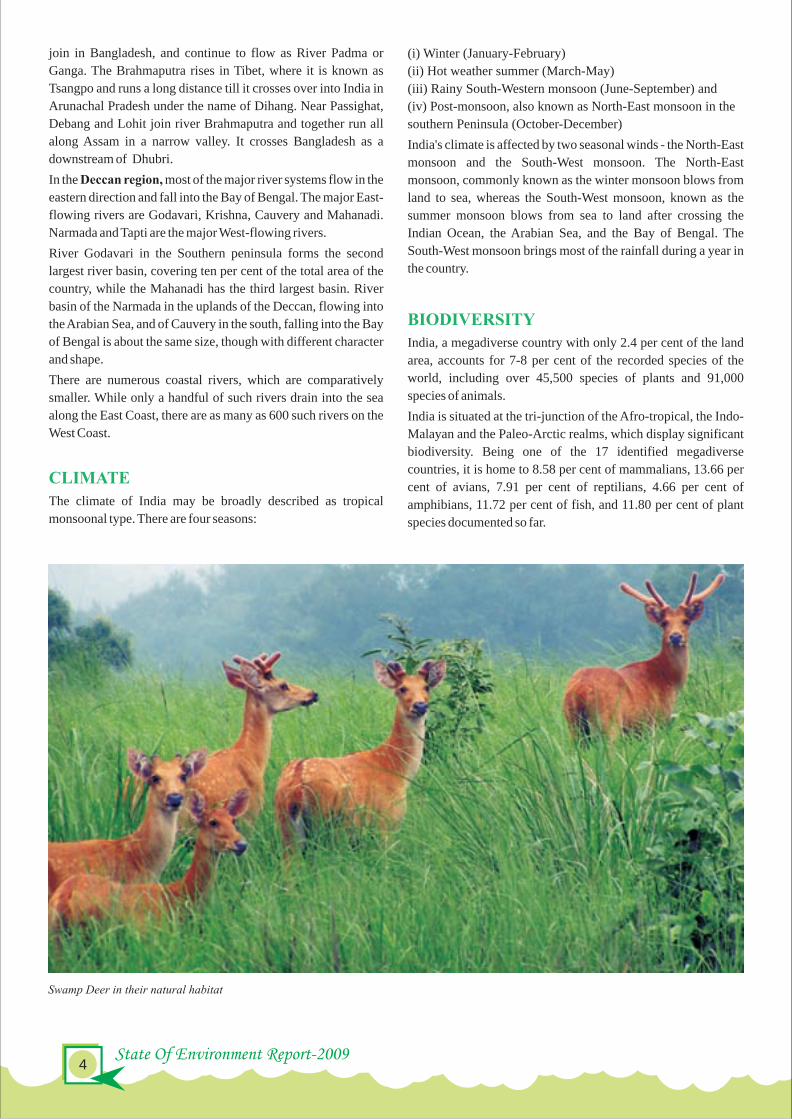
Swamp Deer in their natural habitat
join in Bangladesh, and continue to flow as River Padma or
Ganga. The Brahmaputra rises in Tibet, where it is known as
Tsangpo and runs a long distance till it crosses over into India in
Arunachal Pradesh under the name of Dihang. Near Passighat,
Debang and Lohit join river Brahmaputra and together run all
along Assam in a narrow valley. It crosses Bangladesh as a
downstream of Dhubri.
In the Deccan region, most of the major river systems flow in the
eastern direction and fall into the Bay of Bengal. The major East-
flowing rivers are Godavari, Krishna, Cauvery and Mahanadi.
Narmada and Tapti are the major West-flowing rivers.
River Godavari in the Southern peninsula forms the second
largest river basin, covering ten per cent of the total area of the
country, while the Mahanadi has the third largest basin. River
basin of the Narmada in the uplands of the Deccan, flowing into
the Arabian Sea, and of Cauvery in the south, falling into the Bay
of Bengal is about the same size, though with different character
and shape.
There are numerous coastal rivers, which are comparatively
smaller. While only a handful of such rivers drain into the sea
along the East Coast, there are as many as 600 such rivers on the
West Coast.
The climate of India may be broadly described as tropical
monsoonal type. There are four seasons:
CLIMATE

Overview5
State Of Environment Report-2009 4
(i) Winter (January-February)
(ii) Hot weather summer (March-May)
(iii) Rainy South-Western monsoon (June-September) and
(iv) Post-monsoon, also known as North-East monsoon in the
southern Peninsula (October-December)
India's climate is affected by two seasonal winds - the North-East
monsoon and the South-West monsoon. The North-East
monsoon, commonly known as the winter monsoon blows from
land to sea, whereas the South-West monsoon, known as the
summer monsoon blows from sea to land after crossing the
Indian Ocean, the Arabian Sea, and the Bay of Bengal. The
South-West monsoon brings most of the rainfall during a year in
the country.
India, a megadiverse country with only 2.4 per cent of the land
area, accounts for 7-8 per cent of the recorded species of the
world, including over 45,500 species of plants and 91,000
species of animals.
India is situated at the tri-junction of the Afro-tropical, the Indo-
Malayan and the Paleo-Arctic realms, which display significant
biodiversity. Being one of the 17 identified megadiverse
countries, it is home to 8.58 per cent of mammalians, 13.66 per
cent of avians, 7.91 per cent of reptilians, 4.66 per cent of
amphibians, 11.72 per cent of fish, and 11.80 per cent of plant
species documented so far.
BIODIVERSITY
India’s forest cover ranges from the tropical rainforest of the
Andaman Islands, Western Ghats, and North-Eastern India to the
coniferous forest of the Himalayas. Between these extremes lie
the Sal-dominated moist deciduous forest of Eastern India, the
Teak-dominated dry deciduous forest of Central and Southern
India, and the Babul-dominated thorn forest of Central Deccan
and Western Gangetic plains. Important Indian trees include
Neem, widely used in traditional Indian herbal remedies.
Among species found in India, only 12.6 per cent of mammals
and 4.5 per cent of birds are endemic, as against 45.8 per cent of
reptiles and 55.8 per cent of amphibians. Notable endemics are
the Nilgiri Leaf Monkey and the Brown and Carmine Beddome’s
Toad of the Western Ghats. India contains 172 (2.9 per cent) of
the IUCN designated threatened species. These include the
Asiatic Lion, the Bengal Tiger, and the Indian White-Rumped
Vulture, which suffered near-extinction situation from feeding
on the carrion of diclofenac-treated cattle.
Indian culture is marked by a high degree of syncretism and
cultural pluralism. It has managed to preserve established
traditions while absorbing new customs, traditions, and ideas
from invaders and immigrants and spreading its cultural
influence to other parts of Asia.
All the five major ethnic groups - Australoid, Mongoloid,
Europoid, Caucasian, and Negroid find representation among
the people of India. According to the 2001 census, out of the total
population of 1,028 million in the country, Hindus constituted
the majority with 80.5 per cent, Muslims were second at 13.4 per
cent, followed by Christians, Sikhs, Buddhists, Jains, and others.
Twenty two National Languages that have been recognized by
the Constitution of India, of which Hindi is the official union
language. Besides these, there are 844 different dialects spoken
in various parts of the country.
Architecture is one area that truly represents the diversity of
Indian culture. Much of it, including notable monuments and
heritage buildings such as the Taj Mahal, Red Fort of Agra,
Ajanta and Ellora Caves, Purana Quila, Qutub Minar, Elephanta
Caves, Jaisalmer Fort, Jantar Mantar, India Gate, Gateway of
India etc., comprises a blend of ancient and varied local
traditions from several parts of the country and abroad.
Vernacular architecture also displays notable regional variation.
Indian dance has diverse folk and classical forms. Among the
well-known folk dances are the bhangra of Punjab, the bihu of
Assam, the chhau of West Bengal, Jharkhand and Orissa and the
ghoomar of Rajasthan. Eight dance forms, many with narrative
forms and mythological elements, have been accorded the
'classical dance' status by India's National Academy of Music,
Dance, and Drama. These are: bharatanatyam of Tamil Nadu,
kathak of Uttar Pradesh, kathakali and mohiniyattam of Kerala,
kuchipudi of Andhra Pradesh, manipuri of Manipur, odissi of
Orissa and sattriya of Assam.
SOCIO - ECONOMIC & CULTURAL
PATTERN
Indian cuisine is characterized by a wide variety of regional
styles and the use of herbs and spices. The staple food in the
region is rice (especially in the South and the East) and wheat
(predominantly in the North). Spices that are native to the Indian
subcontinent are now consumed worldwide, for instance black
pepper. Indian cuisine is season specific and is based on scientific
combination of the medicinal and digestive properties of various
vegetables, pulses and spices duly balancing their positive and
negative effects on the body and digestive system. Turmeric,
saffron and other herbs for body care and Amla, Ritha, Neem etc.
for hair care and medicinal purposes have been traditionally used
for ages in India.
Traditional Indian dresses vary across the regions in their
materials, colours and styles and depend on various factors,
including climate. Popular dress-styles include draped garments
such as sari for women and dhoti or lungi for men. In addition,
stitched clothes such as salwar-kameez for women and kurta-
pyjama and European-style trousers and shirts for men, are also
popular.
Many Indian festivals are religious in origin, although several are
celebrated irrespective of caste and creed. Some popular festivals
are Diwali, Ganesh Chaturthi, Ugadi, Thai Pongal, Holi, Onam,
Vijayadasami, Durga Puja, Eid-ul-Fitr, Bakr-Id, Christmas,
Buddha Jayanti and Baisakhi. Religious practices are an integral
part of everyday life and are a public affair. Most festivals are
related to crop harvesting or with change of seasons and as such
are secular in nature.
The Constitution of India, the longest and the most exhaustive
constitution of any independent nation in the world, came into
force on 26 January, 1950.
The President of India is the Head of the State, elected indirectly
by an electoral college for a five year term. The Prime Minister is
the head of the government and exercises most executive powers.
The Prime Minister is appointed by the President and, by
POLITICAL & GOVERNANCE
STRUCTURE
India Gate
Swamp Deer in their natural habitat
join in Bangladesh, and continue to flow as River Padma or
Ganga. The Brahmaputra rises in Tibet, where it is known as
Tsangpo and runs a long distance till it crosses over into India in
Arunachal Pradesh under the name of Dihang. Near Passighat,
Debang and Lohit join river Brahmaputra and together run all
along Assam in a narrow valley. It crosses Bangladesh as a
downstream of Dhubri.
In the Deccan region, most of the major river systems flow in the
eastern direction and fall into the Bay of Bengal. The major East-
flowing rivers are Godavari, Krishna, Cauvery and Mahanadi.
Narmada and Tapti are the major West-flowing rivers.
River Godavari in the Southern peninsula forms the second
largest river basin, covering ten per cent of the total area of the
country, while the Mahanadi has the third largest basin. River
basin of the Narmada in the uplands of the Deccan, flowing into
the Arabian Sea, and of Cauvery in the south, falling into the Bay
of Bengal is about the same size, though with different character
and shape.
There are numerous coastal rivers, which are comparatively
smaller. While only a handful of such rivers drain into the sea
along the East Coast, there are as many as 600 such rivers on the
West Coast.
The climate of India may be broadly described as tropical
monsoonal type. There are four seasons:
CLIMATE

Overview7
State Of Environment Report-2009 6
.Courts, and a large number of trial courts. The Supreme Court
has original jurisdiction over cases involving fundamental rights
and disputes between states and the Centre, and appellate jurisdiction over the High Courts. It is judicially independent,
and has the power to declare the law and to strike down union or .state laws which contravene the Constitution. The role as the
ultimate interpreter of the Constitution is one of the most important functions of the Supreme Court.
India's diverse economy encompasses traditional village
farming, modern agriculture, fisheries, handicrafts, a wide range
of modern industries, and a multitude of services.
The structure of the Indian economy has undergone considerable
change in the last decade.
ECONOMIC BASE
of the Indian economy. Agriculture (including allied activities)
accounted for 17.8 per cent of the GDP in 2007-08 as compared to
21.7 per cent in 2003-04. Notwithstanding the fact that the share
of the agricultural sector in GDP has been declining over the
years, its role remains critical as it accounts for about 52 per cent
of the employment in the country. Apart from being the provider
of food and fodder, its importance also stems from the raw
materials that it provides to industry. The prosperity of the rural
economy is also closely linked to agriculture and allied activities.
Agricultural sector contributed 12.2 per cent of national exports
in 2007-08.
§Economic Survey of India, 2008-09,
§National Biodiversity Action Plan 2008, Ministry of
Environment & Forests
§Neuborne, Burt (2003). The Supreme Court of India.
International Journal of Constitutional Law 1 (1), 476–510
§Pylee, Moolamattom Varkey (2004). The Union Judiciary:
The Supreme Court, Constitutional Government in India, 2nd
edition, S. Chand, 314. ISBN 8121922038
§Sripati, Vuayashri (1998). Toward Fifty Years of
Constitutionalism and Fundamental Rights in India: Looking
Back to See Ahead (1950-2000). American University
International Law Review 14 (2), 413–496
§National Portal of India, Government of India
REFERENCES
Ministry of Finance
These include increasing importance of external trade and of
external capital flows. The services sector has become a major
contributor to the economy with GDP share of over 50 per cent
and the country becoming an important hub for exporting IT
services. The share of merchandise trade to GDP increased to
over 35 per cent in 2007-08 from 23.7 per cent in 2003-04. If the
trade in services is included, the trade ratio is 47 per cent of GDP
for 2007-08.
The overall growth of GDP at factor cost at constant prices in
2008-09, as per revised estimates released by the Central
Statistical Organization (CSO) (May 29, 2009) was 6.7 per cent.
This represented a decline of 2.1 per cent from the average
growth rate of 8.8 per cent in the previous five years (2003-04 to
2007-08).
The growth of GDP at factor cost (at constant 1999-2000 prices)
at 6.7 per cent in 2008-09 nevertheless represents a deceleration
from high growth of 9.0 per cent and 9.7 per cent in 2007-08 and
2006-07 respectively (Table 1.1)
The deceleration of growth in 2008-09 was spread across all
sectors except mining & quarrying and community, social and
personal services. The growth in agriculture and allied activities
decelerated from 4.9 per cent in 2007-08 to 1.6 per cent in 2008-
09, mainly on account of the high base effect of 2007- 08 and due
to a fall in the production of non-food crops including oilseeds,
cotton, sugarcane and jute. The production of wheat was also
marginally lower than in 2007-08.
The performance of the agricultural sector influences the growth
Parliament House
convention, is the candidate supported by the party or political
alliance holding the majority seats in the lower house of
Parliament.
The legislature of India is a bicameral Parliament, which consists
of the upper house called the Rajya Sabha and the lower house
called the Lok Sabha. The Rajya Sabha, a permanent body, has
245 members serving staggered six year terms. Most are elected
indirectly by the State and territorial legislatures in proportion to
the State's population. 543 of the Lok Sabha's 545 members are
directly elected by popular vote to represent individual
constituencies for a five year term. The other two members are
nominated by the President from the Anglo-Indian community if,
the President is of the opinion that the community is not
adequately represented.
India has a unitary three-tier judiciary, consisting of the Supreme
Court, headed by the Chief Justice of India, twenty-one High
Gloriosa superba - an ornamental orchid of Himalaya
Table 1.1: Rate of growth at factor cost at 1999-2000 prices (per cent)
Source: Economic Survey of India, 2008-09, Ministry of Finance
2003-04 2004-05 2005-06 2006-07 2007-08 2008-09Agriculture, forestry & fishing 10.0 0.0 5.8 4.0 4.9 1.6Mining & quarrying 3.1 8.2 4.9 8.8 3.3 3.6Manufacturing 6.6 8.7 9.1 11.8 8.2 2.4Electricity, gas & water supply 4.8 7.9 5.1 5.3 5.3 3.4Construction 12.0 16.1 16.2 11.8 10.1 7.2Trade, hotels & restaurants 10.1 7.7 10.3 10.4 10.1 *Transport, storage & communication 15.3 15.6 14.9 16.3 15.5 *Financing, insurance, real estate & business services 5.6 8.7 11.4 13.8 11.7 7.8Community, social & personal services 5.4 6.8 7.1 5.7 6.8 13.1Total GDP at factor cost 8.5 7.5 9.5 9.7 9.0 6.7
* Trade, hotels & restaurants, transport & communication (together) grew at 9 per cent, 2008-09

STATE & TRENDSOF THE ENVIRONME NT
STATE & TRENDSOF THE ENVIRONME NT
CHAPTER - 2

STATE & TRENDSOF THE ENVIRONME NT
STATE & TRENDSOF THE ENVIRONME NT
CHAPTER - 2

State & Trends of the Environment-Land11
State Of Environment Report-2009 10
India is the seventh largest country in the world, with a total land
area of 3,287,263 sq. km. (1,269,219 sq. miles). It measures
3 ,214 km (1 ,997 mi les ) f rom Nor th to Sou th
and 2,993 km (1,860 miles) from East to West. It has a
land frontier of 15,200 km (9,445 miles) and a coastline
of 7,517 km (4,671 miles). Ever-growing population and
urbanization is creeping into its forests and agricultural lands.
Although India occupies only 2.4 per cent of the world's total
land area, it supports over 16.7 per cent of the entire global
LANDpopulation. Of the total geographical area of 328.73 Mha., 306
Mha. comprise the reporting area and 146.82 Mha. land is
degraded land.
In India, an estimated 146.82 Mha. area suffers from various
forms of land degradation due to water and wind erosion and
other complex problems like alkalinity/salinity and soil acidity
due to water logging (Figure 2.1.2).
LAND DEGRADATION STATUS
Source: Agricultural Statistics at a Glance 2008, Ministry of Agriculture
Source: Compendium of Environment Statistics India, 2007
Figure 2.1.1 : Land Use Classification in India (2005-2006)
Net Area Sown Non Agricultural Uses
Permanent Pastures and Other Grazing Land
Miscellaneous Tree Crops and Groves Culturable Wasteland
Fallow Land Forests
Barren and Unculturable Land
47%
23%
8%
6%
3%1%
8%4%
Figure 2.1.2 : Extent of Various Kinds of Land Degradation in India
Source: National Bureau of Soil Survey and Land Use Planning, 2005
Win
d E
rosi
on
Wat
er E
rosi
on
Wat
er L
oggi
ng
Salin
ity /
Alk
alin
ity
Deg
rade
d A
rea
Geo
grap
hica
l Are
a
Soil
Aci
dity
Com
plex
Pro
blem
0
50
100
150
200
250
300
350
Lan
d D
egra
dat
ion
(A
rea
in m
illi
on h
ecta
re)
93.68
9.48 14.3 5.95 16.03 7.38
146.82
328.73
Source: Agricultural Statistics at a Glance 2008, Ministry of Agriculture
Classification
1
I. Geographical AreaII. Reporting Area for Land Utilisation Statistics (1 to 5)1. Forests2. Not Available for Cultivation (a+b)(a) Non Agricultural Uses(b) Barren and Unculturable Land3. Other Uncultivated Land excluding fallow Land(a+b+c)(a) Permanent Pastures and Other Grazing Land(b) Land Under Miscellaneous Tree Crops and Groves not
Included in Net Area Sown(c) Culturable Wasteland4. Fallow Land (a+b)(a) Fallow Land Other Than Current Fallows(b) Current Fallows5. Net Area Sown (6-7)6. Gross Cropped Area7. Area Sown More Than Once8. Cropping Intensity*III. Net Irrigated AreaIV. Gross Irrigated Area
Table 2.1.1: Land Use Classification in India, (2005-2006)
P : Provisional
* : Cropping Intensity is obtained by dividing the gross cropped area by the net area sown.Note : The decline in net area sown in 2002-03 reflects the impact of the severe drought of 2002-03 on agriculture operations.
2003-04(P)
5
328.73
305.3269.6742.23
24.6617.5726.9810.453.39
13.1425.4811.2014.28140.95190.3749.42
135.1056.0077.11
2004-05(P)
6
328.73
305.2369.6742.30
24.7217.5827.0010.433.38
13.1924.9410.7214.22
141.32190.9149.59
135.1058.5479.51
2000-01
2
328.73
305.0869.6241.55
23.8117.7427.7110.833.32
13.5625.0310.1914.84141.16185.7044.54131.6054.8475.82
2002-03(P)
4
328.73
305.2469.6442.08
24.2817.8027.4110.513.36
13.5433.4611.7621.70132.66175.6643.00132.4053.8872.89
2001-02(P)
3
328.73
305.0169.5141.78
24.0717.7127.3710.593.37
13.4124.9410.3014.64141.42189.7548.33
134.2056.3078.07
2005-06(P)
7
328.73
305.2769.7942.51
25.0317.4826.9210.423.38
13.1224.1710.5013.67
141.89192.8050.90
135.9060.2082.63
(Area in Mha)

State & Trends of the Environment-Land13
State Of Environment Report-2009 12
The varying degrees and types of degradation, stem mainly from
unstable use and inappropriate land management practices. Loss
of vegetation occurs as a result of deforestation, cutting beyond
the silviculturally permissible limits, unsustainable fuel-wood
and fodder extraction, shifting cultivation, encroachment into
forest lands, forest fires and over-grazing, all of which subject
the land to degradational forces. Other important factors
responsible for large-scale degradation are the extension of
cultivation to lands of low potential or high natural hazards, non-
adoption of adequate soil conservation measures, improper crop
rotation, indiscriminate use of agro-chemicals such as fertilizers
and pesticides, improper planning and management of irrigation
systems and extraction of groundwater in excess of the recharge
capacity. In addition, there are a few underlying or indirect
pressures such as land shortage, short-term or insecure land
tenancy, open access resource, economic status and poverty of
the agriculture dependent people which are also instrumental, to
a significant extent, for the degradation of land.
Agricultural Practices
Out of India's total geographical area (328.7 million hectares)
141.89 million hectares is the net sown area, while 192.80
million hectares is the gross cropped area. The net irrigated area
is 60.20 million hectares and the cropping intensity is 135.90 per
cent (Table 2.1.1).
A change in land use pattern implies variation in the proportion
of area under different land uses at a point in two or more time
periods. Over the past fifty years, while India's total population
increased by about three times, the total area of land under
cultivation increased by only 20.2 per cent (from 118.75 Mha. in
1951 to 141.89 Mha. in 2005-06). Most of this expansion has
taken place at the expense of forest and grazing land. Despite fast
expansion of the area under cultivation, less agricultural land is
available on per capita basis.
Direct consequences of agricultural development on the
environment arise from intensive farming activities, which
contribute to soil erosion, land salination and loss of nutrients.
The introduction of Green Revolution in the country has been
accompanied by over-exploitation of land and water resources
and excessive usage of fertilizers and pesticides. Shifting
cultivation (or Jhum cultivation) has also been a major factor
responsible for land degradation in hilly areas. Leaching due to
extensive use of pesticides and fertilizers is a major source of
contamination of water bodies.
The extent of agricultural intensification and extensification is
characterized by an increase in cropping and irrigation intensity
and the imbalanced use of chemical fertilizers, pesticides and
insecticides. It has also led to land degradation, over-
exploitation of underground water resources and increased use
of chemical fertilizers, leading to eutrophication and water
pollution in some regions.
Enhanced intensification and extensification also leads to
DRIVERS OF CHANGE
salination, alkalization and water logging in irrigated areas,
along with eutrophication of water bodies and ill health of
oceans, leading to loss of biodiversity. For achieving and
maintaining food security and sustainable forestry, controlling of
land/soil erosion is extremely vital.
It is essential to control soil erosion in order to attain and
maintain food security, sustainable forestry and agricultural and
rural development. Statistics reveal that only 23 per cent of the
applied fertilizer is consumed by plants, the remaining 77 per
cent is either leached out beyond the root zone or lost by
volatilization.
The current practice of shifting cultivation in the eastern and
north-eastern regions of India is an extravagant and unscientific
form of land use. According to a recent estimate, an area of
18765.86 sq. km. (0.59 percent of the total geographical area) is
under shifting cultivation. The effects of shifting cultivation are
devastating and far-reaching in degrading the environment and
ecology of these regions. The earlier 15–20 years cycle of
shifting cultivation on a particular land has reduced to two or
three years now. This has resulted in large-scale deforestation,
soil and nutrient loss, and invasion by weeds and other species.
The indigenous biodiversity has been affected to a large extent.
As per the statistics, Orissa accounts for the largest area under
shifting cultivation in India.
Shifting Cultivation
Excessive Chemical Usage
Per hectare consumption of fertilizers has increased from 69.8 kg
in 1991-92 to 113.3 kg in 2006-07, at an average rate of 3.3 per
cent. There is excessive use of urea and a bias against
micronutrients. As against the desirable NPK proportion of
4:2:1, the average use of urea now is 6:2 and 4:1. The Steering
Committee of the Planning Commission has observed that
“because nitrogenous fertilizers are subsidised more than
potassic and phosphatic fertilizers, the subsidy tends to benefit
the crops and regions which require higher use of nitrogenous
fertilizers as compared to crops and regions which require higher
application of P and K.” The excessive use of urea has also
affected the soil profile adversely (Table 2.1.2)
Agricultural Waste Residue Burning
Burning of wheat and rice straw and other agricultural residue
has also contributed to loss of soil fertility, apart from causing air
pollution. Open field burning of straw after combine harvesting
is a common practice in states like Punjab, Haryana and Uttar
Pradesh in order to ensure early preparation of fields for the next
crop. Punjab alone produces around 23 million tonnes of rice
straw and 17 million tonnes of wheat straw, annually. This straw
is rich in nitrogen, phosphorus and potassium. However, instead
of recycling it back into the soil by mulching, it is burnt in the
fields. This raises the temperature of the soil in the top three
inches to such a high degree that the carbon: nitrogen equilibrium
in soil changes rapidly. The carbon as CO is lost to the 2
atmosphere, while nitrogen is converted into a nitrate. This leads
to a loss of about 0.824 million tonnes of NPK from the soil. This
is about 50 per cent of the total fertilizer consumption in the state.
Considering that 90 per cent of rice straw and 30 per cent of the
wheat straw is available for recycling, it will be equivalent to
recycling of 0.56 million tonnes of nutrients worth Rs. 4 billion.
Moreover, agriculture experts also maintain that fire in the fields
kills friendly fauna and bacteria.
Soil Erosion
Soil is a unique non-renewable natural resource that supports life
on planet Earth. It is estimated that one-sixth of the world's soil
has already been degraded by water and wind erosion. In India,
approximately 130 Mha. of land area (or 45 percent of the total
geographical area) is affected by serious soil erosion through
ravines and gullies, shifting cultivation, cultivated wastelands,
sandy areas, deserts and water logging (Govt. of India, 1989).
Excessive soil erosion with consequent high rate of
sedimentation in the reservoirs and decreased fertility has
created serious environmental problems with disastrous
economic consequences.
In India, the Ganga, Brahmaputra and Kosi rivers carry huge
amounts of eroded soil in the form of heavy silt, which deposits
as sediments on the river bed. While soil erosion by rain and river
in hilli areas causes landslides and floods, deforestation,
overgrazing, traditional agricultural practices, mining and
Source: Agriculture Statistics at a Glance, 2006-07, Ministry of Agriculture
Year N P K Total
2000-01 10920.2 4214.6 1567.5 16702.3
2001-02 11310.2 4382.4 1667.1 17359.7
2002-03 10474.1 4018.8 1601.2 16094.1
2003-04 11077.0 4124.3 1597.9 16799.1
2004-05 11713.9 4623.8 2060.6 18398.3
2005-06 12723.3 5203.7 2413.3 20340.3
2006-07 13772.9 5543.3 2334.8 21651.0
( 1000 tonnes)
Table 2.1.2: All India Consumption of Fertilizers in Terms of Nutrients (N, P & K)
Forest fire caused by jhum burning
incorrect siting of development projects in forested areas have
resulted in exposing the green cover to severe soil erosion.
Ravines and gullies account for 4 Mha. of land erosion. The area
subjected to shifting cultivation reported 4.9 Mha. of eroded
land.
In India, erosion rates range from 5 to 20 tonnes per hectare,
sometimes going up to 100 tonnes per hectare. Nearly 93.68
million hectares are affected by water erosion and another 9.48
million hectares are affected by wind erosion annually in India.
Thus, erosion leads to impoverished soil on one hand, and silting
up of reservoirs and water tanks on the other.
Apart from checking soil erosion, the problem of conserving soil
moisture is also of immense importance in the extensive regions
of low and uncertain rainfall, forming parts of Punjab, Madhya
Pradesh, Maharashtra, Andhra Pradesh and Karnataka. These
tracts are characterized by scanty, ill-distributed and highly
erosive rains, undulating topography, high wind velocity and
generally shallow soils. The period of heavy downpour from
August to October is also the period of severe erosion in these
regions. About 76 per cent of Rajasthan's arid region is affected
by wind erosion of different intensities, and 13 per cent by water
erosion. In fact, 4 per cent of Rajasthan's arid area is affected by
water logging and salinity or alkalinity.
In India, very little area is free from the hazard of soil erosion. It is
estimated that out of 305.9 million hectares of reported area, 146
million hectares is in dire need of conservation measures.
Change in Forest Cover
Forests are not just trees, but part of an ecosystem that underpins
life, economies and societies. Forests provide a wide range of
services which include prevention of soil erosion, floods,
landslides, maintenance of soil fertility, and fixing carbon from
the atmosphere as biomass and soil-organic carbon.
The total forest cover of the country, as per the 2005 assessment,
is 677,088 sq. km. which constitutes 20.60 per cent of the
geographic area of the country (Table 2.1.3 and Figure 2.1.4).
Dry Deciduous Forests of the Melghat Tiger Reserve

State & Trends of the Environment-Land15
State Of Environment Report-2009 14
Figure 2.1.4: Forest Cover Map of India
Source: Forest Survey of India, 2005
Between 2003 and 2005, the total forest cover had decreased
slightly by 728 sq. km. The states, which have shown a decline in
the forest covers, are Nagaland (296 sq. km), Manipur (173 sq.
km), Madhya Pradesh (132 sq. km) and Chhattisgarh (129 sq.
km). There has been a significant loss of forest cover in the
Andaman and Nicobar Islands (178 sq. km) because of the
Tsunami, whereas the states of Tamil Nadu (41 sq. km) and
Tripura (32 sq. km) have shown a marginal increase in the forest
cover, with Arunachal Pradesh (85 sq. km) showing significant
increase in the total forest cover (Figure 2.1.3).
Mining
India is rich in a variety of natural resources. Along with 56 per
cent arable land, it has a significant number of sources of coal,
iron ore, manganese, mica, bauxite, titanium ore, chromite,
natural gas, diamonds, petroleum and limestone. India is self-
sufficient in thorium, which is mined along the shores of Kerala,
comprising 24 per cent of the world's known and economically
available thorium.
Land degradation is considered to be unavoidable by-product of
mining and has reached alarming proportions, mainly due to
over-exploitation and mismanagement of natural resources.
Mining activity often leads to environmental problems like land
degradation, particularly in opencast mining and land subsidence
in underground mining. Open-cast mining in areas with forest
cover causes deforestation.
Mining complexes, as estimated recently, occupy around 0.06
per cent of the total land area of the country.
Flooding
The increasing frequency of floods in India is largely due to
deforestation in the catchment areas, destruction of surface
vegetation, change in land-use, increased urbanization and other
developmental activities. The main reason, however, is the
increased sedimentation and reduced capacity of drainage
systems. Consequently, streams and rivers overflow their banks,
flooding the downstream areas. These are of frequent occurrence
in many parts of India, especially in hilly terrains, causing a
disruption of normal life and considerable damage to the
productive land system. The problem of human-induced water
logging in India is more common in canal command areas
(surface irrigation) because irrigation facilities are often
introduced without adequate provision for drainage.
Desertification
In India, 228.3 Mha. of geographical area comprises arid
(50.8 Mha.), semi-arid (123.4 Mha.) and dry sub-humid regions
(54.1 Mha.). Western parts of Rajasthan and Kutch are
chronically drought affected. As a matter of fact, droughts occur
frequently in the areas affected by desertification (Figure 2.1.5).
The total tree cover of the country has been estimated as 91,663
sq. km. or about 2.79 per cent of the country's geographical area
(State of Forest Report, 2005).
Figure 2.1.3 : Change in the Forest Cover of India
Source: State of Environment Atlas of India 2007, MoEF
Gain of ForestLoss of ForestNo Change
Change of Forest
Figure 2.1.5: Drought Prone Areas of India
Source: State of Environment Atlas of India 2007, MoEF
Source: Compendium of Environment Statistics - India, 2007
Table 2.1.3: Status of Forest Cover in India, 2005
Class Area (sq. km.) Percentage of Geographical Area
1 2 3
Very Dense Forest 54569 1.66
Moderately Dense Forest
332647 10.12
Open Forest 289872 8.82
Total Forest Cover 677088 20.60
Scrub 38475 1.17
Non-Forest 2571700 78.23
Total Geographical Area
3287263 100.00
Forest Cover
Non-Forest Cover
Pollution
Soil pollution from heavy metals due to improper disposal of
industrial effluents, along with the excessive use of pesticides
and mismanagement of domestic and municipal wastes, is
becoming a major concern. Though no reliable estimates are
available to depict the exact extent and degree of this type of land
degradation, it is believed that the problem is extensive and its
effects are significant. Some commercial fertilizers also contain
appreciable quantities of heavy metals, which have undesirable
effects on the environment. The indiscriminate use of agro-
chemicals, such as fertilizers and pesticides, is often responsible
for land degradation. Soil texture, infiltration and permeability Wasteland reclamation through Dhaincha plantation
Population pressure, poverty and weak institutional framework have often been viewed as the predominant underlying causes
of forest depletion and degradation in developing countries. Excessive population and livestock pressure and the requirements
of forest products for essential development generate pressure on forest resources like fuel-wood, fodder, timber, lumber, paper,
which in turn triggers deforestation. Over-exploitation of the forest resources, as compared to its incremental and regenerative
capacities, escalates the forest depletion and degradation process. India has witnessed a spurt of large projects from big dams
and thermal power projects to huge mines and massive industrial complexes. About 92 per cent area in arid Rajasthan is affected
by desertification (30 per cent slightly, 41 per cent moderately and 21 per cent severely). In the neighbouring arid Gujarat, about
93 per cent area is affected by desertification.
Box 2.1.1: Drivers and Pressures Affecting Forest Ecosystems
characteristics are affected adversely to a considerable extent due
to excessive grazing, fire and mismanagement of land under
cultivation.
1. Watershed management programmes have been taken up
extensively in the recent past. The Soil and Water
Conservation Division in the Ministry of Agriculture has
been playing a key role in implementing Integrated
Watershed Management Programmes. IWDP (Integrated
Watershed Development Programme) was launched in the
year 1989-90 to develop the wastelands on watershed basis,
to strengthen the natural resource base and to promote the
overall economic development of the resource-poor and
disadvantaged sections of people inhabiting the programme
areas.
2. The National Bureau of Soil Survey and Land Use Planning,
the Central Soil and Water Conservation Research and
Training Institute and the Indian Council of Agricultural
Research (ICAR), have jointly initiated the preparation of
maps of soil erosion affected areas in different states using the
components of Universal Soil Loss Equation. Similar
assessments needs to be carried out for other degradation
processes also. In addition, the All-India Soil and Land Use
Survey, MoA, is engaged in generating spatial and non-
spatial information on the soils of India and preparing
RESPONSE

State & Trends of the Environment-Land17
State Of Environment Report-2009 16
5. Drought Prone Areas Programme (DPAP): The Rural Works
Programme (RWP) initiated in 1970-71 was re-designated as
Drought Prone Areas Programme (DPAP) in 1973-74 to
focus solely on problems of drought prone areas. At present,
DPAP is under implementation in 972 Blocks of 185 Districts
in 16 States (Table 2.1.4).
6. Desert Development Programme (DDP): The Desert
Development Programme (DDP) was started both in hot
desert areas of Rajasthan, Gujarat and Haryana and the cold
deserts of Jammu & Kashmir and Himachal Pradesh in 1977-
78. From 1995-96, the coverage has been extended to a few
more districts in Andhra Pradesh and Karnataka.
DDP was launched to tackle special problems of desert areas.
The basic objective of this programme is to minimize the
adverse effect of drought, and to control desertification
through rejuvenation of the natural resource base of the
identified desert areas. The programme also aims at
promoting overall economic development and improving the
socio-economic conditions of the resource - poor and
disadvantaged sections of people inhabiting the programme
areas. DDP is under implementation in 235 blocks of 40
districts in seven states having the coverage of about 45.7
Mha.
7. The National Land Use & Conservation Board’s (NLCB)
objective is to serve as a policy planning, coordinating and
monitoring agency at the national level for issues concerning
the health and scientific management of land resources of the
country.
8. The Programme for Reclamation of Alkali Soil (RAS) was
launched in the Seventh Five Year Plan for reclamation of
soils, which are suffering from alkalinity. About 7 Mha. area
in the country is affected by the salt problem, out of which
about 3.58 Mha. area suffers from alkalinity. Such alkali soils
are largely located in 11 states, namely- Andhra Pradesh,
Bihar, Gujarat, Haryana, Karnataka, Madhya Pradesh,
thematic maps like land capability classification,
hydrological soil grouping, irrigability classification, etc.
The state governments are also working on various aspects of
soil conservation, following the guidelines of the Centre.
3. Joint Forest Management Programme: In India, Joint Forest
Management (JFM) has emerged as an important
intervention in management of forest resources. It recognizes
the livelihood and sustenance needs of the people through the
principle of 'care and share'. The concept of JFM has been
interpreted in various ways but the basic element in this
concept is to establish grassroots community based
institutions for protection and management of forests. The
programme aims at empowering local people for their active
participation as partners in the management of forest
resources and sharing the benefits derived from its protection
and management. The JFM approach optimizes the returns,
minimizes conflicts and links the forestry development
works with the overall development of land based resources.
It also aims at building technical and managerial capability at
the grassroots level.
4. Soil conservation in arid, semi-arid and dry sub-humid areas
was included as one of the themes in the 'International
Convention on Combating Desertification' held in December
1996. India participated and ratified its commitments. The
objective was to curtail wide scale deforestation and
watershed degradation through appropriate corrective
measures.
Sl.No.
States No. of Districts
No. of Blocks
Area in Sq. Km.
1 Andhra Pradesh
2 Bihar
3 Chhattisgarh
4 Gujarat
5 Himachal Pradesh
6 Jammu & Kashmir
7 Jharkhand
8 Karnataka
9 Madhya Pradesh
10 Maharashtra
11 Orissa
12 Rajasthan
13 Tamil Nadu
14 Uttar Pradesh
15 Uttrakhand
16 West Bengal
Total
11
6
8
14
3
2
15
15
24
25
8
11
17
15
7
4
185
94
30
29
67
10
22
100
81
105
149
47
32
80
60
30
36
972
99,218
9,533
21,801
43,938
3,319
14,705
34,843
84,332
89,101
1,94,473
26,178
31,969
29,416
35, 698
15,796
11,594
7,45,914
Source: Annual Report 2007-2008, Ministry of Rural Development
Table 2.1.4: States under Drought Prone Area Programme
Slope stabilization for soil conservation
Maharashtra, Punjab, Rajasthan, Tamil Nadu and Uttar
Pradesh.
The main objectives of the programme are:-
§Reclamation of the lands affected by alkalinity and
improving land productivity by growing salt tolerant crops
and horticulture plantations;
§Increase the production of fuel- wood and fodder;
§Improve capacity of extension personnel and beneficiaries in
various aspects of alkali land reclamation technology;
§Generate employment opportunities, thereby reducing
rural-urban migration.
Since the inception of the programme, till its end in 2004-05, an
area of 6.59 lakh ha. had been reclaimed under this programme.
9. Watershed Development Project in Shifting Cultivation
Areas (WDPSCA) is basically a central assistance to states
with an objective of overall development of jhum areas on
watershed basis, reclaiming the land affected by shifting
cultivation and socio-economic upgradation of jhumia
families so as to encourage them for settled agriculture. The
scheme is being implemented since 1994-95.
10. The Programme on Soil Conservation for Enhancing the
Productivity of Degraded Lands in the Catchments of River
Valley Project and Flood Prone River (RVP and FPR):
Presently, this programme is being implemented in 53
catchments having a total catchment area of 110.11 Mha.
falling in 27 states namely - Assam, Andhra Pradesh,
Arunachal Pradesh, Bihar, Chhattisgarh, Gujarat, Haryana,
Himachal Pradesh, Jammu & Kashmir, Jharkhand,
Karnataka, Kerala, Madhya Pradesh, Maharashtra,
Mizoram, Meghalaya, Manipur, Nagaland, Orissa, Punjab,
Bihar : A Flood Prone State
Rajasthan, Sikkim, Tamil Nadu, Tripura, Uttar Pradesh,
Uttaranchal and West Bengal.
The major objectives of the programme are:
§Prevention of land degradation by adoption of a
multi–disciplinary integrated approach of soil conservation
and watershed management in catchment areas;
§Improvement of land capability and moisture regime in the
watersheds;
§Promotion of land use to match the land capability; and
§Prevention of soil loss from the catchments to reduce siltation
of multipurpose reservoirs and enhance the in-situ moisture
conservation and surface rainwater storage in the catchments
to reduce flood peaks and the volume of run-off.
From the inception of the programme, till the end of the IX Plan
(2005-06), an area of 62.58 lakh ha. had been treated.
11. Several initiatives for proper management of agricultural
waste have also been taken up for promoting alternative uses
of straw instead of burning it in the fields. The Department of
Science, Technology & Environment, Government of Punjab
constituted a task force in September, 2006 for formulation of
a policy to mitigate the problem generated due to severity of
burning of agricultural waste in the open fields after
harvesting, and its consequent effects on soil, ambient air and
health of living organisms. The task force has suggested
promotion of agronomic practices and technological
measures for better utilization of agricultural waste. These
include use of happy seeder, developed by Punjab
Agricultural University in collaboration with Australian
Centre for International Agriculture Research (ACIAR) and
use of paddy straw for power generation. The happy seeder,

State & Trends of the Environment-Land19
State Of Environment Report-2009 18
Prevention of coastal erosion at Kanya Kumari
machine is compact and lightweight, and is tractor-mounted.
It consists of two separate units, a straw management unit and
a sowing unit. The happy seeder cuts, lifts and throws the
standing stubble and loose straw and sows in one operational
pass of the field while retaining the rice residue as surface
mulch. It has thus the capability of managing the total loose
straw and cutting rice residue in strips, which are thrown in
front of each furrow opener.
Consequently, burning of paddy and wheat straw in the fields
has been banned in the state of Punjab.
§Land degradation problem can be tackled to an extent by
suitable policies that would internalize degradation into
proper decision-making, wherever possible. Inappropriate
policy choices in the Indian context like free or highly
subsidized pricing of electricity for tube well irrigation,
heavily subsidized surface water for irrigation and
subsidized chemical inputs have aggravated the problem. For
example, overuse of poor quality tube well water has led to
soil salinity. Economic instruments in the form of balanced
incentives will be a cost-effective measure to encourage
farmers to adopt soil conservation practices. For problems
POLICY SUGGESTIONS
regarding over-application of chemical inputs, in the long
run, conjunctive use of chemical inputs with bio-inputs along
with farm residue is the only answer.
§At the macro level, the existing database on land use statistics
cannot adequately facilitate the analysis of land degradation
and its impact. Modifications in the classification of land use
statistics are needed in order to study its environmental
impacts. Advanced technology like Remote Sensing can go a
long way in helping generate better information on the
different dimensions of land degradation.
§The information base on which farmers make decisions is
incomplete with respect to internalizing rapid changes in soil
and water quality variables, by moving towards more
sustainable practices such as integrated pest management and
land-conserving crop rotations. Research needs to be focused
on measures such as integrated crop management. An
integrated approach to the problem of degradation, linking
agriculture and environment, is yet to be attempted even at the
policy level.
§Farm research should address the issue of balancing the
external inputs usage and the internal sources of nutrients.
Thus from a policy perspective, there is a need for public and
private initiative on several fronts - increased investment in
A view of Annamalai forest
resource management, research and extension; research to
develop suitable and more sustainable cropping patterns and
rotations; correction of price distortions on key inputs,
especially water and electricity; and special incentives to
invest in bio-inputs and also inputs like gypsum, which helps
in reclamation of salt-affected soil. Such policy interventions
may be rewarding if they can counteract the environmentally
perverse land use. However, costs of such interventions have
to be considered against their potential benefits, before
making definite policy prescriptions.
§Develop and implement viable models of public-private
partnerships for setting up and operating secure landfills,
incinerators, and other appropriate techniques for the
treatment and disposal of toxic and hazardous waste, both
industrial and biomedical, on payment by users, taking the
concerns of local communities into account.
§Develop and implement strategies for cleaning up toxic and
hazardous waste dump legacies, particularly in industrial
areas, and abandoned mines, and work towards reclamation
of such lands for future sustainable use.
§Annual Report 2007-08, Ministry of Rural Development
§Annual Report 2007-08, Ministry of Agriculture
§Badrinath K. V. S., Kiran Chand T. R. and Krishna Prasad V.
(2006). Agriculture Crop Residue Burning in the Indo-
Gangetic Plains - A study using IRS-P6 AWiFS satellite data.
Current Science Vol. 91(8), 1085-1089
REFERENCES
.
§Benbi D. K., Nayyar V.K. and Brar J.S. (2006). The Green
Revolution in Punjab: Impact on Soil Health. Indian Journal
of Fertilizers. Vol 2(4), 57-66
§Compendium of Environment Statistics India 2007, Ministry
of Statistics & Programme Implementation
§Economic Survey of India 2007-08, Ministry of Finance
§Dr Dewaram A. Nagdeve (2004).Environment and Health in
India. Population & Environment. Vol 25 (5), 461-473
§Dr G. Mythili. Intensive Agriculture and its Impact on Land
Degradation, Center of Excellence, Madras School of
Economics
§National Environmental Policy 2006, Ministry of
Environment and Forestsrd
§3 National Report on Implementation of the United Nations
Convention to Combat Desertification 2006, Ministry of
Environment & Forests
§Sidhu B. S. and Beri V. (1989). Effects of Crop Residue
Management on the Yields of Different Crops and on Soil
Properties. Biol. Wastes. 27, 15–27
§Status of Environment Punjab 2007, Punjab State Council for
Science & Technology
§State of Forest Report 2005, Forest Survey of India, Ministry
of Environment & Forests
§Wasteland Atlas of India, 2005, Department of Land
Resources, Ministry of Rural Development
§Ministry of Statistics & Programme Implementation,
Government of India

1970
-71
1950
-51
0
1980
-81
10000
1960
-61
1990
-91
2000
-01
2003
-04
2002
-03
2004
-05(
a)
2005
-06(
a)
20000
30000
40000
50000
60000
70000
80000
90000
100000
Nu
mb
er o
f re
gist
ered
ve
hic
les
(th
ousa
nd
)
Total Vehicles
Note :(a) provisionalSource: Economic Survey of India, 2007-2008, Ministry of Finance
Figure 2.2.2 : Total Registered Motor Vehicles in India
State & Trends of the Environment-Air21
State Of Environment Report-2009 20
AIR
i.e. almost double (Bose 1997). The increase in population has
been hinting towards an alarming situation. India sustains 16.7
per cent of the world's population on 2.4 per cent of its land area,
exerting tremendous pressure on its natural resources. In fact, the
growing air pollution menace is deadly for the urban poor in
India, 50-60 per cent of whom live in slums.
Following the trends of urbanization and population growth in
Indian cities, people buying more vehicles for personal use have
perpetuated an increase in vehicles that contribute to vehicular
emissions containing pollutants such as sulfur dioxide, nitrogen
oxides, carbon monoxide, lead, ozone, benzene, and
hydrocarbons (Goyal 2005).
In India, air pollution is proving to be an issue of concern. India's
ongoing population explosion along with rapid urbanization and
industrialization has placed significant pressure on its
infrastructure and natural resources. While industrial
development has contributed significantly to economic growth
in India, it has done so at considerable cost to the environment.
Air pollution and its resultant impacts can be attributed to
emissions from vehicular, industrial and domestic activities. The
air quality has been, therefore, an issue of social concern in the
backdrop of various developmental activities.
There has been unbalanced industrial growth, unplanned
urbanization and deforestation. According to reports, India's
urban air quality ranks amongest the world's worst. Of the three
million premature deaths in the world that occur each year due to
outdoor and indoor air pollution, the highest numbers are
assessed to occur in India. Some cities in India have witnessed
decline in air pollution levels due to various measures taken by
the Governments. In fact, according to a World Bank study,
Delhi, Mumbai, Kolkata, Ahmedabad and Hyderabad have seen
about 13,000 less premature deaths from air pollution related
diseases.
Population Growth
India has witnessed an explosive growth of population (0.3
billion in the year 1950 to 1.04 billion in the year 2002)
accompanied by unplanned urbanization over the last five
decades (Figure 2.2.1).
The total population of India is expected to exceed 1.6 billion by
the year 2050 (Oldenburg 2005). The population growth has
mainly centered on cities with large scale migration of rural
population in search of livelihoods. In addition, high population
growth rates especially in the Indo-Gangetic (IG) basin has
resulted in unbalanced human concentration. The result is that IG
basin is one of the most densely populated regions in the world.
This rapidly expanding population, especially in urban areas, is
one of the main reasons for environmental concerns in the
country. This problem can be narrowed down to many of the
large cities in India. Between 1997 and 2020, the population of
India's second largest city (Delhi) is expected to grow 1.9 times,
PRESSURES AFFECTING AIR QUALITY
Industrial emissions : A major cause of air pollution
Pop
ulat
ion
(mil
lion
)
0
0.2
0.4
0.6
1.2
1.0
0.8
1961
1966
1971
1976
1981
1986
1996
2001
1991
IndiaTotal
UrbanNon-Agr Pop
RuralAgr Pop
Source: Census, 2001
Figure 2.2.1: Total Rural, Urban, Agricultural Population Growth (Agr Pop) and Non- Agricultural
Population (Non-Agr Pop)) for India, Since 1961
2 Wheelers 4 Wheelers Buses 3 Wheelers
2 Wheelers4 Wheelers
Buses
3 Wheelers
0
50,000
100,000
150,000
200,000
250,000
300,000 Thousands
19801985
19901996
20012006
20112016
20212026
Source: Transportation economics and environmental issues that influence product strategy, TERI 2003
Figure 2.2.3: Vehicular Growth in India
Vehicular Emission Load
As a result of urbanization in India, pressure on urban transport is
likely to increase substantially in this new millennium. Total
vehicle population of India is more than 85 million (about 1 per
cent share of the world) (Figure 2.2.2). The increase in vehicles,
as well as the presence of other motorized forms of
transportation (taxis, autos, trains, buses, etc.), will contribute to
the already existent large amount of vehicular emissions. The
worst thing about vehicular pollution is that it cannot be avoided
as the vehicular emissions are emitted at near-ground level.
Following the trend of Delhi's urbanization and the lack of
appropriate mass transport system, people buying more vehicles
for personal use have perpetuated an increase in vehicles. The
amount of registered vehicles in Delhi has increased fifty-one
times over a thirty year period. Unbelievably, as much as 17 per
cent of the cars in India run in Delhi alone. It has more cars than
the total numbers of cars in the individual states of Maharashtra,
Tamil Nadu, Gujarat and West Bengal. The vehicle stock in
Delhi is expected to almost quadruple by the year 2020.
However, there are several ways by which government, industry,
and the public can significantly contribute to the twin goals of
reducing our dependence on motor vehicles and consequently
reducing harmful emissions. A vigilant, informed, and active
citizenry will help ensure that air pollution concerns are factored
into the way we plan our cities, towns, and transportation
systems.
Industrial Sector Growth
Growth of India's economy is led by a robust performance of the
industrial sector (Table 2.2.1 & 2.2.2). The development of a
diversified industrial structure, based on a combination of large
and small-scale industries, along with growing population has
contributed to the growing incidence of air pollution. Impressive
growth in manufacturing (7.4 per cent average over the past
10 years) is a reflection of growth trends in the fields of
electronics and information technology, texti les,
pharmaceuticals, basic chemicals etc. These industries, belong to
the 'red category' of major polluting processes designated by the
Central Pollution Control Board (CPCB), and have significant
environmental consequences in terms of air emissions. The
economic boom has also led to an increase in investments and
activities in the construction, mining, and iron and steel sectors.
This in turn, is causing a significant increase in brick making
units, sponge iron plants and steel re-rolling mills that involve
highly polluting processes.
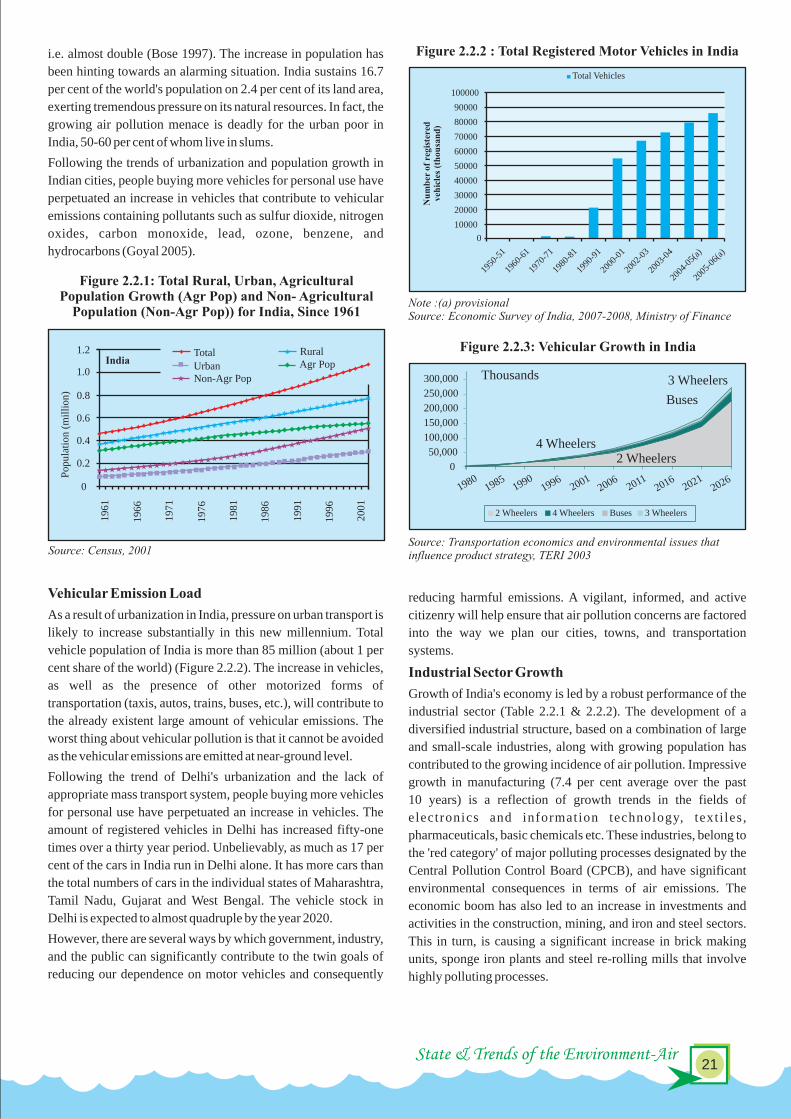

State & Trends of the Environment-Air23
State Of Environment Report-2009 22
Agricultural Waste Burning
Almost all the leading newspapers of northern India published
reports on the incident of a thick cloud of smog that enveloped
many parts of Punjab and Haryana on 15 October, 2005. People
experienced reduced visibility, besides irritation in the eyes and
throat. This smog was attributed to the large scale burning of rice
straw by farmers.
Punjab alone produces around 23 million tonnes of rice straw
and 17 million tonnes of wheat straw annually. More than 80 per
cent of paddy straw (18.4 million tonnes) and almost 50 per cent
wheat straw (8.5 million tonnes) produced in the state is being
burnt in fields every year.
Apart from affecting the soil fertility, this also causes air
pollution due to emission of large amounts of suspended
particulate matter, besides gases like CH , CO, NO , SO , etc., 4 2 2
leading to various health hazards like respiratory, skin and eye
diseases. Intensive agriculture is also a contributor to greenhouse
gases (GHG) like carbon dioxide, methane and nitrous oxide,
causing climate change. At an all India level, emissions from the
agriculture sector are reported to be 28 per cent of the aggregate
national emissions. These include emissions from enteric
fermentation in livestock, manure management, rice cultivation
and burning of agricultural crop residues.
The National Remote Sensing Agency (NRSA), Hyderabad
(Badrinath et al., 2006) conducted a study to calculate the total
emissions produced from straw-burning during the harvesting
season in Punjab. The calculated total emissions suggested that
wheat crop residue burning contributed to about 113 Gg (Giga
gram: 10 billion gram or 10 million kg) of CO, 8.6 Gg of NO , x
1.33 Gg of CH , 13 Gg PM (smoke) and 12 Gg of PM during 4 10 2.5
May 2005.
The extent of paddy crop residue burning in Punjab only during
October 2005 had been estimated to be in an area of 12,685 sq.
km., which is much higher than the wheat crop residue burning
that occurs during the month of May each year. Emissions from
burning paddy fields were estimated to be 261 Gg of CO, 19.8 Gg
of NO , 3 Gg of CH , 30 Gg of PM and 28.3 Gg of PM during x 4 10 2.5
October 2005.
Domestic Sector - Indoor Air Pollution
A considerable amount of air pollution results from burning of
fossil fuels. The household sector is the second largest consumer
of energy in India after the industrial sector. National Family
Health Survey-3 (NFHS-3) found that 71 per cent of India's
households use solid fuels for cooking and that 91 per cent of
rural households also do the same. According to National Family
Health Survey-3, more than 60 per cent of Indian households
depend on traditional sources of energy like fuel-wood, dung and
crop residue for meeting their cooking and heating needs (Figure
2.2.4). Burning of traditional fuels introduces large quantities of
CO in the atmosphere, when the combustion is complete, but if 2
there is an incomplete combustion followed by oxidation, then
CO is produced, in addition to hydrocarbons.
account for around 62.2 per cent of total power generation in the
country. Coal is a major energy source catering to India's
growing energy needs. It meets about 51 per cent of the country's
commercial energy needs, and about 70 per cent of the electricity
produced in India comes from coal. Thus, coal continues to be
the mainstay for the Indian power sector.
India's heavy reliance on coal explains the country's relatively
high carbon intensity level. Coal production through opencast
mining, its supply to and consumption in power stations, and
industrial boilers leads to particulate and gaseous pollution.
Radioactive emissions from nuclear power plants are of grave
concern as they can cause serious impact both in terms of spatial
and inter-generational effects.
The industrial units in India are largely located in the states of
Gujarat, Maharashtra, Uttar Pradesh, Bihar, West Bengal and
Madhya Pradesh. The highest concentration of sulphur dioxide
and oxides of nitrogen is, therefore, often found in cities located
in these states. Some other industrial states in Delhi, Punjab,
Rajasthan and Andhra Pradesh are also becoming critical.
Power Sector
The power sector is a major consumer of coal, using about 78 per
cent of the country's coal production. Coal-fired thermal units
In 2006-07, India had encountered 495.54 million tonne/year of
total absolute emissions of CO from the power sector (Table 2
2.2.3). However, the contribution of India to the cumulative
global CO emissions is only 5 per cent. Thus historically, and at 2
present, India's share in the carbon stock in the atmosphere is
relatively very small when compared to its population. With
high capital costs associated with replacing existing coal-fired
plants and the long time required to introduce advanced coal
technologies, many of India's highly polluting coal-fired power
plants are expected to remain in operation for the next couple of
decades, thereby keeping India's carbon emissions on the rise.
STATEWISE AIR QUALITY TRENDS
CPCB has identified a list of polluted cities in which the
prescribed National Ambient Air Quality Standards (NAAQS)
are violated. Action plans are being formulated and 88 of them
are being implemented to control air pollution in non- attainment
cities by respective states.
Ambient Air Quality Trends
Central Pollution Control Board is executing a nation-wide
programme of ambient air quality monitoring known as National
Air Quality Monitoring Programme (NAMP). The network
consists of 342 monitoring stations covering 127 cities/towns in
26 States and 4 Union Territories of the country.
The country-wide ambient air quality monitoring carried out by
CPCB at 201 monitoring stations revealed that National Ambient
Air Quality Standards (NAAQS) for Respirable Suspended
Particulate Matter (RSPM), the main air pollutant of public
health concern, were violated at most of the monitoring stations
(MoEF, 2005). The estimated annual economic cost of damage to
public health from increased air pollution, based on RSPM
measurements for 50 cities with the total population of 110
million, reached USD 3 billion (Rs.15,000 crores) in 2004.
Air quality data and trends highlight an emerging phenomenon
of conflicting trends for different categories of cities, similar to
that experienced by many other countries, thereby reflecting the
complex forces behind the impact of growth on environmental
action and outcome.
Sulphur Dioxide (SO )2
Annual average concentration of SO levels are within the 2
prescribed National Ambient Air Quality Standards (NAAQS) at
(a): based on Index of industrial production. Base 1993-94=100; figure for April-Nov 2006-07
Period Mining Manufacturing Electricity General
(weights) (10.47) (79.36) (100.00)
1995-962000-012001-022002-032003-042004-052005-062006-072007-08(Apr-Nov)
9.72.81.25.85.24.41.05.4
4.9b(4.2 )
14.15.32.96.07.49.29.112.5
9.8b(11.8 )
(10.17)
8.14.03.13.25.15.25.27.2
7.0b(7.3 )
13.05.02.75.77.08.48.211.6
9.2b(10.9 )
Table 2.2.1 : Annual Growth Rates (Per Cent) For Industries
Source: Economical Survey of India, 2007-2008, Ministry of Finance
Source: Annual Report, 2007-2008, Planning Commission
Year Agriculture Industry Services Total
2002-03 -7.2 7.1 7.4 3.8
2003-04 10.0 7.4 8.5 8.5
2004-05 0.0 9.8 9.6 7.5
2005-06 (QE) 6.0 9.6 9.8 9.0
2006-07 (RE) 2.7 10.9 11.0 9.4
Average:Tenth Plan
2.1 8.9 9.3 7.6
(at Factor Cost, 1999-2000 prices) Table 2.2.2: Sectoral Growth Rates
Note: QE – Quick Estimates ; RE – Revised Estimates
Region 2000-01 2001-02 2002-03 2003-04 2004-05 2005-06 2006-07
1 2 3 4 5 6 7 8
North 97.87 102.74 106.81 110.00 112.21 120.10 129.55
East 58.03 61.43 66.59 75.51 83.96 92.52 93.36
South 89.02 92.18 105.24 108.12 105.60 101.76 109.25
West 135.19 141.60 148.56 144.13 157.78 153.93 157.72
North-East 2.21 2.16 2.29 2.46 2.47 2.53 2.65
India 382.31 4000.11 429.48 440.22 462.02 470.85 495.54
Table 2.2.3: Total Absolute Emissions of CO (Million Tonnes/Year)2
From the Power Sector by Region for 2000-01 to 2006-2007
Source: Compendium of Environment Statistics - India, 2007
Source: , 2005-2006National Family Health Survey-3
Figure 2.2.4: Proportion of Households by Type of Fuel Usage
Air borne emissions emitted from various industries are a cause
of major concern. These emissions are of two forms, viz. solid
particles (SPM) and gaseous emissions (SO , NO , CO, etc.). 2 2
Heavy polluting industries were identified which are included
under the 17 categories of highly polluting industries for the
purpose of monitoring and regulating pollution from them. The
Ministry of Environment and Forests has developed standards
for regulating emissions for various industries including thermal
power stations, iron and steel plants, cement plants, fertilizer
plants, oil refineries, pulp and paper, petrochemicals, sugar,
distilleries and tanneries.
LPG
Kerosene
Coal
Wood
Dung cakes
Other
NFHS-1
4
8
114
10
64
NFHS-2
59
77
17
8
3
NFHS-3
49
11
1225
32
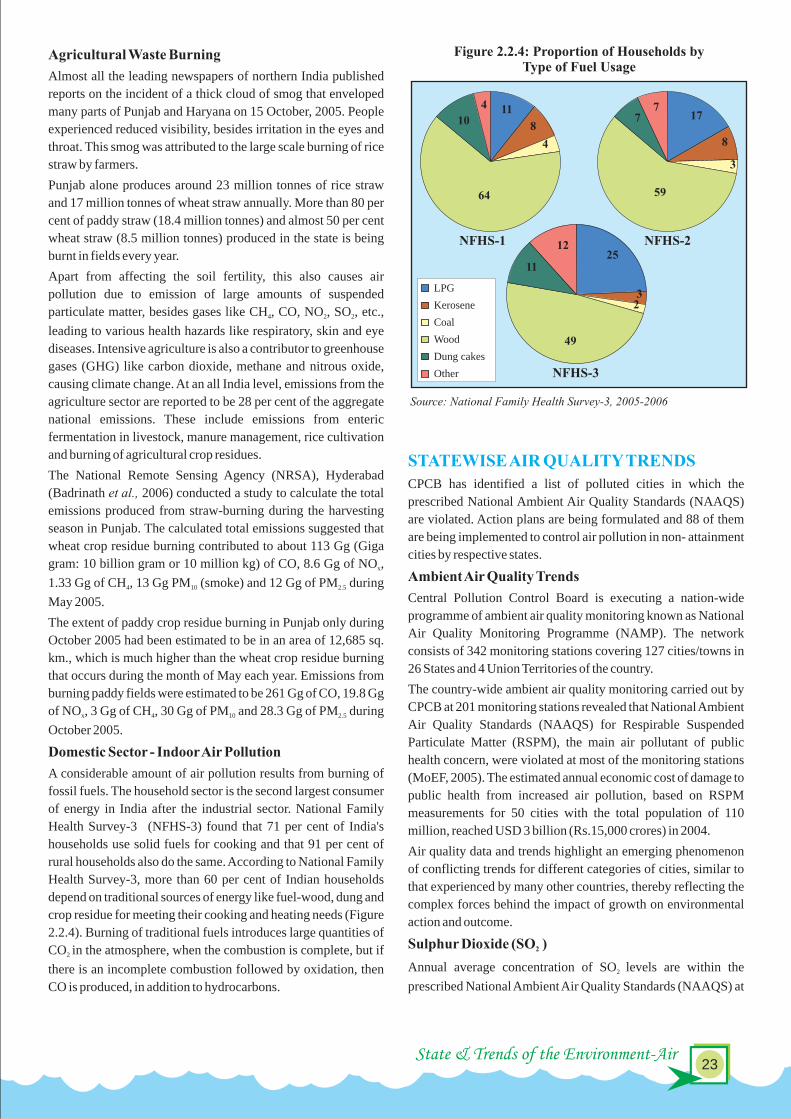

State & Trends of the Environment-Air25
State Of Environment Report-2009 24
last few years. This trend may be due to various measures taken,
such as reduction of sulphur in diesel etc. and use of LPG instead
of coal as a domestic fuel (Figure 2.2.5).
The highest concentration amongst all residential areas was
observed at the monitoring station located in Nashik Municipal
Corporation Building, Nashik and the highest concentration
from the industrial areas was observed at the monitoring station
located at CGCRI, Khurja, U.P. during 2007, although SO levels 2
at none of the monitoring stations exceeded the NAAQS ( Table
2.2.4 & 2.2.5).
Nitrogen Dioxide (NO )2
During the last few years, a decreasing trend has been observed
in nitrogen dioxide levels due to various measures taken for
vehicular pollution control such as stricter vehicular emission
norms. Vehicles are one of the major sources of NO in the 2
country. However, Delhi observed an increasing trend in the past
few years, especially after the introduction of CNG. This
alternative fuel is known to emit, comparatively, more NO than 2
diesel and petrol (Figure 2.2.6).
During 2007, the highest concentration of NO among all 2,
residential areas was observed at Town Hall, Delhi and from the
industrial areas, at Bandhaghat, Howrah. Nonetheless, NO 2
levels at 81 per cent of the monitoring stations in industrial areas
and 70 per cent of the monitoring stations in residential areas
were found to be lower than the NAAQS (Table 2.2.6 & 2.2.7).
Particulate Matter
Annual average concentrations of Respirable Suspended
Particulate Matter (RSPM) and Suspended Particulate Matter
(SPM) exceeded the NAAQS in most of the cities. In cities like
Delhi, this is due to engine gensets, small scale industries,
biomass incineration, boilers and emission from power plants,
re-suspension of traffic dust and commercial and domestic use of
fuels (Figure 2.2.7). A decreasing trend in RSPM however, has
been observed in cities like Solapur and Lucknow during the last
few years. The probable reason could be corrective measures,
like reduction of sulphur in diesel, use of premix 2-T oil
dispensor and stringent standard for particulate matter in diesel
vehicles. Lower levels of RSPM and SPM are also found to be
governed by factors like presence of excellent ventilation effects
owing to sea and land breeze, in coastal cities and wet deposition
in the month of monsoon.
The highest concentration from residential areas was observed at
a monitoring station located at M/s Modi Oil & General Mills,
Gobindgarh and in case of industrial areas at Sub-divisional
Office, Satna. RSPM level at 51 per cent of the monitoring
stations in residential areas and 14 per cent of the monitoring
stations in industrial areas, was critical (Table 2.2.8 & 2.2.9).
As far as SPM is concerned, highest concentrations were
observed at Town Hall, Delhi and Regional Office, Udaipur from
the residential and industrial areas, respectively. The percentage
violation of NAAQS (24 hourly avg.) was less than two per cent
at 68 monitoring stations of industrial and 30 monitoring stations
of residential areas. In the remaining stations, it was two per cent
or more (Table 2.2.10 & 2.2.11).
almost all the locations as per the reports of the Central / State
Pollution Control Board. A decreasing trend has been observed
in SO levels in many cities like Delhi and Mumbai, during the 2
Table 2.2.4 : Top Ten Locations with respect to SO Emissions During 2007 in Residential Areas2
Location State Annual Averageconc.(µg/m ) 3
1 Nashik Municipal Council Building, Nashik Maharashtra 49
2 Ahirpara, Khurja Uttar Pradesh 43
3 Gram Panchayat Ghugus, Chandrapur Maharashtra 39
4 RTO Colony Tank, Nashik Maharashtra 36
5 Nagar Parishad, Chandrapur Maharashtra 34
6 Fisheries College, Tuticorin Tamil Nadu 29
7 AVM Jewellery Building, Tuticorin Tamil Nadu 28
8 Clock Tower, Dehradun Uttranchal 27
9 Elbert Ekka Chowk, Ranchi Jharkhand 22
10 Vishak Hostel, Bhilai Chhattisgarh 21
Source: Central Pollution Control Board, 2008
Residential Area
Sl. No.
3Note: Annual average national standard is 60 ìg/m
Table 2.2.5: Top Ten Locations with respect to SO Emissions During 2007 in Industrial Areas2
Source: Central Pollution Control Board, 2008
Location State Annual Average
3Conc. ( g/m ) µ
1 CGCRI, Khurja Uttar Pradesh 47
2 VIP Industrial Area, Nashik Maharashtra 44
3 MIDC, Chandrapur Maharashtra 41
4 Bistupur Vehicle Testing Center, Jamshedpur Jharkhand 39
5 Golmuri Vehicle Testing Center, Jamshedpur Jharkhand 37
6 Dombivali MIDC Phase-II Maharashtra 32
7 Ambernath Muncipal Council Office Maharashtra 29
8 Chemical Div. Labour Club, Nagda Madhya Pradesh 28
9 Raunag Auto Limited, Gajraula Uttar Pradesh 28
10 Raja Agencies, Tuticorin Tamil Nadu 28
Sl. No.
Industrial Area
3Note: Annual average national standard is 80 ìg/m
Figure 2.2.5: Trends in Annual Average Concentration of SO in Residential Areas of 2
Delhi, Mumbai, Chennai and Kolkata
Source: Central Pollution Control Board, 2008
Remark: Data for 2007 for Chennai, Kolkata and Mumbai is the avarage of data available as on date
3C
once
ntr
atio
n (
µg
/m)
010203040506070
19
95
19
96
19
97
19
98
19
99
20
00
20
01
20
02
20
03
20
04
20
05
20
06
20
07
Delhi
YearRes. Area NAAQS
3C
once
ntr
atio
n (
µg/
m)
YearRes. Area NAAQS
010203040506070
19
95
19
96
19
97
19
98
19
99
20
00
20
01
20
02
20
03
20
04
20
05
20
06
20
07
Mumbai
3C
once
ntr
atio
n (
µg/
m)
Year
Res. Area NAAQS
010203040506070
19
95
19
96
19
97
19
98
19
99
20
00
20
01
20
02
20
03
20
04
20
05
20
06
20
07
Chennai
3C
once
ntr
atio
n (
µg
/m)
Res. Area NAAQS
Year
10203040506070
0
Kolkata
1999
2000
2001
2002
2003
2004
2005
2006
2007

Figure 2.2.6: Trends in Annual Average Concentration of NO in Residential Areas of 2
Delhi, Mumbai, Chennai and Kolkata
Source: Central Pollution Control Board, 2008
0
10
20
30
40
50
60
70
80
20
02
20
03
20
04
20
05
20
06
20
07
3C
once
ntr
atio
n (
µg/
m)
Year
Kolkata
0
15
30
45
60
75
90
19
99
20
00
20
01
20
02
20
03
20
04
20
05
20
06
20
07
3C
once
ntr
atio
n (
µg/
m)
Year
Mumbai
0
10
20
30
40
50
60
701
99
5
19
96
19
97
19
98
19
99
20
00
20
01
20
02
20
03
20
04
20
05
20
06
20
07
3C
once
ntr
atio
n (
µg
/m)
Year
Delhi
0
10
20
30
40
50
3C
on
cen
trati
on
(µ
g/m
)
Year
Chennai
19
99
19
98
20
00
20
01
20
02
20
03
20
04
20
05
20
06
20
07
Remark: Data for 2007 for Chennai, Kolkata and Mumbai is the average of data available as on date
60
Res. Area NAAQSRes. Area NAAQS
Res. Area NAAQSRes. Area NAAQS
State & Trends of the Environment-Air27
State Of Environment Report-2009 26
It is well-known that particulate matter less than 2.5 micron (PM
2.5) is the most harmful particle as it reaches the alveolar region
(i.e. blood and gas exchange region) of the respiratory tract,
causing various respiratory and cardiovascular ailments. It has
also been established that fine particles are more prone to get
enriched with toxic and carcinogenic substances than the coarse
particles.
Recognizing its importance, CPCB has initiated the monitoring
of PM in some major cities.2.5
Particulate matter with size less than 2.5 micrometre (PM ) was 2.5
measured at BSZ Marg (ITO), New Delhi using continuous
analyzers (Figure 2.2.8). The annual average concentration of 3PM was found to be 102 ìg/m during 2007. The monthly 2.5
3average concentration of PM varied from 34 ìg/m to 2.5
3198 ìg/m , change in climatic conditions being a decisive factor.
Presence of lesser volume of troposphere in the winter season,
aided easy mixing resulting in higher concentrations. Similarly,
lower concentrations were observed in monsoon months as
particulate matter is washed out due to wet deposition.
Of late, noise has been recognized as a pollutant which until
recently was considered only a nuisance. The Central Pollution
Control Board (CPCB) notified the ambient noise standards, in
1987 under section 20 of the Air (Prevention and Control of
Pollution) Act, 1981. The noise standards specify 55 dB (A) and
45 dB (A) as limits for day and night time, respectively, for
residential areas; 75 dB (A) and 70 dB (A) in the day and night
NOISE POLLUTIONIMPACT
Health Problems
Air quality is deteriorating especially in metropolitan cities,
mainly due to vehicular emissions. There is evidence that the
health of over 900 million urban people around the world is
deteriorating daily because of high levels of ambient air
pollutants. The toxicology of air pollution is very complex as
time for industrial areas and 50 dB (A) and 40 dB (A) in the day
and night time for silence zones.
For residential areas, average noise level exceeds the day as well
as night time limit for major cities. The situation is worse in
silence zone areas.
There are significant health impacts of noise pollution as
depicted in table 2.2.13.
Location State Annual Average
conc. ( 3µg/m )
1 Town Hall, Delhi Delhi 82*
2 Maulali, Kolkata West Bengal 76*
3 Ghuseri Naskarpara, Howrah West Bengal 68*
4 Gandhi Maidan, Patna Bihar 67*
5 Salt Lake, Kolkata West Bengal 66*
7 Minto Park, Kolkata West Bengal 65*
West Bengal8 Bator, Howrah 57
9 Lal Bazaar, Kolkata West Bengal 54
10 Regional Office, Dhanbad Jharkhand 52
Sl. No.
Residential Area
Source: Central Pollution Control Board, 2008
Table 2.2.6: Top Ten Locations with respect to NO During 2007 in Residential Areas2
6 Sarojini Nagar, Delhi Delhi 65*
*- Locations where annual mean concentration of NO exceeded the NAAQS of 60 2
3 µg/m for Residential areas
Location State Annual Average
conc. ( 3µg/m )
1 Bandhaghat, Howrah West Bengal 91*
2 Behala Chowrasta, Kolkata West Bengal 73
3 Howrah Municipal Corporation, Howrah West Bengal 73
Mayapuri Industrial Area, Delhi Delhi 70
5 Dew India Ltd, Durgapur West Bengal 65
6 Dunlop Bridge, Kolkata West Bengal 62
7 Cossipore, Kolkata West Bengal 60
8 Kwality Hotel, Durgapur West Bengal 59
9 Asansol Municipal Corporation, Asansol West Bengal 57
10 Bistupur Vehicle Testing Center, Jamshedpur Jharkhand 53
*- Locations where annual mean concentration of NO exceeded the NAAQS of 80 2
3µg/m for Industrial areas
Source: Central Pollution Control Board, 2008
Table 2.2.7: Top Ten Locations with respect to NO During 2007 in Industrial Areas2
Sl. No.
Industrial Area
4

Figure 2.2.6: Trends in Annual Average Concentration of NO in Residential Areas of 2
Delhi, Mumbai, Chennai and Kolkata
Source: Central Pollution Control Board, 2008
0
10
20
30
40
50
60
70
80
20
02
20
03
20
04
20
05
20
06
20
07
3C
once
ntr
atio
n (
µg/
m)
Year
Kolkata
0
15
30
45
60
75
90
19
99
20
00
20
01
20
02
20
03
20
04
20
05
20
06
20
07
3C
once
ntr
atio
n (
µg/
m)
Year
Mumbai
0
10
20
30
40
50
60
70
19
95
19
96
19
97
19
98
19
99
20
00
20
01
20
02
20
03
20
04
20
05
20
06
20
07
3C
once
ntr
atio
n (
µg
/m)
Year
Delhi
0
10
20
30
40
50
3C
on
cen
trati
on
(µ
g/m
)
Year
Chennai
19
99
19
98
20
00
20
01
20
02
20
03
20
04
20
05
20
06
20
07
Remark: Data for 2007 for Chennai, Kolkata and Mumbai is the average of data available as on date
60
Res. Area NAAQSRes. Area NAAQS
Res. Area NAAQSRes. Area NAAQS
State & Trends of the Environment-Air27
State Of Environment Report-2009 26
It is well-known that particulate matter less than 2.5 micron (PM
2.5) is the most harmful particle as it reaches the alveolar region
(i.e. blood and gas exchange region) of the respiratory tract,
causing various respiratory and cardiovascular ailments. It has
also been established that fine particles are more prone to get
enriched with toxic and carcinogenic substances than the coarse
particles.
Recognizing its importance, CPCB has initiated the monitoring
of PM in some major cities.2.5
Particulate matter with size less than 2.5 micrometre (PM ) was 2.5
measured at BSZ Marg (ITO), New Delhi using continuous
analyzers (Figure 2.2.8). The annual average concentration of 3PM was found to be 102 ìg/m during 2007. The monthly 2.5
3average concentration of PM varied from 34 ìg/m to 2.5
3198 ìg/m , change in climatic conditions being a decisive factor.
Presence of lesser volume of troposphere in the winter season,
aided easy mixing resulting in higher concentrations. Similarly,
lower concentrations were observed in monsoon months as
particulate matter is washed out due to wet deposition.
Of late, noise has been recognized as a pollutant which until
recently was considered only a nuisance. The Central Pollution
Control Board (CPCB) notified the ambient noise standards, in
1987 under section 20 of the Air (Prevention and Control of
Pollution) Act, 1981. The noise standards specify 55 dB (A) and
45 dB (A) as limits for day and night time, respectively, for
residential areas; 75 dB (A) and 70 dB (A) in the day and night
NOISE POLLUTIONIMPACT
Health Problems
Air quality is deteriorating especially in metropolitan cities,
mainly due to vehicular emissions. There is evidence that the
health of over 900 million urban people around the world is
deteriorating daily because of high levels of ambient air
pollutants. The toxicology of air pollution is very complex as
time for industrial areas and 50 dB (A) and 40 dB (A) in the day
and night time for silence zones.
For residential areas, average noise level exceeds the day as well
as night time limit for major cities. The situation is worse in
silence zone areas.
There are significant health impacts of noise pollution as
depicted in table 2.2.13.
Location State Annual Average
conc. ( 3µg/m )
1 Town Hall, Delhi Delhi 82*
2 Maulali, Kolkata West Bengal 76*
3 Ghuseri Naskarpara, Howrah West Bengal 68*
4 Gandhi Maidan, Patna Bihar 67*
5 Salt Lake, Kolkata West Bengal 66*
7 Minto Park, Kolkata West Bengal 65*
West Bengal8 Bator, Howrah 57
9 Lal Bazaar, Kolkata West Bengal 54
10 Regional Office, Dhanbad Jharkhand 52
Sl. No.
Residential Area
Source: Central Pollution Control Board, 2008
Table 2.2.6: Top Ten Locations with respect to NO During 2007 in Residential Areas2
6 Sarojini Nagar, Delhi Delhi 65*
*- Locations where annual mean concentration of NO exceeded the NAAQS of 60 2
3 µg/m for Residential areas
Location State Annual Average
conc. ( 3µg/m )
1 Bandhaghat, Howrah West Bengal 91*
2 Behala Chowrasta, Kolkata West Bengal 73
3 Howrah Municipal Corporation, Howrah West Bengal 73
Mayapuri Industrial Area, Delhi Delhi 70
5 Dew India Ltd, Durgapur West Bengal 65
6 Dunlop Bridge, Kolkata West Bengal 62
7 Cossipore, Kolkata West Bengal 60
8 Kwality Hotel, Durgapur West Bengal 59
9 Asansol Municipal Corporation, Asansol West Bengal 57
10 Bistupur Vehicle Testing Center, Jamshedpur Jharkhand 53
*- Locations where annual mean concentration of NO exceeded the NAAQS of 80 2
3µg/m for Industrial areas
Source: Central Pollution Control Board, 2008
Table 2.2.7: Top Ten Locations with respect to NO During 2007 in Industrial Areas2
Sl. No.
Industrial Area
4

Location State Annual Average
Conc.( 3µg/m )
1 Sub-divisional Office, Satna Madhya Pradesh 288*
2 Rita Sewing Machine, Ludhiana Punjab 261*
3 Sahibabad Industrial Area, Ghaziabad Uttar Pradesh 250*
4 Mayapuri Industrial Area, Delhi Delhi 233*
5 Markfed Vanaspati, Khanna Punjab 233*
6 M/s Raj Steel Rolling Mills, Gobindgarh Punjab 228*
7 Bulandshahar Road Industrial Area, Ghaziabad Uttar Pradesh 210*
8 CGCRI, Khurja Uttar Pradesh 209*
9 Center for Development of Glass Industry, Firozabad Uttar Pradesh 205*
10 VKIA, Jaipur Rajasthan 202*
Source: Central Pollution Control Board, 2008
Table 2.2.9 : Top Ten Locations with respect to RSPM During 2007 in Industrial Areas
Sl. No.
Industrial Area
3*- Locations where annual mean concentration of RSPM exceeded the NAAQS of 120 g/m for Industrial areasµ
Sl. No.
Table 2.2.8: Top Ten Locations with respect to RSPM During 2007 in Residential Areas
Location State Annual Average
Conc. ( 3µg/m )
1 M/s Modi Oil & General Mills, Gobindgarh Punjab 252*
2 PPCB Office Building, Ludhiana Punjab 231*
3 Ahirpara, Khurja Uttar Pradesh 201*
4 Deputy Ka Padao, Kanpur Uttar Pradesh 198*
5 Town Hall, Delhi Delhi 198*
6 Kidwai Nagar, Kanpur Uttar Pradesh 197*
7 A S School, Khanna Punjab 196*
8 Aminabad, Lucknow Uttar Pradesh 193*
9 Aliganj, Lucknow Uttar Pradesh 190*
10 Sharda Nagar, Kanpur Uttar Pradesh 185*
Residential Area
3*- Locations where annual mean concentration of RSPM exceeded the NAAQS of 60 g/m for Residential areasµ
Source: Central Pollution Control Board, 2008
State & Trends of the Environment-Air29
State Of Environment Report-2009 28
there are different types of pollutants affecting the individual
differently.
The pollutants in air, namely - SO , NO and Suspended 2 x
Particulate Matter (SPM) - damage the human respiratory and
cardio-respiratory systems in various ways. The elderly,
children, smokers and those with chronic respiratory diseases are
the most vulnerable. It has been reported that high levels of
pollution affect mental and emotional health too. Elevated levels
of lead in children result in impaired neurological development,
leading to lowered intelligence quotient, poor school
performance and behavioural difficulties.
A study conducted by All India Institute of Medical Sciences and
Central Pollution Control Board in Delhi showed that exposure to
higher levels of particulate matter contributed to respiratory
morbidity. It indicated that the most common symptoms relating
to air pollution were irritation of eyes (44 per cent), cough (28.8
Location State Annual Average
Conc.( 3µg/m )
1 Town Hall, Delhi Delhi 476*
2 Regional Office, Noida Uttar Pradesh 447*
3 Kidwai Nagar, Kanpur Uttar Pradesh 442*
4 Deputy Ka Padao, Kanpur Uttar Pradesh 440*
5 Ahirpara, Khurja Uttar Pradesh 432*
6 Shivpur/Sigra, Varanasi Uttar Pradesh 422*
7 Sharda Nagar, Kanpur Uttar Pradesh 421*
8 A-1 Platters, Amritsar Punjab 411*
9 Aminabad, Lucknow Uttar Pradesh 402*
10 Jail Chauraha, Jhansi Uttar Pradesh 402*
Table 2.2.10: Top Ten Locations with respect to SPM During 2007 in Residential Areas
Sl. No.
Source: Central Pollution Control Board, 2008
Residential Area
3*- Locations where annual mean concentration of SPM exceeded the NAAQS of 140 g/m for Residential areasµ
Figure 2.2.7: Trends in Annual Average Concentration of RSPM in Residential Areas of Delhi, Mumbai, Chennai and Kolkata
020406080
100120140160180
20
01
20
02
20
03
20
04
20
05
20
06
20
07
3C
on
cen
trat
ion
(µ
g/m
)
Delhi
Remark: Data for 2007 for Chennai, Kolkata and Mumbai is the average of data available as on date
0
20
40
60
80
100
120
140
19
99
20
00
20
01
20
02
20
03
20
04
20
05
20
06
20
07
3C
on
cen
trat
ion
(µ
g/m
)
Mumbai
0102030405060708090
100
20
00
20
01
20
02
20
03
20
04
20
05
20
06
20
07
3C
on
cen
trat
ion
(µ
g/m
)
Chennai
0
20
40
60
80
100
120
140
160
19
99
20
00
20
01
20
02
20
03
20
04
20
05
20
06
20
07
3C
once
ntr
atio
n (
µg
/m)
Kolkata
Souce : Central Pollution Control Board, 2008
YearRes. Area NAAQS
YearRes. Area NAAQS
Year
Res. Area NAAQS
Year
Res. Area NAAQS

Location State Annual Average
Conc.( 3µg/m )
1 Sub-divisional Office, Satna Madhya Pradesh 288*
2 Rita Sewing Machine, Ludhiana Punjab 261*
3 Sahibabad Industrial Area, Ghaziabad Uttar Pradesh 250*
4 Mayapuri Industrial Area, Delhi Delhi 233*
5 Markfed Vanaspati, Khanna Punjab 233*
6 M/s Raj Steel Rolling Mills, Gobindgarh Punjab 228*
7 Bulandshahar Road Industrial Area, Ghaziabad Uttar Pradesh 210*
8 CGCRI, Khurja Uttar Pradesh 209*
9 Center for Development of Glass Industry, Firozabad Uttar Pradesh 205*
10 VKIA, Jaipur Rajasthan 202*
Source: Central Pollution Control Board, 2008
Table 2.2.9 : Top Ten Locations with respect to RSPM During 2007 in Industrial Areas
Sl. No.
Industrial Area
3*- Locations where annual mean concentration of RSPM exceeded the NAAQS of 120 g/m for Industrial areasµ
Sl. No.
Table 2.2.8: Top Ten Locations with respect to RSPM During 2007 in Residential Areas
Location State Annual Average
Conc. ( 3µg/m )
1 M/s Modi Oil & General Mills, Gobindgarh Punjab 252*
2 PPCB Office Building, Ludhiana Punjab 231*
3 Ahirpara, Khurja Uttar Pradesh 201*
4 Deputy Ka Padao, Kanpur Uttar Pradesh 198*
5 Town Hall, Delhi Delhi 198*
6 Kidwai Nagar, Kanpur Uttar Pradesh 197*
7 A S School, Khanna Punjab 196*
8 Aminabad, Lucknow Uttar Pradesh 193*
9 Aliganj, Lucknow Uttar Pradesh 190*
10 Sharda Nagar, Kanpur Uttar Pradesh 185*
Residential Area
3*- Locations where annual mean concentration of RSPM exceeded the NAAQS of 60 g/m for Residential areasµ
Source: Central Pollution Control Board, 2008
State & Trends of the Environment-Air29
State Of Environment Report-2009 28
there are different types of pollutants affecting the individual
differently.
The pollutants in air, namely - SO , NO and Suspended 2 x
Particulate Matter (SPM) - damage the human respiratory and
cardio-respiratory systems in various ways. The elderly,
children, smokers and those with chronic respiratory diseases are
the most vulnerable. It has been reported that high levels of
pollution affect mental and emotional health too. Elevated levels
of lead in children result in impaired neurological development,
leading to lowered intelligence quotient, poor school
performance and behavioural difficulties.
A study conducted by All India Institute of Medical Sciences and
Central Pollution Control Board in Delhi showed that exposure to
higher levels of particulate matter contributed to respiratory
morbidity. It indicated that the most common symptoms relating
to air pollution were irritation of eyes (44 per cent), cough (28.8
Location State Annual Average
Conc.( 3µg/m )
1 Town Hall, Delhi Delhi 476*
2 Regional Office, Noida Uttar Pradesh 447*
3 Kidwai Nagar, Kanpur Uttar Pradesh 442*
4 Deputy Ka Padao, Kanpur Uttar Pradesh 440*
5 Ahirpara, Khurja Uttar Pradesh 432*
6 Shivpur/Sigra, Varanasi Uttar Pradesh 422*
7 Sharda Nagar, Kanpur Uttar Pradesh 421*
8 A-1 Platters, Amritsar Punjab 411*
9 Aminabad, Lucknow Uttar Pradesh 402*
10 Jail Chauraha, Jhansi Uttar Pradesh 402*
Table 2.2.10: Top Ten Locations with respect to SPM During 2007 in Residential Areas
Sl. No.
Source: Central Pollution Control Board, 2008
Residential Area
3*- Locations where annual mean concentration of SPM exceeded the NAAQS of 140 g/m for Residential areasµ
Figure 2.2.7: Trends in Annual Average Concentration of RSPM in Residential Areas of Delhi, Mumbai, Chennai and Kolkata
020406080
100120140160180
20
01
20
02
20
03
20
04
20
05
20
06
20
07
3C
on
cen
trat
ion
(µ
g/m
)
Delhi
Remark: Data for 2007 for Chennai, Kolkata and Mumbai is the average of data available as on date
0
20
40
60
80
100
120
140
19
99
20
00
20
01
20
02
20
03
20
04
20
05
20
06
20
07
3C
on
cen
trat
ion
(µ
g/m
)
Mumbai
0102030405060708090
100
20
00
20
01
20
02
20
03
20
04
20
05
20
06
20
07
3C
on
cen
trat
ion
(µ
g/m
)
Chennai
0
20
40
60
80
100
120
140
160
19
99
20
00
20
01
20
02
20
03
20
04
20
05
20
06
20
07
3C
once
ntr
atio
n (
µg
/m)
Kolkata
Souce : Central Pollution Control Board, 2008
YearRes. Area NAAQS
YearRes. Area NAAQS
Year
Res. Area NAAQS
Year
Res. Area NAAQS

State & Trends of the Environment-Air31
State Of Environment Report-2009 30
per cent), pharyngitis (16.8 per cent), dyspnea (16 per cent) and
nausea (10 per cent). In Mumbai, the prevalence of both
symptoms and signs of such diseases is around 22.2 per cent.
Among the six major communicable diseases, maximum cases
(2,58,07,722) were reported for Acute Respiratory Infection
while maximum number of people (7,073) died due to
Pulmonary Tuberculosis in India, during the year 2006 (Figure
2.2.9).
Climate Change
India is a fast growing economy and has many future
developmental targets, several of which are directly or indirectly
linked to energy and therefore increased green house gas
emissions.
Though the contribution of India to the cumulative global CO2
emissions is only 5 per cent but impacts could be severe at local
level. India has nearly 700 million rural population directly
Location State Annual Average
Conc. ( 3µg/m )
1 Regional Office, Udaipur Rajasthan 250*
2 Center for Development of Glass Industry, Firozabad Uttar Pradesh 486*
3 CGCRI, Khurja Uttar Pradesh 485*
4 Fazalganj, Kanpur Uttar Pradesh 484*
5 Sahibabad Industrial Area, Ghaziabad Uttar Pradesh 475*
6 Mayapuri Industrial Area, Delhi Delhi 461*
7 Jajmau, Kanpur Uttar Pradesh 444*
8 Shahdara, Delhi Delhi 440*
9 M/s GEE PEE Electroplating and Engineering Works, Noida Uttar Pradesh 437*
10 Sub-divisional Office, Satna Madhya Pradesh 433*
Source: Central Pollution Control Board, 2008
Table 2.2.11: Top Ten Locations with respect to SPM During 2007 in Industrial Areas
Sl. No.
Industrial Area
3*- Locations where annual mean concentration of SPM exceeded the NAAQS of 360 g/m for Industrial areasµ
Source: Central Pollution Control Board, 2008
* NA– Data not available/not adequate
0
50
100
150
200
250
Jan-
07
Feb-
07
Mar
-07
Apr
-07
May
-07
Jun-
07
Jul-
07
Aug
-07
Sep-
07
Oct
-07
*Nov
-07
Dec
-07
Ave
rage
2.5
PM
3C
once
ntr
atio
n (
g/m
)
3Figure 2.2.8: Concentration of PM (g/m ) at Bahadur Shah Zafar Marg (ITO), Delhi During 20072.5
Stage: IThreat to Survival(a) Communication interference (b) Permanent hearing loss
Stage: IICausing injury(a) Neural-humoral stress response(b) Temporary hearing loss(c) Permanent hearing loss
Stage IIICurbing Efficient Performance (a) Mental Stress(b) Task Interference (c) Sleep Interference
Stage IVDiluting Comfort and Enjoyment (a) Invasion of privacy(b) Disruption of Social Interaction(c) Hearing Loss
Source: West Bengal Pollution Control Board, 2008
Table 2.2.13: Effects of Noise Pollution on Human Health
A. Noise Hazards
B. Noise Nuisances
Commercial
Area
Residential
Area
Silence
Area
SI.
No.
82 79 7975 65 65
1
75 70 6666 62 52
2
78 66 6371 48 49
3
4
Metropolitan
Cities
Kolkata
Mumbai
Chennai
Bangalore 76 67 67
Day/
Night
DayNight
DayNight
DayNight
DayNight
Industrial
Area
7867
7665
7166
7853 57 50 --
Source: Compendium of Environment Statistics India, 2007
Table 2.2.12: Average Noise Levels in Various Metropolitan Cities(dB[A])
17%
19%
18%4%4%
38%
Acute Diarr. Acute Resp. Inf. Pneumonia
Entric Fever Viral Hepatitis TB
Source: Monthly Health Condition from Directorate of Health Services of States/UTs
Figure 2.2.10: Six Major Communicable Diseases (deaths), 2006
Source: Monthly Health Condition from Directorate of Health Services of States/UTs
Figure 2.2.9: Six Major Communicable Diseases (cases), 2006
Acute Diarr. Acute Resp. Inf. Pneumonia
Entric Fever Viral Hepatitis TB
26.4%
67.5%
1.8%1.9% 0.4% 2.1%
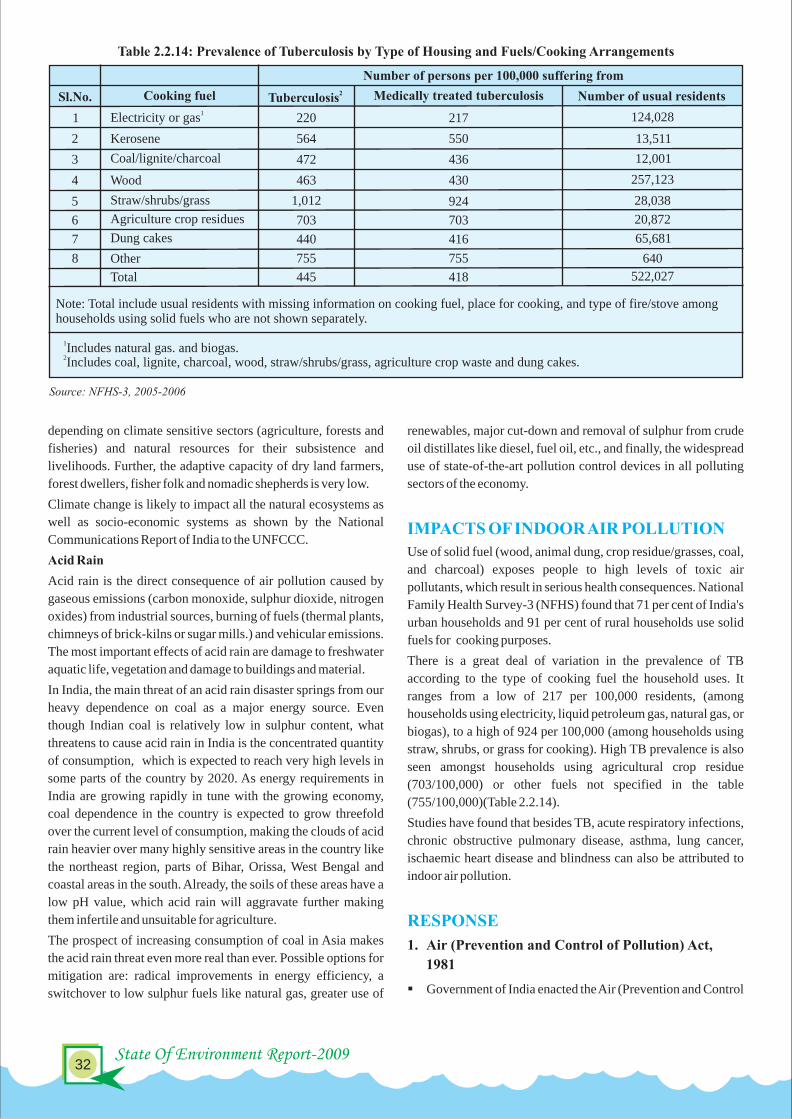
State & Trends of the Environment-Air33
State Of Environment Report-2009 32
of Pollution) Act, 1981 to arrest the deterioration in the air
quality. The Act prescribes various functions for the Central
Pollution Control Board (CPCB) at the apex level and State
Pollution Control Boards at the state level. The main
functions of the Central Pollution Control Board are as
follows:
§To advise the Central Government on any matter concerning
the improvement of the quality of the air and prevention,
control and abatement of air pollution.
§To plan and cause to be executed a nation-wide programme
for the prevention, control and abatement of air pollution.
§To provide technical assistance and guidance to the State
Pollution Control Board.
§To carry out and sponsor investigations and research related
to prevention, control and abatement of air pollution.
§To collect, compile and publish technical and statistical data
related to air pollution; and
§To lay down standards for the quality of air.
The main functions of the State Pollution Control Boards are
as follows:
§To plan a comprehensive programme for prevention, control
and abatement of air pollution and to secure the execution
thereof.
§To advise the State Government on any matter concerning
prevention, control and abatement of air pollution.
§To collect and disseminate information related to air
pollution.
§To collaborate with the Central Pollution Control Board in
programmes related to prevention, control and abatement of
air pollution; and
§To inspect air pollution control areas, assess quality of air and
to take steps for prevention, control and abatement of air
pollution in such areas.
2. National Air Quality Monitoring Programme
§Central Pollution Control Board is executing a nation-wide
National Air Quality Monitoring Programme (NAMP). The
network consists of 342 operating stations covering 127
cities/towns in 26 States and 4 Union Territories of the
country.
§The objectives of the NAMP are to determine the status and
trends of ambient air quality; to ascertain whether the
prescribed ambient air quality standards are violated; to
assess health hazards and damage to materials; to continue
the ongoing process of producing periodic evaluation of air
pollution situation in urban and industrial areas of the
country; to obtain the knowledge and understanding
necessary for developing preventive and corrective measures
and to understand the natural cleansing processes undergoing
in the environment through pollution dilution, dispersion,
wind based movement, dry deposition, precipitation and
chemical transformation of pollutants generated.
§Under the NAMP, four air-pollutants viz., SO , Oxides of 2
Nitrogen as NO , SPM and RSPM (PM ), have been 2 10
identified for regular monitoring at all the locations.
§Keeping in view the monitored data available on air quality,
the Hon'ble Supreme Court, in its various judgments, has
depending on climate sensitive sectors (agriculture, forests and
fisheries) and natural resources for their subsistence and
livelihoods. Further, the adaptive capacity of dry land farmers,
forest dwellers, fisher folk and nomadic shepherds is very low.
Climate change is likely to impact all the natural ecosystems as
well as socio-economic systems as shown by the National
Communications Report of India to the UNFCCC.
Acid Rain
Acid rain is the direct consequence of air pollution caused by
gaseous emissions (carbon monoxide, sulphur dioxide, nitrogen
oxides) from industrial sources, burning of fuels (thermal plants,
chimneys of brick-kilns or sugar mills.) and vehicular emissions.
The most important effects of acid rain are damage to freshwater
aquatic life, vegetation and damage to buildings and material.
In India, the main threat of an acid rain disaster springs from our
heavy dependence on coal as a major energy source. Even
though Indian coal is relatively low in sulphur content, what
threatens to cause acid rain in India is the concentrated quantity
of consumption, which is expected to reach very high levels in
some parts of the country by 2020. As energy requirements in
India are growing rapidly in tune with the growing economy,
coal dependence in the country is expected to grow threefold
over the current level of consumption, making the clouds of acid
rain heavier over many highly sensitive areas in the country like
the northeast region, parts of Bihar, Orissa, West Bengal and
coastal areas in the south. Already, the soils of these areas have a
low pH value, which acid rain will aggravate further making
them infertile and unsuitable for agriculture.
The prospect of increasing consumption of coal in Asia makes
the acid rain threat even more real than ever. Possible options for
mitigation are: radical improvements in energy efficiency, a
switchover to low sulphur fuels like natural gas, greater use of
renewables, major cut-down and removal of sulphur from crude
oil distillates like diesel, fuel oil, etc., and finally, the widespread
use of state-of-the-art pollution control devices in all polluting
sectors of the economy.
Use of solid fuel (wood, animal dung, crop residue/grasses, coal,
and charcoal) exposes people to high levels of toxic air
pollutants, which result in serious health consequences. National
Family Health Survey-3 (NFHS) found that 71 per cent of India's
urban households and 91 per cent of rural households use solid
fuels for cooking purposes.
There is a great deal of variation in the prevalence of TB
according to the type of cooking fuel the household uses. It
ranges from a low of 217 per 100,000 residents, (among
households using electricity, liquid petroleum gas, natural gas, or
biogas), to a high of 924 per 100,000 (among households using
straw, shrubs, or grass for cooking). High TB prevalence is also
seen amongst households using agricultural crop residue
(703/100,000) or other fuels not specified in the table
(755/100,000)(Table 2.2.14).
Studies have found that besides TB, acute respiratory infections,
chronic obstructive pulmonary disease, asthma, lung cancer,
ischaemic heart disease and blindness can also be attributed to
indoor air pollution.
1. Air (Prevention and Control of Pollution) Act,
1981
§Government of India enacted the Air (Prevention and Control
IMPACTS OF INDOOR AIR POLLUTION
RESPONSE
Sl.No. Cooking fuel 2Tuberculosis Medically treated tuberculosis Number of usual residents
11Electricity or gas 220 217 124,028
2 Kerosene 564 550 13,511
3 Coal/lignite/charcoal 472 436 12,001
4 Wood 463 430 257,123
5 Straw/shrubs/grass 1,012 924 28,038
6 Agriculture crop residues 703 703 20,872
7 Dung cakes 440 416 65,681
8 Other 755 755 640
Note: Total include usual residents with missing information on cooking fuel, place for cooking, and type of fire/stove amonghouseholds using solid fuels who are not shown separately.
1Includes natural gas. and biogas.2Includes coal, lignite, charcoal, wood, straw/shrubs/grass, agriculture crop waste and dung cakes.
Total 445 418 522,027
Source: NFHS-3, 2005-2006
Table 2.2.14: Prevalence of Tuberculosis by Type of Housing and Fuels/Cooking Arrangements
Number of persons per 100,000 suffering from
More vehicles means more air pollution

Date of Introduction Benzene Content Areas Covered
Before 1996 No specification Entire Country
April 1996 5% benzene Entire Country
April 2000 3% benzene Metro Cities
November 2000 1% benzene NCT & Mumbai
2005 1% benzene All Metro Cities
Source: Central Pollution Control Board, 2008
Table 2.2.17: Gasoline Benzene Reduction Programme
Source: Central Pollution Control Board, 2008
Table 2.2.15: Gasoline Lead Phase Out Programme
Areas Covered
1.9.1998Phase-VI Unleaded National Capital Region (NCR)
Phase-III 1.1.1997 Low leaded Entire Country
Capitals of States & UTsPhase-V 31.12.1998 Unleaded+Low leaded
Phase-IV 1.9.1998 Only unleaded National Capital Territory (NCT)
Phase-VII 1.2.2000 Unleaded Entire Country
Phase Date of Introduction Lead Content
Phase-I June 1994 Low lead (0.15 g/l) Delhi, Mumbai, Kolkata, Chennai
Phase-II 1.4.1995 Unleaded (0.013 g/l)+ low leaded Delhi, Mumbai, Kolkata, Chennai
Table 2.2.16: Diesel Sulphur Reduction Programme
Phase Date of Introduction Sulphur Content(%)
Areas Covered
Phase-I April 1996 0.50 Four Metros & Taj
Phase-II August 1997 0.25 Delhi & Taj
Phase-III April 1998 0.25 Metro Cities
Phase-IV January 2000 0.25 Entire Country
April 2000 0.05 NCR-private vehicles
January 2000 0.05 Mumbai-all vehicles
March 2001 0.05 NCT-all vehicles
June 2001 0.05 NCT-all vehicles
July 2001 0.05 Chennai & Kolkata
Phase-VI October 2001 0.05 All retail outlets of four metros
Phase-VII 2003 0.05 Ahmedabad, Surat, Agra, Pune & Kanpur
Phase-VIII 2005 0.05 Entire Country
Phase-IX 2005 0.035 10 Metro Cities & Agra
Phase-X 2010 0.035 Entire Country
Phase-XI 2010 0.005 10 Metro Cities
Source: Central Pollution Control Board, 2008
Phase-V
State & Trends of the Environment-Air35
State Of Environment Report-2009 34
Table 2.2.18: Vehicular Pollution Control Measures & Impact on Air Quality in Delhi
1994 1996 1998 2000 2001(Jan-June)
Relaxednorms
Emission norms made stringent as compared to 1991
Emission norms made for cat. convertor fitted vehicles made stringentHot-start replaced by cold-start tests which gives less emissions
Euro-I equivalent norms for all types of vehicles, expertpassenger vehicles which are Euro-II equivalent
Diesel sulphur 1%Gasoline Lead0.56 g/lBenzene nolimit
Fuel quality specifications notified under EPA for the first timePb (g/l)=0.15Diesel S=0.5%
Diesel sulphur reduced to 0.25%Gasoline Benzene reduced to 3%Gasoline Lead phased
Diesel sulphur to reduce 0.05% in selected outletsGasoline Benzene reduced to 1%Gasoline sulphur with 0.05% max. sulphur in all outletsLow smoke 2-T oil introduced
Other Measures - Govt. vehicles to run on CNG/Catalytic Converter
15 years old commercial vehicles bannedPre-mix 2-T oil in retail outlets
Buses more than 8 years old phased outReplacement of Pre-1990 autos/taxis with vehicles on clean fulesConversion of Post-1990 autos toCNG initiatedFuel testing lab established
3CO(µg/m ) 3343 5587 5450 4686 3069
3SO (µg/m )2 42 35 25 18 163NO (µg/m )2 66 75 63 59 -
3Pb(µg/m ) 408 312 136 101 -
3RSPM(µg/m ) - - 200 191 163
Vehicle No. (Lakh) 23.72 27.96 31.67 34.0 -
% of Calm Wind - - 41.69 43.0 -
Source: Central Pollution Control Board, 2008
Emission Normsof Vehicles
Fuel QualityImprovement
CNG/LPG Norms finalized
Diesel with 0.05%sulphur throughout retail outlets in NCT
All Auto/taxisand buses torun on CNGAt present 1600 buses, 11000 taxisand cars, 25000 autos on CNG

State & Trends of the Environment-Air37
State Of Environment Report-2009 36
identified sixteen cities namely; Hyderabad, Patna,
Ahmedabad, Faridabad, Jharia, Bangalore, Pune, Mumbai,
Sholapur, Jodhpur, Chennai, Agra, Kanpur, Lucknow,
Varanasi and Kolkata as equal to or more polluted than Delhi.
Action plans for improvement of air quality in these cities
have been drawn.
§The CPCB has evolved a format for preparation of action
plans, which has been circulated to all State Pollution Control
Boards/Committees. The action plans emphasize on
identification of sources of air pollution, assessment of
pollution load and adoption of abatement measures for
identified sources. Setting up of an inter-departmental task
force for implementation of city specific action plans has also
been suggested.
3. Vehicular Pollution Control Measures
I. Vehicular Emission Norms
In order to control vehicular pollution, a road map has been
adopted as per the schedule proposed in the Auto Fuel Policy
(2002), which includes use of cleaner fuels, automobile
technologies and enforcement measures for in-use vehicles
through improved Pollution Under Control (PUC)
certification system. As per the Policy, Bharat Stage-II norms
for new vehicles have been introduced throughout the
country from April 1, 2005.
e) Year 2000 experienced stricter norms which were already
notified in 1997 under the Motor Vehicle Rules. Automobile
manufacturers had to undergo major modifications to meet
these standards.
f) As per the Hon'ble Supreme Court's directions, only private
vehicles conforming to at least EURO-I norms are to be
registered. Consequently, in Mumbai, EURO- II norms for
private vehicles (4 wheelers) was made applicable from
2001. In Kolkata, India-2000 norms (EURO-I) were
implemented from November 1999.
g) From October 1, 1999 emission norms for agricultural
tractors were introduced throughout the country. Bharat
Stage-II and Bharat Stage-III emission norms for tractors
were scheduled to be implemented from 2003 and 2005
respectively.
h) The Bharat Stage-II norms for new 4-wheeler, private non-
commercial vehicles were introduced in Mumbai from
January 2001 and in Kolkata and Chennai from July 2001 to
October 24, 2001.
i) Only those taxies were registered in Delhi, which conformed
to Bharat Stage-II norms.
j) Bharat State-II norms for Diesel 4-wheeler transport vehicles
were introduced in NCT from 24th October, 2001, and in
Greater Mumbai, Kolkata and Chennai from October 31,
2001.
k) An expert committee on the Auto Oil Policy was constituted
during September 2001. The interim report of the committee
was submitted to the government on January 1, 2000,
recommending Bharat Stage-III emission norms for all
categories of 4-wheelers in seven mega cities from 2005 and
for the rest of the country by 2010. The final report of the
committee was submitted in September 2002 and includes
the road map for control of vehicular pollution till 2010.
II. Fuel Quality Specifications
For the first time, diesel and gasoline fuel quality with respect to
environment related parameters was notified under the EPA in
April 1996.
All these measures were introduced in phases (Table 2.2.15,
2.2.16 and 2.2.17).
III.Traffic Management
a) Restrictions have been imposed on goods vehicles during
day time from August 1999 in Delhi.
b) Left lane of the roads have been made exclusive for buses
and other HMV (Heavy Motor Vehicles) in Delhi.
c) Time clocks have been installed at important traffic signals
to enable the drivers to switch off their vehicles depending
on the time left in the clocks.
d) More fly-overs and subways have been constructed and
T-Junctions have been closed for better traffic flow.
IV. Public Transport Systems
a) Number of buses have been increased in major cities to
encourage the use of public transportation and reduce
private vehicle use.
b) Delhi and Kolkata have introduced the Metro Rail system.
The Government of Maharashtra has also developed a
master plan for the Mumbai Metro with implementation in
three phases over nine corridors. Other states like
Karnataka is in the initial phase of implementing Mass
Rapid Transit System (MRTS).
c) To provide better public transport and to ease congestion,
proposals for Bus Rapid Transit System (BRTS) have been
approved for Ahmedabad, Bhopal, Indore, Jaipur, Pune,
Rajkot, Vijayawada and Visakhapatnam under JNNURM,
covering a total length of more than 310 kms.
V. Reduction of Emissions by Using Lubricants
a) Specifications of 2T oil for two stroke engine with respect
to smoke emissions were notified under the EPA in
September 1998, for implementation from April 1, 1999
throughout the country.
b) Pre-mix 2T oil dispenser has been installed at all petrol
filling stations in Delhi so that excessive oil is not being
used by the vehicle owners. Sale of loose 2T oil was banned
from December 1998 in Delhi and Kolkata.
VI. Technology
a) Fitting catalytic converter for new petrol passenger cars
was made compulsory from April 1, 1995 in four metros
and 45 cities from September 1, 1998.
b) Two wheeler scooters with four stroke engine were
introduced in the market from October 1998.
c) Registration of only rear engine auto rickshaws was
allowed from May 1996 onwards.
VII. Alternate Fuels
a) CNG vehicles were introduced in Mumbai and Delhi. At
present more than 80,000 CNG vehicles (19000 cars, 49810
autos, 4935 RTVs & 8874 buses) are plying in Delhi and
about 23,000 in Mumbai. All city buses were converted to
the CNG mode in Delhi.
b) There are more than 111 CNG filling stations installed in
Delhi with an average consumption of 674 tonnes per day of
CNG.
c) Emission norms for CNG & LPG driven vehicles have been
notified.
d) Petrol vehicles are running on ethanol blended (5 per cent)
petrol in states of Maharashtra, Andhra Pradesh, Goa,
Gujarat, Haryana, Karnataka, Tamil Nadu, Uttar Pradesh,
Daman & Diu and Union Territories of Dadar & Nagar
Haveli, Chandigarh and Pondicherry.
e) Planning Commission, Government of India, has
announced a National Mission on bio-diesel. Specifications
for this have been drafted by the Bureau of Indian Standards
(BIS).
VIII. Control of Pollution from In-use Vehicles
Idling emission norms have been notified for in-use
vehicles. Pollution Under Control (PUC) certificates are
EURO-III equivalent emission norms for all new vehicles,
except 2-3 wheelers, have been introduced in 11 major cities
from April 1, 2005. To meet Bharat Stage-II, EURO-III and
EURO-IV emission norms, matching quality of petrol and
diesel is being made available.
The vehicle emission norms in India are detailed below.
a) During 1990-91, for the first time in India, notified mass
emission norms for vehicles at the manufacturing stage as
well as for in-use vehicles were implemented. These norms
were notified under the EPA, the Motor Vehicle Rules and the
Air Act.
b) The emission norms introduced in 1996 have been crucial in
controlling vehicular pollution because of stringency in the
norms along with specifications on fuel quality. For the first
time, crankcase and evaporative emission norms were
introduced.
c) From April 1995, in the four metros - Delhi, Mumbai,
Kolkata and Chennai, passenger cars were allowed to register
themselves only if they were fitted with a catalytic converter.
Emission norms for such vehicles were stricter by 50 per cent
compared to the1996 norms.
d) The testing method for passenger car norms was changed
from hot start to cold start. This was a more stringent
requirement compared to the earlier one.
Table 2.2.19: Ambient Air Quality of Delhi - Comparison of Pre-CNG (2000) with 2008*
Parameter
Prescribed
Annual Standard
(Residential)
2000 2008*
Percentage
Increase/
Decrease
No. of Vehicles
(Approx. in Lakhs)
35 55 57
SO2 60 18 5 (-72)
NO2 60 36 48 33
SPM 140 405 413 2
RSPM 60 159 192 21
CO 2000 4686 2348 (-50)
Source: Central Pollution Control Board, 2008
3All values are in µg/m
*Data of November and December is taken from the year 2007 for averaging the year 2008
Observations:
# Increase in number of vehicles (57 per cent), NO (33 ), SPM (2 ) & RSPM (21 )2 per cent per cent per cent
# Decrease in SO (72 ) & CO (50 )2 per cent per cent

State & Trends of the Environment-Air39
State Of Environment Report-2009 38
issued for adherence to idling emission norms every 3-6
months. The number of computerized PUC centres in Delhi
alone is around 353.
IX. Mass Awareness Programmes
a) Messages/articles related to vehicular emissions are
disseminated through newsletters, pamphlets, newspapers,
magazines, television, radio, internet, workshops and
summer exhibitions.
b) Display of ambient air quality data through display systems
in major cities through newspapers, daily news and internet.
c) NGOs working on vehicular pollution control are being
encouraged for mass awareness campaigns.
4. Industrial Pollution Control
The measures taken for controlling air pollution from industries
are as follows:
a) Emission standards have been notified under the
Environment (Protection) Act, 1986 to check pollution.
b) Industries have been directed to install the necessary
pollution control equipments in a time bound manner and
legal action has been initiated against the defaulting units.
c) 24 critically polluted areas have been identified. In all,
Action Plan has been formulated for restoration of
environmental quality in these areas.
d) Environmental guidelines have evolved for siting of
industries.
e) Environmental clearance is made compulsory for 29
categories of development projects involving public
hearing/NGO participation as an important component of
the EIA process.
f) Environmental audit in the form of environmental
statement has been made mandatory for all polluting
industries.
g) Preparation of Zoning Atlas for setting up industries based
on environmental considerations, in various districts of the
country, has been taken up.
h) Power plants (coal based) located beyond 1000 kms from
the pit-head are required to use low ash content coal (not
exceeding 34 per cent) with effect from June 1, 2002. Power
plants located in the sensitive areas are also required to use
low ash coal, irrespective of their distance from the pit-
head.
a) Take an integrated approach towards energy conservation
and adoption of renewal energy technologies, including
hydropower, by appropriately linking efforts to improve
conversion, transmission, distribution, and end-use
efficiency, and R&D in dissemination of renewable energy
technologies. Remove policies, legal, and regulatory
barriers in setting up of decentralized generation and
POLICY SUGGESTIONS
Noise monitoring at Kota
Stone crushing unit needs dust control systems to minimize air pollution
distribution systems for power and other secondary energy
forms, based on local primary energy resources.
b) Accelerate the national programmes of dissemination of solar cookers and improved fuel wood stoves suited to local cooking practices and biomass resources.
c) Strengthen the monitoring and enforcement of emission standards and prepare and implement action plans for both point and non-point sources, relying on a judicious combination of flats and incentive based instruments.
d) Formulate a national strategy for urban transport to ensure adequate investment, public and private, in low pollution mass transport systems.
e) Promote reclamation of wastelands by energy plantations for rural energy, through multi-stakeholder partnership involving the land-owing agencies, local communities and investors.
f) Strengthen efforts for partial substitution of fossil fuels by bio-fuels, through promotion of bio-fuel plantation, promoting relevant research and development, and strengthening regulatory certification of the new technologies.
§Annual Report 2006-07, Central Pollution Control Board
§Annual Report 2006–07, Ministry of Environment & Forests
§Badrinath K. V. S., Kiran Chand T. R. and Krishna Prasad V.
(2006). Agriculture Crop Residue Burning in the Indo-
Gangetic Plains - A study using IRS-P6 AWiFS satellite data.
Current Science. Vol. 91(8), 1085-1089
§Bose, Ranjan K., and V. Srinivasachary. (1997). Policies to
Reduce Energy Use and Environmental Emissions in the
Transport Sector-a Case of Delhi City. Energy Policy. Vol.
25, 1137-1150
§Compendium of Environment Statistics India 2007, Ministry
of Statistics & Programme Implementation
§ENVIS Centre, Indian Institute of Tropical Meteorology
§Goyal, S. K., S. V. Ghatge, P. Nema, and S. M. Tamhane.
Understanding Urban Vehicular Pollution Problem Vis-a-Vis
Ambient Air Quality - Case Study of a Megacity ( Delhi,
REFERENCES
India. Environmental Monitoring and Assessment 119
(2005): 557-569. 12 Nov. 2006
§Luthra A. (1999). Vehicular Emissions in India: Retrospect
and Prospects. Environment and People. Vol. 16(4)
§Nagdeve D. (2004).Air Pollution in Mega Cities of India,
International Institute for Population Sciences
§National Environment Policy 2006, Ministry of
Environment & Forests
§National Family Health Survey-3 (2005-06), Ministry of
Health & Family Welfare
§National Health Profile 2006, Ministry of Health & Family
Welfare
§National Ambient Air Quality Status 2007, Central Pollution
Control Board
§Oldenburg P. “India” .Microsoft Encarta Encyclopedia.
2005
§Pradeep Kumar Dadhich. Potential for CCS in India:
Opportunities and Barriers Opportunities and Barriers.
Expert Group Meeting on Carbon Dioxide Capture and
Storage and Sustainable Development. United Nations
Department of Economic and Social Affairs, 2007
§Sagar A.., Bhattacharya M. & Joon Vinod (2007).A
Comparative Study of Air Pollution - Related Morbidity
Among Exposed Population of Delhi. Indian Journal of
Community Medicine. Vol. 32(4)
§Status of Environment Punjab 2007, Punjab State Council for
Science & Technology
§India Strengthening Institutions for Sustainable Growth
(Country Environmental Analysis), South Asia Environment
and Social Development Unit South Asia Region. World
Bank, April 2007
§Society of Indian Automobile Manufacturers. Fuel and
Vehicular Technology. 2006

State & Trends of the Environment-Water41
State Of Environment Report-2009 40
From the East to the West and from the North to the South, water
has defined life in the Indian subcontinent for thousands of years.
On an average, the combination of rainfall, surface and
groundwater resources have been sufficient for providing
adequate water to the Indian population.
Rise in demand and development pressures are changing the
scenario of water availability in India. Erosion in the watersheds
due to rapid development and poor land management practices is
increasing siltation and changing stream hydraulics.
Groundwater reserves are becoming more and more depleted
even as surface water sources become too polluted for human
use. Biodiversity in the country's once extensive wetlands and
coastal mangroves is fast declining. To add to this, current socio-
economic activities and economic incentives are encouraging
the unsustainable consumption of this resource.
The realization that India's water resources need to be more
WATERcarefully managed, is leading to the adoption of sustainable
water management practices. By managing its water more
judiciously, India can avert the crisis that looms large over the
future.
Surface Water
India is blessed with many rivers. Twelve major river systems
drain the subcontinent along with a number of smaller rivers and
streams and form a total catchment area of approximately 252.8
Mha. Of the major rivers, the Ganga-Brahmaputra-Meghna
system is the biggest, with a combined catchment area of about
110 Mha. which is more than 43 per cent of the catchment area of
all the major rivers in the country. Other major rivers with a
NATIONAL WATER RESOURCES AT A
GLANCE
Sl. No. Quantity (Cubic Km)
1 4000
2 1869
3 1820
4 1122
(i) Surface Water Resources 690 Cu.Km.
Source: Ministry of Water Resources, 2006
Table 2.3.1: Water Availability in India
(ii) Ground Water Resources 431 Cu. Km.
Items
Annual Precipitation (including snowfall)
Average Annual Availability
Per Capita Water Availability (2001) in cubic metres
Estimated Utilizable Water Resources
Table 2.3.2: Water Availability- Basinwise
1 Indus (up to Border) 73.31
a) Ganga 525.02
b) Brahmaputra, Barak & Others 585.6
Source: Ministry of Water Resources, 2006
Sl. No. Average Annual Availability (cubic km/year) Name of the River Basin
2
3 Godavari 110.54
Krishna 78.124
5 Cauvery 21.36
Pennar 6.32
East Flowing Rivers Between Mahanadi & Pennar 22.52
East Flowing Rivers Between Pennar and Kanyakumari 16.46
Mahanadi 66.88
Brahmani & Baitarni 28.48
Subernarekha 12.37
Sabarmati 3.81
Mahi 11.02
West Flowing Rivers of Kutch, Sabarmati including Luni 15.1
Narmada 45.64
Tapi 14.88
West Flowing Rivers from Tapi to Tadri 87.41
West Flowing Rivers from Tadri to Kanyakumari 113.53
Area of Inland drainage in Rajasthan desert Negligible
6
7
8
9
10
11
12
13
14
15
16
17
18
19
20 Minor River Basins Draining into Bangladesh & Burma 31
1869.35Total
catchment area of more than 10 Mha. are Indus (32.1 Mha.),
Godavari (31.3 Mha.), Krishna, (25.9 Mha.) and Mahanadi (14.2
Mha.).
Over 70 per cent of India's rivers drain in the Bay of Bengal,
mostly as a part of the Ganga-Brahmaputra system. The Arabian
Sea, on the western side of the country, receives 20 per cent of the
total drainage from the Indus system as well as from a number of
smaller rivers down the western coast. The remaining ten per
cent drain into the interior basins and few natural lakes scattered
across the country.
Groundwater
Groundwater represents one of the most important water sources
in India. Total replenishable groundwater potential of the
country has been estimated by the Ministry of Water Resources 3as 431 Km per year (Table 2.3.1). Excluding the water reserved
for drinking, industrial and other purposes (other than irrigation),
which is about 16 per cent of the total potential, the potential 3available for irrigation is 360 Km per year. The figure for net
draft of groundwater considering the present utilization indicates
that a substantial portion of the total potential (about 68 per cent)
still remains untapped.
WATER DEMAND
Access to adequate water is one of the leading factors limiting
development in India. Agricultural, industrial and domestic uses
are competing more and more for a limited supply. The
agricultural sector continues to dominate water use owing to its
continued importance to the Indian economy, while industrial
demands are increasing as the sector continues to grow.
Domestic needs claim only a small portion of the annual water
withdrawals as access to adequate water and sanitation supplies
remains low throughout the country. Greater access and an
improvement in the socio-economic situation is likely to result in
a higher demand for water in the coming years, in rural India.
Agriculture Demand
Agriculture remains central to the Indian economy and therefore,
receives the greatest share of the annual water allocation.
According to the World Resources Institute (2000), 92 per cent
of India's utilizable water is devoted to this sector, mostly in the
form of irrigation.
The necessity of irrigation in agricultural production is greater
due to the unpredictable nature of the monsoon. In regions
completely dependent on rain-fed agriculture, a weak monsoon
season can result in drought like conditions leading to reduced

State & Trends of the Environment-Water43
State Of Environment Report-2009 42
yields or even total crop failure. The normal monsoon too allows
the farmers to produce only one crop a year with a low yield.
Indeed, the productivity of irrigated agriculture per unit of land
has been estimated as seven times more than that of the rain-fed
agriculture (World Bank, 1999).
The growth in the irrigated area, along with improvements in the
farming technologies and plant genetics, has been responsible
for the incredible growth in crop production over this period. The
increase in production also has contributed greatly to the national
economy and to India's food security. However, irrigation
expansion has also placed greater demands on surface and
groundwater resources. Groundwater alone accounts for 39 per
cent of the water used in agriculture and the surface water use
often comes at the expense of other sectors such as the industrial
and the domestic supply.
On the other end, flood conditions could prove to be equally
devastating for the agricultural sector and require careful
planning in terms of drainage and construction of flood control
structures. Development projects such as dam and canal
construction were devised to help mitigate the effect of monsoon
on rivers and seasonal streams. For the most part, they have been
successful in reducing the impact of flooding in some areas, their
effectiveness being limited in exceptional rainfall situations.
Industrial Demand
In the past several decades, industrial production has increased
in India owing to an increasingly open economy and greater
emphasis on industrial development and international trade.
Water consumption for this sector has consequently risen and
will continue growing at a rate of 4.2 per cent per year (World
Bank, 1999). According to the World Bank, demand of water for
industrial, energy production and other uses will rise from 67 3 3billion m to 228 billion m by 2025.
Hydroelectric generation already accounts for a large percentage
of water demand. The potential in India has been estimated to be
84,000 MW, of which only 22,000 MW is currently being
harnessed (MOWR, 2001). The large untapped potential,
particularly in the northern regions of India, and the growing
demands for electricity from a larger population and industrial
sector, will ensure that the development of this activity continues
in the coming years.
Domestic Demand
Demand from the domestic sector has remained low and
accounts for only five per cent of the annual freshwater
withdrawals in India (World Resources Institute, 2000).
Domestic water use will increase as the population continues to
grow and access to water is improved. Recent data from the
World Bank indicates that the demand over the next twenty years 3 3will double from 25 billion m to 52 billion m .
Only 85 per cent of the urban and 79 per cent of the rural
population has access to safe drinking water and fewer still have
access to adequate sanitation facilities (World Resources
Institute, 2000) despite Central Government's commitment to
provide the same in the National Water Policy (1987). Most
urban areas are serviced by a municipal water distribution
system. Usually, the municipal water supply originates from
local reservoirs or canals, but in some cases water may be
imported through inter-basin transfer. Although major cities in
India enjoy access to central water supply systems, these
schemes often do not adequately cover the entire urban
population and are notoriously inefficient and unreliable. In rural
areas, access to water is even more precarious. Over 80 per cent
of the rural domestic water comes from groundwater sources
since it is more reliable in terms of water quantity and quality.
Still, in areas where water is scarce, rural women travel long
distances to wells or streams to fetch water for their daily needs.
Water pollution is a serious problem in India as almost 70 per
cent of its surface water resources and a growing percentage of
its groundwater reserves are contaminated by biological, toxic,
WATER POLLUTION
Sl.No.
State
Fluoride
1 19
2 Assam 4
3 9
4 12
5 Delhi 6
6 Gujarat 18
7 14
8 2
9 6
10 20
11 1
12 Madhya Pradesh 19
13 Maharashtra 8
14 11
15 Punjab 11
16 30
17 16
18 10
19 West Bengal 8
Districts (in parts)No. of districtsaffected
Andhra Pradesh Adilabad, Anantpur, Chitoor, Guntur, Hyderabad, Karimnagar, Khammam, Krishna,Kurnool, Mehaboobnagar, Medak, Nalgonda, Nellore, Prakasham, Rangareddy,Vishakhapatanam, Viziangaram, Warangal, West Godawari
Goalpara, Kamrup, Karbi, Anglong, Naugoan
Bihar Aurangabad, Banka, Buxar, Jamui, Kaimur, Munger, Nawada, Rohtas, Supaul
Chhattisgarh Bastar, Bilaspur, Dantewara, Janjgir-Champa, Jashpur, Kanker, Korba, Koriya,Mahasamund, Raipur, Rajnandgoan, SugujaEast Delhi, New Delhi, Northwest Delhi, South Delhi, Southwest Delhi, West Delhi
Ahmedabad, Amreli, Anand, Banaskantha, Bharuch, Bhavnagar, Dahod, Junagarh,Kachchh, Mahesana, Narmada, Panchmahals, Patan, Rajkot, Sabarkantha, Surat,Surendranagar, Vadodara
Haryana Bhiwani, Faridabad, Gurgaon, Hissar, Jhajjar, Jind, Kaithal, Kurkshetra,zMahendragarh, Panipat, Rewari, Rohtak, Sirsa, Sonepat
Jammu & Kashmir Rajauri, Udhampur
Jharkhand Bokaro, Giridih, Godda, Gumla, Palamau, Ranchi
Karnataka Bagalkot, Bangalore, Bellary, Belgaum, Bidar, Bijapur, Chamarajnagar, Chikmagalur, Chitradurga, Devangere, Dharwar, Gadag, Gulbarga, Haveri, Kolar Koppala, Mandya, Mysore, Raichur, Tumkur
Kerala PalakkadBhind, Chhatarpur, Chhindwara, Datia, Dewas, Dhar, Guna, Gwalior, Harda, Jabalpur, Jhabua, Khargone, Mandsaur, Rajgarh, Satna, Seoni, Shajapur, Sheopur, Sidhi
Amrawati, Chandrapur, Dhule, Gadchiroli, Gondia, Jalna, Nagpur, Nanded
Orissa Angul, Balasore, Bargarh, Bhadrak, Boudh, Cuttack, Deogarh, Dhenkanal, Jajpur, Keonjhar, Suvarnapur
Amritsar, Bhatinda, Faridkot, Fatehgarh Saheb, Firozpur, Gurdaspur, Mansa, Moga, Muktsar, Patiala, SangrurAjmer, Alwar, Banswara, Barmer, Bharatpur, Bhilwara, Bikaner, Bundi, Chhittorgarh, Churu, Dausa, Dholpur, Dungarpur, Ganaganagar, Hanumangarh, Jaipur, Jaisalmer, Jalore, Jhunjhunu, Jodhpur, Karauli, Kota, Nagaur, Pali, Rajasamand, SawaiModhopur, Sikar, Sirohi, Tonk, Udaipur
Rajasthan
Tamil Nadu Coimbatore, Dharmapuri, Dindigul, Erode, Karur, Krishnagiri, Namakkal, Perambalur, Puddukotai, Ramnathpuram, Salem, Shivaganga, Theni, Thiruvannamalai, Vellore, Virudunagar
Uttar Pradesh Agra, Aligarh, Etah, Firozabad, Jaunpur, Kannauj, Mahamayanagar, Mainpuri,Mathura, Maunathbhanjan
Bankura, Bardhhman, Birbhum, Dakhin, Dinajpur, Malda, Nadia, Purulia, Uttar Dinajpur
Table 2.3.3: State-wise Details of Distribution of Flouride in Groundwater above Permissible Limit
Source: Ministry of Water Resources, 2008
than their relative importance, implied in the Indian economy.
Despite this, agricultural activities still dominate in terms of
overall impact on water quality.
Besides rapidly depleting groundwater table, the country faces
another major problem on the water front - groundwater
contamination - a problem which has affected as many as 19
states, including Delhi. The geogenic contaminants, including
salinity, iron, fluoride and arsenic have affected groundwater in
over 200 districts spread across 19 states (Table 2.3.3 and Table
2.3.4). Studies have shown that long-term intake of fluoride can
cause tooth decay and crippled bones. Arsenic can cause skin
cancer and skin pigmentation.
organic and inorganic pollutants (MOWR 2000). In many cases,
these sources have been rendered unsafe for human consumption
as well as for other activities such as irrigation and industrial
needs. This illustrates that degraded water quality can contribute
to water scarcity as it limits its availability for both human use
and the ecosystem.
In 1995, the Central Pollution Control Board identified severely
polluted stretches on 18 major rivers in India (World Bank 1999).
Not surprisingly, the majority of these stretches were found in
and around large urban areas. The high incidence of severe
contamination near urban areas indicates that the industrial and
domestic sector's contribution to water pollution is much higher
A High Altitude Lake in Kanchanjunga National Park
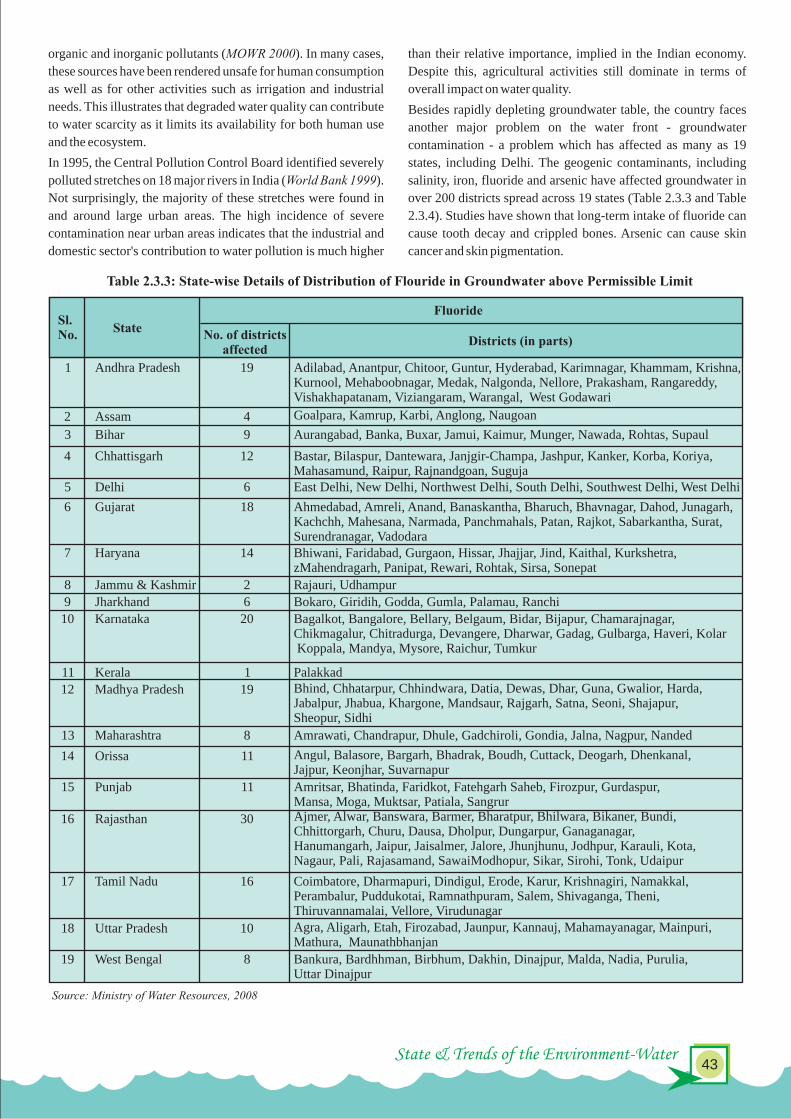
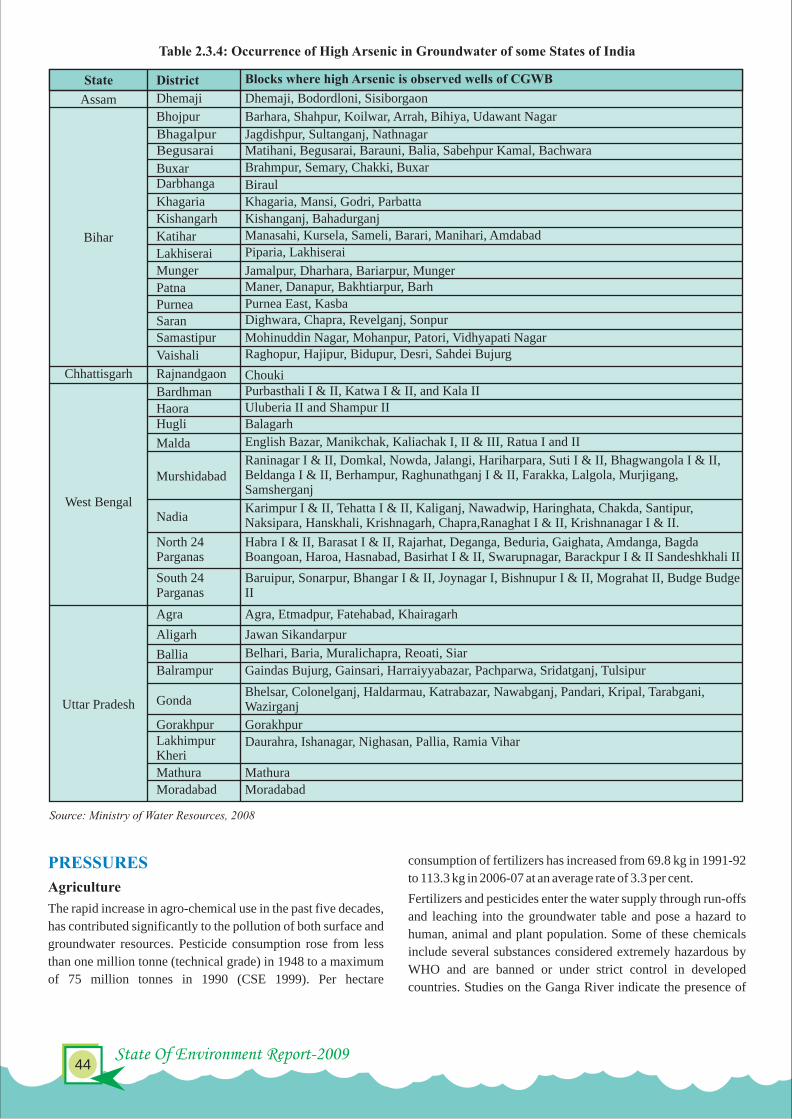
State & Trends of the Environment-Water45
State Of Environment Report-2009 44
Source: Ministry of Water Resources, 2008
Table 2.3.4: Occurrence of High Arsenic in Groundwater of some States of India
State District Blocks where high Arsenic is observed wells of CGWB
Assam
Munger
Patna
Saran
West BengalNadia
Agra
Dhemaji Dhemaji, Bodordloni, Sisiborgaon
Bihar
Bhojpur Barhara, Shahpur, Koilwar, Arrah, Bihiya, Udawant Nagar
Bhagalpur Jagdishpur, Sultanganj, NathnagarBegusarai Matihani, Begusarai, Barauni, Balia, Sabehpur Kamal, Bachwara
Buxar Brahmpur, Semary, Chakki, BuxarDarbhanga Biraul
Khagaria Khagaria, Mansi, Godri, Parbatta
Kishangarh Kishanganj, Bahadurganj
Katihar Manasahi, Kursela, Sameli, Barari, Manihari, Amdabad
Lakhiserai Piparia, Lakhiserai
Jamalpur, Dharhara, Bariarpur, MungerManer, Danapur, Bakhtiarpur, Barh
Purnea Purnea East, KasbaDighwara, Chapra, Revelganj, Sonpur
Samastipur Mohinuddin Nagar, Mohanpur, Patori, Vidhyapati Nagar
Vaishali Raghopur, Hajipur, Bidupur, Desri, Sahdei Bujurg
Chhattisgarh Rajnandgaon Chouki
Bardhman Purbasthali I & II, Katwa I & II, and Kala II
Haora Uluberia II and Shampur IIHugli Balagarh
Malda English Bazar, Manikchak, Kaliachak I, II & III, Ratua I and II
MurshidabadRaninagar I & II, Domkal, Nowda, Jalangi, Hariharpara, Suti I & II, Bhagwangola I & II,Beldanga I & II, Berhampur, Raghunathganj I & II, Farakka, Lalgola, Murjigang,Samsherganj
Karimpur I & II, Tehatta I & II, Kaliganj, Nawadwip, Haringhata, Chakda, Santipur,Naksipara, Hanskhali, Krishnagarh, Chapra,Ranaghat I & II, Krishnanagar I & II.
North 24Parganas
Habra I & II, Barasat I & II, Rajarhat, Deganga, Beduria, Gaighata, Amdanga, BagdaBoangoan, Haroa, Hasnabad, Basirhat I & II, Swarupnagar, Barackpur I & II Sandeshkhali II
South 24Parganas
Baruipur, Sonarpur, Bhangar I & II, Joynagar I, Bishnupur I & II, Mograhat II, Budge BudgeII
Uttar Pradesh
Agra, Etmadpur, Fatehabad, Khairagarh
Aligarh Jawan Sikandarpur
Ballia Belhari, Baria, Muralichapra, Reoati, Siar
Balrampur Gaindas Bujurg, Gainsari, Harraiyyabazar, Pachparwa, Sridatganj, Tulsipur
GondaBhelsar, Colonelganj, Haldarmau, Katrabazar, Nawabganj, Pandari, Kripal, Tarabgani,Wazirganj
Gorakhpur GorakhpurLakhimpurKheri
Daurahra, Ishanagar, Nighasan, Pallia, Ramia Vihar
Mathura Mathura
Moradabad Moradabad
consumption of fertilizers has increased from 69.8 kg in 1991-92
to 113.3 kg in 2006-07 at an average rate of 3.3 per cent.
Fertilizers and pesticides enter the water supply through run-offs
and leaching into the groundwater table and pose a hazard to
human, animal and plant population. Some of these chemicals
include several substances considered extremely hazardous by
WHO and are banned or under strict control in developed
countries. Studies on the Ganga River indicate the presence of
PRESSURES
Agriculture
The rapid increase in agro-chemical use in the past five decades,
has contributed significantly to the pollution of both surface and
groundwater resources. Pesticide consumption rose from less
than one million tonne (technical grade) in 1948 to a maximum
of 75 million tonnes in 1990 (CSE 1999). Per hectare
Groundwater overdraft is a serious concern
chemicals such as HCH, DDT, endosulfan, methyl malathion,
malathion, dimethoate, and ethion in levels greater than those
recommended by the international standards (World Bank 1999).
Some of these substances have been known to bio-accumulate in
certain organisms, leading to an increased risk of contamination
when used for human consumption and a persistence of the
chemicals in the environment over long periods of time.
Water enriched with nutrients leads to eutrophication. Decaying
organic matter releases odourous gases and partially
decomposed matter accumulates on the river or lakebed, thereby
limiting water's suitability for human consumption and other
uses. High levels of fertilizer use has been associated with
increased incidence of eutrophication in rivers and lakes in
several of India's most important water bodies, such as the
Hussein Sagar in Hyderabad and Nainital in Uttar Pradesh
(MOWR 2000)
Industries
Although the industrial sector only accounts for three per cent of
the annual water withdrawals in India, its contribution to water
pollution, particularly in urban areas, is considerable.
Wastewater generation from this sector has been estimated to be 3 355,000 million m per day, of which 68.5 million m are dumped
directly into local rivers and streams without prior treatment
(MOWR 2000). The government has called for the establishment
of Common Effluent Treatment Plants (CETP) in industrial areas
but their implementation has been slow, and most industries
either are not connected to CETPs or only partially treat their
wastewater before disposal. The Central and State Pollution
Control Boards have identified 1,532 'grossly polluting'
industries in India, although almost non of the industries comply
with the emission standards (World Bank 1999).

State & Trends of the Environment-Water47
State Of Environment Report-2009 46
Wastewater from industrial activities is often contaminated with
highly toxic organic and inorganic substances, some of which are
persistent pollutants and remain in the environment for many
years. For instance, over 50 per cent of the urban organic load in
some cities originates from industrial effluents. Further, heavy
metal contamination from thermal power, tannery and mining
activities has occurred in several locations (World Bank 1999).
Water contamination from industrial areas is compounded
usually due to the high concentration of industries over a small
area. Increasing industrial development, coupled with
inadequate zoning and emissions regulations, will only
aggravate the problem in the coming years.
Domestic Usage
All of India's fourteen major river systems are heavily polluted,
mostly from the 50 million cubic meters of untreated sewage
discharged into them each year (APCSS 1999). The domestic
sector is responsible for the majority of wastewater generation in
India. Combined, the 22 largest cities in the country produce over
7,267 million litres of domestic wastewater per day, of which
slightly over 80 per cent is collected for treatment (CSE 1999).
Inadequate treatment of human and animal wastes also
contributes to high incidence of water-related diseases in the
country. Till date, only 19.2 per cent of the rural and 70 per cent of
the urban inhabitants have access to adequate sanitation facilities
(WRI 2000). Therefore, water contaminated by human waste is
often discharged directly into watercourses or seeps into the
groundwater table from faulty septic tanks or pit latrines. The
level of faecal coliform bacteria in most rivers often exceeds
WHO standards and is responsible for causing a number of
gastro-intestinal ailments among the population.
Improper disposal of solid waste also leads to surface and
groundwater pollution. Runoff from garbage dumps and city
streets carries litter, deposed particulate matter and chemicals to
nearby streams and canals. Leaching from landfills and garbage
pits transports toxic substances and heavy metals to the water
table. Annual production of solid waste in India has been
estimated to be 2,000 million tonnes (MOWR 2000). This figure
will undoubtedly continue to increase with the growing
population and the higher consumption of disposable goods
resulting from improvement in the socio-economic conditions of
the rural and urban residents.
The water quality data on rivers, lakes, ponds, tanks and
groundwater locations being monitored under the network, is
evaluated against the water quality criteria, and the monitoring
locations, on exceeding one or more parameters are identified as
polluted, and require action for restoration of water quality. The
locations on rivers, lakes, ponds, tanks and groundwater which
have not met the criteria are summarized below.
§High Biochemical Oxygen Demand (BOD), one of the most
important indicators of pollution, was observed in
STATE & TRENDS
Amlakhadi at Ankleshwar (714 mg/l) followed by Ghaggar
at Moonak, Punjab (626 mg/l); Khari at Lali village,
Ahmedabad (320 mg/l); Musi at Hyderabad (225 mg/l);
Sabarmati at Ahmedabad (207 mg/l); Kalinadi at Kannuaj,
Uttar Pradesh (136 mg/l); Khan at Kabitkhedi, Indore,
Madhya Pradesh (120 mg/l); Damanganga D/s Daman at
Kachigaon (112 mg/l); Kalinadi at D/s of Muzzafarnagar,
Uttar Pradesh (110 mg/l); Saroonagar, Ranga Reddy Dist.
Andhra Pradesh (71 mg/l); Gandigudem at Medak Dist. (60
mg/l); Hindon at Saharanpur (60 mg/l); Yamuna at Sonepat
(59 mg/l); Krishna D/s of Islampur (40mg/l); Satluj D/s
Hussainwala Firozpur, Punjab (40 mg/l); Bhima at Pune (36
mg/l); Elangabeel System point, Assam (64 mg/l); Bharalu at
Guwahati, Assam (43 mg/l); Sukhna at Parwanoo Dist.,
Solan (36 mg/l); Chandola Lake at Ahemdabad (36 mg/l);
Hussain Sagar Lake, Budamaru, Andhra Pradesh (33 mg/l);
Dhadar at Kothada (32 mg/l); Bhaleshwar Khadi at N.H. No.
8 (27 mg/l); Gomti at Sitapur (25 mg/l); Chambal at Dholpur
(25 mg/l); Yamuna between Delhi and Etawah (10-59 mg/l)
and Tapi at Uphad, Maharashtra (25 mg/l). Due to a high
BOD, dissolved oxygen in these stretches was observed to be
either nil or very low most of the time.
§Total number of observations having BOD less than 3 mg/l; 3
to 6 mg/l and above 6 mg/l was 64 per cent, 18 per cent and 18
per cent, respectively. The total number of observations
having total Coliform number less than 500 MPN/100 ml
was 45 per cent; between 500-5000 MPN/100 ml was 31 per
cent and exceeding 5000 MPN/100 ml was 24 per cent
MPN/100 ml. Similarly, the number of observations having
Faecal Coliform bacterial count less than 500 MPN/100 ml
was 53 per cent; between 500-5000 MPN/100 ml was 26 per
cent and 21 per cent observations were exceeding 5000
MPN/100 ml.
§Faecal Coliform, another important indicator of pollution in
India was found the highest in the Yamuna river in Agra, 6 6
Nizamuddin, Mazawali and Okhla (MPN 5.2x10 to 3.7x10 ) 6followed by Hindon after confluence with Krishna (1.1x10
5 6to 4.6x10 ); Ganga at Dakshineshwar and Uluberia (1.1x10 5 6to 2.8x10 ); Damodar at Haldia (1.4x10 ); Khari at Lali
5Village, Ahmedabad (7.5x10 ); Sabarmati at Ahmedabad 6 5 5(1.1x10 to 4.6x10 ); Bharalu at Guwahati, Assam (2.4x10 );
5 5Ganga at Varanasi (1.1 x 10 ); Satluj at Ludhiana (1.1x10 ); 5 5Tapi at Ukai (1.5x10 ); Kalinadi at Muzaffarnagar (3.1x10 );
6Damanganga at Silvasa (1.2x10 ); and Brahmaputra at 5Dhenukapahar and Pandu (2.4x10 ).
Due to various factors, available water is deteriorating in quality.
Tests indicate that the biological contamination of surface water
sources, much of it due to untreated or partially treated sewage,
exceeds permissible limits at many locations. Similarly,
overexploitation of groundwater, besides other human activities
IMPACT
has led to contamination of groundwater in many parts of the
country. While salinity (dissolved salts in water) and iron make
the taste of water and vegetables cooked in it unappealing, long-
term usage of water with fluoride and arsenic can lead to several
health hazards.
Around 85 per cent of the rural population of the country uses
groundwater for drinking and domestic purposes. High
concentrations of fluoride and arsenic in groundwater beyond
the permissible limits of 1.5 mg/l and 0.05 mg/l, respectively
poses health hazard. In all, 19 states in India have been identified
as 'endemic' areas for fluorosis, with an estimated 44 million
people impacted, and another 66 million at risk. The scenario is
the worst in the hard rock terrain viz., granites.
Arsenic is a known carcinogen and is highly toxic. It is perhaps
the only human carcinogen for which there is adequate evidence
of carcinogenic risk by both inhalation and ingestion (Centeno et
al. 2002; Chen & Ahsan 2004).The occurrence of Arsenic in
groundwater was first reported in 1980 in West Bengal in India.
Apart from West Bengal, arsenic contamination in groundwater
has been found in the states of Bihar, Chhattisgarh, Uttar Pradesh
and Assam. Arsenic in groundwater has been reported in 15
districts in Bihar, 9 districts in Uttar Pradesh, 8 districts in West
Bengal and one district each in Chhattisgarh and Assam.
The management of India's water resources falls under the
jurisdiction of a number of government agencies, although the
primary responsibility for the development of water resources
belong to the individual states. The Central Government
oversees the implementation of national policy on resource
development and exploitation, as well as manages inter-state and
international rivers and river valleys. It also provides technical
advice to individual states on development, flood control, coastal
erosion, dam safety, navigation and hydropower when required.
National Water Quality Monitoring Programme
(NWMP)
CPCB in collaboration with State pollution control boards
established a nationwide network for water quality monitoring
comprising 1,019 stations in 27 States and 6 Union Territories.
The monitoring is undertaken on a monthly or quarterly basis for
surface water and on a half yearly basis for groundwater. The
monitoring network covers 200 Rivers, 60 Lakes, 5 Tanks, 3
Ponds, 3 Creeks, 13 Canals, 17 Drains and 321 Wells.
The water quality monitoring results obtained between 1995 to
2006 indicate that organic and bacterial contamination continue
to be critical in water bodies. This is mainly due to discharge of
domestic wastewater mostly in untreated form from the urban
centres of the country. The municipal corporations at large are
not able to treat the wastewater, increasing municipal sewage
load flowing into water bodies without treatment. Secondly, the
receiving water bodies also do not have adequate water for
dilution, because of which the oxygen demand and bacterial
RESPONSE
pollution is depicting an increasing trend and leading to water
borne diseases. The water quality monitoring results were
analyzed with respect to the indicator of organic matter (Bio-
chemical oxygen demand) and indicator of pathogenic bacteria
(total coliform and faecal coliform).
The result of such analysis shows that there is gradual
degradation in water quality.
National Water Policy
A comprehensive policy on water is necessary on the face of a
growing number of social, economic and environmental issues
surrounding water resources in India. In 1987, the National Water
Resources Council adopted the National Water Policy (NWP)
and submitted the document to Parliament for implementation.
The NWP is the primary document stating the position of the
Government of India (GOI) on water resource issues, ranging
from drought and flood management to drinking water
provisions.
In essence, the policy serves as a guideline to help planners and
managers develop the country's water resources to its maximum
potential. But the adoption of the policy is also a step-forward for
the government in terms of promoting the sustainable
management of the country's water resources.
The policy addresses many issues regarding planning,
development and allocation of water, including groundwater and
surface water sources. Among the points addressed in the policy
are:
§Development of standardized national information system
containing data on water availability and use is essential for
appropriate planning;
§Resource planning should be conducted using a catchment or
a watershed as the basic unit;
§Water development projects should be multi-purpose and
should address various priorities such as drinking water
provision and flood-mitigation;
§Environmental impact of new projects should be assessed and
minimized wherever possible;
A view of Dal Lake in Kashmir

State & Trends of the Environment-Water49
State Of Environment Report-2009 48
§Socially disadvantaged groups such as Scheduled Castes and
Tribes and other minority groups are to be included in the
planning process as much as possible, and farmers must
become increasingly involved in the irrigation management
policies;
§Groundwater development should be based on the basis of
the potential and recharge capabilities of the aquifer;
§Water allocation should be based on the following priorities:
drinking water, irrigation, hydro-power, navigation,
industrial and other uses;
§Irrigation planning should attempt to maximize benefits to
farmers and integrate soil and water conservation practices;
§Water rates should reflect the true cost of water use and
encourage economic use of the resource;
§Promotion of conservation through education, regulation and
incentives be encouraged;
§Development of a master plan for flood control and
management should be undertaken and include soil
conservation, forestry management, zoning and forecasting
considerations;
§Drought-prone areas should be given priority in water
development projects and programmes such as soil moisture
conservation and water harvesting practices should be
encouraged;
§Additional research in a number of areas such as hydro-
meteorology, groundwater hydrology and recharge, water
harvesting, crops and cropping systems, sedimentation and
reservoirs, river morphology and hydraulics, recycling and
re-use, and sea water resources should be pursued.
The National Water Resources Council is the body responsible
for reviewing the progress made by the government in
implementing the policy. The Council is composed of
Secretaries from various Ministries associated with water
resources and the Chief Secretaries of States/Union Territories.
Through the National Water Board, the Council is able to make
recommendations regarding the financing and development of
new projects and provide suggestions on further action to be
taken.
Acts And Regulations
Water in India is governed under three different Acts: the
Environmental Protection Act (1986), the River Boards Act
(1956) and the Inter-State Water Disputes Act (1956). Other Acts
and Regulations affect water resources in different ways by
addressing its importance for agriculture, biodiversity and
conservation and drinking water. These three Acts, however,
have the broadest scope in terms of how they affect all aspects of
water management.
River Boards Act
The regulation and development of inter-state rivers and river
valleys was to be entrusted to various River Boards when this Act
was adopted in 1956. The River Boards were designed to advise
the central government on development opportunities, co-
ordinate activities and resolve disputes. Under their mandate, the
Boards were required to provide advice to the government on the
following topics:
§Conservation with a view to control and optimise use of
water resources;
§Promotion and operation of schemes related to irrigation,
water supply and drainage;
§Promotion and operation of schemes related to hydro-power
and flood control;
§Promotion and control of navigation;
§Promotion of aforestation and control of soil erosion;
§Prevention of pollution; and
§Other duties as deemed necessary.
The Indian government has been unable to constitute a River
Board since the Act was enacted, almost fifty years ago.
However, there is a realisation of the fact that the Act should be
revised and amendments are currently under way to strengthen
its powers.
Inter-State Water Disputes (ISWD) Act, 1956
Since the majority of the rivers in India are shared between
neighbouring States, the ISWD Act was enacted in 1956 to
adjudicate any dispute regarding the distribution or control of
rivers or river valleys. The Act gives the Government the power
to constitute Tribunals to serve as intermediaries in the disputes.
Till date, five Inter-State Water Tribunals have been established:
§Godavari Water Disputes Tribunal (April 1969)
§Krishna Water Disputes Tribunal (April 1969)
§Narmada Water Disputes Tribunal (October 1969)
§Ravi and Beas Water Disputes Tribunal (April 1986)
§Cauvery Water Disputes Tribunal (June 1990)
The first three Tribunals have been concluded, but a final
decision is still pending on the last two matters.
International Treaties
A number of international disputes regarding the allocation and
management of water of several large transboundary rivers have
arisen between India and its neighbours. Fortunately, these
differences have been settled through diplomatic channels with
the signing of treaties and agreements. The three principal
treaties are:
§The Indus Water Treaty - India and Pakistan (1960)
§The Indo Nepal Treaty on the Integrated Development of
Mahakali River (1996)
§The Ganga Water Sharing Treaty with Bangladesh: Sharing
of Lean Season Flow of Ganga at Farakka Barrage in India
(1996)
All three disputes arose from disagreements on the allocation of
water resources between India and the other countries. In case of
both Indus and Mahakali Rivers, the equitable distribution of
irrigation water was under contention. The Farakka Barrage
dispute originated when the water level entering Bangladesh
from India was reduced to almost nothing during the lean season
(January to May) due to the construction of the Farakka Barrage
on the Indian side of the border. In 1996, an agreement was
reached between the governments of India and Bangladesh to
share the flow during the lean season in the ratio of 60 per cent
(Bangladesh) and 40 per cent (India).
Although the treaties have been signed, there are still a number of
issues which remain unresolved. However, in general, the
treaties have generated a sense of goodwill between India and its
neighbours, which bodes well for future collaborations.
§Annual Report 1999, World Bank
§Annual Report 1999, Asia-Pacific Centre for Security
Studies
§Centre for Science and Environment (1999). Perpetual
Thirst: Faucets of the problem, Down to Earth Vol. 7 (19),
February 28
§Central Ground Water Board, Ministry of Water Resources
§Centeno J.A., Mullick F.G., Martinez L., Page N.P., Gibb
H. and Longfellow D. (2002). Pathology Related to
Chronic Arsenic Exposure. Environ Health Perspect
110(suppl 5),883–886
§Chen Y. and Ahsan H. (2004). Cancer Burden from Arsenic
in Drinking Water in Bangladesh. American Journal of
Public Health, 94(5), 741- 744
§Compendium of Environment Statistics India 2007, Ministry
of Statistics & Programme Implementation
§Dynamic Ground Water Resources of India 2006, Central
Ground Water Board, Ministry of Water Resources
§National Water Policy 1987, Ministry of Water Resources
§Ramesh R. and Yadava M.G. (2005). Climate and Water
Resources of India, Current Science, Vol 89 (5)
§Status of Water Quality in India 2007-08, Central Pollution
Control Board
REFERENCES
A common effluent treatment plant at Chennai

State & Trends of the Environment-Biodiversity51
State Of Environment Report-2009 50
BIODIVERSITYIndia is one of the 17 identified mega diverse countries of the
world. From about 70 per cent of the total geographical area
surveyed so far, 45,500 plant species (including fungi and lower
plants) and 91,000 animal species, representing about seven per-
cent of the world's flora and 6.5 per cent of the world's fauna,
respectively, have been described. Nearly 6,500 native plants are
still used prominently in the indigenous healthcare systems.
From the biodiversity standpoint, India has some 59,353 insect
species, 2,546 fish species, 240 amphibian species, 460 reptile
species, 1,232 bird species and 397 mammal species, of which
18.4 per cent are endemic and 10.8 per cent are threatened. The
country is home to at least 18,664 species of vascular plants, of
which 26.8 per cent are endemic. With only 2.4 per cent of the
total land area of the world, the known biological diversity of
India contributes 8 per cent to the known global biological
diversity. It has been estimated that at least 10 per cent of the
country's recorded wild flora, and possibly the same percentage
of its wild fauna, are on the threatened list, many of them on the
verge of extinction.
India has two biodiversity hot spots, namely:
1. The Eastern Himalayas
2. The Western Ghats
And, it is composed of diverse ecological habitats:
1. Forests
2. Grasslands
3. Wetlands
4. Coastal and Marine ecosystems
5. Desert ecosystems
BIODIVERSITY PROFILE OF INDIA
India, with varied terrain, topography, land use, geographic and
climatic factors, can be divided into ten recognizable bio-
geographic zones (Rodgers et al., 2000). These zones encompass
a variety of ecosystems - mountains, plateaus, rivers, forests,
deserts, wetlands, lakes, mangroves, coral reefs, coasts and
islands.
Trans-Himalayan Region, constituting 5.6 per cent of the total
geographical area, includes the high altitude, cold and arid
mountain areas of Ladakh, Jammu & Kashmir, North Sikkim,
Lahaul and Spiti areas of Himachal Pradesh. This zone has
sparse alpine steppe vegetation that harbours several endemic
species and is a favourable habitat for the biggest populations of
wild sheep and goat in the world and other rare fauna that
includes Snow Leopard (Uncia uncia) and the migratory Black-
necked Crane (Grus nigricollis). The cold dry desert of this zone
represents an extremely fragile ecosystem.
Himalayan Zone, in the far North, constituting 6.4 per cent of
the total geographical area includes some of the highest peaks in
the world and makes India one of the richest areas in terms of
habitats and species. The steep slopes, unconsolidated soils and
intense rainfall render the zone extremely fragile. The alpine and
sub-alpine forests, grassy meadows and moist mixed deciduous
forests provide diverse habitat for endangered species of bovids
such as Bharal (Pseudois nayaur), Ibex (Capra ibex), Markhor
(Capra falconeri), Tahr (Hemitragus jemlabicus), and Takin
(Budoreas taxicolor). Other rare and endangered species
restricted to this zone include Hangul (Cervus eldi eldi) and
Musk Deer (Moschus moschiferus) .
Indian Desert Zone, constituting 6.6 per cent of the total
Figure 2.4.1: Biogeographic Classification of India
Source : State of Environment Atlas of India 2007, MoEF
geographical area, includes the Thar and the Kutch deserts and
has large expanses of grassland that supports several endangered
species of mammals such as Wolf (Canis lupus), Caracal (Felis
caracal), Desert Cat (Felis libyca) and birds of conservation
interest viz., Houbara Bustard (Chamydotis undulate) and the
Great Indian Bustard (Ardeotis nigriceps).
Semi-arid Region, constituting 16.6 per cent of the total
geographical area, is a transition zone between the desert and the
dense forests of Western Ghats. Peninsular India has two large
regions, which are climatically semi-arid. This semi-arid region
also has several artificial and natural lakes and marshy lands.
The dominant grass and palatable shrub layer in this zone
supports the highest wildlife biomass. The cervid species of
Sambar (Cervus unicolor) and Chital (Axis axis) are restricted to
the better wooded hills and moister valley areas respectively.
The Lion (Leo persica), an endangered carnivore species
(restricted to a small area in Gujarat), Caracal (Felis caracal),
Jackal (Canis aureus) and Wolf (Canis lupus) are some of the
endangered species that are characteristic of this region.
Western Ghats, constituting 4.0 per cent of the total
geographical area, is one of the major tropical evergreen forest
regions in India. The zone stretches from the hills to the South of
the Tapti River in the North to Kanyakumari in the South and in
the West, this zone is bound by the coast. This zone represents
one of the biodiversity 'hot spots' with some 15,000 species of
higher plants, of which 4,000 (27 per cent) are endemic to the
region.
The Western Ghats harbour viable populations of most of the
vertebrate species found in peninsular India, besides an endemic
faunal element of its own. Significant species endemic to this
region include Nilgiri Langur (Presbytis jobni), Lion Tailed
Macaque (Macaca silenus), Grizzled Giant Squirrel (Ratufa
macroura), Malabar Civet (Viverricula megaspila), Nilgiri Tahr
(Hemitragus bylocrius) and Malabar Grey Hornbill (Ocycerous
griseus). The Travancore Tortoise (Indotestudo forstem) and
Cane turtle (Heosemys silvatica) are two endangered taxa
restricted to a small area in central Western Ghats.
Deccan Plateau, constituting 42 per cent of the total
geographical area, is a semi-arid region that falls in the rain
shadow area of the Western Ghats. This bio-geographic zone of
peninsular India is by far the most extensive zone, covering
India's finest forests, particularly in the States of Madhya
Pradesh, Maharashtra and Orissa. Majority of the forests are
deciduous in nature but there are regions of greater biological
diversity in the hill ranges. The zone comprising of deciduous
forests, thorn forests and degraded scrubland support diverse
wildlife species. Species such as Chital (Axis axis), Sambar
(Cervus unicolor), Nilgai (Boselapbus tragocamelus) and
Chousingha (Tetracerus quadricornis) are abundant in this zone.
Some other species like Barking deer (Muntiacus muntjak) and
Gaur (Antilope cervicapra) are more frequent in, or are restricted
to moister areas, but are still found in fairly large numbers.
Species with small populations include the Elephant (Elephas
maximus) in Bihar-Orissa and Karnataka-Tamil Nadu belts, Wild

State & Trends of the Environment-Biodiversity53
State Of Environment Report-2009 52
flats, coral reefs and marine angiosperm pastures make them the
wealth and health zones of India. The coastline from Gujarat to
Sunderbans is estimated to be 5,423 km long. A total of 25 islets
constitute the Lakshadweep, which are of coral origin, and have
a typical reef lagoon system, rich in biodiversity. However, the
densely populated Lakshadweep islands virtually have no
natural vegetation.
Andaman and Nicobar Islands, constituting 0.3 per cent of the
total geographical area are one of the three tropical moist
evergreen forests zones in India. The islands house an array of
flora and fauna not found elsewhere. The elongated North-South
oriented groups of 348 Andaman Islands have a bio-
geographical affinity with Myanmar. The Nicobar Islands, lying
only 90 kms away from Sumatra have much stronger Indonesian
and South-East Asian elements. These islands are centres of high
endemism and contain some of India's finest evergreen forests
and support a wide diversity of corals. However, endemic island
biodiversity is found only in the Andaman and Nicobar Islands.
Wetlands occur in various geographical regions such as the cold
arid zones of Ladakh, warm arid zones of Rajasthan, tropical
monsoonic Central India, North Eastern region, South
peninsular region and the coastal wetlands.
India has two identified biodiversity hot spots. These are the
Eastern Himalayas and the Western Ghats.
Eastern Himalaya
Phyto-geographically, the Eastern Himalaya forms a distinct
floral region and comprises of Nepal, Bhutan, states of East and
North-East India, and a contiguous sector of Yunnan province in
South-Western China. In the whole of Eastern Himalaya, there
are an estimated 9,000 plant species, out of which 3,500 (i.e. 39
per cent) are endemic. In the Indian portion, there occurs some
5,800 plant species, roughly 2,000 (i.e. 36 per cent) of which are
endemic. At least 55 flowering plants endemic to this area are
recognised as rare, for example, the Pitcher Plant (Nepenthes
khasiana).
The area has long been recognised as a rich centre of primitive
flowering plants and is popularly known as the 'Çradle of
Speciation'. Species of several families of monocotyledons,
Orchidaceae, Zingiberaceae and Arecaceae are found in the area.
Gymnorperms and Pteridophytes (ferns) are also well
represented here.
The area is also rich in wild relatives of plants of economic
significance e.g. rice, banana, citrus, ginger, chilli, jute and
sugarcane. It is also regarded as the centre of origin and
diversification of five palms of commercial importance, namely-
coconut, arecanut, palmyra palm, sugar palm and wild date palm.
Tea (Thea sinensis) has been cultivated in this region for the last
4,000 years. Many wild and allied species of tea, the leaves of
which are used as a substitute for tea, are found in the North East,
in their natural habitats.
HOT SPOTS IN INDIA
Buffalo (Bubalus bubalis) in a small area at the junction of
Orissa, Madhya Pradesh and Maharashtra and the hard ground
Swamp Deer (Cervus duvauceli), now restricted to a single
locality in Madhya Pradesh.
Gangetic Plain, constituting 10.8 per cent of the total
geographical area, is a flat alluvial region lying to the North and
South of the Ganga River and its major tributaries and in the
foothills of the Himalayas. The Gangetic plain is topographically
homogenous for hundreds of kilometers. The characterstic fauna
of this region include Rhino (Rhinoceros unicornis), Elephant
(Elephas maximus), Buffalo (Bubalus bubalis), Swamp Deer
(Cervus duvauceli), Hog-Deer (Axis porcinus) and Hispid Hare
(Carprolagus bispidus). This zone gains considerable ecological
significance in the context of increasing industrialization and
pollution and the consequent environmental degradation and
deforestation.
North-East Region, constituting 5.2 per cent of the total
geographical area, represents the transition zone between the
Indian, Indo-Malayan and Indo-Chinese bio-geographical
regions as well as being a meeting point of the Himalayan
mountains and peninsular India. The North-East is thus the bio-
geographical 'gateway' for much of India's fauna and flora and
also a biodiversity hotspot. A diverse set of habitats coupled with
long term geological stability has allowed the development of
significant levels of endemism in all animal and plant groups.
Many of the species contributing to this biological diversity are
either restricted to the region itself, or to the smaller localized
areas of the Khasi Hills.
The country's extensive Coasts, constituting 2.5 per cent of the
total geographical area with sandy beaches, mangroves, mud
Nepenthes Khasiana - commonly known as Pitcher Plant
The Taxol plant (Taxus wallichiana) is sparsely distributed in the
region and is listed under the red data category due to its over-
exploitation for extraction of a drug effectively used against
cancer.
As regards faunal diversity, 63 per cent of the genera of land
mammals in India are found in this region. During the last four
decades, two new mammals have been discovered from the
region - Golden Langur from Assam-Bhutan region, and
Namdapha Flying Squirrel from Arunachal Pradesh, indicating
the species richness of the region. The region is also a rich centre
of avian diversity - more than 60 per cent of the bird species
found in India have been recorded in the North East. The region
also hosts two endemic genera of lizards, and 35 endemic
reptilian species, including two turtles. Of the 240 Indian
amphibian species, at least 68 species are known to occur in the
North East, 20 of which are endemic.
From Namdapha National Park itself, a new genus of mammal, a
new subspecies of a bird, six new amphibians species, four new
species of fish, at least 15 new species of beetles and six new
species of flies have been discovered.
Western Ghats
The Western Ghats region is considered to be one of the most
important bio-geographic zones of India, as it is one of the richest
centres of endemism. Due to varied topography and micro-
climatic regimes, some areas within the region are considered to
be active zones of speciation. The region has 490 arborescent
taxa, of which as many as 308 are endemic.
About 1,500 endemic species of dicotyledonous plants are
reported from the Western Ghats. 245 species of orchids
belonging to 75 genera are found here, of which 112 species in ten
genera are endemic to the region.
As regards the fauna, as many as 315 species of vertebrates
belonging to 22 genera are endemic, including 12 species of
mammals, 13 species of birds, 89 species of reptiles, 87 species of
amphibians and 104 species of fish.
The extent of endemism is high amongst amphibian and reptile
species. There occur 117 species of amphibians in the region, of
which 89 species (76 per cent) are endemic. Of the 165 species of
reptiles found in Western Ghats, 88 species are endemic.
Many of the endemic and other species are listed as threatened.
Nearly 235 species of endemic flowering plants are considered
endangered. Rare fauna of the region include - Lion Tailed
Macaque, Nilgiri Langur, Nilgiri Tahr, Flying Squirrel, and
Malabar Gray Hornbill.
Wetlands
Wetlands in India are distributed in different geographical
regions, ranging from the Himalaya to the Deccan plateau. The
BIOMES
Bengal Tiger

State & Trends of the Environment-Biodiversity55
State Of Environment Report-2009 54
variability in climatic conditions and topography is responsible
for significant diversity. Based on their origin, vegetation,
nutrient status and thermal characteristics, they are classified
into following different types:
§Glaciatic Wetlands (e.g., Tsomoriri in Jammu and Kashmir,
Chandertal in Himachal Pradesh)
§Tectonic Wetlands (e.g., Nilnag in Jammu and Kashmir,
Khajjiar in Himachal Pradesh, and Nainital and Bhimtal in
Uttaranchal)
§Oxbow Wetlands (e.g., Dal Lake, Wular Lake in Jammu and
Kashmir and Loktak Lake in Manipur and some of the
wetlands in the river plains of Brahmaputra and Indo-
Gangetic region. Deepor Beel in Assam, Kabar in Bihar,
Surahtal in Uttar Pradesh)
§Lagoons (e.g., Chilika in Orissa)
§Crater Wetlands (Lonar lake in Maharashtra)
§Salt Water Wetlands (e.g., Pangong Tso in Jammu and
Kashmir and Sambhar in Rajasthan)
§Urban Wetlands (e.g., Dal Lake in Jammu and Kashmir,
Nainital in Uttaranchal and Bhoj in Madhya Pradesh)
§Ponds/Tanks, Man-made Wetlands (e.g., Harike in Punjab
and Pong Dam in Himachal Pradesh)
§Reservoirs (e.g., Idukki, Hirakud dam, Bhakra-Nangal
dam)
§Mangroves (e.g., Bhitarkanika in Orissa)
§Coral reefs (e.g., Lakshadweep)
§Others - Creeks (Thane Creek in Maharashtra), seagrasses,
estuaries, thermal springs are some other types of wetlands in
the country.
Sl. No. State/UT Name of Ramsar Site Area (ha.) Date of Declaration
1 Andhra Pradesh Kolleru Lake 90100 19/08/02
2 Assam Deepor Beel 4000 19/08/02
3 Himachal Pradesh Pong Dam LakeRenuka WetlandChandertal Wetland
156622049
19/08/0208/11/0508/11/05
4 Jammu & Kashmir Wular LakeTsomoririHokera WetlandSurinsar-Mansar Lakes
18900120001375350
23/03/9019/08/0208/11/0508/11/05
5 Kerala Ashtamudi WetlandSasthamkotta LakeVembanad-Kol Wetland
61400373151250
19/08/0219/08/0219/08/02
6 Madhya Pradesh Bhoj Wetland 3201 19/08/02
7 Manipur Loktak Lake 26600 23/03/90
8 Orissa Chilika LakeBhitarkanika Mangroves
11650065000
01/10/8119/08/02
9 Punjab Harike LakeKanjiliRopar
41001831365
23/03/9022/01/0222/01/02
10 Rajasthan Sambhar LakeKeoladeo National Park
240002873
23/03/9001/10/83
11 Tamil Nadu Point Calimere Wildlife andBird Sanctuary
38500 19/08/02
12 Tripura Rudrasagar Lake 240 08/11/05
13 Uttar Pradesh Upper Ganga River(Brijghat to Narora Stretch)
26590 08/11/05
14 West Bengal East Kolkata Wetlands 12500 19/08/02
Total sites 25 677131
Source: National Biodiversity Action Plan, 2008, MoEF
Table 2.4.1: State-wise List of Wetlands of International Importance in India under Ramsar Convention There are in all 104 identified wetlands under the National
Wetland Conservation & Management Programme (NWCMP).
Ramsar Convention
India is a signatory to the Ramsar Convention and plays an
important role in conservation and wise use of wetlands. On the
basis of the country's initiatives in the field of wetland
conservation, India was nominated as a member of the Standing
Committee from 1993-1996 and from 1999-2002. So far, 25 sites
from India have been identified as Ramsar sites of international
importance and six new sites are under process of designation
(Table 2.4.1).
Forests
As per the latest report of the Forest Survey of India (2005),
forests cover 23.6 per cent of India's total geographic area, which
includes 3.04 per cent of the tree cover. Area under grasslands is
about 3.9 per cent and deserts cover about 2 per cent. It is
estimated that India has about 4.1 million hectares of wetlands
(excluding paddy fields and mangroves).
Between 1990 and 2000, India gained an average of 3,61,500
hectares of forest per year. This amounts to an average annual
reforestation rate of 0.57 per cent. Between 2000 and 2005, this
rate of decreased by 92.3 per cent to 0.04 per cent per annum. In
total, between 1990 and 2005, India gained 5.9 per cent in forest
cover, or around 3.762 Mha. Measuring the total rate of habitat
conversion (defined as change in forest area plus change in
woodland area minus net plantation expansion) for the 1990-
2005 interval, India gained one per cent in forest and woodland
habitat.
India possesses a distinct identity, not only because of its
geography, history and culture but also because of the great
diversity of its natural ecosystems. The panorama of Indian
forests ranges from evergreen tropical rain forests in the
Andaman and Nicobar Islands, the Western Ghats, and the North-
Eastern States, to dry alpine scrub high in the Himalayas to the
north. Between the two extremes, the country has semi-evergreen
rain forests, deciduous monsoon forests, thorn forests,
subtropical pine forests in the lower mountain zone and
temperate mountain forests (Lal, 1989).
The main areas of tropical forest are found in the Andaman and
Nicobar Islands, the Western Ghats which fringe the Arabian Sea
coastline of peninsular India and the greater Assam region in the
North-East. Small remnants of rain forest are found in Orissa
state. Semi-evergreen rain forest is more extensive than the
evergreen formation, partly because evergreen forests tend to
degrade to semi-evergreen with human interference.
The tropical vegetation of North-East India (which includes the
states of Assam, Nagaland, Manipur, Mizoram, Tripura and
Sesamum orientale
Scrub
Source: State of Forest Report 2005, Forest Survey of India
Figure 2.4.2: Forest Cover in India
1.66%10.12%8.82%
1.17%
78.23%
Very Dense Forest
Moderately Dense Forest
OpenForest
Non -Forest

Egretta Gularis - a Western reef egret
State & Trends of the Environment-Biodiversity57
State Of Environment Report-2009 56
Meghalaya as well as the plain regions of Arunachal Pradesh)
typically occurs at elevations up to 900 m. It embraces evergreen
and semi-evergreen rain forests, moist deciduous monsoon
forests, riparian forests, swamps and grasslands. Evergreen rain
forests are found in the Assam Valley, the foothills of the eastern
Himalaya and the lower parts of the Naga Hills, Meghalaya,
Mizoram and Manipur where the annual rainfall exceeds 2,300
mm. In the Assam Valley, the giant Dipterocarpus macrocarpus
and Shorea assamica occur singly, occasionally attaining a girth
of up to 7 m and a height of up to 50 m. The monsoon forests are
mainly moist Sal (Shorea robusta) forests, which occur widely in
this region . The Andaman and Nicobar islands have tropical
evergreen rain forests and tropical semi-evergreen rainforests as
well as tropical monsoon forests. The tropical evergreen rain
forests are only slightly less grand in stature and rich in species
than on the mainland. The dominant species is Dipterocarpus
grandiflorus in hilly areas, while Dipterocarpus kerrii is
A Mangrove Corridor in Andaman & Nicobar Islands
dominant on some islands in the southern parts of the
archipelago. The monsoon forests of the Andamans are
dominated by Pterocarpus dalbergioides and Terminalia spp.
Marine Environment
The near shore coastal waters of India are extremely rich fishing
areas. The total commercial marine catch for India has stabilized
over the last ten years at between 1.4 and 1.6 million tonnes, with
fishes from the clupeoid group, e.g. Sardines (Sardinella sp.),
Indian Shad (Hilsa sp.) and Whitebait (Stolephorus sp.)
accounting for approximately 30 per cent of all landings. 2The Indian reef area is estimated to be 2,375 km . Coral reefs
occur along only a few sections of the mainland, principally the
Gulf of Kutch, off the southern mainland coast, and around a
number of islands opposite Sri Lanka. This general absence is
largely due to the presence of major river systems and the
sedimentary regime on the continental shelf. Elsewhere, corals
are also found in Andaman & Nicobar and Lakshadweep island
groups, although their diversity is reported to be lower than in
South-East India.
Indian coral reefs have a wide range of resources which are of
commercial value. Exploitation of corals, coral debris and coral
sands is widespread in the Gulf of Mannar and Gulf of Kutch
reefs, while ornamental shells, chanks and pearl oysters are the
basis of an important reef industry in the south of India. Sea fans
and seaweeds are exported for decorative purposes, and there is a
spiny lobster fishing industry along the South-East coast,
notably at Tuticorin, Madras and Mandapam. Commercial
exploitation of aquarium fishes from Indian coral reefs has
gained importance only recently and as yet no organized effort
has been made to exploit these resources. Reef fisheries are
generally at the subsistence level and yields are not recorded.
Other notable marine area includes seagrass beds which,
although not directly exploited, are valuable as habitats for
commercially harvested species, particularly prawns, and
mangrove stands. In the Gulf of Mannar, the green tiger prawn
Penaeus semisulcatus is extensively harvested for the export
market. Seagrass beds are also important feeding areas for the
Dugong (Dugong dugon) and several species of marine turtle.
Five species of marine turtle occur in Indian waters - Green turtle
(Chelonia mydas), Loggerhead (Caretta caretta), Olive Ridley
(Lepidochelys olivacea), Hawksbill (Eretmochelys imbricata)
and Leatherback (Dermochelys coriacea). Most of the marine
turtle populations found in the Indian region are in decline. The
principal reason for the decrease in numbers is deliberate human
predation. Turtles are netted and speared along the entire Indian
coast. In South-East India, the annual catch is estimated at 4,000-
5,000 animals, with C. mydas accounting for about 70 per cent of
the harvest. C. caretta and L. olivacea are the most widely
consumed species (Salm, 1981). E. imbricata is occasionally
eaten but it has caused deaths and so is usually caught for its shell
alone. D. coriacea is boiled for its oil, which is used for caulking
boats and as a protection from marine borers. Incidental netting
is widespread.
Mangroves
Mangroves are salt-tolerant forest ecosystems found mainly in
tropical and sub-tropical inter-tidal regions of the world. They
comprise of trees or shrubs that have the common trait of
growing in shallow and muddy salt water or brackish waters,
especially along quiet shorelines and in estuaries. They exhibit a
remarkable capacity for saltwater tolerance. Mangrove forests
are one of the most productive and biodiverse wetlands on earth.
Yet, these unique coastal tropical forests are among the most
threatened habitats in the world.
Status of Mangroves in India
Mangroves in India account for about five per cent of the world's
mangrove vegetation and are spread over an area of about 4,500 2km along the coastal States/UTs of the country. Sunderbans in
West Bengal accounts for a little less than half of the total area
under mangroves in India. The Forest Survey of India has been
assessing the vegetation cover of the country, including
mangroves using remote sensing since 1983. It published its first
assessment of mangroves of India in 1987 and estimated it to be
4,046 km². Thereafter, mangroves have been assessed regularly
on a two-year cycle. West Bengal has the maximum mangrove
cover in the country, followed by Gujarat and Andaman &
Nicobar Islands.
Mangroves mapping was done in 2005, utilizing their unique
reflectance characteristics. In the assessment, mangrove cover
has also been categorized into very dense mangrove (canopy
density of more than 70 per cent), moderately dense mangrove
(canopy density between 40-70 per cent) and open mangrove
(canopy density between 10-40 per cent). The current assessment 2shows that the mangrove cover in the country is 4,445 km , which
is 0.14 per cent of the country's total geographic area. The very 2dense mangrove comprises 1,147 km (25.8 per cent of mangrove
2cover), moderately dense mangrove is 1,629 km (36.6 per cent)
Small Green Bee-eater Merops orientalis

State & Trends of the Environment-Biodiversity59
State Of Environment Report-2009 58
2while open mangrove covers an area of l, 669 km (37.6 per cent)
(Figures 2.4.3 & 2.4.4).
Compared with 2003 assessment, there has been a marginal
decrease in the mangrove cover of the country mainly because of
the Tsunami that hit Andaman & Nicobar Islands on 26
December, 2004. Gujarat has shown an increase in mangrove
cover mainly owing to plantations and adoption of protection
measures.
Medicinal and Aromatic Plants
Medicinal and aromatic plants have been used in the country for
a long time for their medicinal properties. About 2,000 native
plant species have curative properties and 1,300 species are
known for their aroma and flavour. For the Indian systems of
medicine, popularly known as Ayurveda, Unani and Siddha,
herbal drugs are in great demand in the country. There is already
a spurt in demand for plant-based drugs and lately, many such
species of medicinal values are being brought under systematic
cultivation. India has been considered a treasure house of
valuable medicinal and aromatic plant species.
The Ministry of Environment and Forests, Government of India
has identified and documented over 9,500 plant species
considering their importance in the pharmaceutical industry. Out
of these, about 65 species have large and consistent demand in
world trade. India, however, produces only limited quantities of
these. In terms of market share in production value, India holds
only the sixth place with a mere 7 per cent share. On the contrary,
we still import about ten types of essential oils to the tune of
8,000 tonnes per annum. Indian exports are thus guided by what
may be termed as a trader's vision rather than by a knowledge-
products vision.
Sacred groves
India has over 19,000 sacred groves. Sacred groves are
initiatives of communities for conserving biodiversity based on
their religious beliefs but of late, these are being degraded or
Source: State of Forest Report, 2005, Forest Survey of India
Figure 2.4.3: Type of Mangrove Cover in India
Very Dense Mangrove
Moderately Dense
Mangrove
Open Mangrove
Total0
500
1000
1500
2000
2500
3000
3500
4000
4500
5000
2M
angr
ove
Cov
er(k
m)
Source: State of Forest Report, 2005, Forest Survey of India
Figure 2.4.4: Total Mangrove Cover in India
2M
angr
ove
cove
r (k
m)
0
1000
2000
3000
4000
5000
6000
1987 1989 1991 1993 1995 1997 1999 2001 2003
Assessment Year
Box 2.4.1 : Bishnois – Committed to Conservation
The Bishnoi tribe of Western Rajasthan has, over the centuries, protected the trees and wild animals in and around their villages.
Bishnois do not cut trees for fuel and timber; they remove only the dead trunks and twigs. Spotted deer, black buck and blue bulls
can be seen foraging fearlessly in their fields. Even if the crop is consumed by herds of deer, the Bishnois do not chase away the
animals.
In 1730 A.D., Maharaja Abhaya Singh of Jodhpur ordered cutting of trees in large numbers to provide timber for building a
fortress. He sent soldiers to Bishnoi villages to cut down Khejari trees growing in the area. When soldiers applied the axe, the
Bishnoi villagers pleaded to spare the trees. When the soldiers did not relent, they hugged the trees and as many as 363 of them
laid down their lives to save the trees. The Bishnois worship nature in all its manifestations, conserve trees and medicinal plants,
provide food and water to animals, and are vegetarians in their diet.
converted to plantations. Since there are several medicinal plants
and wild relatives of crop plants occurring naturally in these
areas, the sacred groves need to be conserved. Traditional norms
and practices for conservation of neighbourhood forests and
common land are also diminishing, although certain rural and
tribal communities continue to safeguard their biological
resource base even at the cost of their livelihood and sustenance.
PRESSURES
Threats to Biodiversity
Traditional and substantial dependence on biodiversity resources
for fodder, fuel wood, timber and minor forest produce has been
an accepted way of life for the rural population that accounts for
nearly 74 per cent of India's population. With radical
demographic changes, the land to man ratio and forest to man
ratio has rapidly declined. The lifestyles and the biomass
resource needs having remained unchanged, the remnant forests
have come under relentless pressure of encroachment for
cultivation, and unsustainable resource extraction rendering the
very resource base unproductive and depleted of its biodiversity.
Coupled with these incongruities and aberrations in land use, the
unsound development strategies have led to increasing threats to
biodiversity resources by way of illegal encroachment of 0.07
Mha. of forest, cultivation of 4.37 Mha. and diversion of forest
for river valley projects (0.52 Mha.), industries and townships
(0.14 Mha.), transmission lines and roads (0.06 Mha.) and an
additional 1.5 Mha. for miscellaneous purposes (TERI, 1999).
The unabated pace of development of infrastructure to harness
hydropower, driven by necessity to meet the growing
requirements of water for inputs to irrigation, domestic use and
industrial purposes, has led to the construction of over 4,000
dams across India. The creation of valley bottom reservoirs in
wilderness areas has brought on the destruction of some of the
finest forests and biodiversity-rich unique ecosystems.
Deforestation due to hydropower and mining projects are
perhaps the greatest threats to biodiversity in India.
Human activities are directly and indirectly responsible for
current high rates of biodiversity loss. Some of the major issues
are:
§Habitat loss, fragmentation and degradation result due to
agricultural activities, extraction (including mining, fishing,
logging and harvesting) and development (human
settlements, industry and associated infrastructure). Habitat
loss and fragmentation leads to the formation of isolated,
small, scattered populations. These small populations are
increasingly vulnerable to inbreeding depression, high Heracleum wallichii-Alpine Medicinal Plant
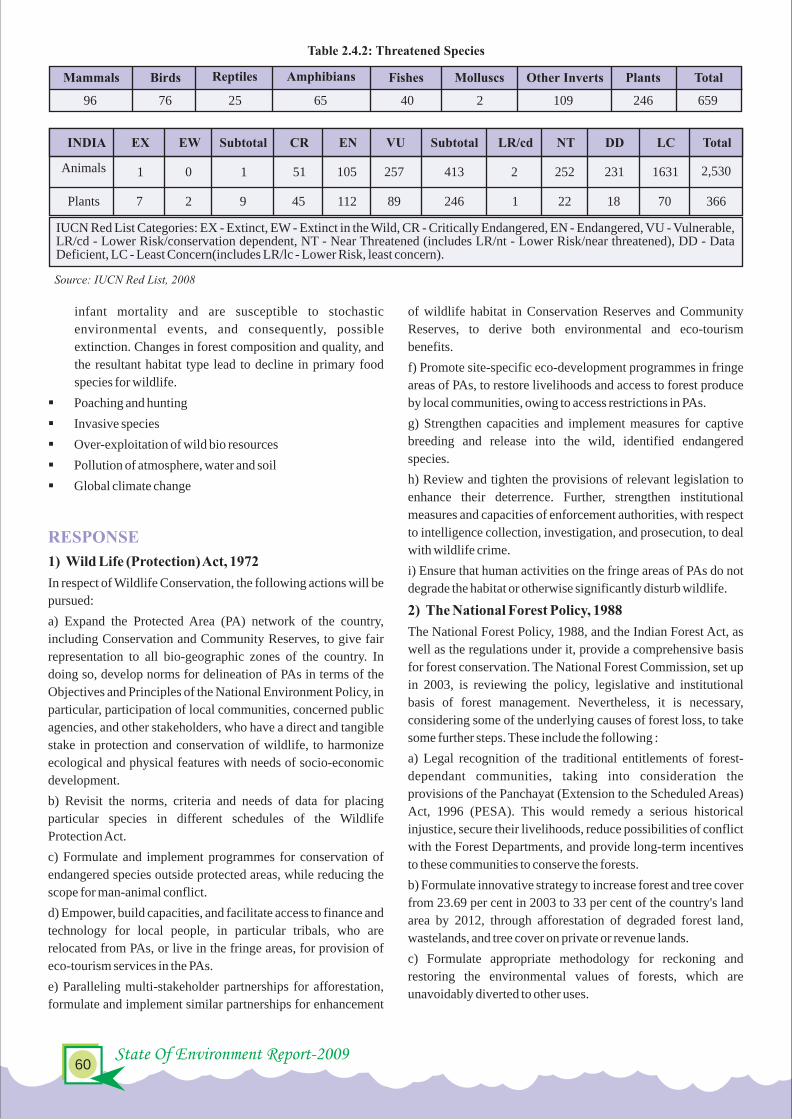
State & Trends of the Environment-Biodiversity61
State Of Environment Report-2009 60
infant mortality and are susceptible to stochastic
environmental events, and consequently, possible
extinction. Changes in forest composition and quality, and
the resultant habitat type lead to decline in primary food
species for wildlife.
§Poaching and hunting
§Invasive species
§Over-exploitation of wild bio resources
§Pollution of atmosphere, water and soil
§Global climate change
1) Wild Life (Protection) Act, 1972
In respect of Wildlife Conservation, the following actions will be
pursued:
a) Expand the Protected Area (PA) network of the country,
including Conservation and Community Reserves, to give fair
representation to all bio-geographic zones of the country. In
doing so, develop norms for delineation of PAs in terms of the
Objectives and Principles of the National Environment Policy, in
particular, participation of local communities, concerned public
agencies, and other stakeholders, who have a direct and tangible
stake in protection and conservation of wildlife, to harmonize
ecological and physical features with needs of socio-economic
development.
b) Revisit the norms, criteria and needs of data for placing
particular species in different schedules of the Wildlife
Protection Act.
c) Formulate and implement programmes for conservation of
endangered species outside protected areas, while reducing the
scope for man-animal conflict.
d) Empower, build capacities, and facilitate access to finance and
technology for local people, in particular tribals, who are
relocated from PAs, or live in the fringe areas, for provision of
eco-tourism services in the PAs.
e) Paralleling multi-stakeholder partnerships for afforestation,
formulate and implement similar partnerships for enhancement
RESPONSE
of wildlife habitat in Conservation Reserves and Community
Reserves, to derive both environmental and eco-tourism
benefits.
f) Promote site-specific eco-development programmes in fringe
areas of PAs, to restore livelihoods and access to forest produce
by local communities, owing to access restrictions in PAs.
g) Strengthen capacities and implement measures for captive
breeding and release into the wild, identified endangered
species.
h) Review and tighten the provisions of relevant legislation to
enhance their deterrence. Further, strengthen institutional
measures and capacities of enforcement authorities, with respect
to intelligence collection, investigation, and prosecution, to deal
with wildlife crime.
i) Ensure that human activities on the fringe areas of PAs do not
degrade the habitat or otherwise significantly disturb wildlife.
2) The National Forest Policy, 1988
The National Forest Policy, 1988, and the Indian Forest Act, as
well as the regulations under it, provide a comprehensive basis
for forest conservation. The National Forest Commission, set up
in 2003, is reviewing the policy, legislative and institutional
basis of forest management. Nevertheless, it is necessary,
considering some of the underlying causes of forest loss, to take
some further steps. These include the following :
a) Legal recognition of the traditional entitlements of forest-
dependant communities, taking into consideration the
provisions of the Panchayat (Extension to the Scheduled Areas)
Act, 1996 (PESA). This would remedy a serious historical
injustice, secure their livelihoods, reduce possibilities of conflict
with the Forest Departments, and provide long-term incentives
to these communities to conserve the forests.
b) Formulate innovative strategy to increase forest and tree cover
from 23.69 per cent in 2003 to 33 per cent of the country's land
area by 2012, through afforestation of degraded forest land,
wastelands, and tree cover on private or revenue lands.
c) Formulate appropriate methodology for reckoning and
restoring the environmental values of forests, which are
unavoidably diverted to other uses.
Table 2.4.2: Threatened Species
Source: IUCN Red List, 2008
IUCN Red List Categories: EX - Extinct, EW - Extinct in the Wild, CR - Critically Endangered, EN - Endangered, VU - Vulnerable, LR/cd - Lower Risk/conservation dependent, NT - Near Threatened (includes LR/nt - Lower Risk/near threatened), DD - Data Deficient, LC - Least Concern(includes LR/lc - Lower Risk, least concern).
Mammals Birds Reptiles Amphibians Fishes Molluscs Other Inverts Plants Total
96 76 25 65 40 2 109 246 659
INDIA EX EW Subtotal CR EN VU Subtotal LR/cd NT DD LC Total
Animals 1 0 1 51 105 257 413 2 252 231 1631 2,530
Plants 7 2 9 45 112 89 246 1 22 18 70 366
Our National Bird Peacock
d) Formulate and implement a ‘Code of Best Management
Practices’ for dense natural forests, to realize the objectives and
principles of National Environment Policy. Forests of high
indigenous genetic diversity should be treated as entities with
incomparable value.
e) Denotify Bamboo and similar other species as 'Forest Species'
under the Forest Conservation Act, to facilitate their cultivation
outside notified forests, and encourage their productive
utilization in economic activities.
f) Promote plantation of only such species as are conducive to the
conservation and sustainability of given ecosystems.
g) It is essential that women play a greater role in the
management of natural resources. While they have to bear the
burden of natural resource degradation, they have little control
over the management of these resources. Relevant provisions of
the National Policy for the Empowerment of Women provide a
framework for incorporating elements of proposed actions.
3) Biological Diversity Act, 2002
To regulate access to genetic resources and associated sharing
arrangements, apart from developing policies and programmes
on long term conservation and protection of biological resources
and associated knowledge, the Biological Diversity Act, 2002
was promulgated. The National Biodiversity Authority (NBA) st set up at Chennai on 1 October 2003 as per the provisions of the
Biological Diversity Act, 2002 is mandated to facilitate
implementation of the Act.
4) National Biodiversity Action Plan (NBAP)
The Union Ministry of Environment and Forests (MoEF), the
nodal agency for implementing the provisions of Convention on
Biological Diversity (CBD) in India, developed a strategy for
biodiversity conservation at macro-level in 1999 and enacted the
Biological Diversity Act in 2002, followed by the Rules
thereunder in 2004. There is a need now to develop and
implement a suitable national action plan for promoting
biodiversity conservation, sustainable use of its components and
equitable sharing of benefits arising from such use. The National
Environment Policy, 2006, seeks to achieve balance and
harmony between conservation of natural resources and
development processes and also forms the basic framework for
the National Biodiversity Action Plan.
The objectives of the NBAP are founded in the backdrop of the
cardinal principles already set out in the NEP 2006. The most
important of these principles is that human beings are at the
centre of sustainable development concerns. The other relevant
principles on which the objectives are premised include the right
to development, precautionary approach, economic efficiency,
entities with 'incomparable value’, equity, public trust doctrine,
decentralization, integration, preventive actions, and
environmental offsetting.
The objectives are broad-based and relate to current perceptions
of key threats and constraints to biodiversity conservation and
are as follows.
i. Strengthening and integration of in situ, on-farm and ex situ
conservation
ii. Augmentation of natural resource base and its sustainable
utilization; Ensuring inter and intra-generational equity

State & Trends of the Environment-Biodiversity63
State Of Environment Report-2009 62
iii. Regulation of introduction of invasive alien species and
their management
iv. Assessment of vulnerability, and adaptation to climate
change and desertification
v. Integration of biodiversity concerns in economic and social
development
vi. To prevent, minimize and abate impacts of pollution
vii. Development and integration of biodiversity databases
viii. Strengthening implementation of policy, legislative and
administrative measures for biodiversity conservation and
management
ix. Building of national capacities for biodiversity
conservation and appropriate use of new technologies
x. Valuation of goods and services provided by biodiversity
and use of economic instruments in the decision-making
processes
xi. International cooperation to consolidate and strengthen
bilateral, regional and multilateral cooperation on issues
related to biodiversity.
5) Forest Certification
Forest certification has emerged as one of the market
mechanisms to address environmental concerns of the green
consumers on one hand and help promote sustainable forest
management on the other. Forest certification also contributes to
the promotion of economically viable, environmentally
appropriate and socially beneficial management of forests as
defined by the Helsinki criteria. Forest certification was
launched over a decade ago to help protect forests from
destructive logging practices. Like the 'organically grown' label
on produce, forest certification was intended as a seal of
approval, a means of notifying consumers that a wood or paper
product comes from forests managed in accordance with strict
environmental and social standards.
At present, most of the certified forests are in the developed
countries. Globally, as of July 2005, the total area of certified
forests was estimated at about 245 Mha.
The process of certification in tropical timber producing
countries like India has been slow on account of several reasons
Rhino in Kaziranga National Park
including inflexibility of international certification standards
like FSC (Forest Stewardship Council) and PEFC (Pan European
Forest Certification Council), lack of recognition of broader
local land-use issues, wide-range of NTFPs (Non-Timber Forest
Products) conflicts, incompatibility between legal settings and
certification standards and high costs of certification. There are
only two FSC certificates existing in India as on date.
It is also important to note that there seems to be no domestic
market for forest certified products in the country till now.
However, there could be potential export markets for certain
products based on forest resources as raw material, for example,
wood/natural fibre based handicraft products.
As a first step in the direction for initiating forest certification
processes in the country, a National Working Group has been set
up involving officials of the MoEF and SFDs (State Forest
Departments), industry representatives and environment based
NGOs, institutional experts and independent experts having
international expertise in forest certification.
6) Coastal Management Zone Draft Notification, 2008
Ministry of Environment and Forests issued the Coastal
Regulation Zone Notification in 1991, under which coastal
stretches were declared Coastal Regulation Zones (CRZ) and
restrictions were imposed on the setting up and expansion of
industries, operations and processes in the said Zones for its
protection. The Government had constituted an Expert
Committee under the Chairmanship of Prof. M.S. Swaminathan
to review the various issue pertaining to implementation of the
Coastal Regulation Zone Notification, 2004. The Committee
submitted its report along with its recommendations to the
Ministry in April, 2005. Based on these recommendations, the
Ministry has formulated a draft CMZ Notification. This draft has
been discussed with various stakeholders and based on the
suggestions received, the draft notification is under finalization.
7) Ex-situ Conservation
Attention has been paid to ex-situ conservation measures also as
they complement in-situ conservation measures and are even
otherwise important. There are about 70 botanical gardens,
including 33 University botanical gardens. Also, there are 275
centres of ex-situ wildlife preservation in the form of zoos, deer
parks, safari parks, aquaria etc. A Central Zoo Authority
supports, oversees, monitors and coordinates the development
and management of zoos in the country. A scheme entitled
Assistance to Botanical Gardens provides one-time assistance to
botanical gardens to institute and strengthen measures for ex-situ
conservation of cultivated plants and domesticated animals.
While zoological parks have been looked upon essentially as
centres of education and recreation, they have played an
important role in the conservation of species such as Manipur
Thamin Deer and the White-Winged Wood Duck.
The Indian National Gene Bank established by the ICAR as a part
of the National Bureau of Plant Genetic Resources, has
conserved more than 1,50,000 accessions and samples. The
capacity of this gene bank has been increased to about one
million, making it the largest gene bank of the world. It has more
than 7,100 accessions of underutilized crops.
8) In-situ conservation
Approximately, 4.83 per cent of the total geographical area of the
country has been earmarked for extensive in-situ conservation of
habitats and ecosystems through a protected area network of 99
National Parks and 523 Wildlife Sanctuaries. The results of this
network have been significant in restoring viable populations of
large mammals such as tigers, lions, rhinoceros, crocodiles and
elephants. To conserve the representative ecosystems, the
Biosphere Reserve Programme is being implemented. In all, 15
biodiversity rich areas of the country have been designated as
Biosphere Reserves. Programmes have also been launched for
scientific management and wise use of fragile ecosystems.
Specific programmes for management and conservation of
wetlands, mangroves and coral reefs systems are being
implemented. National and sub-national level committees
oversee and guide these programmes to ensure strong policy and
strategic support.
Number and Extent of Protected Areas
The network of protected areas presently covers 4.83 per cent of
the country's total land area and includes 99 national parks and
523 wildlife sanctuaries. Of these, 100 cover both terrestrial and
freshwater ecosystems and 31 are marine protected areas. There
are also 15 Biosphere Reserves and several Reserved Forests,
which are part of the most strictly protected forests outside the
protected areas.
Biodiversity and Protected Areas
India has some 2,356 known species of amphibians, birds,
mammals and reptiles according to figures from the World
Conservation Monitoring Center. Of these, 18.4 per cent are
endemic, meaning they exist in no other country, and 10.8 per
cent are threatened. India is home to at least 18,664 species of
vascular plants, of which 26.8 per cent are endemic. About 4.9 per
cent of the country’s area is protected under IUCN categories I-V.
1. Nature Reserves, Wilderness Areas, and National Parks
(categories I and II)
2. Areas Managed for Sustainable Use and Unclassified Areas
(category VI and ‘other’)
3. Natural Monuments, Species Management Areas, and
Protected Landscapes and Seascapes (categories III, IV,
and V)
Biosphere Reserves
The programme of Biosphere Reserve was initiated under the
'Man & Biosphere' (MAB) programme of UNESCO in 1971. The
purpose of the formation of the biosphere reserve is to conserve
in-situ all forms of life, along with its support systems, in their
totality, so that it could serve as a referral system for monitoring
and evaluating changes in natural ecosystems. The first biosphere
reserve of the world was established in 1979. Since then the

State & Trends of the Environment-Biodiversity65
State Of Environment Report-2009 64
Date ofEstbl.
Area2(in km )
1 Achanakamar -Amarkantak
2005 3835.51(Core 551.55 & Buffer 3283.86)
Covers parts of Anupur and Dindori districts ofMadhya Pradesh and parts of Bilaspur Districts ofChhattisgarh State
2 Agasthyamalai 12.11.2001 1828 Neyyar, Peppara and Shendurney Wildlife Sanctuaries and their adjoining areas in Kerala
3 Dehang-Dibang 02.09.98 5111.5(Core 4094.80 & Buffer 1016.70)
Part of Siang and Dibang Valley in Arunachal Pradesh
4 Dibru-Saikhowa 28.07.97 765(Core 340 & Buffer 425)
Part of Dibrugarh and Tinsukia Districts (Assam)
5 Great Nicobar 06.01.89 885(Core 705 & Buffer 180)
Southern most islands of Andaman and Nicobar(Andaman and Nicobar Islands)
6 Gulf of Mannar 18.02.89 Indian part of Gulf of Mannar between India andSri Lanka (Tamil Nadu)
7 Khangchendzonga 07.02.2000 2619.92(Core 1819.34 & Buffer 835.92)
Parts of Khangchendzonga Hills and Sikkim
8 Manas 14.03.89 2837(Core 391 & Buffer 2446)
Part of Kokrajhar, Bongaigaon, Barpeta, Nalbari,Kamprup and Darang Districts (Assam)
9 Nanda Devi 18.01.88 5860.69(Core 712.12, Buffer 5,148.570
& Transition 546.34)
Part of Chamoli, Pithoragarh, and Bageshwar Districts (Uttarakhand)
10 Nilgiri 01.09.86 5520(Core 1240 & Buffer 4280)
Part of Wayanad, Nagarhole, Bandipur andMadumalai, Nilambur, Silent Valley and SiruvaniHills (Tamil Nadu, Kerala and Karnataka)
11 Nokrek 01.09.88 820(Core 47.8 & Buffer 227.92
Transition Zone 544.60)
Part of Garo Hills (Meghalaya)
12 Pachmarhi 03.03.99 4926 Parts of Betul, Hoshangabad and ChindwaraDistricts of Madhya Pradesh
13 Simlipal 21.06.94 4374(Core 845, Buffer 2129 &
Transition 1400)
Part of Mayurbhanj District (Orissa)
14 Sunderbans 29.03.89 9630(Core 1700 & Buffer 7900)
Part of delta of Ganga and Brahamaputra riversystem (West Bengal)
Source: National Biodiversity Action Plan, 2008, MoEF
Table 2.4.3: Number of Biosphere Reserves set up in India
Sl. No.
Name Location
10,500 Total Gulf Area2(Area of Island 5.55 km )
15 Kachch 29.01.08 12454 Parts of Kachch, Rajkot, Surendranagar andPatan district of Gujarat
Source: Wildlife Institute of India, 2007
Table 2.4.4: List of Tiger Reserves in India
State Tiger Reserve Year of Establishment2Total Area (km )
1. Kaziranga 2006 859
2. Manas 1973-74 2840
3. Nameri 1999-2000 344
4. Namdapha 1982-83 1985
5. Pakhui 1999-2000 862
Andhra Pradesh 6. Nagarjunsagar- Srisailam 1982-83 3568
Bihar 7. Valmiki 1989-90 840
Chhattisgarh 8. Indravati 1982-83 2799
Jharkhand 9. Palamau 1973-74 1026
10. Bandipur Nagarhole
(extension)
1973-74
1999-2000
866
643
11. Bhadra 1998-99 492
Kerala 12. Periyar 1978-79 777
13. Bandhavgarh 1993-94 1162
14. Bori-Satpura 1999-2000 1486
15. Kanha 1973-74 1945
16. Panna 1994-95 542
17. Pench 1992-93 758
18. Melghat 1973-74 1677
19. Pench
20. Tadoba-Andheri
1992-93
1993-94
257
620
Mizoram 21. Dampa 1994-95 500
Orissa 22. Simlipal 1973-74 2750
Rajasthan 23. Ranthambhore 1973-74 1334
24. Sariska 1978-79 866
Tamil Nadu 25. Kalakad-Mundathurai 1988-89 800
26. Dudhwa
Katernighat (Extension)
1987-88
1999-2000
811
551
Uttaranchal 27. Corbett 1973-74 1316
28. Buxa 1982-83 759
29. Sunderbans 1973-74 2585
Madhya Pradesh
Maharashtra
Uttar Pradesh
West Bengal
Assam
Arunachal Pradesh
Karnataka
38,620Total Area
network of biosphere reserves has increased to 531 in 105
countries across the world (MAB, 2008). Presently, there are 15
existing biosphere reserves in India ( Table 2.4.3).
Project Tiger
As per the recommendations of a special task-force of the Indian
Board of Wildlife, Project Tiger was launched in 1973 with the
following objectives:
§To ensure maintenance of the available population of tigers
in India for scientific, economic, aesthetic, cultural and
ecological value.
§To preserve, for all times, the areas of such biological
importance as a national heritage for the benefit, education
and enjoyment of the people.
Starting with nine reserves in 1973-74, the number has grown to 229 in 2006 (Table 2.4.4). A total area of 38,620 km
corresponding to 1.17 per cent of the total geographical area of
the country is covered by Project Tiger.
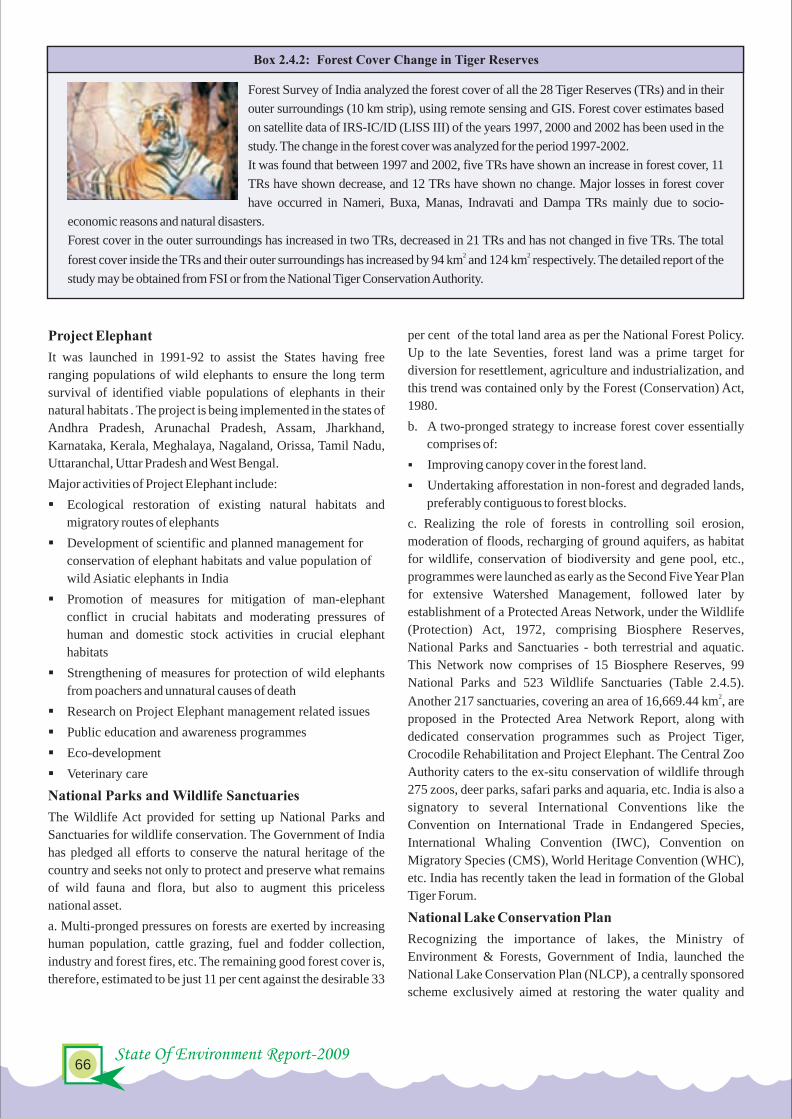
State & Trends of the Environment-Biodiversity67
State Of Environment Report-2009 66
Box 2.4.2: Forest Cover Change in Tiger Reserves
Forest Survey of India analyzed the forest cover of all the 28 Tiger Reserves (TRs) and in their
outer surroundings (10 km strip), using remote sensing and GIS. Forest cover estimates based
on satellite data of IRS-IC/ID (LISS III) of the years 1997, 2000 and 2002 has been used in the
study. The change in the forest cover was analyzed for the period 1997-2002.
It was found that between 1997 and 2002, five TRs have shown an increase in forest cover, 11
TRs have shown decrease, and 12 TRs have shown no change. Major losses in forest cover
have occurred in Nameri, Buxa, Manas, Indravati and Dampa TRs mainly due to socio-
economic reasons and natural disasters.
Forest cover in the outer surroundings has increased in two TRs, decreased in 21 TRs and has not changed in five TRs. The total 2 2forest cover inside the TRs and their outer surroundings has increased by 94 km and 124 km respectively. The detailed report of the
study may be obtained from FSI or from the National Tiger Conservation Authority.
Figure 2.4.5 : Growth of National Parks in India
Source: Wildlife Institute of India,2009
5 811
22 25
134 7
74
5
13
24
46
71
84 8895
169
0
20
40
60
80
100
120
140
160
180
Up
to 1
970
1971
-75
1976
-80
1981
-85
1986
-90
1991
-95
1996
- 20
00
2001
-09
Pro
pos
als
Tota
l No.
of
Nat
ion
al P
ark
s
Existing National Park
Cumulative Growth
Source: Wildlife Institute of India, 2009
2Geographical Area (G.A.) of India 32,87,263 km 2Forest Area of India (FSI, 2005) 667,088 km
Percentage Forest Area of Geographical Area of India 20.29 %
Current Protected Area Status
2National Parks 99 Area Covered 39,155 km 2Wildlife Sanctuaries 523 Area Covered 1,18,417 km 2Conservation Reserves 43 Area Covered 1,155.06 km 2Community Reserves 3 Area Covered 17.76 km 2Protected Areas 668 Area Covered 1,58,745 km
National Parks % of G.A. 1.19%
Wildlife Sanctuaries % of G.A. 3.60%
Conservation Reserves % of G.A. 0.04%
Protected Areas % of G.A. 4.83%
Table 2.4.5: Current Protected Areas Statistics of India (as on March 2009)
Project Elephant
It was launched in 1991-92 to assist the States having free
ranging populations of wild elephants to ensure the long term
survival of identified viable populations of elephants in their
natural habitats . The project is being implemented in the states of
Andhra Pradesh, Arunachal Pradesh, Assam, Jharkhand,
Karnataka, Kerala, Meghalaya, Nagaland, Orissa, Tamil Nadu,
Uttaranchal, Uttar Pradesh and West Bengal.
Major activities of Project Elephant include:
§Ecological restoration of existing natural habitats and
migratory routes of elephants
§Development of scientific and planned management for
conservation of elephant habitats and value population of
wild Asiatic elephants in India
§Promotion of measures for mitigation of man-elephant
conflict in crucial habitats and moderating pressures of
human and domestic stock activities in crucial elephant
habitats
§Strengthening of measures for protection of wild elephants
from poachers and unnatural causes of death
§Research on Project Elephant management related issues
§Public education and awareness programmes
§Eco-development
§Veterinary care
National Parks and Wildlife Sanctuaries
The Wildlife Act provided for setting up National Parks and
Sanctuaries for wildlife conservation. The Government of India
has pledged all efforts to conserve the natural heritage of the
country and seeks not only to protect and preserve what remains
of wild fauna and flora, but also to augment this priceless
national asset.
a. Multi-pronged pressures on forests are exerted by increasing
human population, cattle grazing, fuel and fodder collection,
industry and forest fires, etc. The remaining good forest cover is,
therefore, estimated to be just 11 per cent against the desirable 33
per cent of the total land area as per the National Forest Policy.
Up to the late Seventies, forest land was a prime target for
diversion for resettlement, agriculture and industrialization, and
this trend was contained only by the Forest (Conservation) Act,
1980.
b. A two-pronged strategy to increase forest cover essentially
comprises of:
§Improving canopy cover in the forest land.
§Undertaking afforestation in non-forest and degraded lands,
preferably contiguous to forest blocks.
c. Realizing the role of forests in controlling soil erosion,
moderation of floods, recharging of ground aquifers, as habitat
for wildlife, conservation of biodiversity and gene pool, etc.,
programmes were launched as early as the Second Five Year Plan
for extensive Watershed Management, followed later by
establishment of a Protected Areas Network, under the Wildlife
(Protection) Act, 1972, comprising Biosphere Reserves,
National Parks and Sanctuaries - both terrestrial and aquatic.
This Network now comprises of 15 Biosphere Reserves, 99
National Parks and 523 Wildlife Sanctuaries (Table 2.4.5). 2Another 217 sanctuaries, covering an area of 16,669.44 km , are
proposed in the Protected Area Network Report, along with
dedicated conservation programmes such as Project Tiger,
Crocodile Rehabilitation and Project Elephant. The Central Zoo
Authority caters to the ex-situ conservation of wildlife through
275 zoos, deer parks, safari parks and aquaria, etc. India is also a
signatory to several International Conventions like the
Convention on International Trade in Endangered Species,
International Whaling Convention (IWC), Convention on
Migratory Species (CMS), World Heritage Convention (WHC),
etc. India has recently taken the lead in formation of the Global
Tiger Forum.
National Lake Conservation Plan
Recognizing the importance of lakes, the Ministry of
Environment & Forests, Government of India, launched the
National Lake Conservation Plan (NLCP), a centrally sponsored
scheme exclusively aimed at restoring the water quality and
ecology of the lakes in different parts of the country. The scheme thwas approved by the Government of India in the IX Five Year
Plan (Feb 2002) as 100 per cent central funding to 70:30 costs-
sharing between the Centre and the concerned State
Government. The objective of the scheme is to restore and
conserve the urban and semi-urban lakes of the country, degraded
due to wastewater discharge into the lakes and other unique
freshwater ecosystems, through an integrated ecosystem
approach.

State & Trends of the Environment-Biodiversity69
State Of Environment Report-2009 68
Source: Wildlife Institute of India,2009
Figure 2.4.6 : Growth of Wildlife Sanctuaries in India
62
27
76 69
184
32 31 25
217
62 89
167
236
420452
483 508
725
0
100
200
300
400
500
600
700
800U
pto
1970
1971
-75
1976
-80
1981
-85
1986
-90
1991
-95
1996
-200
0
2001
-07
Pro
posa
ls
Tot
al N
o. o
f W
ild
life
San
ctu
arie
sExisting Wildlife Sanctuaries
Cumulative Growth
Source: Wildlife Institute of India,2009
Figure 2.4.7: Growth of Protected Areas in India
6735
89 91
209
45 35 34
291
67 102
191
282
491 536
571 605
896
0
100
200
300
400
500
600
700
800
900
1000
Tot
al N
o. o
f P
rote
cted
Are
as
Pro
posa
ls
Upt
o 19
70
1971
75
1976
-80
1981
-85
1986
-90
1991
-95
1996
-200
0
2001
-07
-
Existing Protected Areas
Cumulative Growth
Malayan Giant Squirrel
National Wetland Conservation and Management
Programme (NWCMP)
Recognizing the importance of protecting wetlands, the
Government of India operationalized a wetland conservation
programme in 1985-86 in close collaboration with the concerned
State Governments. Several steps were taken to arrest further
degradation and shrinkages of water bodies due to
encroachments, siltation, weed infestation, catchment erosion,
surface runoff carrying pesticides and fertilizers from agriculture
fields, and discharge of domestic sewage and effluents, which
resulted in deterioration of water quality, prolific weed growth,
decline in biodiversity and other associated problems.
There are a total of 104 identified wetlands under the National
Wetland Conservation & Management Programme (NWCMP).
These wetlands are eligible for financial assistance on a 100 per
cent grant basis from the concerned State Governments for
undertaking activities like survey and demarcation, weed
control, catchment area treatment, de-siltation, conservation of
biodiversity, pollution abatement, livelihood support, creation of
minor infrastructure, educational awareness, capacity building
of various stakeholders and community development. So far, 24
states have been covered.
Wetland Conservation
For wetland conservation, a holistic view is necessary, which
looks at each identified wetland in terms of its causal linkages
with other natural entities, human needs, and its own attributes.
The following actions could be considered:
a) Set up a legally enforceable regulatory mechanism for
identified valuable wetlands, to prevent their degradation and
enhance their conservation. Develop a national inventory of such
wetlands.
b) Formulate conservation and prudent use strategies for each
significant catalogued wetland, with participation from local
communities, and other relevant stakeholders.
c) Formulate and implement eco-tourism strategies for identified
wetlands through multi-stakeholder partnerships involving
public agencies, local communities, and investors.
d) Take explicit account of impact on wetlands of significant
development projects during the environmental appraisal of
such projects; in particular, the reduction in the economic value
of wetland environmental services should be explicitly factored
into the cost-benefit analyses.
e) Consider unique wetlands as entities with 'incomparable
values', in developing strategies for their protection.
f) Integrate wetland conservation, including conservation of
village ponds and tanks, into sectoral development plans for
poverty alleviation and livelihood improvement, and link efforts
for conservation and sustainable use of wetlands with the
ongoing rural infrastructure development and employment
POLICY SUGGESTIONS
generation programmes. Promote traditional techniques and
practices for conserving village ponds.
Technological processes often lead to higher withdrawals and
consumption of natural resources and higher addition of
pollutants than what ecological limits permit. These contribute to
underdevelopment through destruction of ecosystems.
The need for eco-technological solutions has been felt for
sometime and a few sporadic and scattered innovations and
efforts are being made silently in the areas of agriculture, mining
and fishing for mitigating the adverse impacts. The successful
adoption of alternative eco-technologies depend upon their
integration into the existing livelihood systems. Stakeholders
are both the experimenters and potential beneficiaries of
alternative systems. Much of the biological diversity is in the
custody of farmers who follow age-old farming and land-use
practices and thereby are excellent conservators of biodiversity.
However, due to the increasing demand for food, fodder and
other natural resources there is a need to develop eco-
technologies as they are the blend of traditional knowledge and
modern technology.
The Patents Act, 1970 addresses several aspects of the issue of
ECO - TECHNOLOGY SOLUTIONS

State & Trends of the Environment-Biodiversity69
State Of Environment Report-2009 68
Source: Wildlife Institute of India,2009
Figure 2.4.6 : Growth of Wildlife Sanctuaries in India
62
27
76 69
184
32 31 25
217
62 89
167
236
420452
483 508
725
0
100
200
300
400
500
600
700
800
Upt
o 19
70
1971
-75
1976
-80
1981
-85
1986
-90
1991
-95
1996
-200
0
2001
-07
Pro
posa
ls
Tot
al N
o. o
f W
ild
life
San
ctu
arie
s
Existing Wildlife Sanctuaries
Cumulative Growth
Source: Wildlife Institute of India,2009
Figure 2.4.7: Growth of Protected Areas in India
6735
89 91
209
45 35 34
291
67 102
191
282
491 536
571 605
896
0
100
200
300
400
500
600
700
800
900
1000
Tot
al N
o. o
f P
rote
cted
Are
as
Pro
posa
ls
Upt
o 19
70
1971
75
1976
-80
1981
-85
1986
-90
1991
-95
1996
-200
0
2001
-07
-
Existing Protected Areas
Cumulative Growth
Malayan Giant Squirrel
National Wetland Conservation and Management
Programme (NWCMP)
Recognizing the importance of protecting wetlands, the
Government of India operationalized a wetland conservation
programme in 1985-86 in close collaboration with the concerned
State Governments. Several steps were taken to arrest further
degradation and shrinkages of water bodies due to
encroachments, siltation, weed infestation, catchment erosion,
surface runoff carrying pesticides and fertilizers from agriculture
fields, and discharge of domestic sewage and effluents, which
resulted in deterioration of water quality, prolific weed growth,
decline in biodiversity and other associated problems.
There are a total of 104 identified wetlands under the National
Wetland Conservation & Management Programme (NWCMP).
These wetlands are eligible for financial assistance on a 100 per
cent grant basis from the concerned State Governments for
undertaking activities like survey and demarcation, weed
control, catchment area treatment, de-siltation, conservation of
biodiversity, pollution abatement, livelihood support, creation of
minor infrastructure, educational awareness, capacity building
of various stakeholders and community development. So far, 24
states have been covered.
Wetland Conservation
For wetland conservation, a holistic view is necessary, which
looks at each identified wetland in terms of its causal linkages
with other natural entities, human needs, and its own attributes.
The following actions could be considered:
a) Set up a legally enforceable regulatory mechanism for
identified valuable wetlands, to prevent their degradation and
enhance their conservation. Develop a national inventory of such
wetlands.
b) Formulate conservation and prudent use strategies for each
significant catalogued wetland, with participation from local
communities, and other relevant stakeholders.
c) Formulate and implement eco-tourism strategies for identified
wetlands through multi-stakeholder partnerships involving
public agencies, local communities, and investors.
d) Take explicit account of impact on wetlands of significant
development projects during the environmental appraisal of
such projects; in particular, the reduction in the economic value
of wetland environmental services should be explicitly factored
into the cost-benefit analyses.
e) Consider unique wetlands as entities with 'incomparable
values', in developing strategies for their protection.
f) Integrate wetland conservation, including conservation of
village ponds and tanks, into sectoral development plans for
poverty alleviation and livelihood improvement, and link efforts
for conservation and sustainable use of wetlands with the
ongoing rural infrastructure development and employment
POLICY SUGGESTIONS
generation programmes. Promote traditional techniques and
practices for conserving village ponds.
Technological processes often lead to higher withdrawals and
consumption of natural resources and higher addition of
pollutants than what ecological limits permit. These contribute to
underdevelopment through destruction of ecosystems.
The need for eco-technological solutions has been felt for
sometime and a few sporadic and scattered innovations and
efforts are being made silently in the areas of agriculture, mining
and fishing for mitigating the adverse impacts. The successful
adoption of alternative eco-technologies depend upon their
integration into the existing livelihood systems. Stakeholders
are both the experimenters and potential beneficiaries of
alternative systems. Much of the biological diversity is in the
custody of farmers who follow age-old farming and land-use
practices and thereby are excellent conservators of biodiversity.
However, due to the increasing demand for food, fodder and
other natural resources there is a need to develop eco-
technologies as they are the blend of traditional knowledge and
modern technology.
The Patents Act, 1970 addresses several aspects of the issue of
ECO - TECHNOLOGY SOLUTIONS

State & Trends of the Environment-Biodiversity71
State Of Environment Report-2009 70
Gujarat Wetland
Box 2.4.4: Traditional Ethos
In spite of modernization, traditional ecological ethos continue to survive in many local communities in India. Investigations into
the traditional resource use norms and associated cultural institutions prevailing in rural Bengal society (Deb and Malhotra,
2001) demonstrate that a large number of elements of local biodiversity, regardless of their use value, are protected by the local
cultural practices. Some of these may not have known the conservation effect, yet may symbolically reflect a collective
appreciation of the intrinsic or existence value of life forms, and respect for nature. Traditional conservation ethics are still
capable of protecting much of the country's decimating biodiversity, as long as the local communities have a stake in the
management of natural resources.
One example from North East India is particularly notable (Tiwari et al. 1998). The tribal communities of Meghalaya - Khasis,
Garos, and Jaintias - have a tradition of environmental conservation based on various religious beliefs. As elsewhere in India,
particular patches of forests are designated as sacred groves under customary law and are protected from any product extraction
by the community. Such forests are very rich in biological diversity and harbour many endangered plant species, including rare
herbs and medicinal plants.
Traditional water-harvesting structures too are also a habitat for a variety of species. Even if the pond size is small, as is the case
with about 60 per cent of the 1.5 million total tanks in India (Pandey, 2001), it may still be a useful habitat for many species in rural
ecosystems. Indeed, the island biogeography theory – valid in numerous cases - suggesting that larger areas support more species
did not stand in the case of the 80 ponds studied in Switzerland (Oertli et al., 2002).
disclosure. The Act mandatorily requires disclosure of source
and geographical origin of biological material used in an
invention while applying for patents. Failure to disclose or
wrongful disclosure are considered as grounds for opposition to
the grant of patent and the patent may be revoked. The Act also
requires the applicant to furnish a declaration with regard to
having obtained the necessary permission of the competent
authority to use the biological material from India. There is a
need to harmonize these provisions with the Biodiversity
Conservation Act, in particular to enable local communities,
holding the traditional knowledge for use of such biological
material, to benefit from providing access to such knowledge.
There is a need to formulate an appropriate system for Prior
Informed Consent and Fair and Equitable Benefit sharing in
respect of biological material and traditional knowledge to
enable both the country and the local communities to derive
economic benefits by providing access. These issues are
complex and therefore, modalities for their implementation need
to be carefully worked out. Finally, efforts should be made to
attain greater congruence between these issues and trade related
aspects of Intellectual Property Rights.
Box 2.4.3: New Technology for Mining
The process of open-cast mining scars the landscape, disrupts ecosystems and destroys microbial communities. Over the long
term, open-cast mining reduces forest productivity, damages aquatic and atmospheric ecosystems and sometimes leads to
substantial alterations in microclimates. Such changes, in turn, have adverse economic and social impacts on nearby
communities whose residents majorly depend on the region's natural resources for their livelihoods.
The National Environmental Engineering Research Institute (NEERI) has developed a sustainable eco-friendly technology that
reclaims and rejuvenates the ‘soil spoils’ left behind by open-cast mining. The strategy, which experts have labeled as the
Integrated Biotechnological Approach (IBA), involves the use of diverse organic materials (for example, such industrial wastes
as press-mud, a by-product of sugar mills, and treated sludge, a by-product of paper mills) to build soil productivity. These
organic materials, which nourish the depleted soil, are supplemented by the planting of saplings that contain specialized
cultures of endomycorrhizal fungi and such nitrogen-fixing bacteria such as Rhizobium and Azotobacter. IBA has increased
the survival rate of plant species found on land that is scarred by open-cast mining to more than 80 per cent. At the same time, it
has boosted the species growth rate by a factor of five. Barren, eroded slopes have been transformed into lush-green tree-lined
landscapes. Equally importantly, the areas' biodiversity is slowly being regenerated. In fact, IBA forests ultimately produce
commodities of high value, including timber, fruit and gum. In addition to these long-term environmental benefits, over the
short term, the strategy generates jobs and income.
REFERENCES
§Compendium of Environment Statistics India 2007,
Ministry of Statistics & Programme Implementation
§Convention on biological diversity - National Biodiversity
Strategy Action Plan
§Deb, D., Malhotra, K. C. (2001). Conservation Ethos in
Local Traditions: The West Bengal Heritage. Society and
Natural Resources 14: 711-724
§India' Forests 2007, Ministry of Environment & Forests
§Lal J.B.( 1989). India's Forests: Myth and Reality. Natraj
Publishers, New Delhi, India
§National Biodiversity Action Plan 2008, Ministry of
Environment & Forests
§Oertli, B. Joye, D. A., Castella, E., Juge, R., Cambin, D., and
Lachavanne, J.-B. (2002). Does size matter? The relationship
between pond area and biodiversity. Biological
Conservation 104, 59-70
§Pandey, Deep N. (2001b). Ethnoforestry for Small-Scale
Forest Management in India. In Herbohn, J. et al. (eds)
Developing Policies to Encourage Small-Scale Forestry.
Australia, 220-231
§Rodgers, W.A., H.S. Panwar., H. S and Mathur, V. B. (2000).
Wildlife Protected Area Network in India: A Review
(Executive Summary). Wildlife Institute of India, Dehradun
§Salim R.V. 1981. Coastal resources of Sri Lanka, India and
Pakistan: Description, Use and Management. U.S. Fish and
Wildlife Service International Affairs Publication: pp 260
§State of Forest Report 2005, Forest Survey of India, Ministry
of Environment & Forests
§TERI (1999). TERI Energy Data Directory & Yearbook
1999/2000. The Energy and Resources Institute, New Delhi
§Tiwari, B. K., Barik, S. K., and Tripathi, R. S. 1998.
Biodiversity value, status, and strategies for conservation of
sacred groves of Meghalaya, India. Ecosystem Health 4: 20-
32
§The Integration of Biodiversity into National Environmental
Assessment Procedures-National Case Studies-India.
2001.UNDP/UNEP/GEF
§IUCN – The International Union for the Conservation of
Nature and Natural Resources
§Wildlife Institute of India, Dehradun

KEY ENVIRONME NTALISSUES
KEY ENVIRONME NTALISSUES
CHAPTER - 3

KEY ENVIRONME NTALISSUES
KEY ENVIRONME NTALISSUES
CHAPTER - 3

Key Environmental Issues-Climate Change75
State Of Environment Report-2009 74
Ever since the industrial revolution began about 150 years ago,
human activities have added significant quantities of GHGs to
the atmosphere. An increase in the levels of GHGs could lead to
greater warming which, in turn, could have major impact on the
world's climate, leading to accelerated climate change.
Global atmospheric concentrations of carbon dioxide, methane,
and nitrous oxide have increased from 280 ppm to 379 ppm,
715 ppb to 1774 ppb and 270 ppb to 319 ppb respectively,
between pre-industrial period and 2005 (IPCC ,2007).
Eleven of the last twelve years rank among the 12 warmest years
in the instrumental record of global surface temperatures since 01850. The updated 100-year linear for 1906-2005 is 0.74 C.
Globally, average sea level rose at an average rate of 1.8 mm per
year over 1961 to 2003. The rate was higher over 1993 to 2003,
about 3.1 mm per year (IPCC, 2007). The projected sea level rise
by the end of this century is likely to be 0.18 to 0.59 metres.
In its 2007 Report, the Intergovernmental Panel on Climate 0Change (IPCC) predicts global temperatures will rise by 2-4.5 C
by the end of this century and for the next two decades a warming 0of about 0.2 C per decade is projected. Even if the concentrations
of all greenhouse gases and aerosols had been kept constant at 0year 2000 levels, a further warming of about 0.1 C per decade
would be expected.
This unprecedented increase is expected to have severe impact
on global hydrological systems, ecosystems, sea level, crop
production and related processes. The impact would be
particularly severe in the tropical areas, which mainly consist of
developing countries, including India.
CLIMATECLIMATECHANGECHANGE
§Extreme rise in maximum and minimum temperatures is
also expected and similarly extreme precipitation is also
CLIMATE CHANGE SCENARIO IN INDIA
India is a large developing country with nearly 700 million rural
population directly depended on climate sensitive sectors
(agriculture, forests and fisheries) and natural resources (such as
water, biodiversity, mangroves, coastal zones, grasslands) for
their subsistence and livelihoods. Further, the adaptive capacity
of dry land farmers, forest dwellers, fisher folk and nomadic
shepherds is very low. Climate change is likely to impact all the
natural ecosystems as well as socio-economic systems as per the
National Communications Report of India to the UNFCCC.
The Intergovernmental Panel on Climate Change, in its 2007 0report, predicts that global temperatures will rise by 2-4.5 C by
0the end of this century, with a 2.7-4.3 C increase over India by the
2080s. The panel also predicted an increase in rainfall over the
Indian sub-continent by 6-8 per cent and that the sea level would
rise by 88 centimetres by 2100.
The latest high resolution climate change scenarios and
projections for India, based on Regional Climate Modelling
(RCM) system, known as PRECIS developed by Hadley Center
and applied for India using IPCC scenarios A2 and B2 depicts the
following:
§An annual mean surface temperature rise by the end of this
century, ranging from 3°C to 5°C (under A2 scenario) and
2.5°C to 4°C (under B2 scenario), with the warming more
pronounced in the northern parts of India.
§A 20 per cent rise in all India summer monsoon rainfall and
a further rise in rainfall is projected over all states except
Punjab, Rajasthan and Tamil Nadu, which show a slight
decrease.
Box 3.1.1: IPCC Special Report on Emission Scenarios (SRES)
A1. The A1 storyline and scenario family describes a future world of very rapid economic growth, global population that peaks in
mid-century and declines thereafter, and the rapid introduction of new and more efficient technologies. Major underlying themes
are convergence among regions, capacity building and increased cultural and social interactions, with a substantial reduction in
regional differences in per capita income. The A1 scenario family develops into three groups that describe alternative directions
of technological change in the energy system. The three A1 groups are distinguished by their technological emphasis: fossil-
intensive (A1FI), non-fossil energy sources (A1T) or a balance across all sources (A1B) (where ‘balanced’ is defined as not
relying too heavily on one particular energy source, on the assumption that similar improvement rates apply to all energy supply
and end use technologies).
A2. The A2 storyline and scenario family describes a very heterogeneous world. The underlying theme is self-reliance and
preservation of local identities. Fertility patterns across regions converge very slowly, which results in continuously increasing
population. Economic development is primarily regionally oriented and the per capita economic growth and technological
change are more fragmented and slower than other storylines.
B1. The B1 storyline and scenario family describes a convergent world with the same global population, that peaks in mid-
century and declines thereafter, as in the A1 storyline, but with rapid change in economic structures toward a service and
information economy, with reductions in material intensity and the introduction of clean and resource-efficient technologies.
The emphasis is on global solutions to economic, social and environmental sustainability, including improved equity, but
without additional climate initiatives.
B2. The B2 storyline and scenario family describes a world in which the emphasis is on local solutions to economic, social and
environmental sustainability. It is a world with continuously increasing global population, at a rate lower than A2, intermediate
levels of economic development, and less rapid and more diverse technological changes than in the B1 and A1 storylines. While
the scenario is also oriented towards environmental protection and social equity, it focuses on local and regional levels.
Source: Intergovernmental Panel on Climate Change, 2007
projected, particularly over the West Coast of India and
West Central India.
India’s Contribution to global GHG Emissions
In recent years, development planning in India has increasingly
incorporated measurable goals for enhancement of human
wellbeing, beyond mere expansion of production of goods and
services and the consequent growth of per capita income. India
has many future developmental targets, several of which are
directly or indirectly linked to energy consumption and therefore
to GHG emissions.
Source: World Development Indicators, 2007
Figure 3.1.1: India's Share in Global CO Emissions2
China, 16%
India, 5% Rest of South Asia, 1% Rest of World,
11%
United States, 22%
Japan, 5%Rest of High Income, 13%
Russian Federation, 6%
Rest of Europe and Central Asia,
7%
Europe - EMU, 10%
Rest of East Asia and Pacific, 4%

Key Environmental Issues-Climate Change77
State Of Environment Report-2009 76
The contribution of India to the cumulative global CO emissions 2
is only 5 per cent (Figure 3.1.1). Thus historically, and at present,
India's share in the carbon stock in the atmosphere is relatively
very small in terms of per capita emissions. India's per capita
carbon emissions average one-twentieth of those of the US and
one-tenth of most countries in Western Europe and Japan.
Sectoral distribution shows that the highest CO equivalent 2
emission contribution is from the energy sector (61 per cent)
(Figure 3.1.2).
§Storms/Cyclones: India's 7,517 km coastline will be
particularly hard-hit by storm surges and sea-level rise
displacing millions, flooding low-lying areas, and damaging
economic assets and infrastructure. The super-cyclone of 1999
wreaked havoc in Orissa, knocking decades off its development
and claiming more than 30,000 human lives (Figure 3.1.3).
STATE-WISE IMPACTS OF CLIMATE
CHANGE
PHYSICAL IMPACT
Climate changes characterized as global warming are leading to
large-scale irreversible effects at continental and global scales.
The likelihood, magnitude, and timing is observed to be
increasing and accelerating. Many projected consequences of
global warming once thought controversial, are now being
observed.
The IPCC reports that the effects of global warming will be
mixed across regions. For smaller values of warming (1 to 3°C),
changes are expected to produce net benefits in some regions and
for some activities, and net costs for others. Greater warming
may produce net costs in all regions. Developing countries are
vulnerable to reduced economic growth as a result of global
warming.
Most of the consequences of global warming would result from
physical changes like sea level rise, higher local temperatures,
and changes in rainfall patterns, but synergistic effects such as
the release of methane hydrates or clathrates and forests and
species die-off may cause many unforeseen impacts such as a
decrease in the levels of oxygen in the Earth's atmosphere. Most
scientists believe that the warming of the climate will lead to
more extreme weather patterns such as:
§Heat Spells: Extreme temperatures and heat spells have
already become common over Northern India, often causing
human fatalities. In 1998 alone, 650 deaths occurred in Orissa
due to heat waves.
Source: State of Environment Atlas of India, 2007, MoEF
Figure 3.1.3: Natural Hazards Affected Areas of India
CH4
31%
N O2
4%
CO2
65%
(a)
Agriculture28%
IndustrialProcess
8%
Waste2% LULUCF
1%
Energy61%
(b)
Source: India's Initial National Communication to UNFCCC, 2004
Figure 3.1.2 : Distribution of GHG Emissions from India
(a) Gas by Gas Emission Distribution (b) Sectoral Distribution of CO Equivalent Emissions2
Loss of littoral rain forest in Great Nicobar Biosphere Reserveafter Tsunami
Source: India's Initial National Communication to UNFCCC, 2004
The Spatial Pattern of Cyclone Incidences and the
Average Based on Facts:
8.45 cyclones cross the Indian coastline per year.
5.15 depressions cross the Indian coastline on an average
The Temporal Pattern of Cyclone Incidences
1,474 cyclones originated in the Bay of Bengal
964 cyclones crossed the Indian coastline.
Three districts of West Bengal (174 events).
Seven districts of Orissa (422 events).
Nine districts of Andhra Pradesh (203 events).
Depressions have a distinct peak in the month of August.
Storms have two distinct peaks in June and October.
Seven storms have distinct peaks in May and November
The total number of tropical cyclones seasonally follow the
1.93 storms occur on an average per year.
1.35 severe storms occur on an average per year.
15 districts of Tamil Nadu (100 events)
Facts (data from 1877 to 1990)
and the Arabian Sea during this period.
path of the depression.
per year.
Box 3.1.2: Cyclonic Events
Key Environmental Issues-Climate Change79
State Of Environment Report-2009 78
§Rainfall: Climate change has had an effect on the monsoons
too. India is heavily dependent on the monsoon to meet its
agricultural and water needs, and also for protecting and
propagating its rich biodiversity. Subtle changes have already
been noted in the monsoon rain patterns by scientists at IIT,
Delhi. They also warn that by the 2050s, India will experience a
decline in its summer rainfall, which accounts for almost 70 per
cent of the total annual rainfall and is crucial to agriculture.
§Melting of glaciers causing sea level rise & flooding:
According to International Centre for Integrated Mountain
Development (ICIMOD), Himalayan glaciers could disappear
within 50 years because of climate change, with far-reaching
implications for more than a billion people in India. The Earth's 0temperature has increased by an average of 0.74 C over the past
100 years. It is believed that global warming has pushed up the 0temperature of the Himalayas by up to 0.6 C in the past 30 years.
Ice melt's share in sea level rise is increasing, and will accelerate
if the larger ice sheets crumble. As mountain glaciers shrink,
large regions that rely on glacial runoff for water supply could
experience severe shortages. In northern India, a region already
facing severe water scarcity, an estimated 500 million people
depend on the tributaries of the glacier-fed Indus and Ganga
rivers for irrigation and drinking water. But, as the Himalayas
melt, these rivers are expected to initially swell and then fall to
dangerously low levels, particularly in summers. (In 1999, the
Indus reached record high levels because of glacial melt.) Some
of the glaciers in the Himalayas are receding at an average rate of
10 to 15 metres per year. As glaciers melt, many glaciers form
lakes at their end which are held together only by frozen mud
dams. The dams can break and cause flash floods of water, rocks
and gravel, destroying villages and fields downstream imitating
the phenomenon termed as Glacial Lake Outburst Flood
(GLOF).
As glaciers retreat, water flows are expected to be affected
during the dry season, leading to freshwater scarcity in the
summer months when melt waters contribute up to 75 per cent of
the river water. The region's agriculture and power generation
are partially dependent on this water supply. In the Ganga, one of
the two biggest rivers in India, the loss of glacier melt water is
expected to impact downstream water flows, causing water
stress for several million people and also affect the irrigated land
in the Ganga basin.
In Indian Himalaya Region (IHR), Gangotri glacier, the largest
ice mass in the Ganga basin, is receding and shrinking at an
unsustainable rate. The Gangotri glacier system has a number of
glacial lakes. These lakes are formed by displacement of
transverse and longitudinal crevasses, rapid melting of glacial
ice and high precipitation and seismicity. G.B. Pant Institute of
Himalayan Environment and Development (GBPIHED) has
been carrying out research on glacial hydrology and glacio-
fluvial aspect of the glacier since 1999. The study found that in
the ablation period, the rising limb of hydrographs exhibited an
abrupt increase to peak flow, arresting the GLOF dealings in the
glacier. On 6th June 2000, large amount of sediment was
transported from the glacier due to heavy rains and deposited as a
huge bulk of debris in the valley near Bhujbas (four kilometres
downstream of the glacier snout). This debris deposit blocked the
Bhagirathi river to form a short-lived extensive lake. Bursting of
this lake caused flash floods in the entire area sweeping a temple
located on the riverbank and damaging the buildings at Bhujbas,
including a pre-fabricated hut and base camp located there. The
water level of the river was elevated by about 3m. Similar
devastating events were observed at Gangotri town (located 18
km downstream of the snout of Gangotri glacier) where minor
damages occurred to the Gangotri temple and three lodges. The
bursting of such lakes could also spell disaster for the people
living downstream.
Agriculture
Food grain production in India has increased from 50 million
tonnes in 1951 to 212 million tonnes in 2002, while mean cereal
productivity has increased from 500 kg/hectare to almost 1,800
kg/hectare. Despite the progress, food production in India is still
considerably dependent on the rainfall quantity and its
distribution, which is highly variable, both spatially and
temporally. In the past fifty years, there have been around 15
major droughts, due to which the productivity of rain-fed crops
in drought years was adversely affected. Limited options of
alternative livelihoods and widespread poverty continue to
threaten livelihood security of millions of small and marginal
farmers in the rain-fed agriculture region. Food security of India
may be at risk in the future due to the threat of climate change
leading to an increase in the frequency and intensity of droughts
and floods, thereby affecting production of small and marginal
farms. Simulations using dynamic crop models, having the
flexibility to independently assess the impacts of temperature
rise and CO increase on crop production, indicate a decrease in 2
yield of crops as temperature increases in different parts of India.
These reductions were, however, generally offset by the increase
in CO . The magnitude of this response varied with the crop, 2
region, and the nature of climate change (pessimistic or
optimistic, where pessimistic scenario refers to high increase in
temperature and low increase in CO , while optimistic scenario 2
refers to a large increase in CO and a low rise in temperature). 2
Irrigated rice yields may have a small gain, irrespective of the
scenario throughout India. Wheat yields in central India are
likely to suffer a drop in the crop yield upto two per cent in a
pessimistic scenario, but there is also a possibility that yields
may increase by six per cent if the global change is optimistic.
Sorghum, being a C4 plant, does not show any significant
response to increase in CO and hence these scenarios are 2
unlikely to affect its yield. However, if the temperature increases
are higher, western India may show some negative impact on
productivity due to reduced crop durations (Figure 3.1.4).
SOCIO - ECONOMIC IMPACT
Source: The Energy and Resources Institute, 2003-04
Figure 3.1.4 : Vulnerability of Indian Agriculture to Climate Change and Globalization
Forests
Preliminary assessments, using BIOME-3 vegetation response
model, based on regional climate model projections (HadRM2)
for India, show shifts in forest boundary, changes in species-
assemblage or forest types, changes in net primary productivity,
possible forest die-back in the transient phase, and potential loss
or change in biodiversity (Figure 3.1.5). Enhanced levels of CO 2
are projected to result in an increase in the net primary
productivity (NPP) of forest ecosystems over more than 75 per
cent of the forest area. Even in a relatively short span of about 50
years, most of the forest biomes in India seem to be highly
vulnerable to the projected change in climate. About 70 per cent
of the vegetation in India is likely to find itself less than
optimally adapted to its existing location, making it more
vulnerable to the adverse climatic conditions as well as to the
increased biotic stresses. Biodiversity is also likely to be
adversely impacted. These impacts on forests will have adverse
socio-economic implications for forest dependent communities
and the national economy. The impacts of climate change on
forest ecosystems are likely to be long-term and irreversible.
Thus, there is a need for developing and implementing
adaptation strategies to minimize the possible adverse impacts.
Further, there is a need to study and identify the forest policies,
programmes and silvicultural practices that contribute to the
vulnerability of forest ecosystems to climate change.
Source: India's Initial National Communication to UNFCCC, 2004
Figure 3.1.5 : Vegetation Map for the Year 2050 (Right) under GHG Run of Hard RM2 Considering all Grids of Indian and Potential Vegetation (including grids without forests)
The Control Run (without GHG increase) is shown on the left
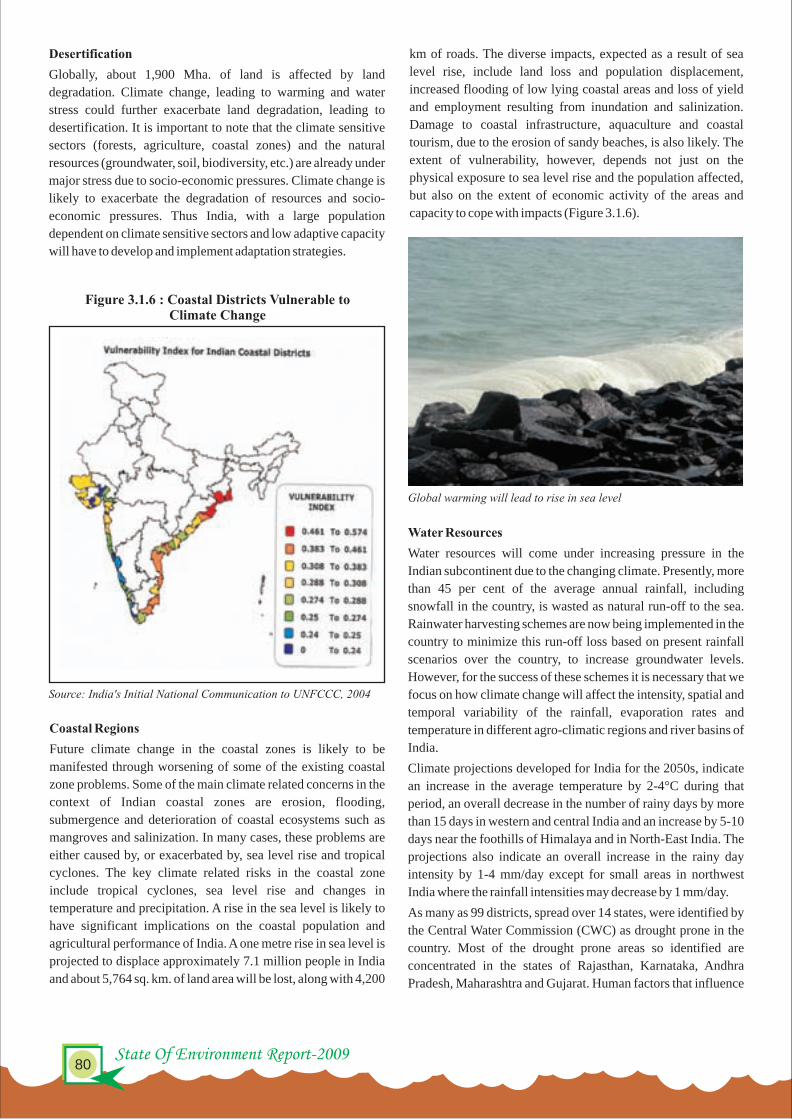
Key Environmental Issues-Climate Change81
State Of Environment Report-2009 80
Desertification
Globally, about 1,900 Mha. of land is affected by land
degradation. Climate change, leading to warming and water
stress could further exacerbate land degradation, leading to
desertification. It is important to note that the climate sensitive
sectors (forests, agriculture, coastal zones) and the natural
resources (groundwater, soil, biodiversity, etc.) are already under
major stress due to socio-economic pressures. Climate change is
likely to exacerbate the degradation of resources and socio-
economic pressures. Thus India, with a large population
dependent on climate sensitive sectors and low adaptive capacity
will have to develop and implement adaptation strategies.
Source: India's Initial National Communication to UNFCCC, 2004
Figure 3.1.6 : Coastal Districts Vulnerable to Climate Change
Coastal Regions
Future climate change in the coastal zones is likely to be
manifested through worsening of some of the existing coastal
zone problems. Some of the main climate related concerns in the
context of Indian coastal zones are erosion, flooding,
submergence and deterioration of coastal ecosystems such as
mangroves and salinization. In many cases, these problems are
either caused by, or exacerbated by, sea level rise and tropical
cyclones. The key climate related risks in the coastal zone
include tropical cyclones, sea level rise and changes in
temperature and precipitation. A rise in the sea level is likely to
have significant implications on the coastal population and
agricultural performance of India. A one metre rise in sea level is
projected to displace approximately 7.1 million people in India
and about 5,764 sq. km. of land area will be lost, along with 4,200
km of roads. The diverse impacts, expected as a result of sea
level rise, include land loss and population displacement,
increased flooding of low lying coastal areas and loss of yield
and employment resulting from inundation and salinization.
Damage to coastal infrastructure, aquaculture and coastal
tourism, due to the erosion of sandy beaches, is also likely. The
extent of vulnerability, however, depends not just on the
physical exposure to sea level rise and the population affected,
but also on the extent of economic activity of the areas and
capacity to cope with impacts (Figure 3.1.6).
Global warming will lead to rise in sea level
Water Resources
Water resources will come under increasing pressure in the
Indian subcontinent due to the changing climate. Presently, more
than 45 per cent of the average annual rainfall, including
snowfall in the country, is wasted as natural run-off to the sea.
Rainwater harvesting schemes are now being implemented in the
country to minimize this run-off loss based on present rainfall
scenarios over the country, to increase groundwater levels.
However, for the success of these schemes it is necessary that we
focus on how climate change will affect the intensity, spatial and
temporal variability of the rainfall, evaporation rates and
temperature in different agro-climatic regions and river basins of
India.
Climate projections developed for India for the 2050s, indicate
an increase in the average temperature by 2-4°C during that
period, an overall decrease in the number of rainy days by more
than 15 days in western and central India and an increase by 5-10
days near the foothills of Himalaya and in North-East India. The
projections also indicate an overall increase in the rainy day
intensity by 1-4 mm/day except for small areas in northwest
India where the rainfall intensities may decrease by 1 mm/day.
As many as 99 districts, spread over 14 states, were identified by
the Central Water Commission (CWC) as drought prone in the
country. Most of the drought prone areas so identified are
concentrated in the states of Rajasthan, Karnataka, Andhra
Pradesh, Maharashtra and Gujarat. Human factors that influence
drought include incurred demand of water through population
growth and agricultural practices, modification of land use that
directly influences storage conditions and hydrological response
of catchments and their vulnerability to drought. As pressures on
water resources grow, so does the vulnerability to
meteorological/hydrological/agricultural drought.
From the above table, one can observe that the impacts are
different in different catchments (Table 3.1.1). The increase in
rainfall due to climate change does not result in an increase in the
surface run-off as may be generally predicted. For example, in
the case of the Cauvery river basin, an increase of 2.7 per cent has
been projected in the rainfall, but the run-off is projected to
reduce by about 2 per cent and the evapo-transpiration to
increase by about 2 per cent. This may be either due to increase in
temperature and/or change in rainfall distribution in time.
Similarly, a reduction in the rainfall in the Narmada is likely to
result in an increase in the run-off and a reduction in the evapo-
transpiration that is again contrary to the usual myth. This
increase in run-off may be due to intense rainfall as a
consequence of climate change. It is important to note that these
inferences have become possible since a daily computational
time step has been used in the distributed hydrological modeling
framework. This realistically simulates the complex spatial and
temporal variability inherent in the natural systems. It may be
observed that even though an increase in precipitation is
projected for the Mahanadi, Brahmani, Ganga, Godavari, and
Cauvery basins for the Climate Change Scenario, the
corresponding total run-off for all these basins has not
necessarily increased. For example, the Cauvery and Ganga
show a decrease in the total run-off. This may be due to an
increase in evapo-transpiration on account of increased
temperatures or variation in the distribution of rainfall. In the
remaining basins, a decrease in precipitation is projected. The
resultant total run-off for the majority of the cases, except for the
Source: India’s Initial National Communication to UNFCCC, 2004
Table 3.1.1 : Comparison of Change in Water Balance Components as a Percentage of Rainfall
Basins Scenario Rainfall(mm)
Run-off(mm)
As a proportionof Rainfall (%)
Actual ET(mm)
As a proportionof Rainfall (%)
Control 1309.0 661.2 50.5 601.6 46.0
GHG 1344.0 650.4 48.4 646.8 48.1
Control 1384.8 711.5 51.4 628.8 45.4
GHG 1633.7 886.1 54.2 698.8 42.8
Control 1292.8 622.8 48.2 624.1 48.3
GHG 1368.6 691.5 50.5 628.3 45.9
Control 1013.0 393.6 38.9 585.0 57.7
GHG 954.4 346.9 36.4 575.6 60.3
Control 317.3 15.5 4.9 316.5 99.7
GHG 195.3 6.6 3.4 207.3 106.1
Control 1269.5 612.3 48.2 613.5 48.3
GHG 1505.3 784.0 52.1 674.1 44.8
Control 655.1 133.9 20.4 501.0 76.5
GHG 539.3 100.0 18.5 422.7 78.4
Control 973.5 353.4 36.3 586.8 60.3
GHG 949.8 359.4 37.8 556.6 58.6
Control 723.2 148.6 20.6 556.7 77.0
GHG 676.2 110.2 16.3 551.7 81.6
Control 928.6 311.2 33.5 587.9 63.3
GHG 884.2 324.9 36.7 529.3 59.9
Control 1126.9 495.4 44.0 535.0 47.5
GHG 1249.6 554.6 44.4 587.2 47.0
Control 499.4 57.0 11.4 433.1 86.7
GHG 303.0 16.6 5.5 286.0 94.4
Cauvery
Brahmani
Godavari
Krishna
Luni
Mahanadi
Mahi
Narmada
Pennar
Tapi
Ganga
Sabarmati

Key Environmental Issues-Climate Change83
State Of Environment Report-2009 82
including Himachal Pradesh, may become Malaria prone in the
future climate change regime. The duration of the transmission
window is likely to widen in Northern and Western states and
shorten in the Southern states.
India has undertaken numerous response measures that are
contributing to the objectives of the United Nations Framework
Convention on Climate Change (UNFCCC). India's
development plans balance economic development and
environmental concerns. The planning process is guided by the
principles of sustainable development. Reforms in the energy
and power sector have accelerated economic growth and
enhanced the efficiency of energy use. These have been
complemented by notable initiatives taken by the private sector.
In the last few years, several measures relating to environmental
issues have been introduced. They have targeted a significant
increase in the capacity of renewable energy installations,
improving the air quality in major cities (the world's largest fleet
of vehicles fuelled by compressed natural gas has been
introduced in New Delhi) and enhancing afforestation. Other
similar measures have been implemented by committing
additional resources and realigning new investments, thus
steering economic development onto a climate-friendly path.
SECTORAL INITIATIVES 1) Coal
Coal is, and will remain, the mainstay of commercial energy
production in India in the near future. To ensure more efficient
use of coal, the following measures have been taken:
§Rationalization of coal use
§Participation of private sector encouraged
§Reforms in pricing
§Technology upgradation involving coal-washing,
improvements in combustion technology and the recovery
of coal-bed methane
RESPONSE / MEASURES
2) Oil
To promote fuel efficiency and conservation, the following
measures have been undertaken:
§Reduction of gas-flaring
§Installation of waste heat recovery systems
§Energy audits
§Equipment upgradation
§Substitution of diesel with natural gas
§Establishment of PCRA (Petroleum Conservation
Research Association) to increase awareness and develop
fuel-efficient equipment.
3) Gas
This source of energy is the preferred substitute for coal and oil.
§In the residential sector, gas has replaced coal and kerosene
§CNG is being introduced as an alternative to petrol and
diesel in the transport sector
§Major investments have been made in developing
infrastructure for long distance and local distribution
§Import options are under consideration
§The share of gas in the power sector has increased from 2 to
8 per cent
4) Renewable Energy
India has an active programme to promote the use of renewable
energy. Some salient features of the current renewables situation
are given source-wise.
a) Hydropower
The government's policy objective is to exploit the huge
potential in India's North-East. At present, about 25 per cent of
the total installed capacity is accounted for by hydro. The total
installed capacity of small hydropower projects is 1,423 MW.
b) Solar Energy
§Photovoltaic (PV) systems based on solar energy have been
put to a variety of uses in rural electrification, railway
signaling, microwave repeaters, power to border outposts
and TV transmission and reception.
§Grid-connected PV power plants with an aggregate
capacity of 1900 KWp (Kilowattpeak) have been set up for
demand-side management or tail-end voltage support.
§A 140 MW Integrated Solar Combined Cycle (ISCC) plant
is being set up, based on solar thermal technology and
liquified natural gas.
§Solar lanterns, home and street-lighting systems, stand-
alone power plants, and pumping systems are being
promoted. So far, 9,20,000 SPV systems, with an aggregate
capacity of 82 MWp (Megawattpeak), have been installed
in the country.
c) Wind Energy
India is among the five leading nations in wind power
generation
(Sukumar, 2000). The increase in precipitation can change the
nature of the forest in terms of the floral species dominance,
canopy cover, forest dynamics etc. It can rebuild the connections
between fragmented ecosystems, support forest areas to
encroach in to grasslands, alter tree species dominance and
thereby change the forest class. Vice-versa, reduction in
precipitation can support a shift towards deciduous category of
forests, expansion of grass lands, lead to forest fragmentation
and raise frequency of forest fires. All these can cause significant
changes in faunal species distribution, demography and
composition.
§There is a threat to species in the three distinct ecological
zones that make up the Sundarbans - the largest
contiguous mangrove area in the world. If the saline water
front moves further inland, many species could be
threatened. These changes could result in economic
impacts. Direct employment supported by the Sundarbans
is estimated to be in the range of 500,000-600,000 people
for at least half of the year, and a large number of these
people, who are directly employed in the industries that use
raw materials from the Sundarbans (e.g. fishing, wood-
cutting, collection of thatching materials, honey, beeswax,
and shells) may lose their sources of income. Sea level rise
also may threaten a wide range of mammals, birds,
amphibians, reptiles and crustaceans.
§The predicted increase in precipitation in the forest areas in
the Indian subcontinent is higher than that of the non-forest
area (Ravindranath et al., 2006). Climate models predict 02-3.5 C increase in temperature and 250-500 mm increase
in precipitation in the North Eastern region (Ravindranath
et al., 2006; IPCC technical paper V). Increase in rainfall
may not have a significant impact on the forest areas of
North East which are already experiencing high rainfall but
any change in temperature regime may cause severe impact
and significant changes (Ravindranath and Sukumar,
1996).
Human Health
Climate signals observed over India in the last 100 years show an
increasing trend in surface temperature by 0.3°C, a change in the
spatial pattern of rainfall and occurrence of more intense and
frequent extreme temperature, rainfall and cyclone events. As a
result, there is growing concern about the changing pattern over
the years of some of the diseases that are directly influenced by
the variable climate. Changes in the climate may affect vector-
borne diseases in several ways, namely, their survival and
reproduction rates, the intensity and temporal pattern of vector
activity and the rates of development, survival and reproduction
of pathogens within vectors.
Applying the same criteria as under the climate change
conditions in the 2050s, it is projected that Malaria is likely to
persist in Orissa, West Bengal and Southern parts of Assam,
bordering North of West Bengal. However, it may shift from the
central Indian region to the South Western coastal states of
Maharashtra, Karnataka and Kerala. Also the Northern states,
Narmada and Tapi, is projected to decline. As expected, the
magnitude of such variations is not uniform, since they are
governed by many factors such as land use, soil characteristics
and the status of soil moisture. The Sabarmati and Luni basins
are likely to experience a decrease in precipitation and a
consequent decrease in the total run-off to the tune of two-thirds
of the prevailing run-off. This may lead to severe drought
conditions under a future Climate Change Scenario. The
vulnerability of water resources has been assessed with respect
to droughts and floods. Rainfall, run-off and actual evapo-
transpiration have been selected from the available model
outputs, since they mainly govern these two extreme impacts
due to climate change.
Changing Ecosystem
Eco-systems will be particularly vulnerable to climate change,
with a study estimating that between 15 and 40 per cent of ospecies will face extinction, with 2 C of warming. The impact of
climate change would be particularly adverse on the forests,
wetlands and coastal regions.
The precipitation decline and droughts in most delta regions of
India have resulted in the drying up of wetlands and severe
degradation of ecosystems. In some regions, the remaining
natural flood plains are disappearing at an accelerating rate,
primarily as a result of changes in land use and hydrological
cycle, particularly changes in stream-flows due to climatic and
human related factors.
According to IPCC, the most threatened flood plains will be
those in South Asia. Evidence of the impacts of climate-related
factors on mangroves remains limited to the severe destruction
of mangroves due to reduction of freshwater flows and salt water
intrusion in the Indus delta and Bangladesh (IUCN, 2003). In
addition, around 30 per cent of Asia's coral reefs are likely to be
lost in the next 30 years due to multiple stresses and climate
change.
The higher impact will be on the Savannah biomes, Teak and Sal
forests of Central and East India and the temperate biomes of the
Himalayas. Moist and dry Savannahs are likely to be replaced by
tropical dry forests and seasonal forests. By 2050, significant
impact will be witnessed. The impact will be lower on the
evergreen rain forests of the Western Ghats and the North-East.
Composition of species and their dominance could also be
altered, and large-scale forest depletion and loss of biodiversity
are likely to mark the beginning of the bleak scenario.
Biodiversity
The impact of global warming on biodiversity has emerged as an
active area in contemporary conservation biology research and it
is extremely important for a country like India, where
community dependence on forests is very high and climate
change can have much worse impacts than expected or predicted
on biodiversity of forest ecosystems (Ravindranath et al., 2006).
In the Indian scenario, the two important measures of climate
change which have direct and significant impact on the
biodiversity are the variation in precipitation and temperature
Development of Pre-fab modular housing system using bamboo based composites

Key Environmental Issues-Climate Change85
State Of Environment Report-2009 84
§The installed capacity is 1,507 MW, and generators of
capacity 250-600 KW are manufactured here.
§Around 95 per cent of installed wind power capacity is in
the private sector. State-of-the-art wind power systems are
also being manufactured in the country. In fact, wind
turbine equipment is also being exported to other
developing and developed countries.
d) Biogas
§Biomass power generation plants of a total capacity of
about 358 MW have been installed and gasification systems
of a total capacity of 42.8 MW have been set up for
decentralized energy application.
§In rural areas, over 3.2 million biogas plants and 33 million
improved stoves have been installed.
e) Others
Projects with an aggregate capacity of about 15 MW have been
completed using energy recovered from urban, municipal and
industrial waste.
5) Energy Efficiency and Conservation
India is alive to the importance of improving the efficiency of
energy usage and conservation measures. A Bureau of Energy
Efficiency (BEE) has been set up to put into operation,
conservation measures such as energy standards, labelling of
equipment/appliances, building energy codes, and energy
audits.
6) Transport
A major initiative has been the upgradation of vehicular
emission norms. A norm called the ‘Bharat 2000’, similar to
Euro-I norms was implemented throughout the country on 1
April, 2000 for all categories of vehicles manufactured in India.
Emission standards (Bharat Stage II) for motor cars and
passenger vehicles came into force in the National Capital stRegion (NCR) on 1 April, 2000 and has been extended to
Mumbai, Chennai and Kolkata. Apart from reducing pollution
locally, these norms result in increased energy efficiency and
therefore, reduced GHG emissions.
§Awareness and training programmes have been undertaken
to educate drivers.
§The commercial manufacture of battery operated vehicles
has begun in India. This will promote low/no carbon
emitting vehicles.
In Delhi, large-scale switch has taken place from petrol and
diesel to Compressed Natural Gas (CNG) with over 50,000
vehicles having already been converted.
7) Industry
This sector has made significant advances in the conservation of
energy. Government policies, campaigns by associations of
industry and strategic decisions by firms have all contributed to
sizeable improvements in the intensity of energy use in
industries.
§The major energy-consuming sectors are steel, cement,
caustic soda, brick, aluminium and electric power
adaptation than is currently occurring is required to reduce
vulnerability to future climate change. There are barriers, limits
and costs, but these are not fully understood.
Adaptation Expenditure
The adverse impacts of current climate already threaten the
livelihoods of many Indians, especially the poorest. Current
government expenditure on adaptation to climate variability, as
shown in the Figure 3.1.7, already exceeds two per cent of the
GDP, with agriculture, water resources, health and sanitation,
forests, coastal zone infrastructure and extreme weather events,
being specific areas of concern (Figure 3.1.8).
generation. Measures to improve energy efficiency include:
a. Promotion of fuel-efficient practices and equipment
b. Replacement of old and inefficient boilers and other oil-
operated equipment.
c. Fuel switching and technology upgradation
§In the cement industry, specific energy intensities declined
from 900 kcal/kg thermal energy to 800 kcal/kg and 120
KWh/tonne electrical energy to 90 KWh/tonne with a shift
from low capacity energy inefficient wet plants to high
capacity energy efficient dry process during the 1980s. New
Indian plants are among those with the lowest power
consumption internationally.
§In the fertilizer industry, the overall specific energy
consumption and capacity utilization of ammonia plants
have improved from 14.8 Gcal/mt and 63 per cent
respectively, for the year 1979-80 to 10.9 Gcal/mt and 90
per cent respectively, during 1996-97.
8) Agriculture
Some efforts to mitigate climate change in the agricultural sector
have also been undertaken.
§Standardization of fuel-efficient pump sets and
rectification of existing pump sets.
§Rationalization of power tariffs.
§Better cultivation practices which will help in reducing N O 2
emissions
9) Power sector
India has a diverse mix of power generation technologies with
coal dominating, and a significant contribution by large hydro.
§Reforms in the power sector and targeted technology
improvements have helped to enhance the combustion
efficiency of conventional coal technology, leading to
conservation of coal and savings in emissions.
§Power sector reforms include regulatory restructuring,
corporatization, privatization and unbundling of state-
owned utilities. The 1998 Regulatory Commissions Act
empowers commissions to rationalize electricity tariffs and
promote environmentally benign policies.
§Corporatization is altering state electricity boards from
state ownership and administration to business-like
corporations, as defined by the Indian Company Act, 1956.
§The Indian Electricity Act of 1910 and the Electricity Act of
1948 have been amended to permit private participation in
the generation and distribution of power.
§Privatization in transmission has been encouraged by the
recognition of exclusive transmission companies.
Adaptation will be necessary to address impacts resulting from
warming which is already unavoidable due to past emissions. A
wide array of adaptation options is available, but more extensive
ADAPTATION TO CLIMATE CHANGE
Climate change will lead to an increase in extreme weather events causing floods, drought
Source: National Action Plan on Climate Change, 2008, India
Figure 3.1.7: Expenditure on Adaptation Programmes in India
Expenditure on adaptation as % of total budget expenditure14
0
2
4
6
8
10
12
2001 - 02 2002 - 03 2003 - 04 2004 - 05 2005 - 06 2006 - 07V
alu
e of
Exp
end
itu
re
Expenditure on adaptation as % of GDP

Key Environmental Issues-Climate Change85
State Of Environment Report-2009 84
§The installed capacity is 1,507 MW, and generators of
capacity 250-600 KW are manufactured here.
§Around 95 per cent of installed wind power capacity is in
the private sector. State-of-the-art wind power systems are
also being manufactured in the country. In fact, wind
turbine equipment is also being exported to other
developing and developed countries.
d) Biogas
§Biomass power generation plants of a total capacity of
about 358 MW have been installed and gasification systems
of a total capacity of 42.8 MW have been set up for
decentralized energy application.
§In rural areas, over 3.2 million biogas plants and 33 million
improved stoves have been installed.
e) Others
Projects with an aggregate capacity of about 15 MW have been
completed using energy recovered from urban, municipal and
industrial waste.
5) Energy Efficiency and Conservation
India is alive to the importance of improving the efficiency of
energy usage and conservation measures. A Bureau of Energy
Efficiency (BEE) has been set up to put into operation,
conservation measures such as energy standards, labelling of
equipment/appliances, building energy codes, and energy
audits.
6) Transport
A major initiative has been the upgradation of vehicular
emission norms. A norm called the ‘Bharat 2000’, similar to
Euro-I norms was implemented throughout the country on 1
April, 2000 for all categories of vehicles manufactured in India.
Emission standards (Bharat Stage II) for motor cars and
passenger vehicles came into force in the National Capital stRegion (NCR) on 1 April, 2000 and has been extended to
Mumbai, Chennai and Kolkata. Apart from reducing pollution
locally, these norms result in increased energy efficiency and
therefore, reduced GHG emissions.
§Awareness and training programmes have been undertaken
to educate drivers.
§The commercial manufacture of battery operated vehicles
has begun in India. This will promote low/no carbon
emitting vehicles.
In Delhi, large-scale switch has taken place from petrol and
diesel to Compressed Natural Gas (CNG) with over 50,000
vehicles having already been converted.
7) Industry
This sector has made significant advances in the conservation of
energy. Government policies, campaigns by associations of
industry and strategic decisions by firms have all contributed to
sizeable improvements in the intensity of energy use in
industries.
§The major energy-consuming sectors are steel, cement,
caustic soda, brick, aluminium and electric power
adaptation than is currently occurring is required to reduce
vulnerability to future climate change. There are barriers, limits
and costs, but these are not fully understood.
Adaptation Expenditure
The adverse impacts of current climate already threaten the
livelihoods of many Indians, especially the poorest. Current
government expenditure on adaptation to climate variability, as
shown in the Figure 3.1.7, already exceeds two per cent of the
GDP, with agriculture, water resources, health and sanitation,
forests, coastal zone infrastructure and extreme weather events,
being specific areas of concern (Figure 3.1.8).
generation. Measures to improve energy efficiency include:
a. Promotion of fuel-efficient practices and equipment
b. Replacement of old and inefficient boilers and other oil-
operated equipment.
c. Fuel switching and technology upgradation
§In the cement industry, specific energy intensities declined
from 900 kcal/kg thermal energy to 800 kcal/kg and 120
KWh/tonne electrical energy to 90 KWh/tonne with a shift
from low capacity energy inefficient wet plants to high
capacity energy efficient dry process during the 1980s. New
Indian plants are among those with the lowest power
consumption internationally.
§In the fertilizer industry, the overall specific energy
consumption and capacity utilization of ammonia plants
have improved from 14.8 Gcal/mt and 63 per cent
respectively, for the year 1979-80 to 10.9 Gcal/mt and 90
per cent respectively, during 1996-97.
8) Agriculture
Some efforts to mitigate climate change in the agricultural sector
have also been undertaken.
§Standardization of fuel-efficient pump sets and
rectification of existing pump sets.
§Rationalization of power tariffs.
§Better cultivation practices which will help in reducing N O 2
emissions
9) Power sector
India has a diverse mix of power generation technologies with
coal dominating, and a significant contribution by large hydro.
§Reforms in the power sector and targeted technology
improvements have helped to enhance the combustion
efficiency of conventional coal technology, leading to
conservation of coal and savings in emissions.
§Power sector reforms include regulatory restructuring,
corporatization, privatization and unbundling of state-
owned utilities. The 1998 Regulatory Commissions Act
empowers commissions to rationalize electricity tariffs and
promote environmentally benign policies.
§Corporatization is altering state electricity boards from
state ownership and administration to business-like
corporations, as defined by the Indian Company Act, 1956.
§The Indian Electricity Act of 1910 and the Electricity Act of
1948 have been amended to permit private participation in
the generation and distribution of power.
§Privatization in transmission has been encouraged by the
recognition of exclusive transmission companies.
Adaptation will be necessary to address impacts resulting from
warming which is already unavoidable due to past emissions. A
wide array of adaptation options is available, but more extensive
ADAPTATION TO CLIMATE CHANGE
Climate change will lead to an increase in extreme weather events causing floods, drought
Source: National Action Plan on Climate Change, 2008, India
Figure 3.1.7: Expenditure on Adaptation Programmes in India
Expenditure on adaptation as % of total budget expenditure14
0
2
4
6
8
10
12
2001 - 02 2002 - 03 2003 - 04 2004 - 05 2005 - 06 2006 - 07
Val
ue
of E
xpen
dit
ure
Expenditure on adaptation as % of GDP
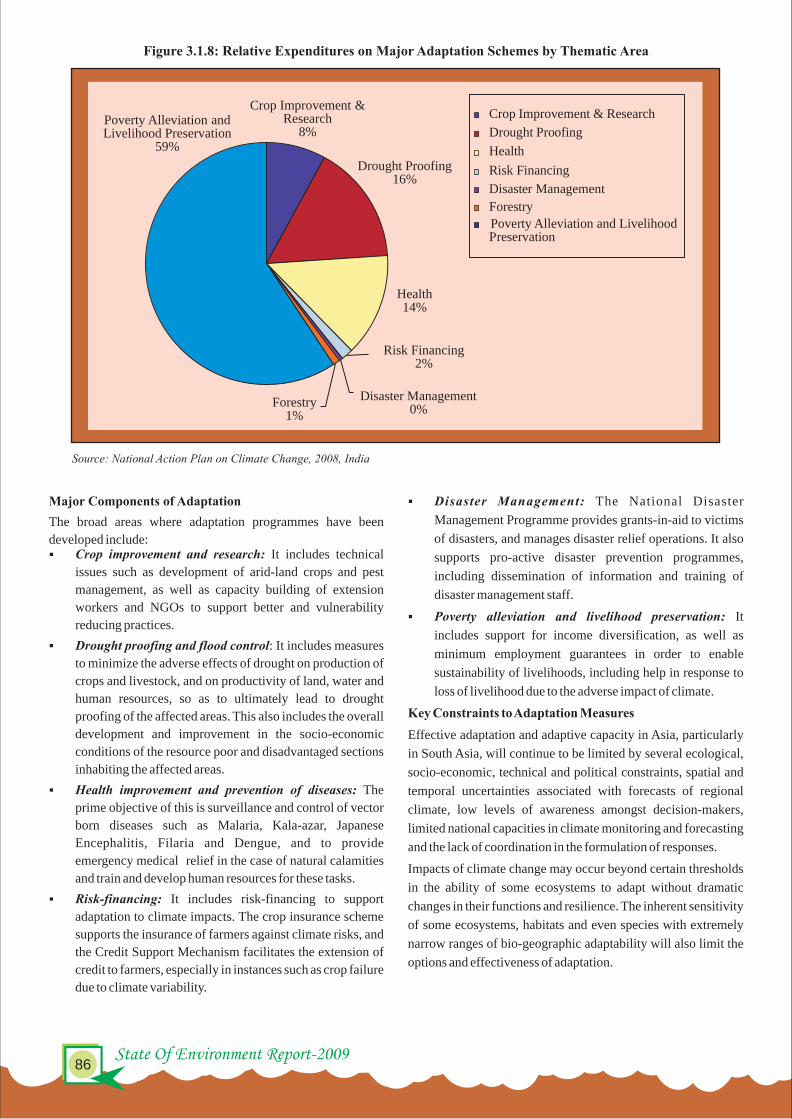
Key Environmental Issues-Climate Change87
State Of Environment Report-2009 86
processes, but also sustainable life styles across the globe. In this
effort, every citizen of the planet should have an equal share of
the planetary atmospheric space. The Action Plan suggests that
the long-term convergence of per capita GHG emissions is the
only equitable basis for a global agreement to tackle climate
change. The Action Plan assures the international community
that India's per capita GHG emissions would not exceed the per
capita GHG emissions of developed countries, despite India's
developmental imperatives.
Domestic Action
India's National Action Plan stresses that maintaining a high
growth rate is essential for increasing the living standards of the
vast majority of people in India and reducing their vulnerability
to the impacts of climate change. Accordingly, the Action Plan
identified measures that promote the objectives of sustainable
development of India while also yielding to benefits for
addressing climate change. Eight National Missions, which
form the core of the National Action Plan, represent multi-
pronged, long term and integrated strategies for achieving key
goals in the context of climate change. The focus is on promoting
understanding of climate change, adaptation and mitigation,
energy efficiency and natural resource conservation. While
several of these programmes are already a part of the current
actions, the Action Plan seeks to enhance them in scope and
effectiveness and implement them in an accelerated manner
through time bound plans.
National Missions
1. National Solar Mission aims at increasing the share of
solar energy in the total energy mix through development of
Major Components of Adaptation
The broad areas where adaptation programmes have been
developed include:§Crop improvement and research: It includes technical
issues such as development of arid-land crops and pest
management, as well as capacity building of extension
workers and NGOs to support better and vulnerability
reducing practices.
§Drought proofing and flood control: It includes measures
to minimize the adverse effects of drought on production of
crops and livestock, and on productivity of land, water and
human resources, so as to ultimately lead to drought
proofing of the affected areas. This also includes the overall
development and improvement in the socio-economic
conditions of the resource poor and disadvantaged sections
inhabiting the affected areas.
§Health improvement and prevention of diseases: The
prime objective of this is surveillance and control of vector
born diseases such as Malaria, Kala-azar, Japanese
Encephalitis, Filaria and Dengue, and to provide
emergency medical relief in the case of natural calamities
and train and develop human resources for these tasks.
§Risk-financing: It includes risk-financing to support
adaptation to climate impacts. The crop insurance scheme
supports the insurance of farmers against climate risks, and
the Credit Support Mechanism facilitates the extension of
credit to farmers, especially in instances such as crop failure
due to climate variability.
§Disaster Management: The National Disaster
Management Programme provides grants-in-aid to victims
of disasters, and manages disaster relief operations. It also
supports pro-active disaster prevention programmes,
including dissemination of information and training of
disaster management staff.
§Poverty alleviation and livelihood preservation: It
includes support for income diversification, as well as
minimum employment guarantees in order to enable
sustainability of livelihoods, including help in response to
loss of livelihood due to the adverse impact of climate.
Key Constraints to Adaptation Measures
Effective adaptation and adaptive capacity in Asia, particularly
in South Asia, will continue to be limited by several ecological,
socio-economic, technical and political constraints, spatial and
temporal uncertainties associated with forecasts of regional
climate, low levels of awareness amongst decision-makers,
limited national capacities in climate monitoring and forecasting
and the lack of coordination in the formulation of responses.
Impacts of climate change may occur beyond certain thresholds
in the ability of some ecosystems to adapt without dramatic
changes in their functions and resilience. The inherent sensitivity
of some ecosystems, habitats and even species with extremely
narrow ranges of bio-geographic adaptability will also limit the
options and effectiveness of adaptation.
§
§
§
Poverty
Poverty has been identified as one of the greatest barriers to
developing adaptive capacity. The poor, usually, have low
adaptive capacity due to their limited access to information,
technology and other capital assets, making them highly
vulnerable to climate change. Poverty also constrains
adaptation in other sectors. Poverty, along with
infrastructural limitations and other socio-economic
factors, could also limit efforts to conserve biodiversity in
India. Adaptive capacity in countries where there is a high
incidence of poverty, will likely remain limited.
Inadequate Awareness
Insufficient information and knowledge on the impacts of
climate change and responses of natural systems to climate
change will continue to hinder effective adaptation,
particularly in India. The limited studies on the inter-
connections between adaptation and mitigation options,
costs and benefits of adaptation, and trade-offs between
various courses of actions will also likely limit adaptation
initiatives. The deficiency in available information and
knowledge will continue to make it difficult to enhance
public perception of the risks and dangers associated with
climate change. In addition, the absence of information on
adaptation costs and benefits makes it difficult to identify
the best adaptation option. This limiting factor will be most
constraining in developing countries, where systems for
monitoring and research on climate, and responses of
natural and human systems to climate are usually lacking.
Lack of Political Motivation
The slow change in the political and institutional landscape
in response to climate change could also be a major
limitation to future adaptation. The existing legal and
institutional framework in India remains inadequate to
facilitate implementation of comprehensive and integrated
response to climate change in synergy with the pursuit of
sectoral development goals.
India released its National Action Plan on Climate Change th(NAPCC) on 30 June, 2008 to outline its strategy to meet the
challenge of climate change. The National Action Plan advocates
a strategy that promotes, firstly, the adaptation to climate change
and secondly, further enhancement of the ecological
sustainability of India's development path.
Approach to Climate Change
The National Action Plan recognizes that climate change is a
global challenge and that it should be successfully addressed
through a globally collaborative and cooperative effort based on
the basis of the principle of equity. The Action Plan expresses
India's willingness to play its role as a responsible member of the
international community and to make its contribution. However,
it emphasizes that this requires not only sustainable production
NATIONAL ACTION PLAN ON CLIMATE
CHANGE
Drought-a major concern of climate change
Crop Improvement &Research
8%
Drought Proofing16%
Health14%
Risk Financing2%
Disaster Management0%
Forestry1%
Poverty Alleviation andLivelihood Preservation
59%
Crop Improvement & Research
Drought Proofing
Health
Risk Financing
Disaster Management
Forestry
Poverty Alleviation and LivelihoodPreservation
Source: National Action Plan on Climate Change, 2008, India
Figure 3.1.8: Relative Expenditures on Major Adaptation Schemes by Thematic Area

Key Environmental Issues-Climate Change89
State Of Environment Report-2009 88
new solar technologies, while attempting to expand the
scope of other renewable and non fossil options such as
nuclear energy, wind energy and biomass.
2. National Mission for Enhanced Energy Efficiency
comprises four new initiatives, namely - a market based
mechanism for trading in certified energy savings in energy
intensive large industries and facilities, accelerating the
shift to energy efficient appliances in designated sectors,
demand side management programmes in all sectors by
capturing future energy savings, and developing fiscal
instruments to promote energy efficiency.
3. National Mission for Sustainable Habitat attempts to
promote energy efficiency in buildings, management of
solid waste and nodal shift to public transport including
transport options based on biodiesel and hydrogen.
4. National Water Mission has as its objective, the
conservation of water, minimizing wastage and ensuring
more equitable distribution both across and within states.
5. National Mission for Sustaining the Himalayan
Ecosystem is aimed at evolving management measures for
sustaining and safeguarding the Himalayan glacier and
mountain ecosystem.
6. National Mission for a Green India focuses on enhancing
ecosystem services and carbon sinks through afforestation
on degraded forest land, in line with the national policy of
expanding the forest and tree cover to 33 per cent of the total
land area of the country.
7. National Mission for Sustainable Agriculture would
develop strategies to make Indian agriculture more resilient
to climate change, with new varieties of thermal resistant
crops, credit and insurance mechanisms and improving
productivity of rainfed agriculture.
8. National Mission on Strategic Knowledge for Climate
Change is intended to identify the challenges of, and the
responses to, climate change through research and
technology development and ensure funding of high quality
and focused research into various aspects of climate
change.
Other Initiatives
Apart from the eight National Missions, the National Action Plan
also envisages other initiatives aimed at enhancing mitigation
and adaptation. These include:
§Research and development in the area of ultra super critical
boilers in coal-based thermal plants.
§Integrated gasification combined-cycle technology to make
coal based power generation efficient
§Setting up more combined cycle natural gas plants.
§Promotion of nuclear energy through adoption of fast breeder
and thorium based thermal reactor technology in nuclear
power generation.
§Adoption of high-voltage AC and high-voltage DC
transmission to reduce technical losses during transmission
and distribution.
§Setting up small and large scale hydro power projects.
§Promotion of renewable energy technologies such as biomass
combustion and gasification based power generation.
§Enhancement in the regulatory/tariff regimes to help
mainstream renewable based sources in the national power
system.
§Promotion of renewable energy technologies for
transportation and industrial fuels.
In addition, the Action Plan envisages effective disaster
management strategies that include mainstreaming disaster risk
reduction into infrastructure project design, strengthening
communication networks and disaster management facilities at
all levels, protection of coastal areas, provision of enhanced
public health care services and assessment of increased burden of
disease due to climate change. The Action Plan also highlights
the role of Central Government, State Governments and local
bodies in putting in place appropriate delivery mechanisms and
building adequate capacity and knowledge in the relevant
institutions for effective adaptation and mitigation action.
Institutional Mechanism
The National Missions are to be institutionalized by the
respective Ministries and will be organized through inter-
sectoral groups. Appropriate mechanisms including public-
private partnerships and civil society actions will be devised, as
suited, for effective delivery of each individual Mission's
objectives. The work is to be coordinated by the Ministry of
Environment and Forests.
International Cooperation
National Action Plan looks forward to enhanced international
cooperation under the United Nations Framework Convention
on Climate Change. It renews India's pledge to play an active role
in multilateral cooperation in addressing climate change based
on the principle of 'Common but Differentiated Responsibilities
and Respective Capabilities'. The Action Plan acknowledges that
in the move towards a low carbon economy, technology has a
vital role to play. Models and mechanisms for technology
transfer will need to incorporate key elements such as
appropriate funding modalities and approaches, facilitative IPR
environment, and enhancing the absorptive capacity within
developing countries. Some reforms in the carbon market, such
as mainstreaming the bundling and programmatic CDM, also
need to be carried out multilaterally.
The Action Plan emphasizes that international cooperation
should aim at enhanced implementation of the UNFCCC by
minimizing the negative impacts of climate change through Eco-club guide delivering lecture on Environmental Protection and Conservation
Flood in Bihar
suitable adaptation measures, providing fairness and equity in
actions and measures, and ensuring concessional financial flows
from the developed countries and access to technology on
affordable terms.
India's National Action Plan on Climate Change will evolve on
the basis of new scientific and technical knowledge, and in
response to the evolution of the multilateral climate change
regime including arrangements for international cooperation.
§Climate Change 2001: The Scientific Basis – Contribution
of Working Group I to the Third Assessment Report of the
Intergovernmental Panel on Climate Change (IPCC),
Cambridge University Press, Cambridge, 2001
§India's Initial National Communications to the United
Nations Framework Convention on Climate Change 2002,
Ministry of Environment and Forests
§Indian Vision 2020, SP Gupta Committee Report. Planning
Commission, Government of India
§International Energy Outlook 2005, US Department of
Energy, Energy Information Administration of Government
of United States of America, 2005
§Intergovernmental Panel on Climate Change (2007).
Summary for Policymakers. Climate Change 2007:
Impacts, Adaptation and Vulnerability. Contribution of
Working Group II to the Fourth Assessment Report of the
Intergovernmental Panel on Climate Change
§IUCN, 2003a. Indus Delta, Pakistan: Economic Costs of
Reduction in Freshwater Flows. Case Studies in Wetland
Valuation No. 5, Pakistan Country Office, Karachi, 6 pp
§Kovats R. S., Campbell-Lendrumdh D. H., McMichael A.
J., Woodward A. and Coxj J. S. T. H. (2001). Early Effects of
Climate Change: do they include changes in vector-borne
diseases? Philos. Trans. R. Soc. B, Biol. Sci., 356,
1057–1068
§National Action Plan on Climate Change, 2008,
Government of India
§Ravindranath N. H. and Sathaye J. (2002). Climate Change
and Developing Countries, Kluwer Academic Publishers,
Dordrecht, Netherlands
§Rupa Kumar K. et al, (2005). High-resolution climate
change scenarios for India for the 21st century. Current
Science. Vol 90, 334–345
§Sathaye J., Shukla P. R. and Ravindranath N. H. (2006).
Climate Change, Sustainable Development and India:
Global and National Concerns. Current Science .Vol. 90(3),
314-325
§Summary for Policymakers. Climate Change 2007: The
Physical Science Basis. Contribution of Working Group I to
the Fourth Assessment Report of the Intergovernmental
Panel on Climate Change. Intergovernmental Panel on
Climate Change
REFERENCES
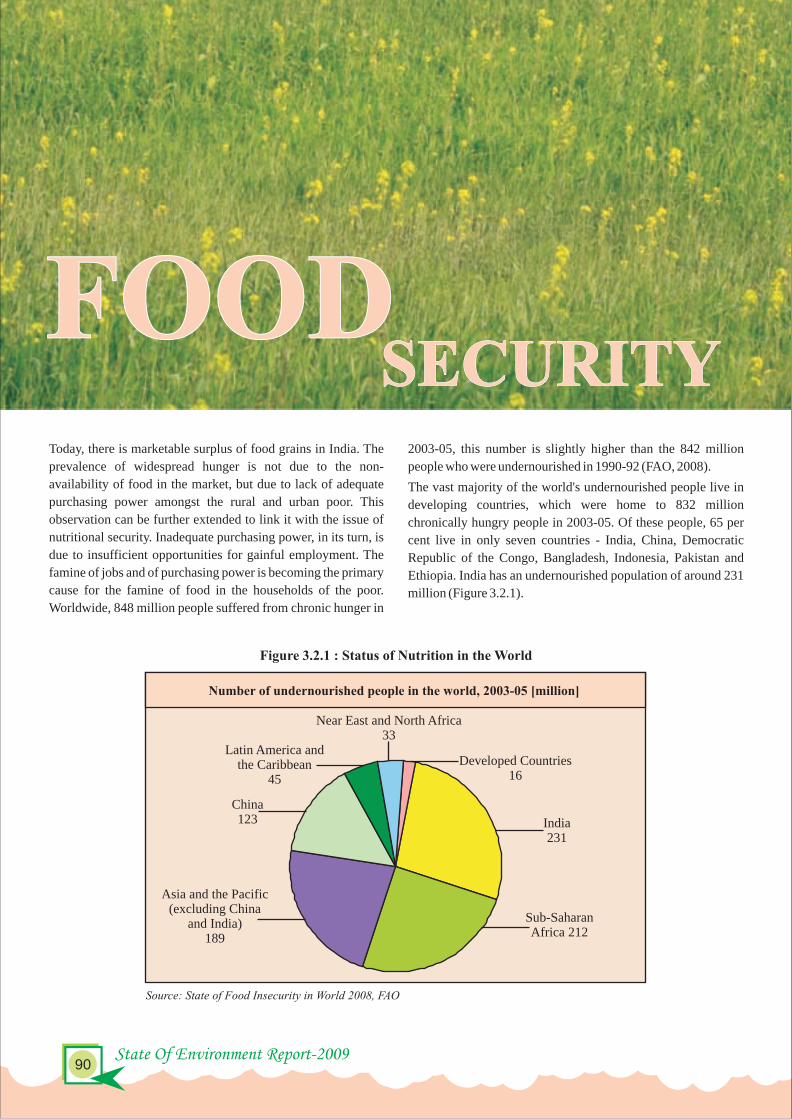
Key Environmental Issues-Food Security91
Today, there is marketable surplus of food grains in India. The
prevalence of widespread hunger is not due to the non-
availability of food in the market, but due to lack of adequate
purchasing power amongst the rural and urban poor. This
observation can be further extended to link it with the issue of
nutritional security. Inadequate purchasing power, in its turn, is
due to insufficient opportunities for gainful employment. The
famine of jobs and of purchasing power is becoming the primary
cause for the famine of food in the households of the poor.
Worldwide, 848 million people suffered from chronic hunger in
After registering impressive gains during 1990-92 and the mid-
1990s, progress in reducing hunger in India has stalled since
about 1995-97. The high proportion of undernourished in India
in the base period (24 per cent), combined with a high population
growth rate, means that India has had a challenging task in
reducing the number of undernourished. The increase in the
number of undernourished in India can be traced to a slowing in
the growth (even a slight decline) in per capita dietary energy
supply for human consumption since 1995-97. On the demand
side, life expectancy in India has increased from 59 to 63 years
since 1990-92. This has had an important impact on the overall
change in population structure, with the result that in 2003-05 the
growth in minimum dietary energy requirements had outpaced
that of dietary energy supply.
The combination of the declining per capita growth rate in total
dietary energy supply and higher per capita dietary energy
requirements resulted in an estimated 24 million more
undernourished people in India in 2003-05 compared with the
base period. The increased food needs of the ageing population
amount to about 6.5 million tonnes per year in cereal equivalent.
Nevertheless, the prevalence of hunger in India decreased from
24 per cent in 1990-92 to 21 per cent in 2003-05, marking a
progress towards meeting the MDG hunger reduction target.
The uncertainties of food security are linked to and compounded
by their vulnerability from the uncertainty of sustenance/
production, livelihoods, accessibility to health and education
services, etc. An important fact about hunger and food insecurity
in India is that the growth of the number of malnourished people
is in absolute terms rather than a percentage.
This fact makes the problem of food insecurity in India a
complicated one. It highlights the fact that hunger in India is not
necessarily a function of underproduction, bad monsoons or the
fall in buffer stocks. In fact, India today finds itself in a
paradoxical situation of having food grain stocks with the Food
Corporation of India (FCI) standing at an all time high of 63.1
million tonnes in July 2002 (Patnaik, 2003). This exceeds the
requirements for food security by about 20 million tonnes, yet
above 200 million people go hungry and about 50 million are on
the brink of starvation (Goyal, 2004). The existence of food
stocks above buffer requirements has not translated into
availability and in 2001, a per capita availability of 151 kg per
annum was lower than the level in the late 30s and around the
average for the time period corresponding to World War II,
which included the Bengal famine of 1943 (Patnaik, 2003).
Poverty
The National Sample Survey Organization (NSSO) constructed
three income groups - bottom, middle and top; for these groups
the per capita expenditure on cereal, non-cereal and total calorie
intake for the years 1970 to 1989, 1990 to 1998, 1998 to 2000
was estimated. For the bottom income group, expenditure on
cereals has fallen from 0.10 per cent per annum to -1.38; it is
worse for non-cereals where the expenditure has decreased from
2.81 per cent per annum to 0.96 per cent per annum. The figures
of different levels of poverty in the above study are useful:
Between 1993-94 and 1999-2000, the proportion of extremely
poor fell from 2.0 to 0.8, very poor from 11.7 to 8.2; moderately
poor from 22.1 to 18.3 and the 'poor' as defined by below poverty
line from 36.8 to 26.5 (Figure 3.2.2).
PRESSURES
2003-05, this number is slightly higher than the 842 million
people who were undernourished in 1990-92 (FAO, 2008).
The vast majority of the world's undernourished people live in
developing countries, which were home to 832 million
chronically hungry people in 2003-05. Of these people, 65 per
cent live in only seven countries - India, China, Democratic
Republic of the Congo, Bangladesh, Indonesia, Pakistan and
Ethiopia. India has an undernourished population of around 231
million (Figure 3.2.1).
Source: Compendium of Environment Statistics - India, 2007
Figure 3.2.2: Percentage of Population Below Poverty Line
0
10
20
30
40
50
60
1973
- 7
4
1977
- 7
8
1983
1987
- 8
8
1993
- 9
4
1999
- 0
0
2000
- 0
5
% o
f P
op
ula
tion
Year
Rural
Urban
Combined
State Of Environment Report-2009 90
FOODFOODSECURITYSECURITY
Near East and North Africa33
Developed Countries16
India231
Sub-Saharan Africa 212
Asia and the Pacific(excluding China
and India)189
China123
Latin America andthe Caribbean
45
Figure 3.2.1 : Status of Nutrition in the World
Source: State of Food Insecurity in World 2008, FAO
Number of undernourished people in the world, 2003-05 [million]

Key Environmental Issues-Food Security93
State Of Environment Report-2009 92
Predictably, the percentage of poor in rural areas is highest
amongst the agricultural labour, followed by the self-employed.
According to National Nutrition Monitoring Bureau (NNMB)
data, 37.4 per cent of adult females and 39.4 per cent of males
suffer from chronic energy deficiency. NSS data on poverty and
alternate estimates by other scholars concluded that poverty
reduction was less than 3 per cent between 1993-94 (50th NSS)
and 1999-2000 (55th NSS).
Undernutrition is particularly serious in rural areas, in the lower
wealth quintiles, among scheduled tribes and scheduled castes,
and among those without education.
Almost half the children under age five are stunted, or too short
for their age, which indicates that they have been
undernourished for some time. 20 per cent are wasted, or too thin
for their height, which may result from inadequate recent food
intake or a recent illness. 43 per cent are underweight, which
takes into account both chronic and acute undernutrition. More
than half the children under age five are underweight in Madhya
Pradesh, Jharkhand and Bihar.
Increased Food Consumption
The Indian food basket has changed drastically since 1973-74.
Both the expenditure on and the quantity of food consumed
indicate that the share of cereals in the food basket has decreased
in rural and urban areas, while the share of other items has
increased.
Energy derived from food has also decreased considerably. The
National Council of Economic and Applied Research’s
(NCEAR) estimate of nutrition for rural and urban areas is less
than NSSO’s estimates by 53 kCal. As one moves from poorer to
richer households, per capita consumption of cereals reaches a
plateau whereas in rural areas as one moves to better-off classes,
consumption increases. Consumption is dominated by rice and
wheat. Other cereals such as bajra, jowar, maize, barley and ragi
are consumed only in rural areas and that too in tiny amounts. Per
capita monthly expenditure in rural areas was Rs 399 of which
83 per cent was for cereals and 13.6 per cent for other food items.
The recommended daily intake of proteins is 60 gm per person
per day of which the rural areas get barely 60 per cent. This data
is for 1993-94. There is no reason to assume that the situation has
improved. The situation is far worse today with rising prices and
Children in rural areas are more likely to be undernourished, but
even in urban areas, almost two out of five children suffer from
chronic undernutrition. Girls and boys are equally likely to be
undernourished. Children's nutritional status in India has
improved slightly since NFHS-2 by some measures but not by all
measures. Children under age three (the age group for which
nutritional status data are available in NFHS-2) are less likely to
be too short for their age today than they were seven years ago,
which means chronic undernutrition is less widespread, but they
are slightly more likely to be too thin for their height, which
means acute undernutrition is still a major problem in India
(Figure 3.2.3).
low yields of pulses, the main protein source in India.
The 59th round of the NSS, concludes that for farming
households at the all India level, the average monthly per capita
consumption was Rs 503, less by Rs 9 for rural households as a
whole across regions and income groups. This was Rs 155 above
the rural poverty line of Rs 349 per capita per month in 2003. The
farming households spent Rs 278.74 on all food items as against
Rs 298.57 for all rural households. Except for cereal
consumption, farming households' consumption of other food
items like pulses, vegetables, fruits, eggs, fish and meat was
consistently lower than that of rural households in general.
Food Prices - Main Concern
Income growth, climate change, high energy prices,
globalization, and urbanization are converging to drive food
prices higher, threatening livelihoods and nutrition of poor
people in the developing countries, says a new report from the
International Food Policy Research Institute (IFPRI).
"Food prices have been steadily decreasing since the Green
Revolution, but the days of falling food prices may be over," said
Joachim von Braun, lead author of the report and director general
of IFPRI. "Surging demand for feed, food, and fuel have recently
led to drastic price increases, which are not likely to fall in the
foreseeable future, due to low stocks and slow-growing supplies
of agricultural outputs. Climate change will also have a negative
impact on food production, compounding the challenge of
meeting the global food demand, and potentially exacerbating
hunger and malnutrition among the world's poorest people.”Food security is vital for human sustenance
Source: NFHS-3, 2005-2006
Figure 3.2.3: Trends in Children's Nutrition Status in India
0
10
20
30
40
50
60
Stunt
ing
(low
hei
ght f
or ag
e)
Was
ting(
low
weight
for
heig
ht)
Und
erw
eigh
t(low
wei
ght f
or ag
e)
NFHS-2 NFHS-3
5145
20 23
4340
Per
cen
tage
of
chil
dre
n u
nde
rag
e th
ree
year
s
Source: Food Corporation of India, 2007
Table 3.2.3: Minimum Support Price the Last Five Years (2002-03 to 2006-07)
(Rs. Per Quintal) of Wheat/ Paddy for
Common Grade 'A'
2002-03 620530
+*20.00560
+*20.00
2003-04 620
+*10.00550 580
2004-05 630 560 590
2005-06 640 570 600
2006-07650.00
+50.00(Bonus) 580.00
+40.00(Bonus) 610.00
+40(Bonus)
Marketing year Wheat ( rabi )Paddy (kharif)
Note : - * Drought relief announced by the Govt. of India
Table 3.2.1: Comparison of Poverty Estimates Based on Uniform Recall Period
Source: Planning Commission of IndiaAnnual Report 2007-2008,
1993-94 2004-05
Rural 37.3 28.3
Urban 32.4 25.7
Total 36.0 27.5
(%) (%)
Table 3.2.2: Comparison of Poverty Estimates Based on Mixed Recall Period
Source: Planning Commission of IndiaAnnual Report 2007-2008,
1999-2000 2004-05
Rural 27.1 21.8
Urban 23.6 21.7
Total 26.1 21.8
(%) (%)

Key Environmental Issues-Food Security95
State Of Environment Report-2009 94
Economic growth in India is changing the spending patterns and
consumer preferences from staple crops to resource intensive
processed food and high-value agricultural products, including
vegetables, fruits, meat, and dairy. Surging demand for biofuels
as an alternative energy source are further pressurizing food
prices. It lists four dimensions in the characterization of food
security:
(i) the ability to improve and maintain the level of acquirement;
(ii) the ability to cope with shocks;
(iii) the ability to improve and maintain the level of utilization
and;
(iv) the ability to cope with shocks to the utilization.
Land Degradation
Permanently degraded lands are growing at an annual rate of
6 Mha. globally, affecting the livelihoods of millions of people,
concentrated mainly in the developing and poor countries. Land
degradation seriously undermines the livelihood opportunities,
thus leading to poverty, migration and food insecurity.
In India, erosion rates are reported to be in the range of 5 to 20
tonnes/hectare (up to 100 tonnes/hectare). Nearly 150 Mha. are
affected by water erosion and another 18 Mha. are affected by
wind erosion annually in India. Thus, erosion leads to
impoverished soil on one hand, and silting up of reservoirs and
tanks on the other. This degradation induced source of carbon
emissions also contributes to far reaching global warming
consequences. If the current production practices are continued,
India will face a serious food shortage in the near future. 65 per
cent of arable land in India is rainfed and the increasing demand
for food and feed has to be met with the increased production in
the rainfed areas, as there is very little scope for expansion of
cultivable area or irrigation facilities.
At present, approximately 68.35 Mha. of land is lying as
wasteland, of this approximately 50 per cent is non-forest land
which can be made fertile again if treated properly. Rajasthan has
the highest component of degraded land, followed by Madhya
Pradesh, Maharashtra, Uttar Pradesh, Gujarat, Andhra Pradesh
and Karnataka.
Where land has been subjected to light or moderate degradation,
the same level of inputs will give lower outputs. These may be
reduced crop yields or lower livestock production. Relatively
little data is available on reduction in production as a result of
water and wind erosion.
Fragility of Agriculture
With respect to agricultural production, there are wide
fluctuations, but an overall downward trend exists, including
some negative patches, the only exception being 2003-04, when
favourable monsoon was witnessed. However, the growth rate
dipped again to 0.7 per cent in 2004-05 (India budget 2006). The
advanced estimates of national income released by the Central
Statistical Organization (CSO) in February 2006, give the figure
of 2.3 per cent for agriculture and allied sectors’ growth.
Although India accounts for 21.8 per cent of the global paddy
production, our yields are less than those in most countries
(Table 3.2.4).
The decline in the agriculture dependent portion of the
population has been modest, from 73.9 per cent in 1972-73 to
60.2 per cent in 2000. The relative productivity of agriculture is
less than one fourth of that in non-agricultural sector. The yield
of food crops and non-food crops over the years depict that crop
production in general has suffered. The dominance of wheat and
rice among food crops and lower importance given to other so-
called coarse cereals has several implications – lower area under
these crops, lower production, and shift in consumption to more
rice and wheat and the declining importance of traditional coarse
cereals in the national policy.
The increase in the yield per hectare for rice, wheat and coarse
cereals in the past 50 years is around 200 per cent, but the
difference lies in absolute numbers; rice yield was 2,051 kg per
ha and for wheat the yield was 2,707 kg per ha whereas for coarse
cereals it was 1,228 kg per hectare. In terms of production of food
grains, the index moved up till the 1990s but after 2000, it
became negative. As for yields per hectare, improvements lasted
only till the beginning of 2000. There is a significant rise over the
entire period from the early decades in the area under cultivation
and production of non-food crops, thereby pointing to an
Two years old restored site at Corbett Tiger Reserve after eradication of Lantana
Bamboo Seedlings
Source: Central Statistical Organisation, 2007
Table 3.2.4 : Average Annual Growth (%)in Agriculture Sector
Five Year Plan Overall GDPGrowth Rate
(at Constant Prices)
Agriculture andAllied Sectors
Seventh Plan (1985-1990)
Annual Plan (1990-92)
Eighth Plan (1992-97)
Ninth Plan (1997-2002)
Tenth Plan (2002-07)
2002-03
2003-04 (P)
2004-05 (Q)
2005-06 (A)
6.0
3.4
6.7
5.5
3.8
8.5
7.5
8.1
3.2
1.3
4.7
2.1
-6.9
10.0
0.7
2.3
P: Provisional, Q: Quick estimates, A: Advance estimatesNote: Growth rates prior to 2001 based on 1993-94 prices and from 2000-01onwards based on new series at 1999-2000 prices.
Crops 1999-2000* 2000-01 2001-02 2002-03 2003-04 2004-05 2005-06 2006-07 2007-08
Rice 17.96 -5.53 8.96 -29.96 18.65 -6.50 9.43 1.67 3.45Wheat 34.73 -9.60 4.25 -10.66 8.81 -5.11 1.02 8.52 3.51CoarseCereals
-14.61 2.41 6.86 -28.00 31.61 -12.37 1.76 -0.41 16.76
Total 19.46 -5.73 6.89 -21.89 17.56 -7.05 5.11 3.88 5.99Pulses 4.17 -21.23 17.20 -20.13 25.50 -13.56 1.94 5.70 3.79
Total Food grains
18.47 -6.60 7.54 -21.73 18.13 -7.48 4.91 3.99 5.85
* Decadal change over 1989-90
Source: Ministry of Agriculture, 2009
Table 3.2.5: Percentage Change in Production of Food Grains
Year Area Percentage change
Production Percentage change
Yield Percentage change
Weights 62.92
1949-50 78.0 NA 51.5 NA 70.3 NA1959-60 91.5 14.8 64.9 20.6 75.6 7.01969-70 97.3 6.0 81.6 20.5 87.5 13.61979-80 98.5 1.2 87.5 6.7 88.7 1.41980-81 99.8 1.3 104.9 16.6 105.1 15.61989-90 99.9 0.1 139.1 24.6 135.5 22.4
1999-2000 97.0 -3.0 169.7 18.0 159.8 15.22000-01 95.4 -1.7 158.4 -7.1 152.8 -4.62001-02 96.7 1.3 172.5 8.2 164.1 6.92002-03 89.7 -7.8 140.4 -22.9 143.2 -14.62003-04 97.3 7.8 172.0 18.4 165.3 13.42004-05 94.6 -2.9 159.9 -7.6 156.5 -5.62005-06 95.8 1.3 169.2 5.5 162.3 3.62006-07 97.5 1.7 175.9 3.8 180.4 10.02007-08 97.7 0.2 186.8 5.8 191.1 5.6
Table 3.2.6: Index Numbers of Area, Production and Yield of Food Grains in India
Source: Ministry of Agriculture, 2009
Base: Triennium ending 1981-82= 100NA: Not Available

Key Environmental Issues-Food Security97
State Of Environment Report-2009 96
§The percentage of grazing land has come down over the
years, though the decline in forest area is not apparent. The
change in the net sown area is surprisingly negative in the
past five years in some states like Karnataka and Tamil
Nadu, perhaps because prime agricultural land has been
shifted for non-agricultural uses. Cropping intensity and
irrigation intensity have been increasing continuously.
Cropping pattern has been diversified to include non-food
crops. Land degradation has been fairly high in Gujarat and
Nagaland. In some of the North-Eastern States, wasteland
is as high as 50 per cent of the total geographical area.
§The ratio of rainfall to half of the potential evapo-
transpiration shows that, in states such as Orissa, Bihar and
Uttar Pradesh, two crops may be grown with the available
rainwater. However, better utilization of rainwater for crop
growth requires moisture conservation techniques. This
aspect needs further research. Smaller rivers show more
utilization levels, close to 100 per cent. Watersheds of river
basins have degraded considerably, leading to a decline in
the water flow.
§Groundwater exploitation has increased in the past decade,
reaching dangerous levels of over-exploitation in states like
Punjab, Haryana and Tamil Nadu. There is an urgent need to
control this situation.
§Though the forest cover appears to have increased
marginally in recent years, fruit crops and plantations have
encroached on forest land. It is important to conserve prime
forests.
§The increase in air and water pollution from chemicals and
greenhouse gases has been causing a decline in agricultural
production in recent years. Climate change is projected to
have adverse effects, particularly in developing countries,
and, in the case of India, the impact is expected to be severe
in the coastal areas. Fluctuations in rainfall may increase,
causing floods and droughts more often than before. These
will have negative impact on agricultural production.
§There is a large scope for improvement in agricultural
yields, given the variations across states in natural resource
endowments and adoption of technology. Market forces
influence the use of natural resources. In India, though input
and output prices are instrumental in determining the total
agricultural production, there are a number of other non-
price factors that play an important role.
§Strategies for sustainable livelihoods will have to be
chalked out for each State to achieve the path of sustainable
food production and sustainable livelihood security.
Poverty alleviation, by using the existing natural resource
potential, is the key issue for Madhya Pradesh. Similarly,
the requirements of Orissa, and to some extent Bihar, are
increasing land productivity, diversification of agriculture,
improving infrastructure and basic amenities, and
providing market linkages. Removing pressure on land and
water and conserving natural resources for sustainable
decades. Commercial crops have recorded a huge increase, most
prominently for tea, sugar-cane and to a lesser extent, coffee.
Unfortunately the yield of these export crops is also slowing
down and decreasing in the post 2000 period.
Rice production shot up from around 20 million tonnes in the
early 1950s to almost 90 million tonnes in 1999-2000 and 93.34
million tonnes in 2001-02. Not only has the production of rice
and wheat reached a plateau but has even declined in absolute
numbers. Production of coarse cereals doubled in the five
There are many factors limiting agricultural production, like the
availability of energy, decreasing fertilizer response, limitation
in terms of the genetic improvement of crops, degradation of the
resource base, dependence on monsoon for irrigation, floods and
drought.
Climate Change
Changing rainfall patterns are likely to affect India’s food
security. Extreme events, such as droughts, torrential rains, flash
floods, cyclones and forest fires could become more common. In
the past fifty years, there have been around 15 major droughts,
due to which the productivity of rainfed crops in drought years
was adversely affected.
Floods are another major cause of food emergencies. Sharp
seasonal differences in water availability can also increase food
insecurity. In India, more than 70 per cent of annual rainfall
occurs during the three months of the monsoon, when most of it
floods out to sea. Farmers who lack irrigation facilities must
contend with water scarcity through much of the year and also
the threat of crop failures when the monsoons fail.
Climate change over the long-term, in particular global
warming, could affect agriculture in a number of ways - the
majority of which would threaten food security for the world's
most vulnerable people:
§The overall predictability of weather and climate would
decrease, making planning of farm operations more
difficult.
§Climate variability might increase, putting additional stress
on the fragile farming systems.
§Climate extremes, which are almost impossible to plan for,
might become more frequent.
§The sea level would rise, threatening valuable coastal
agricultural land, particularly in low lying small islands.
§Biological diversity would be reduced in some of the
world's most fragile environments, such as mangroves and
tropical forests.
§Climatic and agro-ecological zones would shift, forcing
farmers to adapt, and threaten natural vegetation and fauna.
§The current imbalance of food production between cool and
temperate regions as well as tropical and sub-tropical
regions could worsen.
§Distribution and quantities of fish and seafoods could
change dramatically, wreaking havoc in established
national fishery activities.
§The percentage decadal growth rate of the population varies
widely between the states. However, the density of
population has increased over the decades to exert pressure
on our natural resources. The total fertility rate in some
states like Kerala, Tamil Nadu and Goa is below the
replacement level, whereas in Meghalaya and Bihar it is
above four percentage points.
STATE
Box 3.2.1: ‘Our Agriculture is in Doldrums’
Recent data on lower consumption of food and diversion to non-food items is an expression of the financial squeeze the poor
face in the light of lower incomes, due to poor returns from agriculture, and inadequate availability of critical pubic services,
especially in health and education. This forces the poor to forgo food to meet other urgent requirements. From a pre-reform
growth rate of output 2.51 per cent, input 2 per cent and value added for agriculture 2.62 per cent, the post-reform growth
figures are: output 1.69 per cent, input 1.84 per cent and value added 1.85 per cent. The anti-agriculture bias in policy is clear
[Chand 2006]. Both the share in gross cultivated area under foodgrains and value added have been on the decline. Inevitably
farmers' income reflect this sorry state. According to Chand, the growth rate of average income per worker has declined from
0.696 in the late 1970s and early 1980s to 0.29 in 2003-04.
There was a decline in the share of agriculture's capital formation in GDP from 2.2 per cent in late 1990s to 1.7 per cent in
2004-05. Some reversal has taken place in 2005 when the share of public investment in gross investment rose to 29.2 per cent
in 2004-05. This enhancement is expected to help towards agricultural diversification, agricultural marketing, strengthening
national schemes for repair and maintenance and restoration of water bodies.
Psychotria henryana : an indigenous species

Key Environmental Issues-Food Security99
State Of Environment Report-2009 98
of poverty has also fallen, but a lot still needs to be done as,
according to a 2000 National Sample Survey, more than 25 per
cent of the population still lives below the poverty line.
The challenge that stares the government in the face is fully
implementing the TPDS and making it accessible to the
deserving groups. It also has to develop effective social security
nets for vulnerable population groups, especially during
moments of crisis such as droughts, earthquakes or cyclones.
Food security implementation can also be tied to other
development projects on health, employment and education. To
meet these demands, a large number of voluntary organizations
are aiding the government in providing assistance and in
developing networks and models for effective food and
nutritional security. Food security is an important step towards
national economic development as no country can prosper if
one-fourth of its people have to worry about where their next
meal will come from.
National Food Security Mission
The National Food Security Mission has been launched recently
as a centrally sponsored scheme. The objective is to increase
production and productivity of wheat, rice and pulses on a
sustainable basis so as to ensure food security of the country. The
approach is to bridge the yield gap in respect of these crops
through dissemination of improved technologies and farm
management practices. It is envisaged to focus on districts which
have high potential but relatively low level of productivity
performance at present. There will be a series of programmatic
interventions, efforts to reach resource-poor farmers and
continuous monitoring of various activities. Panchayati Raj
institutions will play a central role, not only in selection of
beneficiaries and identifying priority areas but also in the entire
gamut of activities of the Mission. A strong component of project
management and monitoring and evaluation will steer the
scheme for achieving the Mission's objectives.
The National Food Security Mission has three components :
(i) National Food Security Mission - Rice (NFSM-Rice)
Scope of the Food Bank has been expanded beyond emergencies.
The Bank would act as a regional food security reserve for the
SAARC member countries during normal time food shortages
and emergencies. The Agreement contains broad principles for
determination of price. The prices, terms and conditions of
payment in respect of the food grains would be the subject of
direct negotiation between the concerned member countries
based on the guidelines for price determination to be approved
by the Food Bank Board periodically. The Agreement sought to
rationalize and improve the provisions on the procedures for
withdrawal and release of food grains. It delineates the role of
the Board to administer functioning of the Food Bank and its
policymaking, distinct from the designated Nodal Point(s)
responsible for transacting the entire business at the national
level related to operations of the Food Bank.
Organic Farming - A Possible Solution to ensure
Economically Sustainable Agriculture
Organic agriculture is one among the broad spectrum of
production methods that are supportive of the environment.
Organic production systems are based on specific standards
water supply are essential in Tamil Nadu and restoration of
forests and protection of natural resources in Andhra
Pradesh, Rajasthan, and Gujarat.
India's food security policy was crafted with an aim to attain food
self-sufficiency by making basic food grains available to all its
citizens at affordable prices. To make this possible and to oversee
its implementation, the Food Corporation of India (FCI) was set
up under the Food Corporations Act 1964. The FCI procures
food grains from farmers at the government declared Minimum
Support Price (MSP), which is a long-term guarantee to ensure
minimum production, stocks them in its warehouses, and then
makes them available at affordable rates to the people through
the Public Distribution System (PDS), which was restructured
into the Targeted Public Distribution System (TPDS) in 1997, at
an issue price, which is different for those above and below the
poverty line.
Besides the TPDS, the government has implemented numerous
other programmes aimed at food security, which include the
Integrated Child Development Scheme (ICDS) for providing
nutrition and healthcare services to children and pregnant
women, the Antyodaya Anna Yojana for providing affordable
food to Below Poverty Level (BPL) households, and the Mid-
day Meal Scheme.
At the same time, the government has been suppressing market
prices through extensive restrictions and pricing controls on the
free trade in foodgrains, and by providing input subsidies to
farmers, such as on water, power and fertilizers to compensate
for that.
Over the years following independence, India has successfully
been able to transform itself from a foodgrain importing country
to a food self-sufficient country with adequate buffer stocks to
see itself through a year or two of drought. The general incidence
MEASURES TO ENSURE FOOD
SECURITY
Man ploughing an agriculture field
Table 3.2.7 : Assessed Shares of Food Grains for the SARRC Food Bank
Source: South Asian Association for Regional Coorporation, 2007
Shares of food grains forthe reserve
(in metric tonnes)
Afghanistan ------*
Bangladesh 40,000
Bhutan 180
India 1,53,200
Maldives 200
Nepal 4,000
Pakistan 40,000
Sri Lanka 4,000
Total: 2,41,580*
Member Country
* Assessed share of Afghanistan is to be decided by the First Meeting of the SAARC Food Bank Board and reflected accordingly in this Schedule
(ii) National Food Security Mission - Wheat (NFSM-Wheat)
(iii)National Food Security Mission - Pulses (NFSM-Pulses)
The National Food Security Mission (NFSM) is currently
running in 17 States of the country including Andhra Pradesh,
Assam, Bihar, Chhattisgarh, Gujarat, Haryana, Jharkhand,
Karnataka, Kerala, Madhya Pradesh, Maharashtra, Orissa,
Punjab, Rajasthan, Tamil Nadu, Uttar Pradesh, and West Bengal.
The SAARC Food Bank
The Agreement on Establishing the SAARC Food Security
Reserve came into force on 12 August 1988. It had a Reserve of
2,41,580 tonnes of food grains (a combination of rice and wheat)
(Table 3.2.7). However, the Reserve was not utilized despite the
SAARC member states suffering food emergencies. As such, the
question of the non-operationalization of the Reserve remained a
subject of concern for the Association. It was, therefore, felt
necessary to evolve mechanisms to make the SAARC Food
Security Reserve operational.
In view of the emerging global situation of reduced food
availability and a worldwide rise in food prices, a meeting of the
Agriculture Ministers of the SAARC member states was held in
New Delhi, India in November 2008, to evolve and implement
people-centred short to medium term regional strategy and
collaborative projects that would, among others, lead to:
§Increase in food production;
§Investment in agriculture and agro-based industries;
§Agriculture research and prevention of soil health
degradation;
§Development and sharing of agricultural technologies;
§Sharing of best practices in procurement and distribution;
and
§Management of the climatic and disease-related risks in
agriculture.
This will also emphasize on early drawing up of the SAARC
Agriculture Perspective 2020.
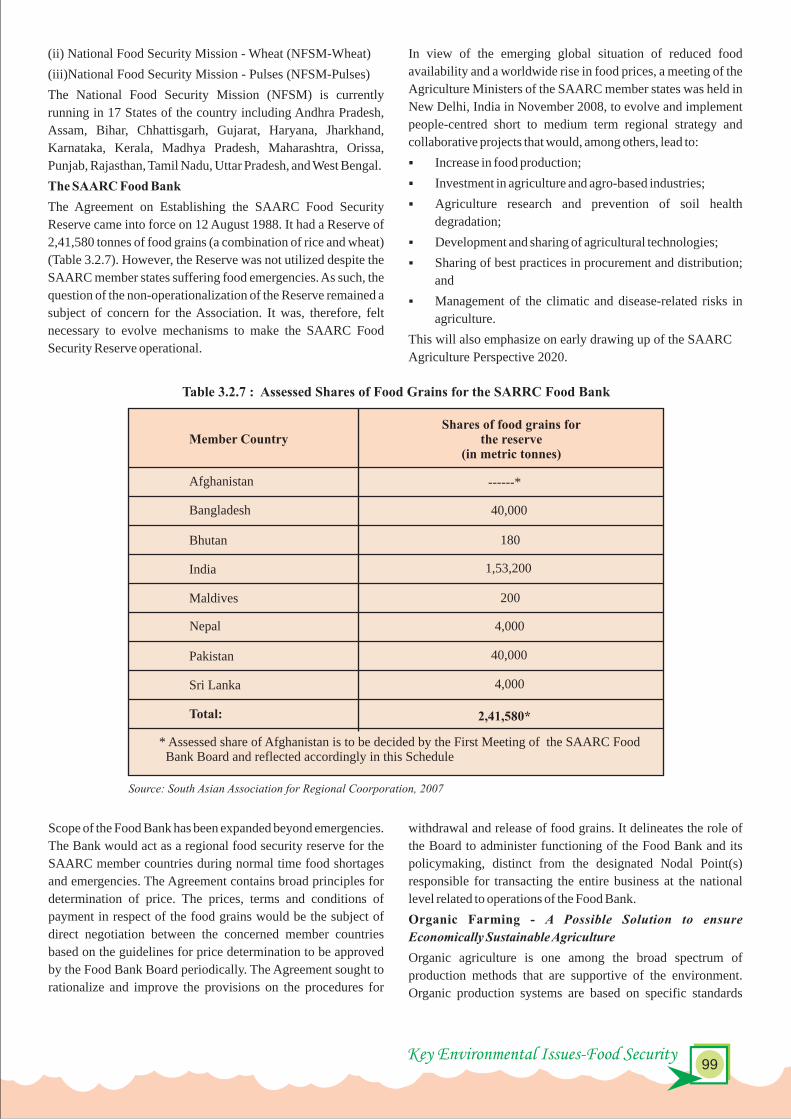

Key Environmental Issues-Food Security101
State Of Environment Report-2009 100
precisely formulated for food production and aim at achieving
agro ecosystems, which are socially and ecologically
sustainable. It is based on minimizing the use of external inputs
through the use of on-farm resources efficiently, as compared to
industrial agriculture. Thus, the use of synthetic fertilizers and
pesticides is avoided.
The strongest feature of organic agriculture is its reliance on
fossil-fuel free and locally-available production assets and
working with natural processes, which increases cost-
effectiveness and resilience of agro-ecosystems to climatic
stress.
As per a Food and Agriculture Organization (FAO) study of mid
2003, India had 1,426 certified organic farms producing
approximately 14,000 tonnes of organic food/products annually.
In 2005, as per the Govt. of India figures, approximately
1,90,000 acres (77,000 hectares) were under organic cultivation.
The total production of organic food in India as per the same
reference was 1,20,000 tonnes annually, though this largely
included certified forest collections.
In India, a common problem faced by organic farmers is the lack
of a ready market and often unremunerative prices for their
produce. In many cases, the farmer does not receive timely
payments from middlemen, including organic food traders.
Buyers of organic food, on the other hand, face difficulty in
sourcing organic produce, at least at reasonable prices. Supplies
are often erratic or unreliable, and in some cases, buyers cannot
§Goyal P. (2004). Food Insecurity in India. The Hindu, 11
March 2004
§M S Swaminathan Research Foundation (MSSRF) (2004).
Food Insecurity Atlas of Urban India report of the MSSRF
and World Food Programme (WFP)
§National Family Health Survey-3 (2005-06), Ministry of
Health & Family Welfare
§National Food Security Mission 2007,Ministry of
Agriculture
§Prakash S. Shetty. (2002). Nutrition transition in India -
Nutrition Planning, Assessment and Evaluation, Food and
Nutrition Division, Food and Agriculture Organization of
the United Nations, Via delle Terme di Caracalla, I-00100
Rome, Italy
§Patnaik U. (2003). Food Stocks and Hunger: Causes of
Agrarian Distress. Social Scientist, Vol 32. No.7-8, 15-41
§State of Food Insecurity in World 2008, Food and
Agriculture Organization
§South Asian Association for Regional Cooperation
§Vittal K. P. R., Vijayalakshmi K. and Rao, U. M. B. (1990).
The Effect of Cumulative Erosion and Rainfall on Sorghum,
pearl Millet and Castor Bean Yields under Dry Farming
Conditions in Andhra Pradesh, India. Experimental
Agriculture,26: 429-39
be sure whether the produce is indeed organic.
The spread of organic and agro-ecological farming (OF)
methods in developing countries has raised a debate on whether
its large scale adoption will increase or decrease global food
security. This will, however, depend on a number of socio-
economic factors, together with the relative yield levels of
various conventional farming systems. Relative yields again
depend on a number of agro-ecological factors and the
characteristics of farming systems before conversion.
In areas with intensive high-input agriculture, conversion will
most often lead to a reduction in crop yields per ha by 20-45 per
cent in crop rotations, integrated with leguminous forage crops.
In many areas with low input agricultural systems, farmers have
little incentive or access to use the chemical fertilizers and
pesticides, and yields may increase when agro-ecological
principles are introduced.
1. Population stabilization
2. Boosting agriculture science and technology. Eventually,
rising agricultural productivity will drive economic growth
3. Securing property rights and access to finance
4. Encouragement of child-friendly village/town movement
5. Land resources conservation and enhancement
RECOMMENDATIONS
6. Establishment of a water security system
7. Management of forests and preservation of biodiversity
8. Atmosphere and climate management
9. Administration of common property resources
10. Sustainable intensification and diversification of farming
systems and value-addition
11. Formation of a State Coalition for Sustainable Food
Security
12. Conflict prevention and resolution mechanisms, and
democracy and governance based on principles of
accountability and transparency in public institutions and
the rule of law to empower the vulnerable members of
society.
§Land degradation in south Asia: Its Severity Causes and
Effects upon the People. (1994). Food and Agriculture
Organization
§Food Security in the Changing Global Climate. In the
conference proceedings for The Changing Atmosphere:
Implications for Global Security, 27-30 June 1988, in
Toronto, Canada, 167-192. WMO-No. 170. Geneva: World
Meteorological Organization
REFERENCES
Organic Farming : Taking a Green U-turn Paper making from waste cloth rags : A sustainable livelihood

Key Environmental Issues-Water Security103
State Of Environment Report-2009 102
WATERWATERSECURITYSECURITY
view of the constraints of topography, uneven distribution over
space and time, water storage technologies, and inter-state
issues, the total utilizable quantity of water is estimated to be
1,122 bcm/year, of which 690 bcm and 431 bcm are utilizable
surface and groundwater, respectively.
Current and Future Water Requirements
In 1990, the total water withdrawal was estimated at 552 bcm i.e.
30 per cent of the country's renewable water resources (1869
bcm). The contribution from surface water was 362 bcm, while
the groundwater withdrawal was estimated at 190 bcm.
Approximately 460 bcm was used for irrigation while 25 bcm
was used for domestic needs. About 19 bcm and 15 bcm were
used for energy and industrial purposes respectively.
Currently, more than 80 per cent of the 750 bcm water used in
India is for irrigation. The balance 20 per cent is used to meet
domestic, energy, industrial and other requirements.
With the rapidly growing population, along with industrial and
urbanization activities, the demand for water is expected to
increase even faster. Estimates indicate that by the year 2025,
the total water demand of 1050 bcm will be very close to the total
utilizable water resources of 1,122 bcm in the country. Though
projections are not available beyond 2025, it is evident that the
country may have to face an acute water crisis unless clear and
strategic measures are adopted now.
It is pertinent to note that more attention is also required to
scientifically assess the water requirements for ecosystems
security. Today, approximately 40 per cent (748 bcm) of
available water resources is considered to be unutilizable due to a
variety of factors. Probably, this is a blessing in disguise since
that water must be catering to the requirements of the
ecosystems.
Temporal Challenge
Almost 80 per cent of the rainfall occurs in the four monsoon
months from June to September. Even within these four months,
most of the rainfall occur as few spells of intense rain. It is
estimated that in Himalayan rivers, where there is some flow due
to snowmelt also, about 80 per cent of the total annual flow takes
place within these four monsoon months. In peninsular rivers,
where there is no contribution from snowmelt, monsoon flow
accounts for more than 90 per cent of the annual flow.
In this context, retention and storage of water becomes
imperative. More important is the scale at which retention or
storage activities are undertaken. Large dams have their fair
share of adverse social and environmental impacts, besides
causing conflicts between riparian States. In today's context,
large storage structures may be attempted only after their
benefits are weighed carefully against their social and ecological
costs.
On the other hand, the country has large numbers of traditional
water harvesting structures. Unfortunately, most of them are
dilapidated, silted or have been encroached upon due to the
breakdown of the traditional community-based management
systems and neglect by the concerned departments.
Revival of these traditional water harvesting structures, coupled
with modern watershed management systems including large
scale afforestation and regeneration of degraded lands (covering
30 per cent of the country), small structures like check dams,
gully plugs and other systems can significantly enhance the
surface water retention and storage capacity and also recharge
the groundwater aquifers.
Spatial Challenge
Precipitation in India is not uniformly distributed and varies
from less than 100 mm/year in Rajasthan to more than 2,500
mm/year in Assam. Consequently, despite the current
availability, water is not evenly distributed or used around the
country. Brahmaputra and Barak basin, with 7.3 per cent of the
geographical area and 4.2 per cent of the country's population,
have 31 per cent of the annual water resources.
Water security is emerging as an increasingly important and vital
issue for India. Many Indian cities are beginning to experience
moderate to severe water shortages, brought on by the
simultaneous effects of agricultural growth, industrialization
and urbanization. Another concern in the region is the growing
competition over shared water resources. These shortages would
be further aggravated by receding of glaciers and dwindling
fresh water resources.
Water stress is likely to be a major impact of climate change, with
flows of some of India's major rivers such as the Indus and
Brahmaputra projected to fall by as much as a quarter. Conflict
over freshwater resources can strain relationships between
various states sharing these resources. In the future, diminishing
and degraded freshwater resources could lead to internal
instability in the country.
The two main sources of fresh water in India are rainfall and the
snowmelt of glaciers in the Himalaya. Although reliable data on
the snow cover in India is not available, it is estimated that some
5,000 glaciers cover about 43,000 sq. km in the Himalayas with a 3total volume of locked water estimated at 3,870 km .
Considering that about 10,000 sq. km of this is located in Indian
territory, the total water yield from snowmelt contributing to the 3river run-off in India may be of the order of 200 km /year .
India receives an average annual precipitation of approximately
4,000 bcm in the form of rainfall and snow. After accounting for
percolation, evaporation and other losses, less than 50 per cent
(1,869 bcm) is the total surface flow, including regenerating flow
from groundwater and the flow from neighbouring countries. In
WATER AVAILABILITY
Catchment Area : An important element of watershed management
Box 3.3.1: Water Needs of Ecosystems
The water needs of ecosystems are not always recognized, since many people do not regard water for eco-systems as a social
and economic use. Yet, access to fresh water is an indisputable need for the maintenance and functioning of valuable
ecosystems and landscapes in which human activities are an integral part. Ecosystems are also important in securing human
health, because they provide services that are fundamental to our life support systems – such as pest control and detoxification
and decomposition of waste. They contribute to the production of food (crops and fish), medicines and other goods. They
provide water treatment, recreation and waterway transport. Also, terrestrial ecosystems help balance rainwater infiltration,
ground water recharge and river flow regimes.
Accelerating population growth and unsustainable consumption and production patterns have increased the demand for water.
In the greater competition for water, ecosystems and biodiversity tend to be the losers. But people are the losers too. Activities
that reduce biodiversity jeopardize economic development and human health through losses of useful materials, genetic
stocks, and potential medicines. As ecosystems and biodiversity get degraded, their ability to lend resilience to the biosphere
declines, and communities and human health suffer. The decline in the quantity and quality of water flow has reduced the
productivity of many terrestrial, aquatic, and coastal zone ecosystems and led to loss of biodiversity. In remote areas, the
degradation of ecosystems has devastated fishing, agriculture, and grazing and undermined the survival potential of rural
communities relying on these activities.
Source: World Water Council & Earthscan

Key Environmental Issues-Water Security105
State Of Environment Report-2009 104
over 30 per cent of the total cropland is under irrigation. While
irrigation is vital for increasing crop yields, it can also be
extremely dangerous when mismanaged and could result in
erosion, water-logging and salinization of the soil, rendering it
less productive or uncultivable. Poorly managed irrigation can
also result in water pollution and spread of water-borne diseases.
growing population, there will be greater demands placed on the
region’s water supply. Requirement is likely to increase in future
as agriculture is extremely dependent on adequate freshwater
supply.
About half of the water that is used for irrigation is lost to seepage
and evaporation. Irrigation is also a major concern for India as
3 Against a national per capita annual availability of 2,208 m of
water, the average availability in Brahmaputra and Barak is as 3 3 high as 16,589 m , while it is as low as 360 m in the Sabarmati
basin. The per capita annual water availability for the rest of the
country, excluding Brahmaputra and Barak basin, works out to 3 about 1,583 m (Figure 3.3.1).
3 Water availability less than 1,000 m per capita is considered by
international agencies as indicating scarcity conditions.
Cauvery, Pennar, Sabarmati, east flowing rivers and west
flowing rivers are some of the basins with scarcity conditions.
In majority of river basins, current utilization is significantly
high and is in the range of 50-95 per cent of utilizable surface
resources. But, in rivers such as Narmada and Mahanadi,
percentage utilization is only 23 and 34 per cent respectively. In
several basins, there is also an overdrawal of groundwater
leading to lowering of groundwater tables and even salt water
incursions. 3If the average national per capita availability of 2,000 m is to be
maintained, given the bourgeoning population, the only river in
North India with significant surplus water to meet future needs
of the country is the Brahmaputra. Since Bangladesh also draws
water from this river, it may not be easily possible to tap its full
potential. In peninsular India, the Godavari, Brahmani,
Mahanadi and Narmada, besides regions of Tapti and Tadri may
have surplus water. Inter-linking of rivers has been proposed to
address the spatial challenge of water availability. Besides its
questionable techno-economic feasibility, the associated
ecological damages of river linking may be irreversible.
While at the country level, there may not appear to be an
immediate problem of water availability, several basins (e.g.
Sabarmati) are already under severe stress and face scarcity
Rapid Industrial Growth
Another important factor that influences the state of water
security in India, is the extent of industrialization. In India, the
maximum utilization was 5 per cent in 2000 (FAO 2000).
Industrial activity requires large amounts of freshwater for
activities such as boiling, cleaning, air-conditioning, cooling,
situations. With increasing demands, the situation is only going
to be aggravated unless appropriate basin level measures are
attempted now.
Population StressstIndia's population is around 1,028 million as on 1 March,
2001.The population is growing at the rate of about 17 million
annually which means a staggering 45,000 births per day and 31
births per minute. The population of India is expected to stabilize
at around 1,640 million by the year 2050. As a result, gross per 3capita water availability will decline from 1,820 m / yr in 2001 to
3as low as 1,140 m /yr in 2050. Total water requirement of the
country for various activities around the year 2050 has been 3estimated to be 1,450 km /yr. This is significantly more than the
current estimate of utilizable water resource potential (1,122 3km /yr) through conventional development strategies.
Therefore, when compared with the availability of 3approximately 500 km /yr at present, the water availability
around 2050 needs to be almost trebled. Various options have
been considered, in quantitative terms, as possible sources to
augment the anticipated deficit. It is argued that due to
considerations of gestation period and capital requirements,
rainwater harvesting and water-conservation measures must
receive the highest priority, followed by renovation and
recycling to be followed by intra-basin and then inter-basin
transfers in the last phase. But, investigations and planning
processes for all options must begin immediately.
Irrigation Requirements
In India, the primary use of water other than the domestic, is for
agriculture. As more food will be needed in the future to feed the
PRESSURES
688
910
1072
56 73 10212 23
6352 72 80
0
200
400
600
800
1000
1200
2010 2025 2050
Wat
er D
eman
d(b
cm)
Domestic Irrigation Industry Others
Source: Compendium of Environmental Statistics - India, 2007
Figure 3.3.2: Projected Annual Requirement of Water (in Different Sectors)
processing, transportation and energy production. As the
country rapidly industrializes, greater quantities of water will be
required.
The positive side of this trend is that water used in industrial
processes can be recycled, unlike in agriculture where very little
of it is actually consumed.
Domestic usage of water
Source: Central Water Commission, 2007
Figure 3.3.1 : Basin-wise Water Resource Potential (unit:bcm)
79.4 28.566.9
39.2
216
110
45.6
73.321.4
585.6
78.1
525.8
1869
Other Rivers
Brahmani
Mahanadi
East flowing rivers
West flowing rivers
Godavari
Narmada
Indus
Cauvery
Brahmaputra
Krishna
Ganga
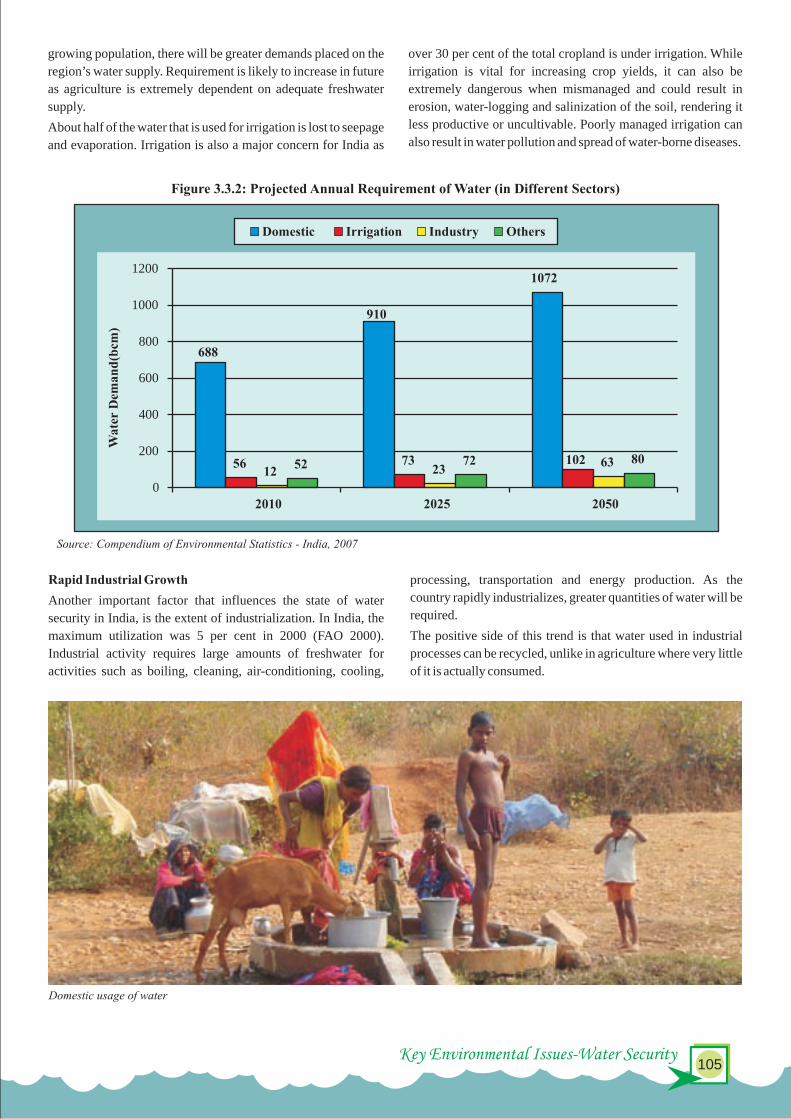
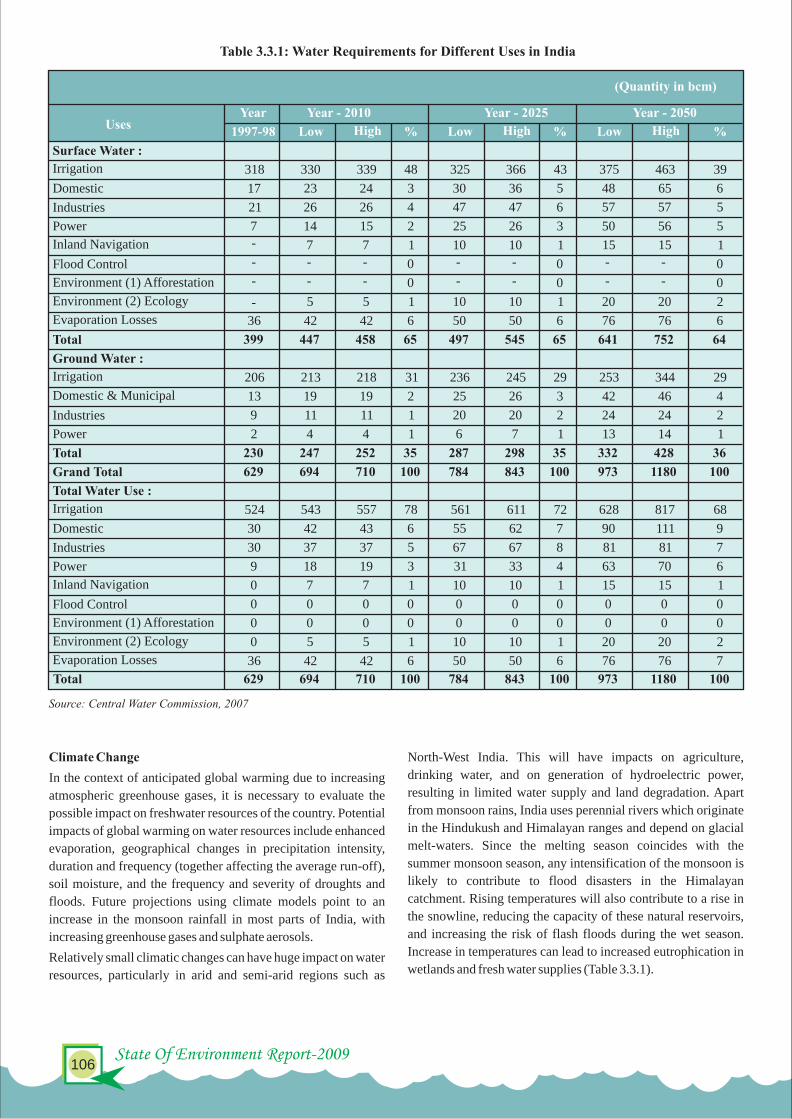
Key Environmental Issues-Water Security107
State Of Environment Report-2009 106
Climate Change
In the context of anticipated global warming due to increasing
atmospheric greenhouse gases, it is necessary to evaluate the
possible impact on freshwater resources of the country. Potential
impacts of global warming on water resources include enhanced
evaporation, geographical changes in precipitation intensity,
duration and frequency (together affecting the average run-off),
soil moisture, and the frequency and severity of droughts and
floods. Future projections using climate models point to an
increase in the monsoon rainfall in most parts of India, with
increasing greenhouse gases and sulphate aerosols.
Relatively small climatic changes can have huge impact on water
resources, particularly in arid and semi-arid regions such as
North-West India. This will have impacts on agriculture,
drinking water, and on generation of hydroelectric power,
resulting in limited water supply and land degradation. Apart
from monsoon rains, India uses perennial rivers which originate
in the Hindukush and Himalayan ranges and depend on glacial
melt-waters. Since the melting season coincides with the
summer monsoon season, any intensification of the monsoon is
likely to contribute to flood disasters in the Himalayan
catchment. Rising temperatures will also contribute to a rise in
the snowline, reducing the capacity of these natural reservoirs,
and increasing the risk of flash floods during the wet season.
Increase in temperatures can lead to increased eutrophication in
wetlands and fresh water supplies (Table 3.3.1).
from which water is also drawn for irrigation and domestic use.
The enforcement of regulations regarding discharge of industrial
wastewater and limits to extraction of groundwater needs to be
considerably strengthened, while more incentives are required
for promoting waste water reuse and recycling.
Agricultural Water Pollution
Two-thirds of India's farm production comes from one-third of
its land which is irrigated. The rest is from rainfed areas that
employ large populations. In order to meet the increasing
demand for food and farm employment, India has to increase the
area under irrigation, and enhance productivity in both irrigated
and rainfed areas.
For the agricultural sector, water and electricity for irrigation are
subsidized for political reasons. This leads to wasteful flood
irrigation rather than adoption of more optimal practices such as
sprinkler and drip irrigation. Cropping patterns and farming
practices also do not necessarily encourage the judicious use of
water. Conservative estimates indicate that the same quantity of
irrigation water used today can irrigate double the current area
with optimized irrigation and farming practices.
With limited revenues and budgetary support, the state
engineering departments are unable to operate and maintain the
irrigation systems efficiently, leading to increasing deterioration
of the structures and systems over time. Consequently, there are
further water losses due to breaches and seepage, resulting in
water logging and salinity. Water quality is further affected due to
the overuse of chemical fertilizers and pesticides.
The environmental challenges of water resources development
and management in India are expected to manifest themselves
more explicitly and rapidly in the coming years. These
environmental challenges may be addressed through four broad
approaches:
§Improving efficiencies and minimizing losses
§Recharging groundwater aquifers
§Abatement and treatment of pollution
§Reuse and recycling of wastewater
Due to the complexity and urgency of the environmental
challenges, these approaches need to be simultaneously pursued.
However, it is evident that an essential prerequisite for water and
human security is ecological security. Hence, water resource
planning in India has to urgently estimate the requirements of
water for ecosystem security.
In each of these approaches, appropriate policy, institutional,
technological and economic interventions and instruments may
be adopted. Most of these instruments have fortunately been
tried or tested at least on a pilot scale in India. The challenge is to
institutionalize systems for these interventions and instruments
to work on a large scale.
MEASURES TO ADDRESS WATER
INSECURITY
IMPACT
Most human activities whether domestic, agricultural or
industrial have an impact on water and the ecosystems. World
Health Organization statistics indicate that half of India's
morbidity is water related. Water borne diseases can be, to a
large extent, controlled by managing human consumption and
production patterns. It is therefore pertinent to have an
understanding of human activities, including water management
initiatives, and their impacts on water and the environment.
Domestic Water Pollution
Waste management systems have not been able to keep pace with
the huge volumes of organic and non-biodegradable wastes
generated daily. As a consequence, garbage in most parts of
India is unscientifically disposed and ultimately leads to increase
in the pollutant load of surface and groundwater courses. On the
other hand, the large population of the poor in India do not have
much choice but to live off the natural resource base and pollute
the environment in the process. They deforest for food, fuel,
fodder and fibre and pollute the water sources on which they
depend, since they cannot afford access to sanitation services.
Domestic water use today, though a small fraction of the total
water requirement, is under-priced for political reasons. This
leads to a considerable waste of the precious resource and
inadequate revenues for operation and maintenance. Low
revenues result in deterioration of the supply infrastructure and
further loss of the resource due to system inefficiencies.
In most parts of the country, waste water from domestic sources
is hardly treated, due to inadequate sanitation facilities. This
waste water, containing highly organic pollutant load, finds its
way into surface and groundwater courses, very often close to
dense pockets of human habitation from where further water is
drawn for use. Considerable investments will be required to
install treatment systems in at least the 500 major cities and
towns of the country. Coupled with investment requirements, are
the difficulties of mobilizing consumers to pay for centralized
systems. Estimates indicate that it is viable to set up
decentralized treatment systems for clusters of approximately
100 to 200 households where it is possible to convince users to
pay for efficient services. Incentives like soft loans may be
provided to these initiatives.
Industrial Water Pollution
The Industrial sector, contributing to about 20 per cent of the
national income, accounts for about 8 per cent of the current
water use. With rapid industrialization and urbanization, the
water requirement for energy and industrial use is estimated to
rise to about 18 per cent (191 bcm) of the total requirements in
2025.
Poor environmental management systems, especially in
industries such as thermal power stations, chemicals, metals and
minerals, leather processing and sugar mills, have led to
discharge of highly toxic and organic wastewater. This has
resulted in pollution of the surface and groundwater sources
Source: Central Water Commission, 2007
Table 3.3.1: Water Requirements for Different Uses in India
(Quantity in bcm)
UsesYear Year - 2010 Year - 2025 Year - 2050
Low High % Low High % Low High %
Surface Water :
Irrigation 318 330 339 48 325 366 43 375 463 39
Domestic 17 23 24 3 30 36 5 48 65 6
Industries 21 26 26 4 47 47 6 57 57 5
Power 7 14 15 2 25 26 3 50 56 5
Inland Navigation 7 7 1 10 10 1 15 15 1
Flood Control - - 0 - - 0 - - 0
Environment (1) Afforestation - - 0 - - 0 - - 0
Environment (2) Ecology 5 5 1 10 10 1 20 20 2
Evaporation Losses 36 42 42 6 50 50 6 76 76 6
Total 399 447 458 65 497 545 65 641 752 64
Ground Water :
Irrigation 206 213 218 31 236 245 29 253 344 29
Domestic & Municipal 13 19 19 2 25 26 3 42 46 4
Industries 9 11 11 1 20 20 2 24 24 2
Power 2 4 4 1 6 7 1 13 14 1
Total 230 247 252 35 287 298 35 332 428 36
Grand Total 629 694 710 100 784 843 100 973 1180 100
Total Water Use :
Irrigation 524 543 557 78 561 611 72 628 817 68
Domestic 30 42 43 6 55 62 7 90 111 9
Industries 30 37 37 5 67 67 8 81 81 7
Power 9 18 19 3 31 33 4 63 70 6
Inland Navigation 0 7 7 1 10 10 1 15 15 1
Flood Control 0 0 0 0 0 0 0 0 0 0
0 0 0 0 0 0 0 0 0 0
Environment (2) Ecology 0 5 5 1 10 10 1 20 20 2
Evaporation Losses 36 42 42 6 50 50 6 76 76 7
Total 629 694 710 100 784 843 100 973 1180 100
Environment (1) Afforestation
1997-98
-
-
-
-
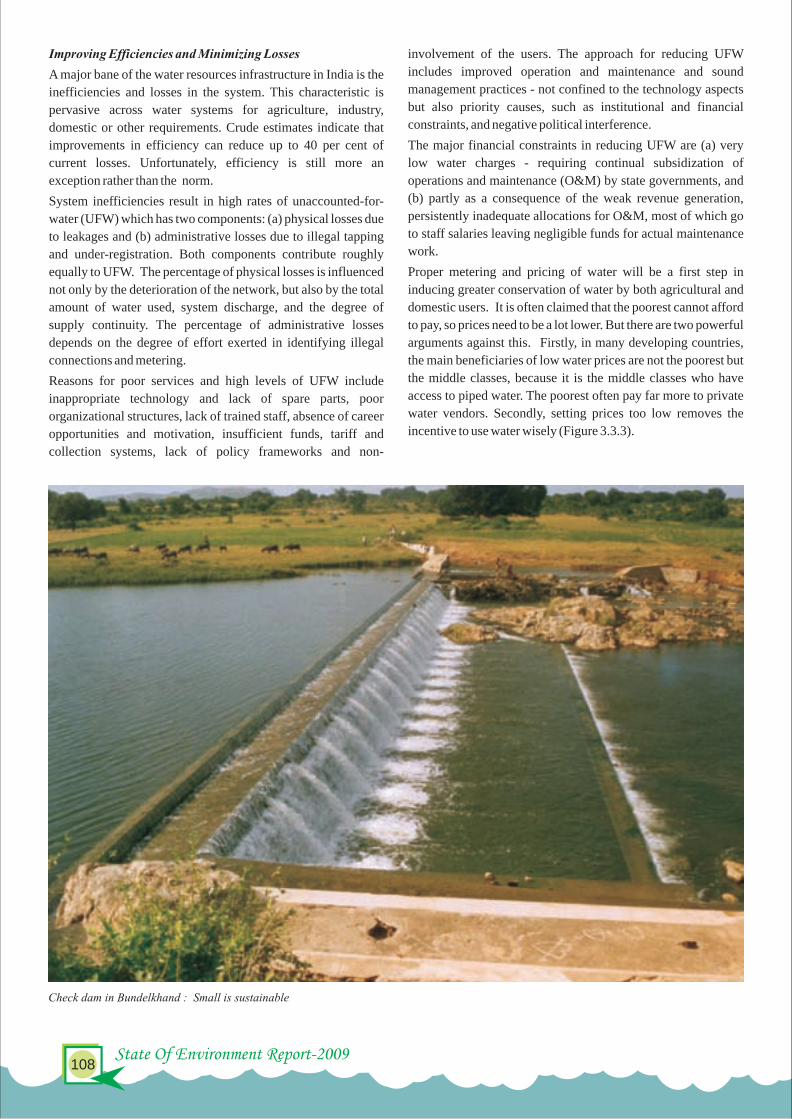
Key Environmental Issues-Water Security109
State Of Environment Report-2009 108
involvement of the users. The approach for reducing UFW
includes improved operation and maintenance and sound
management practices - not confined to the technology aspects
but also priority causes, such as institutional and financial
constraints, and negative political interference.
The major financial constraints in reducing UFW are (a) very
low water charges - requiring continual subsidization of
operations and maintenance (O&M) by state governments, and
(b) partly as a consequence of the weak revenue generation,
persistently inadequate allocations for O&M, most of which go
to staff salaries leaving negligible funds for actual maintenance
work.
Proper metering and pricing of water will be a first step in
inducing greater conservation of water by both agricultural and
domestic users. It is often claimed that the poorest cannot afford
to pay, so prices need to be a lot lower. But there are two powerful
arguments against this. Firstly, in many developing countries,
the main beneficiaries of low water prices are not the poorest but
the middle classes, because it is the middle classes who have
access to piped water. The poorest often pay far more to private
water vendors. Secondly, setting prices too low removes the
incentive to use water wisely (Figure 3.3.3).
Some of the other possible interventions and instruments
include:
§Increasing agricultural power tariffs to establish incentives
for groundwater and power conservation.
§Enabling transfer and reuse of water between sectors
through economic incentives and legislations.
§Contracting out operations of water supply systems,
maintenance of irrigation canals and collection of water
fees to community based organizations, NGOs, private
sector or a combination of these.
§Promotion of water conservation methods such as sprinkler
and drip irrigation equipment, on-farm works and other
land-improvement investments.
Box 3.3.2: A Look at India's Water Harvesting Practices
Traditional structures include : Zing, Kul, Naula, Kuhl, Khatri, Apatani, Zabo, Cheo-oziihi, Bamboo-drip irrigation, Dongs,
Dungs, Ahar-pyne, Bengal's Inundation channels, Dighis, Baolis, Kunds, Kuis, Baoris, Jhalaras, Nadi, Tobas, Tankas,
Khadins, Vav, Virdas, Talab, Saza kuva, Johads, Bandh, Pat, Rapat, Chandela Tank, Bundela Tank, Katas, Cheruvu, Kohli
Tanks, Bhandaras, Phad, Kere, The Ramtek Model, Surangam, Korambu, Eri, Ooranis, Jackwells.
Contemporary structures include - Artificial Glaciers, Nadis, Polymer Kundis, Chaukas Jaldhar Model, Tudum Monga,
Networking of Farm Ponds, Horizontal Roughening Filter.
Improving Efficiencies and Minimizing Losses
A major bane of the water resources infrastructure in India is the
inefficiencies and losses in the system. This characteristic is
pervasive across water systems for agriculture, industry,
domestic or other requirements. Crude estimates indicate that
improvements in efficiency can reduce up to 40 per cent of
current losses. Unfortunately, efficiency is still more an
exception rather than the norm.
System inefficiencies result in high rates of unaccounted-for-
water (UFW) which has two components: (a) physical losses due
to leakages and (b) administrative losses due to illegal tapping
and under-registration. Both components contribute roughly
equally to UFW. The percentage of physical losses is influenced
not only by the deterioration of the network, but also by the total
amount of water used, system discharge, and the degree of
supply continuity. The percentage of administrative losses
depends on the degree of effort exerted in identifying illegal
connections and metering.
Reasons for poor services and high levels of UFW include
inappropriate technology and lack of spare parts, poor
organizational structures, lack of trained staff, absence of career
opportunities and motivation, insufficient funds, tariff and
collection systems, lack of policy frameworks and non-
Check dam in Bundelkhand : Small is sustainable
Delhi
Manila
Mumbai
Phnom Penth
Bangkok
Ho Chi Minh City
Dhaka
Jakarta
Source: UN; Asian Development Bank
Figure 3.3.3 : The Concept of the ‘Poor Pay More’
0 25 50 75
489
Water vendor’s prices as a multiple of price of pipedwater, selected Asian cities
Prices (US$)

Key Environmental Issues-Water Security111
State Of Environment Report-2009 110
Rainfall in India occurs during short spells of high intensity (as
most of the rain falls in just 100 hours out of 8,760 hours in a
year). Due to such short duration of heavy rains, most of the
rainwater tends to flow away rapidly, leaving very little for
recharge of groundwater. Measures to recharge groundwater
aquifers include:
§Promotion of watershed management practices, which
have proved to be an effective means of recharging
groundwater, improving soil fertility and enhancing
productivity.
§Repair and revival of traditional water-harvesting and
conveyance structures and community based management
systems
§Incentives, like subsidy on property tax, may be provided to
individuals who adopt water harvesting practices in their
premises
§Modified baselines (including environmental parameters),
monitoring systems and the associated metrics, tools and
techniques for integrated planning and management of
groundwater.
§Creation of water markets that encourage water trading
among and within sectors. This would mean that the users
have an incentive to invest adequate resources and efforts to
maintain the value of the water resources they own to
maximize benefits over longer time horizon, thus
promoting groundwater recharge measures.
Estimates by the Centre for Science and Environment indicate
that upto 300 bcm (approximately half of the current demand)
can be captured through effective rainwater harvesting and
watershed management. Even if this may be an overestimate,
the fact remains that it is possible to harvest a significant
quantum through these initiatives to meet requirements.
Abatement and Treatment of Pollution
Pollution abatement and treatment measures that may be adopted
include:
§Capacity building of farmers for improvement in
application of water, fertilizers and pesticides through
better extension of irrigated agronomy knowhow. This will
help in greatly reducing contamination of water sources by
agricultural chemicals.
§Investments in canal lining to reduce seepage that results in
water-logging and salinity. Seepage holes may be designed
as required to provide for basin recharge.
§Reclamation of salinity affected lands.
§Introduction of fiscal incentives for improving
environmental quality through:
- Rebates on excise duty / customs duty / sales tax on
machinery and equipment used for pollution abatement or
adoption of clean technologies.
- Accelerated depreciation allowances to encourage
adoption of clean technologies.
- Soft loans/subsidies for setting up common effluent
treatment plants and recycling and conservation activities.
- Application of 'polluter pays' principle through pollution
taxes, penalties and price structures.
- Support for innovations in development of pollution
abatement and treatment technologies through setting up of
zero-pollution industrial estates.
Reuse and Recycling of Waste Water
There are several examples across the country where waste water
has been reused or recycled for applications like crop irrigation,
industrial use and groundwater recharge. Reused water has been
used in farming, or diverted to irrigate forests. An additional
advantage to these applications, is the recharge of groundwater.
Industrial and commercial activities such as cooling
applications, which do not require drinking water standards, are
also potential users of reclaimed water. Reclaimed water can be
applied to aquifer recharge areas like retention ponds from where
it can percolate into the soil.
To ensure that these practices are adopted, policy measures that
are required include:
§Zoning cum incentive scheme designed to encourage reuse
and recycling of waste water from one industry for
processes in another (internalize the externalities).
§Support for innovative technologies and capacity building
of private sector for design and implementation of water
recycling and reuse technologies.
Box 3.3.3 : Polluters Pay Principle – Supreme Court
A monitoring Committee on Hazardous Waste, set up by the Supreme Court, has looked into the allegation of pollution created
by Coca Cola, which distributed its sludge to farmers at Plachimada, Palakkad, where the soft drink giant has a bottling unit. The
committee came to the conclusion that Coca Cola will have to take quick measures to ensure water supplies to all the people in
the vicinity of the plant. In order to reduce the withdrawal of groundwater, both the units are directed to install reverse osmosis
systems to ensure that the use of public water for effluent treatment is returned to its original condition for reuse. This
recommendation has to be implemented within six months.
Sewage Treatment Plant with attractive surroundings at Chandan Nagar in West Bengal
Box 3.3.4 : Reuse and Recycling of Water within and among Sectors
1. Chennai Petroleum Corporation Limited
Conserving Water: CPCL has identified alternate sources for its raw water needs. As a unique project, it has invested nearly
Rs. 24 crores on reclamation of city sewage by employing tertiary treatment, followed by reverse osmosis process. The salient
features of this unique project are:
§The project is the first of its kind in Asia, in magnitude and end-use application3
§The capacity of the plant is 2.5 MGD (475 m /hour), and caters to about 40 per cent of the refinery's raw water
requirements.
§Benefits of conserving water to CPCL as well as the society at large are:
§Resource saving: 2.5 MGD of metro water is saved and diverted to city population.
§Pollution angle: disposal of 2.5 MGD sewage and its effects on the environment are averted.
§Revenue of the State Government: the sale of sewage generates additional revenue for the State Government.
§Continuous refinery operations: Even during water scarcity, continuous operations of the refinery are ensured with
alternate sources of water.
§Substantial chemical savings: Quality of reclaimed sewage from RO plant is far superior to metro raw water. Hence huge
quantities of chemicals are saved in DM plant regeneration.
§Cleaner Water: Two effluent treatment plants with state-of-the-art technology are operating to meet the Minimum
National Standards (MINAS), prescribed for petroleum refinery effluents.
§Maximum quantity of treated effluents are being reused within the refinery complex for fire-water makeup, 'Green Belt'
development and construction activities. They are also used as service waters for chemical preparations, floor washings
and toilet flushings.
§For zero discharge of treated effluents, CPCL has initiated Pilot Plant studies on recycling of treated effluents from its
refinery campus.
2. Jubilant Organosys Limited
Jubilant Organosys Ltd. is the largest speciality chemicals company of India which strongly believes in the sustainability of
growth. It has four modern global scale manufacturing facilities located at Bhartiagram, Gajraula (100 kms from Delhi), Nira
(near Pune, Maharashtra), Samalaya (near Vadodara, Gujarat) and Nanjangud (near Mysore, Karnataka). Effluent collected
from various plants can be classified as biodegradable and non-biodegradable. The biodegradable effluents, emanating
primarily from the distilleries at the Gajraula and Nira facilities, are treated in modern effluent treatment plants to reduce
polluting ingredients to acceptable levels. Currently, a part of this treated effluent is used for crop irrigation and bio-
composting, and within three years, the entire quantity will be used for crop irrigation and bio-composting purposes.
‘

Key Environmental Issues-Water Security113
State Of Environment Report-2009 112
The core water challenge is one of 'governance'. While
infrastructure development needs to be pursued and cannot be
neglected, the focus has to be on the judicious use of available
water resources at the local level, with community participation
and management. A prerequisite for this would be capacity
building of all stakeholders including planners, designers,
engineers and civil society.
Opportunities and Priorities
The core challenge of water resources development and
management in India is one of governance. The institutions
needed to ensure efficient and equitable distribution of water are
crumbling or do not exist. With growing population and
increasing economic activity, the pressures on this basic but
increasingly scarce resource have grown much faster than the
ability of communities and higher level jurisdictions to cope
with them. The bulk of the day-to-day environmental and social
problems in India's cities and villages emanate from this core
challenge. The solution lies in how quickly and how well these
communities learn to decentralize their management systems
and mobilize community ownership and participation in
decision making.
Operationally, the environmental challenges include:
§Improving efficiencies and minimizing losses in extraction,
transport and use of water.
§Addressing the spatial and temporal variations of available
rainfall and devising the means to optimize its availability,
now and for the future.
§Planning and designing water-related projects as
environmental improvement opportunities to maximize the
overall benefits – not simply to minimize negative impacts.
§Internalizing waste water minimization, reuse and
recycling as an integral feature of all water related projects.
Most projects have tended to increase supplies, without
adequate attention to demand side management.
§Ensuring adequate reserves for ecosystem requirements.
§Supporting scientific assessments and incorporating the
analysis into projects.
Promote integrated water resource management approach
The need for integrated water resource management is widely
and frequently called for but rarely implemented due to the
differences in conceptual understanding and analysis, coupled
with implementation hurdles in bringing together powerful
agencies with strong domain expertise, but with a tendency of
protecting their ‘turf’ rather than working together. Despite the
complexity of the issues, existing conceptual frameworks are
good enough to be the basis for much better results than are
commonly produced today. To ensure effective water resource
management, following measures should be taken:
§The water needs of the poor and underserved must be given
the highest priority through the preparation of a
comprehensive policy and regulatory framework aimed at
integrated management systems that can ensure rational
and equitable allocation of resources.
§The water requirements for eco-system services and
security need to be scientifically assessed and incorporated
into the analysis of all water resource management projects.
§Industrial, agricultural and municipal water systems should
be designed to take full advantage of innovative approaches
structured to maximize delivery and minimize waste such
as zero emission systems, controlled irrigation and 24x7
drinking water supplies.
§Water resource management must go well beyond
environmental impact assessment and minimizing
externalities to becoming integral components of national
and local action to improve the environment and human
security.
§The information base and analytical framework for
integration of water resource management needs to be
continually revised and updated in the light of experience
and made widely available through intensive programmes
for the education and training of planners, designers,
engineers and civil society.
§Integrated planning and action will also require modified
baselines (including environmental parameters),
monitoring systems and the associated metrics, tools and
techniques.
Vigorously pursue decentralization and community water
management initiatives
India has built extensive infrastructure over the past 50 years for
managing the nation's water resources. Some of the structures
that comprise it are rightly considered major marvels of
engineering. Yet, the country's water problems have not been
solved and in many cases, they have been aggravated. There
exists considerable debate on whether this is in spite of this
massive investment or because of it. One thing is clear however-
large-scale public sector operations are often not very
accountable to the citizen or amenable to his or her sense of
ownership. This has meant that they often suffer from neglect,
leading to poor financial returns, inadequate income to cover the
costs of upkeep and maintenance and misuse, inevitably
resulting in inefficiencies, water losses and environmental
degradation.
Over a long period of India's history, water had been managed,
very successfully, as a local resource. Unfortunately, the logic of
the so-called economies of scale and the self-perpetuating
momentum of the engineering sector radically changed all this.
Over the past five or six decades, this logic has led to a quest for
large projects, massive transfers of the resource over long
distances and centralized management systems. The planning
systems quickly became dominated by the predispositions of
distant suppliers of water rather than of the local users.
Fortunately, the Constitution of India recognizes water as a 'state
subject'. This opens the possibility of bringing it back under the
control of local communities, which can ensure that it can be
retained for as long as possible where it falls and used efficiently
through local ownership and management. The government,
through its investments, can help accelerate the decentralizing
process:rd th
§The constitutional authority provided by the 73 and 74
Amendments to the Constitution, which empowers
Panchayats and Urban Local Governments to manage their
water resources must be used so as to create a sense of
ownership among local communities and a culture of
paying for a resource and its delivery.
§The issue of water ownership and rights will have to be
revisited and options for transferring surface and
groundwater rights defined. Mechanisms for transfer or
reuse of water between sectors also need to be simplified.
§New guidelines and legislation are required for:
- Creating institutions for water sharing and allocation
including strengthening of regulatory powers
- Water resource development, distribution and revenue
collection including participation of the private sector,
NGOs and community based organizations.
§Large-scale conservation measures like integrated
watershed development need to be simplified and
propagated widely to mobilize local ownership and
promote food and livelihood security. At the same time,
smaller projects, such as traditional water harvesting and
conveyance structures and community-based management
systems which are more in tune with local cultures and
practices must be revived and popularized.
Foster local institutional development and capacity building
Robust local institutions are an essential prerequisite for
decentralized management of water resources. They must also
have access to higher level information and institutional support
to manage these resources in an integrated manner. The highly
effective community based institutions that used to exist in most
parts of the country have today been replaced by the local offices
of state level engineering departments. In some places, there
also exist NGO and private sector initiatives, usually in the
nature of experiments and pilot projects attempting to create and
build local water management institutions.
No single type of institution can hope to manage the ever-
growing complexities and challenges of water resource
development and management. New types of multi-stakeholder
institutional bodies will be required and innovative partnerships
will have to be forged for this purpose. The task of building local
institutions and their capacity across a country like India is
immense.
§An aggressive, conscious effort is needed to define the roles
of various participants in the multi-stakeholder processes
associated with managing water resources:
- Governance - Panchayati Raj Institutions, Gram Sabhas
or Urban Local Bodies
- Operations - community based organizations, NGOs,
private sector, government agencies or a combination of
these
- Regulation - state or central government; community
based
- Financing - all these stakeholders as well as international
agencies
§The knowledge and skill base of these local institutions will
have to be strengthened for :
- Integration of water resource management
- Building of information and knowledge base
- Internalizing cost recovery principles
- Monitoring and conflict resolution mechanisms
§Operationally, the local institutions will need support in
design and implementation of projects including :
- Assessment of technological options
- Management systems including unbundling of resource
development, conveyance, distribution and revenue
collection wherever appropriate
Condition of Powai Lake before and after revival
Before After

Key Environmental Issues-Water Security115
State Of Environment Report-2009 114
Promote economic instruments for efficient and sustainable
water resource management
Though water is unquestionably a fundamental right of every
human being, its growing scarcity severely jeopardizes the
ability of citizens in many parts of India to exercise this right.
The way water is currently used in agriculture, industry and the
human habitat is not sustainable. Already, the scarcity of water
in many areas of the country has become a major constraint on
the economy, not to mention its highly negative impact on the
health and well-being of people and the cause of community and
inter-state conflict. Today's water management practices are
definitely not sustainable.
Economic instruments are recognized as an essential component
for efficient and sustainable management of resource. However,
economic instruments are very often politically difficult to
implement. The government of India can play a critical role in
promoting appropriate economic instruments for the various
components of water resource management to:
§Evolve pricing mechanisms for irrigation, urban and rural
water supply systems that include the full cost of providing
it. These should include the costs not only of the
infrastructure, operations and maintenance, capital
servicing, and other financial costs, but also the broader
economic, ecological and social costs incurred in the
process of acquiring, transporting and delivering it. At the
same time, these pricing mechanisms have to be adjusted to
ensure universal service provision, and especially to cater
to the special needs of the poor and underserved.
§Demonstrate pilot projects in cooperative, enterprise and
other institutional modes, with community participation,
for providing water services to communities.
§Provide time-bound subsidies for development, testing and
scaling up of tools and techniques (e.g. drip irrigation) for
efficient use of irrigation water with the aim of enabling
such practices to become economically viable and widely
adopted without continuing subsidies.
§Evolve fiscal incentives like rebates on excise, customs and
other duties, or tax exemptions for industrial operations
that adopt pollution prevention and treatment measures,
particularly for systems aimed at zero emission..
§Provide incentives to domestic water suppliers that
integrate water reuse and recycling measures in their
operations.
§Devise fiscal instruments such as taxes, penalties on
industrial polluters for discharging effluents in water
bodies based on the 'Polluter Pays' principle.
§Promote establishment of water markets that encourage
water trading among farmers themselves and also with
urban or industrial users.
Support innovative approaches to water resource management
The environmental and other challenges of water resource
development and management in India require a whole range of
innovative approaches. Some of the areas of innovation include:
§Technology packages for :
- Up-gradation of traditional water harvesting and
conveyance structures
- Cost-effective systems for conjunctive use of surface and
groundwater
- Improved agriculture and irrigation practices to achieve
'more crop per drop'
- Low-cost water purification systems
- Water reuse and recycling systems
- Zero emission industrial estates
§Water resources planning and management
- Scientific assessment of water requirements for
ecosystem security
- Development of knowledge base and analytical
Volume I: Main Report, World Bank, October 15, 2001
§Pitman G. T. Keith ,India: World Bank Assistance for Water
Resources Management, A Country Assistance
Evaluation,World Bank, 2002
§Rangachari R., Sengupta N., Iyer R.R., Banerji P., and Singh
S. (2000). Large Dams: India's Experience, a World
Commission on Dams case study
§Ringskog Klas and Chow Nola, India: Environmental
Sustainability in the 1990s; A Country Assistance
Evaluation, The World Bank, 2002
§Rita Pandey, Water Demand Management: Issues in Pricing
and Cost Recovery, National Institute of Public Finance and
Policy, New Delhi, December 1997
§Rupesh Kumar (2003). Water Pricing in India. Journal of
Hydrology Vol 26, Number1-2
Box 3.3.5: Water Security – Financial Constraints
Operation and Maintenance (O & M) of the water distribution systems, reservoirs, canals and other infrastructure requires
financial inputs from the central and state governments, although in some cases the cost of O & M is also shared by the users.
In the past, allocation of funds has been inadequate to properly maintain the existing structures and many have fallen into
disrepair with consequent losses in efficiency. Even current construction projects suffer from lack of funding and lengthy
delays are not uncommon. With water consumption estimated to double in the next twenty years (World Bank, 1999), greater
emphasis will have to be placed on the financial requirements of the water sector.
Due to its important contribution to the Indian economy, the agricultural sector receives greater attention in terms of financing
and subsidies. Not surprisingly, irrigation has been the largest recipient of government funds. Over US$ 9 billion were spent
in this area during the Eigth Plan and subsidies to this sector accounted for almost 0.3 per cent of the GDP during the 1994-95
fiscal year (World Bank, 1999). The Drinking Water and Sanitation Supply sector in both rural and urban areas has also been
subjected to subsidies and rate structures that have not reflected the true cost of the resource and discouraged conservation.
For the most part, government spending in all water-related sectors is running at a deficit. Development of new water supply
schemes and maintenance of older structures will continue to exhaust government funds while new issues, such as water
pollution and scarcity, will require greater investment over the long term.
framework for integrated water resource development
- Inst i tu t ional and f inancial mechanisms for
decentralization of water resource management
§Central Water Commission, Government of India
§Hanumantha Rao CH (2000). Watershed Development in
India: Recent Experience and Emerging Issues, Economic
and Political Weekly, Vol. 35 No. 45, 3943-3948
§Ministry of Water Resources, Government of India
§McCartney M.P., Sullivan C. and Acreman M.C. Ecosystem
Impacts of Large Dams, Background Paper Nr. 2 for IUCN /
UNEP / WCD
§Operations Evaluation Department, Bridging Troubled
Waters Assessing the Water Resources Strategy since 1993,
REFERENCES
A lake in Tikamgarh District
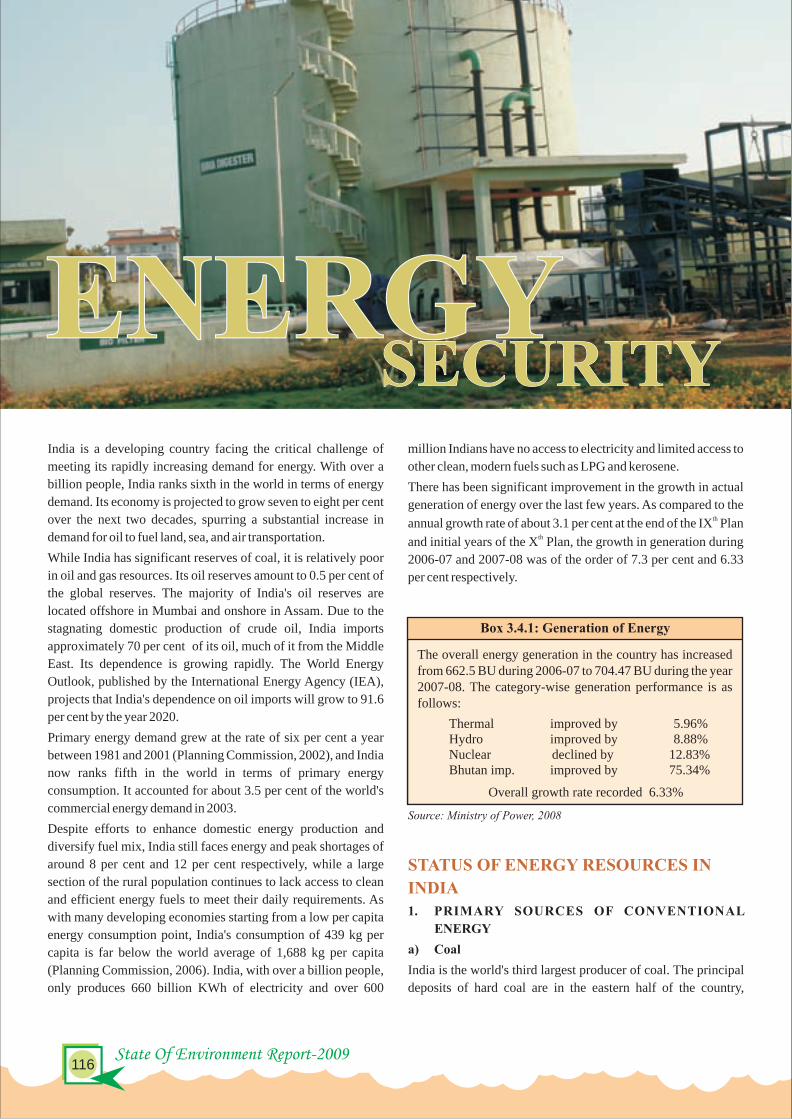
Key Environmental Issues-Energy Security117
State Of Environment Report-2009 116
ENERGYENERGYSECURITYSECURITY
India is a developing country facing the critical challenge of
meeting its rapidly increasing demand for energy. With over a
billion people, India ranks sixth in the world in terms of energy
demand. Its economy is projected to grow seven to eight per cent
over the next two decades, spurring a substantial increase in
demand for oil to fuel land, sea, and air transportation.
While India has significant reserves of coal, it is relatively poor
in oil and gas resources. Its oil reserves amount to 0.5 per cent of
the global reserves. The majority of India's oil reserves are
located offshore in Mumbai and onshore in Assam. Due to the
stagnating domestic production of crude oil, India imports
approximately 70 per cent of its oil, much of it from the Middle
East. Its dependence is growing rapidly. The World Energy
Outlook, published by the International Energy Agency (IEA),
projects that India's dependence on oil imports will grow to 91.6
per cent by the year 2020.
Primary energy demand grew at the rate of six per cent a year
between 1981 and 2001 (Planning Commission, 2002), and India
now ranks fifth in the world in terms of primary energy
consumption. It accounted for about 3.5 per cent of the world's
commercial energy demand in 2003.
Despite efforts to enhance domestic energy production and
diversify fuel mix, India still faces energy and peak shortages of
around 8 per cent and 12 per cent respectively, while a large
section of the rural population continues to lack access to clean
and efficient energy fuels to meet their daily requirements. As
with many developing economies starting from a low per capita
energy consumption point, India's consumption of 439 kg per
capita is far below the world average of 1,688 kg per capita
(Planning Commission, 2006). India, with over a billion people,
only produces 660 billion KWh of electricity and over 600
million Indians have no access to electricity and limited access to
other clean, modern fuels such as LPG and kerosene.
There has been significant improvement in the growth in actual
generation of energy over the last few years. As compared to the thannual growth rate of about 3.1 per cent at the end of the IX Plan
thand initial years of the X Plan, the growth in generation during
2006-07 and 2007-08 was of the order of 7.3 per cent and 6.33
per cent respectively.
ranging from Andhra Pradesh, bordering the Indian Ocean, to
Arunachal Pradesh in the extreme North-East. The eastern states
of Chhattisgarh, Jharkhand. Orissa and West Bengal together
account for about 77 per cent of India’s coal reserves. As a result
of exploration carried out to the depth of 1,200 metres by the GSI
STATUS OF ENERGY RESOURCES IN
INDIA
1. PRIMARY SOURCES OF CONVENTIONAL
ENERGY
a) Coal
India is the world's third largest producer of coal. The principal
deposits of hard coal are in the eastern half of the country,
Source: Ministry of Power, 2008
Overall growth rate recorded 6.33%
The overall energy generation in the country has increased from 662.5 BU during 2006-07 to 704.47 BU during the year 2007-08. The category-wise generation performance is as follows:
Thermal improved by 5.96%Hydro improved by 8.88%Nuclear declined by 12.83%Bhutan imp. improved by 75.34%
Box 3.4.1: Generation of Energy
Source: Ministry of Coal, 2006
Table 3.4.1 : State-wise Distribution of Coal Resources and its Categories
StateProved Indicated Inferred Total
Andhra Pradesh 8403 6158 2584 17145
Arunachal Pradesh 31 40 19 90
Assam 315 27 34 376
Bihar 0 0 160 160
Chhattisgarh 9570 27433 4439 41442Jharkhand 36148 31411 6339 73898
Madhya Pradesh 7565 9258 2935 19758Maharashtra 4653 2432 1992 9077
Meghalaya 117 41 301 459Nagaland 4 1 15 20
Orissa 16911 30793 14295 61999
Uttar Pradesh 766 296 0 1062
West Bengal 11383 11879 4553 27815
Total 95866 119769 37666 253301
Coal resources in million tonnes
Source: Ministry of Coal, 2008
Figure 3.4.1: India's Production of Coal
0
50
100
150
200
250
300
350
400
450
500
2000-01 2005-06 2006-07 2007-08
Pro
du
ctio
n o
f C
oal
(m
illi
on t
on
nes
)
(Geological Survey of India), CMPDI (Central Mine Planning &
Design Institute Ltd.) and MECL (Mineral Exploration
Corporation Ltd.), a cumulative total of 253.30 billion tonnes of
geological resources of coal have so far been estimated in the
country as on 1.1.2006 (Table 3.4.1 and Figure 3.4.1).
The coal resources of India are available in sedimentary rocks of
older Gondwana formations of peninsular India and younger
tertiary formations of north-eastern region. Based on the results
of regional / promotional exploration, where the boreholes are
normally placed 1-2 km apart, the resources are classified into
Indicated and Inferred categories. Subsequent detailed
exploration in selected blocks, with boreholes placed less than
400 metres apart, upgrades the resources into more reliable
'Proved' category.
As a result of regional, promotional and detailed exploration by
GSI, CMPDI and SCCL, the estimation of coal resources of India
has reached 253.30 Bt (Table 3.4.2, Table 3.4.3 and Table 3.4.4).

Key Environmental Issues-Energy Security119
State Of Environment Report-2009 118
Lignite deposits mostly occur in the southern state of Tamil
Nadu. India's geological resources of lignite are estimated to be
some 36 billion tonnes, of which about 2.4 billion tonnes in the
Neyveli area of Tamil Nadu are regarded as mineable under the
presently adopted mining parameters. Annual production of
lignite is currently in the region is 31 million tonnes, almost all of
which is used for electricity generation (Table 3.4.4).
Although India's coal reserves cover all ranks - from lignite to
bituminous, they tend to have high ash content and a low
calorific value. The low quality of much of its coal prevents India
from being anything but a small exporter of coal (traditionally to
the neighbouring countries of Bangladesh, Nepal and Bhutan)
and conversely, is responsible for sizeable imports (around 20
million tonnes per annum of coking coal and 17 million tonnes
per annum of steam coal) from Australia, China, Indonesia and
South Africa (Figure 3.4.2).
The Ministry of Petroleum and Natural Gas (MoPNG) has
undertaken several initiatives to tap gaseous fuels other than
natural gas. Proven Coal Bed Methane (CBM) is estimated to
double India's proven gas reserves. The government has
formulated a CBM policy to attract technology and investment
for exploration and production of CBM from coal-producing
areas. Already, 16 exploration blocks for CBM have been
awarded to national oil companies and private companies, and
exploration work in all these blocks is in progress. In-situ coal
gasification can also release usable gas from in-extractable coal
reserves below 600 meters depth and bring it to the surface
without the accompanying ash, while providing the potential for
injecting back the captured CO . Recoverable energy from one of 2
the blocks (Mehsana-Ahmedabad) alone, with coal reserves of
63 billion metric tonnes in the form of gas, could be equivalent to
15,000 billion cubic metres of natural gas. Public sector oil and
gas companies are collaborating with leading international
organizations in this area (MoPNG, 2005).
b) Oil and Natural Gas
Within a proved amount in place of 1,652 million tonnes, the stamount of proved recoverable reserves (as on 1 April 2005) is
786 million tonnes, of which 410 million tonnes is located
offshore. Onshore reserves have risen by 13.3 per cent from the st332 million tonnes (as on 1 April, 2002) to 376 million tonnes,
whereas offshore reserves have remained virtually unchanged. stAs on 1 April, 2006, further growth in onshore reserves to 387
million tonnes and a sharp drop in the offshore reserves down by
10 per cent to 369 million tonnes has been recorded.
For more than 60 years after its discovery in 1890, the Digboi oil
field in Assam, in the North East of the country, provided India
with its only commercial oil production field. This field was still
functional in 2005, albeit at a very low level. Since 1960,
numerous onshore discoveries have been made in the western,
eastern and southern parts of India. In 2005-06, offshore fields
provided almost 65 per cent of national oil output. Total
Source: Ministry of Coal, 2006
Table3.4.3: Type-wise and Category-wise Coal Resources(in million tonnes) of India as on 1.1.2006
Type of Coal Proved Indicated Inferred Total
Prime Coking 4614 699 - 5313
Medium Coking 11445 11751 1880 25076
Semi-Coking 482 1003 222 1707
Sub-Total Coking 16541 13453 2102 32096
(B) Non-Coking* 79325 106316 35564 221205
Total (Coking & Non-Coking) 95866 119769 37666 253301
(A) Coking
* Including total coal of North Eastern Region
Source: Ministry of Coal, 2007
Table 3.4.4: Estimates of Coal Resources (in million tonnes) in the Country during last 5 years
As on Proved Indicated Inferred Total
1.1.2002 87320 109377 37417 234114
1.1.2003 90085 112613 38050 240748
1.1.2004 91631 116174 37888 245693
1.1.2005 92960 117090 37797 247847
1.1.2006 95866 119769 37666 253301
Source: Ministry of Coal, 2006
Table 3.4.2 : The Formation-wise and Category-wise Coal Resources(in million tonnes) of India as on 1.1.2006
Formation Proved Indicated Inferred Total
Gondwana Coal 95399 119663 37297 252359
Tertiary Coal 467 106 369 942
Total 95866 119769 37666 253301
Coal is a major energy source catering to India's growing energy
needs. It meets about 51 per cent of the country's commercial
energy needs, and about 70 per cent of the electricity produced in
India comes from coal. While the adoption of efficient coal-
based power generation technologies (internal gasification
combined cycle and ultra-supercritical) would reduce the
environmental impacts from coal combustion, clean coal
utilization needs to be adopted across the entire coal cycle
through scientific mining practices followed by land
reclamation, beneficiation of coal for ash reduction at source and
transforming coal from its current form to cleaner energy forms
via coal liquefaction, and coal gasification. Moreover, Coal Bed
Methane (CBM) is an important clean energy option for the
country and needs to be examined judiciously as a key
alternative to the country's sustainable energy pathway.
USA
South
Afri
ca
Indi
a
Russia
Kaz
akhs
tan
Austra
lia
Ukr
aine
Rest o
f the
Wor
ld
Polan
d
Serbi
a
China
0
50
100
150
200
250
300
Bil
lio
n t
onn
es
Source: World Energy Council Survey of Energy Resources, 2007
Figure 3.4.2: Proved Recoverable Coal Reserves; The Top Ten Countries in the World
production of oil (including gas-plant liquids) has fluctuated in
recent years within a range of 36 to 38 million tonnes per annum.
In 2005, India produced (in million tonnes) 32.5 crude oil, 1.4
natural gasoline and an estimated 2.4 gas-plant LPG, all of which
was consumed internally.
Oil accounts for about one third of India's commercial energy
consumption, and its share has been growing gradually in recent
years. Although India has significant domestic oil reserves, it is a
net oil importer. The Government of India has initiated such
Electricity for all : Not a distant dream
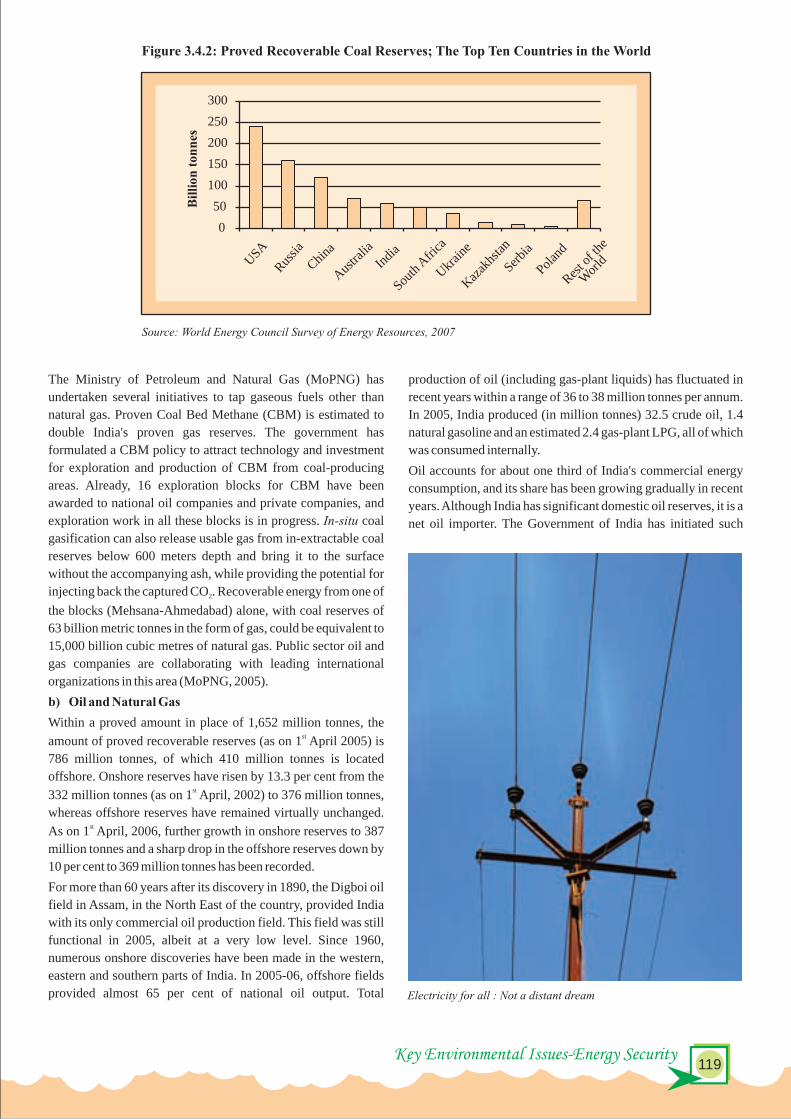

Key Environmental Issues-Energy Security121
State Of Environment Report-2009 120
2. RENEWABLE ENERGY
India is blessed with an abundance of sunlight, water and
biomass. Vigorous efforts during the past two decades are now
bearing fruit as people from all walks of life are more aware of
the benefits of renewable energy, especially where decentralized
energy is required in villages and in urban or semi-urban centres.
India has the world's largest programme for renewable energy.
The government created the Department of Non-conventional
Energy Sources (DNES) in 1982. In 1992, a full-fledged
Ministry of Non-conventional Energy Sources was established
under the overall charge of the Prime Minister.
a) Hydropower
India's gross theoretical hydropower potential (2,638 TWh/year)
and technically feasible potential (660 TWh/year) are amongst
the highest in the world. The public utilities' total installed
hydroelectric capacity exceeded 32,000 MW at the end of 2005,
with a corresponding generation of 97.4 TWh, equivalent to 16
per cent of India's public sector electricity generation. The Indian
WEC Member Committee reports that about 13 GW of hydro
capacity was under construction at end-2005 and that a further 9
GW is planned. The largest hydropower plants currently under
construction are Subansiri Lower (2,000 MW), Parbati II (800
MW) and Omkareshwar (520 MW).
Numerous other hydropower projects are under way or at the
planning stage. In addition, 55 hydropower schemes have been
designated as suitable for renovation and upgrading, which could
eventually result in an increment of some 2,500 MW to India's
generating capacity. Hydropower & Dams World Atlas reports
that there are 420 small-scale hydropower plants in operation,
with an aggregate installed capacity of about 1,423 MW; a
further 521 MW of small scale capacity is under construction.
A view of Nathpa Jakhri Hydro Electric Power Station, Himachal Pradesh
steps, as to intensify domestic exploration and development
efforts to explore new fields and increase the reserve base of the
country to ensure oil security for the nation. The Hydrocarbon
Vision 2025 laid down a phased programme for reappraising 100
per cent of the sedimentary basins of the country by 2025
(Planning Commission, 1999). The Directorate General of
Hydrocarbons (DGH) has conducted a number of studies to
upgrade information on the unexplored or the less explored
regions in the country. Overseas acquisition of equity oil is
another major strategy adopted to enhance the oil security of the
country. The Government of India aims to produce 20 Mt per
annum of equity oil and gas abroad by 2010.
The DGH has divided India's topography into 26 sedimentary 2basins, comprising 1.35 million km of onshore area and 0.39
2million km of offshore area (up to 200 metre isobaths). Despite
several developments in the country's hydrocarbon sector,
several areas that may have hydrocarbon reserves are yet to be
explored. In 1997-98, the Government of India announced its
New Exploration Licensing Policy (NELP), with the twin
objectives of enhancing domestic production by attracting
private capital and foreign technology for the Indian upstream
sector, and mapping the sedimentary basins of the country as
extensively as possible. Under this framework, total freedom has
been given to market crude oil in the domestic market and a
company can bid directly without the participation of ONGC or
OIL, as was mandatory earlier.
Although oil shale, in association with coal and also oil, is
known to exist in the far northeastern regions of Assam and
Arunachal Pradesh, the extent of the resource and its quality
have not yet been determined. Currently oil shale, recovered
with coal during the mining process, is discarded as a waste
product. However, the Indian Directorate General of
Hydrocarbons has initiated a project designed to assess the
reserve and its development.
A sizeable natural gas industry has been developed on the basis
of the offshore Mumbai gas and oil/gas fields. Proved reserves as ston 1 April, 2005 have been reported by the Indian WEC
Member Committee as 1,101 bcm, an increase of 46.6 per cent
on the level reported in the 2004 Survey. The revised figure
appears to be consistent with the series of 'proved and indicated
balance recoverable reserves' published by the Ministry of
Petroleum & Natural Gas, which shows 1,075 bcm for such streserves as on 1 April 2006. Strong growth in India's offshore
reserves has been recorded from 584 bcm (63 per cent of total streserves) as on 1 April, 2004 to 761 bcm (69 per cent of total
streserves) as on 1 April, 2005.
The Indian WEC Member Committee also reports that the
proved amount of gas in place (of which the proved reserves
constitute the recoverable portion) is 1,595 bcm. Marketed
production is principally used as a feedstock for fertilizer and
petrochemical manufacture, electricity generation and as
industrial fuel. The recorded use in the residential and
agricultural sectors is very small.
c) Nuclear Power
Nuclear power for civil use is well established in India. Its civil
nuclear strategy has been directed towards complete
independence in the nuclear fuel cycle necessary because it is
excluded from the 1970 Nuclear Non-Proliferation Treaty (NPT)
due to its acquiring nuclear weapons capability after 1970.
As a result, India's nuclear power programme has proceeded
largely without fuel or technological assistance from other
countries (but see later section). Its power reactors till the mid
1990s had some of the world's lowest capacity factors, reflecting
the technical difficulties due to the country's isolation, but rose
impressively from 60 per cent in 1995 to 85 per cent in 2001-02.
Nuclear power supplied 15.8 billion kwh (2.5 per cent) of India's
electricity in 2007 from 3.7 GWe (out of a total of 110 GWe)
capacity and this will increase steadily as imported uranium
becomes available and new plants come on line. India's fuel
situation, with shortage of fossil fuels, is driving the investment
in nuclear energy. By 2050, nuclear energy is expected to
contribute 25 per cent to total energy production i.e. one hundred
times the 2002 capacity. Almost as much investment in the grid
system as in power plants is necessary.
Between 2010 and 2020, further construction is expected to take
the total gross capacity to 21,180 MWe. The nuclear capacity
target is part of the national energy policy. This planned
increment includes the initial 300 MWe Advanced Heavy Water
Reactor (AHWR).
Box 3.4.2 : India's Nuclear Power Potential
§India has a flourishing and largely indigenous nuclear power programme and expects to have 20,000 MWe nuclear capacity on
line by 2020. It aims to supply 25 per cent of electricity from nuclear power by 2050.
§Because India is outside the Nuclear Non-Proliferation Treaty, due to its weapons programme, it has been for 34 years largely
excluded from trade in nuclear plant or materials, which has hampered its development of civil nuclear energy.
§Due to these trade bans and lack of indigenous uranium, India has uniquely been developing a nuclear fuel cycle to exploit its
reserves of thorium.
Source: Ministry of New and Renewable Energy, 2007
Table 3.4.5: Estimated Potential for Renewable Energy Technologies in India
SI.No.
Source / Systems Approximate Potential
1 Biogas Plants 120 lakh W
2 Improved Chulhas 1200 lakh W
3 Wind 45000 MW
4 Small Hydro Projects 15000 MW
5 Biomass 19500 MW
6 Biomass Gasifiers NA
7 Solar PV 20 MW/sq.km
8 Waste to Energy 2500 MW
9 Solar Water Heating 140 Million sq.m Collector Area
NA: Not Available
b) Bioenergy
For India, biomass has always been an important energy source.
Although the energy scenario in India today indicates a growing
dependence on the conventional forms of energy, about 32 per
cent of the total primary energy use in the country is still derived
from biomass and more than 70 per cent of the country's
population depends upon it for its energy needs.
India produces a huge quantity of biomass material in its
agricultural, agro-industrial and forestry operations. According
to some estimates, over 500 million tonnes of agricultural and
agro-industrial residue is generated every year. This quantity, in
terms of heat content, is equivalent to about 175 million tonnes
of oil. A portion of these materials is used for fodder and fuel in
the rural economy. However, studies have indicated that at least
150-200 million tonnes of this biomass material does not find

Key Environmental Issues-Energy Security123
State Of Environment Report-2009 122
d) Geothermal Energy
It has been estimated by the Geological Survey of India that the
geothermal potential is in the region of 10,000 MWe, widely
distributed between seven geothermal provinces. The provinces,
although found along the West Coast in Gujarat and Rajasthan
and along a West-Southwest - East-Northeast line, running from
the west coast to the western border of Bangladesh, are most
prolific in a 1,500 km stretch of the Himalaya. The resource is
little used at the moment but the government has an ambitious
plan to more than double the current total installed generating
capacity by 2012. This would be achieved by utilizing both
conventional fossil fuels and the range of renewable energies at
India's disposal (bioenergy, hydro, geothermal, solar and wind).
The Tattapani field in the far Northwest of the Himalaya is
estimated to have a potential of one MW and if this could be
developed it would substantially benefit the isolated villages in
the mountainous areas. Direct utilization is almost entirely for
bathing and balneological purposes but greenhouse cultivation
of fruits could be developed extensively in future by harnessing
this resource.
e) Wind Energy
The Indian Wind Power Programme was initiated in 1983-84 and
a Wind Energy Data Handbook published in 1983 by the
Ministry of New and Renewable Energy, served as a data source
for early government initiatives. In 1985, an extensive Wind
Resource Assessment was launched, which also signalled the
beginning of concentrated development and harnessing of
renewable sources of energy and, more specifically, of wind
energy. To date, seven volumes of the Handbook on Wind Energy
Resource Survey, containing a huge volume of accumulated
wind data, have been published. It is being implemented through
the state Nodal Agencies and the Centre for Wind Energy
Technology (C-WET). C-WET, an autonomous R&D
institution, established by the Ministry and based in Chennai,
acts as a technical focal point for wind power development in
India.
Estimates of the Indian wind resource have put it at about 45,000
MW, assuming 3 per cent land availability for wind farms
requiring 12 ha/MW, at sites having adequate wind power
density in excess of locations with abundant wind have been
identified in the following ten states: Andhra Pradesh, Gujarat,
Karnataka, Kerala, Madhya Pradesh, Maharashtra, Orissa,
Rajasthan, Tamil Nadu and West Bengal. In terms of currently
installed wind turbine capacity, India ranks fourth in the world
after Germany, Spain and the USA. At the end of 2005, the figure
stood at 4,434 MW. Tamil Nadu possessed over 57 per cent of the
commercial plants.
By the end of September 2006, the installed capacity had already
grown to 6,018 MW. Demonstration projects, which began in
1985, are being implemented in areas not already having
projects but where potential for commercial development exists.
In early 2006, total demonstration capacity amounted to 68 MW.
Use is being made of wind-diesel hybrid projects where an area
is dependent on diesel fuel. A project with a capacity of 2x50
KW has been commissioned in the Sagar Islands in West Bengal.
Phase II (8x50 KW) of the project is expected to be
commissioned shortly. The strong growth in the Indian wind
energy market is expected to continue and even accelerate, as a
result of a range of Government and State-led financial
incentives ( Table 3.4.6).
much productive use, and can be made available for alternative
uses at an economical cost. These materials include a variety of
husks and straws. This quantity of biomass is sufficient to
generate 15,000 to 25,000 MW of electrical power at a typically
prevalent plant.
In India, more than 2,000 gasifiers are estimated to have been
established with a capacity in excess of 22 MW and a number of
villages have been electrified with biomass gasifier based
generators. MNRE has actively promoted research and
development programmes for efficient utilization of biomass
and agrowastes and further efforts are on in this direction.
c) Solar Energy
The Ministry of New and Renewable Energy (MNRE), formerly
the Ministry of Non Conventional Energy Sources (MNES),
working in conjunction with the Indian Renewable Energy
Development Agency (IREDA) continues to promote the
utilization of all forms of solar power as part of its drive to
increase the share of renewable energy in Indian market. This
promotion is being achieved through R&D, demonstration
projects, government subsidy programmes, programmes based
on cost recovery supported by IREDA, and also private sector
projects. India receives a good level of solar radiation, energy
equivalent of more than 5,000 trillion KWh/year.
Depending on the location, the daily incidence ranges from 4 to 7 2KWh/m , with the hours of sunshine ranging from 2,300 to 3,200
per year. Solar thermal and solar photovoltaic technologies are
both encompassed by the Solar Energy Programme that is being
implemented by the Ministry. The Programme, regarded as one
of the largest in the world, plans to utilize India's estimated solar 2 2power potential of 20 MW/km , and 35 MW/km solar thermal.
The country has also developed a substantial manufacturing
capability, becoming a lead producer in the developing world.
India's overall potential for solar water heating systems has been 2estimated to be 140 million m of collector area. Up to the present
2only about 1 million m of collector area has been installed, a low
level in comparison with the potential, and as compared with
other countries, notably China. A Government scheme for
'Accelerated development and deployment of Solar Water
Heating Systems in domestic, industrial and commercial sectors'
has been introduced, with the object of promoting the 2installation of another million m of collector area during
financial year 2005-06 and 2006-07. The scheme offers a
number of financial and promotional incentives, along with
other measures of support. The installation of Evacuated Tube
Collectors is being officially encouraged.
Solar Air Heating technology has been applied to various
industrial and agricultural processes (e.g. drying, curing,
regeneration of dehumidifying agents, timber seasoning, leather
tanning). For space heating, many types of solar dryers have
been developed for utilization in different situations. The
Government provides financial support for solar air
heating/drying systems, and also for solar concentrating systems 2such as the 160 m parabolic dish concentrator recently installed
for use in milk pasteurization at a dairy in Maharashtra.
Solar buildings have been promoted by the MNRE in an effort
to increase the energy efficiency. The state government in
Himachal Pradesh has actively promoted the incorporation of
passive solar design into the building design.
The Solar Photovoltaic Programme (SPV), promoted by the
Ministry for the past two decades, has been aimed particularly at
rural and remote areas. Following the success of the country-
wide SPV demonstration and utilization programme during the thperiod of the IX Plan, it was planned, with certain
thmodifications, to continue it during the X Plan (2002-2007).
Of the approximately 80,000 villages not currently connected to
the grid, about 18,000 are too remote to be considered. The
Ministry has the objective that by 2010 they will all have access thto power from renewable energy sources, with the X Plan
providing electrification for the 5,000 of them. During 2005-06,
the Ministry supported the supply of solar lanterns to certain un-
electrified villages.
In a country where agriculture is a major component of the
economy, the SPV Water Pumping Programme will continue to
subsidize the large-scale use of PV-powered (1800 Wp)
pumping systems for farmers. The Ministry is also implementing
a programme for water-pumping windmills, small
aerogenerators and wind-PV hybrid systems to enable the
considerable Indian wind resource to be harnessed in
conjunction with the available solar power. These applications
will be fully researched and demonstrated prior to deployment in
remote areas.
The MNRE is developing a chain of Akshay Urja Shops
(previously called Aditya Solar Shops). These are showroom-
cum-sales and service centres, initially established to sell solar
energy products; their scope has now been widened to cover all
renewable energy systems and devices. So far, 104 shops have
been opened in 28 States and Union Territories, and the Ministry
has planned for at least one such shop to exist in each district
throughout the country.
Biofuel : A main source of cooking in rural India
Source: Ministry of New and Renewable Energy, 2007
Table 3.4.6 : State-wise Wind Power Installed capacity
2001-02 2002-03 2003-04 2004-05 2005-06 2006-07
1 2 3 4 5 6 7 8
1 Andhra Pradesh 0.7 0.0 6.2 21.8 126.1 121.60
2 Gujarat 0.0 6.2 28.9 51.5 287.8 401.40
3 Karnataka 24.0 55.6 84.9 201.5 487.0 745.60
4 Kerala 0.0 0.0 0.0 0.0 2.0 2.00
5 Madhya Pradesh 0.0 0.0 0.0 6.3 35.1 54.90
6 Maharashtra 209.4 2.0 6.2 48.8 654.6 1283.70
7 Rajasthan 8.8 44.6 117.8 106.3 312.6 444.80
8 Tamil Nadu 44.0 133.6 371.2 675.5 2526.7 3216.10
9 West Bengal 0.6 0.0 0.0 0.0 1.1 1.10
10 Others 0.0 0.0 0.0 0.0 1.6 3.20
Wind Power Installed Capacity (MW)
StateSlNo.
287.5 242.0 615.2 1111.7 4434.6 6274.40Total

Key Environmental Issues-Energy Security125
State Of Environment Report-2009 124
f) Tidal Energy
The main potential sites for tidal power generation are the Gulf
of Kutch and the Gulf of Khambhat (Cambay), both in the
western state of Gujarat, and the Gangetic delta in the
Sundarbans area of West Bengal, in eastern India. The tidal
ranges of the Gulf of Kutch and the Gulf of Khambhat are 5 and
6 metres, the theoretical capacities 900 and 7,000 MW, and the
estimated annual output approximately 1.6 and 16.4 TWh,
respectively. The West Bengal Renewable Energy Development
Agency (WBREDA) prepared a project report, for a 3.65 MW
demonstration tidal power plant at Durgaduani Creek in the
Sundarbans. This was followed by an environmental impact
assessment study. In February, 2007, the WBREDA stated that it
had engaged the National Hydroelectric Power Corporation to
implement the Rs 400 million (approximately US$ 10 million)
project on a turnkey basis, with the work likely to begin in the
near future.
g) Wave Energy
The Indian Wave Energy Programme started in 1983 at the
Indian Institute of Technology (IIT) under the sponsorship of the
Indian Department of Ocean Development. Initial research
identified the OWC as the most suitable for Indian conditions. A
150 KW pilot OWC was built onto the breakwater of the
Vizhinjam Fisheries Harbour, near Trivandrum (Kerala), with
commissioning in October 1991. The scheme operated
successfully, producing data that was used for the design of a
superior generator and turbine. An improved power module was
installed at Vizhinjam in April 1996, which in turn led to the
production of new designs for a breakwater comprising ten
caissons with a total capacity of 1.1 MW. However, this does not
appear to have been taken any further. The National Institute of
Ocean Technology has succeeded IIT and continues to research
wave energy, including the Backward Bent Duct Buoy (a variant
of the OWC design).
h) Ocean Thermal Energy Conversion
Having an extremely long coastline, a very large EEZ area and
suitable oceanic conditions, India's potential for OTEC is
extensive. Conceptual studies on OTEC plants for Kavaratti
(Lakshadweep Islands), in the Andaman and Nicobar Islands
and off the Tamil Nadu coast at Kulasekharapatnam were
initiated in 1980. In 1984, a preliminary design for a 1 MW
(gross) closed Rankine Cycle floating plant was prepared by the
Indian Institute of Technology in Madras at the request of the
Ministry of Non-Conventional Energy Resources. The National
Institute of Ocean Technology (NIOT) was formed by the
governmental Department of Ocean Development in 1993 and
in 1997, the government proposed the establishment of a 1 MW
plant of earlier studies. NIOT signed a Memorandum of
Understanding with Saga University in Japan for the joint
development of the plant near the port of Tuticorin (Tamil Nadu).
During 2001, the Department of Ocean Development undertook
an exercise to determine the actions required to maximise the
country's potential from its surrounding ocean. The result was a
Vision Document and a Perspective Plan 2015 (forming part of ththe X five year plan), in which all aspects of the Indian Ocean
will be assessed, from the forecasting of monsoons through the
modelling of sustainable uses of the coastal zone to the mapping
of ocean resources, etc. It has been postulated that most of
India's future fully-commercial OTEC plants will be closed
cycle floating plants in the range of 10 to 50 MW (although 200
to 400 MW plants are not ruled out). Working with Saga
University, NIOT had planned to deploy the 1 MW
demonstration plant in March/April, 2003. However,
mechanical problems prevented total deployment and the launch
was delayed. Following the testing, it was planned to relocate the
plant to the Lakshadweep Islands for power generation prior to
full commercial operation from scaled-up plants. No further
progress has been reported so far.
In recent years, India's energy consumption has been increasing
at one of the fastest rates in the world owing to population growth
and economic development (Figure 3.4.3). Primary commercial
energy demand grew at the rate of 6 per cent between 1981 and
2001 (Planning Commission 2002). India ranks fifth in the world
in terms of primary energy consumption, accounting for about
3.5 per cent of the world commercial energy demand in the year
2003. Despite the overall increase in energy demand, per capita
energy consumption in India is still very low compared to other
developing countries. Despite the increasing dependency on
commercial fuels, a sizeable quantum of energy requirement
(40 per cent of total energy requirement), especially in the rural
household sector, is met by non-commercial energy sources,
which includes fuelwood, crop residue, and animal waste,
including human and draught animal power. However, other
forms of commercial energy of a much higher quality and
efficiency are steadily replacing the traditional energy resources
being consumed in the rural sector.
Resource augmentation and growth in the energy supply has not
kept pace with the increasing demand and, therefore, India
continues to face serious energy shortages. This has led to
increased reliance on imports to meet the energy demand.
ENERGY CONSUMPTION
Source: Planning Commission of India, 2006
Figure 3.4.3: Primary Energy Sources of India
Nuclear2%
Coal51%
Oil36%
Gas9%
Hydro 2%
Primary Energy Sources (%)
Agriculture Sector
Till the 1950s, use of tractors for agriculture was very limited.
Tractor manufacturing in India started in 1961 with aggregate
capacity to manufacture 11,000 tractors. Joint efforts made by
the government and private sector have led to a steady increase in
the level of mechanization over the years.
Given that rains are not always timely and evenly distributed,
farmers prefer pump sets as a more reliable and assured source of
irrigation; as a result, energization of pump sets have been
stincreasing rapidly. As on 31 March 2004, 14.1 million pump
sets had been energized. Maharashtra has the maximum number
of energized pump sets (2.4 million), followed by Andhra
Pradesh (2.3 million). Earlier, the average capacity of the pump
sets was 3.68 KW and a pump set on an average consumed 6004
kWh of electricity in that year (Central Electricity Authority,
2005). However, owing to insufficient electricity supplies, some
farmers have also procured diesel pump sets as a standby. In the
recent past, concerted efforts of the government have led to the
Source: Annual Report , Ministry of New and Renewable Energy2007-08
Table 3.4.7 : Renewable Energy: Estimated Potential and Cumulative Achievements as on 31.12.2007
Sl. No. Source / SystemsEstimatedPotential
CumulativeAchievements
I. Rural and Decentralized Energy Systems
1 Family type Biogas Plants(nos.) 120 lakh 39.40 lakh
2 Solar Photovoltaic Programme 50 MW/Sq.km. 110 MWp
i. Solar Street Lighting System NA 69,549 nos.
ii. Home Lighting System NA 3,63,399 nos.
iii. Solar Santam NA 5,85,001 nos.
iv. Solar Power Plants NA 2.18 MWp
3 Solar Thermal Programme NA
i. Solar Water Heating Systems
140 millionsq.m. collector area
2.15 millionsq.m. collector area
ii. Solar Cookers NA 6.17 lakh
4 Wind Pumps NA 1284 nos.
5 Aero-generator / Hydro Systems NA 675.27 KW
6 Solar Photovoltaic Pumps NA 7068 nos.
II. Remote Village Electrification NA 3368 / 830villages /hamlets
III. Power from Renewables
A. Grid-interactive renewable power
7 Bio Power (Agro residues & Plantations) 16,881 605.80 MW
8 Wind Power 45,195 7,844.52 MW
9 Small Hydro Power (up to 25 MW) 15,000 2,045.61 MW
10 Cogeneration-bagesse 5,000 719.83 MW
11 Waste to Energy (Urban & Industrial) 2,700 55.25 MW
12 Solar Power 2.12 MW
Total (in MW) 84,776 11272.13 MW
B. Captive/CHP/Distributed renewable power
13 Biomass / Cogeneration (non-bagass) 95.00 MW
14 Biomass Gasfier NA 86.53 MW
15 Energy Recovery from Waste NA 23.70 MW
Total NA 205.23 MW
IV. Other Programmes
16 Energy Parks NA 504 nos.
17 Aditya Solar Shops NA 269 nos.
18 Battery Operated Vehicle NA 270 nos.
MW = Megawatt, KW = Kilowatt, KWp = Kilowatt peak, sq.m = square metre
NA NA
NA: Not Available
- -
-
- -
-
-
-
- -
-
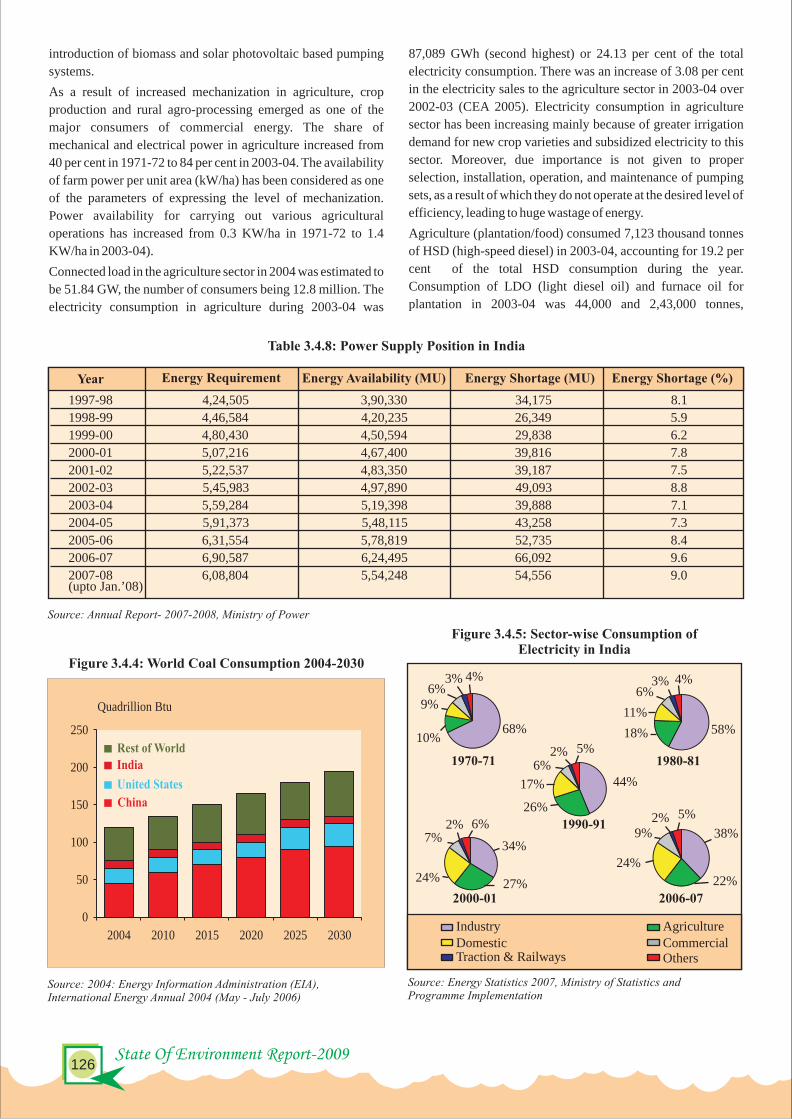
Key Environmental Issues-Energy Security127
State Of Environment Report-2009 126
Figure 3.4.4: World Coal Consumption 2004-2030
0
50
100
150
200
250
2004 2010 2015 2020 2025 2030
Source: 2004: Energy Information Administration (EIA), International Energy Annual 2004 (May - July 2006)
Rest of World
India
United States
China
Quadrillion Btu
Source: Annual Report- 2007-2008, Ministry of Power
Table 3.4.8: Power Supply Position in India
Year Energy Requirement Energy Availability (MU) Energy Shortage (MU) Energy Shortage (%)
1997-98 4,24,505 3,90,330 34,175 8.1
1998-99 4,46,584 4,20,235 26,349 5.9
1999-00 4,80,430 4,50,594 29,838 6.2
2000-01 5,07,216 4,67,400 39,816 7.8
2001-02 5,22,537 4,83,350 39,187 7.5
2002-03 5,45,983 4,97,890 49,093 8.8
2003-04 5,59,284 5,19,398 39,888 7.1
2004-05 5,91,373 5,48,115 43,258 7.3
2005-06 6,31,554 5,78,819 52,735 8.4
2006-07 6,90,587 6,24,495 66,092 9.6
2007-08(upto Jan.’08)
6,08,804 5,54,248 54,556 9.0
Figure 3.4.5: Sector-wise Consumption of Electricity in India
Source: Energy Statistics 2007, Ministry of Statistics and Programme Implementation
Industry AgricultureDomestic CommercialTraction & Railways Others
68%10%
9%6%
3% 4%
1970-71
58%18%
11%
6%3% 4%
1980-81
44%
26%
17%
6%2% 5%
1990-9138%
22%
24%
9%2% 5%
2006-07
34%
27%24%
7%2% 6%
2000-01
introduction of biomass and solar photovoltaic based pumping
systems.
As a result of increased mechanization in agriculture, crop
production and rural agro-processing emerged as one of the
major consumers of commercial energy. The share of
mechanical and electrical power in agriculture increased from
40 per cent in 1971-72 to 84 per cent in 2003-04. The availability
of farm power per unit area (kW/ha) has been considered as one
of the parameters of expressing the level of mechanization.
Power availability for carrying out various agricultural
operations has increased from 0.3 KW/ha in 1971-72 to 1.4
KW/ha in 2003-04).
Connected load in the agriculture sector in 2004 was estimated to
be 51.84 GW, the number of consumers being 12.8 million. The
electricity consumption in agriculture during 2003-04 was
87,089 GWh (second highest) or 24.13 per cent of the total
electricity consumption. There was an increase of 3.08 per cent
in the electricity sales to the agriculture sector in 2003-04 over
2002-03 (CEA 2005). Electricity consumption in agriculture
sector has been increasing mainly because of greater irrigation
demand for new crop varieties and subsidized electricity to this
sector. Moreover, due importance is not given to proper
selection, installation, operation, and maintenance of pumping
sets, as a result of which they do not operate at the desired level of
efficiency, leading to huge wastage of energy.
Agriculture (plantation/food) consumed 7,123 thousand tonnes
of HSD (high-speed diesel) in 2003-04, accounting for 19.2 per
cent of the total HSD consumption during the year.
Consumption of LDO (light diesel oil) and furnace oil for
plantation in 2003-04 was 44,000 and 2,43,000 tonnes,
Source: TERI, 2003
Figure 3.4.7: Projected Commercial Energy Consumption
1800
1500
900
1200
600
300
0
2001 2008 2011 2021 2028 20312018
Year
Sector-wise Commercial Energy Consumption in BAU
(mto
e)
Industry Transport Professional Agriculture Commercial
Coal Natural Gas Hydro Nuclear Renewable Diesel Total
Source: TERI, 2003
Figure 3.4.6: Projected Electricity Generation Capacity
74 100175
466
1431
118
137
69
116
158
125
216
441
795
0
100
200
300
400
500
600
700
800
900
2001 2011 2021 2031
GW
Year
22
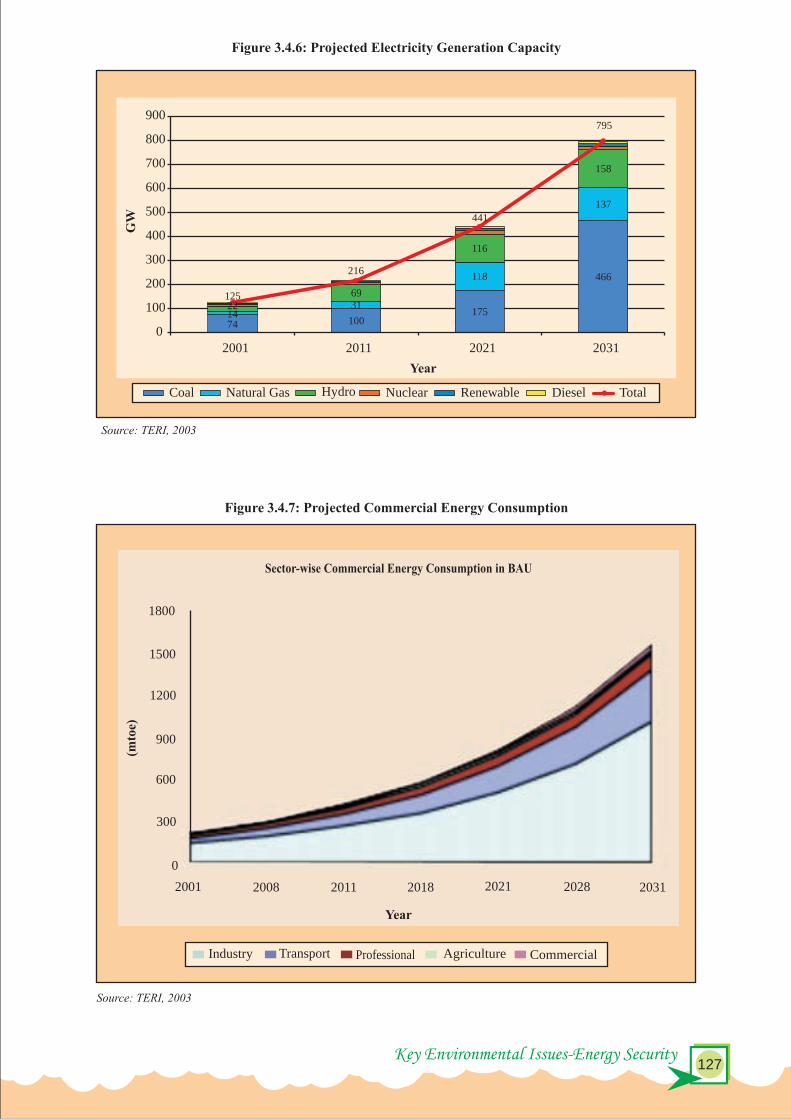

Key Environmental Issues-Energy Security129
State Of Environment Report-2009 128
crores) and a Standards Labeling Programme to promote energy
efficient equipments and appliances with an allocation of
Rs. 47.71 crores.
Integrated Energy Policy constituted by the Planning
Commission has in its report (IEPR) estimated the requirement
of primary energy supply to increase 3 to 4 times the 2003-04
level for an economy growing at around 8 to 9 per cent per
annum over the next 25 years. The country's electricity
generation capacity / supply would need to go up 6 to 7 fold from
the current installed capacity of around 1.15 lakh MW during
2003-04 to between 7.8 to 9.6 lakh MW by 2031-2032 (end of
XV Plan period). In addition, crude oil requirement would need
to increase 4 to 4.5 fold from the 2003-04 consumption level of
around 122 MMT to 486-548 MMT by 2031-2032.
(a) Enhancing Sustainable Development
This reduced energy intensity, at the relatively low level of
India's per-capita GDP, has been made possible by a range of
factors, including India's traditionally sustainable patterns of
consumption, enhanced competitiveness, pro-active policies to
promote energy efficiency, and more recently, the use of Clean
Development Mechanism to accelerate the adoption of clean
energy technologies.
(b) Increased Industrial Energy Efficiency
Over the past decade, energy efficiency in Indian industry has
increased steadily. In the major energy consuming industrial
sectors, such as cement, steel, aluminum, fertilizers, etc.,
average specific energy consumption has been declining owing
to energy conservation in existing units, and (much more) due to
the new capacity. In almost every industrial sector, some of the
world's most energy - efficient units are located in India.
The specific energy consumption in cement, iron and steel plants
in India has been declining rapidly. In the cement sector, the
specific energy consumption of the most efficient plants is now
comparable with the most efficient plants worldwide.
CURRENT STATUS AND POTENTIAL OF
CLEAN ENERGY
electricity with the focus on demand side management,
load management and technology upgradation to provide
energy efficient equipment / gadgets.
§Communication Strategy for political consensus with
media support to enhance public awareness.
Rural Electrification
Jharkhand, Bihar, Uttar Pradesh, Orissa, Uttranchal, West
Bengal etc. are some of the states where significant number
(more than 10 per cent) of villages are yet to be electrified.
§Number of Villages (1991 Census) - 593,732 th
§Villages Electrified (30 May 2006) - 488,173
§Village level Electrification - 82.2 per cent
Subsidies
Several state governments in India provide electricity at
subsidized rates or even free to some sections. This includes
electricity for use in agriculture and for consumption by
backward classes. The subsidies are mainly in the form of cross-
subsidization, with the other users such as industries and private
consumers paying the deficit caused by the subsidized charges
collected. Such measures have resulted in many of the state
electricity boards becoming financially weak.
Demand-side measures initiated by the Government
CDM Based CFL Scheme: The government has approved a
scheme of Rs. 48 crores to promote replacement of incandescent
bulbs with Compact Fluorescent Lamps (CFLs) by leveraging
the sale of Certified Emission Reductions (CERs) under the
Clean Development Mechanism (CDM) of Kyoto Protocol. The
Bureau of Energy Efficiency (BEE) is coordinating voluntary
efforts to provide high-quality CFLs to domestic consumers.
This will reduce CO emission and help avoid the consumption 2
of 6,000 to 10,000 MW.
Energy Conservation Building Code (ECBC): The ECBC has
been launched to reduce energy consumption in new commercial
buildings.
Standards and Labeling Programme & Strengthening of
SDAs: The government has approved a scheme for capacity
building at the state level (with an approved cost of Rs 49.47
Hydro Power: A main source of energy in India
Source: Economic Survey of India,2007-2008
Box 3.4.3: Rajiv Gandhi Grameen Vidhyutikaran Yojana (RGGVY): Progress
§A total of 27 states and their utilities have signed the Memorandum of agreement agreeing to the conditionalities for
implementation of the programme as envisaged under RGGVY.
§CPSUs - Power Grid Corporation (India) Ltd. (PGCIL), National Thermal Power Corporation (NTPC), National Hydro-
electric Power Corporation (DVC) - have been allotted 139 districts for implementation of RGGVY.
§At present, 235 projects are under implementation covering 67,012 unelectrified villages and 83.1 lakh BPL households at
the awarded cost of Rs. 12,386.03 crore.
§In all 45,430 villages have been electrified and 18,25,508 connections to BPL households at the awarded cost of
Rs. 12,386.03 crores.
§Franchisees are in place in 73,422 villages in 14 States.
respectively, accounting for 2.7 per cent of the total LDO and
2.9 per cent of the total furnace oil consumed in the country.
Consumption of furnace oil for transport (agriculture retail
trade) in the agriculture sector was 94,000 tonnes (Ministry of
Power and Natural Gas 2004). However, it is difficult to assess
the total diesel consumption for agriculture from the available
data.
The electricity consumption in agriculture sector was 22 per cent
of the total electricity consumption during 2006-07 (Figure
3.4.5).
Industrial Sector
Of the total electricity consumed in 2006-07, industrial sector
accounted for the largest share. The industrial sector uses about
50 per cent of the total commercial energy available in India. Of
the commercial sources of energy, coal, lignite, oil and natural
gas are mainly used. The Indian industrial sector is highly energy
intensive and efficiency is well below that of other industrialized
countries. Efforts are made on a regular basis to promote energy
conservation in these countries as this will help reduce the cost of
production.
There is considerable scope for improving energy efficiency in
industries dealing with iron and steel, chemicals, cement, pulp
and paper, fertilizers, textiles, etc. If such industries adopt energy
conservation measures, it could lead to a substantial reduction in
their cost of production. Energy management is very important
and well planned actions can help reduce an organization's
energy bills and minimize its impact on the environment. The
two main energy management strategies are conservation and
efficiency. This requires the establishment of a system of
collection, analysis, and reporting on the organization's energy
consumption and costs.
In the industrial sector, the major consumers of energy are
fertilizer, textile, sugar, cement, and steel. It has been estimated
that the total conservation potential of this sector is around 25 per
cent of the entire energy used by it.
Domestic Sector
Of the total electricity consumed in 2006-07, industrial sector
accounted for the largest share, followed by the domestic sector.
Electricity consumption in domestic sector has increased at a
much faster pace as compared to other sectors during 1970-71 to
2006-07.
Transport Sector
Transport sector accounts for the lion's share (50.4 per cent) of
the total consumption of high speed diesel oil in India. In India,
transportation energy use increases by an average of 4.4 per cent
per year for light-duty vehicles, 2.9 per cent per year for
passenger rail, and 3.4 per cent per year for buses.
In the recent years, the government has rightly recognized the
energy security concerns of the nation and more importance is
being placed on energy independence.
India is probably the only country in the world with a full-
fledged ministry dedicated to the production of energy from
renewable energy sources. The Indian government is promoting
the use of ethanol made from sugar-cane and bio-diesel extracted
from trees that are common in many parts of India, such as
Jatropha, Karanja and Mahua. Additionally, India is emerging
as a growing market for solar, wind and hydroelectric power.
The Government of India has an ambitious mission of ‘Power for
all by 2012’. This mission would require that our installed
generation capacity should be at least 200,000 MW by 2012 from
the present level of 144,564.97 MW. Power requirement will
double by 2020 to 400,000MW.
Objectives
§Sufficient power to achieve the GDP growth rate of 8
per cent
§Reliable power
§Quality power
§Optimum power cost
§Commercial viability of power industry
§Power for all
Strategies
§Power Generation Strategy will focus on low cost
generation, optimization of capacity utilization, controlling
the input cost, optimization of fuel mix, Technology
upgradation and utilization of non-conventional energy
sources.
§Transmission Strategy will focus on development of
National Grid including Interstate connections, technology
upgradation and optimization of transmission cost.
§Distribution strategy to achieve distribution reforms with
the focus on system upgradation, loss reduction, theft
control, consumer service orientation, quality power supply
commercialization, decentralized distributed generation
and supply for rural areas.
§Regulation Strategy is aimed at protecting consumer
interests and making the sector commercially viable.
§Financing Strategy to generate resources for required
growth of the power sector.
§Conservation Strategy to optimize the utilization of
INDIA’S INITIATIVES TOWARDS
ENERGY SECURITY

Key Environmental Issues-Energy Security131
State Of Environment Report-2009 130
Energy Conservation potential in the industrial sector of our
nation has been projected between 30 to 40 per cent. Energy
conservation measures range from simple good house-keeping
practices to plant modernization.
To know the extent of energy that is being wasted, it is essential
to know what amount of energy is being consumed. Monitoring
industrial energy utilization on a continuous basis and relating it
to the production is the first step of any energy conservation
programme.
The industrial sector is a major energy-consuming sector
accounting for about 50 per cent of the commercial energy
available in the country. The total energy consumption,
including non-energy uses about 103.1 mtoe. Of the commercial
sources of energy, coal and lignite account for 56 per cent, oil
and natural gas 40 per cent, hydroelectric power 3 per cent and
nuclear power 1 per cent.
Source: India: addressing energy security & climate change, MoEF, MoP & BEE, 2007
Figure 3.4.8: Trends in Thermal Specific Energy Consumption in the Indian Cement Sector
3
5
6
7
8
1995 1996 1997 1998 1999 2000 2001 2002 2003 2004 20062005
Sp
ecif
ic E
ner
gy C
on
sum
pti
on
GJ/t
4
Rate of reduction: 0.35GJ/t
7.5%p.a2r : 0.97
Source: Bureau of Energy Efficiency,2006
Figure 3.4.9: Trends in Thermal Specific Energy Consumption in the Indian Iron & Steel Sector
1995
Sp
ecif
ic E
ner
gy C
onsu
mp
tion
GJ/
t
15
19
17
21
23
27
25
29
31
1996 1997 19991998 2000 2001 2002 20052003 2004 2006
Rate of reduction: 0.8GJ/t
3.5%p.a2r : 0.59
Source: Gujarat Energy Development Agency, 2007
Table 3.4.9: Energy Conservation Potential in Indian Industries
Share of Energyin Production Cost (%)
Refineries 1.0 8-10
Sugar 3.4 25-30
Ferrous Foundry 10.5 15-20
Textile 10.9 20-25
Petrochemical 12.7 10-15
Chloro-alkali 15.0 10-15
Iron & Steel 15.8 8-10
Fertilizers & Pesticides 18.3 10-15
Pulp & Paper 22.8 20-25
Glass 32.5 15-20
Ceramics 33.7 15-20
Aluminium 34.2 8-10
Cement 34.9 10-15
Ferro-alloys 36.5 8-10
Industries Conservation Potential(%)
Source: USIAD ECO-Asia Clean Development & Climate Programme, 2006
Table 3.4.10: Summary of Energy Related Laws and Policy Decrees
Year Title Main Thrust
2006 Rural Electrification PolicyEstablishes a national goal for universal access, assigns responsibilities for implementation, and creates new financing arrangements.
2006 National UrbanTransport Policy
Encourages integrated land use and transportation planning in cities.
2006 National Tariff Policy Provides guidance on establishing power purchase tariffs by State Electricity Regulatory Commissions.
2005 National Electricity Policy Provides guidance for accelerated development of the power sector.
2003 Electricity Act Legislates a comprehensive reform and liberalization process for the power sector.
2001 Energy Conservation Act Provides the legal framework and institutional arrangements for embarking on a national energy efficiency drive.
2001 Accelerated Power Developmentand Reforms Programme
Establishes intervention strategies for distribution reforms in the power sector.

Key Environmental Issues-Energy Security133
State Of Environment Report-2009 132
(i) Electricity from Renewable Sources
The Electricity Act, 2003, requires State Electricity Regulatory
Commissions to specify a percentage of electricity that the
electricity distribution companies must procure from renewable
sources. This Act also notified preferential prices for electricity
from renewable sources. This has significantly contributed to
acceleration in renewable electricity capacity addition, and over
the past three years, about 2000 MW of renewable electricity
capacity has been added in India every year, bringing the total
installed renewable capacity to over 11,000 MW. Of this, a little
over 7,000 MW is based on wind power; India now has the fourth
largest installed wind capacity in the world. The National Hydro
Energy Policy has resulted in the accelerated addition of
hydropower in India, which is now over 35,000 MW. The growth
of electricity from renewable sources has been accelerated by the
legislative mandate for its procurement.
(ii) Enhancing Efficiency of Power Plants
Coal is the mainstay of India's energy economy, and coal-based
power plants account for about two-thirds of the total electric
generation installed capacity of about 135,000 MW. In addition,
the Electricity Regulatory Commissions are also linking tariffs
to efficiency enhancement, thus providing an incentive for
renovation and modernization. New plants are being encouraged
to adopt more efficient and clean coal technologies, and four new
plants under construction have adopted the more efficient
supercritical technology for power generation.
(iii) Introduction of Labeling Programme for Appliances
An energy labeling programme for appliances was launched in
2006, and comparative star-based labeling has been introduced
for fluorescent tube lights, air conditioners, and distribution
transformers. The labels provide information about the energy
consumption of an appliance, and thus enable consumers to
make informed decisions. Almost all fluorescent tube lights sold
in India, and about two-thirds of the refrigerators and air
conditioners, are now covered by the labeling programme.
(iv) Energy Conservation Building Code
An Energy Conservation Building Code (ECBC) was launched
in May, 2007, which addresses the design of new, large
commercial buildings to optimize the building's energy
efficiency. Commercial buildings are one of the fastest growing
sectors of the Indian economy, reflecting the increasing share of
the service sector in the economy. Nearly one hundred buildings
are already following the Code, and compliance with it has also
been incorporated into the Environmental Impact Assessment
requirements for large buildings.
(v) Energy Audits of Large Industrial Consumers
In March 2007, the conduct of energy audits was made
mandatory for large energy-consuming units in nine industrial
sectors. These units, notified as ‘designated consumers’ are also
required to employ ‘certified energy managers’, and report
energy consumption and energy conservation data annually.
(vi) Accelerated Introduction of Clean Energy Technologies
through the CDM
Over 700 CDM projects have been approved by the CDM
National Designated Authority, and about 300 of these have been
registered by the CDM Executive Board. The registered projects
have already resulted in over 27 million tonnes of certified CO2
emission reductions, and directed investment in renewable
energy and energy projects by reducing the perceived risks and
uncertainties of these new technologies, thereby accelerating
their adoption.
Clean Transport
Recognizing the merits of biofuels, Government of India has
identified ethanol and biodiesel as the key focus areas. Both are
in early stages of commercialization. In 2004, the government
mandated five percent blending of petrol with ethanol, subject to
certain conditions, following a Memorandum of Understanding
between the Indian Sugar Mills Association and Indian Oil
Corporation. An autonomous National Biodiesel Board is being
created to promote, finance, and support organizations that are
engaged in the field of oilseed cultivation and oil processing
leading to biodiesel production. In 2005, the Government of
India adopted the Biodiesel Purchase Policy. The policy
prescribes that oil marketing companies in the public sector
should purchase biodiesel of prescribed Bureau of Indian
Standards (BIS) specification from registered authorized
suppliers at a uniform price, to be reviewed every six months.
Some public sector oil companies are already experimenting
with various mixes of biodiesel with diesel in state transport
buses, and are engaged in ongoing discussions with the
automobile industry to share results.
The National Urban Transport Policy (NUTP) of the Ministry of
Urban Development seeks to encourage integrated land use and
transport planning in cities, and focuses on greater use of public
transport and non-motorized modes by offering central financial
assistance. The policy incorporates urban transportation as an
important parameter at the urban planning stage.
The National Auto Fuel Policy of 2003 provides a roadmap for
achieving various vehicular emission norms over a period of
time and the corresponding requirements for upgrading fuel
quality. While it does not recommend any particular fuel or
technology for achieving the desired emission norms, it suggests
that liquid fuels should remain the main auto fuels throughout the
country and that the use of CNG/LPG be encouraged in cities
affected by higher pollution levels so as to enable vehicle owners
to have the choice of the fuel and technology combination.
REFERENCES
§Annual Report 2006-07, Ministry of New and Renewable
Energy
§Energy Statistics 2007, Ministry of Statistics and
Programme Implementation
§Bureau of Energy Efficiency, Ministry of Power
§India Country Report from Ideas to Action: Clean Energy
Solution for Asia to Address Climate Change. International
Conference on Asia's Emerging Response to Climate
Change. Bangkok, Thailand 23 November 2007
§India: Addressing Energy Security and Climate Change,
October 2007, MoEF, Ministry of Power, Bureau of Energy
Efficiency, Government of India
§International Energy Outlook 2008, Energy Information
Administration, US Department of Energy
§Planning Commission, Government of India
§Pradeep Kumar Dadhich. Potential for CCS in India:
Opportunities and Barriers Opportunities and Barriers.
Expert Group Meeting on Carbon Dioxide Capture and
Storage and Sustainable Development. United Nations
Department of Economic and Social Affairs, 2007
§Survey of Energy Resources, World Energy Council 2007
§Shukla P.R. (1996). Greenhouse Gas Mitigation for India:
Future Emissions, Policy Analysis and Perspectives on
Modelling, AIM Interim Paper, Tsukuba, Japan
Bio Methanation Plant at Chennai
Figure 3.4.10: Energy Labels for Refrigerators and Fluorescent Lamps

Key Environmental Issues- Managing Urbanization135
State Of Environment Report-2009 134
towns also increased from 1916 in 1901 to 2,422 in 1951 and
then to 4,689 in 1991. This reveals the rapid urbanization process
in India (Figure 3.5.1).
MANAGINGMANAGINGURBANIZATIONURBANIZATION
b) Percentage of Urban Population in India by Size-Class of
Urban Centres, 1961-1991: The process of urbanization in
India reflects a certain degree of skewness because of the fact
that more than 60 per cent of the urban population of the country
lives in Class I towns alone and the remaining below 40 per cent
urban population lives in the smaller sized towns. An unremitting
increase has been noticed for percentage of total urban
population in Class I cities over the decades (1901 to 1991),
while class IV, V and VI towns have experienced a continuous
decline. However, class II and III towns have almost a constant
percentage of total urban population over the decades. About
three-fold increase has been observe in the percentage of total
urban population in Class I cities, from 23 per cent in 1901 to 65
per cent in 1991. This depicts a huge concentration of urban
population in large cities. The urbanization in India shows the
pattern of 'inverted triangle' where majority of the urban
population resides in the Class I cities.
Urbanization refers to the phenomenon in which an increasing
proportion of the population lives in cities and the suburbs of
cities. Historically, it has been closely connected with
industrialization. When more and more inanimate sources of
energy were used to enhance human productivity
(industrialization), surpluses increased in both agriculture and
industry. Increasingly larger proportions of population could
live in cities. Economic forces were such that cities became the
ideal places to locate factories and their workforce.
In 1901, only 11 per cent of the total population was urbanized.
There were 1,834 towns and cities. By 1951, urban population
had grown to 6.16 crore comprising 17.6 per cent of the total
population. Thus from 1901 to 1951, the growth in urban
population was 240 per cent while that from 1951 to 2001 was
about 450 per cent. The rapid growth in the last few decades has
been because of rapid industrialization and migration to urban
areas, 50 per cent of which are from rural areas. The 2001 census
of India depicts that of the total population of 1,028 million,
about 72.2 per cent (742 million) live in rural areas and 27.8 per
cent (285 million) in urban areas (Table 3.5.1).
a) The pattern and trend of urban population and number of
towns in India during 1901 to 2001 depict that total urban
population has increased more than ten times from 26 millions to
285 million, whereas the total population has increased less than
five times from 238 million to 1,028 million from 1901 to 2001.
A continuous increase has been noticed in the percentage of
urban population from 11 per cent in 1901 to 17 per cent in 1951
to further 28 per cent in 2001. In the same fashion, the number of
PATTERN AND TREND OF
URBANIZATION IN INDIA
Urban housing needs proper planning
Source : Census of India, 2001
Table 3.5.1 : Pattern and Trend of Urbanization in India 1901-2001
CensusYears
Numberof
2Towns
1901 1916
1911 1908
1921 2048
1931 2220
1941 2422
1951 3060
1961 2700
1971 3126
1981 4029
1991 4689
2001 5161
1Excluding Assam in 1981 and Jammu and Kashmir in 1991
3Provisional Figures of 2001 Census
2Constituents of cities and towns of urban agglomerations have been counted as separate units
UrbanPopulation(in million)
Percentageof Urban
Population
AnnualExponential
GrowthRate
Rate ofUrbanization
25.9 10.8 - -
25.9 10.3 0.0 -0.46
28.1 11.2 0.8 0.87
33.5 12.0 1.7 0.71
44.2 13.8 2.8 1.50
62.4 17.3 3.5 2.54
78.9 18.0 2.3 0.40
109.1 19.9 3.2 1.06
159.5 23.3 3.8 1.72
217.6 25.7 3.1 1.023284.5 27.8 2.7 0.82
62.4
78.9109.1
159.4
217.6
287.6
0
50
100
150
200
250
300
350
1951 1961 1971 1981 1991 2001
Urb
an P
opu
lati
on (
mil
lion
)Year
Source: Census of India, 2001
Figure 3.5.1: Growth in the Size of Urban Population in India, 1901-2001

Key Environmental Issues- Managing Urbanization135
State Of Environment Report-2009 134
towns also increased from 1916 in 1901 to 2,422 in 1951 and
then to 4,689 in 1991. This reveals the rapid urbanization process
in India (Figure 3.5.1).
MANAGINGMANAGINGURBANIZATIONURBANIZATION
b) Percentage of Urban Population in India by Size-Class of
Urban Centres, 1961-1991: The process of urbanization in
India reflects a certain degree of skewness because of the fact
that more than 60 per cent of the urban population of the country
lives in Class I towns alone and the remaining below 40 per cent
urban population lives in the smaller sized towns. An unremitting
increase has been noticed for percentage of total urban
population in Class I cities over the decades (1901 to 1991),
while class IV, V and VI towns have experienced a continuous
decline. However, class II and III towns have almost a constant
percentage of total urban population over the decades. About
three-fold increase has been observe in the percentage of total
urban population in Class I cities, from 23 per cent in 1901 to 65
per cent in 1991. This depicts a huge concentration of urban
population in large cities. The urbanization in India shows the
pattern of 'inverted triangle' where majority of the urban
population resides in the Class I cities.
Urbanization refers to the phenomenon in which an increasing
proportion of the population lives in cities and the suburbs of
cities. Historically, it has been closely connected with
industrialization. When more and more inanimate sources of
energy were used to enhance human productivity
(industrialization), surpluses increased in both agriculture and
industry. Increasingly larger proportions of population could
live in cities. Economic forces were such that cities became the
ideal places to locate factories and their workforce.
In 1901, only 11 per cent of the total population was urbanized.
There were 1,834 towns and cities. By 1951, urban population
had grown to 6.16 crore comprising 17.6 per cent of the total
population. Thus from 1901 to 1951, the growth in urban
population was 240 per cent while that from 1951 to 2001 was
about 450 per cent. The rapid growth in the last few decades has
been because of rapid industrialization and migration to urban
areas, 50 per cent of which are from rural areas. The 2001 census
of India depicts that of the total population of 1,028 million,
about 72.2 per cent (742 million) live in rural areas and 27.8 per
cent (285 million) in urban areas (Table 3.5.1).
a) The pattern and trend of urban population and number of
towns in India during 1901 to 2001 depict that total urban
population has increased more than ten times from 26 millions to
285 million, whereas the total population has increased less than
five times from 238 million to 1,028 million from 1901 to 2001.
A continuous increase has been noticed in the percentage of
urban population from 11 per cent in 1901 to 17 per cent in 1951
to further 28 per cent in 2001. In the same fashion, the number of
PATTERN AND TREND OF
URBANIZATION IN INDIA
Urban housing needs proper planning
Source : Census of India, 2001
Table 3.5.1 : Pattern and Trend of Urbanization in India 1901-2001
CensusYears
Numberof
2Towns
1901 1916
1911 1908
1921 2048
1931 2220
1941 2422
1951 3060
1961 2700
1971 3126
1981 4029
1991 4689
2001 5161
1Excluding Assam in 1981 and Jammu and Kashmir in 1991
3Provisional Figures of 2001 Census
2Constituents of cities and towns of urban agglomerations have been counted as separate units
UrbanPopulation(in million)
Percentageof Urban
Population
AnnualExponential
GrowthRate
Rate ofUrbanization
25.9 10.8 - -
25.9 10.3 0.0 -0.46
28.1 11.2 0.8 0.87
33.5 12.0 1.7 0.71
44.2 13.8 2.8 1.50
62.4 17.3 3.5 2.54
78.9 18.0 2.3 0.40
109.1 19.9 3.2 1.06
159.5 23.3 3.8 1.72
217.6 25.7 3.1 1.023284.5 27.8 2.7 0.82
62.4
78.9109.1
159.4
217.6
287.6
0
50
100
150
200
250
300
350
1951 1961 1971 1981 1991 2001
Urb
an P
opu
lati
on (
mil
lion
)
Year
Source: Census of India, 2001
Figure 3.5.1: Growth in the Size of Urban Population in India, 1901-2001
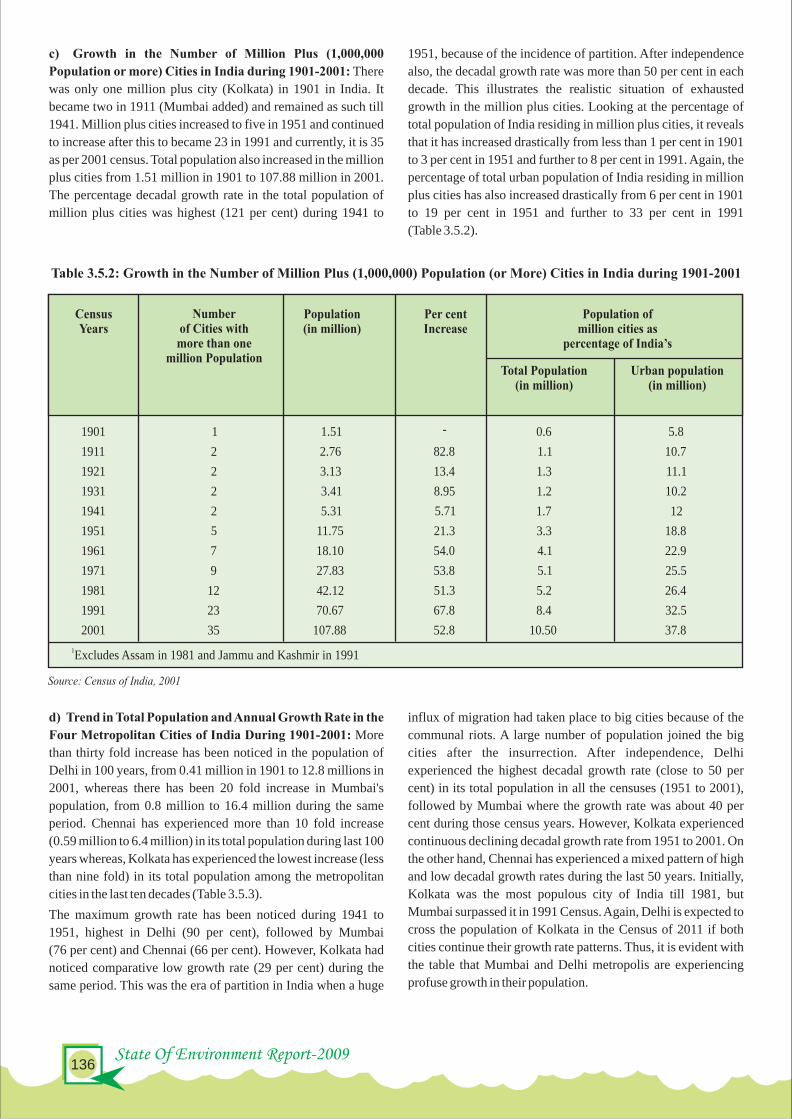
Key Environmental Issues- Managing Urbanization137
State Of Environment Report-2009 136
c) Growth in the Number of Million Plus (1,000,000
Population or more) Cities in India during 1901-2001: There
was only one million plus city (Kolkata) in 1901 in India. It
became two in 1911 (Mumbai added) and remained as such till
1941. Million plus cities increased to five in 1951 and continued
to increase after this to became 23 in 1991 and currently, it is 35
as per 2001 census. Total population also increased in the million
plus cities from 1.51 million in 1901 to 107.88 million in 2001.
The percentage decadal growth rate in the total population of
million plus cities was highest (121 per cent) during 1941 to
1951, because of the incidence of partition. After independence
also, the decadal growth rate was more than 50 per cent in each
decade. This illustrates the realistic situation of exhausted
growth in the million plus cities. Looking at the percentage of
total population of India residing in million plus cities, it reveals
that it has increased drastically from less than 1 per cent in 1901
to 3 per cent in 1951 and further to 8 per cent in 1991. Again, the
percentage of total urban population of India residing in million
plus cities has also increased drastically from 6 per cent in 1901
to 19 per cent in 1951 and further to 33 per cent in 1991
(Table 3.5.2).
influx of migration had taken place to big cities because of the
communal riots. A large number of population joined the big
cities after the insurrection. After independence, Delhi
experienced the highest decadal growth rate (close to 50 per
cent) in its total population in all the censuses (1951 to 2001),
followed by Mumbai where the growth rate was about 40 per
cent during those census years. However, Kolkata experienced
continuous declining decadal growth rate from 1951 to 2001. On
the other hand, Chennai has experienced a mixed pattern of high
and low decadal growth rates during the last 50 years. Initially,
Kolkata was the most populous city of India till 1981, but
Mumbai surpassed it in 1991 Census. Again, Delhi is expected to
cross the population of Kolkata in the Census of 2011 if both
cities continue their growth rate patterns. Thus, it is evident with
the table that Mumbai and Delhi metropolis are experiencing
profuse growth in their population.
d) Trend in Total Population and Annual Growth Rate in the
Four Metropolitan Cities of India During 1901-2001: More
than thirty fold increase has been noticed in the population of
Delhi in 100 years, from 0.41 million in 1901 to 12.8 millions in
2001, whereas there has been 20 fold increase in Mumbai's
population, from 0.8 million to 16.4 million during the same
period. Chennai has experienced more than 10 fold increase
(0.59 million to 6.4 million) in its total population during last 100
years whereas, Kolkata has experienced the lowest increase (less
than nine fold) in its total population among the metropolitan
cities in the last ten decades (Table 3.5.3).
The maximum growth rate has been noticed during 1941 to
1951, highest in Delhi (90 per cent), followed by Mumbai
(76 per cent) and Chennai (66 per cent). However, Kolkata had
noticed comparative low growth rate (29 per cent) during the
same period. This was the era of partition in India when a huge
§The multiplicity of local bodies obstructs efficient planning
and land use.
§Rigid master plans and restrictive zoning regulations limit
the land available for building, constricting cities' abilities
to grow in accordance with changing needs.
2) Migration / Agglomeration
Urban agglomeration is a continuous urban spread constituting a
town and its adjoining urban Out Growths (OGs) or two or more
physically contiguous towns together and any adjoining urban
outgrowths of such towns.
Following are the possible different situations in which urban
agglomerations could be constituted:
i) A city or town with one or more contiguous outgrowths.
ii) Two or more adjoining towns with or without their
outgrowths.
According to the Census figures of 2001, the number of class I
cities and class II towns was around 900. One of the conspicuous
features of urbanization in India is the skewed distribution of
population with as much as 28.3 per cent of the urban population
in 35 metropolitan cities. Unregulated growth of urban areas,
particularly over the last two decades, without infrastructural
services for proper collection, transportation, treatment and
disposal of domestic waste water led to increased pollution and
health hazards. Fast urbanization has been followed by an
increase in prosperity, resulting in a steep increase in waste
generation.
Challenges of Urbanization
1) Urban Planning
§Many urban governments lack a modern planning
framework.
Table 3.5.3: Trend in Total Population (in 10,000s) and Annual Growth Rate (%) in the Four Metropolitan Cities of India: 1901-2001
CensusYears
Mumbai GrowthRate
GrowthRate
GrowthRate
GrowthRate
Kolkata Delhi Chennai India
1901 81.3 - 151.0 - 40.6 - 59.4 - 2384 -
1911 101.8 25.2 174.5 15.6 41.4 2.0 60.4 1.7 2521 5.7
1921 124.5 22.3 188.5 8.0 48.8 17.9 62.8 4.0 2513 -0.3
1931 126.8 1.8 213.9 13.5 63.6 30.3 77.5 23.4 2786 11.0
1941 168.6 33.0 362.1 69.3 91.8 44.3 92.1 18.8 3187 14.2
1951 296.7 76.0 467.0 29.0 174.4 90.0 153.1 66.2 3611 13.3
1961 415.2 39.9 598.4 28.1 265.9 52.5 192.4 25.7 4392 21.6
1971 597.1 43.8 742.0 24.0 406.6 52.9 305.8 58.9 5482 24.8
1981 891.7 49.3 919.0 23.9 622.0 53.0 428.9 40.3 6833 24.7
1991 1259.6 41.3 1102.2 19.9 942.1 51.5 542.2 26.4 8463 23.8
2001 1636.8 29.9 1321.7 19.9 1297.1 37.7 642.5 18.5 10270 21.4
Source: Census of India, 2001
GrowthRate
0
100
200
300
400
500
600
1951 1991 2001 Projected 2021
Urb
an P
opu
lati
on(m
illi
on)
Source: Central Public Health & Environmental Engineering Organization, 2007
Figure 3.5.2: Projected Urban Population
Table 3.5.2: Growth in the Number of Million Plus (1,000,000) Population (or More) Cities in India during 1901-2001
1931 2 3.41 8.95 1.2 10.2
1941 2 5.31 5.71 1.7 12
1951 5 11.75 21.3 3.3 18.8
1961 7 18.10 54.0 4.1 22.9
1971 9 27.83 53.8 5.1 25.5
1981 12 42.12 51.3 5.2 26.4
1991 23 70.67 67.8 8.4 32.5
2001 35 107.88 52.8 10.50 37.8
Source: Census of India, 2001
CensusYears
1 Excludes Assam in 1981 and Jammu and Kashmir in 1991
1901 1 1.51 - 0.6 5.8
1911 2 2.76 82.8 1.1 10.7
1921 2 3.13 13.4 1.3 11.1
Total Population(in million)
Urban population(in million)
Population ofmillion cities as
percentage of India’s
Per centIncrease
Population(in million)
Numberof Cities with
Populationmore than one
million

Key Environmental Issues- Managing Urbanization139
State Of Environment Report-2009 138
iii) A city or one or more adjoining towns with their out
growths, all of which form a continuous spread.
The data on migration in India as per Census 2001 shows that the
total number of migrants has been 307 million. Out of these
migrants by last residence, 258 million (84.2 per cent) have been
intra-state migrants, those who migrated from one area of the
state to another. Around 42 million (13.8 per cent) were interstate
migrants and 6 million (2 per cent) migrated from outside the
country (Table 3.5.4).
Opportunities in urban areas for employment, education, etc.
have been a pull factor, attracting migrants from rural to urban
areas and from smaller towns and cities to larger urban areas.
There is also migration in the opposite direction from urban to
rural areas due to various reasons. The migration during the last
decade, i.e., migrants with duration of residence of 0-9 years at
the place of enumeration, by various migration streams are
summarized in the Table 3.5.5.
§Weak finances of urban local bodies and service providers
leave them unable to expand the trunk infrastructure that
housing developers need to develop new sites.
Out of about 98 million total intra-state and inter-state migrants
in the country during the last decade, 61 million have moved to
rural areas and 36 million to urban areas. Migration stream out of
rural areas (73 million) to other rural areas was quite high (53
million) in comparison to migration from rural to urban areas (20
million). About six million migrants went to rural areas from
urban areas. On the basis of net migrants by last residence during
the past decade, i.e., the difference between in-migration and
out-migration, in each state, Maharashtra stands at the top of the
list, with 2.3 million net migrants, followed by Delhi (1.7
million), Gujarat (0.68 million) and Haryana (0.67 million) as
per census 2001. Uttar Pradesh (-2.6 million) and Bihar (-1.7
million) were the two states with the largest number of net
migrants migrating out of the state. There are various reasons for
migration as per the information collected in Census 2001 for
migration by last residence. Most of the female migrants cite
'marriage' as the reason for migration, especially when the
migration is within the state. For males, the major reasons for
migration are work, employment and education.
3) Housing
§Building regulations that limit urban density, such as floor
space indexes, reduce the number of houses available,
thereby pushing up property prices
§Outdated rent control regulations reduce the number of
houses available on rent – a critical option for the poor
§Poor access to micro finance and mortgage finance limit the
ability of low income groups to buy or improve their homes
§Policy, planning, and regulation deficiencies lead to a
proliferation of slums
Source: Census of India, 2001
Table 3.5.5: Number of Intra-State and Inter-State Migrants in the Country (duration of residence 0-9 years) by Rural Urban Status – India 2001 by Rural Urban Status – India 2001
Total Rural Urban
Total 97,560,320 61,428,374 36,131,946
Rural 73,949,607 53,354,376 20,595,231
Urban 20,655,277 6,266,503 14,388,774
Unclassified 2,955,436 1,807,495 1,147,941
Rural Urban status ofplace of last residence
Rural urban status of place ofenumeration
A rag picker collecting recyclable material at Marina Beach in Chennai, IndiaCommercial development in cities has led to increased construction activities
Table 3.5.4 : Number of Migrants by Place of Birth – India 2001
Source: Census of India, 2001
Category Migrations byPlace of birth
Percentage
1 Total Population 1,028,610,328
2 Total Migrations 307,149,736 29.9
3 Migrants within the state of enumeration 258,641,103 84.2
4 Migrants from within the districts 181,799,637 70.3
5 Migrants from other districts of the state 76,841,466 29.7
6 Migrants from other states in India 42,341,703 13.8
7 Migrants from other countries 6,166,930 2
Sl.No.
-

Key Environmental Issues- Managing Urbanization141
State Of Environment Report-2009 140
6) Transport
Urban areas in India, which include a wide range of mega cities,
and towns, are not all that fortunate in terms of intercity
transportation. Transport, in this context, has been a victim of
ignorance, neglect, and confusion. As far as the public transport
system in Indian cities is concerned, dedicated city bus services
are known to operate in 17 cities only and rail transit exists only
in four out of 35 cities with population in excess of one million.
Transport demand in most Indian cities has increased
substantially, due to increases in population as a result of both
natural increase and migration from rural areas and smaller
towns. Availability of motorized transport, increases in
household income, and increases in commercial and industrial
activities have further added to the transport demand. In many
cases, the demand has outstripped road capacity.
Greater congestion and delays are widespread in Indian cities
and indicate the seriousness of transport problems. A high level
of pollution is another undesirable feature of overloaded streets.
The transport crisis also takes a human toll. Statistics indicate
that traffic accidents are a primary cause of accidental deaths in
Indian cities (Table 3.5.7).
The main reasons for these problems are the prevailing
imbalance in modal split, inadequate transport infrastructure,
and its sub-optimal use. Public transport systems have not been
able to keep pace with the rapid and substantial increases in
demand over the past few decades. Bus services in particular
have deteriorated, and their relative output has been further
reduced since passengers have turned to personalized modes and
intermediate public transport.
7) Slums
The Govt. of India Slum Areas (Improvement and Clearance)
Act of 1954 defines a slum as 'any predominantly residential
area, in which light or sanitary facilities or any combination of
these factors are detrimental to the safety, health or morals'. The
vast majority of the people who migrated to the city were
attracted by opportunities and comforts offered by
modernization. They belonged to the working class and found it
difficult to secure accommodation within their means. So, they
squatted on every open space available, as near their workplaces
as possible and put up huts with cheap building materials. In this
way, slums grew in number and population.
For the first time, detailed data on slum areas in the country has
been collected in Census 2001, particularly for cities/towns
having a population of 50,000 or more based on the 1991
Census. The total slum population in the country is 40.3 million
comprising 22.6 per cent of the total urban population of
cities/towns reporting slums.
4) Service Delivery
§Most services are delivered by city governments with
unclear lines of accountability.
§There is a strong bias towards adding physical
infrastructure rather than providing financially and
environmentally sustainable services.
§Service providers are unable to recover operations and
maintenance costs and depend on the government for
finance.
§Independent regulatory authorities that set tariffs, decide on
subsidies and enforce service quality are generally absent.
§Most urban bodies do not generate the revenues needed to
renew infrastructure, nor do they have the creditworthiness
to access capital markets for funds.
5) Urban Health Problems
Urban health problems arise due to the food insecurity;
malnutrition; overcrowded and unhygienic living conditions;
pollution and lack of safe drinking water and sanitation.
Migration leads to the spread of many communicable diseases.
People may encounter diseases in the urban areas due to
unsanitary conditions of temporary dwellings and slums.
Furthermore, it is found that there are occurrences and
distribution of a wide range of infectious diseases such as
tuberculosis, hepatitis and pneumonia in urban slums. This has
potentially wider impacts on life style, quality of housing, and
diet or nutrition and may cause new disease patterns in the urban
areas. Plastic and polythene bags, rotting food, paper, cloth,
animal bones, cans, and glass are found in garbage piles in most
of the cities.
The health of the urban poor is often worse than that of their rural
counterparts. Child mortality rates among populations in the
lowest income strata, for example, are higher in urban areas than
in rural areas. Children from poor families who live in urban
areas are also more likely to be underweight and experience
stunted growth than their rural counterparts. Air pollution is
another important health challenge for urban residents in India.
In Delhi, one out of ten school children have asthma. According
to a World Bank - Asian Development Bank study, premature
deaths due to air pollution in Indian cities were estimated to have
increased by 30 per cent between 1992 and 1995. High levels of
lead pollution in the air lead to stunted growth in children, as well
as hyperactivity and brain damage.
Source: Census of India, 2001
Table 3.5.6: Urban-Rural Breakup of Total Population, Number of Households and Houses
Sl.No.
Year Total Population No. ofHouseholds
No. ofHouses
1 1981*
Total 655,287,849 119,772,545 121782109**
Urban 157,680,171 28,905,949 29,897,491
Rural 607,607,678 90,866,596 91,884,618
2 1991+ 838,583,988 152,009,467 159425666**
Total 215,771,612 40,418,141 43,518,317
Urban 622,812,376 111,591,326 115,907,349
Rural
3 2001++ 1,028,610,328 193,579,954 202973364#
Total 286,119,689 55,832,570 58,514,738
Urban 742,490,639 137,747,384 144,458,626
Rural
* Excluding Assam
+ Excluding Jammu & Kashmir
** No. of occupied residential houses + No. of Census houses vacant at the time of house listing
++ India figures are final and exclude those of the three sub-divisions viz. Mao Maram, Paomata and Purul of Senapa district of Manipur as population Census 2001 in these 3 subdivisions were cancelled due to technical and administrative reasons although a population census was carried out in these subdivisions as per schedule
# The occupied residential houses and vacant houses are based on Census 2001 house listing data
Source: Ministry of Road Transport and Highways, 2007
Table 3.5.7: Number of Persons Killed in Road Accidents by Truck/Lorry and Private Buses in Metro Cities (2005 and 2006)
Male Female Male Female Male Female Male Female
Chennai 160 55 40 5 319 44 35 7
Delhi 110 9 99 20 99 6 97 15
Kolkata 6 0 22 4 10 0 34 3
Mumbai 78 12 11 7 102 15 32 7
City 2005 2006
Truck/Lorry Private Bus Truck/Lorry Private Bus
Bigger the city, bigger the slums

Key Environmental Issues- Managing Urbanization143
State Of Environment Report-2009 142
Slum population is a serious problem in the mega-cities of India.
A large population of Mumbai, Kolkata and Delhi lives in slums,
despite of several Government housing policies. A continuous
increase has been found in the percentage of slum population
over the last three decades in the four metropolitan cities of
India.
In 1981, 31 per cent population of Mumbai was residing in
slums, and in 2001 nearly half of Mumbai's population (49 per
cent) was living in slums. However, Kolkata and Delhi had not
shown as severe condition as Mumbai. The proportion of slum
population was 30 per cent and 18 per cent in 1981 in Kolkata
and Delhi, which increased to 36 per cent and 23 per cent
respectively. On the other hand, it is a somewhat positive sign for
Kolkata and Delhi that in 2001 the proportion of slum population
has decreased to 33 per cent and 19 per cent respectively.
Although Chennai has the lowest slum population among the
four metropolitan cities, yet it has experienced continuous
increase in the slum population over the three decades. There
was 14 per cent slum population in Chennai in 1981, which
increased to 15 per cent in 1991 and further 18 per cent in 2001.
In India, major urban population resides in the slums, which are
poorly equipped to meet the basic needs of water and sanitation
of the dwellers. This results in people falling prey to various
diseases and putting additional strain on the healthcare facilities
in the area. Low incomes, illiteracy, and inaccessibility to
development opportunities further complicate the problems.
Slum dwellings have no ventilation or natural light and are most
vulnerable. They suffer from dust, smoke, and noise pollution.
Piles of garbage, potholes, stray animals, flies, and mosquitoes
are a common sight in slums.
8) Availability of Safe Drinking Water
Access to safe drinking water remains an urgent need as about
70.5 per cent of the households in urban areas and 8.7 per cent in
rural areas receive organized piped water supply and the rest
have to depend on surface or groundwater, which is untreated
(Figure 3.5.3). The diseases commonly caused due to
contaminated water are diarrhoea, trachoma, intestinal worms,
hepatitis, etc. The most common contamination in the water is
from the disease bearing human wastes, which is usually
detected by measuring faecal coliform levels. Inadequate access
to safe drinking water and sanitation facilities leads to higher
infant mortality and intestinal diseases.
Source: National Family Health Survey-3, 2005-2006
Figure 3.5.3: Households with Improved Source of Drinking Water in India
Water quality is a true index of health
§In all, 607 towns have reported slums.
§Total Slum Population returned as per provisional results of Census of India 2001 was 40,297,341, comprising 22.58 per cent
of the total urban population of the cities/towns reporting slums.
§Largest slum population was registered in Maharashtra (10.64 million).
§The largest proportion of slum population in million plus cities was registered in Greater Mumbai (48.88 per cent) and the
lowest in Patna (0.25 per cent).
§About one per cent of India's population lives in the slums of Maharashtra.
§Around six per cent of Maharashtra's population lives in slums of Greater Mumbai.
§The proportion of slum population out of the total population in cities/towns varied from 41.33 per cent to 1.81 per cent, the
largest being Meghalaya (41.33 per cent) and lowest Kerala ( 1.81 per cent).
§Sex ratio (i.e. number of females per thousand males) of the slum population varied from 1,032 (Pondicherry) to 707
(Chandigarh), Kerala also returned high sex ratio (1,029).
§Proportion of children (0-6 years) among slum population in million plus cities was found to be the highest in Jaipur
(18.11per cent) and lowest in Kolkata (9.35 per cent). Female literacy rate was also found to the highest, varying from
85.11 per cent (Meghalaya) to 40.09 per cent (Chandigarh).
§Literacy rate among slum population was found to be quite high, varying from 80.08 per cent (Meghalaya) to 55.46 per cent
(Chandigarh). The male literacy rate varied from 91.05 per cent (Meghalaya) to 65.59 per cent (Chandigarh). Female literacy
rate was also found to be high varying from 85.11 per cent (Meghalaya) and 65.59 per cent ( . Chandigarh)
Box 3.5.1: Salient Features of Slums as per Census 2001
Source: Central Water Commission, 2005
Table 3.5.8: Availability of Safe Drinking Water Per Day in Metropolitan Cities of India (As per Nov., 2003)
Metropolitan Cities/Urban Agglomeration Per Capita Water Supply (1 pcd)
Greater Mumbai 170
Kolkata 100
Delhi 155
Chennai 65*
Bangalore 100
*Due to consecutive failure of monsoon, the availability of water during summer period is reported as 221 pcd.

Key Environmental Issues- Managing Urbanization145
State Of Environment Report-2009 144
9) Sanitation
Analysis of coverage data from various sources shows that
despite the acceleration of coverage under the Eighth Plan, only
19.2 per cent of rural households have a toilet. However, at the
same time 80 per cent of all urban households in India have
toilets, an increase from the 1990 figures of around 64 per cent .
According to NFHS-3 (2005-2006), only 29 per cent of
households have improved toilet facilities (which include toilet
facilities with a flush, or a pour flush that is connected to a sewer
system, septic tank or pit latrine, a ventilated improved pit (VIP)
latrine, a biogas latrine, a pit latrine with slab and twin pit,
composting toilet). Percentage of households having no toilet
facility in urban India showed a steady decline from NFHS-2 (19
per cent) to NFHS-3 (17 per cent) (Figures 3.5.4 & 3.5.5).
The higher percentages of urban sanitation have largely been due
to private initiatives at the household level and due to high
concentration of household toilets in the larger urban metro
cities.
As far as waste water drainage management is concerned, only
3.9 per cent of the total households in rural India have the closed
drainage system of waste water while in urban India 34.5 per
cent of the total households have closed drainage facility. There
is very high percentage of urban households without any
drainage system at all (approx. 22.1 per cent).
Toilets are not an issue for you and me. But for millions in
India’s villages, the absence of a toilet is a reality. For
many it’s not even a need that is felt. For others, it is a
question of financial priorities. Over 700 million people
in India still live without proper sanitation. The resulting
poor hygiene is responsible for approximately 1,000
children under five years dying every day due to
diarrhoea alone. Poor hygiene, lack of sanitation and
inadequate or unsafe water together contribute to about
88 per cent of diarrhoea deaths.
The fact is that sanitation issues did not command
sufficient public investment till the end of the 1970s. A
total of 108 million man-days, which is equivalent to
Rs 12 billion, are lost every year due to sanitation related
diseases. Sanitation acquired importance only in the
1980s when the Government of India encouraged the
construction of household toilets in the villages under the
Central Rural Sanitation Programme.
However, the programme did not become a major sucess
as it promoted a single design at a single price and gave a
high subsidy with limited funds available. As a result, the
government was only able to allot one or two latrines per
village and this often went to the prominent members.
The subsequent Total Sanitation Campaign has sought to
increase toilet construction and usage by shifting to low
subsidies and a greater stress on creating household
involvement through awareness. Its sucess is evident
from the fact that while in 1997-98, only about 1.3
million toilets were built, in 2003-04 the figure jumped to
over 6 million, followed by over 9 million toilets being
built in 2006-07. It is expected that the number of
household toilets constructed during 2007-08 may
actually exceed a crore.
The key to this sucess has been the involvement of the
Panchayati Raj Institutions (PRI) under the Nirmal Gram
Puraskar, the incentive award scheme. The PRIs have
been motivated to promote sanitation in their community
by influencing behavioural change and creating a
demand. The Nirmal Gram Puraskar awards have seen an
enormous increase in the number of awards from across
the country from 40 PRIs awarded in 2004-05.
Approximately, 30,000 PRIs have already applied for the
award in 2008. All this has meant that states like West
Bengal, Tamil Nadu and Andhra Pradesh are close to
achieving the ‘Millennium Development Targets’. While
it is important to celebrate the gains made in increasing
sanitation coverage nationwide, we must not forget that it
is only the beginning, there is a long way to go before total
sanitation is achieved. The challenge ahead is not only to
maintain the momentum, but also to accelerate the pace of
sanitation coverage.
Although 40 million households have been reached so far,
there is still more than 70 million households across the
country without toilets. The Total Sanitation Campaign
and Nirmal Gram Puraskar have shown that sanitation is
achievable. But before we turn the page, we must know
that the campaign needs consistent and dedicated support.
What we need is not a spring cleaning but a sea change
conducted on a war footing.
RURAL INDIA IS AWASH IN A SANITATION REVOLUTIONN. C. Saxena
Box 3.5.2: Flush with Success
24
87
70
19
81
64
17
74
55
0
10
20
30
40
50
60
70
80
90
100
Urban Rural Total
NFHS - 1
NFHS - 2
NFHS - 3
Source: National Family Health Survey-3, 2005-2006
Figure 3.5.5: Percentage of Households Having No Toilet Facilities
Figure 3.5.4: Residential Toilet Facility
19
28
6
24
6
17
Urban
111
6
5
3
74
Rural
Flush to sewer
Flush to specific tank
Other-improved
Shared with other households
Other not-improved
No facility
Source: National Family Health Survey-3, 2005-2006
(N.C. Saxena is a Former Secretary, Planning Commission)
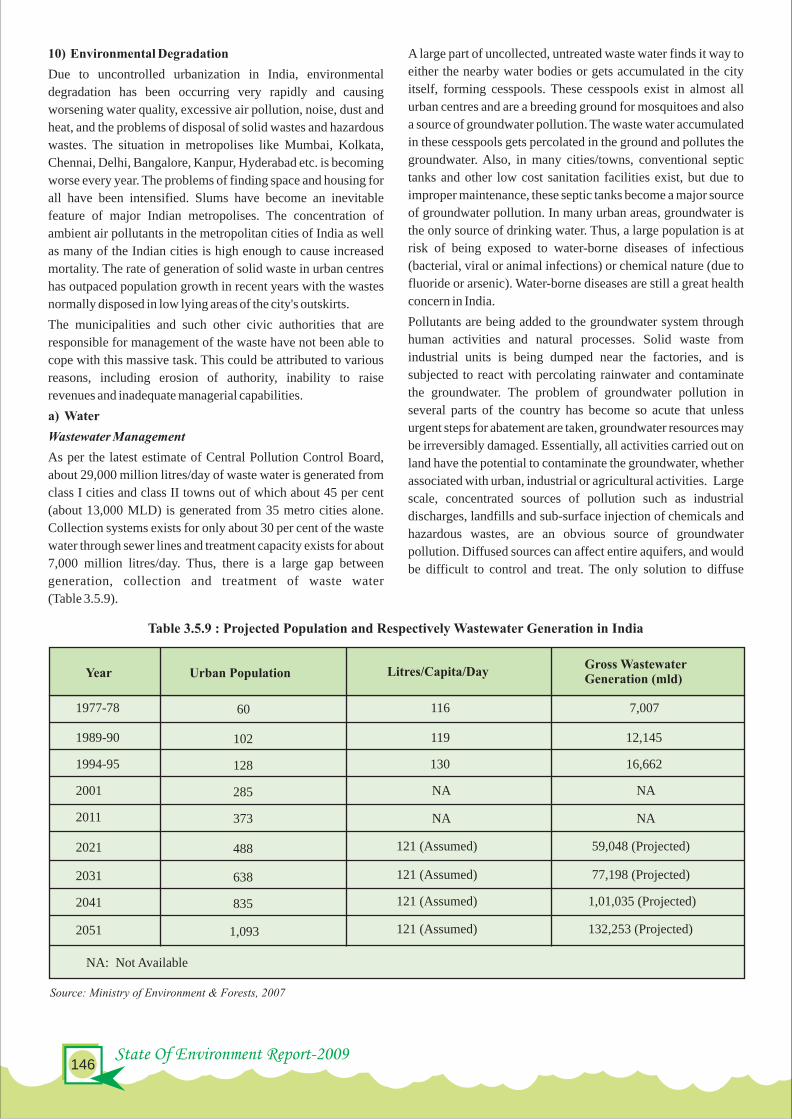
Key Environmental Issues- Managing Urbanization147
State Of Environment Report-2009 146
10) Environmental Degradation
Due to uncontrolled urbanization in India, environmental
degradation has been occurring very rapidly and causing
worsening water quality, excessive air pollution, noise, dust and
heat, and the problems of disposal of solid wastes and hazardous
wastes. The situation in metropolises like Mumbai, Kolkata,
Chennai, Delhi, Bangalore, Kanpur, Hyderabad etc. is becoming
worse every year. The problems of finding space and housing for
all have been intensified. Slums have become an inevitable
feature of major Indian metropolises. The concentration of
ambient air pollutants in the metropolitan cities of India as well
as many of the Indian cities is high enough to cause increased
mortality. The rate of generation of solid waste in urban centres
has outpaced population growth in recent years with the wastes
normally disposed in low lying areas of the city's outskirts.
The municipalities and such other civic authorities that are
responsible for management of the waste have not been able to
cope with this massive task. This could be attributed to various
reasons, including erosion of authority, inability to raise
revenues and inadequate managerial capabilities.
a) Water
Wastewater Management
As per the latest estimate of Central Pollution Control Board,
about 29,000 million litres/day of waste water is generated from
class I cities and class II towns out of which about 45 per cent
(about 13,000 MLD) is generated from 35 metro cities alone.
Collection systems exists for only about 30 per cent of the waste
water through sewer lines and treatment capacity exists for about
7,000 million litres/day. Thus, there is a large gap between
generation, collection and treatment of waste water
(Table 3.5.9).
A large part of uncollected, untreated waste water finds it way to
either the nearby water bodies or gets accumulated in the city
itself, forming cesspools. These cesspools exist in almost all
urban centres and are a breeding ground for mosquitoes and also
a source of groundwater pollution. The waste water accumulated
in these cesspools gets percolated in the ground and pollutes the
groundwater. Also, in many cities/towns, conventional septic
tanks and other low cost sanitation facilities exist, but due to
improper maintenance, these septic tanks become a major source
of groundwater pollution. In many urban areas, groundwater is
the only source of drinking water. Thus, a large population is at
risk of being exposed to water-borne diseases of infectious
(bacterial, viral or animal infections) or chemical nature (due to
fluoride or arsenic). Water-borne diseases are still a great health
concern in India.
Pollutants are being added to the groundwater system through
human activities and natural processes. Solid waste from
industrial units is being dumped near the factories, and is
subjected to react with percolating rainwater and contaminate
the groundwater. The problem of groundwater pollution in
several parts of the country has become so acute that unless
urgent steps for abatement are taken, groundwater resources may
be irreversibly damaged. Essentially, all activities carried out on
land have the potential to contaminate the groundwater, whether
associated with urban, industrial or agricultural activities. Large
scale, concentrated sources of pollution such as industrial
discharges, landfills and sub-surface injection of chemicals and
hazardous wastes, are an obvious source of groundwater
pollution. Diffused sources can affect entire aquifers, and would
be difficult to control and treat. The only solution to diffuse
sources of pollution is to integrate land use with water
management. Land use activity, along with activities that are a
potential threat to groundwater is presented in the Table 3.5.10
given below .
b) Air Pollution
The metropolitan cities of India suffer from extremely high
levels of urban air pollution, particularly in the form of
suspended particulate matter. Region-wise, urban air pollution is
estimated to cause over 2,50,000 deaths and billions of cases of
respiratory illnesses every year (World Bank 2006).
Air quality data suggests that the pollutant of most concern from
the point of view of environmental health risk is the airborne
particulate matter.
Costs to society arising from urban air pollution include damage
to human health, buildings, and vegetation, lowered visibility
and heightened greenhouse gas emissions. Of these, increased
premature mortality and morbidity are generally considered to
be the most serious consequences of air pollution, both on
account of their human and economic impacts. It is common and
appropriate, therefore, to use damage to human health as the
primary indicator of the seriousness of air pollution.
c) Solid Waste Management
Total quantity of waste generated in the country (based on
weighment exercise by local bodies) is not reported. However,
Ministry of Urban Development, in its manual on solid waste
management (year 2000), has estimated a waste generation of
1,00,000 MT (Figure 3.5.6 and Figure 3.5.7).
MSW generation in Indian cities (around 5,100 ULBs) is
estimated to have increased from 6 million MB in 2006 (Central
Pollution Control Board 2000, TERI 2001). In addition, Indian
consumption of plastics is around 4 MTPA (million tonnes per
annum). About 60 per cent of this comprise of polyolefin which
is primarily used as packaging material. About 2.0 MTPA of the
total consumption is generated as plastic waste, of which around
70 per cent is recycled, mostly by the informal sector. The
decadal growth in consumption of plastics during 1991-2001
was around 14 per cent (Indian Centre for Plastics in the
Environment and Central Institute of Plastic Engineering
Source: Central Pollution Control Board, 2007
Table 3.5.10 : Land-Use Activities and Their Potential Threat To Groundwater Quality
Land Use Activities potential to groundwater pollution
Residential
Industrial & Commercial
Mining
Rural
Coastal areas Salt water intrusion
Un-sewered sanitation
Land & stream discharge of sewage
Sewage oxidation ponds
Sewer leakage, solid waste disposal, landfill leachate
Road & urban run-off, aerial fall out
Process water, effluent lagoon etc.
Land & stream discharge of effluents
Tank & pipeline leakage & accidental spills
Well disposal of effluents
Aerial fall out
Poor housekeeping
Spillage & leakages during handling of material
Mine drainage discharge
Process water, sludge lagoons
Solid mine tailings
Oilfield spillage at group gathering stations
Cultivation with agrochemicals
Irrigation with waste water
Soil Salinization
Livestock rearing
Source: Ministry of Environment & Forests, 2007
Table 3.5.9 : Projected Population and Respectively Wastewater Generation in India
1977-78
1989-90
1994-95
2001
2011
2021
2031
2041
2051
Year Urban Population
60
102
128
285
373
488
638
835
1,093
Litres/Capita/Day
116
119
130
NA
121 (Assumed)
121 (Assumed)
121 (Assumed)
121 (Assumed)
Gross WastewaterGeneration (mld)
7,007
12,145
16,662
59,048 (Projected)
77,198 (Projected)
1,01,035 (Projected)
132,253 (Projected)
NA
NA
NA
NA: Not Available
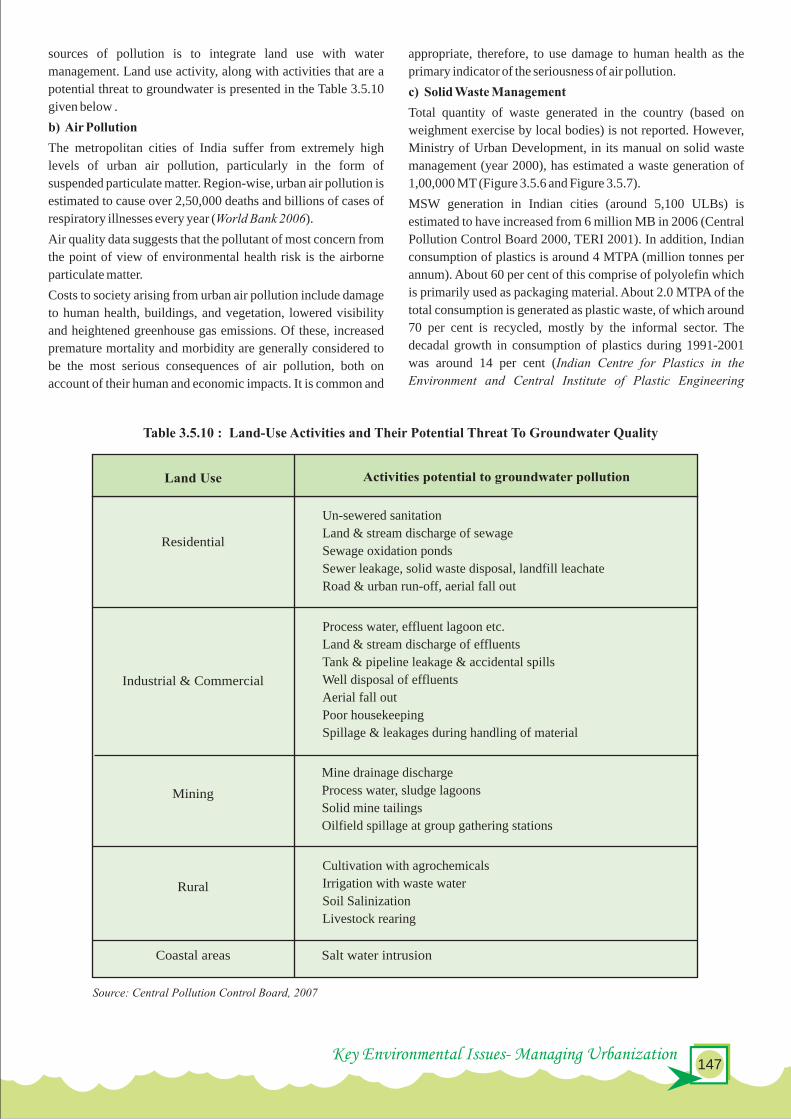

Key Environmental Issues- Managing Urbanization149
State Of Environment Report-2009 148
Technology). Although the quantity of plastic waste reaching
disposal sites is fairly low (0.62 per cent on dry weight basis),
testifying to a high rate of recycling and reuse, the management
of thin plastic bags remains a matter of concern due to low
We are all responsible for keeping our cities clean
Kan
pur
Pune
Surat
Ahm
edab
ad
Banga
lore
Hyd
erab
ad
Kol
kata
Chenn
ai
Mum
bai
Del
hi
Soi
ld W
aste
Gen
erat
ed (
ton
nes
/day
)
0
1000
2000
3000
4000
5000
6000
7000
Source: Central Pollution Control Board, 2006-07
Figure 3.5.6: Solid Waste Generated in India's Top Ten Cities
Source: 1982-90: Planning Commission; 1995 -2005: CPCB
Table 3.5.11: Change in Waste Composition in Selected Cities
Lucknow
Kolkata
Kanpur
Mumbai
Delhi
Chennai
Bangalore
Ahemadabad
1982-1990
60.31
46.58
53.34
59.37
57.71
56.24
75.00
48.95
2005
47.41
50.56
47.52
62.44
54.42
41.34
51.84
40.81
1982-1990
6.72
2.58
2.57
3.85
8.24
6.60
2.70
5.57
2005
15.53
11.48
11.93
16.66
15.52
16.34
22.43
11.65
Compostables(%)
Recyclables(%)
City
Total Organic Fraction - 40%, Combustible Fraction - 37%, Recyclables - 8%, Inert - 15%
Figure 3.5.7: Composition of MSW in a Typical Indian City
Source: CPHEEO Manual on MSW, 2005
Food & GardenWaste,40%
Paper,27%
Textiles,6%
Plastic/Rubber,4%
Inert,15%
Metal,3%
Glass & Ceramics,5%
collection efficiency, which therefore needs to be strengthened.
There is an increased trend in the percentage of recyclables,
accompanied by a decrease in the percentage of biodegradable
matter in the waste stream (Table 3.5.11).
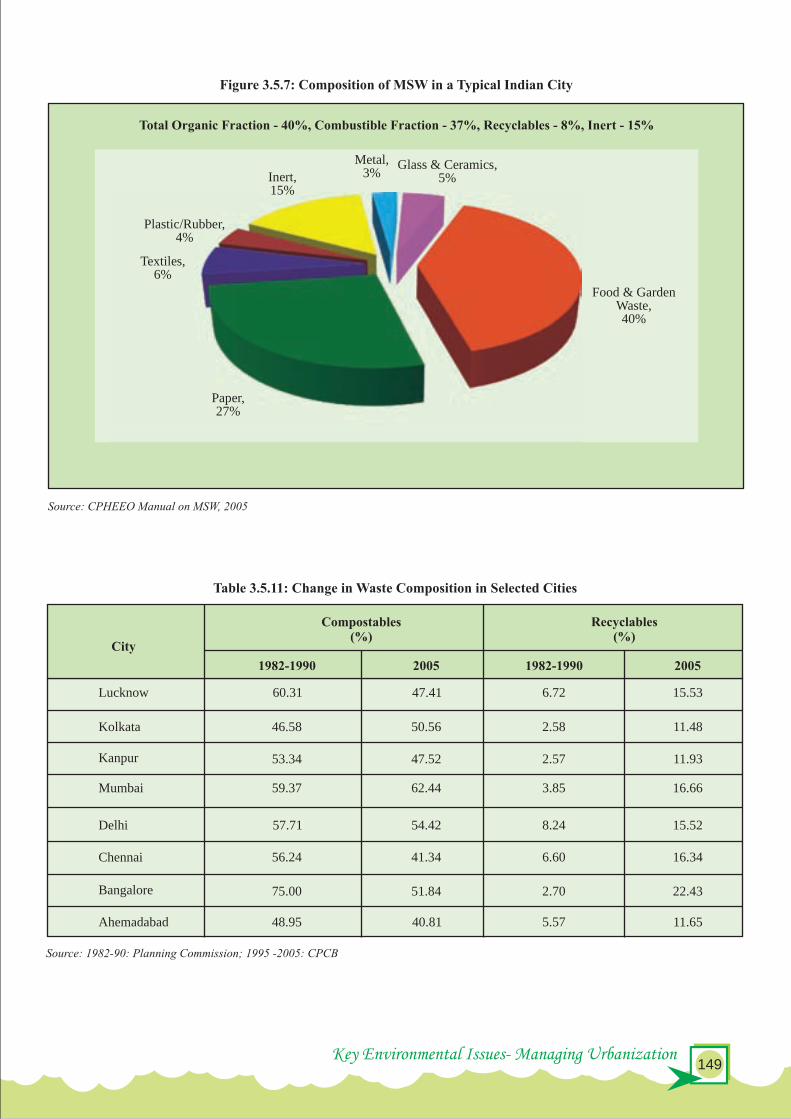

Key Environmental Issues- Managing Urbanization151
State Of Environment Report-2009 150
CPCB, with the assistance of NEERI, has conducted a survey of
solid waste management in 59 cities (35 metro cities and 24 state
capitals) in 2004-05.
Mumbai and Delhi generated the largest amount of municipal
solid waste in 2005, which is 5,922 tonnes/day for Delhi and
5,320 tonnes/day for Mumbai, followed by Chennai (3,036
tonnes/day) and Kolkata (2,653 tonnes/day). But if we consider
the per capita generation of solid waste, it is the largest in
Chennai, where it is about 0.620 kg/day. The lowest per capita
waste generation is in Mumbai, which is about 0.45 kg/day.
Again, about 90 per cent of the municipal solid waste generated
in Mumbai and Chennai is being collected. However, in Delhi
there is no adequate system of collection as only 77 per cent of
the municipal solid waste generated is collected (Table 3.5.12).
Source: Central Pollution Control Board, 2006
Table 3.5.12 : Status of Municipal Solid Waste Management In Selected Metro Cities, 2004-05
Particulars Kolkata Chennai Delhi Mumbai
Area (sq. km) 187.33 174 1484.46 437.71
Population (Census 2001) 45,72,645 43,43,645 1,03,06,452 1,19,78,450
MSW generation (tonnes/day) 2,653 3,036 5,922 5,320
MSW generation rate (kg/c/day) 0.58 0.62 0.57 0.45
Box 3.5.3: Localities Manage Their Own Waste Better in Greater Mumbai
Municipal Corporation of Greater Mumbai has adopted Advanced Locality Management (ALM) scheme wherein citizens and
the Municipal Corporation employees work hand-in-hand for the improvement of solid waste management services. These
ALM groups are actively involved in segregation of waste into dry and wet waste and vermi-composting of biodegradable
waste. It also handles various other civic problems and developmental works in the given locality. This scheme was started in
July 1997 with only one locality participating in it, and by December 2000, the number of ALM Societies registered has grown
to 666. ALM concept has also been extended to slums and commercial areas. The concept has been recognized as an effective
model for citizen's participation in waste management.
Situation before the initiative
People were totally dependant upon the Municipal Corporation for cleanliness and did not take interest in keeping their
locality clean. There was little interaction between residents and the Corporation employees.
The waste from the community bins was not always collected on a daily basis.
Lack of timely street sweeping and littering by people resulted in dirty streets. At some places, the surface water drains
choked due to accumulation of solid waste in it.
Accumulation of waste on streets and around the community bins was a threat to health and hygiene.
Rag pickers used to pick waste from collection points and landfill areas in a very unhygienic manner.
Benefits
Involvement and active participation of citizens who took this initiative improved the level of cleanliness in the locality
considerably.
Throwing of garbage on roads has come down considerably. Segregation of waste at household level has increased.
Dustbins were removed from the main roads and this provides a cleaner look to streets.
The system has provided a platform for the Corporation and the residents to work together and in cooperation with each
other rather than having confrontation, as earlier.
Few ALMs, that are functioning for more than three years, have increased their scope to other activities such as tree
plantation, prevention of encroachment on pavement, beautification of streets, etc.
The ALM movement that started with the objective of cleanliness i.e., Zero Garbage, is gradually spreading to other areas of
peoples' grievances regarding other civic services like maintenance of roads, improvement in water supply, check on
unauthorized construction and monitoring unauthorized hawking.
?
?
?
?
?
?
?
?
?
?
Source: Ministry of Urban Development
Box 3.5.4: Recycling Waste In Namakkal, India?
?Namakkal is a town in Tamil Nadu, situated on the highway from Salem to Dindigul. It is the first municipality in the
country to privatize all the components of solid waste management, by the institutionalization of the door-to-door
collection with segregation at source, vermi-composting and sale of recyclable waste from inorganic waste. Namakkal has
the distinction of being the only zero garbage town in the country. In order to actively achieve this, they follow a ten point
charter:
?Extend the scheme of door-to-door garbage collection (with segregation) to the entire town and make the streets and roads
garbage-free.
?Introduce night sweeping at the bus stands and important roads, etc., and maintain cleanliness round the clock.
?Extend the scheme of door-to-door garbage collection and sweeping to holidays and sundays.
?Make the plants and burial grounds beautiful and attractive through NGOs and voluntary agencies.
?Remove encroachments on all the roads and streets.
?Prevent road-side hotels, lorry repair shops, etc. on the national highways and plant trees.
?Remove stray animals from the town.
?Levy service charges on hotels, kalyanamandapams (or wedding spots), commercial complexes and garbage generating
industries.
?Manufacturing of vermi-compost from organic waste through voluntary organizations/ private agencies on BOT basis, sell
the inorganic recyclable garbage and convert the component yard into Nandanvanam.
?Engage two ‘mop-up’ teams with two auto model carriers to remove the waste then and there, round the clock, and make the
town garbage free.
The experiment has been successful due to its holistic approach, with all the agencies cooperating under the leadership of the
District Collector. The committee includes the district administration, the municipality, a consortium of NGOs, women self
help groups, schools, market associations, industrial associations, RWAs and rag pickers. Although Namakkal is a small town
with a population of 60,000 to 70,000, it has two major industries - body building 60 per cent CNG tankers in the country and a
very large and well organized poultry industry. Hence, if no effort was made, the town would have virtually turned into a
garbage dump. Now, awareness has been created and every citizen accepts the responsibility of keeping the town clean and
ensuring that nothing is thrown anywhere except in a bin.
With appropriate efforts, we can turn ‘trash’ into ‘cash’
Source: Development Alternatives

Key Environmental Issues- Managing Urbanization153
State Of Environment Report-2009 152
Plastic Waste
It is noteworthy that the quantum of waste is ever increasing due
to the increase in population, developmental activities, changes
in life style, and socio-economic conditions. Plastics waste
constitutes a significant portion of the total municipal solid
waste (MSW). It is estimated that approximately ten thousand
tonnes per day (TPD) of plastic waste is generated i.e. 9 per cent
of 1.20 lakhs TPD of MSW in India. The plastic waste includes
two major categories of plastics; (1) Thermoplastics and (2)
Thermoset plastics. Thermoplastics constitute 80 per cent and
Thermoset constitutes approximately 20 per cent of total post-
consumer plastic waste generated in India. Thermoplastics are
recyclable plastics and include Polyethylene Terephthalate
(PET), Low Density Poly Ethylene (LDPE), Poly Vinyl Chloride
(PVC), High Density Poly Ethylene (HDPE), Polypropylene
(PP), Polystyrene (PS), etc. Thermoset plastics contain alkyd,
epoxy, ester, melamine formaldehyde, phenolic formaldehyde,
silicon, urea formaldehyde, polyurethane, metalized and
multilayer plastics etc.
Hazardous Waste
The hazardous waste generated in the country is about 4.4
million tonnes, out of which 38.3 per cent is recyclable, 4.3 per
cent is incinerable and the remaining 57.4 per cent is disposable
in secured landfills. Twelve states of the country (including
Maharashtra, Gujarat, Tamil Nadu, West Bengal, Andhra
Pradesh and Rajasthan) account for 87 of total waste
generation. The top five waste generating states are Maharashtra,
Gujarat, Andhra Pradesh, Rajasthan and West Bengal
(Figure 3.5.8).
per cent
management through a slew of reforms for long-term project
sustainability;
(c) Ensuring adequate funds to meet the deficiencies in urban
infrastructural services;
(d) Planned development of identified cities including peri-
urban areas, outgrowths and urban corridors, leading to
dispersed urbanization;
(e) Scale-up delivery of civic amenities and provision of utilities
with emphasis on universal access to the urban poor;
(f) Special focus on urban renewal programme for the old city
areas to reduce congestion; and
(g) Provision of basic services to the urban poor, including
security of tenure at affordable prices, improved housing, water
supply and sanitation, and ensuring delivery of other existing
universal services of the government for education, health and
social security.
The sectors that come under JNNURM are as follows:
§Urban renewal, that is, redevelopment of inner (old) city
areas including widening of narrow streets, shifting of
industrial and commercial establishments from non-
conforming (inner city) areas to conforming (outer city)
areas to reducing congestion, replacement of old and worn
out pipes by new and higher capacity ones, renewal of the
sewerage, drainage, and solid waste disposal system, etc.;
§Water supply (including desalination plants) and
sanitation;
Electronic Waste (e-waste)
The growth of e-waste has significant environmental, economic
and social impact. The increase of electrical and electronic
products, consumption rates and higher obsolescence rates lead
to higher generation of e-waste. The increasing obsolescence
rate of electronic products also adds to the huge import of used
electronics products. The e-waste inventory based on the
obsolescence rate in India for the year 2005 has been estimated to
be 1,46,180 tonnes, and is expected to exceed 8,00,000 tonnes by
2012. There is no large scale organized e-waste recycling facility
in India, whereas there are two small e-waste dismantling
facilities functioning in Chennai and Bangalore, while most of
the e-waste recycling units are operating in the un-organized
sector.
For countering urbanization pressures, Ministry of Urban
Development has initiated many programmes, some of which are
given below.
1. JNNURM (Jawaharlal Nehru National Urban Renewal
Mission)
It is a programme to ensure that the following objectives are
achieved in the urban sector:
(a) Focused attention to integrated development of infrastructure
services in cities covered under the Mission;
(b) Establishment of linkages between asset creation and asset
RESPONSE
Electronic waste : needs proper recycling
0
5
10
15
20
25
30
35
40
45
Source: Inventory of Hazardous Waste Generation, CPCB, 2006
Figure 3.5.8: State-wise Identified Hazardous Waste Dumpsites
40
5
7
18
1
4
10
21
14
1
2
108
Mad
hya P
rade
sh
And
hra P
rade
sh
Ass
am
Guj
arat
No
. of
Du
mp
site
s
Kar
nata
ka
Ker
ala
Mah
aras
htra
Oris
sa
Punja
b
Rajas
than
Tamil
Nad
u
Utta
r Pra
desh
Wes
t Ben
gal
Source: Inventory Hazardous Waste Generation, CPCB, 2006
Figure 3.5.7: Distribution of the Total Hazardous Waste Generated Among Different Hazardous Waste Generating States
Rajasthan44%
TN2%
UP1%
WB3%
Others5% AP
6% Chhattisgarh1%
Gujarat15%
J&K1%
Karnataka1%
Kerala1%
Maharashtra17%
MP1%
Orrisa1%
Punjab1%

Key Environmental Issues- Managing Urbanization155
State Of Environment Report-2009 154
§Sewerage and solid waste management;
§Construction and improvement of drains and storm water
drains;
§Urban transportation including roads, highways,
expressways, MRTS, and metro projects;
§Parking lots and spaces on PPP basis;
§Development of heritage areas;
§Prevention and rehabilitation of soil erosion and landslides
only in cases of special category states where such
problems are common; and
§Preservation of water bodies.
5. National Urban Transport Policy, 2006
A national policy was developed by the Ministry of Urban
Development to manage urban transport.
The objective of this policy is to ensure safe, affordable, quick,
comfortable, reliable and sustainable access for the growing
number of city residents to jobs, education, recreation and such
other needs within our cities. This is sought to be achieved by:
§Incorporating urban transportation as an important
parameter at the urban planning stage rather than being a
consequential requirement;
§Encouraging integrated land use and transport planning in
all cities so that travel distances are minimized and access to
livelihoods, education, and other social needs, especially
for the marginal segments of the urban population is
improved;
§Improving access of business to markets and the various
factors of production;
§Bringing about a more equitable allocation of road space
with people, rather than vehicles, as its main focus;
§Encourage greater use of public transport and non-
motorized modes by offering Central financial assistance
for this purpose;
§Enabling the establishment of quality focused multi-modal
public transport systems that are well integrated, providing
seamless travel across modes;
§Establishing effective regulatory and enforcement
mechanisms that allow a level playing field for all operators
of transport services and enhanced safety for the transport
system users;
§Establishing institutional mechanisms for enhanced
coordination in the planning and management of transport
systems;
§Introducing Intelligent Transport Systems for traffic
management;
§ Addressing concerns of road safety and trauma response;
and
§Reducing pollution levels through changes in traveling
practices, better enforcement, stricter norms, technological
improvements, etc.
Delhi and Kolkata have introduced the Metro Rail system. The
Government of West Bengal is also planning to set up an East-
West Corridor metro rail project for Kolkata on the DMRC
model covering a length of 13.7 km (8 km underground and 5.7
km elevated) from Howrah to Salt Lake.
The Bangalore Mass Rapid Transit System (MRTS), called the
Bangalore Metro Rail Project, was approved on April 27, 2006
for construction over a total length of 33 km (elevated: 25.65
kms; underground: 6.7 km; at grade: 0.65 km) in two corridors.
The first East-West Corridor from Byappanahalli to Mysore
Road is 18.1 km long and the second North-South Corridor from
Yeshwanthpur to R.V. Road Jayanagar is 14.9 km long. The
project is scheduled to be completed in five years, by December
2011. The first section of 7 km will be completed by March
2010.
The Government of Maharashtra also prepared a master plan for
the Mumbai Metro which suggested implementation in three
phases over nine corridors. The first corridor of Phase-I
(Versova- Andheri-Ghatkopar) is fully elevated covering a total
length of 11.07 km. This is to be implemented in the PPP mode
on BOT basis.
To provide better public transport and ease congestion,
proposals for Bus Rapid Transit System (BRTS) have been
approved for Ahmedabad, Bhopal, Indore, Jaipur, Pune, Rajkot,
Vijayawada and Visakhapatnam under JNNURM, covering a
total length of more than 310 km with a total estimated cost of
Rs. 2,740 crores, out of which the Central assistance is around
Rs. 1,295 crores.
2. National Urban Housing & Habitat Policy, 2007
The National Urban Housing and Habitat Policy, 2007 seeks to
use the perspective of Regional Planning in terms of preparation
of District Plans by District Planning Committees (DPCs) and
Metropolitan Plans by Metropolitan Planning Committees
(MPCs) as a vital determinant of systematic urban planning. The
policy seeks to promote symbiotic development of rural and
urban areas. In this regard, the policy seeks to ensure refinement
of Town and Country Planning Acts (wherever required) and
their effective implementation. The focus areas of this Policy
are:
§Urban Planning
§Affordable Housing
§Increase Flow of Funds
§Increase Supply of Land
§Special Provision for SC/ST/OBC/Minorities/Disabled
§Special Provision for Women
§Employment Generation
§Public-Private Partnerships
§Management Information System
§Healthy Environment
3. Solid Waste Management Rules
Considering the pathetic situation of Solid Waste Management
practices being adopted by the Urban Local Bodies in the
country, in September, 2000, Ministry of Environment & Forests
notified the 'Municipal Solid Waste (Management and Handling)
Rules, 2000', making it mandatory for ULBs to improve the
systems of waste management as envisaged in the rules, in a stgiven time frame ending 31 December, 2003. These rules lay
out procedures for waste collection, segregation, storage,
transportation, processing and disposal.
In India, there are no specific environmental laws or guidelines
for e-waste. None of the existing environmental laws have any
direct reference to electronic waste or reference to its handling as
hazardous in nature. However, several provisions of these laws
may apply to various aspects of electronic wastes. Since e-waste
or its constituents fall under the category of 'hazardous' and 'non-
hazardous waste', they shall be covered under the purview of
'The Hazardous Waste Management Rules, 2003'.
4. Plastic Manufacture and Usage (Amendment) Rules, 2003
Regulation of plastic waste, particularly manufacture and use of
recycled plastic carry bags and containers, is being regulated in
the country as per 'Recycled Plastics Manufacture and Usage
Rules, 1999' and as amended in 2003.Delhi Metro Rail
Source: Economic Survey of India, 2007-2008, Ministry of Finance
When the Government of India launched the JNNURM programme in December 2005, it recognized that mere funding of
infrastructure projects in cities would not transform them. Reforms of the urban local bodies, Parastatal and the State level was
essential for the city’s sustainable, long-term growth. Urban local bodies need to re-engineer their processes through the adoption
of technology. States have to eliminate legal, institutional and financial constraints impeding investment in urban infrastructure
and services. JNNURM specifies thirteen mandatory and 9 optional reforms, which States and cities have to execute over the
seven-year mission period.
The CRISIL Awards are being launched in partnership with the Ministry of Urban Development, Government of India. A city’s
Commitment to Reform was the theme of CRISIL Awards for Excellence in Municipal Initiatives, 2006-07. The following cities
were awarded for their performance at National Conference on JNNURM held on October 9, 2007:
Water Supply: Chandigarh and Nanded
Sewerage: Chandigarh and Bangalore
SWM: Vijayawada and Nanded
Financial Management: Mumbai and Pimiprichwad Municipal Corporation
Progress on e-governance set-up is being made in 8 cities
100 per cent cost recovery (water supply) has been achieved in 3 cities
' '
§
§
§
§
§
§
Box 3.4.5: CRISIL Awards For Excellence In Municipal Initiatives, 2006-07

Key Environmental Issues- Managing Urbanization157
State Of Environment Report-2009 156
6. Accelerated Urban Water Supply Programme (AUWSP)
Due to the low economic base and lower priority given by the
State Governments to provide water supply to smaller towns,
these are often neglected during normal times and are worst hit
during the periods of drought as was observed in 1987.
Therefore, there is a need to extend financial support to the State
Governments/Local Bodies for providing water supply facilities
in towns having population of less than 20,000 (1991 census).
With this in view, a Centrally Sponsored Accelerated Urban thWater Supply Scheme was included in the VIII Five Year Plan.
Objectives
§To provide safe and adequate water supply facilities to the
entire population of the towns having population less than
20,000 (as per1991census) in the country within a fixed
time frame.
§To improve the environment and the quality of life.
§For better socio-economic conditions and more
productivity to sustain the economy of the country.
7. Public Private Partnerships in Infrastructure Projects
Scheme for support to Public Private Partnerships in
Infrastructure projects has been approved by the Cabinet
recently. Department of Economic Affairs has issued guidelines
Sectors under this scheme are:
§Roads and bridges, railways, seaports, airports, inland
waterways
§Power
§Urban transport, water supply, sewerage, solid waste
management and other physical infrastructure in urban
areas
§Infrastructure projects in Special Economic Zones
§Redirection of investment is recommended to develop
strong economic base for small and medium cities
neglected so far.
§Redirection of migration flow is required. Since the mega
cities have reached saturation level for employment
generation and to avoid over-crowding into the over
congested slums of mega cities i.e Mumbai, Kolkata, Delhi,
Chennai etc. it is required to build a strong economic sector
(Kundu and Basu, 1998) in the urban economy. Growth
efforts and investments should be directed towards small
cities which have been neglected so far so that the
functional base of urban economy is strengthened. Then,
the redirection of migration to this desirable destination will
be possible.
§Policy should also relate to proper urban planning where
city planning will consist of operational, developmental and
restorative planning.
§Operational planning should take care of improvement of
urban infrastructure, e.g roads, traffic, transport etc.
RECOMMENDATIONS
for the scheme, which envisages viability gap funding support to
eligible projects. In order to make maximum utilization of this
assistance window, DEA has suggested that the Ministries which
do not have a Model Concession Agreement (MCA) may initiate
steps to formulate such an Agreement. The Ministry has
requested WSP-SA to prepare MCA for water supply and
sanitation sector.
Rotary kiln furnace of the common hazardous waste incinerator Vermicomposting: An effective way of managing waste
The Delhi Metro Rail System, technically known as Delhi Mass Rapid Transit System (MRTS) and popularly called the Delhi
Metro, has transformed the way people travel where it has already been commissioned in Phase I in 65.1 km. It has incentivized
a model shift from the private to public transport. Delhi Metro has also set standards for completion of projects with quality and
without time and cost overrun as well as no inconvenience to the general public. Ever since it was commissioned, it has
maintained the same level of quality of service. The unique joint venture institutional structure of 50:50 partnership of the
Government of India (GoI) and the Government of the National Capital Territory of Delhi (GNCTD), set up for speedy
implementation of this project, has proved to be very successful. Hence, the venture is being repeated in other States as well.
Delhi MRTS project Phase I (65.1 km), already completed, consists of the following corridors:
Line 1: Shahdara-Rithala
Line 2: Vishwavidhyalaya-Central Secretariat
Line 3: Barakhamba Road-Dwarka, and Extension of Line 3 to Dwarka sub-city and Barakhamba Road Indraprastha.
The Government has now sanctioned construction of DMRC Phase II and its extension, totaling to 115.505 km on the following
corridors:
1. Vishwavidhalaya-Jahangir Puri
2. Central Secretariat-Qutab Minar
3. Shahdara-Dilshad Garden
4. Indraprastha-New Ashok Nagar
5. Yamuna Bank-Anand Vihar Inter-State Bus Terminal (ISBT)
6. Kirti Nagar-Mundka
7. Qutab Minar- Sushant Lok in Gurgoan
8. New Ashok Nagar-Noida
9. Hi Speed Express Link from New Delhi Railway Station to Indira Gandhi International Airport
Source: Economic Survey of India, 2007-2008, Ministry of Finance
Box 3.4.6: Delhi Metro Rail SystemDevelopmental planning should emphasize on
development of newly annexed urban areas. Various urban
renewal processes can be used. Restorative planning
should aim to restore original status of old buildings and
monuments with heritage value.
§Compendium of Environmental Statistics 2007, Ministry of
Statistics & Programme Implementation
§Economic Survey of India 2007-08, Ministry of Finance
§Kundu and Basu S. (1998).Informal Manufacturing Sector
in Urban Areas-an Analysis of Recent Trends, Manpower
Journal, 34(1)
§National Family Health Survey-3 (2005-06), Ministry of
Health & Family Welfare
§Pranati Datta (2006). Urbanization in India, Regional and
Sub-Regional Population Dynamic Population Process in
Urban Areas. European Population Conference. 21-24 June,
2006
§Sanjay K. Singh (2005). Review of Urban Transportation in
India. Journal of Public Transportation, Vol. 8, No. 1
REFERENCES
§Sutapa Maiti and Praween K. Agrawal (2005).
Environmental Degradation in the Context of Growing
Urbanization: A Focus on the Metropolitan Cities of India.
Journal of Human Ecology. Vol.17(4), 277-287
§World Health Report 2006, World Health Organization,
Geneva
§Ministry of Urban Development, Government of India
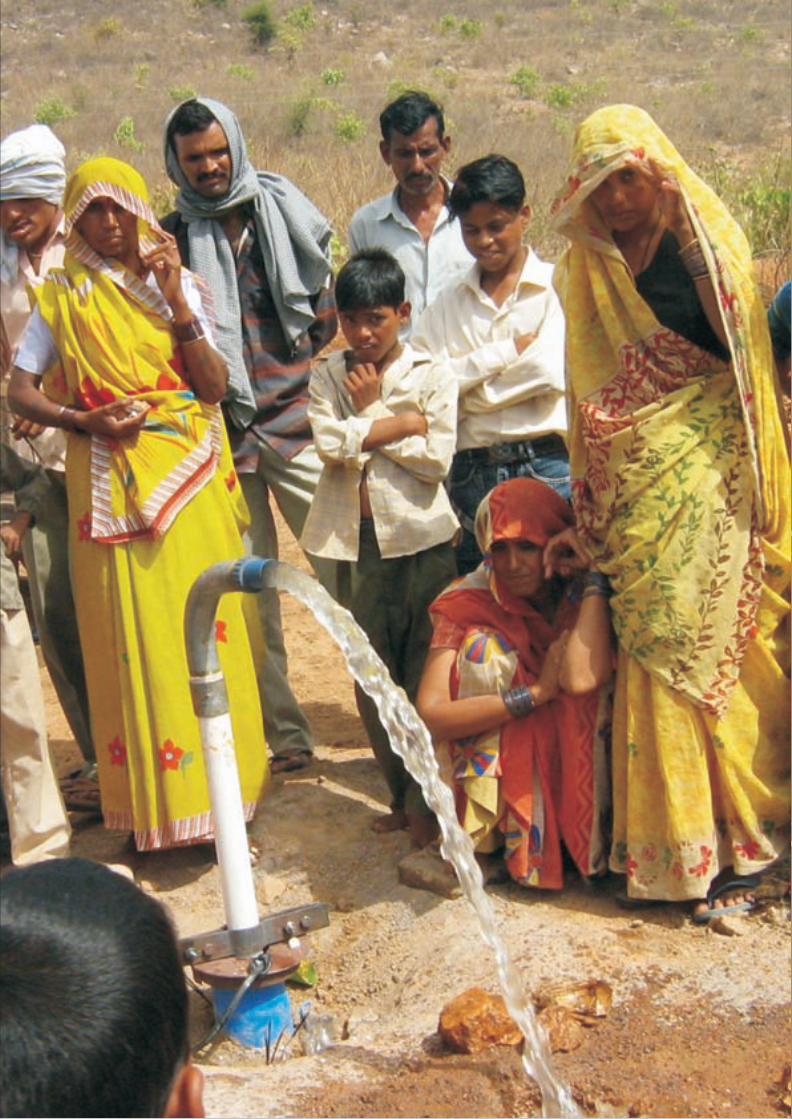
POLICY & INSTITUTIONAL OPTIONS
POLICY & INSTITUTIONAL OPTIONS
CHAPTER - 4

POLICY & INSTITUTIONAL OPTIONS
POLICY & INSTITUTIONAL OPTIONS
CHAPTER - 4

Policy & Institutional Options161
State Of Environment Report-2009 160
BUILDING AWARENESS
Spreading awareness and empowering people to take decisions,
at the local level, is an effective way of dealing with the
environmental problems of India. Their decisions will enable
initiatives that benefit themselves, as well as the local
environment. It has been seen that solutions always emerge
whenever governments involve people, using a participatory
approach to solve problems. Centuries of careful tending of land
on which people depend, is an example of their ability to coexist
harmoniously with nature, and each generation has passed on its
traditional understanding of managing natural resources to those
who have followed.
Rapid population growth is a major challenge which India is
facing. Education and awareness, better health facilities,
accessibility to birth control methods, and promoting a woman's
right to exercise her decisions are the obvious solutions. The
quickening pace of development, industrialization, urbanization
and population growth is challenging traditional practices. The
use of medicinal plants, organic farming and traditional arts and
crafts are being lost in the globalization process. Farmers need to
be educated about better and more sustainable agricultural
practices.
Wasting resources is a practice common to affluent sections of
society and remains one of the principal causes of environmental
problems in India. The per capita consumption of water, energy
and food in urban centres is many times more than in rural areas.
In India, awareness needs to be spread so that individuals
understand the value of conserving resources (water, energy)
and products (food), especially among the affluent sections of
the population.
Another major challenge is conserving the rich biodiversity and
using it sustainably for economic benefit. Local people should
be educated about the natural wealth they possess, so that the
developed world does not take undue advantage of their
traditional knowledge, by patenting it. For example, the
Government is working in cooperation with local communities
to document this knowledge for posterity and as a step towards
protection against unfair patents.
Protecting Traditional Knowledge
India has a rich diversity of plants, which have been used by
people for generations. The majority of people still rely directly
on the diversity of plants, or plant genetic resources, for food and
medicine. There is an abundance of local expertise in plant
genetic resources that has been in use over a considerable period
Managing natural resources requires efficient institutions at all
levels i.e. local, national, regional and global. Institutions are
defined as humanly devised constraints that structure human
interaction (Berkes and Folke, 2000). Institutions, as defined by
Young (1999), are systems of rules, decision-making
procedures, and programmes that give rise to social practices,
assign roles to participants in these practices and guide
interactions among the occupants of the relevant roles.
Institutions often figure prominently in efforts to solve or
manage environmental problems (Young, 1999). The role of
institutions in natural resource management is being
increasingly recognized in the context of global environmental
change. Further, challenges involved in integrating research into
policy necessitate a thorough understanding of the dynamics
between the human actions at different scales.
Awareness campaign in Rural Areas
Figure 4.2: A Simple Framework Connecting Set-up to Ecosystem Performance
Fishing rights leased to non-villagers Lesser environmentalconcerns
Degraded stateof eco-system
Social conflicts
Lack of interestin cultivation
Land use and cover change
Livelihoodopportunities forlocals reduced
Changes in state policies/laws
Land tenure to tenants
Changes in state policies/laws
Revenue formcultivation rights
unavailable
Inadequate funds for maintenance
Improper Management
Institutional set upChange in I set up
Management Responsibility
Communicate System&
Tenant Association
Community Management&
State Interference
Difficulties in Management
Delay in decision making
Degraded state of theecosystem
Impact on ecosystem performance
However, policy research and analysis of institutions related to
global environmental change, that is ongoing worldwide,
normally focuses on international or national mechanisms and
programmes in place. While it is accepted that these programmes
contribute significantly to causing and confronting global
environmental changes, the role of local institutions cannot be
ignored. Therefore, it is necessary to study the role of institutions,
operating at the local level, in global environmental change and
build the capacity of local communities to adapt to these changes
(Figure 4.1 & Figure 4.2).
Source: Institutional Dimensions of Global Environmental Change ( FrameworkIDGEC)
Figure 4.1: Framework for Analyzing Role of Institutions in Global Environmental Change
Institutionalproperty rights
regulatory regimes
Human activitiesover harvesting of fish
Other CausesSocio-economic, biogeophysical
Environmental changeBiodiversity loss
Causesweak incentives to
conserve
Institutional responsesaltering property rights
of stems

Policy & Institutional Options163
State Of Environment Report-2009 162
of time and is also constantly evolving. In agriculture, for
instance, this knowledge is shown in the development and
adaptation of plants and crops to different ecological conditions
(soils, rainfall, temperature, altitude etc.). Traditional
knowledge is people's awareness and understanding of this and
other information, which is passed on from one generation to the
next, usually by word of mouth, for example, within a specified
group of people.
Intellectual Property Rights
Most of the debate about traditional knowledge at the
international level is taking place in the context of Intellectual
Property Rights (IPR). It is through IPR, and particularly
patents, that control and ownership over traditional knowledge is
being usurped by commercial interests.
It is clear that industries, with the increased support from
governments, are quickly establishing control over plant genetic
resources and associated knowledge through the use of IPRs.
Yet, resistance to this incursion on community rights has been
disparate and experimental. Overall, communities are
increasingly losing control over their own plants and are being
increasingly exploited for their knowledge. As the awareness
amongst groups, communities and even governments has
increased, and as those affected have become more organized,
the tide has begun to turn.
There is, however, a lot of strategic work to be done among
NGOs and people's movements in order to build a stronger social
force against the growing influences of trade and IPR over
genetic resources and traditional knowledge. Now, concerns are
being raised that the very biological resource base of traditional
knowledge is on the verge of depletion. Plants are vanishing so
quickly that the Earth is losing one major drug to extinction
every two years. Disrupting the inter-relation between the
traditional knowledge generators and their resource, may well
lead to the disintegration of the very processes by which the
knowledge is evolved and kept alive.
Empowering Local Communities
With India facing and even succumbing to such threats of bio-
piracy and breach of IPRs, a collective stand may provide an
effective sharing of traditional knowledge. Steps which could be
taken to address these threats include:
Networking: Increased networking amongst NGOs and
communities to present a united body of opinion.
Community rights: Development and establishment of strong
community rights' systems that recognize the collective nature of
local innovation, promote its development and application,
encourage individual innovation within this community
framework and shield biodiversity and indigenous knowledge
from privatization.
Legal rights: Conferring clear and unambiguous legal rights to
genetic resources, as this is closely linked with the recognition of
the rights of indigenous people and local communities to such
resources. This means that basic issues of self-determination,
sovereignty and communities' own definitions of their rights
need to be dealt with and built into statutory law and policy at the
national level.
Documentation: Recognizing and protecting, through legal
means, the various initiatives at documenting the traditional
knowledge. The uncertainty about whether and how to document
the materials and knowledge, for fear that the information is used
against the people's interests, needs to be resolved.
Alternative approaches: Examining and highlighting
alternatives to IPRs which protect traditional knowledge.
Trade related aspects of Intellectual Property Rights:
Strengthening a unified demand to review and amend the WTO's
Agreement on Trade-Related Aspects of Intellectual Property
Rights.
Environment Education
The dissemination of awareness and education about the
environment can be done through formal education and informal
means.
Formal Education
The formal education system provides a good framework for
reaching out to a large segment of the population and can help
make future generations conscious of the importance of
environment conservation. India has made efforts to introduce
environment education into their primary, secondary and tertiary
syllabi with varying degrees of success. Academic approaches
have included separating environmental studies from other
courses or incorporating them into existing curricula at the
primary and secondary levels. Many schools have organized and
established eco-clubs, whose members participate in
environmental awareness-and-action activities. There is a
definite increase in awareness among school going children
about the threats to the environment and many of them, in their
own small ways, are contributing through activities to preserve
the environment (such as boycotting polythene bags, planting
trees, etc.). Formal education is often supplemented with
activities such as field visits to study centres, museums and
parks, use of audio-visual material and children's magazines.
NGOs and universities in some countries play a major role in
training teachers and providing the material for formal
education.
Programmes and Campaigns
Environmental conservation is a task of such magnitude that no
government or group, however influential or knowledgeable,
can undertake it successfully without the participation of people.
Efforts, therefore, have been made through campaigns to
generate in the citizenry a concern for, and awareness of the
environment.
The recommendations for making environmental awareness
more effective at a formal level are:
§Improve the quality of school curricula to make learning
and teaching about the environment more effective.
§Review, select and make available adequate supplementary
educational material that has already been developed, for
use in primary and secondary schools.
§Produce educational material on environmental issues (that
have not been adequately covered) in the form of case
studies, and on emerging conditions relating to the
environment.
§Organize training courses for teachers and introduce field-
oriented methods of teaching about the environment.
§Initiate schemes to motivate teachers and schools to
enhance the level of environmental education.
§Encourage and support NGOs to undertake environmental
awareness programmes.
Informal Education
Religious Institutions
Naming a piece of land after a god (as in the case of sacred
groves), or giving away tree saplings as blessings, are long
established practices in the region, which are still being used to
preserve our environment.
Industrial Sector
While large industries are generally aware of their responsibility
towards the environment (more so because the law keeps a close
watch on them), smaller factories and workshops actively flout
environmental regulations, both knowingly and unknowingly.
Generating awareness and providing cleaner and greener
alternatives and technologies should be a major concern for all
the countries in the region. In this context, the sharing of
information and technologies by research institutions, regionally
and globally, is crucial.
The Critical Role of Women
Women have a special stake in helping the cause of sustainable
development; they play a critical role in determining a number of
factors that affect sustainable development. Moreover, women
can play a crucial role in the planting of trees as an alternative to
traversing long distances to collect firewood.
In India, local forests established by women have a much higher
chance of survival than those planted by the government. The
ratio (in terms of the probability of survival) stands at 80 per cent
for the women compared to 20-30 per cent for the government.
The role of women in household sanitation and health is no less
significant. More than any hydrologist or urban planner, it is the
women of the developing world - the drawers, carriers and
household managers of water - who understand what water
scarcity is and its implications for communities. Despite this,
access to informal environmental education for women is low in
India. Most environmental training programmes on soil
regeneration, forestation, energy saving and water management
do not provide learning opportunities for women. Therefore,
women require better opportunities to translate their knowledge
and initiatives into concrete action and control over natural
resources such as water, as well as over their own lives. By
offering them opportunities in education, economic and political
life and in the decision-making process, governments could
vastly improve in terms of environment management.
Environmental Communication
The essence of environmental communication is to convince
people that there is problem that requires urgent attention. With a
host of messages competing every moment for the public's
attention, the task of delivering any particular one is by no means
easy. Numerous channels of communication, ranging from print
and electronic media to folk art and community communicators
such as NGOs and action groups, have been used to promote
environmental awareness among the people. These have
achieved substantial success in raising environmental
consciousness over the years.
Role of Media
Until a few years ago, environment reportage was largely limited
to covering speeches or tree-planting campaigns on
Environment Day. Today, journalists work closely with
environmental activists, and are much more pro-active and
focused on the larger issues. Media coverage of environmental
issues has not only increased in recent years but has also become
more diverse. Besides the local issues, global ones such as the
greenhouse effect, ozone depletion and loss of biodiversity are
increasingly coming in the limelight.
Training women in paper bag making
Women empowerment through skill-training

Policy & Institutional Options165
State Of Environment Report-2009 164
The role and the reach of various media in terms of
dissemination of environmental information vary. The print
media, radio and television dominate the urban areas, whereas
traditional and interpersonal forms of communication appear to
be far more effective in rural areas. Radio may be used as a
powerful medium for information dissemination in local
languages as it reaches most rural areas.
Folk - Art
Communication through folk media is an effective age-old
technique. Experiments have demonstrated that people residing
in rural areas respond most readily when communicators relate
to their local circumstances and cultures, and when they interact
with the audience. As for electronic media, it has generally
proved persuasive when it has adopted the traditional methods of
dissemination: humour, discussion, illustration through
dramatization, and song-and-dance sequences.
The recommendations for making environmental awareness
more effective are:
§Integrating community concerns in decision-making.
§Involvement of community in natural resource
management.
§Market development as a driving force for changes in
human-environment relationship.
§Institutions need good support from concerned
organizations to perform better.
§Capacity building of concerned organizations.
§Periodical review of performance to enhance
responsiveness of institutions.
§Education and communication needs more financial
allocation by governments.
§Enhanced awareness and greater public understanding of
environmental and development issues is vital for the
success of all other development programmes. In other
words, a strong educational and communication sector is
akin to an insurance policy to secure the future. Increased
financial allocation is, therefore, a primary requirement.
§Initiate regional and global cooperation in sharing
educational material.
§Encouragement and support to NGOs for carrying out
environmental awareness programmes.
§Formulate a comprehensive country-wide awareness
programme through the print and audio-visual media, and
seek private support for the programme.
areas outside governments with necessary financial and
institutional support.
International Cooperation
India has contributed to, and ratified several key multilateral
agreements on environmental issues in recognition of the trans-
boundary nature of several environmental problems, and has
complied with their commitments. To enhance capacities to
comply with commitments, and ensure sustained flows of
resources for environmental management, the following steps
should be taken:
a) Use multilateral and bilateral cooperation programmes for
capacity building in terms of environmental management,
particularly in relation to commitments under multilateral
instruments;
b) Participate in mechanisms and arrangements under
multilateral agreements for enhancing the flow of resources for
sustainable development; and
c) Encourage cooperation among states in the country, in
particular for scientific and technical capacity building in
environment management.
Regional Mechanisms
The trans-boundary nature of global environmental problems
suggests that cooperation between states represents the best
strategy for addressing concerns, effectively. Therefore,
responding to environmental problems through prompt
collective action could be an important means to generate trust
and goodwill. Even though there are several regional
mechanisms for environmental protection, there exists a need
for more policies that address the nature of trans-boundary
environmental problems and their impacts. A network of
regional institutions could be effective in complementing the
existing institutional mechanisms, by contributing to the
creation of a better understanding of key issues, exchange of
information among key institutions, and training and capacity
building of appropriate stakeholders. A proper perception on
common environmental problems will result in common and
politically compatible solutions, ensuring better cooperation
within the country.
Technology Transfer
India is facing one of the fastest growths of population,
economic activity, as well as pollution. Transferring state-of-
the-art eco-friendly technologies and training people to use
them, is essential to meet the three-fold challenge. The focus
should be on the propagation and use of 'green technologies'
which include an evolving group of methods and materials for
producing non-toxic clean products. The scope of
environmental technology has been extended to include clean
technology for pollution prevention (such as the development
and use of less polluting materials), procedural improvements
and enhanced energy efficiency. Environmentally sound
technology not only refers to each separate technique, but to the
entire comprehensive system which includes knowledge,
§There is a tendency to focus on formal school education
target groups by both governments and NGOs, rather than
addressing groups that can make a difference in a policy
issue. In reality, our environment is managed by a wide
variety of individuals in society. It includes managers of
resources (such as town planners and forest officials),
teachers (who disseminate environmental information and
thus influence the management), and rural women, farmers
and urban housewives (who exercise a direct impact on our
environment). Governments and NGOs should make these
groups the prime catalysts for their awareness generation
campaigns.
Community-based natural resource management initiatives,
coupled with policy reforms, can prove to be an effective
mechanism for improving access to, and improving productivity
of natural resources. The success of, joint forest management
and irrigation user groups in India, provides enough evidence
that social capital and participatory processes are as crucial to
environmental protection as financial resources and
development programmes. The value of human, land, water and
other assets depend on technologies that improve the
productivity of those assets, thereby generating adequate return
and income. Globalization can bring significant benefits of
technological advancement, and market access through
improved connectivity and information. However, it must be
emphasized here that unless local communities themselves are
involved in the selection and use of these technologies, they are
unlikely to benefit from their implementation and these
technological interventions will be unsustainable in the long
term.
Research and Development
In order to rapidly advance the scientific understanding of
environmental issues, it is necessary to promote focused research
by competent institutions. A continuous engagement with the
scientific community, in governments, academics, and private
institutions, will provide important insights for policy making
and regulation, including multilateral negotiations, and help
utilize deeper and broader skills available with the scientific
community. Key areas of research are:
§Taxonomies of living natural resources.
§Research leading to better understanding of ecological
processes and pathways.
§Research which provides direct inputs to policy making.
§R&D in technologies for environmental management and
cleaner production.
The order of priority of these research areas is very likely to
change over time. Actions are necessary to periodically identify
and prioritize the areas for research, establish a research
programme in priority areas within governments, with expected
outputs clearly specified, and encourage research in priority
PARTICIPATORY MANAGEMENT
Participatory Management in Rural Area

Policy & Institutional Options167
State Of Environment Report-2009 166
Strengthen the rights of local people to use and manage
ecosystem services
Ecosystem services are a lifeline for the poor in rural
communities, who often do not have clear rights to the land,
fisheries, forests or other resources they use and are unlikely to
have the ability to influence decisions on resource management.
In most countries, decisions on management and use of
ecosystem services are made and influenced by the national
governments, international donors and multinational companies.
Conservation groups have also played a prominent role through
their efforts to protect nature by establishing parks and protected
areas. However, it is increasingly being recognized that more
bottom-up approaches are required to involve local communities
in decision-making processes. Similarly, groups working to
reduce poverty and promote biodiversity conservation pursue a
common cause in development policies and need to synergize
efforts.
over who gets the benefits and who pays the costs of disrupted
ecosystem, in an already highly inequitable world.
India will also have to confront the larger problems arising from
ecosystem degradation. Overlaid will be the effects of growing
pressures such as the build-up of nitrogen in rivers and coastal
waters, species extinction, and increased incidence of droughts
and floods from climate change.
Ecosystem Services Valuation (ESV) can be developed as a
vehicle to integrate ecological understanding and economic
considerations. It is a holistic approach for making inventories
and quantifying the monetary value of ecosystem services so
that various stakeholders, including land owners, planners and
policy makers can better understand the trade-offs when altering
natural ecosystem.
The distribution of benefits from ecosystem goods and services
among different beneficiary groups at different time periods is a
crucial factor when considering their value. Beneficiaries of
ecosystem services include individuals (the basic unit in
estimating the total economic value), commercial entities and
the public sector.
Another scale at which the conflicts between users, or trade-offs
between users, become evident is that of temporal variation of
ecosystem goods and services. Benefits and beneficiaries vary in
the short and long term. Such variations are obvious when
exploitation of ecosystem goods in the short term, leads to a
decline in ecosystem services over the long term.
A variety of policy choices are available to reduce the
degradation of ecosystem services in order to retain their
benefits. These include regulatory approaches (such as
establishing 'no take' zones in fisheries), technological
approaches (such as promoting drip irrigation systems to reduce
water consumption) and economic approaches (such as
assigning private property rights to the resource and enabling the
owners to charge for the use of the service).
In recent years, there has been an increase in the use of economic
instruments to promote the conservation of ecosystem services.
In some cases, the producers of services that were formerly being
provided free, have been paid by the government to provide
those services. In other cases, markets are being established for
ecosystem services that were formerly being provided free, such
as carbon markets that enable a landowner to be paid for
management activities that increase carbon sequestration. Many
policy alternatives to market based approaches exist, and
different societies, and even members within societies, are likely
to opt for different mechanisms since value systems differ over
time and with the changing circumstances. This makes the
process of valuation difficult, except for those services that are
widely traded in the marketplace. Maintaining functional
ecosystems, which provide essential services for human well
being, is the basis of sustainable development.
ECONOMIC INSTRUMENTS
processes, goods and services, facilities, and organization and
management processes.
The objectives of technology transfer are to:
§Ensure sustainability by meeting the needs of society in
sustainable ways, without damaging or depleting natural
resources;
§Manufacture products that are non-toxic or biodegradable
and can be partially or fully reclaimed or reused;
§Reduce waste and pollution by changing patterns of
production and consumption;
§Develop alternatives to technologies, whether fossil fuel or
chemical intensive agriculture, that have been
demonstrated to damage health and environment, and
create a centre of economic activity around technologies
and products that benefit the environment, hasten their
implementation and increase employment opportunities in
this area.
There is increasing pressure on society to carve out sustainable
paths of development and this will lead to public and private
sector research and development institutions to develop
technological solutions. This will also encourage business sector
- Corporations and Small and Medium Enterprises (SMEs) to
adopt new green technologies, either voluntarily or in
compliance with the growing number of environmental
regulations. Biotechnology offers powerful new tools for
improving agricultural productivity, environmental
sustainability and nutritional quality of staple foods. These new
technologies are helping to guide more precise crop and
livestock breeding efforts, to diagnose crop and livestock
diseases, and to develop more effective livestock vaccines.
Barriers to Successful Technology Transfer
The parameters that act as barriers to successful technology
transfer are:
§Lack of information on the benefits of green technologies
§Lack of communication between national and international
information systems and industry associations
§Lack of funds to facilitate technology transfer since
mandates and financing of these information systems are
not specifically oriented to developing countries
§Greater cost of new technologies compared to those of the
existing polluting technologies
§Intellectual property rights and royalties
§Lack of skills in terms of managing green technology in the
region
Ecosystem Services
Ecosystem services are the systems and processes through
which natural ecosystems and species sustain human life. These
include oxygen production, carbon sequestration, provision of
clean water, assimilation of wastes, and flood regulation. The
rising demand for ecosystem services, coupled with their
reduced supply, will lead to growing vulnerability and conflicts
REFERENCES
§Berkes F and Folke C (2000) Linking Social and Ecological
systems Cambridge University Press, U.K pp 459
§GRAIN; Kalpavriksh (2002). Traditional knowledge of
biodiversity in Asia-Pacific: Problems of Piracy &
Protection, Kalpavriksh Environmental Action Group and
Genetic Resources Action International.
§Institute for Global Environmental Strategies (2000).
Environmental Education in the Asia-Pacific Region: Some
§Problems and Prospects. International Review for
Environmental Strategies. (1) No.1, pp. 57 - 77, 2000
§Role of Institutions in Global Environmental Change, 2005,
Asia-Pacific Network for Global Change Research
§South Asia Environment Outlook 2007, United Nations
Environment Programme
§UNEP (2001). South Asia: State of the Environment 2001.
United Nations Environment Programme
Common Myna : Acridotheres Tristis

Annexures169
State Of Environment Report-2009 168
ABBREVIATIONS
BAU Business as Usual
BCM Billion Cubic Metre
BTU British Thermal Unit
CDM Clean Development Mechanism
CO Carbon Monoxide
CO Carbon Dioxide2
CNG Compressed Natural Gas
CPCB Central Pollution Control Board
CPHEEO Central Public Health and Environmental Engineering Organization
CSO Central Statistical Organization
dB(A) A-Weighted Decibels
DPCs District Planning Committees
EIA Environmental Impact Assessment
FAO Food and Agriculture Organization
GDP Gross Domestic Productivity
GEDA Gujarat Energy Development Agency
GJ/t Gigajoule per tonne
GW Gigawatt
ICIMOD International Centre for Integrated Mountain Development
IFPRI International Food Policy Research Institute
IIPS International Institute of Population Science
INP Indian Nutrition Profile
IPCC Intergovernmental Panel on Climate Change
IIT Indian Institute of Technology
Kgoe Kilogram of Oil Equivalent
IUCN International Union for Conservation of Nature
LULUCF Land-Use, Land-Use Change and Forestry
Mha Million Hectares
MNRE Ministry of New and Renewable Energy
MoA Ministry of Agriculture
MoEF Ministry of Environment and Forests
MoPNG Ministry of Petroleum and Natural Gas
MPCs Metropolitan Planning Committees
MPN Most Probable Number
MT Million Tonnes
MTPA Million Tonnes per Annum
MTOE Millions Tonnes of Oil Equivalent
NAPCC National Action Plan on Climate Change
NGO Non-Governmental Organization
NFHS National Family Health Survey
NSSO National Sample Survey Organization
NO Oxides of NitrogenX
OED Occupational and Environmental Health
PM Particulate Matter
RSPM Respirable Suspended Particulate Matter
SMEs Small and Medium Enterprises
SO Sulphur Dioxide2
SPM Suspended Particulate Matter
TERI The Energy and Resource Institute
ULB Urban Local Bodies
UNDP United Nations Development Programme
UNEP United Nations Environment Programme
UNESCO United Nations Educational, Scientific and Cultural Organization
UNFCCC United Nations Framework Convention on Climate Change
USAID United States Agency for International Development
VOC Volatile Organic Compound
WHO World Health Organization
WMO World Meteorological Organization
WTO World Trade Organization
WWF World Wide Fund for Nature
State-wise Details of Distribution of Flouride in Ground Water above Permissible Limit
Occurrence of High Arsenic in Ground Water of some States of India
LIST OF TABLES
Table 1.1 Rate of growth at factor cost at 1999-2000 prices (per cent)
Table 2.1.1 Land Use Classification in India area in Mha., 2005-2006
Table 2.1.2 Status of Forest Cover in India, 2005
Table 2.1.3 All India Consumption of Fertilizers in Terms of Nutrients (N, P and K)
Table 2.1.4 States under Drought Prone Area Programme
Table 2.2.1 Annual Growth Rate (Per Cent) For Industries
Table 2.2.2 Sectoral Growth Rates
Table 2.2.3 Total Absolute Emissions of CO (Million Tonnes/Year) From the Power Sector by Region for 2000-01 to 2
2006-2007
Table 2.2.4 Top Ten Locations With Respect to SO Emissions During 2007 in Residential Areas.2
Table 2.2.5 Top Ten Locations With Respect to SO Emissions During 2007 in Industrial Areas.2
Table 2.2.6 Top Ten Locations with Respect to NO during 2007 in Residential Areas2
Table 2.2.7 Top Ten Locations with Respect to NO During 2007 in Industrial Areas2
Table 2.2.8 Top Ten Locations with Respect to RSPM During 2007 in Residential Areas
Table 2.2.9 Top Ten Locations with Respect to RSPM During 2007 in Industrial Areas
Table 2.2.10 Top Ten Locations with Respect to SPM During 2007 in Residential Areas
Table 2.2.11 Top Ten Locations with Respect to SPM During 2007 in Industrial Areas
Table 2.2.12 Average Noise Levels in Various Metropolitan Cities
Table 2.2.13 Effects of Noise Pollution on Human Health
Table 2.2.14 Prevalence of Tuberculosis by Type of Housing and Fuels/Cooking Arrangements
Table 2.2.15 Gasoline Lead Phase Out Programme
Table 2.2.16 Diesel Sulphur Reduction Programme
Table 2.2.17 Gasoline Benzene Reduction Programme
Table 2.2.18 Vehicular Pollution Control Measures & Impact on Air Quality in Delhi
Table 2.2.19 Ambient Air Quality of Delhi- Comparision of Pre-CNG (2000) with 2008*
Table 2.3.1 Water Availability in India
Table 2.3.2 Water Availability- Basinwise
Table 2.3.3
Table 2.3.4
Table 2.4.1 State-wise List of Wetlands of International Importance in India under Ramsar Convention
Table 2.4.2 Threatened Species
Table 2.4.3 Number of Biosphere Reserves set up in India
Table 2.4.4 List of Tiger Reserves in India
Table 2.4.5 Summary of Existing Protected Area Network in India
Table 3.1.1 Comparison of Change in Water Balance Components as a Percentage of Rainfall
Table 3.2.1 Comparison of Poverty Estimates Based on Uniform Recall Period
Table 3.2.2 Comparison of Poverty Estimates Based on Mixed Recall Period
Table 3.2.3 Minimum Support Price (Rs. Per Quintal) of Wheat/ Paddy for the Last Five Years (2002-03 to 2006-07)
Table 3.2.4 Average Annual Growth (%) in Agriculture Sector
Table 3.2.5 Percentage Change in Production of Food Grains
Table 3.2.6 Index Numbers of Area, Production and Yield of Food Grains, in India
Table 3.2.7 Assessed Shares of Food Grains for the SARRC Food Bank
Table 3.3.1 Water Requirements for Different Uses in India
Table 3.4.1 State-wise Distribution of Coal Resources and its Categories
Table 3.4.2 The Formation-wise and Category-wise Coal Resources(in million tonnes) of India as on 1.1.2006

Annexures171
State Of Environment Report-2009 170
Figure 3.1.6 Coastal Districts Vulnerable to Climate Change
Figure 3.1.7 Expenditure on Adaptation Programmes in India
Figure 3.1.8 Relative Expenditures on Major Adaptation Schemes by Thematic Area
Figure 3.2.1 Status of Nutrition in the World
Figure 3.2.2 Percentage of Population Below Poverty Line
Figure 3.2.3 Trends in Children's Nutrition Status in India
Figure 3.3.1 Basin-wise Water Resource Potential (unit:bcm)
Figure 3.3.2 Projected Annual Requirement of Water (in Different Sectors)
Figure 3.3.3 The Concept of the Poor Pay More
Figure 3.4.1 India's Production of Coal
Figure 3.4.2 Proved Recoverable Coal Reserves; The Top 10 Countries in the World
Figure 3.4.3 Primary Energy Sources of India
Figure 3.4.4 World Coal Consumption 2004-2030
Figure 3.4.5 Sector-wise Consumption of Electricity in India
Figure 3.4.6 Projected Electricity Generation Capacity
Figure 3.4.7 Projected Commercial Energy Consumption
Figure 3.4.8 Trends in Thermal Specific Energy Consumption in the Indian Cement Sector
Figure 3.4.9 Trends in Thermal Specific Energy Consumption in the Indian Iron & Steel Sector
Figure 3.4.10 Energy Labels for Refrigerators and Fluorescent Lamps
Figure 3.5.1 Growth in the Size of Urban Population in India, 1901-2001
Figure 3.5.2 Projected Urban Population
Figure 3.5.3 Households with Improved Source of Drinking Water in India
Figure 3.5.4 Toilet Facility by Residence
Figure 3.5.5 Per cent Of Households Having No Toilet Facilities
Figure 3.5.6 Solid Waste Generated in India's Top 10 Cities
Figure 3.5.7 Composition of MSW in a Typical Indian City
Figure 3.5.7 Distribution of The Total Hazardous Waste Generated Among Different Hazardous Waste Generating States
Figure 3.5.8 State-wise Identified Hazardous Waste Dumpsites
Figure 4.1 Framework For Analyzing Role of Institutions in Global Environmental Change
Figure 4.2 A Simple Framework Connecting Set-up To Eco-system Performance
Box 2.1.1 Drivers and Pressures Affecting Forest Ecosystems
Box 2.4.1 Bishnois – Committed to Conservation
Box 2.4.2 Forest Cover Change in Tiger Reserves
Box 2.4.3 New Technology for Mining
Box 2.4.4 Traditional Ethos
Box 3.1.1 The Emission Scenarios of the IPCC Special Report on Emission Scenarios (SRES)
Box 3.1.2 Cyclonic Events
Box 3.2.1 ‘Our Agriculture is in the Doldrums’
Box 3.3.1 Water Needs of Ecosystems
Box 3.3.2 A Look at India's Water Harvesting Practices
Box 3.3.3 Polluter’s Pay Principle – Supreme Court
Box 3.3.4 Reuse and Recycling of Water Within and Among Sectors
Box 3.3.5 Water Security – Financial Constraints
Box 3.4.1 Generation of Energy
Box 3.4.2 India's Nuclear Power Potential
Box 3.4.3 Rajiv Gandhi Grameen Vidhyuti-Karan Yojna (RGGVY): Progress
Box 3.5.1 Salient Features of Slum as per Census 2001
Box 3.5.2 Flush with Success
Box 3.5.3 Localities Manage Their Own Waste Better in Greater Mumbai
Box 3.5.4 Recycling Waste in Namakkal, India
Box 3.5.5 Crisil Awards For Excellence in Municipal Initiatives, 2006-07
Box 3.5.6 Delhi Metro Rail System
LIST OF BOXES
Table 3.4.3 Type-wise and Category-wise Coal Resources (in million tonnes) of India as on 1.1.2006
Table 3.4.4 Estimates of Coal Resources (in million tonnes) in the Country during last 5 years
Table 3.4.5 Estimated Potential for Renewable Energy Technologies in India
Table 3.4.6 State-wise Wind Power Installed capacity
Table 3.4.7 Renewable Energy: Estimated Potential and Cumulative Achievements as on 31.12.2007
Table 3.4.8 Power Supply Position in India
Table 3.4.9 Energy Conservation Potential in Indian Industries
Table 3.4.10 Summary of Energy Related Laws and Policy Decrees
Table 3.5.1 Pattern and Trend of Urbanization in India 1901-2001
Table 3.5.2 Growth in the Number of Million Plus (1,000,000) Population or More) Cities in India: 1901-2001
Table 3.5.3 Trend in Total Population (in 10,000s) and Annual Growth Rate (%) in the Four Metropolitan Cities of India: 1901-2001
Table 3.5.4 Number of Migrants by Place of Birth – India 2001
Table 3.5.5 Number of Intra-State and Inter-State Migrants in the Country (duration of residence 0-9 years) by Rural Urban Status – India 2001by Rural Urban Status – India 2001
Table 3.5.6 Urban-Rural Breakup of Total Population, Number of Households and Houses
Table 3.5.7 Number of Persons Killed in Road Accidents by Truck/Lorry and Private Buses in Metro Cities (2005 and 2006)
Table 3.5.8 Availability of Safe Drinking Water Per Day in Metropolitan Cities of India (As per Nov., 2003)
Table 3.5.9 Projected Population and Respectively Wastewater Generation in India
Table 3.5.10 Land-Use Activities & Their Potential Threat To Groundwater Quality
Table 3.5.11 Change In Waste Composition In Selected Cities
Table 3.5.12 Status Of Municipal Solid Waste Management In Selected Metro Cities, 2004-05
Figure 1.1 Administrative Map of India
Figure 2.1.1 Land Use Classification in India (2004-2005)
Figure 2.1.2 Extent of Various Kinds of Land Degradation in India
Figure 2.1.3 Change in the Forest Cover of India
Figure 2.1.4 Natural Hazard Prone Areas in India
Figure 2.1.5 Drought Prone Areas of India
Figure 2.2.1 Total, Rural, Urban, Agricultural Population Growth Since 1961 (Agr Pop) and Non- Agricultural Population (Non-Agr Pop)) for India
Figure 2.2.2 Total Registered Motor Vehicles in India
Figure 2.2.3 Vehicle Growth in India
Figure 2.2.4 Proportion of Households By Type of Fuel Usage
Figure 2.2.5 Trends in Annual Average Concentration of SO in Residential Areas of Delhi, Mumbai, Chennai and Kolkata2
Figure 2.2.6 Trends in Annual Average Concentration of NO in Residential Areas of Delhi, Mumbai, Chennai and Kolkata2
Figure 2.2.7 Trends in Annual Average Concentration of RSPM in Residential Areas of Delhi, Mumbai, Chennai and Kolkata3Figure 2.2.8 Concentration of PM2.5 (g/m ) at Bahadur Shah Zafar Marg (ITO), Delhi during 2007
Figure 2.2.9 Six Major Communicable Diseases (Cases), 2006
Figure 2.2.10 Six Major Communicable Diseases (Deaths), 2006
Figure 2.4.1 Biogeographic Classification of India: Zones
Figure 2.4.2 Forest Cover in India
Figure 2.4.3 Type of Mangrove Covers in India
Figure 2.4.4 Total Mangrove Covers in India
Figure 2.4.5 Growth of National Parks in India
Figure 2.4.6 Growth of Wildlife Sanctuaries in India
Figure 2.4.7 Growth of Protected Areas in India
Figure 3.1.1 India's Share in Global CO Emissions 2
Figure 3.1.2 Distribution of GHG Emissions from India
Figure 3.1.3 Natural Hazards Affected Areas of India
Figure 3.1.4 Vulnerability of Indian Agriculture to Climate Change and Globalization
Figure 3.1.5 Vegetation Map for the Year 2050 (Right) under GHG run-of Hard RM2 Considering all Grids of Indian and Potential Vegetation (including grids without forests). The Control Run (without GHG increase) is shown on the left.
LIST OF FIGURES

Consultation Workshop Participants173
State Of Environment Report-2009 172
Sensitization/Stakeholders Workshop on ‘State of Environment Report of India’
th19 March, 2008
India Habitat Centre, New Delhi
LIST OF PARTICIPANTS
8. Dr. B. SenguptaMember SecretaryCentral Pollution Control Board Parivesh Bhawan, CBD-cum-Office Complex East Arjun Nagar, Delhi - 110 032Tel: 91-11-22303655TeleFax: 91-11-22307078e-mail: [email protected] EPABX Nos.: 91-11-22305792, 22303717 Email - [email protected]
9. Dr. Srikanta K. PanigrahiDirector, Environment and Forest Planning Commission Yojana Bhavan, Sansad MargNew Delhi - 110001Emal: [email protected]
10. Prof.Vinod K.SharmaProfessor, Disaster Mangement and Environment,Indian Institute of Public Administration (IIPA) Indrapratha Estate, Ring Road, New Delhi - 110002Tel: 91-11-23702400, 9818961977 Email: [email protected],[email protected]
11. Mr. AL. RamanathanAssociate ProfessorSchool of Environment Sciences, JNU, New Delhi
12. Dr. Anil Kumar, Ph.DSenior Scientific OfficerDepartment of Environment Govt. of Delhi
13. Mr. Murari LalChairman Climate, Energy and Sustainable Development Analysis Centre1006, Osimo Block Mahagun Mansions Phase 2 1/4 Vaibhav Khand, Indirapuram Ghaziabad - 201010 Tel: 91-120-3247787
Mob: 9810973380 Fax: 91-120-4129730 Email: [email protected]
14. Mr. Ashok EmaniSenior Specialist – EnvironmentInfrastructure Development Finance Company Ltd.6th Floor, Capital Court, Olof Palme Marg, Munirka, New Delhi - 110067Phone: 91-11-46006112 Fax: 91-11-26713359Web: www.idfc.com
1. Dr. S.P.SharmaStatistical AdvisorEI DivisionMinistry of Environment and ForestsCGO ComplexGovt. of IndiaNew Delhi - 110003Email: [email protected]
2. Dr. Madhumita BiswasJoint DirectorEI DivisionMinistry of Environment and ForestsCGO ComplexGovt. of IndiaNew Delhi - 110003Email: [email protected]
3. Dr. AnnaduraiENVISEI DivisionMinistry of Environment and ForestsCGO ComplexGovt. of IndiaNew Delhi - 110003Email: [email protected]
4. Dr. Debabrata DeResearch OfficerEI DivisionMinistry of Environment and ForestsCGO ComplexGovt. of IndiaNew Delhi - 110003Email: [email protected]
5. Mr. Suneel Pandey Fellow, TERIIndia Habitat Centre, Lodhi Road, New Delhi - 110 003Phone : 91-11-24682100,41504900 Extn. 2334Fax : 91-11-24682144/5Email: [email protected]
6. Mr. P. Prasada RaoManagerEPTRI91/4, Gachibowli,Hyderabad - 500032Mob: 09866077472
7. Mr. G.K.AnandArea Chairman -EnvironmentCentre for Energy, Environment, Urban Governance and InfrastructureDevelopmentAdministrative Staff College of India,Bellavista Campus,Hyderabad - 500082Tel: 91-40-23310952 Extn. 261Fax: 91-40-23312954

Consultation Workshop Participants175
State Of Environment Report-2009 174
15. Mr. Prakash RaoSenior Coordinator, Climate Change and Energy ProgrammeWWF India,172 B, Lodhi Estate,New Delhi - 110003Tel: 91-11-41504794 Fax: 91-11-41504795, 24691226Mob: 9868602928
16. Mr. Rajneesh SareenRegional Programme CoordinatorRegional Climate Change/Freshwater Programme, WWF-India172/B, Lodhi Estate, New Delhi - 110003Tel: 91-11-43516202Mobile: 91-9313088981Email: [email protected]: www.wwfindia.org
17. Dr. Sudhanshu SinhaSenior Project OfficerIndia Canada Environment Facility10 Sanrakshan BhawanBhikaji Kama PlaceNew Delhi - 110066Tel: 91-11-2619 0318, 2619 0306Fax: 91-11-26189631Email:[email protected]
18. Ms. Seeta Giri Team LeaderSustainable Environment New Delhi - 110003 Energy DivisionUnited Nations Development Programme55, Lodhi EstateNew Delhi - 110003Tel: 91-11-46532388Fax: 91-11-24627984Web: www.undp.org.in
19. Dr. Ashish ChaturvediTechnical ManagerGTZA 33, Gulmohar ParkNew Delhi - 110049Tel: 91-11-2652 8840, 26611021Fax: 91- 11-26537673Email: [email protected]
20. Dr. P.S.SodhiUNDP-GEFCentre of Environment and EducationNew DelhiEmail: [email protected]
21. Mr. S.ParthasarathyFormerly Asst. Director GeneralICRISATEmail: [email protected]
22. Ms. Sushma YadavProfessor, IIPANew Delhi
23. Mr. Avenash DattaCountry HeadProgrammesHelpAge IndiaNew Delhi - 110016Email: [email protected]: www.helpageindia.org
24. Ms. Neelima JerathAdditional DirectorEnvironmentPunjab State Council for Science and Technology (PSCST), Chandigarh
25. Dr. Suprava PatnaikIIFM, Bhopal
26. Dr. D. K. ManavalanExecutive DirectorAction For Food Production25/1-A Pankha Road,D-Block, Janakpuri, New Delhi-110058Tel: 91-11-28525452, 28522575, 28525412Fax:91-11-28520343Email: [email protected]@afpro.org
27. Dr. Yashpal SinghDirector Directorate of EnvironmentGovt. of Uttar PradeshVineet Khand – I, Gomti NagarLucknow - 226010Tel: 91-522-2300 541Fax: 91-522-2300543
28. Mr. S.N. RaoMember SecretaryBihar State Pollution Control BoardBeltron Bhawan, 2nd Floor Lal Bahadur Shastri NagarPatna - 800023Tel: 91-612-2281250, 2282265Fax: 91-612-2281050
29. Shri R.K.SinhaMember SecretaryJharkhand State Pollution Control BoardT.A. Division BuildingHEC Complex, P.O. DhurwaRanchi - 834004Tel: 91-651-2400851Fax: 91-651-2400850
30. Shri M.R.G.ReddyMember SecretaryPollution Control CommitteeDadra and Nagar HaveliCircut House, Sillvasa - 396220Tel: 91-260-2230978, 2230524
31. Dr. U.R. SinghDirector (Res. New Delhi - 110003 Trg.)Environmental Planning and Coordination OrganisationParyavaran Parisar, E-5 SectorArera ColonyBhopal - 462016Tel: 91-755-2466970, 2464318
32. Mr. George C. VarughesePresidentDevelopment AlternativesB-32, TARA Crescent, Qutab Institutional Area New Delhi - 110016Tel: 91-11-26134103, 26890380Fax: 91-11-26130817Email: [email protected]
33. Dr. K. Vijaya LakshmiVice PresidentDevelopment AlternativesB-32, TARA Crescent, Qutab Institutional Area New Delhi - 110016Tel: 91-11-26130899(O), Mob: 9871439649Email: [email protected]
34. Mr. Anand KumarProgramme Manager Development AlternativesB-32, TARA Crescent, Qutab Institutional Area New Delhi - 110016Tel: 91-11-26890380(O), Mob: 9818262390Email: [email protected]
35. Mr. Avanindra KumarAssociate Programme Manager Development AlternativesB-32, TARA Crescent, Qutab Institutional Area New Delhi - 110016Tel: 91-11-26890380(O), 91-11-55424613(R)Mob: 9868394074Email: [email protected]
36. Ms. Ridhima SudEnvironment ScientistDevelopment AlternativesB-32, TARA Crescent, Qutab Institutional Area New Delhi - 110016Tel: 91-11-26890380(O), 91-11-55424613(R)Mob: 9868394074Email: [email protected]
37. Prof. R.S. TripathiINSA, Senior ScientistNational Botanical Research Institute

Consultation Workshop Participants177
State Of Environment Report-2009 176
Consultation Workshop on ‘Draft State of Environment Report of India’
th19 December 2008
Qutab Hotel, New Delhi
1. Mr. R. H. KhwajaAdditional SecretaryMinistry of Environment and ForestsCGO Complex, Lodhi Road, New Delhi - 110003Email: [email protected]
2. Dr. S. P. SharmaStatistical AdvisorEI DivisionMinistry of Environment and ForestsCGO Complex, Lodhi Road, New Delhi - 110003Email: [email protected]
3. Mr. A. K. GoyalMinistry of Environment and ForestsCGO Complex, Lodhi Road, New Delhi - 110003
4. Mr. R. S. AhlawatEconomic AdvisorMinistry of Environment and ForestsCGO Complex, Lodhi Road, New Delhi - 110003Tel: 91-11- 24362663Email: [email protected]
5. Mr. Sudhir KumarJharkhand State Pollution Control Board, H.E.C., Dhurwa, Ranchi -834004Tel. : 91-651-2400894/851/852/902/979/138. Fax : 91-651-2400850
6. Mr. Anand KumarEnvironmental Engineer Urban Pollution Control Division (Personnel)Parivesh Bhawan, CBD-cum-Office Complex East Arjun Nagar, Delhi - 110032Email: [email protected]
7. Mr. S. N. DasChief Soil Survey OfficerAll India Soil and Land Use Survey (HQ)IARI Buildings, New Delhi-110012Tel: 91-11-25841263, 25849486Fax: 91-11-25843811Email: soil&[email protected]
8. Ms. Suprava PatnaikAssociate ProfessorIndian Institute of Forest ManagementNehru Nagar, Bhopal - 462003Email: [email protected]
9. Dr. S. A. HussainWildlife Institute of IndiaENVIS CentreChandrabani, Post Box 18,Dehra Dun - 248001Email: [email protected]
10. Mr. Prakash RaoSenior Coordinator, Climate Change & Energy ProgrammeWWF India,172 B,Lodhi Estate ,New Delhi 110003Tel: 91-11-41504794 Fax: 91-11-41504795, 24691226Mob: 9868602928Email: [email protected]
11. Mr. T. S. PanwarDirector, Energy Environment Policy DivisionThe Energy Research Institute, Darbari Seth Block, IHC Complex, Lodhi Road,New Delhi - 110003 Tel: 91-11-2468 2100, 41504900Fax: 91-11-2468 2144, 2468 2145Email: [email protected]
12. Mr. Suneel PandeyFellow & Area ConvenorThe Energy Research Institute, Darbari Seth Block, IHC Complex, Lodhi Road, New Delhi - 110 003 Tel: 91-11-2468 2100, 41504900Fax: 91-11-2468 2144, 2468 2145Email: [email protected]
13. Ms. Priya GhoseScientific Affairs AssistantEmbassy of the United States of AmericaShantipath, ChannakyapuriNew Delhi-110021Tel: 91-11-24198715, 24198000Fax: 91-11-24190018Email: [email protected]
14. Mr. S.C. JainProgramme CoordinatorAction for Food Production (AFPRO)25/1A Institutional AreaPankha Road, D-Block, JanakpuriNew Delhi-110058Tel: 91-11-28525412, 28525452Fax: 91-11-28520343Email: [email protected]
LIST OF PARTICIPANTS

Consultation Workshop Participants179
State Of Environment Report-2009 178
15. Ms. Shipla ChohanAdvocateEnviro Legal Defence Firm278, Sector 15A, NoidaPh.: 91-120-2517248,Telefax: 91-120-2517469Email: [email protected]
16. Mr. Faiz AshrafiGreen Indian States TrustPallavanjali, Uppal's South End,S-Block, Sector 48-49,Behind Omax Plaza, Sohna Road,Gurgaon 122001Tel: 91-124-4047626Email: [email protected]
17. Dr. Kamal Kishor G.Punjab State Council for Science andTechnology (PSCST), MGSIPA Complex, Adjacent Sacred Heart School, Sector-26, ChandigarhTel: 91-172-2795001, 2792325, 2792787, 2793198 Fax: 91-172-2793143Email: [email protected]
18. Mr. Paritosh TyagiEmail: [email protected]
19. Mr. Lalit KumarGreen Indian States TrustPallavanjali,Uppal's South End,S-Block, Sector 48-49,Behind Omax Plaza, Sohna Road,Gurgaon 122001Tel: 91-124-4047626Email: [email protected]
20. Mr. C. Udaya ShankarAdvisor (NRM)Center for World Solidarity12-13-438, Street No.1, Tarnaka, Secunderabad - 500 017Tel: 91-40-27018257, 27007906, 27014300Fax: 91-40-27005243Email: [email protected]
21. Mr. G. R. MahajanEnvironmental officerIndian Resident Mission,Asian Development Bank4 Saint Martin Marg, Chanakyapuri,New Delhi - 110021P.O. Box: 5331Chanakyapuri H.P.O.
28 Mr. Avanindra KumarAssociate Programme ManagerDevelopment AlternativesB-32, TARA Crescent, Qutab Institutional Area New Delhi - 110016Tel: 91-11-26890380(O), 91-11-55424613(R)Mob: 9911925368Email: [email protected]
New Delhi 110021, IndiaTel: 91-11-2410 7200Fax: 91-11-2687 0955Email: [email protected]
22. Dr. (Mrs.) H. K. ParwanaSr. Advisor, Environment,Former Sr. Scientific officer, Punjab Pollution Control BoardMob: 9999971482Email: [email protected]
23. Dr. A. K. TiwariPrincipal ScientistCentre for Alternate Energy ResearchUniversity of Petroleum & Energy Studies3rd Floor PHD House, August Kranti Marg,New Delhi - 110016Tel: 91-11-41730151/52/53Fax: 91-11-41730154Mob: 9810147350Email: [email protected]
24. Ms. DeepaliPunjab State Council for Science and Technology, MGSIPA Complex, Adjacent Sacred Heart School, Sector-26, ChandigarhPhone : 91-172-2795001, 2792325, 2792787, 2793198 Fax : 91-172-2793143Email: [email protected]
25 Mr. George C. VarughesePresidentDevelopment AlternativesB-32, TARA Crescent, Qutab Institutional Area New Delhi - 110016Tel: 91-11-26134103, 26890380Fax: 91-11-26130817Email: [email protected]
26 Dr. K. Vijaya LakshmiVice PresidentDevelopment AlternativesB-32, TARA Crescent, Qutab Institutional Area New Delhi - 110016Tel: 91-11-26130899(O)Mob: 9871439649Email: [email protected]
27 Mr. Anand KumarProgramme Manager Development AlternativesB-32, TARA Crescent, Qutab Institutional Area New Delhi - 110016Tel: 91-11-26890380(O)Mob: 9818262390Email: [email protected]
29 Ms. Neelam RanaEnvironment ScientistDevelopment AlternativesB-32, TARA Crescent, Qutab Institutional Area New Delhi - 110016Tel: 91-11-26890380(O), 91-11-55424613(R)Mob: 9818682957Email: [email protected]

ReportState of Environment
Ministry of Environment & ForestsParyavaran Bhavan
CGO Complex, Lodhi RoadNew Delhi - 110 003, India
Tel. : +91-11-2436 1669, 2436 0783Email : [email protected]
Website : http://www.moef.gov.in, http://envfor.nic.in
India20092009
lR;eso t;rs