society report - lloyd's of london · lloyd’s 68 annual report 2011 society report society...
TRANSCRIPT

Lloyd’s
68
Annual Report 2011
Society Report
Society report
Contents Introduction 69
Financial highlights 70
Corporate governance 71
Internal control statement 80
Report of the Remuneration Committee 81
Report of the Audit Committee 89
Report of the Lloyd’s Members’ Ombudsman 91
Financial review 92
Statement of the Council of Lloyd’s responsibilities in relation to the financial statements 97
Independent auditor’s report to the members of the Society of Lloyd’s 98
Group income statement 99
Group statement of comprehensive income 100
Group statement of financial position 101
Group statement of changes in equity 102
Group statement of cash flows 103
Notes to the financial statements 104
Five year summary 136
Lloyd’s
69W
elcome to Lloyd’s
Society reportM
arket resultsM
arket performance
Strategic overview
Annual Report 2011
Introduction
This reportThis Report sets out the principal activities, 2011 consolidated financial statements and governance arrangements of the Society of Lloyd’s.
In order to obtain an overview of the Society’s operations, however, this Report should be read in conjunction with the rest of the Annual Report that looks at the Lloyd’s market as a whole.
The Lloyd’s market comprises members underwriting through syndicates and members’ and managing agents each supported by the Society of Lloyd’s. The interests of the Society and the market are inter-related and therefore the sections above may refer to both.
The Society’s 2011 consolidated financial statements are included in this Report together with a financial review. The financial results of the members of Lloyd’s are not part of those financial statements but can be found within the market results section starting on page 52.
The SocietyBy Lloyd’s Act 1871, the then existing association of underwriters was incorporated as the Society and Corporation of Lloyd’s (the ‘Society’).
Its activities are governed by statute and, since 1982, have been managed by the Council of Lloyd’s pursuant to Lloyd’s Act 1982.
The Society is not an insurance company, although the group does include insurance company subsidiary undertakings.
Its principal activities are:
> To facilitate the carrying on of insurance business by members of Lloyd’s, who join together as syndicates to insure and reinsure risks, and the protection of their interests in this context.
> To maintain the Lloyd’s Central Fund where assets are held and administered at the discretion of the Council of Lloyd’s, primarily as funds available for the protection of policyholders.
About Lloyd’s page 05Market structure page 07Key performance indicators page 20Business environment page 22 Risk management page 25 Three-Year Plan page 28People strategy page 30
Lloyd’s
70
Annual Report 2011
Society Report
Financial highlights
2011£m
2010£m
2009£m
2008£m
2007£m
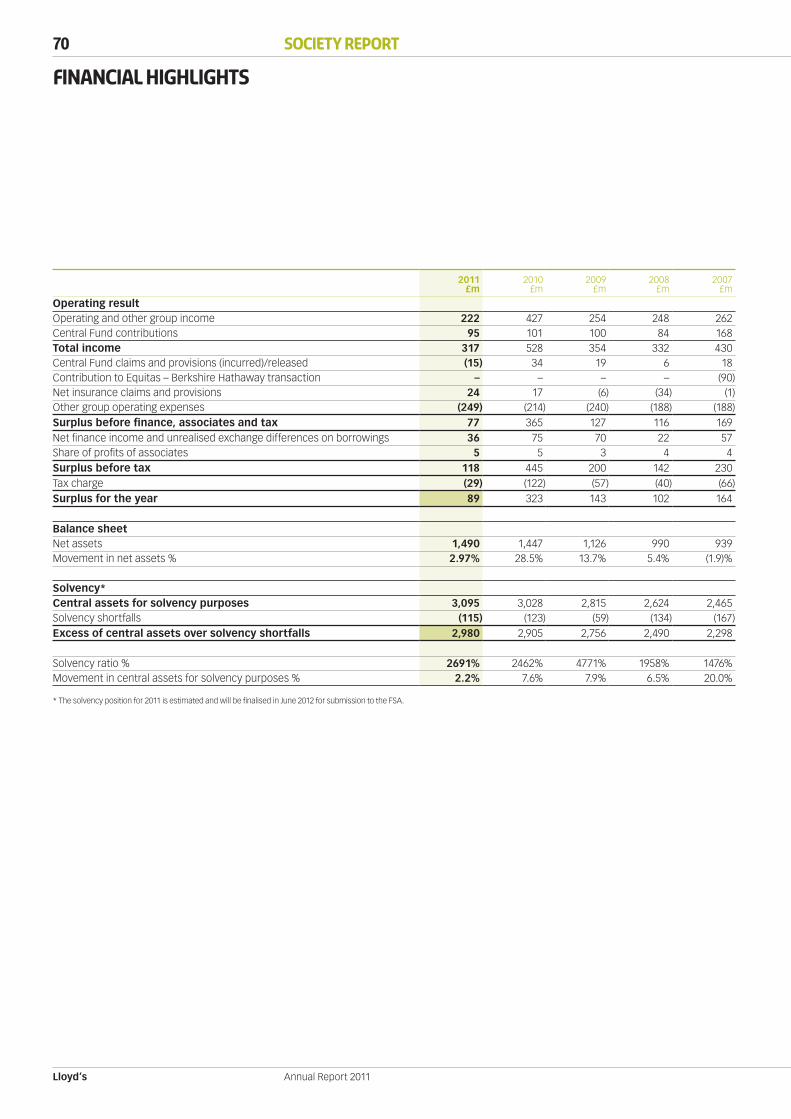
Operating resultOperating and other group income 222 427 254 248 262Central Fund contributions 95 101 100 84 168Total income 317 528 354 332 430Central Fund claims and provisions (incurred)/released (15) 34 19 6 18Contribution to Equitas – Berkshire Hathaway transaction – – – – (90)Net insurance claims and provisions 24 17 (6) (34) (1)Other group operating expenses (249) (214) (240) (188) (188)Surplus before finance, associates and tax 77 365 127 116 169Net finance income and unrealised exchange differences on borrowings 36 75 70 22 57Share of profits of associates 5 5 3 4 4Surplus before tax 118 445 200 142 230Tax charge (29) (122) (57) (40) (66)Surplus for the year 89 323 143 102 164
Balance sheetNet assets 1,490 1,447 1,126 990 939Movement in net assets % 2.97% 28.5% 13.7% 5.4% (1.9)%
Solvency*Central assets for solvency purposes 3,095 3,028 2,815 2,624 2,465Solvency shortfalls (115) (123) (59) (134) (167)Excess of central assets over solvency shortfalls 2,980 2,905 2,756 2,490 2,298
Solvency ratio % 2691% 2462% 4771% 1958% 1476%Movement in central assets for solvency purposes % 2.2% 7.6% 7.9% 6.5% 20.0%
* The solvency position for 2011 is estimated and will be finalised in June 2012 for submission to the FSA.
Lloyd’s
71W
elcome to Lloyd’s
Society reportM
arket resultsM
arket performance
Strategic overview
Annual Report 2011
Corporate governance
The Council of Lloyd’s is committed to the principle of good corporate governance and supports the application of the principles of the UK Corporate Governance Code, as far as they can be applied to the governance of a Society of members and a market of separate competing entities.
Governing body: The Council of Lloyd’sUnder Lloyd’s Act 1982, the Council of Lloyd’s has the management and superintendence of the affairs of the Society and the power to regulate and direct the business of insurance at Lloyd’s. Certain functions are reserved to the Council including:
> The making, amendment or revocation of byelaws (which are available at www.lloyds.com/byelaws). > The setting of Central Fund contribution rates. > Appointing the Chairman and Deputy Chairmen of Council.
Beyond the reserved functions, the Council can delegate its powers or functions to any person, committee or employee of the Society.
In line with the recommendations of the 2002 Chairman’s Strategy Group, the Council has delegated authority for the day-to-day management of the market to the Franchise Board (established in 2003). The Franchise Board is able, in turn, to sub-delegate authority to the CEO and through him to the Lloyd’s Executive. In addition, the Council has delegated authority to carry out specified functions to committees including the Audit, Remuneration, and Nominations Committees, as summarised below.
The relationship between the Council and the Franchise Board is defined in the Council’s Governance Policies implemented in 2006 to clarify the role of the Council and to establish a more structured relationship with the Franchise Board. Further details on the role and functions of the Franchise Board and the Governance Policies are set out below.
Membership The Council comprises a maximum of 18 members, split between six working, six external and six nominated members. The biographical details of the current members of the Council (as at 27 March 2012) are listed on page 13.
Nominated members are usually appointed for three-year terms which can be renewed. They may be regarded, for the purposes of the Code, as independent members of the Council with the exception of the Chairman and CEO who are included within their number.
Working and external members are generally elected for terms of three years by the working and external members of the Society respectively. In the elections for working members, voting operates on a one member, one vote basis. In the elections for external members, the voting entitlement of an external member of the Society is based on the member’s allocated underwriting capacity as determined under the Constitutional Arrangements Byelaw (No.2 of 2010).
The presence of working and external members of the Council enables the nominated members to gain an understanding of the views of key stakeholders in the Lloyd’s market.
Other than the CEO, no member of Council may serve more than nine years in aggregate on the Council.
Chairman and Deputy ChairmenIn accordance with Lloyd’s Act 1982, the Chairman and Deputy Chairmen of Lloyd’s are elected annually by special resolution of the Council from amongst its members. One of the Chairman and Deputy Chairmen must be a working member of the Council. This position is currently filled by Graham White.
The Chairman of Lloyd’s is contracted to work three days a week but commits as much time as is necessary to undertake the role. The Council acknowledges that the Chairman has other commitments outside Lloyd’s (see page 13) and is satisfied that these can be accommodated with the Chairmanship of Lloyd’s.
Andreas Prindl (a nominated member) was appointed Senior Independent Deputy Chairman by Council in February 2012 (Lloyd’s equivalent of the Senior Independent Director).
MeetingsThe Council met six times in 2011. These meetings are structured to allow open discussion. At each meeting the Council receives certain regular reports – for example, a written report from the CEO and oral updates from its principal committees. It also reviews the quarterly Management Information Pack.
A table showing Council members’ attendance at Council and committee meetings which they were eligible to attend is set out on page 78.
The detailed arrangements for Lloyd’s governance processes are set out in the Council’s Governance Policies and the Constitutional Requirements as set out in the Constitutional Arrangements Byelaw.
Lloyd’s
72 Society Report
Annual Report 2011
Corporate governanceContinued
Governance Policies and the Constitutional RequirementsThe Governance PoliciesAmongst other matters, the Governance Policies are intended to improve the clarity around the role of the Council and to establish a more structured relationship with the Franchise Board.
The Governance Policies establish the purpose for Lloyd’s: ‘To maintain, in accordance with Lloyd’s Acts, an organisation that will enable the long-term return from carrying out the business of insurance to be maximised for capital providers’ (ie members).
Under the Governance Policies, the Council is responsible for assessing the long-term strategic development of Lloyd’s by reference to both the interests of capital providers and other stakeholders and through an evaluation of economic, political and social issues impacting the international insurance and reinsurance markets.
As the Council has delegated authority for the majority of its functions (other than its reserved matters) to the Franchise Board, the Governance Policies also define the accountability linkage between the Franchise Board and the Council. This includes determining the boundaries within which the Franchise Board will operate (the Franchise Board Limitations) and establishing a Monitoring and Assurance regime which, among other matters, requires the Chairman of the Franchise Board to report to the Council on all material issues impacting the world insurance market and Lloyd’s as well as providing a summary of key performance indicators.
The Constitutional RequirementsThe Constitutional Requirements align, so far as appropriate, Lloyd’s governance arrangements with the Companies Act 2006. They include provisions concerning the duties and responsibilities of Council members. These same duties also apply to members of the Franchise Board and the other Lloyd’s committees.
In summary, members of the Council, Franchise Board and their committees are required to act in a way which ‘would be most likely to promote the success of the Society for the benefit of the members as a whole’ and must have regard to:
> The likely consequences of any decision in the long term. > The need of the Society:
– To foster business relations with those who do business at Lloyd’s. – To have regard to the interests of its employees. – To consider the impact of its operations on the community and the environment; and – To maintain a reputation for high standards of business conduct.
The Constitutional Requirements also deal with conflicts of interest and collective responsibility.
Lloyd’s
73W
elcome to Lloyd’s
Society reportM
arket resultsM
arket performance
Strategic overview
Annual Report 2011
Franchise BoardThe Council established the Franchise Board as from 1 January 2003 and set it a goal: ‘To create and maintain a commercial environment at Lloyd’s in which the long-term return to all capital providers is maximised’.
Specific functions delegated to the Franchise Board include:
> Determining the major risks to the Lloyd’s market and determining appropriate action to address or mitigate those risks. > Determining the key factors, levers and drivers which may affect the profitability of the Lloyd’s market. > Developing and implementing a strategy to achieve the Franchise Goal. > Supervising, regulating and directing the business of insurance at Lloyd’s.
The Franchise Board has reserved to itself a list of specific functions and powers that only it may deal with. The Franchise Board may sub-delegate authority to the CEO, directors and employees of the Corporation save in respect of those functions and powers reserved to it, the Council and their committees. The Franchise Board’s committees, the CEO, directors and employees must act in accordance with the Franchise Board Limitations (including the Franchise Principles) and in accordance with the strategy, policy and principles set by the Franchise Board.
Matters reserved to the Franchise Board include:
> Setting the policy and principles relating to the supervision, regulation and direction of the business of insurance at Lloyd’s (the Market Supervision Framework), in compliance with FSA requirements.
> Considering and approving Lloyd’s risk appetite (both at Corporation and market level). > Setting policy for the admission and removal of participants in the Lloyd’s market. > Admitting and removing managing agents. > Determining the Franchise Standards for managing agents and approving the Three-Year and Annual Plan and Budget of the Corporation.
Membership and meetingsBiographical details of the members of the Franchise Board as at 27 March 2012 are listed on page 15. In 2011, the Franchise Board comprised:
> The Chairman of Lloyd’s (who was also its Chairman). > The CEO, the Director, Performance Management, and the Director, Finance, Risk Management and Operations. > Three non-executives connected with the Lloyd’s market. > Four independent non-executives.
The presence of market-connected non-executive directors enables the independent non-executives to gain an understanding of market practitioner views and perspectives.
The Franchise Board held ten scheduled meetings in 2011. It also held a half day offsite focusing on the next iteration of the Three-Year Plan. These meetings were structured to allow open discussion. At each scheduled meeting the Franchise Board receives certain regular reports – for example, a written report from the CEO. It also reviews the quarterly Management Information Pack. The Franchise Board papers and minutes are made available to members of Council.
A table showing Franchise Board members’ attendance at Franchise Board and committee meetings which they were eligible to attend is set out on page 78.

Lloyd’s
74 Society Report
Annual Report 2011
Corporate governanceContinued
The Principal Committees of the CouncilAUDIT COMMITTEEThe Audit Committee’s role is to ensure that the financial activities of Lloyd’s are subject to independent review and audit. The Audit Committee’s functions include:
> Reviewing Lloyd’s annual and interim financial statements, the aggregate syndicate results and the Lloyd’s Return to the FSA. > Reviewing both the external and internal audit plans and the compliance plan.
The CEO, Director, Finance, Risk Management and Operations, Director, North America and General Counsel, senior managers and the external and internal auditors attend meetings as appropriate.
Reports from the internal and external auditors on aspects of internal control and reports from the Legal and Compliance department on internal and international compliance are reviewed by the Audit Committee and appropriate action taken in response.
The Audit Committee submits an annual report to the Council. It also reports to the Council and the Franchise Board on its proceedings after each meeting. Additional reports are submitted to the Council and/or the Franchise Board on matters of material interest as and when necessary. The minutes of Audit Committee meetings are submitted to the Franchise Board and the Council.
The Audit Committee is chaired by Claire Ighodaro (an independent non-executive director on the Franchise Board) and its remaining members are drawn from both the Council and the Franchise Board. A table showing Audit Committee members’ attendance at Audit Committee meetings is set out on page 78.
The Audit Committee met on five occasions in 2011.
The Audit Committee’s full report is on pages 89 and 90.
NOMINATIONS COMMITTEEUntil November 2011, the Nominations, Appointments and Compensation Committee (NACC) was responsible for making recommendations to the Council on the appointment of the Chairman, CEO, new nominated Council members, Franchise Board members (including the Director, Finance, Risk Management and Operations and the Director, Performance Management), members of a number of the Council and Franchise Board committees and the Secretary to the Council. The NACC was also responsible for succession planning arrangements for these positions. These functions were assumed by the newly formed Nominations Committee in November 2011.
The NACC was chaired by Andreas Prindl, Deputy Chairman, and consisted of six other Council members and one Franchise Board non-executive director. A table showing NACC members’ attendance at NACC meetings is set out on page 78. The NACC met on four occasions in 2011.
The Nominations Committee will meet at least twice annually and otherwise at the discretion of its Chairman or as directed by Council. The Nominations Committee reports to the Council and Franchise Board on its proceedings after each meeting on all matters relating to its duties and powers. A written report is submitted to the Council annually.
Apart from the annual exercise of making recommendations with respect to the composition of Council and Franchise Board committees (together with any other necessary changes in composition during the year), the NACC made the following major recommendations to Council during 2011:
> To appoint John Nelson as Chairman of Lloyd’s. This followed an extensive search process in which the NACC was assisted by an external search consultant (Odgers Berndtson). The search was conducted based on a job description and an evaluation of the necessary skills and experience to undertake the role. Through its Chairman, the NACC consulted Lloyd’s market practitioners in determining the job description. Mr Nelson’s appointment as Chairman of the Council and Chairman of the Franchise Board is for a three-year term which commenced on 17 October 2011.
> To appoint Sir Andrew Cahn as a member of the Franchise Board for a three-year term commencing on 4 April 2011. Neither an external search consultant nor open advertising were used to identify Sir Andrew as the NACC was able to make use of its own resources and expertise.
The Nominations Committee made the following major recommendations to Council in 2011:
> To appoint Charles Franks as a market-connected director on the Franchise Board. Neither an external search consultant nor open advertising were used to identify Mr Franks as the Nominations Committee was able to make use of its knowledge of senior market practitioners in making the recommendation. Mr Franks’ three-year term commenced on 1 January 2012.
> To reappoint Sir Robert Finch as a nominated member of Council for a one-year term commencing on 1 January 2012.
Both the NACC and the Nominations Committee’s recommendations were accepted by Council.

Lloyd’s
75W
elcome to Lloyd’s
Society reportM
arket resultsM
arket performance
Strategic overview
Annual Report 2011
The Principal Committees of the Council CONTINUEDTo assist with succession planning, the Nominations Committee also considered the future skills, knowledge and experience likely to be needed by the Franchise Board and within the non-elected positions on the Council, given wider trends in the financial services sector. The Nominations Committee, like the NACC before it, is fully apprised of, and supportive of, the need for recent and relevant experience and diversity and will seek to increase the overall diversity (including gender) of the Franchise Board and the non-elected positions on the Council as vacancies arise.
The Nominations Committee is chaired by the Chairman of Lloyd’s and its remaining members are drawn from both the Council and the Franchise Board.
A table showing Nominations Committee members’ attendance at Nominations Committee meetings is set out on page 78.
The Nominations Committee met on one occasion in 2011.
REMUNERATION COMMITTEEUntil November 2011, the NACC was responsible for reviewing and making recommendations to Council on the remuneration arrangements for the Chairman, CEO, executive directors and the members of the Council and Franchise Board and their principal committees. It also reviewed the remuneration of the Secretary to the Council. As from November 2011, the newly formed Remuneration Committee assumed responsibility for setting remuneration for these individuals (other than the non-executive members of the Council, the Franchise Board and their committees). The Council considers the Remuneration Committee’s proposals.
Non-executive remuneration is decided by the Council, on recommendation from the Chairman and CEO who may consult the Remuneration Committee as part of that process.
The Remuneration Committee will meet at least twice a year and otherwise at the discretion of its Chairman or as directed by the Council. The Remuneration Committee reports to the Council and Franchise Board on its proceedings after each meeting on all matters relating to its duties and powers and makes recommendations to the Council or Franchise Board on any area within its remit where action or improvement is needed. The Remuneration Committee submits a written report to the Council annually.
The Remuneration Committee is chaired by the Senior Independent Deputy Chairman. The Chairman is a member of the committee and its remaining members are drawn from both the Council and the Franchise Board. A table showing Remuneration Committee members’ attendance at Remuneration Committee meetings is set out on page 78.
The Remuneration Committee met on one occasion in 2011.
The Remuneration Committee’s full report is on pages 81 to 88.
Lloyd’s
76 Society Report
Annual Report 2011
Corporate governanceContinued
The Principal Committees of the Franchise BoardMARKET SUPERVISION AND REVIEW COMMITTEE (MSARC)MSARC takes decisions regarding the exercise of Lloyd’s enforcement powers. It also acts as a review body capable, where appropriate, of amending, modifying or withdrawing certain decisions taken by the Executive affecting managing agents. It also acts as the body that determines whether certain decisions can be referred to the Lloyd’s Appeal Tribunal and can also make certain business decisions.
MSARC meets at the discretion of its Chairman. MSARC submits a written report to the Franchise Board annually and may submit additional reports to inform the Franchise Board of any matters of material concern as and when required.
A table showing MSARC members’ attendance at MSARC meetings is set out on page 78. MSARC met on six occasions in 2011.
CAPACITY TRANSFER PANELThe Capacity Transfer Panel (CTP) was established principally to exercise the Council’s powers in relation to minority buyouts and mergers. The Panel meets at the discretion of its Chairman. The Panel submits a written report to the Franchise Board annually and may submit additional reports on matters of material concern as and when necessary.
A table showing CTP members’ attendance at CTP meetings is set out on page 78. The Panel met on four occasions in 2011.
INVESTMENT COMMITTEEThe Investment Committee sets the investment objectives and parameters of centrally-managed assets and is responsible for monitoring the performance of these funds. In addition, it monitors the investment operations of the Treasury department in respect of all funds under its management and approves all investment counterparties. It may also make more general recommendations concerning investment activity at Lloyd’s.
The Investment Committee meets at the discretion of its Chairman. The Investment Committee submits a written report to the Franchise Board annually and may submit additional reports on matters of material concern as and when necessary. The Investment Committee is required to obtain the approval of the Franchise Board before making any decisions which may materially affect the financial risks applying to the Society or Lloyd’s market entities. A table showing Investment Committee members’ attendance at Investment Committee meetings is set out on page 78. The Investment Committee met on five occasions in 2011.
Terms of reference and appointment termsThe terms of reference for the Council, Franchise Board and their committees (including the Audit, Remuneration and Nominations Committees) can be found on Lloyd’s website. The terms of reference for the Chairman, Deputy Chairmen (including Senior Independent Deputy Chairman), CEO and executive directors can also be found on Lloyd’s website.
The terms and conditions of appointment of non-executive directors and non-executive members of Council are available on request from the Secretary to the Council.
Annual General MeetingThe Council reports to the members at the Annual General Meeting. A summary business presentation is given at the AGM, by the CEO and Director, Finance, Risk Management and Operations, before the Chairman deals with the business of the meeting.
Voting entitlement at general meetings is generally capacity-based for both external and working members, except at general meetings called on the requisition of members under section 6(4) of the Lloyd’s Act 1982 for the purpose of revoking or annulling byelaws, at which each member has one vote. The resolutions to be considered at general meetings are published on the Lloyd’s website.
IndemnitiesThe Society has given indemnities to certain of its subsidiary undertakings, and the directors thereof, in respect of any claims or actions which may be brought against them or any future operating losses incurred by them in connection with the companies’ activities. The Society has also given indemnities to and has agreed to cover certain specific costs that may be incurred by members of the Council, the Franchise Board, Lloyd’s Regulatory Board and Lloyd’s Market Board (the latter two boards ceased during 2002) and of their respective sub-committees, the Society staff and also certain individuals and organisations who have been asked to carry out or provide services to the Society or on behalf of, or for the benefit of, its members.
Lloyd’s
77W
elcome to Lloyd’s
Society reportM
arket resultsM
arket performance
Strategic overview
Annual Report 2011
Council, Franchise Board and committee assessmentsAn evaluation of the performance of the Council and its principal committees in 2011 (defined for this purpose as the Franchise Board, the Audit Committee and the NACC) was undertaken. The evaluation also covered the performance of the members of the Council and principal committees. It was conducted by the Secretary to the Council who issued questionnaires to individual Council and committee members seeking their views on 2011 performance.
The assessment covered the performance of the Chairmen of the Audit Committee and the NACC and committee members’ comments were discussed privately with them. As the assessment was conducted in the fourth quarter of 2011, it did not cover Mr Nelson’s performance as Chairman of the Council and the Franchise Board as he was only appointed in October 2011.
The principal conclusion of the assessment was that the current governance arrangements were working effectively and in accordance with the Governance Policies and that the Council and its principal committees were operating in accordance with their terms of reference.
Among the other major findings of the review was the need for:
> More senior underwriting and broking experience on Council. > Effort to be continued to improve the clarity and focus of Council and Franchise Board papers. > More visibility around the work of the Franchise Board’s committees.
These and other suggestions for improvement will be taken forward by the Council and the relevant committees.
As a result of a recommendation in the 2010 performance assessment, the Council agreed in March 2011 to undertake a review of the effectiveness and appropriateness of Lloyd’s delegation arrangements. Each member of the Council and the Franchise Board was interviewed and the review concluded that the current division of responsibilities between the Council and the Franchise Board worked well and was effective. The principal recommendations for improvement were:
> To increase the interaction between the independent members of both bodies. > To highlight better the key issues/areas of concern when presenting management information to the Council and Franchise Board. > To amend the terms of reference for the Council, Franchise Board, their committees and the Executive to reflect technical changes to
the way authority is delegated and to ensure that responsibility for risk considerations was effectively embedded across the organisation.
Steps have been taken to address each of these recommendations.
Individual assessmentFor 2012 and future years, the Chairman will meet each member of Council and each non-executive Franchise Board director to appraise their performance. The Senior Independent Deputy Chairman will lead the appraisal of the Chairman which will also be undertaken once a year.
Training and inductionAll new appointments to the Council, Franchise Board and Lloyd’s committees receive an induction pack containing guidance notes on Lloyd’s governance arrangements.
In addition, new members of the Council and Franchise Board without extensive knowledge of Lloyd’s are offered briefing sessions with senior executive management and others. Members of the Council and Franchise Board with pre-existing knowledge and involvement at Lloyd’s are given the opportunity to receive briefings on subjects of particular interest to them.
In addition, in 2011 four briefing sessions on a range of Lloyd’s related topics were made available to all members of the Council and the Franchise Board.
Independent professional adviceMembers of the Council and Franchise Board have access to independent professional advice, if required.
Conflicts of interestA register of interests is maintained by the Secretary to the Council for members of Council, Franchise Board and their committees and is available for inspection by members.
Corporate governance of the Lloyd’s marketThe corporate governance of each entity within the Lloyd’s market is the responsibility of that entity. The Council provides, through the Corporation, a framework for the governance of these businesses including the assessment of capital adequacy and market supervision (including inspections, visits and audits of market entities). Managing agents’ governance arrangements are also reviewed on registration and as part of risk management assessments.
Lloyd’s
78 Society Report
Annual Report 2011
Corporate governanceContinued
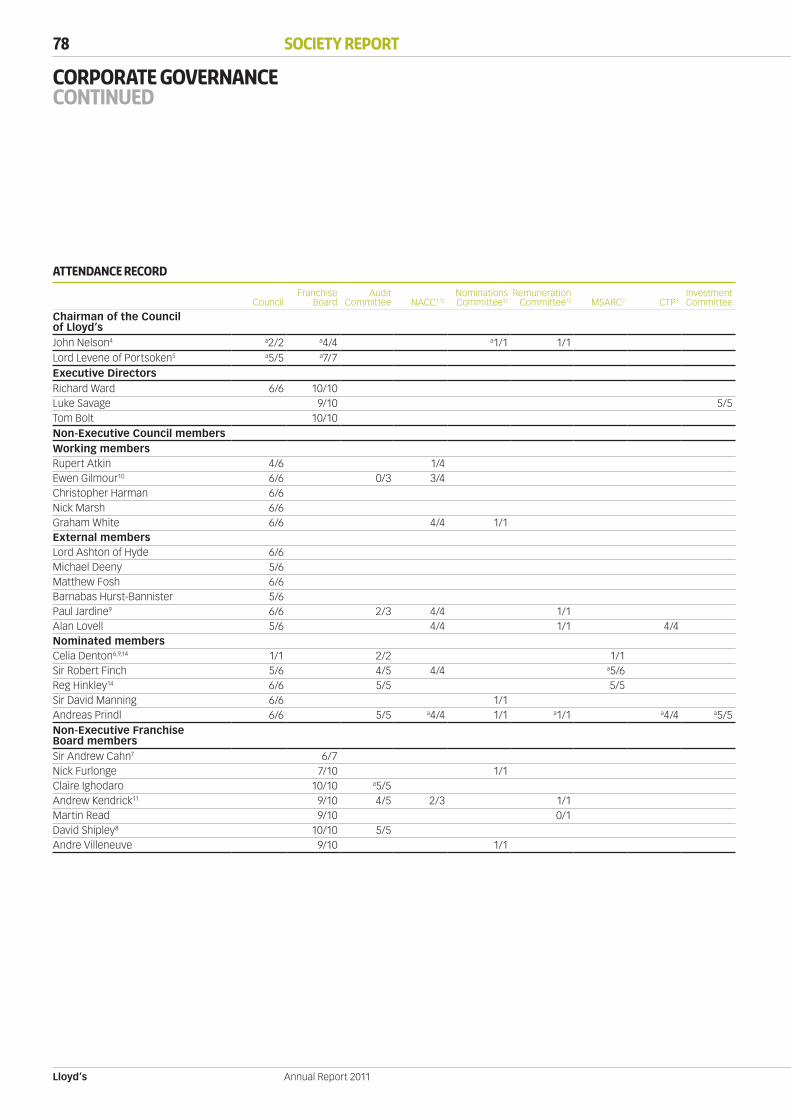
Attendance record
CouncilFranchise
BoardAudit
Committee NACC1,12Nominations Committee12
Remuneration Committee12 MSARC2 CTP3
InvestmentCommittee
Chairman of the Council of Lloyd’sJohn Nelson4 a2/2 a4/4 a1/1 1/1Lord Levene of Portsoken5 a5/5 a7/7Executive DirectorsRichard Ward 6/6 10/10Luke Savage 9/10 5/5Tom Bolt 10/10Non-Executive Council membersWorking membersRupert Atkin 4/6 1/4Ewen Gilmour10 6/6 0/3 3/4Christopher Harman 6/6Nick Marsh 6/6Graham White 6/6 4/4 1/1External membersLord Ashton of Hyde 6/6Michael Deeny 5/6Matthew Fosh 6/6Barnabas Hurst-Bannister 5/6Paul Jardine9 6/6 2/3 4/4 1/1Alan Lovell 5/6 4/4 1/1 4/4Nominated membersCelia Denton6,9,14 1/1 2/2 1/1Sir Robert Finch 5/6 4/5 4/4 a5/6Reg Hinkley14 6/6 5/5 5/5Sir David Manning 6/6 1/1Andreas Prindl 6/6 5/5 a4/4 1/1 a1/1 a4/4 a5/5Non-Executive Franchise Board membersSir Andrew Cahn7 6/7Nick Furlonge 7/10 1/1Claire Ighodaro 10/10 a5/5Andrew Kendrick11 9/10 4/5 2/3 1/1Martin Read 9/10 0/1David Shipley8 10/10 5/5Andre Villeneuve 9/10 1/1
Lloyd’s
79W
elcome to Lloyd’s
Society reportM
arket resultsM
arket performance
Strategic overview
Annual Report 2011
CouncilFranchise
BoardAudit
Committee NACC1,12Nominations Committee12
Remuneration Committee12 MSARC2 CTP3
InvestmentCommittee
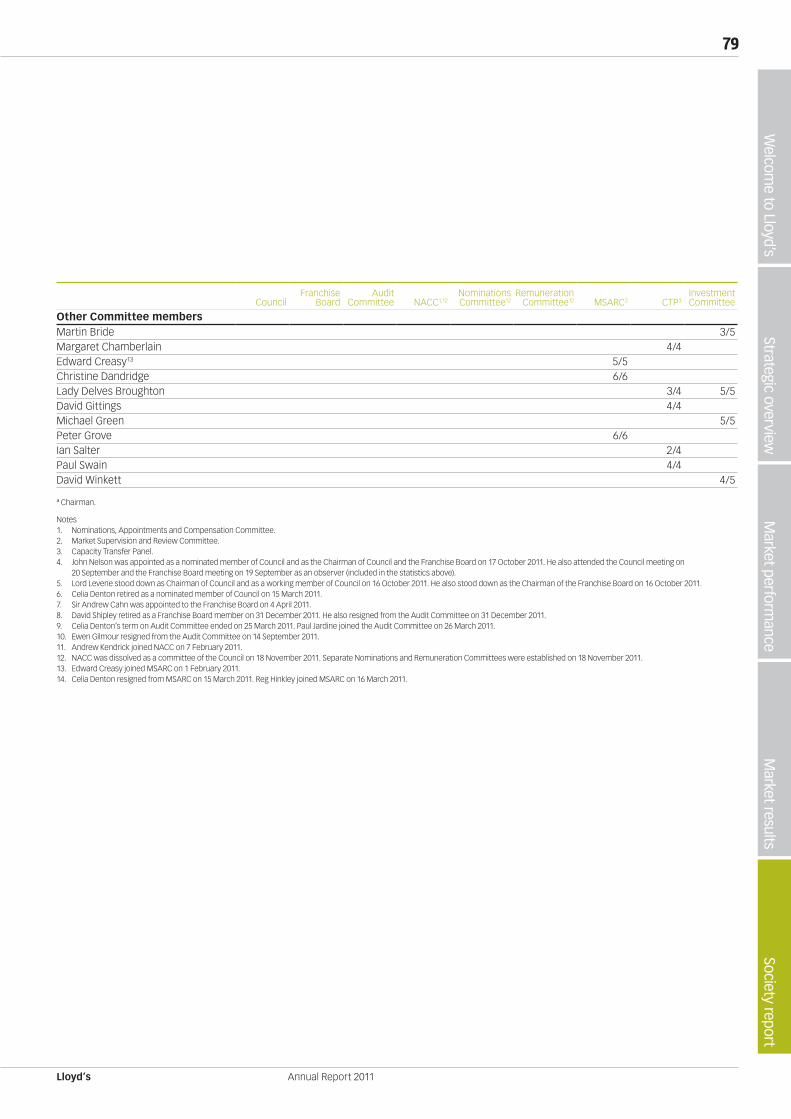
Other Committee membersMartin Bride 3/5Margaret Chamberlain 4/4Edward Creasy13 5/5Christine Dandridge 6/6Lady Delves Broughton 3/4 5/5David Gittings 4/4Michael Green 5/5Peter Grove 6/6Ian Salter 2/4Paul Swain 4/4David Winkett 4/5
ª Chairman.
Notes1. Nominations, Appointments and Compensation Committee. 2. Market Supervision and Review Committee.3. Capacity Transfer Panel.4. John Nelson was appointed as a nominated member of Council and as the Chairman of Council and the Franchise Board on 17 October 2011. He also attended the Council meeting on
20 September and the Franchise Board meeting on 19 September as an observer (included in the statistics above).5. Lord Levene stood down as Chairman of Council and as a working member of Council on 16 October 2011. He also stood down as the Chairman of the Franchise Board on 16 October 2011. 6. Celia Denton retired as a nominated member of Council on 15 March 2011. 7. Sir Andrew Cahn was appointed to the Franchise Board on 4 April 2011.8. David Shipley retired as a Franchise Board member on 31 December 2011. He also resigned from the Audit Committee on 31 December 2011.9. Celia Denton’s term on Audit Committee ended on 25 March 2011. Paul Jardine joined the Audit Committee on 26 March 2011.10. Ewen Gilmour resigned from the Audit Committee on 14 September 2011.11. Andrew Kendrick joined NACC on 7 February 2011.12. NACC was dissolved as a committee of the Council on 18 November 2011. Separate Nominations and Remuneration Committees were established on 18 November 2011.13. Edward Creasy joined MSARC on 1 February 2011.14. Celia Denton resigned from MSARC on 15 March 2011. Reg Hinkley joined MSARC on 16 March 2011.
Lloyd’s
80 Society Report
Annual Report 2011
Internal controlStatement
The Franchise Board, on behalf of the Council of Lloyd’s, has responsibility for the Society’s system of internal control and for reviewing its effectiveness. The Executive Team is responsible for the implementation and maintenance of the internal control system. This incorporates an embedded, ongoing process for identifying, evaluating and managing significant business, operational, financial, compliance and other risks. The system is designed to reduce, rather than eliminate, the risk of failure to achieve business objectives and can only provide reasonable but not absolute assurance against material misstatement or loss.
The Audit Committee monitors and reviews the effectiveness of the system of internal control of the Society and biannual reports are provided to the Franchise Board. There is an ongoing process, in accordance with the guidance of the UK Corporate Governance Code on internal control, which has been established for identifying, evaluating and managing significant risks. Other procedures such as whistle-blowing whereby any member of staff may take matters that concern them to the Head of Internal Audit, the Legal and Compliance department or, where appropriate, to the Chairman of the Audit Committee or the FSA, are clearly set out. Associate companies, Ins-sure Holdings Limited and Xchanging Claims Services Limited, are not dealt with as part of the group for the purposes of applying the UK Corporate Governance Code.
The group’s key risk management processes and the system of internal control procedures include the following:
MANAGEMENT STRUCTURE ‘Lloyd’s Governance Arrangements: A Guide for Members of Lloyd’s Committees’ outlines the governance structure and committee members’ duties and responsibilities, including confidentiality and conflicts and declarations of interest.
There is a clearly defined organisation structure with terms of reference agreed for the CEO and all directors which set out, inter alia, their functions and powers, authority to act and limitations on authority. Employees have role profiles agreed by their line manager which set out equivalent information.
The Society is committed to the highest standards of business conduct. Corporate policies and procedures are available to all staff and include the Code of Conduct, Compliance Manual, Employee Handbook, Health & Safety Policy, Information Security and Computer Usage Policy, Procurement Policy, Financial Policies and authorisation limits. These policies and procedures are regularly reviewed and updated.
Lloyd’s maintains an internal audit function that reports to the CEO and the Audit Committee. The Head of Internal Audit is supported by Deloitte LLP who provide resources to complete the internal audit plan.
IDENTIFICATION AND EVALUATION OF BUSINESS RISKSThe Risk Management Framework ensures that the identification, assessment, monitoring and management of the major risks affecting the Society takes place on an ongoing basis. The Framework includes a number of risk assessment techniques, which are tailored to specific risk areas. One such technique is the comprehensive risk and control assessment procedure, which is conducted on a regular basis. This review re-assesses the existing risks and identifies any new risks. It evaluates controls in terms of adequacy of performance and also seeks to monitor the action plans in place to help manage risks. These processes are described in more detail in the Risk Management section on pages 25 to 27.
One of the key objectives of the Lloyd’s risk governance structure is to provide assurance to the Franchise Board that risks facing the Society are identified and managed in accordance with approved policy and appetite. This is achieved by the risk committees having the appropriate management information (MI) to oversee and challenge. The MI includes information from many different sources within the Risk Management and internal control frameworks, such as the various risk and control assessments, details of the operating and regulatory environment and capital management reports. The risk governance structure comprises of the Executive Risk Committee plus three specialist sub-committees; the Syndicate Risk Committee, the Financial Risk Committee and the Corporation Risk Committee. These provide clear independent challenge to the risk takers at Lloyd’s and enables tailored risk management operating models, rather than a ‘one size fits all’ platform. The Risk Management Framework enables Lloyd’s to undertake a more forward looking assessment of risk, building in capital consideration into the decision making process and a formal Risk Appetite Framework with defined escalation routes.
A framework of regular self-certification, with targeted independent challenge, is in place and where control failures have been reported, details of the circumstances are required together with appropriate corrective actions. A summary of these reports is reviewed by the Executive Team, the Corporation Risk Committee, Franchise Board and the Audit Committee on a regular basis.
Internal auditors also perform independent reviews of control activities as part of their annual programme as approved by the Audit Committee. The Head of Internal Audit and the Legal and Compliance department report to the Executive Team on a regular basis and to each Audit Committee meeting.
A compliance plan is in place to manage the risk associated with non-compliance with FSA regulatory processes. The Head of Internal Audit and the Legal and Compliance department provide progress reports to the Risk Committees and the Audit Committee. The Risk Committees also oversee the wider coordination of international regulatory compliance.
INFORMATION AND FINANCIAL REPORTING SYSTEMS An annual budget for the Society is reviewed in detail by the Executive and is considered and approved by the Franchise Board and Council. Monthly financial reports compare actual performance with the annual budget and management action is taken, where appropriate, when variances arise. Revised forecasts are prepared regularly.
Lloyd’s
81W
elcome to Lloyd’s
Society reportM
arket resultsM
arket performance
Strategic overview
Annual Report 2011
Report of the Remuneration committee
This report is based upon best practice as set out in the UK Corporate Governance Code. This code is directed at companies listed on the London Stock Exchange, whereas Lloyd’s is a market of many separate and competing trading entities; nonetheless, Council supports its principles insofar as they can be applied to the governance of the Society.
Composition of the REMUNERATION COMMITTEE AND THE NACCREMUNERATION COMMITTEEThe Remuneration Committee was established in November 2011. Previously, its functions were undertaken by the Nominations, Appointments and Compensation Committee (NACC).
The Remuneration Committee currently comprises six members – three members of Council, two members of the Franchise Board and the Chairman of Lloyd’s. It is chaired by Andreas Prindl (a Nominated member of Council and Senior Independent Deputy Chairman). The Remuneration Committee members for 2011 are shown in the remuneration table on page 86.
The Remuneration Committee met once in 2011. The attendance record is set out in the Corporate Governance report, page 78. The Committee’s terms of reference are available on the Lloyd’s website and on request from the Secretary to the Council.
NACCThe Nominations, Appointments and Compensation Committee (NACC) comprised seven members of Council – two nominated, two external and three working members – and one market-connected non-executive director on the Franchise Board. The NACC members for 2011 are indicated within the remuneration table on page 86.
The Committee met four times during the year. The attendance record is set out in the Corporate Governance report, page 78.
Remuneration and compensationEXECUTIVE REMUNERATIONWithin the policy for remuneration approved by the Council, the Remuneration Committee is responsible for setting the total individual remuneration package for the Chairman of Lloyd’s, the Chief Executive Officer, each executive director, the Secretary to the Council and other members of staff (including individual consultants) above certain thresholds.
CORPORATION REMUNERATION POLICYThe remuneration policy for all current and future employees is set out in the HR Policies & Procedures as follows: ‘Lloyd’s operates a Total Reward approach, which is designed to meet employee and Corporation needs by providing rewards that are linked to individual performance and the delivery of Lloyd’s Corporation objectives.
Lloyd’s Total Reward approach is supported by the following practices:
> We look beyond base salary to the value of the total reward package in meeting the needs of employees. > We recognise and reward superior performance.
Lloyd’s policy is therefore based on providing a package of rewards (salary plus benefits) that is business driven, competitive, fair and flexible. It is also founded on the proposition that the ultimate source of value in the business is people. Combining this creates a reward offering which:
> Emanates from business strategies and priorities. > Is based on business success (ie our ability to pay). > Provides a flexible mix of rewards, designed to attract, retain and motivate a performance driven workforce with the varied range
of experience and skills the business requires. > Is externally competitive and regularly monitored by means of benchmarking exercises. > Rewards for performance rather than cost of living. > Ensures employees understand the criteria by which rewards are determined and reviewed. > Gives managers the tools to make informed decisions regarding rewarding their teams. > Is in line with our equality and diversity policy.’
Salary increases are based primarily on external benchmarking and commerciality. Salaries are reviewed annually but there is no automatic entitlement to an increase (eg for cost of living).
Annual individual performance bonus awards are discretionary.
The policy outlined above has been applied throughout 2011. The Remuneration Committee will, however, continue to monitor its policies, particularly its arrangements for performance related pay, against evolving market practice and relevant guidelines prepared in response to the current economic climate. Many of the proposals under consideration in the wider financial services sector are aimed at curbing excessive risk-taking at financial institutions. The Corporation is focused on market oversight and promoting the attractiveness of Lloyd’s. Risk-taking is primarily undertaken at syndicate level rather than within the Corporation.

Lloyd’s
82 Society Report
Annual Report 2011
Report of the Remuneration committee continued
Remuneration and compensation continuedCEO AND EXECUTIVE DIRECTORSThe current remuneration package of the CEO and the executive directors comprises both performance and non-performance related components. The performance-related components comprise annual bonuses as well as a Lloyd’s Performance Plan award. The former is determined by reference to performance against objectives while the latter is linked to the overall performance of the Lloyd’s market. The non-performance related components comprise base salaries, benefits and pension entitlements.
The annual salaries and bonuses of the CEO and the executive directors are reviewed by the Remuneration Committee (and before that, the NACC) annually. For 2011, increases took effect from 1 February. No director plays a part in any discussion about his or her own remuneration.
The CEO and executive directors are entitled to receive certain benefits including private medical and life insurance in addition to their base salary.
In December 2011, the Remuneration Committee considered the results of an external review (undertaken by FIT Remuneration Consultants LLP) into the remuneration arrangements for the CEO and executive directors. The Remuneration Committee concluded that while overall remuneration levels – ie: fixed (non-performance related) plus variable (performance related) – were reasonable, the balance between the fixed and variable elements should be realigned by increasing the former and reducing the latter, in order to reflect better the role of the Corporation of Lloyd’s and bring remuneration arrangements more in line with other organisations with a similar role.
The Remuneration Committee also agreed that more specific and measurable targets and KPIs should be established, where possible, to help determine bonus awards. Over the last three years average bonus payments (as a percentage of the maximum bonus opportunity) have been 88% for the CEO, 96% for the Director, Finance, Risk Management and Operations and 85% for the Director, Performance Management. In future, payments are likely to be more variable because of the introduction of the more specific targets and KPIs.
As a result of the review, the maximum bonus opportunity for 2012 and subsequent years for the CEO and the executive directors has been reduced and their base salaries increased.
2012 maximumbonus opportunity
2012 base salaries% increase on 2011*
2012 base salaries£000
CEO 100% of base salary (2011: 150%) 20% 668Director, Performance Management 67% of base salary (2011: 100%) 18% 577Director, Finance, Risk Management & Operations 50% of base salary (2011: 75%) 15% 518
* Base salaries will be increased with effect from 1 January 2012.
It remains Remuneration Committee policy that a significant proportion of executive remuneration should be performance-related and determined by annual performance reviews.
THE CHAIRMANLord Levene retired as Chairman on 16 October 2011. In addition to his annual salary, Lord Levene was eligible for a bonus and was also entitled to receive private medical and life insurance. He also received a cash allowance in lieu of pension contributions.
John Nelson was appointed Chairman with effect from 17 October 2011. In addition to his salary, Mr Nelson is entitled to receive private medical insurance. Neither Mr Nelson nor Lord Levene participated in the Lloyd’s Performance Plan.
LLOYD’S PERFORMANCE PLANThe Lloyd’s Performance Plan (LPP) was introduced from 1 January 2008. It replaced the previous long-term incentive plan (LTIP) available to the CEO, Directors and Level 1 employees. The transitional arrangements to the LPP came to an end on 31 December 2010.
The LPP is available to all employees and has been designed to meet strategic objectives by enabling the Corporation to offer an incentive which:
> Is directly linked to the profitability of the Lloyd’s market and will therefore encourage an attitude of commercial partnership with the market and align the interests of participants with capital providers.
> Will provide a competitive reward and therefore assist Lloyd’s in attracting and retaining the talented individuals required to develop and support future strategy.
The plan is operated at the discretion of the Remuneration Committee and can be amended or terminated at any time.
ELIGIBILITYAll employees of the Corporation and international offices are eligible to participate in the LPP on the basis set out below.
New employees will become eligible to participate in the LPP from the first full financial year following their recruitment.
Lloyd’s
83W
elcome to Lloyd’s
Society reportM
arket resultsM
arket performance
Strategic overview
Annual Report 2011
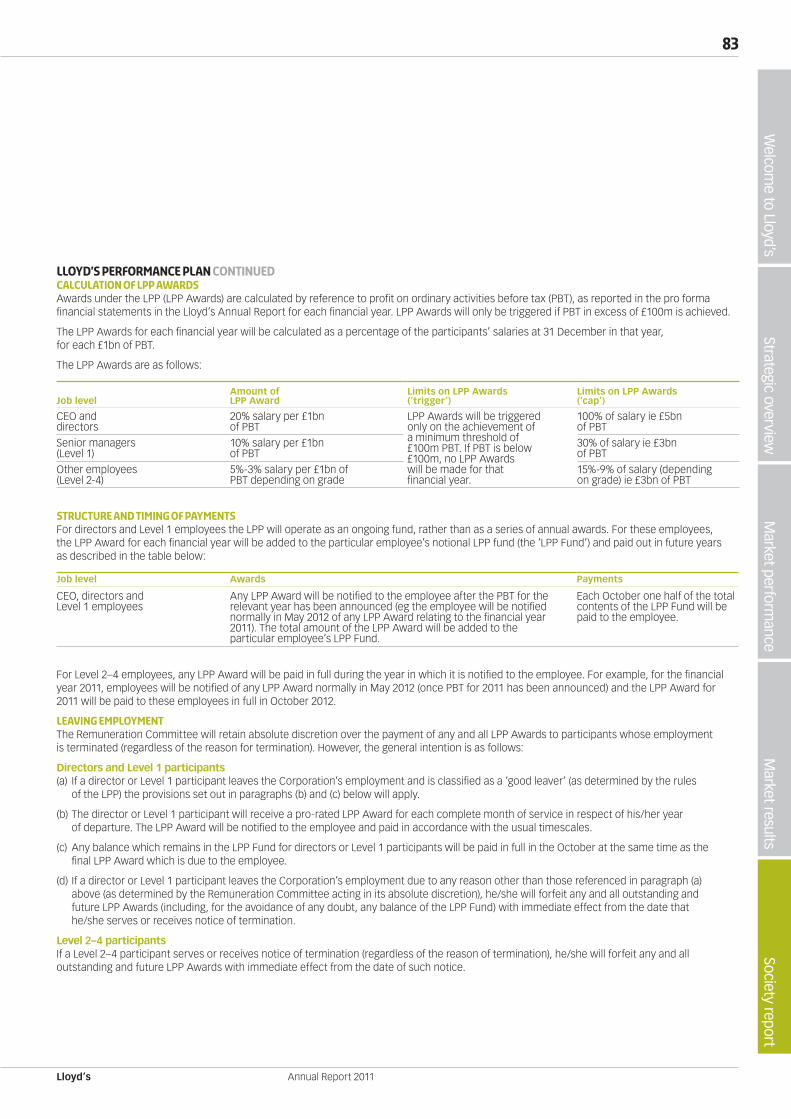
LLOYD’S PERFORMANCE PLAN continuedCALCULATION OF LPP AWARDSAwards under the LPP (LPP Awards) are calculated by reference to profit on ordinary activities before tax (PBT), as reported in the pro forma financial statements in the Lloyd’s Annual Report for each financial year. LPP Awards will only be triggered if PBT in excess of £100m is achieved.
The LPP Awards for each financial year will be calculated as a percentage of the participants’ salaries at 31 December in that year, for each £1bn of PBT.
The LPP Awards are as follows:
Job levelAmount ofLPP Award
Limits on LPP Awards(‘trigger’)
Limits on LPP Awards(‘cap’)
CEO anddirectors
20% salary per £1bnof PBT
LPP Awards will be triggeredonly on the achievement ofa minimum threshold of£100m PBT. If PBT is below£100m, no LPP Awardswill be made for thatfinancial year.
100% of salary ie £5bnof PBT
Senior managers(Level 1)
10% salary per £1bnof PBT
30% of salary ie £3bnof PBT
Other employees(Level 2-4)
5%-3% salary per £1bn of PBT depending on grade
15%-9% of salary (depending on grade) ie £3bn of PBT
STRUCTURE AND TIMING OF PAYMENTSFor directors and Level 1 employees the LPP will operate as an ongoing fund, rather than as a series of annual awards. For these employees, the LPP Award for each financial year will be added to the particular employee’s notional LPP fund (the ‘LPP Fund’) and paid out in future years as described in the table below:
Job level Awards Payments
CEO, directors andLevel 1 employees
Any LPP Award will be notified to the employee after the PBT for the relevant year has been announced (eg the employee will be notified normally in May 2012 of any LPP Award relating to the financial year 2011). The total amount of the LPP Award will be added to the particular employee’s LPP Fund.
Each October one half of the total contents of the LPP Fund will be paid to the employee.
For Level 2–4 employees, any LPP Award will be paid in full during the year in which it is notified to the employee. For example, for the financial year 2011, employees will be notified of any LPP Award normally in May 2012 (once PBT for 2011 has been announced) and the LPP Award for 2011 will be paid to these employees in full in October 2012.
Leaving employmentThe Remuneration Committee will retain absolute discretion over the payment of any and all LPP Awards to participants whose employment is terminated (regardless of the reason for termination). However, the general intention is as follows:
Directors and Level 1 participants (a) If a director or Level 1 participant leaves the Corporation’s employment and is classified as a ‘good leaver’ (as determined by the rules
of the LPP) the provisions set out in paragraphs (b) and (c) below will apply.
(b) The director or Level 1 participant will receive a pro-rated LPP Award for each complete month of service in respect of his/her year of departure. The LPP Award will be notified to the employee and paid in accordance with the usual timescales.
(c) Any balance which remains in the LPP Fund for directors or Level 1 participants will be paid in full in the October at the same time as the final LPP Award which is due to the employee.
(d) If a director or Level 1 participant leaves the Corporation’s employment due to any reason other than those referenced in paragraph (a) above (as determined by the Remuneration Committee acting in its absolute discretion), he/she will forfeit any and all outstanding and future LPP Awards (including, for the avoidance of any doubt, any balance of the LPP Fund) with immediate effect from the date that he/she serves or receives notice of termination.
Level 2–4 participantsIf a Level 2–4 participant serves or receives notice of termination (regardless of the reason of termination), he/she will forfeit any and all outstanding and future LPP Awards with immediate effect from the date of such notice.
Lloyd’s
84 Society Report
Annual Report 2011
Report of the Remuneration committee continued
Pension arrangementsThe CEO, Director, Finance, Risk Management and Operations, and the Director, Performance Management are members of the Lloyd’s Pension Scheme.
Their dependants are eligible for dependants’ pensions and the payment of a lump sum in the event of death in service. The pension arrangements for the Director, Finance, Risk Management and Operations provide for a pension at normal retirement of two-thirds base annual salary after 20 years’ eligible service less any entitlement from previous pension arrangements and subject to a Scheme earnings cap of £129,600 from 6 April 2011. The pension arrangements for the CEO provide for a pension on retirement based on a standard accrual rate of one sixtieth of base annual salary subject to the Scheme earnings cap, for each year of eligible service, with the facility to increase the accrual rate to one thirtieth for an additional contribution. The pension arrangements for the Director, Performance Management provide for a pension at retirement built in annual blocks based on a standard accrual rate of one eightieth of base annual salary subject to the Scheme earnings cap in each year of eligible service with the facility to increase the accrual rate to one thirtieth for an additional contribution. No other payments to the CEO, the Director, Finance, Risk Management and Operations or the Director, Performance Management are pensionable.
The CEO, Director, Finance, Risk Management and Operations, and the Director, Performance Management receive a cash allowance of 20% of their base salary to compensate for their pension benefits being based on the Scheme earnings cap rather than their base salaries.
A cash allowance of £51,840 was payable in respect of Lord Levene for 2011 which equates to 40% of the Scheme earnings cap applicable during the period.
The Lloyd’s Pension Scheme is contributory and the Director, Finance, Risk Management and Operations made salary sacrifices of 10% of the earnings cap in exchange for additional employer pension contributions of the same amount. The CEO made a salary sacrifice of 5% of the earnings cap in exchange for an additional employer contribution for a sixtieth accrual rate and sacrificed an extra 25.9% of the earnings cap in exchange for an additional employer contribution to increase the accrual rate to thirtieths. The Director, Performance Management, made a salary sacrifice of 5% of the earnings cap in exchange for an additional employer contribution for an eightieth accrual rate.

Lloyd’s
85W
elcome to Lloyd’s
Society reportM
arket resultsM
arket performance
Strategic overview
Annual Report 2011
Contracts of employmentMr Nelson’s contract covers his services as Chairman of Lloyd’s and Chairman of the Franchise Board, as did Lord Levene’s contract.
Lord Levene’s contract expired on 9 December 2011 and he was paid in full until then.
The CEO, the Director, Finance, Risk Management and Operations and the Director, Performance Management, have rolling one-year contracts providing for a maximum of one year’s notice.
Effective date of contractUnexpired term as at
31 December 2011 Notice period1
John Nelson5 17/10/11 33 months 12 monthsRichard Ward2 24/04/06 rolling 1 year 12 monthsTom Bolt3 01/09/09 rolling 1 year 12 monthsLuke Savage4 20/09/04 rolling 1 year 12 months
Notes1. Employment contracts do not contain provisions for compensation payable upon early termination.2. Richard Ward was appointed to the Franchise Board and Council on 24 April 2006.3. Tom Bolt was appointed to the Franchise Board on 1 January 2010.4. Luke Savage was appointed to the Franchise Board on 30 September 2004.5. John Nelson was appointed to the Franchise Board and Council on 17 October 2011.
Remuneration and contracts of service for members of the Council of Lloyd’s and Franchise Board who are not employees of the CorporationThe Chairman and CEO are responsible for making recommendations to the Council for the remuneration of members of Council, the Franchise Board and their committees (other than themselves and the executive directors). In making their recommendations, the Chairman and CEO may liaise and consult with the Remuneration Committee as they think appropriate.
Remuneration for all members of Council and Franchise Board who are not employees of the Corporation is designed to attract people of sufficient calibre and experience to govern Lloyd’s affairs by providing an appropriate level of fees which reflects the demands made upon them. Reference is also made to independent surveys of fees paid to non-executive directors of similar organisations.
In 2011, fees for members of Council and Franchise Board were £35,700 and £56,100 per annum, respectively. The Deputy Chairmen were paid £45,900 per annum. Fees are also payable in respect of membership of a number of Council and Franchise Board committees, including a number of ad hoc committees established to consider specific issues requiring a significant time commitment. Non-employee members of the Council and Franchise Board are not eligible to join the Lloyd’s Pension Scheme.
Individual remuneration of all members of the Council and Franchise Board can be found in the table on page 86.
External and working members are elected to Council while nominated members are appointed to Council, usually for a three-year period. Members of the Franchise Board are appointed by Council with non-executive directors’ terms of office varying between one and three years. These are not contractual arrangements and compensation is not paid if a member leaves early.
Information subject to auditBASIS OF PREPARATIONThe following section provides details of the remuneration of all members of the Council of Lloyd’s and the Franchise Board for the year ended 31 December 2011. This section contains the following information in the form specified in Schedule 8 Part 3 of the Large and Medium-sized Companies and Groups (Accounts and Reports) Regulations 2008:
> Amount of each member’s emoluments and compensation in the current and previous financial year. > Details of each member’s accrued benefits in the Lloyd’s Pension Scheme and transfer values of those accrued benefits. > Details of each member’s interests under the LPP.
Lloyd’s
86 Society Report
Annual Report 2011
Report of the Remuneration committee continued
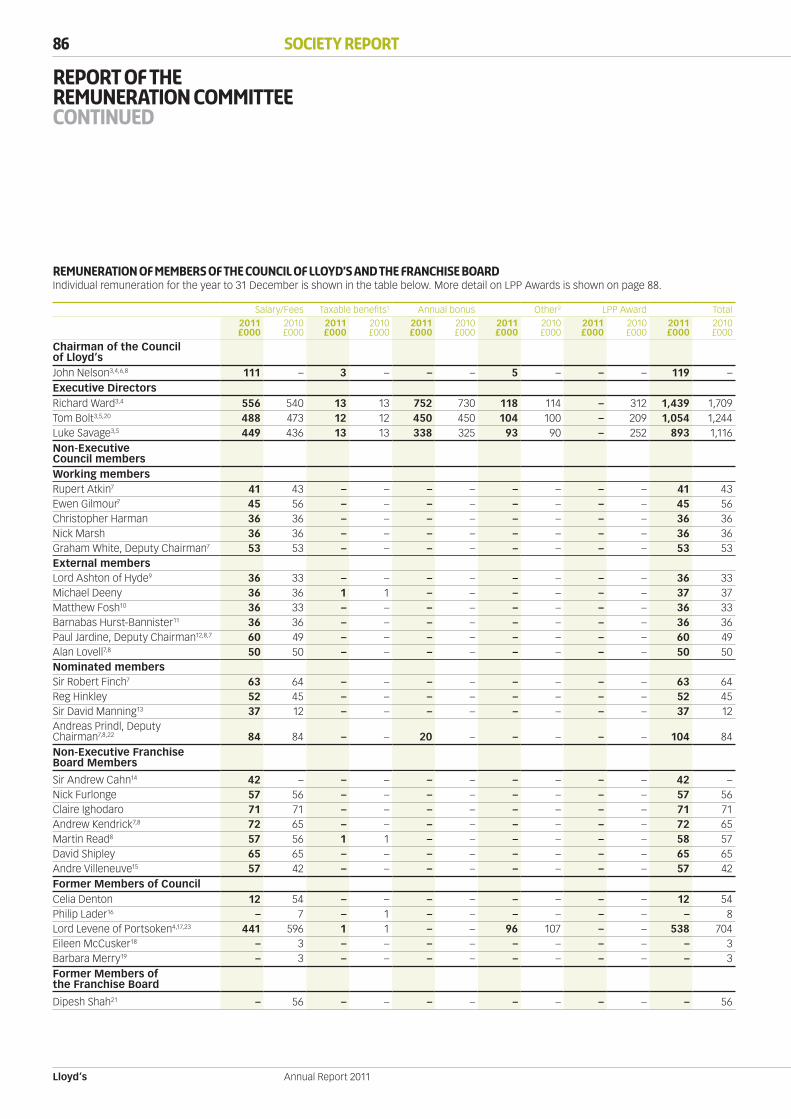
Remuneration of members of the council of Lloyd’s and the franchise boardIndividual remuneration for the year to 31 December is shown in the table below. More detail on LPP Awards is shown on page 88.
Salary/Fees Taxable benefits1 Annual bonus Other2 LPP Award Total2011£000
2010£000
2011£000
2010£000
2011£000
2010£000
2011£000
2010£000
2011£000
2010£000
2011£000
2010£000
Chairman of the Council of Lloyd’sJohn Nelson3,4,6,8 111 – 3 – – – 5 – – – 119 –Executive DirectorsRichard Ward3,4 556 540 13 13 752 730 118 114 – 312 1,439 1,709Tom Bolt3,5,20 488 473 12 12 450 450 104 100 – 209 1,054 1,244Luke Savage3,5 449 436 13 13 338 325 93 90 – 252 893 1,116Non-Executive Council membersWorking membersRupert Atkin7 41 43 – – – – – – – – 41 43Ewen Gilmour7 45 56 – – – – – – – – 45 56Christopher Harman 36 36 – – – – – – – – 36 36Nick Marsh 36 36 – – – – – – – – 36 36Graham White, Deputy Chairman7 53 53 – – – – – – – – 53 53External membersLord Ashton of Hyde9 36 33 – – – – – – – – 36 33Michael Deeny 36 36 1 1 – – – – – – 37 37Matthew Fosh10 36 33 – – – – – – – – 36 33Barnabas Hurst-Bannister11 36 36 – – – – – – – – 36 36Paul Jardine, Deputy Chairman12,8,7 60 49 – – – – – – – – 60 49Alan Lovell7,8 50 50 – – – – – – – – 50 50Nominated membersSir Robert Finch7 63 64 – – – – – – – – 63 64Reg Hinkley 52 45 – – – – – – – – 52 45Sir David Manning13 37 12 – – – – – – – – 37 12Andreas Prindl, Deputy Chairman7,8,22 84 84 – – 20 – – – – – 104 84Non-Executive Franchise Board Members
Sir Andrew Cahn14 42 – – – – – – – – – 42 –Nick Furlonge 57 56 – – – – – – – – 57 56Claire Ighodaro 71 71 – – – – – – – – 71 71Andrew Kendrick7,8 72 65 – – – – – – – – 72 65Martin Read8 57 56 1 1 – – – – – – 58 57David Shipley 65 65 – – – – – – – – 65 65Andre Villeneuve15 57 42 – – – – – – – – 57 42Former Members of CouncilCelia Denton 12 54 – – – – – – – – 12 54Philip Lader16 – 7 – 1 – – – – – – – 8Lord Levene of Portsoken4,17,23 441 596 1 1 – – 96 107 – – 538 704Eileen McCusker18 – 3 – – – – – – – – – 3Barbara Merry19 – 3 – – – – – – – – – 3Former Members of the Franchise Board
Dipesh Shah21 – 56 – – – – – – – – – 56
Lloyd’s
87W
elcome to Lloyd’s
Society reportM
arket resultsM
arket performance
Strategic overview
Annual Report 2011
Notes1. Taxable benefits include items such as benefit allowances, medical and life insurance.2. For executive directors, other includes payments of 20% of annual base salary as their pension benefits are based on a maximum earnings cap, which from 6 April 2011 was £129,600.
The amount stated in respect of Lord Levene represents a cash allowance in lieu of pension contributions and the premium in respect of additional life cover.3. Employee of the Corporation of Lloyd’s.4. Member of both Council and the Franchise Board for 2011.5. Member of the Franchise Board only.6. John Nelson’s term as Chairman of Lloyd’s started on 17 October 2011.7. Member of the Nominations, Appointments and Compensation Committee (NACC) for 2011. The NACC ceased in November 2011.8. Member of the Remuneration Committee for 2011. The Remuneration Committee was established in November 2011.9. Lord Ashton (as the representative of Faraday Capital Limited) joined Council on 1 February 2010.10. Matthew Fosh (as the representative of Novae Corporate Underwriting Limited) joined Council on 1 February 2010.11. Representative of Aprilgrange Ltd.12. Representative of Catlin Syndicate Limited.13. Sir David Manning was appointed to Council on 1 September 2010.14. Sir Andrew Cahn was appointed to the Franchise Board on 4 April 2011.15. Andre Villeneuve was appointed to the Franchise Board on 11 May 2010.16. Philip Lader retired from the Council and the NACC on 2 March 2010.17. Lord Levene retired as Chairman on 16 October 2011, although his contract expired on 9 December and he was paid in full to that date. He was contracted to work four days
per week but with effect from 1 October 2010, one of those four days was associated with duties to NBNK Investments plc and was paid directly by NBNK Investments plc.18. Eileen McCusker, as the representative of Dornoch Limited, retired from Council on 31 January 2010.19. Barbara Merry, as the representative of Hardy Underwriting Limited, retired from Council on 31 January 2010.20. Tom Bolt is a non-executive director of Xchanging Claims Services. No fees are payable.21. Dipesh Shah retired from the Franchise Board on 31 December 2010.22. On the recommendation of the NACC, the Council agreed to award Andreas Prindl a special bonus of £20,000 for the additional work he undertook as Chairman of the NACC
in successfully leading the search for a new Chairman.23. Former employee of the Corporation.

Lloyd’s
88 Society Report
Annual Report 2011
Report of the Remuneration committee continued
Lloyd’s pension scheme provisions
Salarysacrifice in
year to31 December
20111
£000
Age at31 December
2011
Increasein pensionin year to
31 December2011 –actual
£000
Increasein pensionin year to
31 December2011 – net
of priceinflation
£000
Totalaccrued
annualpension in
year to31 December
2011£000 pa
Normalretirement
age
Richard Ward 39 54 5 5 24 65Tom Bolt 6 55 2 1 4 65Luke Savage 13 50 9 9 28 60
Note1. The Lloyd’s Pension Scheme was made a contributory pension scheme with effect from 1 July 2006. The CEO, Director, Finance, Risk Management and Operations, and the Director, Performance
Management have made salary sacrifices in exchange for Lloyd’s making additional employer contributions.
Transfer values of accrued pension benefits
Transfervalue toaccruedpension
as at31 December
2010£000
Transfervalue ofaccruedpension
as at31 December
2011£000
Movementin transfervalue over
the year lessamounts
salarysacrificed
£000
Richard Ward 242 274 (7)Tom Bolt 25 39 8Luke Savage 292 378 73
The transfer value represents a liability of the Lloyd’s Pension Scheme, not a sum paid or due to the individual.
Members of the council of Lloyd’s and franchise board’s share of the Lloyd’s performance planEstimated long-term bonus
Total awardoutstanding
as at31 December
2010£000
Change inyear£000
Amount paidduring the
year ended31 December
2011£000
Total awardoutstanding
as at31 December
2011£000
Richard Ward 605 – 302 303Tom Bolt 209 – 105 104Luke Savage 520 – 260 260
Andreas Prindl, CBE Chairman, Remuneration Committee
Lloyd’s
89W
elcome to Lloyd’s
Society reportM
arket resultsM
arket performance
Strategic overview
Annual Report 2011
Report of theAudit committee
This report sets out the role, remit and activities of the Audit Committee during 2011.
Composition of the Audit CommitteeAt the end of 2011, the Audit Committee comprised three nominated members of Council, one external member of the Council and three non-executive members of the Franchise Board. The Audit Committee met five times during the year. The members of the Audit Committee in 2011 and their attendance at meetings are shown in the Corporate Governance report on page 78.
All of the Audit Committee have extensive commercial experience. For the purposes of the UK Corporate Governance Code, Reg Hinkley, Paul Jardine, and Claire Ighodaro, the Chairman of the Audit Committee, are considered by the Council to have recent and relevant financial experience.
Terms of referenceThe Council has delegated to the Audit Committee responsibility for overseeing the financial reporting and internal controls of the Society and its subsidiaries and the Central Fund. The Audit Committee follows an agreed annual work plan. The principal responsibilities of the Audit Committee include:
> Ensuring that the financial activities of Lloyd’s are subject to independent review and audit. The Audit Committee reviews Lloyd’s published annual and interim financial statements including the pro forma financial statements, the Aggregate Accounts, the group financial statements of the Society of Lloyd’s and Lloyd’s Return to the FSA.
> Reviewing and monitoring the arrangements for ensuring the objectivity and effectiveness of the external and internal audit functions. > Considering, on behalf of the Council, the appointment or removal of the external auditors. > Reviewing and monitoring the effectiveness of the systems of internal control of the Society. > Ensuring that appropriate arrangements are in place for ensuring compliance by the Society with relevant laws and regulations. > Ensuring appropriate whistle-blowing arrangements are in place by which members of staff can, in confidence, raise concerns
relating to possible improprieties.
The Audit Committee’s terms of reference are available on request from the Secretary to the Council.
Report on the Audit Committee’s activities in 2011The principal issues addressed during 2011 were:
> The annual financial statements for 2010 including the pro forma financial statements and Aggregate Accounts, the financial statements of the Society and financial disclosures and various accounting matters raised by management and auditors.
> The interim financial statements for the six months to 30 June 2011 including the pro forma financial statements and the financial statements of the Society of Lloyd’s.
> The interim management statements of the Society of Lloyd’s. > A consideration of those accounting policies which involved significant estimates and judgements. > The 2010 Lloyd’s Return to the FSA. > The external auditors’ status reports and management letters. > The independence and objectivity of the external auditors, including a review of non-audit fees. > The external and internal audit plans. > The reports of the Head of Internal Audit and the Legal and Compliance department, including follow-up of internal audit findings
and the annual compliance plan. > Reports from the Executive Risk Committee, covering key aspects of the Lloyd’s Risk Framework and risk reporting. > Assessment of the effectiveness of internal controls. > Assessment of the effectiveness of the internal and external auditors.
Lloyd’s
90 Society Report
Annual Report 2011
Report of theAudit committeeContinued
The Audit Committee believes that the auditor’s performance should be considered fully every year. Therefore, there is a standing agenda item to review the performance of the auditors in detail against the relevant criteria in the Committee’s terms of reference and the auditors are not present for this. Following the 2011 effectiveness review, the Committee concluded that it was appropriate to recommend that the present auditors be reappointed. The external auditors are required to rotate the audit partner responsible for the audit every 5 years. In 2010, a new lead audit partner was appointed by Ernst & Young LLP. There are no contractual obligations restricting the company’s choice of external auditor.
The Audit Committee monitors the implementation of the policy on non-audit services provided by the external auditors. The policy sets out the approach to be taken by the Society when using the services of the external auditors, including requiring that certain services provided by the external auditors are pre-approved by the Audit Committee or its Chairman. The approval of the Audit Committee is always required if a non-audit service provided by the auditors is expected to cost more than £100,000.
The Audit Committee also carried out an effectiveness review of the internal auditors and is satisfied with their performance.
The Audit Committee held a workshop training session during 2011 with a presentation made by Ernst & Young on the current status of IFRS 4, Phase II.
The Audit Committee also reviewed its own performance.
SupportThe CEO, Director, Finance, Risk Management and Operations, General Counsel, senior managers and the external and internal auditors attended meetings as appropriate. During the year, the Audit Committee met separately with the external and internal auditors without executive management present.
The Audit Committee has access to external independent advice, if required.
Claire Ighodaro, CBE Chairman, Audit Committee
Lloyd’s
91W
elcome to Lloyd’s
Society reportM
arket resultsM
arket performance
Strategic overview
Annual Report 2011
Report of the Lloyd’sMembers’ ombudsman
Report by Mark Humphries, Lloyd’s Members’ OmbudsmanI am pleased to present the Annual Report of the Lloyd’s Members’ Ombudsman to the Council of Lloyd’s for the year ended 31 December 2011.
The role of the Lloyd’s Members’ Ombudsman is to investigate complaints by members and former members who were members at any time after 30 November 2001, who believe that they have suffered injustice in consequence of maladministration in relation to any action taken by or on behalf of the Society.
Complaints ReceivedDuring the year three complaints were received, none of which justified a finding of maladministration.
CostsThe expenses incurred by my office amounted to £15,000.
Lloyd’s
92 Society Report
Annual Report 2011
Financial review
This review should be read in conjunction with the financial statements of the Society on pages 99 to 135.
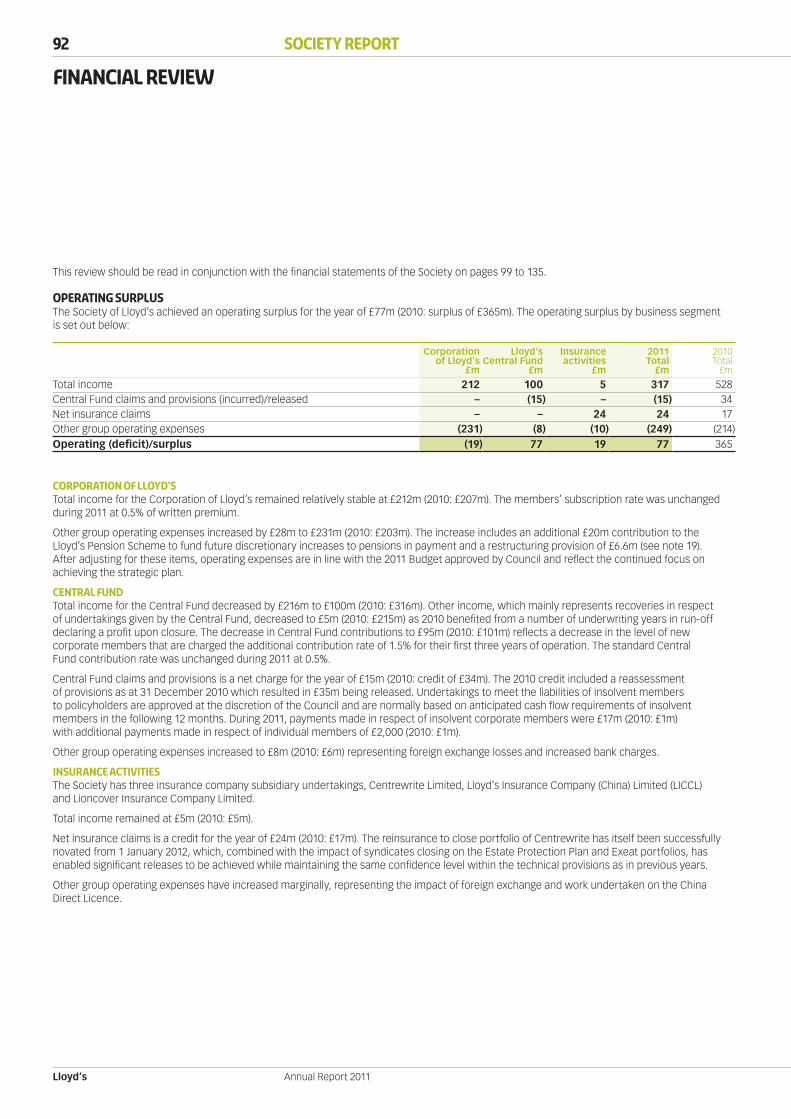
Operating surplusThe Society of Lloyd’s achieved an operating surplus for the year of £77m (2010: surplus of £365m). The operating surplus by business segment is set out below:
Corporationof Lloyd’s
£m
Lloyd’sCentral Fund
£m
Insuranceactivities
£m
2011Total
£m
2010Total
£m
Total income 212 100 5 317 528Central Fund claims and provisions (incurred)/released – (15) – (15) 34Net insurance claims – – 24 24 17Other group operating expenses (231) (8) (10) (249) (214)Operating (deficit)/surplus (19) 77 19 77 365
CORPORATION OF LLOYD’STotal income for the Corporation of Lloyd’s remained relatively stable at £212m (2010: £207m). The members’ subscription rate was unchanged during 2011 at 0.5% of written premium.
Other group operating expenses increased by £28m to £231m (2010: £203m). The increase includes an additional £20m contribution to the Lloyd’s Pension Scheme to fund future discretionary increases to pensions in payment and a restructuring provision of £6.6m (see note 19). After adjusting for these items, operating expenses are in line with the 2011 Budget approved by Council and reflect the continued focus on achieving the strategic plan.
CENTRAL FUNDTotal income for the Central Fund decreased by £216m to £100m (2010: £316m). Other income, which mainly represents recoveries in respect of undertakings given by the Central Fund, decreased to £5m (2010: £215m) as 2010 benefited from a number of underwriting years in run-off declaring a profit upon closure. The decrease in Central Fund contributions to £95m (2010: £101m) reflects a decrease in the level of new corporate members that are charged the additional contribution rate of 1.5% for their first three years of operation. The standard Central Fund contribution rate was unchanged during 2011 at 0.5%.
Central Fund claims and provisions is a net charge for the year of £15m (2010: credit of £34m). The 2010 credit included a reassessment of provisions as at 31 December 2010 which resulted in £35m being released. Undertakings to meet the liabilities of insolvent members to policyholders are approved at the discretion of the Council and are normally based on anticipated cash flow requirements of insolvent members in the following 12 months. During 2011, payments made in respect of insolvent corporate members were £17m (2010: £1m) with additional payments made in respect of individual members of £2,000 (2010: £1m).
Other group operating expenses increased to £8m (2010: £6m) representing foreign exchange losses and increased bank charges.
INSURANCE ACTIVITIESThe Society has three insurance company subsidiary undertakings, Centrewrite Limited, Lloyd’s Insurance Company (China) Limited (LICCL) and Lioncover Insurance Company Limited.
Total income remained at £5m (2010: £5m).
Net insurance claims is a credit for the year of £24m (2010: £17m). The reinsurance to close portfolio of Centrewrite has itself been successfully novated from 1 January 2012, which, combined with the impact of syndicates closing on the Estate Protection Plan and Exeat portfolios, has enabled significant releases to be achieved while maintaining the same confidence level within the technical provisions as in previous years.
Other group operating expenses have increased marginally, representing the impact of foreign exchange and work undertaken on the China Direct Licence.

1,447
89
12
(58)
1,490
net assets at1 january 2011
surplus forthe year
Actuarial loss onlloyd’s pension scheme
tax
net assets at31 december 2011
Additions to net assets
Deductions to net assets
Net assets
Lloyd’s
93W
elcome to Lloyd’s
Society reportM
arket resultsM
arket performance
Strategic overview
Annual Report 2011
Investment performance
2011£m
2010£m
Finance income 91 132Finance costs (64) (66)Unrealised exchange gains on borrowings 5 8
32 74Surplus on subordinated debt repurchase 4 1
36 75
The Society’s investments returned £91m, or 3.4% during the year (2010: £132m, 5.6%). Most of the Society’s investments are held within the Central Fund. Of these assets, the majority are invested in fixed interest securities of high credit quality. These investments performed strongly in the period as yields continued to decline in key developed economies. Also helping performance, there were no exposures to peripheral European countries, where yields rose significantly. Returns from more volatile asset classes were less good during this period of economic uncertainty and some equity portfolios, in particular, experienced losses. Overall, the well diversified disposition of the Society’s assets has helped us achieve a satisfactory investment return during a period of significant uncertainty in financial markets. A commentary on investment strategy is set out on page 95. The disposition of the Society’s financial investments is set out in note 15 on pages 122 to 124.
Finance costs of £64m in 2011 (2010: £66m) predominantly relate to interest on the subordinated notes and perpetual subordinated capital securities. The decrease in the level of finance costs is mainly as a result of the reduction in the level of outstanding debt securities.
Unrealised exchange gains on borrowings reflect the impact of foreign exchange movements on the Society’s outstanding debt securities. The exposure to movements in the euro is naturally hedged through euro-denominated investments held.
Adjusting for interest costs and foreign exchange movements results in a net investment return of £32m (2010: £74m).
During 2011, the Society of Lloyd’s repurchased a principal amount of £27m of its 2007 perpetual subordinated capital securities at a cost of £23m. The Society additionally paid accrued interest on the purchased securities. The profit on the repurchase was £4m.
TAXATIONA tax charge of £29m (2010: £122m) on the surplus before tax of £118m (2010: £444m) has been recognised for the year ended 31 December 2011. Further details are set out in note 8 on pages 115 and 116.
Movement in net assets£m
The net assets of the Central Fund are included within the above amounts and at 31 December 2011 were £1,361m (2010: £1,281m).

Lloyd’s
94 Society Report
Annual Report 2011
Financial reviewContinued
PENSION SCHEMESLLOYD’S PENSION SCHEMEOn an IFRS basis, the group pension scheme valuation at 31 December 2011 was a deficit of £24m before allowance for deferred tax asset of £6m (31 December 2010: £26m surplus before allowance for a deferred tax liability of £7m).
The movement in the pension asset/(liability) during the year is summarised below:
2011£m
Pension surplus as at 1 January 2011 26Pension expense recognised in the group income statement (29)Employer contributions– normal 5– special 31Actuarial loss recognised in the group statement of comprehensive income (57)Pension deficit as at 31 December 2011 (24)
The movement in the valuation was mainly due to a fall in the discount rate from 5.5% to 4.9%, driven by lower bond yields, and the return on assets during the year being lower than expected.
The actuarial valuation of liabilities is particularly sensitive to changes in market conditions, which determine the discount rate, and changes to mortality assumptions. Further details are provided in note 18 on pages 126 to 130 which includes the sensitivity of the valuation to changes in these assumptions.
The latest triennial funding valuation of the scheme was carried out as at 30 June 2010, which showed a shortfall of £70m. To eliminate the funding shortfall Lloyd’s made a special contribution of £20m in December 2010 and agreed a recovery plan with the Trustees. An advance payment of £25m was also made in December 2010 and, as a result, Lloyd’s obligations under the recovery plan until 2014 have been met.
OVERSEAS PENSION SCHEMESOverseas pension schemes’ actuarial valuation at 31 December 2011 was £1.3m (2010: £1m). Further details are provided in note 18.
SOLVENCYTotal assets for solvency purposes are set out below. The 2011 position is an estimate of the amount which will be finalised in June 2012 for submission to the FSA:
2011£m
2010£m
Net assets at 31 December 1,490 1,447Subordinated notes and perpetual subordinated capital securities 898 930Central assets 2,388 2,377Callable Central Fund contributions 718 683Other solvency adjustments (11) (32)Central assets for solvency purposes 3,095 3,028Solvency shortfalls (115) (123)Excess of central assets over solvency shortfalls 2,980 2,905
Based on central assets for solvency purposes of £3.1bn (2010: £3.0bn), the estimated solvency ratio is 2691% (2010: 2462%). In setting contribution levels, account is taken of the Society’s ICA to ensure that Lloyd’s is prudently but competitively capitalised. Unencumbered central assets should be at least 250% of the Society’s ICA on a business as usual basis.
CASH FLOWS AND LIQUIDITYCash and cash equivalents decreased during the year ended 31 December 2011 by £19m to £127m (2010: £146m). Cash balances are maintained at appropriate levels to meet the short-term operating expenses of the Society. Any surplus cash balances are invested and are included as financial investments within the group balance sheet.
Lloyd’s
95W
elcome to Lloyd’s
Society reportM
arket resultsM
arket performance
Strategic overview
Annual Report 2011
CASH FLOWS AND LIQUIDITY continuedThe Corporation’s free cash balances are regularly monitored. Free cash represents the amounts, both at bank and on deposit, held in the UK and available to the Corporation to meet operating expenses, including those of overseas operations, excluding any client money balances held in respect of insurance and arbitration activities. Free cash balances during the year ended 31 December 2011 increased by £3m to £78m (2010: £75m).
The liquidity of the Central Fund is monitored separately. Cash balances are managed to meet short-term operational commitments including the payment of drawdowns. Any surplus cash balances are invested in compliance with defined investment parameters approved by the Lloyd’s Investment Committee.
CENTRAL FUND INVESTMENT STRATEGYCentral Fund investment strategy is considered in three parts. A prudent estimate of possible net cash flow requirements is used to determine the value of assets to be maintained for liquidity purposes. These are commingled with other liquid assets of Lloyd’s group companies and invested in bank deposits and other short-term securities, with maturities of up to 12 months, with the objective to optimise current income, with low risk, while ensuring that all cash flow requirements are met as they arise.
A significant element of Central Fund assets is invested in fixed interest securities of high credit quality. The financial risk exposures represented by debt securities issued by the Society are also considered when determining the disposition of fixed interest investments. The aim is to optimise investment returns in the longer term while maintaining overall financial risk within defined limits.
A proportion of investments is maintained in more volatile asset classes. Here also, the aim is to optimise investment returns in the longer term without exceeding defined risk tolerances. These investments are diversified among different asset classes to help manage risk. Current exposures include global equities, high yield bonds, global property (via property-related equity securities), commodities and hedge funds. Fixed interest assets of high credit quality are managed ‘in house’ by Lloyd’s. Third party investment managers are retained to manage investments in other asset classes.
FINANCIAL RISK MANAGEMENT AND TREASURY POLICIESOVERVIEWThe Society’s principal financial instruments comprise cash and cash equivalents, investments, borrowings and items that arise directly from operations such as trade receivables and payables. These include assets and liabilities of the Central Fund.
The Society’s treasury operations and investments are managed by reference to established policies which are reviewed regularly by the Investment Committee. Policies for managing these risks, in particular credit risk, liquidity risk and market risk, are summarised below:
CREDIT RISKCredit risk represents the risk of financial loss to the Society if a counterparty, or the issuer of a security, fails to meet its contractual obligations.
Trade and other receivablesThe Society has established procedures to minimise the risk of default by trade and other receivables, which are mainly in respect of the Lloyd’s market, the main source of income. These procedures include minimum standard checks for new market entrants.
Financial investmentsA list of permissible bank counterparties, for the purposes of money-market investment, is maintained and restricted to banks having strong balance sheets and credit ratings. Investment parameters exist for all investment assets, controlling overall credit quality and ensuring appropriate risk diversification. Permitted counterparties to capital market transactions are also carefully controlled. All applicable parameters are reviewed regularly by the Lloyd’s Investment Committee.
GuaranteesThe Society provides certain financial guarantees as security for the underwriting activities of the members of Lloyd’s. Further details are provided in note 25 on page 135.
LIQUIDITY RISKThe value and term of short-term assets are carefully monitored against those of the Society’s liabilities. The Society maintains sufficient liquid assets to meet liabilities as they fall due.
The liquidity of the Central Fund is monitored separately. Cash balances are managed to meet short-term operational commitments including the payment of drawdowns. Any surplus cash balances are invested in compliance with defined investment parameters approved by the Lloyd’s Investment Committee.
The Society had no committed borrowing facilities as at 31 December 2011 (2010: £nil).
MARKET RISKMarket risk represents the risk that movements in financial markets will affect the financial position of the Society. Market risks arising from the disposition of the Society’s investments are monitored against defined parameters using Value at Risk (VAR) methodology. The position is reviewed regularly by the Lloyd’s Investment Committee. As investments are actively monitored on a fair value basis, all investments are designated as fair value through profit or loss.
Lloyd’s
96 Society Report
Annual Report 2011
Financial reviewContinued
FINANCIAL RISK MANAGEMENT AND TREASURY POLICIES continuedFOREIGN CURRENCY RISKThe Society enters into a variety of foreign exchange transactions in response to the foreign currency requirements of Lloyd’s group companies. In managing the exposures arising from such foreign exchange activity, which may involve transactions for forward settlement, the net risk arising from all such exposures is considered and the level of this risk is managed within defined parameters. Consequently, while some net foreign exchange exposures may accrue to the Society from time to time as a result of this activity, the level of such exposures is carefully monitored and is not significant in the context of its combined activities.
Foreign currency exposures arising from overseas investments are considered together with foreign currency liabilities of the Society, and net foreign currency exposures arising are managed through the use of forward foreign exchange contracts.
Separately, the Society provides a Currency Conversion Service (CCS) to participating Lloyd’s syndicates, converting insurance premiums and claims between pounds sterling and other Lloyd’s settlement currencies as required. Foreign exchange exposures arising from the provision of the CCS are again managed on a net basis, within defined parameters. The CCS is operated separately from other foreign exchange activity of the Society because, under the terms of the service, any profit (or loss) arising from CCS exposures is distributed to (or collected from) syndicates participating in the CCS. Currency exposures arising from CCS activity consequently do not, ultimately, represent risks to the Society.
INTEREST RATE RISKBorrowings from the Lloyd’s market for the purpose of funding statutory insurance deposits do not bear a fixed rate of interest. Instead, investment returns earned on the borrowed assets are passed on to lenders. Consequently, no interest rate risk arises on such borrowings.
Short-term assets held by the Society may be significant at certain times but such balances cannot be accurately predicted. These are invested in money market instruments of up to 12 months duration with the objective of maximising current income while meeting liquidity requirements.
Interest rate risk arising from the requirement to make fixed rate coupon payments in respect of the Lloyd’s subordinated loan notes and the perpetual subordinated capital securities is considered in conjunction with the market risk arising on the Society’s investments. Overall risk is managed within defined limits, specified by the Franchise Board.
CAPITAL MANAGEMENTThe Society monitors its capital to ensure that it maintains sufficient assets for both operational and solvency purposes. Further disclosures with regard to financial instruments are provided in note 21 on pages 132 and 133.
RELATED PARTY TRANSACTIONSExcept for disclosures made in note 24 (see page 135), no related party had material transactions with the Society in 2011.
GOING CONCERN STATEMENTAfter making enquiries, the members of the Council of Lloyd’s have a reasonable expectation that the Society has adequate resources to continue in operational existence for the foreseeable future. For this reason, they continue to adopt the going concern basis in preparing the Society’s financial statements.
STATEMENT AS TO DISCLOSURE OF INFORMATION TO AUDITORSHaving made enquiries, the Council of Lloyd’s confirms that:
> To the best of each Council member’s knowledge and belief there is no information relevant to the preparation of the Society Report of which the Society’s auditors are unaware.
> Each Council member has taken all the steps a Council member might reasonably be expected to have taken to be aware of relevant audit information and to establish that the Society’s auditors are aware of that information.
OUTLOOKCentral assets, which exclude subordinated liabilities, are expected to remain stable at £2.4bn in 2012.
On 27 March 2012, the Council of Lloyd’s gave further undertakings to certain corporate members to use the New Central Fund to discharge the liability of those members where they have unpaid cash calls and do not have the resources to meet those cash calls. After taking account of the expiry of unutilised undertakings, the net increase in undertakings, which will be reflected as a charge in the 2012 income statement, is £26m (see note 4 on page 113).
The operating expenses for the Corporation and its subsidiaries are budgeted to decrease by £17m to £192m in 2012 reflecting the focus on financial discipline while delivering the Lloyd’s strategy.
Lloyd’s
97W
elcome to Lloyd’s
Society reportM
arket resultsM
arket performance
Strategic overview
Annual Report 2011
STATEMENT OF THE COUNCIL OF LLOYD’S RESPONSIBILITIES IN RELATION TO THE FINANCIAL STATEMENTS
The Council of Lloyd’s is responsible for preparing the group financial statements in accordance with byelaws made under Lloyd’s Act 1982 and International Financial Reporting Standards (IFRS) as adopted by the European Union.
The Council of Lloyd’s is required to prepare group financial statements for each financial year which present fairly the financial position of the Society and the financial performance and cash flows of the Society for that period. In preparing those group financial statements, the Council of Lloyd’s is required to:
> Select suitable accounting policies and then apply them consistently. > Present information, including accounting policies, in a manner that provides relevant, reliable, comparable and understandable information. > Provide additional disclosures when compliance with the specific requirements in IFRS is insufficient to enable users to understand the impact
of particular transactions, other events and conditions on the Society’s financial position and financial performance. > State that the Society has complied with IFRS, subject to any material departures disclosed and explained in the group financial statements.
The Council of Lloyd’s is responsible for keeping proper accounting records which disclose with reasonable accuracy at any time the financial position of the Society and enable it to ensure that the group financial statements comply with Article 4 of the IAS Regulation. As the Society’s subordinated debt and perpetual subordinated capital securities are admitted to trading in a regulated market in the European Union, Council has elected to comply with Article 4, which requires group financial statements to be prepared in conformity with IFRS as adopted by the European Union. The Council of Lloyd’s is also responsible for safeguarding the assets of the Society and hence for taking reasonable steps for the prevention and detection of fraud and other irregularities.
The Council of Lloyd’s is responsible for the maintenance and integrity of the corporate and financial information included on the Society’s website (www.lloyds.com). Legislation in the United Kingdom governing the preparation and dissemination of financial statements may differ from legislation in other jurisdictions.
Lloyd’s
98 Society Report
Annual Report 2011
INDEPENDENT AUDITOR’SREPORT TO the MEMBERS OF the society of LLOYD’S
We have audited the group financial statements of the Society of Lloyd’s (‘the Society’) for the year ended 31 December 2011, which comprise the group income statement, group statement of comprehensive income, group statement of financial position, group statement of changes in equity, group statement of cash flows and the related notes 1 to 25. The financial reporting framework that has been applied in their preparation is applicable law and International Financial Reporting Standards (IFRSs) as adopted by the European Union.
This report is made solely to the members of Lloyd’s, as a body, in accordance with the Council of Lloyd’s byelaws made under the Lloyd’s Act 1982 and our engagement letter dated 13 December 2011. Our audit work has been undertaken so that we might state to the members of Lloyd’s as a body those matters we are required to state to them in an auditor’s report and for no other purpose. To the fullest extent permitted by law, we do not accept or assume responsibility to anyone other than the Society and the members of Lloyd’s as a body, for our audit work, for this report, or for the opinions we have formed.
Respective responsibilities OF the council of Lloyd’s and auditorsAs explained more fully in the Statement of The Council of Lloyd’s Responsibilities set out on page 97, The Council of Lloyd’s is responsible for the preparation of the group financial statements and for being satisfied that they give a true and fair view. Our responsibility is to audit and express an opinion on the group financial statements in accordance with byelaws made under the Lloyd’s Act 1982 and International Standards on Auditing (UK and Ireland). Those standards require us to comply with the Auditing Practices Board’s Ethical Standards for Auditors.
The Society has also instructed us to:
> Report to you our opinion as to whether the Report of the Remuneration Committee has been properly prepared in accordance with the basis described therein.
> Report if, in our opinion, the Society has not kept proper accounting records, if we have not received all the information and explanations we require for our audit.
Scope of the audit of the FINANCIAL STATEMENTSAn audit involves obtaining evidence about the amounts and disclosures in the financial statements sufficient to give reasonable assurance that the financial statements are free from material misstatement, whether caused by fraud or error. This includes an assessment of: whether the accounting policies are appropriate to the group’s circumstances and have been consistently applied and adequately disclosed; the reasonableness of significant accounting estimates made by The Council of Lloyd’s; and the overall presentation of the financial statements. In addition, we read all the financial and non-financial information in the reports listed on page 68 to identify material inconsistencies with the audited financial statements. If we become aware of any apparent material misstatements or inconsistencies we consider the implications for our report.
Opinion ON FINANCIAL STATEMENTSIn our opinion the group financial statements:
> Give a true and fair view, of the state of the Society’s affairs as at 31 December 2011 and of its surplus for the year then ended; and > Have been properly prepared in accordance with IFRSs as adopted by the European Union; and > Have been prepared in accordance with Council of Lloyd’s byelaws made under the Lloyd’s Act 1982.
Opinion ON other mattersIn our opinion the part of the Report of the Remuneration Committee that has been described as audited has been properly prepared in accordance with the basis of preparation as described therein;
Matters on which we are required to report by exception We have nothing to report in respect of the following matters where the Society has requested us to report to you if, in our opinion:
> Proper accounting records have not been kept; or > We have not received all the information and explanations we require for our audit.
Ernst & Young LLP Statutory Auditor, London
27 March 2012

Lloyd’s
99W
elcome to Lloyd’s
Society reportM
arket resultsM
arket performance
Strategic overview
Annual Report 2011
Group income statementfor the year ended 31 December 2011
Note2011£000
2010£000
Operating income 215,085 210,193Central Fund contributions 94,693 100,858General insurance net premium income 523 1,463Other group income 6,598 215,822Total income 3b 316,899 528,336
Central Fund claims and provisions (incurred)/released 4 (15,283) 34,245Gross insurance claims 13 22,717 11,602Insurance claims recoverable from reinsurers 13 1,492 4,864Other group operating expenses 5 (248,582) (214,483)Operating surplus 77,243 364,564Finance costs 7 (64,370) (66,143)Finance income– surplus on subordinated debt repurchase 17 4,248 1,470– other 7 90,369 131,436Unrealised exchange gains on borrowings 5,428 7,954Share of profits of associates 12A 4,927 5,084Surplus before tax 117,845 444,365Tax charge 8A (28,495) (121,752)Surplus for the year 89,350 322,613
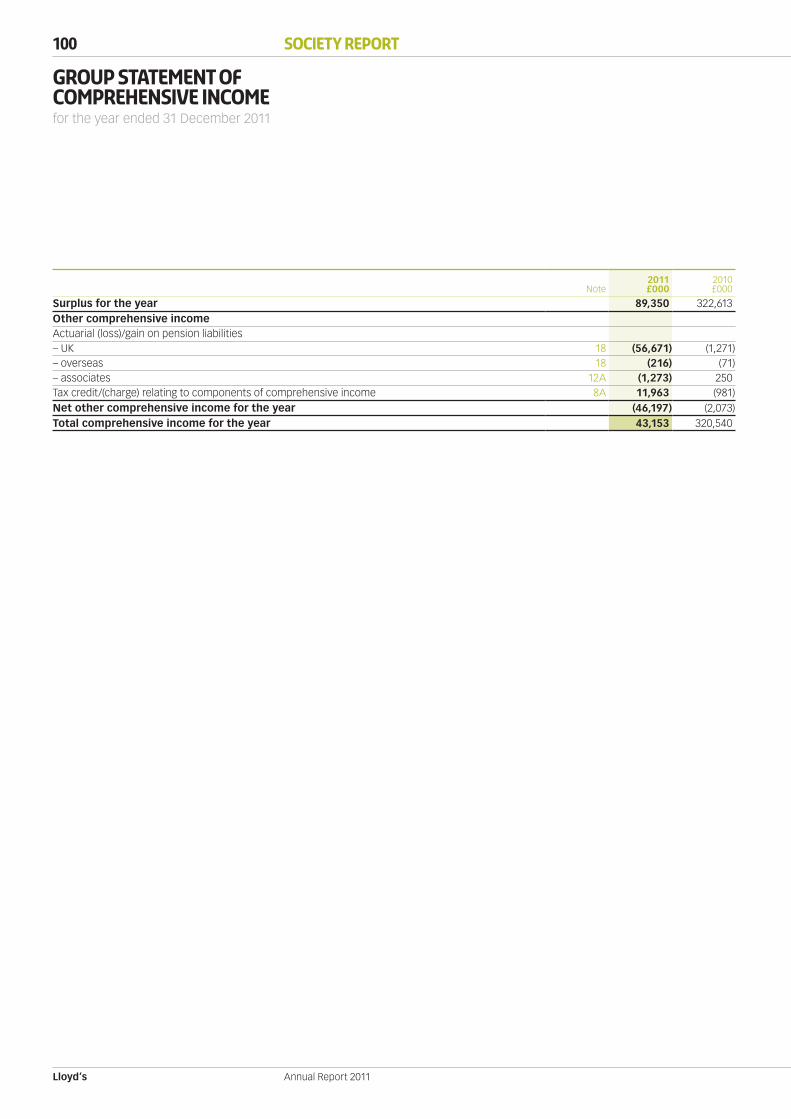
Lloyd’s
100 Society Report
Annual Report 2011
Group statement ofComprehensive incomefor the year ended 31 December 2011
Note2011£000
2010£000
Surplus for the year 89,350 322,613Other comprehensive incomeActuarial (loss)/gain on pension liabilities– UK 18 (56,671) (1,271)– overseas 18 (216) (71)– associates 12A (1,273) 250Tax credit/(charge) relating to components of comprehensive income 8A 11,963 (981)Net other comprehensive income for the year (46,197) (2,073)Total comprehensive income for the year 43,153 320,540
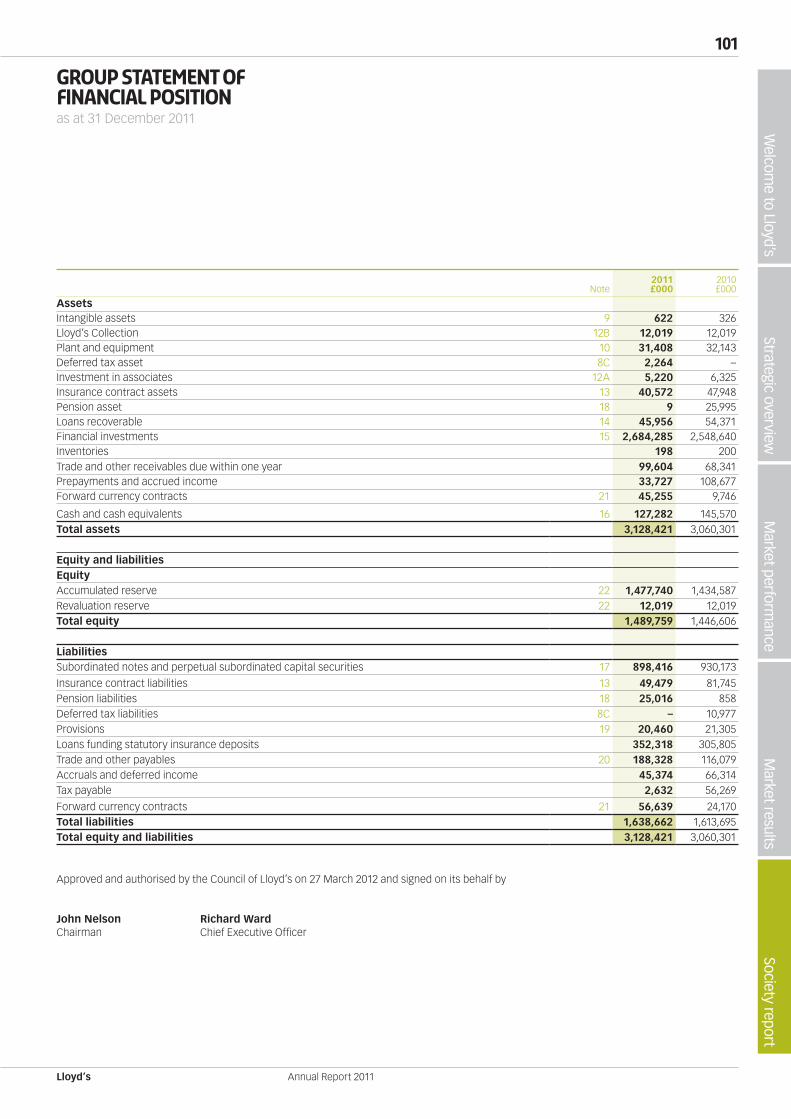
Lloyd’s
101W
elcome to Lloyd’s
Society reportM
arket resultsM
arket performance
Strategic overview
Annual Report 2011
Group statement ofFinancial positionas at 31 December 2011
Note2011£000
2010£000
AssetsIntangible assets 9 622 326Lloyd’s Collection 12B 12,019 12,019Plant and equipment 10 31,408 32,143Deferred tax asset 8C 2,264 –Investment in associates 12A 5,220 6,325Insurance contract assets 13 40,572 47,948Pension asset 18 9 25,995Loans recoverable 14 45,956 54,371Financial investments 15 2,684,285 2,548,640Inventories 198 200Trade and other receivables due within one year 99,604 68,341Prepayments and accrued income 33,727 108,677Forward currency contracts 21 45,255 9,746
Cash and cash equivalents 16 127,282 145,570Total assets 3,128,421 3,060,301
Equity and liabilitiesEquityAccumulated reserve 22 1,477,740 1,434,587Revaluation reserve 22 12,019 12,019Total equity 1,489,759 1,446,606
LiabilitiesSubordinated notes and perpetual subordinated capital securities 17 898,416 930,173
Insurance contract liabilities 13 49,479 81,745Pension liabilities 18 25,016 858Deferred tax liabilities 8C – 10,977Provisions 19 20,460 21,305Loans funding statutory insurance deposits 352,318 305,805Trade and other payables 20 188,328 116,079Accruals and deferred income 45,374 66,314Tax payable 2,632 56,269
Forward currency contracts 21 56,639 24,170Total liabilities 1,638,662 1,613,695Total equity and liabilities 3,128,421 3,060,301
Approved and authorised by the Council of Lloyd’s on 27 March 2012 and signed on its behalf by
John Nelson Richard WardChairman Chief Executive Officer

Lloyd’s
102 Society Report
Annual Report 2011
Group statement ofChanges in equityfor the year ended 31 December 2011
Note
Accumulatedreserve
£000
Revaluationreserve
£000
Totalequity
£000
At 1 January 2010 1,114,045 12,021 1,126,066Total comprehensive income for the year 320,540 – 320,540Transfer between reserves 2 (2) –At 31 December 2010 1,434,587 12,019 1,446,606Total comprehensive income for the year 43,153 – 43,153At 31 December 2011 22 1,477,740 12,019 1,489,759

Lloyd’s
103W
elcome to Lloyd’s
Society reportM
arket resultsM
arket performance
Strategic overview
Annual Report 2011
Group statement of cash flowsfor the year ended 31 December 2011
Note2011£000
2010£000
Surplus before tax 117,845 444,365Finance income – surplus on subordinated note repurchase 17 (4,248) (1,470)Net finance income – other 7 (25,999) (65,293)Unrealised exchange gains on borrowings (5,428) (7,954)Share of profits of associates 12A (4,927) (5,084)Operating surplus 77,243 364,564Central Fund claims and provisions incurred/(released) 4 15,283 (34,245)Operating surplus before Central Fund claims and provisions 92,526 330,319Adjustments for:Depreciation of plant and equipment 10 5,938 5,868Amortisation of intangible assets 9 221 427Impairment losses 9/10 716 1,006Loss on sale of fixed assets 1,111 591Operating surplus before working capital changes and claims paid 100,512 338,211Changes in pension obligations (6,743) (48,540)Decrease/(increase) in receivables 52,638 (68,743)Decrease in inventories 2 1Increase in payables 18,145 51,435Increase/(decrease) in provisions other than for Central Fund claims 788 (23,911)Cash generated from operations before claims paid 165,342 248,453Claims paid in respect of corporate/insolvent members 19 (16,910) (1,432)Tax and interest payments in respect of corporate/insolvent members 4 (2) (20)Claims paid in respect of individual members 4 (2) (905)Claims paid in respect of Limited Financial Assistance Agreements (1) (352)Cash generated from operations 148,427 245,744Tax paid (83,747) (70,970)Net cash generated from operating activities 64,680 174,774Cash flows from investing activitiesPurchase of plant, equipment and intangible assets (7,577) (16,102)Proceeds from the sale of fixed assets 30 1Purchase of financial investments 15A/B (3,741,771) (4,237,092)Receipts from the sale of financial investments 15A/B 3,637,135 3,897,913Decrease in short-term deposits 15B 26,982 23,661Dividends received from associates 12A 5,096 5,245Interest received 40,048 37,747Dividends received 7 3,145 3,088Realised (loss)/gain on settlement of forward currency contracts (3,206) 10,329Net cash used in investing activities (40,118) (275,210)Cash flows from financing activitiesPurchase of subordinated notes 17 (23,120) (19,518)Interest paid on subordinated notes (64,381) (66,045)Other interest paid (1,025) (1,841)Increase in borrowings for statutory insurance deposits 46,973 156,037Net cash (used)/generated in financing activities (41,553) 68,633Net decrease in cash and cash equivalents (16,991) (31,803)Effect of exchange rates on cash and cash equivalents (1,297) (843)Cash and cash equivalents at 1 January 16 145,570 178,216Cash and cash equivalents at 31 December 16 127,282 145,570

Lloyd’s
104 Society Report
Annual Report 2011
Notes to the financial statementsas at 31 December 2011
1. Basis of preparation and consolidationIn 1871, by Lloyd’s Act 1871, the then existing association of underwriters was incorporated as the Society and Corporation of Lloyd’s (the ‘Society’). Its activities are accordingly governed by statute and, since 1982, have been managed by the Council of Lloyd’s (the ‘Council’) pursuant to Lloyd’s Act 1982.
The Society’s main corporate purposes are to facilitate the carrying on of insurance business by members of Lloyd’s and the advancement and protection of their interests in this context. The group financial statements of the Society of Lloyd’s comprise the financial statements of the Society of Lloyd’s and all its subsidiary undertakings, the Lloyd’s Central Fund and the group’s interest in associates as at each reporting date. Subsidiary undertakings are consolidated from the date of their acquisition, being the date on which the Society obtains control, and continue to be consolidated until the date that such control ceases. The financial statements are prepared using consistent accounting policies. All intra-group balances and transactions are eliminated in full.
The group financial statements have been prepared in accordance with International Financial Reporting Standards (as adopted by the European Union) and on a historic cost basis, except for financial assets and liabilities at fair value through profit or loss and the Lloyd’s Collection, which are measured at fair value. Loans and receivables and other financial liabilities are carried at amortised cost. The group financial statements are presented in sterling and all values are rounded to the nearest thousand (£000).
The Society is regulated by the FSA.
2. Principal accounting policiesGeneralIn preparing the financial statements significant estimates and judgements are made in respect of some of the items reported. The main accounting policies identified involving such assessments are considered to be:
> Central Fund claims and provisions – undertakings (see note 2Q and note 19). > Employee benefits – defined benefit pension scheme (see note 2I and note 18). > Insurance contracts – liabilities and reinsurance assets (see note 2G and note 13). > Loans recoverable – hardship loans (see note 2J and note 14).
A. Plant and equipmentPlant and equipment are held at cost less accumulated depreciation and any impairment in value.
Depreciation is charged on a straight line basis on the following principal categories:
> Plant, vehicles and equipment are depreciated over 3 to 25 years according to the estimated life of the asset. > Equipment on hire or lease is depreciated over the period of the lease.
B. Software developmentCosts incurred in acquiring and developing computer software are capitalised as intangible assets where the software supports a significant business system and the expenditure leads to the creation of an identifiable asset of value. Software development is held at cost less accumulated depreciation and any impairment in value. Capitalised software is amortised over three years.
C. Lloyd’s CollectionLloyd’s Collection represents various paintings, antiques and artefacts which are included at fair value. Any revaluation surplus or deficit is recognised in the group statement of comprehensive income and is reflected in the revaluation reserve within the group statement of changes in equity.
Lloyd’s
105W
elcome to Lloyd’s
Society reportM
arket resultsM
arket performance
Strategic overview
Annual Report 2011
2. Principal accounting policies continuedD. Investment in associates AND JOINT VENTUREAn associate is an entity in which the Society has significant influence and which is not a subsidiary undertaking or joint venture. A joint venture is a joint arrangement whereby the parties that have joint control of the arrangement have rights to the net assets of the arrangement. The Society’s investment in associates and joint venture are accounted for under the equity method of accounting.
Under the equity method, the investment in associates and joint venture are carried in the group statement of financial position at cost plus post-acquisition changes in the Society’s share of net assets of the associate and joint venture. Goodwill relating to an associate is included in the carrying amount of the investment and is not amortised. After application of the equity method, the Society determines whether it is necessary to recognise any additional impairment loss with respect to the Society’s net investment in an associate and joint venture. The group income statement reflects its share of the results of operations of the associates and joint venture. The Society’s share of associates’ other comprehensive income is recognised in the group statement of comprehensive income.
E. Impairment of assetsThe Society performs annual impairment testing to assess whether there is an indication that an asset may be impaired. If any such indication exists the Society makes an estimate of the asset’s recoverable amount. An asset’s recoverable amount is the higher of an asset’s fair value less costs to sell and its value in use. When the carrying amount exceeds its recoverable amount, the asset is considered impaired and written down to its recoverable amount.
F. Financial instrumentsFinancial assets Initial recognitionFinancial assets within the scope of IAS 39 are classified as financial assets at fair value through profit or loss and receivables. The Society determines the classification of its financial assets at initial recognition.
Financial assets are recognised initially at fair value plus, in the case of loans and receivables, directly attributable transaction costs.
Purchases or sales of financial assets that require delivery of assets within a time frame established by regulation or convention in the market place (regular way purchases) are recognised on the settlement date.
The Society’s financial assets include loans recoverable, statutory insurance deposits and other investments designated at fair value through profit or loss, trade and other receivables, accrued income, cash and cash equivalents and derivative assets.
Subsequent measurementThe subsequent measurement of financial assets depends on their classification as follows:
(i) Financial assets at fair value through profit or loss include derivative financial assets which are classified as held for trading, and financial assets designated upon initial recognition at fair value through profit or loss. They are carried in the group statement of financial position at fair value. Gains and losses arising from changes in their fair value are included in the group income statement in the period in which they arise. When financial assets are interest-bearing, interest calculated using the effective interest method is recognised in the group income statement.
(ii) Loans and receivables are non-derivative financial assets with fixed or determinable payment that are not quoted in an active market. They arise when the Society provides money, goods or services directly to a debtor with no intention of trading the receivable. These financial assets are carried at amortised cost using the effective interest method. Gains and losses are recognised in the group income statement when the loans and receivables are derecognised or impaired, as well as through the amortisation process.
Financial liabilities Initial recognitionFinancial liabilities within the scope of IAS 39 are classified as financial liabilities at fair value through profit and loss and other financial liabilities. The Society determines the classification of its financial liabilities at initial recognition.
Financial liabilities are recognised initially at fair value and in the case of other financial liabilities, directly attributable transaction costs. The Society’s financial liabilities include trade and other payables, accruals, subordinated loan notes and perpetual capital securities and derivative liabilities.
The subsequent measurement of financial liabilities depends on their classification as follows:
(i) Financial liabilities at fair value through profit or loss include derivative financial liabilities which are classified as held for trading. Gains or losses on liabilities held for trading are recognised in the group income statement.
(ii) Other financial liabilities, which include the subordinated loan notes and the subordinated perpetual capital securities, are carried at amortised cost using the effective interest method.

Lloyd’s
106 Society Report
Annual Report 2011
Notes to the financial statementsContinuedas at 31 December 2011
2. Principal accounting policies continuedF. Financial instruments continuedFair value of financial instrumentsFinancial instruments are categorised for disclosure purposes into a hierarchy consisting of three levels depending upon the source of input as required by IFRS 7 (Financial Instruments: Disclosures).
Level 1 – The fair value of financial instruments which are actively traded in organised financial markets is determined by reference to quoted market bid prices at the close of business on the reporting date. The quoted market price used for financial assets held by the Society is the current bid price; the appropriate quoted market price for financial liabilities is the current offer price.
Level 2 – The fair value of financial instruments for which quoted market prices are not used for valuation purposes are derived both directly and indirectly from observable market conditions. The fair value of forward currency contracts is calculated by reference to current forward exchange rates for contracts with similar maturity profiles. The nominal value less estimated credit adjustments of trade receivables and payables are assumed to approximate to their fair values.
Level 3 – The fair value of financial instruments for which there is no observable quoted market price is determined by a variety of methods incorporating assumptions that are based, so far as possible, on market conditions existing at each reporting date.
Amortised cost of financial instrumentsAmortised cost is computed using the effective interest method less any allowance for impairment and principal repayment or reduction. The calculation takes into account any premium or discount on acquisition and includes transaction costs and fees that are an integral part of the effective interest rate.
Impairment of financial assetsThe Society assesses at each reporting date whether there is an indication that an asset may be impaired. If any such indication exists, the asset is written down to its recoverable amount.
Derecognition of financial instrumentsOther investments are derecognised when the right to receive cash flows from the asset have expired or, in the case of a financial liability, when the obligation under the liability is cancelled or discharged.
G. INSURANCE CONTRACTS (LIABILITIES AND REINSURANCE ASSETS)In accordance with IFRS 4 (Insurance contracts), the Society applies established UK accounting practices for insurance contracts, modified as appropriate to comply with the IFRS framework and applicable standards. This includes the application of the Statement of Recommended Practice (SORP) on accounting for insurance business issued by the Association of British Insurers in December 2005 (amended December 2006).
Insurance contracts are defined as those containing significant insurance risk which arises if, and only if, an insured event could cause an insurer to pay significant additional benefits in any scenario, excluding scenarios that lack commercial substance, at the inception of the contract. Such contracts remain insurance contracts until all rights and obligations are extinguished or expired.
An impairment review is performed on all reinsurance assets when an indication of impairment occurs. Reinsurance assets are impaired only if there is objective evidence that the Society may not receive all amounts due to it under the terms of the contract and this can be measured reliably.
H. INVENTORIESInventories are stated at the lower of cost and net realisable value on a first in, first out (FIFO) basis. Net realisable value is the estimated selling price in the ordinary course of business less estimated costs necessary to make the sale.
I. EMPLOYEE BENEFITSThe Society accounts for pensions and similar benefits (principally income protection due to ill-health) under IAS 19 (Employee Benefits). The Society operates a number of defined benefit pension schemes in which obligations are measured at discounted present value using the projected unit credit method, while plan assets are recorded at fair value. The operating and financing income and costs of the scheme are recognised in the group income statement. Service costs, financing income (expected return on plan assets), and costs are recognised in the periods in which they arise. Actuarial gains and losses are recognised in full in the group statement of comprehensive income in the period in which they occur. Costs of discretionary awards in respect of past service are recognised in the group income statement when amounts are committed to be paid or there is a constructive liability to make awards to pensioners.
Payments to separately administered defined contribution schemes are charged to the group income statement as they fall due.
Short-term bonuses are accrued in the period to which they relate, long-term bonuses are recognised over their vesting period.
Lloyd’s
107W
elcome to Lloyd’s
Society reportM
arket resultsM
arket performance
Strategic overview
Annual Report 2011
2. Principal accounting policies continuedJ. LOANS RECOVERABLERecoverable Central Fund loans made to hardship members are managed on a fair value basis and are designated as fair value through profit or loss.
Any gains and losses arising from changes in the fair value are included in the group income statement in the period in which they arise.
Fair values are determined by reference to an estimate of the valuation of the underlying securities at the dates at which they may be exercised and discounted back to present day values. A security can normally only be exercised on the later date of death of the member or of their spouse. This date is assessed using actuarial assumptions.
K. TAXATIONCorporation tax on the surplus or deficit for the periods presented comprises current and deferred tax. Corporation and income tax is recognised in the group income statement except to the extent that it relates to items recognised directly in the group statement of comprehensive income, in which case it is recognised in the group statement of comprehensive income.
Current tax is the expected tax payable on the taxable income for the year, using tax rates enacted or substantially enacted at the reporting date, and any adjustment to tax payable in respect of previous years.
Deferred tax liabilities are recognised for all taxable temporary differences and deferred tax assets are recognised for all deductible temporary differences and unutilised tax losses to the extent that it is probable that taxable profits will be available against which the deductible temporary differences or tax losses can be utilised.
Deferred tax is measured on an undiscounted basis at the rates that are expected to apply in the periods in which timing differences reverse, based on tax rates and laws enacted or substantially enacted at the reporting date.
L. SUBORDINATED NOTES AND PERPETUAL SUBORDINATED CAPITAL SECURITIESSubordinated debt is initially recognised at fair value, being the fair value of the consideration received net of issue costs associated with the borrowing.
After initial recognition, the subordinated debt is subsequently recorded at amortised cost using the effective interest rate over the period to the earliest option date. Amortised cost is calculated after taking into account issue costs and issue discount.
M. CASH AND CASH EQUIVALENTSFor the purposes of the group statement of cash flows, cash comprises cash at banks and demand deposits, and cash equivalents comprise highly liquid investments, that are convertible into cash with an insignificant risk of changes in value, with original maturities of less than three months.
N. INCOME RECOGNITIONIncome, which is stated net of value added tax, comprises the fair value of amounts receivable. Income is recognised as follows:
(i) Members’ subscriptions, market charges and other services Members’ subscriptions, market charges and other services are recognised in the period for which the service is provided. They are recognised on a basis that reflects the timing, nature and value of the benefits provided.
(ii) Central Fund contributions Central Fund contributions from members underwriting in the year are recognised when no significant uncertainty as to collectability exists.
(iii) Interest income Interest receivable is recognised in the group income statement on a time apportioned basis using the effective interest method. Any unwinding of discount is recognised as interest income.
(iv) Dividend income Dividend income from equity investments is included in the group income statement on the ex-dividend date.
(v) Other income Other income is recognised when recoverability is agreed.
O. INSURANCE PREMIUMSInsurance premiums represent premiums on business incepting during the year, together with adjustments for premiums written in previous accounting periods. Premium income is recognised over the period of cover. Premiums written are stated before deduction of commissions but net of taxes, duties levied on premiums and other similar deductions.
Lloyd’s
108 Society Report
Annual Report 2011
Notes to the financial statementsContinuedas at 31 December 2011
2. Principal accounting policies continuedP. INSURANCE CLAIMSClaims incurred in insurance related activities consist of claims and claims handling expenses paid during the year together with the movement in outstanding claims. Outstanding claims are the estimated final cost of all claims incurred but not settled at the reporting date, including claims incurred but not reported (IBNR). Outstanding claims are not discounted. Subsequent information and events may result in the ultimate liability being less than, or greater than, the amount provided. Any differences between the provision and subsequent settlements are reflected within the group financial statements of later years.
Q. CENTRAL FUND CLAIMS AND PROVISIONSCentral Fund claims and provisions (undertakings) are accounted for when they are approved by the Council and become contractual commitments. These undertakings are granted wholly at the discretion of the Council for a fixed period, normally one year, and therefore are not deemed to be constructive obligations, except for renewals of those commitments previously granted. For those corporate members in provisional liquidation, the Council provides a supporting commitment, which will ensure that in no circumstance will an insurance creditor receive less than the amount it would have received in a winding up commencing on the date of the provisional liquidation. As the supporting undertakings are legally enforceable commitments, an estimate of their value is included within provisions in the group financial statements and changes during the period are reflected in the group income statement.
Recoveries in respect of undertakings previously given are credited to the group income statement when contractually committed to be received.
R. FOREIGN CURRENCY AND DERIVATIVE INSTRUMENTSForeign currency translation(i) Functional and presentation currency
The group financial statements are presented in pound sterling, which is the Society’s functional and presentation currency. Items included in the financial statements of each of the Society’s entities are measured using the currency of the primary economic environment in which the entity operates (the functional currency).
(ii) Transactions and balances Transactions in foreign currencies are recorded at the exchange rate prevailing on the date of the transaction. At each reporting date, monetary assets and liabilities denominated in foreign currencies are retranslated at the exchange rate prevailing at the reporting date. Translation differences on monetary items are taken to the group income statement.
Translation differences on non-monetary items measured at fair value are reported as part of the fair value gain or loss and included in the group income statement.
The results and financial position of overseas Society operations are translated into pound sterling as follows:
> Assets and liabilities are translated at the closing rate at the date of that statement of financial position. > Income and expenses are translated at the average exchange rate for the year. > Any resulting exchange differences are recognised in the group statement of comprehensive income and accumulated within a separate
component of equity.
The Society enters into forward currency contracts to manage exposures to fluctuation in foreign exchange rates, and to provide a service to the Lloyd’s market. Where gains and losses are not expected to be refunded or recovered from the Lloyd’s market, these amounts are taken to the group income statement.
The principal exchange rates were:
2011 2010
US$ 1.55 1.57Can$ 1.58 1.56Euro 1.20 1.17
S. LeasesPayments made under operating leases are charged to the group income statement on a straight-line basis over the period of the lease.
Lloyd’s
109W
elcome to Lloyd’s
Society reportM
arket resultsM
arket performance
Strategic overview
Annual Report 2011
2. Principal accounting policies continuedT. NEW STANDARDS AND INTERPRETATIONS NOT APPLIEDThe International Accounting Standards Board and International Financial Reporting Interpretations Committee have issued the following standards and interpretations relevant to the Society. At the date these financial statements were approved, the following standards were in issue but not effective:
Effective date(for accounting periods beginning on or after)
International Accounting StandardsIAS 1 Presentation of Financial Statements 1 January 2013IAS 19 Employee Benefits 1 January 2013IFRS 9 Financial Instruments 1 January 2015IFRS 10 Consolidated Financial Statements 1 January 2013IFRS 11 Joint Arrangements 1 January 2013IFRS 12 Disclosure of Interests in Other Entities 1 January 2013IFRS 13 Fair Value Measurement 1 January 2013
With the exception of revisions to IAS 19, the Council does not consider that the adoption of the above standards will have a material impact on the Society’s financial statements. The impact of changes to IAS 19 Employee Benefits is in the process of being evaluated.
3. Segmental analysisSegment information is presented in respect of the Society’s business segments. The primary business segments are based on the Society’s management and internal reporting structure.
Intra-segment pricing is determined on an arm’s-length basis.
Segment results, assets and liabilities include items directly attributable to a segment as well as those that can be allocated on a reasonable basis.
Segment capital expenditure is the total cost incurred during the year to acquire segment assets that are expected to be used for more than one period.
Segment information in respect of geographical location is not presented. The Society’s main source of income is from the Lloyd’s market based primarily in the UK, which includes the recovery of costs in respect of overseas operations. The recovery of overseas operating costs is collected in the UK from the Lloyd’s market.
The Society’s primary business segments are as follows:
(i) Corporation of Lloyd’s and non-insurance related subsidiary undertakings: the main corporate purposes are to facilitate the carrying on of insurance business by members of Lloyd’s and the advancement and protection of their interests in this context. The activities of authorised insurance company subsidiary undertakings are excluded from this business segment.
(ii) Lloyd’s Central Fund: these funds, comprising the New Central Fund and the ‘Old’ Central Fund, are assets of the Society and are held and administered at the discretion of the Council, primarily as funds available for the protection of policyholders. Unless the approval of members is obtained, the New Central Fund may not be used for the purposes of extinguishing or reducing liabilities which have been reinsured by Equitas.
(iii) Insurance activities: the Society has three insurance company subsidiary undertakings, Centrewrite Limited, Lloyd’s Insurance Company (China) Limited and Lioncover Insurance Company Limited. Centrewrite provides Exeat insurance to resigned members participating only on run-off syndicates allowing an early exit from Lloyd’s, and Estate Protection Plan insurance to members. Centrewrite has also reinsured the members of Syndicate 535 and 1204 for outstanding claims in respect of certain years of account, these contracts have been successfully novated from 1 January 2012. Lloyd’s Insurance Company (China) Limited underwrites onshore reinsurance business in China and direct insurance risks in the Shanghai municipality. Following the completion of Phase 2 of the Equitas-Berkshire Hathaway transaction, Lioncover no longer has reinsurance liabilities to any person nor any entitlement to any reinsurance recoveries.
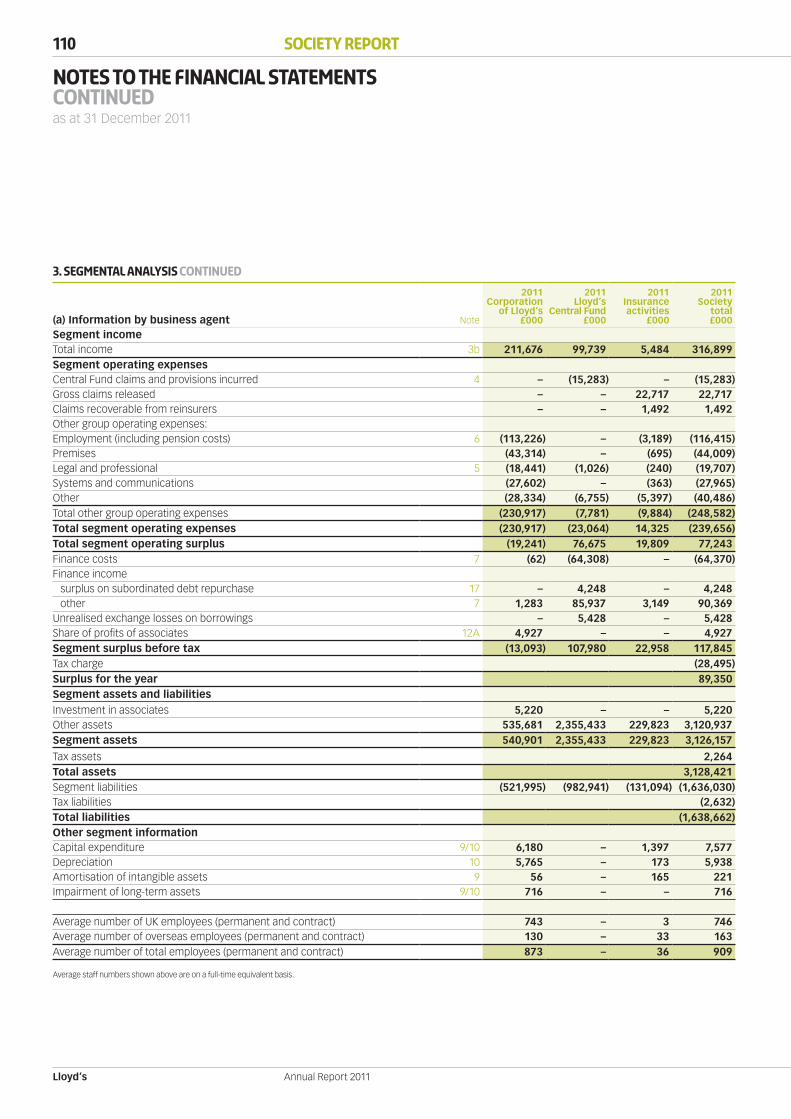
Lloyd’s
110 Society Report
Annual Report 2011
Notes to the financial statementsContinuedas at 31 December 2011
3. Segmental analysis continued
(a) Information by business agent Note
2011Corporation
of Lloyd’s£000
2011Lloyd’s
Central Fund£000
2011Insuranceactivities
£000
2011Society
total£000
Segment incomeTotal income 3b 211,676 99,739 5,484 316,899Segment operating expensesCentral Fund claims and provisions incurred 4 – (15,283) – (15,283)Gross claims released – – 22,717 22,717Claims recoverable from reinsurers – – 1,492 1,492Other group operating expenses:Employment (including pension costs) 6 (113,226) – (3,189) (116,415)Premises (43,314) – (695) (44,009)Legal and professional 5 (18,441) (1,026) (240) (19,707)Systems and communications (27,602) – (363) (27,965)Other (28,334) (6,755) (5,397) (40,486)Total other group operating expenses (230,917) (7,781) (9,884) (248,582)Total segment operating expenses (230,917) (23,064) 14,325 (239,656)Total segment operating surplus (19,241) 76,675 19,809 77,243Finance costs 7 (62) (64,308) – (64,370)Finance income
surplus on subordinated debt repurchase 17 – 4,248 – 4,248other 7 1,283 85,937 3,149 90,369
Unrealised exchange losses on borrowings – 5,428 – 5,428Share of profits of associates 12A 4,927 – – 4,927Segment surplus before tax (13,093) 107,980 22,958 117,845Tax charge (28,495)Surplus for the year 89,350Segment assets and liabilitiesInvestment in associates 5,220 – – 5,220Other assets 535,681 2,355,433 229,823 3,120,937Segment assets 540,901 2,355,433 229,823 3,126,157
Tax assets 2,264Total assets 3,128,421Segment liabilities (521,995) (982,941) (131,094) (1,636,030)Tax liabilities (2,632)Total liabilities (1,638,662)Other segment informationCapital expenditure 9/10 6,180 – 1,397 7,577Depreciation 10 5,765 – 173 5,938Amortisation of intangible assets 9 56 – 165 221Impairment of long-term assets 9/10 716 – – 716
Average number of UK employees (permanent and contract) 743 – 3 746Average number of overseas employees (permanent and contract) 130 – 33 163Average number of total employees (permanent and contract) 873 – 36 909
Average staff numbers shown above are on a full-time equivalent basis.

Lloyd’s
111W
elcome to Lloyd’s
Society reportM
arket resultsM
arket performance
Strategic overview
Annual Report 2011
3. Segmental analysis continued
(a) Information by business agent continued Note
2010Corporation
of Lloyd’s£000
2010Lloyd’s
Central Fund£000
2010Insuranceactivities
£000
2010Society
total£000
Segment incomeTotal income 3b 207,326 315,605 5,405 528,336Segment operating expenses Central Fund claims and provisions released 4 – 34,245 – 34,245Gross claims released – – 11,602 11,602Claims recoverable from reinsurers – – 4,864 4,864Other group operating expenses:Employment (including pension costs) 6 (89,842) – (2,622) (92,464)Premises (42,025) – (730) (42,755)Legal and professional 5 (17,599) (838) (398) (18,835)Systems and communications (27,485) – (435) (27,920)Other (26,841) (4,947) (721) (32,509)Total other group operating expenses (203,792) (5,785) (4,906) (214,483)Total segment operating expenses (203,792) 28,460 11,560 (163,772)Total segment operating surplus 3,534 344,065 16,965 364,564Finance costs 7 (27) (66,116) – (66,143)Finance income
surplus on subordinated debt repurchase 17 – 1,470 – 1,470other 7 1,040 127,907 2,489 131,436
Unrealised exchange losses on borrowings – 7,954 – 7,954Share of profits of associates 12A 5,084 – – 5,084Segment surplus before tax 9,631 415,280 19,454 444,365Tax charge (121,752)Surplus for the year 322,613Segment assets and liabilitiesInvestment in associates 6,325 – – 6,325Other assets 494,816 2,354,847 204,313 3,053,976Segment assets 501,141 2,354,847 204,313 3,060,301Tax assets –Total assets 3,060,301Segment liabilities (413,212) (1,007,487) (125,750) (1,546,449)Tax liabilities (67,246)Total liabilities (1,613,695)Other segment informationCapital expenditure 9/10 15,247 – 855 16,102Depreciation 10 5,489 – 379 5,868Amortisation of intangible assets 9 223 – 204 427Impairment of long-term assets 9/10 1,006 – – 1,006
Average number of UK employees (permanent and contract) 718 – 3 721Average number of overseas employees (permanent and contract) 123 – 24 147Average number of total employees (permanent and contract) 841 – 27 868
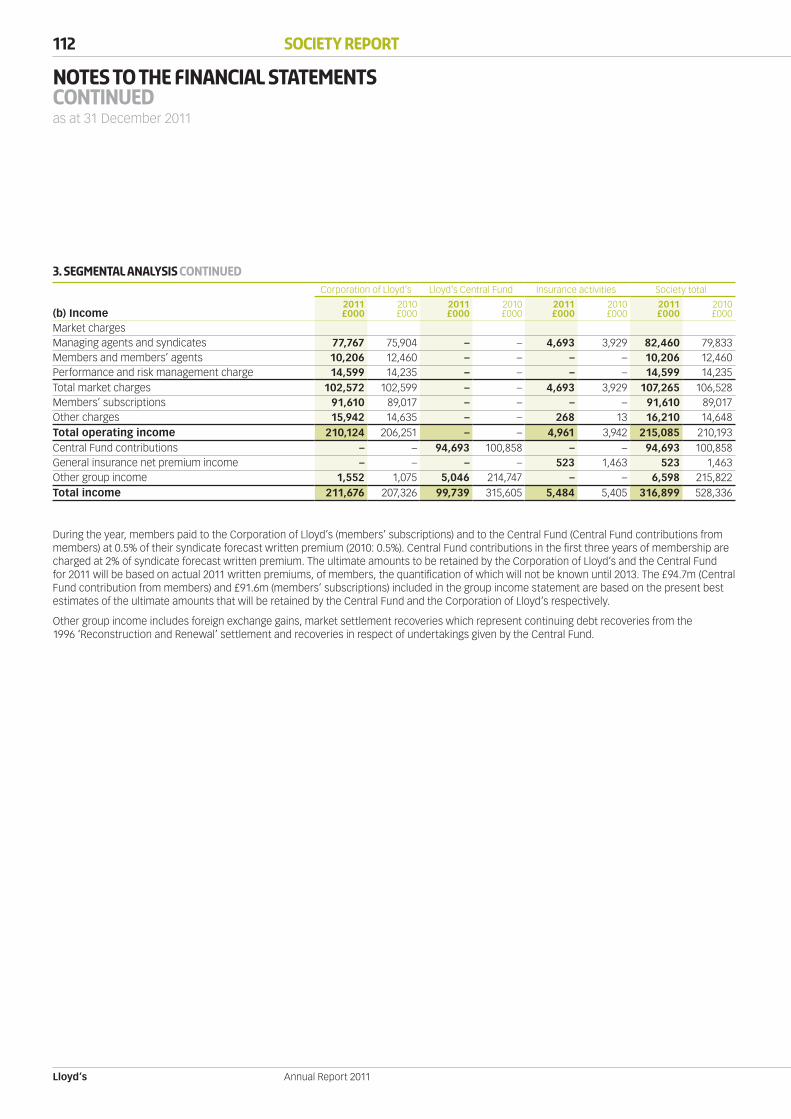
Lloyd’s
112 Society Report
Annual Report 2011
Notes to the financial statementsContinuedas at 31 December 2011
3. Segmental analysis continuedCorporation of Lloyd’s Lloyd’s Central Fund Insurance activities Society total
(b) Income2011£000
2010£000
2011£000
2010£000
2011£000
2010£000
2011£000
2010£000
Market chargesManaging agents and syndicates 77,767 75,904 – – 4,693 3,929 82,460 79,833Members and members’ agents 10,206 12,460 – – – – 10,206 12,460Performance and risk management charge 14,599 14,235 – – – – 14,599 14,235Total market charges 102,572 102,599 – – 4,693 3,929 107,265 106,528Members’ subscriptions 91,610 89,017 – – – – 91,610 89,017Other charges 15,942 14,635 – – 268 13 16,210 14,648Total operating income 210,124 206,251 – – 4,961 3,942 215,085 210,193Central Fund contributions – – 94,693 100,858 – – 94,693 100,858General insurance net premium income – – – – 523 1,463 523 1,463Other group income 1,552 1,075 5,046 214,747 – – 6,598 215,822Total income 211,676 207,326 99,739 315,605 5,484 5,405 316,899 528,336
During the year, members paid to the Corporation of Lloyd’s (members’ subscriptions) and to the Central Fund (Central Fund contributions from members) at 0.5% of their syndicate forecast written premium (2010: 0.5%). Central Fund contributions in the first three years of membership are charged at 2% of syndicate forecast written premium. The ultimate amounts to be retained by the Corporation of Lloyd’s and the Central Fund for 2011 will be based on actual 2011 written premiums, of members, the quantification of which will not be known until 2013. The £94.7m (Central Fund contribution from members) and £91.6m (members’ subscriptions) included in the group income statement are based on the present best estimates of the ultimate amounts that will be retained by the Central Fund and the Corporation of Lloyd’s respectively.
Other group income includes foreign exchange gains, market settlement recoveries which represent continuing debt recoveries from the 1996 ‘Reconstruction and Renewal’ settlement and recoveries in respect of undertakings given by the Central Fund.
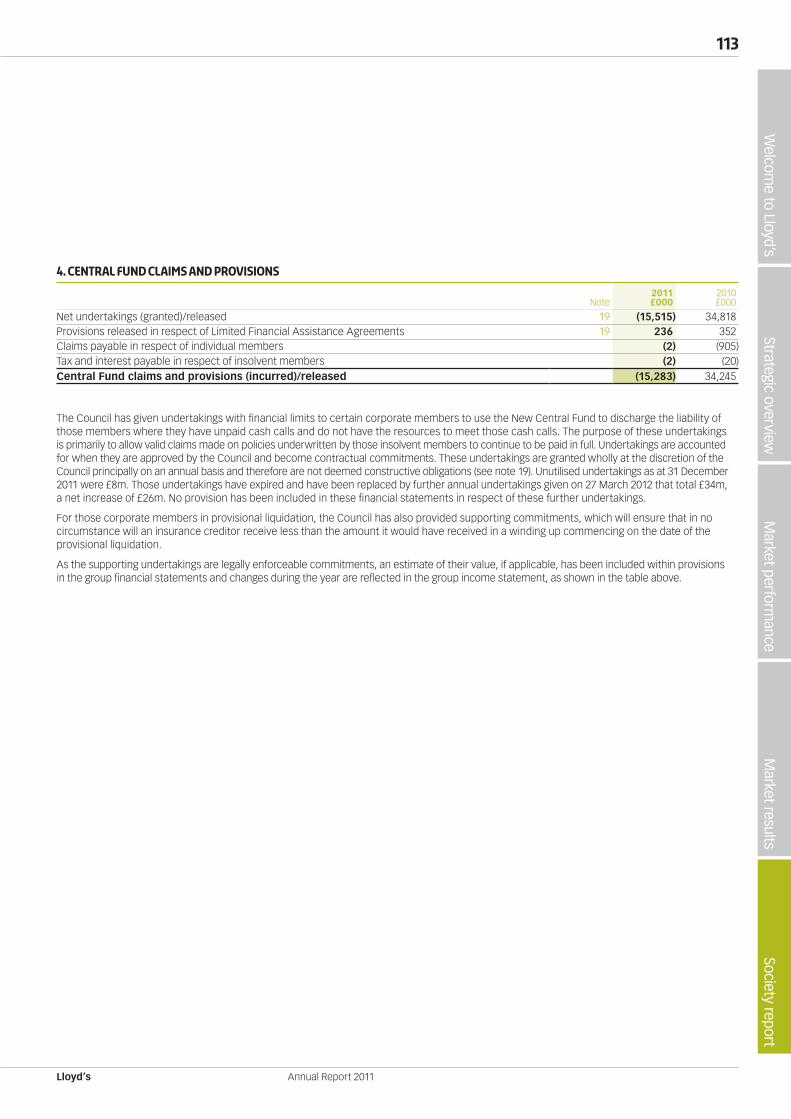
Lloyd’s
113W
elcome to Lloyd’s
Society reportM
arket resultsM
arket performance
Strategic overview
Annual Report 2011
4. Central fund claims and provisions
Note2011£000
2010£000
Net undertakings (granted)/released 19 (15,515) 34,818Provisions released in respect of Limited Financial Assistance Agreements 19 236 352Claims payable in respect of individual members (2) (905)Tax and interest payable in respect of insolvent members (2) (20)Central Fund claims and provisions (incurred)/released (15,283) 34,245
The Council has given undertakings with financial limits to certain corporate members to use the New Central Fund to discharge the liability of those members where they have unpaid cash calls and do not have the resources to meet those cash calls. The purpose of these undertakings is primarily to allow valid claims made on policies underwritten by those insolvent members to continue to be paid in full. Undertakings are accounted for when they are approved by the Council and become contractual commitments. These undertakings are granted wholly at the discretion of the Council principally on an annual basis and therefore are not deemed constructive obligations (see note 19). Unutilised undertakings as at 31 December 2011 were £8m. Those undertakings have expired and have been replaced by further annual undertakings given on 27 March 2012 that total £34m, a net increase of £26m. No provision has been included in these financial statements in respect of these further undertakings.
For those corporate members in provisional liquidation, the Council has also provided supporting commitments, which will ensure that in no circumstance will an insurance creditor receive less than the amount it would have received in a winding up commencing on the date of the provisional liquidation.
As the supporting undertakings are legally enforceable commitments, an estimate of their value, if applicable, has been included within provisions in the group financial statements and changes during the year are reflected in the group income statement, as shown in the table above.
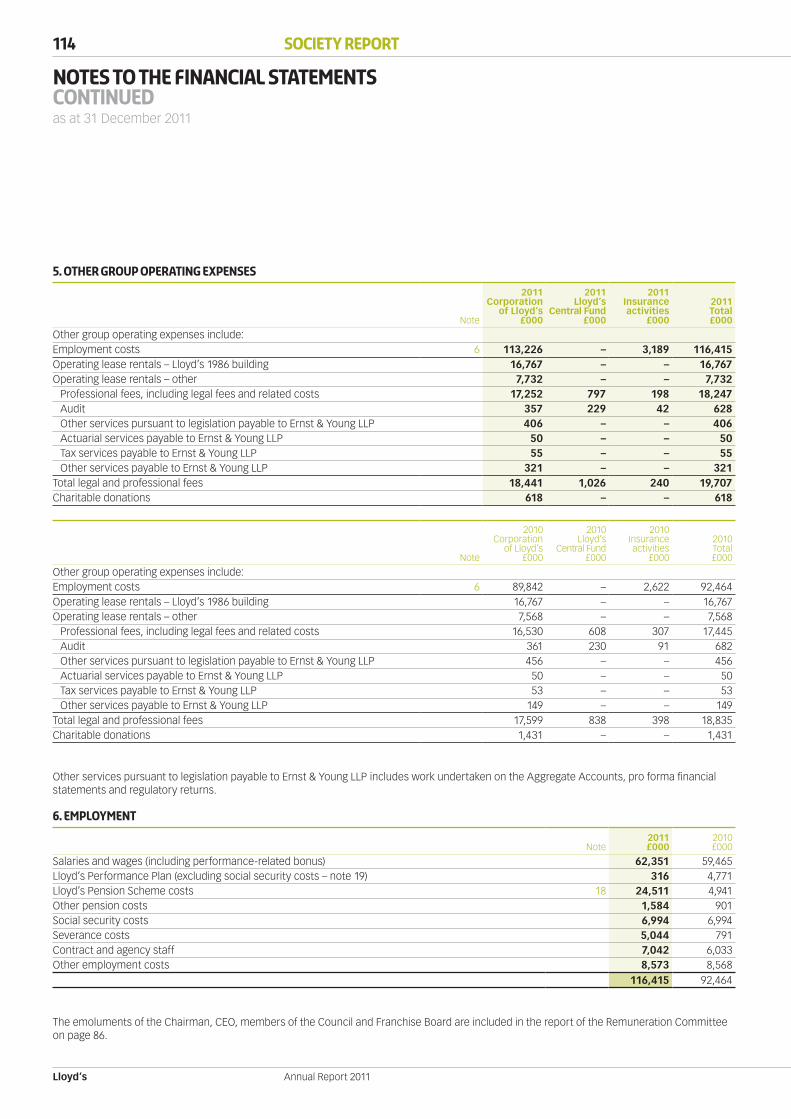
Lloyd’s
114 Society Report
Annual Report 2011
Notes to the financial statementsContinuedas at 31 December 2011
5. Other group operating expenses
Note
2011Corporation
of Lloyd’s£000
2011Lloyd’s
Central Fund£000
2011Insuranceactivities
£000
2011Total£000
Other group operating expenses include:Employment costs 6 113,226 – 3,189 116,415Operating lease rentals – Lloyd’s 1986 building 16,767 – – 16,767Operating lease rentals – other 7,732 – – 7,732
Professional fees, including legal fees and related costs 17,252 797 198 18,247Audit 357 229 42 628Other services pursuant to legislation payable to Ernst & Young LLP 406 – – 406Actuarial services payable to Ernst & Young LLP 50 – – 50Tax services payable to Ernst & Young LLP 55 – – 55Other services payable to Ernst & Young LLP 321 – – 321
Total legal and professional fees 18,441 1,026 240 19,707Charitable donations 618 – – 618
Note
2010Corporation
of Lloyd’s£000
2010Lloyd’s
Central Fund£000
2010Insuranceactivities
£000
2010Total£000
Other group operating expenses include:Employment costs 6 89,842 – 2,622 92,464Operating lease rentals – Lloyd’s 1986 building 16,767 – – 16,767Operating lease rentals – other 7,568 – – 7,568
Professional fees, including legal fees and related costs 16,530 608 307 17,445Audit 361 230 91 682Other services pursuant to legislation payable to Ernst & Young LLP 456 – – 456Actuarial services payable to Ernst & Young LLP 50 – – 50Tax services payable to Ernst & Young LLP 53 – – 53Other services payable to Ernst & Young LLP 149 – – 149
Total legal and professional fees 17,599 838 398 18,835Charitable donations 1,431 – – 1,431
Other services pursuant to legislation payable to Ernst & Young LLP includes work undertaken on the Aggregate Accounts, pro forma financial statements and regulatory returns.
6. Employment
Note2011£000
2010£000
Salaries and wages (including performance-related bonus) 62,351 59,465Lloyd’s Performance Plan (excluding social security costs – note 19) 316 4,771Lloyd’s Pension Scheme costs 18 24,511 4,941Other pension costs 1,584 901Social security costs 6,994 6,994Severance costs 5,044 791Contract and agency staff 7,042 6,033Other employment costs 8,573 8,568
116,415 92,464
The emoluments of the Chairman, CEO, members of the Council and Franchise Board are included in the report of the Remuneration Committee on page 86.
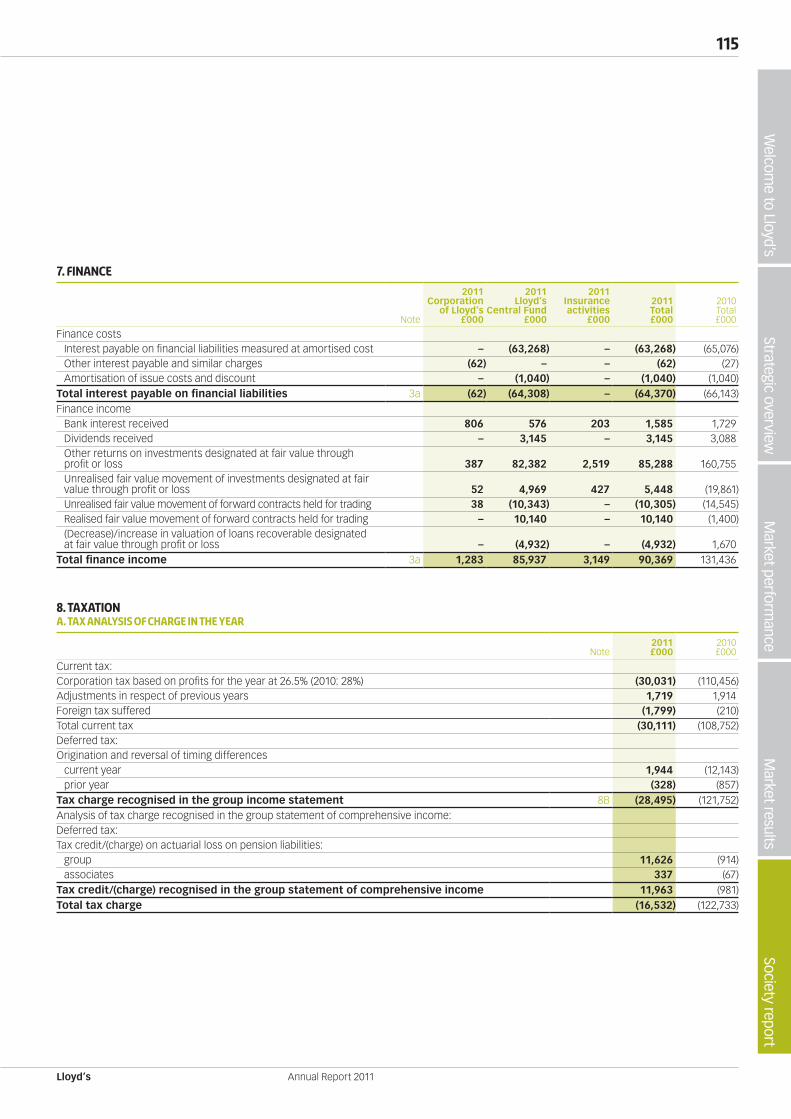
Lloyd’s
115W
elcome to Lloyd’s
Society reportM
arket resultsM
arket performance
Strategic overview
Annual Report 2011
7. Finance
Note
2011Corporation
of Lloyd’s£000
2011Lloyd’s
Central Fund£000
2011Insurance activities
£000
2011Total£000
2010Total£000
Finance costs Interest payable on financial liabilities measured at amortised cost – (63,268) – (63,268) (65,076)Other interest payable and similar charges (62) – – (62) (27)Amortisation of issue costs and discount – (1,040) – (1,040) (1,040)
Total interest payable on financial liabilities 3a (62) (64,308) – (64,370) (66,143)Finance income
Bank interest received 806 576 203 1,585 1,729Dividends received – 3,145 – 3,145 3,088 Other returns on investments designated at fair value through profit or loss 387 82,382 2,519 85,288 160,755 Unrealised fair value movement of investments designated at fair value through profit or loss 52 4,969 427 5,448 (19,861)Unrealised fair value movement of forward contracts held for trading 38 (10,343) – (10,305) (14,545)Realised fair value movement of forward contracts held for trading – 10,140 – 10,140 (1,400) (Decrease)/increase in valuation of loans recoverable designated at fair value through profit or loss – (4,932) – (4,932) 1,670
Total finance income 3a 1,283 85,937 3,149 90,369 131,436
8. TaxationA. Tax analysis of charge in the year
Note2011£000
2010£000
Current tax:Corporation tax based on profits for the year at 26.5% (2010: 28%) (30,031) (110,456)Adjustments in respect of previous years 1,719 1,914Foreign tax suffered (1,799) (210)Total current tax (30,111) (108,752)Deferred tax:Origination and reversal of timing differences
current year 1,944 (12,143)prior year (328) (857)
Tax charge recognised in the group income statement 8B (28,495) (121,752)Analysis of tax charge recognised in the group statement of comprehensive income:Deferred tax:Tax credit/(charge) on actuarial loss on pension liabilities:
group 11,626 (914)associates 337 (67)
Tax credit/(charge) recognised in the group statement of comprehensive income 11,963 (981)Total tax charge (16,532) (122,733)

Lloyd’s
116 Society Report
Annual Report 2011
Notes to the financial statementsContinuedas at 31 December 2011
8. Taxation continuedB. Reconciliation of effective Tax rate
Note2011
%2011£000
2010%
2010£000
Surplus on ordinary activities before tax 117,845 444,365Corporation tax at 26.5% (2010: 28%) 26.5% (31,229) 28.0% (124,422)Expenses not deductible for tax purposes 2.6% (3,112) 0.4% (1,760)Utilisation of tax credits (0.0%) 50 (0.0%) 61Overseas tax 0.7% (788) 0.0% (210)Other (1.4%) 1,700 (0.4%) 1,845Deferred tax adjustment relating to change in tax rate (3.0%) 3,494 (0.4%) 1,677Deferred tax prior year adjustments 0.3% (329) 0.2% (857)Adjustments in respect of previous years (1.5%) 1,719 (0.4%) 1,914Tax charge 8A 24.2% (28,495) 27.4% (121,752)
c. Deferred tax
2011Balance
at1 January
£000
2011Income
Statement£000
2011Equity
£000
2011Balance
at 31December
£000
Plant and equipment 5,496 (629) – 4,867Loans recoverable (5,808) 1,506 – (4,302)Financial investments (4,184) 1,654 – (2,530)Pension (assets)/liabilities (5,996) 290 11,626 5,920Other employee benefits 2,760 (1,444) – 1,316Other items (3,245) 238 – (3,007)
(10,977) 1,615 11,626 2,264
In 2011, there were no unrecognised deductible temporary differences (2010: nil).
The Finance Act 2011, enacted on 19 July 2011, included legislation to reduce the corporation tax rate to 26% from 1 April 2011, and then to 25% from 1 April 2012. This change was therefore substantively enacted at 31 December 2011 and has been reflected in the amounts recognised as at that date.
Further reductions are proposed to reduce the rate by an additional 1% down to 24% from April 2012, followed by further redcutions of 1% each year down to 22% in April 2014. These reductions were not substantively enacted at 31 December 2011 and therefore have not been reflected in the amounts recognised as at that date. It is estimated that these future changes will decrease the net deferred tax asset by £406k.
2010Balance
at1 January
£000
2010Income
Statement£000
2010Equity
£000
2010Balance
at 31December
£000
Plant and equipment 4,549 947 – 5,496Loans recoverable (7,228) 1,420 – (5,808)Financial investments (1,812) (2,372) – (4,184)Pension liabilities/(assets) 5,962 (11,044) (914) (5,996)Other employee benefits 3,428 (668) – 2,760Other items (1,962) (1,283) – (3,245)
2,937 (13,000) (914) (10,977)
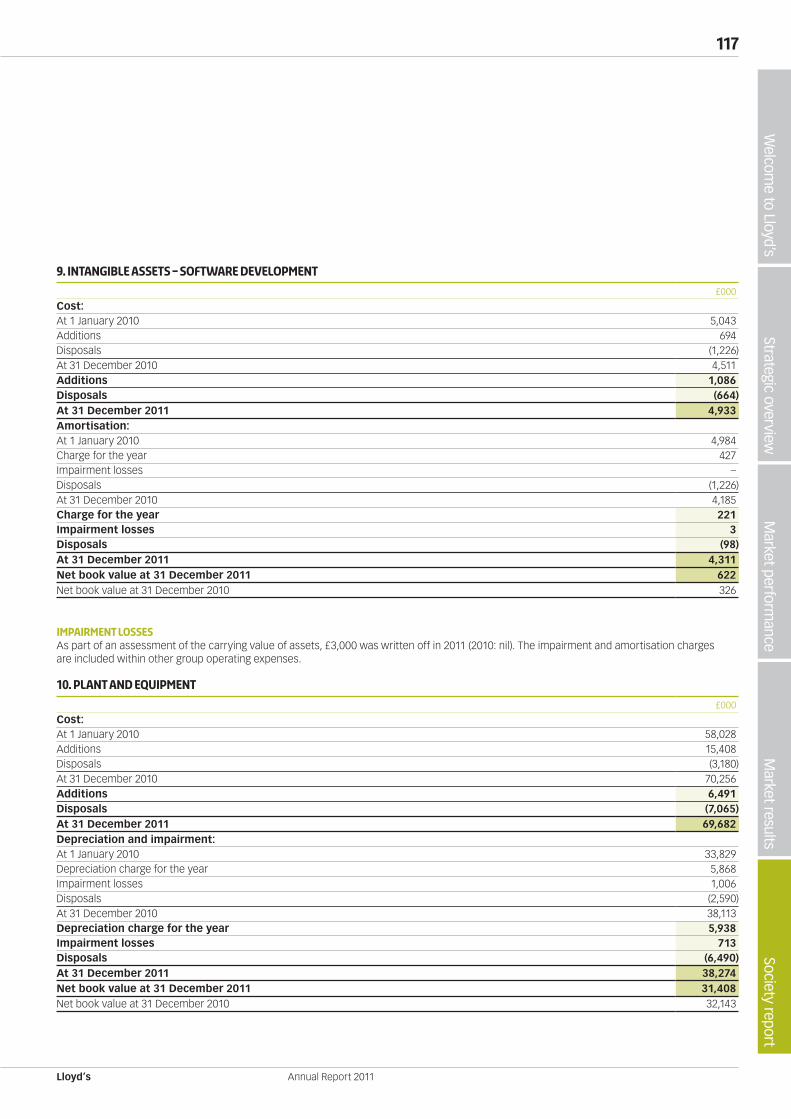
Lloyd’s
117W
elcome to Lloyd’s
Society reportM
arket resultsM
arket performance
Strategic overview
Annual Report 2011
9. Intangible assets – software development
£000
Cost:At 1 January 2010 5,043Additions 694Disposals (1,226)At 31 December 2010 4,511Additions 1,086Disposals (664)At 31 December 2011 4,933Amortisation:At 1 January 2010 4,984Charge for the year 427Impairment losses –Disposals (1,226)At 31 December 2010 4,185Charge for the year 221Impairment losses 3Disposals (98)At 31 December 2011 4,311Net book value at 31 December 2011 622Net book value at 31 December 2010 326
IMPAIRMENT LOSSESAs part of an assessment of the carrying value of assets, £3,000 was written off in 2011 (2010: nil). The impairment and amortisation charges are included within other group operating expenses.
10. Plant and equipment
£000
Cost:At 1 January 2010 58,028Additions 15,408Disposals (3,180)At 31 December 2010 70,256Additions 6,491Disposals (7,065)At 31 December 2011 69,682Depreciation and impairment:At 1 January 2010 33,829Depreciation charge for the year 5,868Impairment losses 1,006Disposals (2,590)At 31 December 2010 38,113Depreciation charge for the year 5,938Impairment losses 713Disposals (6,490)At 31 December 2011 38,274Net book value at 31 December 2011 31,408Net book value at 31 December 2010 32,143

Lloyd’s
118 Society Report
Annual Report 2011
Notes to the financial statementsContinuedas at 31 December 2011
10. Plant and equipment continuedIMPAIRMENT LOSSESImpairment reviews are undertaken annually in which assets within plant and other assets have their recoverable amounts reassessed. As part of this assessment of the carrying value of assets, £713,000 was written off in 2011 (2010: £1,006,000). The charge is included within other group operating expenses.
11. Investments in subsidiary undertakings and associates
Entity Nature of business Proportion of equity capital held
Principal subsidiary undertakings
Additional Securities LimitedProvision of deposits overseas on behalf of Lloyd’sunderwriters to comply with local insurance regulations 100%
Centrewrite Limited Authorised UK insurance company 100%Lioncover Insurance Company Limited Authorised UK insurance company 100%
Lloyd’s Insurance Company (China) LimitedAuthorised insurance company in China (incorporated in 2007 with a share capital of Rmb 200,000,000) 100%
Associates and Joint Venture
Ins-sure Holdings Limited
Provision of premiums and claims accounting and settlement, policy production and ancillary insurance services principally to the London insurance market 25%
Xchanging Claims Services Limited Provision of claims and recoveries services 50%
The Message Exchange LimitedProvision of messaging infrastructure to the London insurance market Limited by Guarantee 25%
The issued share capital of Ins-sure Holdings Limited is £4,000. There are three classes of shares. The Society holds 1,000,000 B shares of 0.1p each that have the right to participate in 25% of any profits available for distribution.
The issued share capital of Xchanging Claims Services Limited is £4,001. There are three classes of shares. The Society holds 1,000 A shares of £1 each and 2,001 C shares of £1 each. The A and C shares have the following rights with respect to dividends:
(a) The C shares carry a right to a fixed cumulative preference dividend of 5% calculated on the nominal capital and a variable participating dividend calculated by reference to trading profits.
(b) The A shares participate in 50% of any profits available for distribution after taking account of the dividend rights outlined above.
The Society entered into a joint venture agreement with three Lloyd’s Market associations namely International Underwriting Association; London and International Brokers’ Association; and Lloyd’s Market Association for an equal participation in The Message Exchange Limited (TMEL) which was incorporated on 27 August 2010.
TMEL operates The Exchange – a simple messaging hub provided to the London insurance market to support its efforts to extend the use of electronic processing of business. As a 31 December 2011, net assets of TMEL have no material impact on the Society accounts.
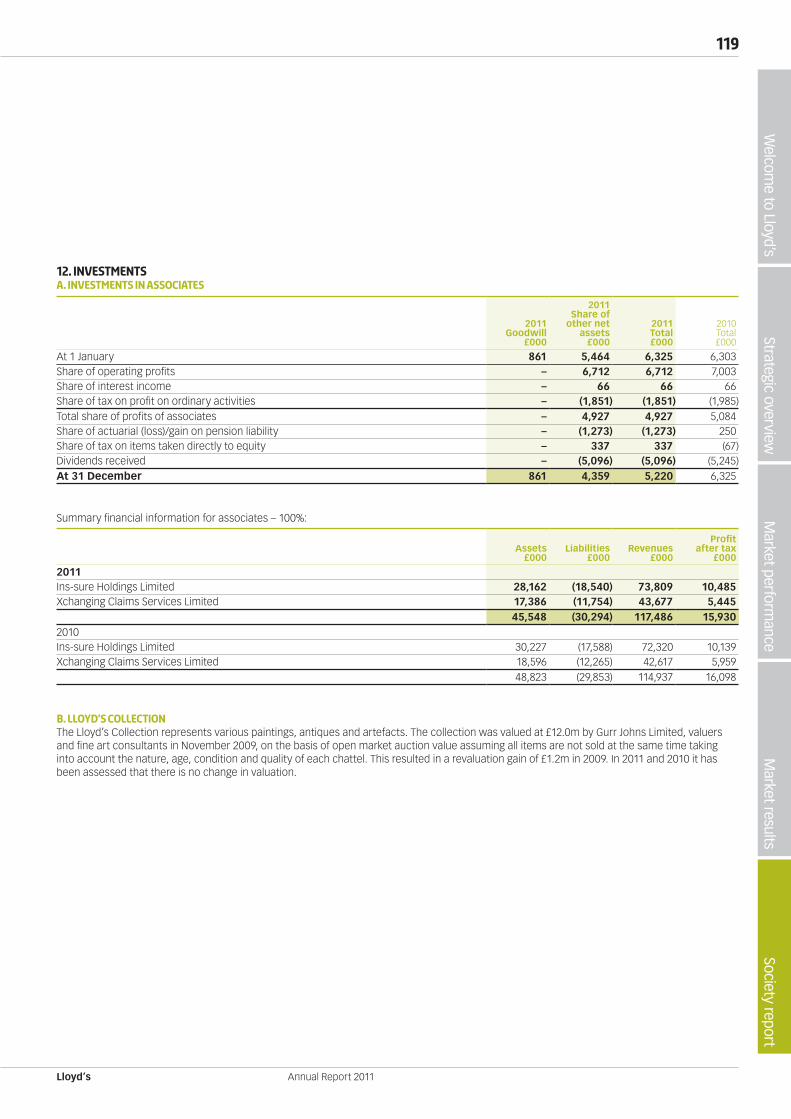
Lloyd’s
119W
elcome to Lloyd’s
Society reportM
arket resultsM
arket performance
Strategic overview
Annual Report 2011
12. InvestmentsA. Investments in associates
2011Goodwill
£000
2011Share of
other net assets
£000
2011Total£000
2010Total£000
At 1 January 861 5,464 6,325 6,303Share of operating profits – 6,712 6,712 7,003Share of interest income – 66 66 66Share of tax on profit on ordinary activities – (1,851) (1,851) (1,985)Total share of profits of associates – 4,927 4,927 5,084Share of actuarial (loss)/gain on pension liability – (1,273) (1,273) 250Share of tax on items taken directly to equity – 337 337 (67)Dividends received – (5,096) (5,096) (5,245)At 31 December 861 4,359 5,220 6,325
Summary financial information for associates – 100%:
Assets£000
Liabilities£000
Revenues£000
Profitafter tax
£000
2011Ins-sure Holdings Limited 28,162 (18,540) 73,809 10,485Xchanging Claims Services Limited 17,386 (11,754) 43,677 5,445
45,548 (30,294) 117,486 15,9302010Ins-sure Holdings Limited 30,227 (17,588) 72,320 10,139Xchanging Claims Services Limited 18,596 (12,265) 42,617 5,959 48,823 (29,853) 114,937 16,098
B. LLOYD’S COLLECTIONThe Lloyd’s Collection represents various paintings, antiques and artefacts. The collection was valued at £12.0m by Gurr Johns Limited, valuers and fine art consultants in November 2009, on the basis of open market auction value assuming all items are not sold at the same time taking into account the nature, age, condition and quality of each chattel. This resulted in a revaluation gain of £1.2m in 2009. In 2011 and 2010 it has been assessed that there is no change in valuation.
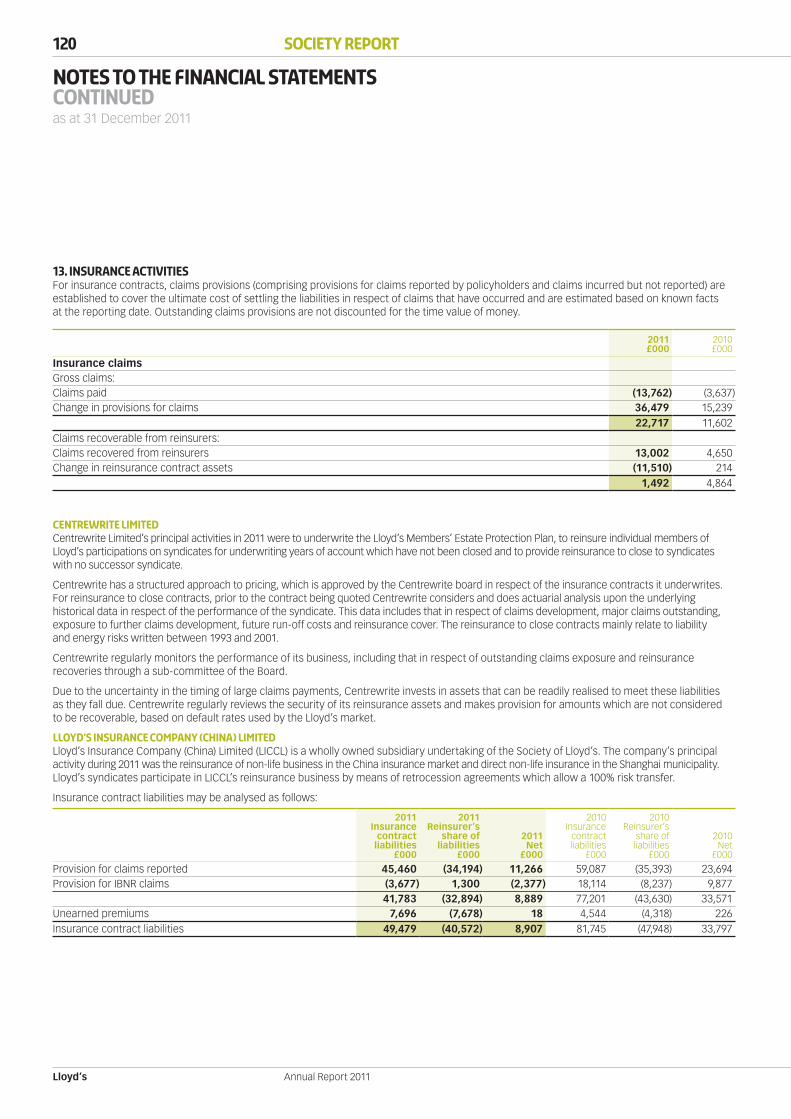
Lloyd’s
120 Society Report
Annual Report 2011
Notes to the financial statementsContinuedas at 31 December 2011
13. Insurance activitiesFor insurance contracts, claims provisions (comprising provisions for claims reported by policyholders and claims incurred but not reported) are established to cover the ultimate cost of settling the liabilities in respect of claims that have occurred and are estimated based on known facts at the reporting date. Outstanding claims provisions are not discounted for the time value of money.
2011£000
2010£000
Insurance claimsGross claims:Claims paid (13,762) (3,637)Change in provisions for claims 36,479 15,239
22,717 11,602Claims recoverable from reinsurers:Claims recovered from reinsurers 13,002 4,650Change in reinsurance contract assets (11,510) 214
1,492 4,864
centrewrite limitedCentrewrite Limited’s principal activities in 2011 were to underwrite the Lloyd’s Members’ Estate Protection Plan, to reinsure individual members of Lloyd’s participations on syndicates for underwriting years of account which have not been closed and to provide reinsurance to close to syndicates with no successor syndicate.
Centrewrite has a structured approach to pricing, which is approved by the Centrewrite board in respect of the insurance contracts it underwrites. For reinsurance to close contracts, prior to the contract being quoted Centrewrite considers and does actuarial analysis upon the underlying historical data in respect of the performance of the syndicate. This data includes that in respect of claims development, major claims outstanding, exposure to further claims development, future run-off costs and reinsurance cover. The reinsurance to close contracts mainly relate to liability and energy risks written between 1993 and 2001.
Centrewrite regularly monitors the performance of its business, including that in respect of outstanding claims exposure and reinsurance recoveries through a sub-committee of the Board.
Due to the uncertainty in the timing of large claims payments, Centrewrite invests in assets that can be readily realised to meet these liabilities as they fall due. Centrewrite regularly reviews the security of its reinsurance assets and makes provision for amounts which are not considered to be recoverable, based on default rates used by the Lloyd’s market.
Lloyd’s insurance company (china) limitedLloyd’s Insurance Company (China) Limited (LICCL) is a wholly owned subsidiary undertaking of the Society of Lloyd’s. The company’s principal activity during 2011 was the reinsurance of non-life business in the China insurance market and direct non-life insurance in the Shanghai municipality. Lloyd’s syndicates participate in LICCL’s reinsurance business by means of retrocession agreements which allow a 100% risk transfer.
Insurance contract liabilities may be analysed as follows:
2011Insurance
contractliabilities
£000
2011Reinsurer’s
share ofliabilities
£000
2011Net
£000
2010Insurance
contractliabilities
£000
2010Reinsurer’s
share ofliabilities
£000
2010Net
£000
Provision for claims reported 45,460 (34,194) 11,266 59,087 (35,393) 23,694Provision for IBNR claims (3,677) 1,300 (2,377) 18,114 (8,237) 9,877
41,783 (32,894) 8,889 77,201 (43,630) 33,571Unearned premiums 7,696 (7,678) 18 4,544 (4,318) 226Insurance contract liabilities 49,479 (40,572) 8,907 81,745 (47,948) 33,797
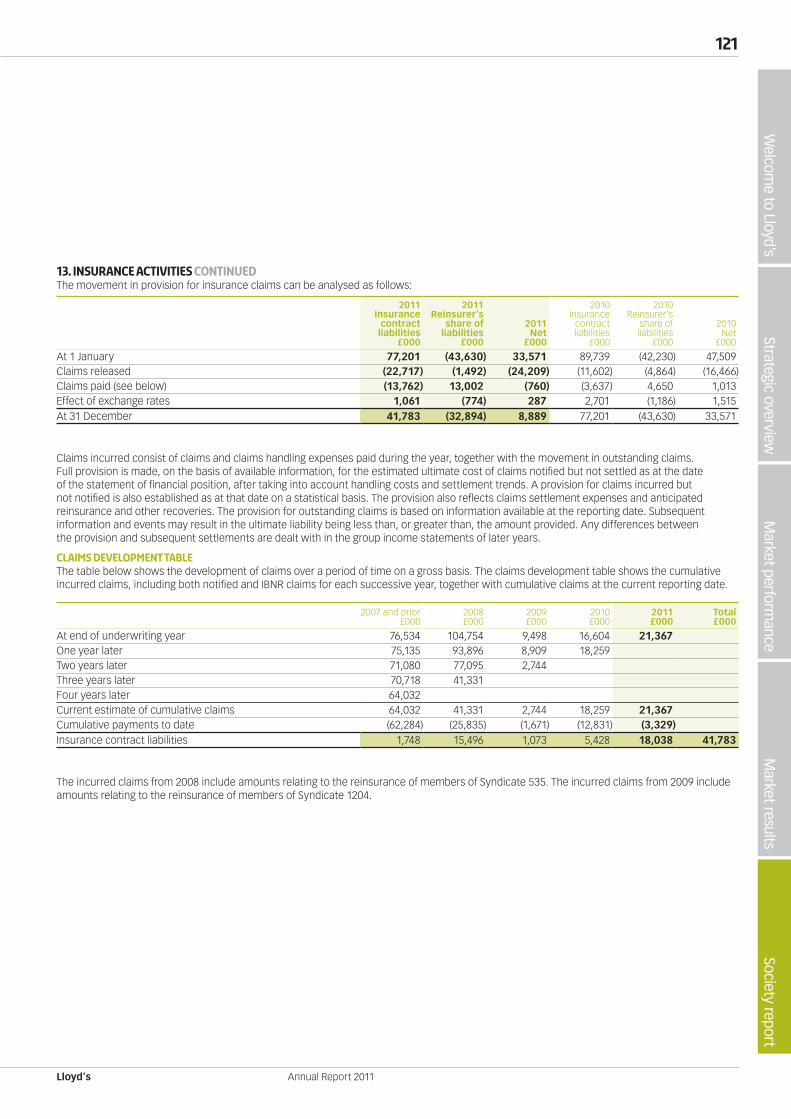
Lloyd’s
121W
elcome to Lloyd’s
Society reportM
arket resultsM
arket performance
Strategic overview
Annual Report 2011
13. Insurance activities continuedThe movement in provision for insurance claims can be analysed as follows:
2011Insurance
contractliabilities
£000
2011Reinsurer’s
share ofliabilities
£000
2011Net
£000
2010Insurance
contractliabilities
£000
2010Reinsurer’s
share ofliabilities
£000
2010Net
£000
At 1 January 77,201 (43,630) 33,571 89,739 (42,230) 47,509Claims released (22,717) (1,492) (24,209) (11,602) (4,864) (16,466)Claims paid (see below) (13,762) 13,002 (760) (3,637) 4,650 1,013Effect of exchange rates 1,061 (774) 287 2,701 (1,186) 1,515At 31 December 41,783 (32,894) 8,889 77,201 (43,630) 33,571
Claims incurred consist of claims and claims handling expenses paid during the year, together with the movement in outstanding claims. Full provision is made, on the basis of available information, for the estimated ultimate cost of claims notified but not settled as at the date of the statement of financial position, after taking into account handling costs and settlement trends. A provision for claims incurred but not notified is also established as at that date on a statistical basis. The provision also reflects claims settlement expenses and anticipated reinsurance and other recoveries. The provision for outstanding claims is based on information available at the reporting date. Subsequent information and events may result in the ultimate liability being less than, or greater than, the amount provided. Any differences between the provision and subsequent settlements are dealt with in the group income statements of later years.
CLAIMS DEVELOPMENT TABLEThe table below shows the development of claims over a period of time on a gross basis. The claims development table shows the cumulative incurred claims, including both notified and IBNR claims for each successive year, together with cumulative claims at the current reporting date.
2007 and prior£000
2008£000
2009£000
2010£000
2011£000
Total£000
At end of underwriting year 76,534 104,754 9,498 16,604 21,367One year later 75,135 93,896 8,909 18,259Two years later 71,080 77,095 2,744Three years later 70,718 41,331Four years later 64,032Current estimate of cumulative claims 64,032 41,331 2,744 18,259 21,367Cumulative payments to date (62,284) (25,835) (1,671) (12,831) (3,329)Insurance contract liabilities 1,748 15,496 1,073 5,428 18,038 41,783
The incurred claims from 2008 include amounts relating to the reinsurance of members of Syndicate 535. The incurred claims from 2009 include amounts relating to the reinsurance of members of Syndicate 1204.

Lloyd’s
122 Society Report
Annual Report 2011
Notes to the financial statementsContinuedas at 31 December 2011
14. Loans recoverable
2011£000
2010£000
At 1 January 54,371 54,614Recoveries during the year (3,483) (1,913)Fair value movements recognised during the year (4,932) 1,670At 31 December 45,956 54,371
None of the change in valuation of loans recoverable during 2011 or 2010 relates to changes in credit risk. The Society’s loans recoverable are categorised as fair value Level 3 for disclosure purposes. All fair value movements are recognised as finance income or finance costs in the group income statement and relate solely to the revaluation of hardship and LFAA assets.
15. FINANCIAL INVESTMENTS
Note2011£000
2010£000
Statutory insurance deposits 15A 361,817 311,756Other investments 15B 2,322,468 2,236,884
2,684,285 2,548,640
A. STATUTORY INSURANCE DEPOSITS
2011Securities
£000
2011Deposits
£000
2011Total£000
2010Total£000
Market value at 1 January 146,416 165,340 311,756 175,248Additions at cost 478,952 287,342 766,294 547,235Disposal proceeds (499,288) (224,986) (724,274) (430,158)Surplus on the sale and revaluation of investments 5,936 2,105 8,041 19,431Market value at 31 December 132,016 229,801 361,817 311,756
Analysis of securities at year end:
2011Cost£000
2011Valuation
£000
2010Cost£000
2010Valuation
£000
Government 135,383 132,016 136,468 144,700Corporate securities (see below) – – 1,127 1,716Market value at 31 December 135,383 132,016 137,595 146,416
Analysis of corporate securities:AAA – 1,716AA – –
– 1,716
Finance is arranged by advances from syndicates in the Lloyd’s market. These advances are renewed annually. By agreement with the lenders, investment returns earned on these assets are paid, in appropriate proportions, to the lenders. In this way, the Society avoids any risk arising from a mismatch between borrowing and lending terms. Book cost is stated at historical exchange rates, market value is quoted at year end exchange rates.
The provision of funds by members in respect of the establishment and maintenance of overseas deposits is a condition of permission to underwrite insurance business at Lloyd’s.
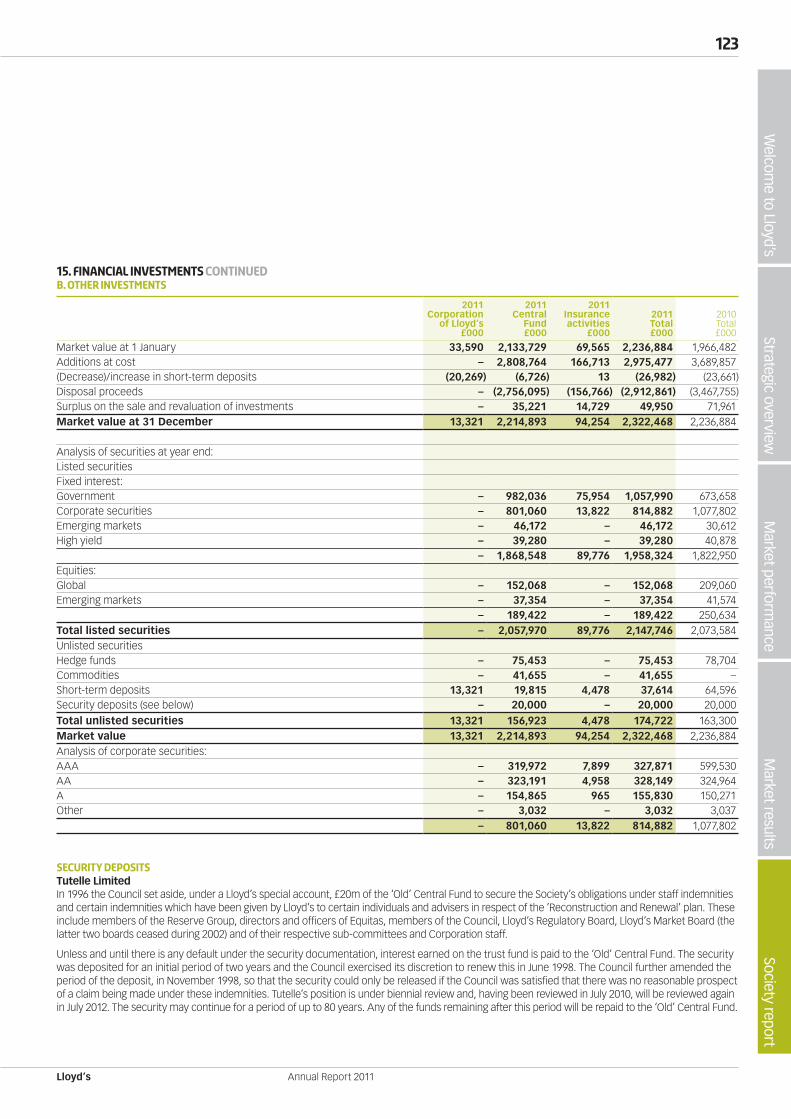
Lloyd’s
123W
elcome to Lloyd’s
Society reportM
arket resultsM
arket performance
Strategic overview
Annual Report 2011
15. FINANCIAL INVESTMENTS continuedB. Other investments
2011Corporation
of Lloyd’s£000
2011 Central
Fund£000
2011Insuranceactivities
£000
2011Total£000
2010Total£000
Market value at 1 January 33,590 2,133,729 69,565 2,236,884 1,966,482Additions at cost – 2,808,764 166,713 2,975,477 3,689,857(Decrease)/increase in short-term deposits (20,269) (6,726) 13 (26,982) (23,661)Disposal proceeds – (2,756,095) (156,766) (2,912,861) (3,467,755)Surplus on the sale and revaluation of investments – 35,221 14,729 49,950 71,961Market value at 31 December 13,321 2,214,893 94,254 2,322,468 2,236,884
Analysis of securities at year end:Listed securitiesFixed interest:Government – 982,036 75,954 1,057,990 673,658Corporate securities – 801,060 13,822 814,882 1,077,802Emerging markets – 46,172 – 46,172 30,612High yield – 39,280 – 39,280 40,878
– 1,868,548 89,776 1,958,324 1,822,950Equities:Global – 152,068 – 152,068 209,060Emerging markets – 37,354 – 37,354 41,574
– 189,422 – 189,422 250,634Total listed securities – 2,057,970 89,776 2,147,746 2,073,584Unlisted securitiesHedge funds – 75,453 – 75,453 78,704Commodities – 41,655 – 41,655 –Short-term deposits 13,321 19,815 4,478 37,614 64,596Security deposits (see below) – 20,000 – 20,000 20,000
Total unlisted securities 13,321 156,923 4,478 174,722 163,300Market value 13,321 2,214,893 94,254 2,322,468 2,236,884Analysis of corporate securities:AAA – 319,972 7,899 327,871 599,530AA – 323,191 4,958 328,149 324,964A – 154,865 965 155,830 150,271Other – 3,032 – 3,032 3,037
– 801,060 13,822 814,882 1,077,802
SECURITY DEPOSITSTutelle LimitedIn 1996 the Council set aside, under a Lloyd’s special account, £20m of the ‘Old’ Central Fund to secure the Society’s obligations under staff indemnities and certain indemnities which have been given by Lloyd’s to certain individuals and advisers in respect of the ’Reconstruction and Renewal’ plan. These include members of the Reserve Group, directors and officers of Equitas, members of the Council, Lloyd’s Regulatory Board, Lloyd’s Market Board (the latter two boards ceased during 2002) and of their respective sub-committees and Corporation staff.
Unless and until there is any default under the security documentation, interest earned on the trust fund is paid to the ‘Old’ Central Fund. The security was deposited for an initial period of two years and the Council exercised its discretion to renew this in June 1998. The Council further amended the period of the deposit, in November 1998, so that the security could only be released if the Council was satisfied that there was no reasonable prospect of a claim being made under these indemnities. Tutelle’s position is under biennial review and, having been reviewed in July 2010, will be reviewed again in July 2012. The security may continue for a period of up to 80 years. Any of the funds remaining after this period will be repaid to the ‘Old’ Central Fund.
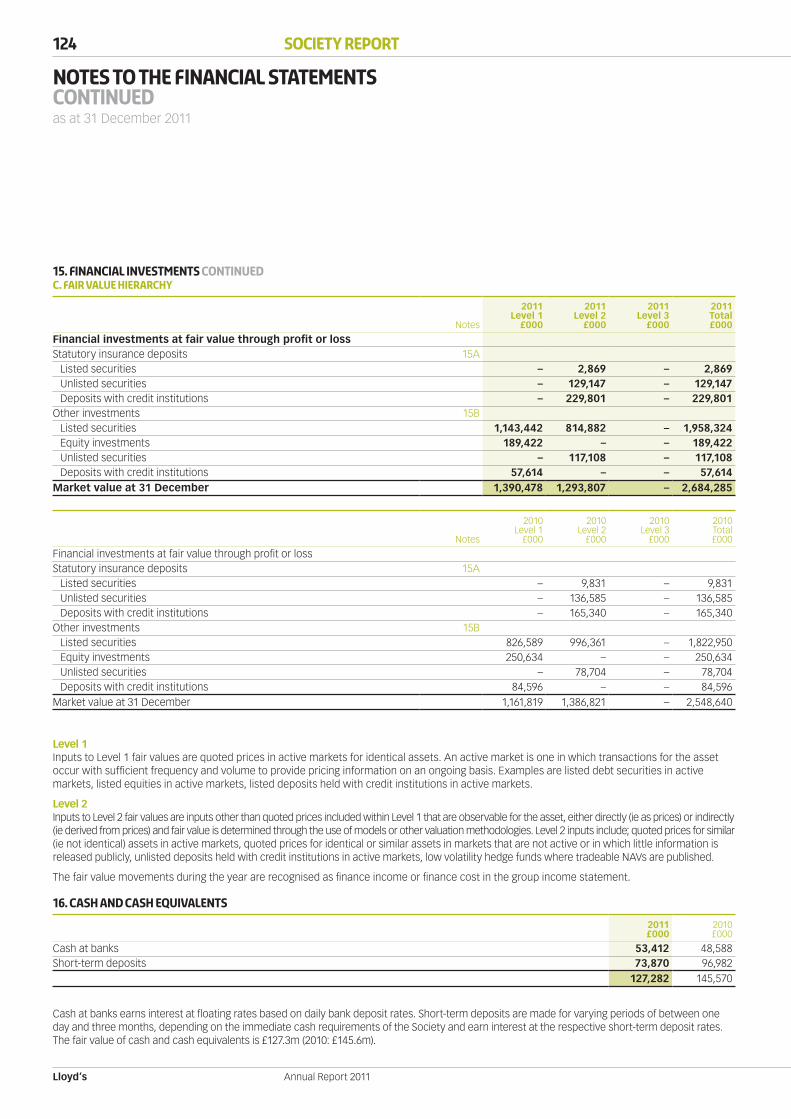
Lloyd’s
124 Society Report
Annual Report 2011
Notes to the financial statementsContinuedas at 31 December 2011
15. FINANCIAL INVESTMENTS continuedc. Fair value hierarchy
Notes
2011Level 1
£000
2011 Level 2
£000
2011Level 3
£000
2011Total£000
Financial investments at fair value through profit or lossStatutory insurance deposits 15A
Listed securities – 2,869 – 2,869Unlisted securities – 129,147 – 129,147Deposits with credit institutions – 229,801 – 229,801
Other investments 15BListed securities 1,143,442 814,882 – 1,958,324Equity investments 189,422 – – 189,422Unlisted securities – 117,108 – 117,108Deposits with credit institutions 57,614 – – 57,614
Market value at 31 December 1,390,478 1,293,807 – 2,684,285
Notes
2010Level 1
£000
2010 Level 2
£000
2010Level 3
£000
2010Total£000
Financial investments at fair value through profit or lossStatutory insurance deposits 15A
Listed securities – 9,831 – 9,831Unlisted securities – 136,585 – 136,585Deposits with credit institutions – 165,340 – 165,340
Other investments 15BListed securities 826,589 996,361 – 1,822,950Equity investments 250,634 – – 250,634Unlisted securities – 78,704 – 78,704Deposits with credit institutions 84,596 – – 84,596
Market value at 31 December 1,161,819 1,386,821 – 2,548,640
Level 1 Inputs to Level 1 fair values are quoted prices in active markets for identical assets. An active market is one in which transactions for the asset occur with sufficient frequency and volume to provide pricing information on an ongoing basis. Examples are listed debt securities in active markets, listed equities in active markets, listed deposits held with credit institutions in active markets.
Level 2 Inputs to Level 2 fair values are inputs other than quoted prices included within Level 1 that are observable for the asset, either directly (ie as prices) or indirectly (ie derived from prices) and fair value is determined through the use of models or other valuation methodologies. Level 2 inputs include; quoted prices for similar (ie not identical) assets in active markets, quoted prices for identical or similar assets in markets that are not active or in which little information is released publicly, unlisted deposits held with credit institutions in active markets, low volatility hedge funds where tradeable NAVs are published.
The fair value movements during the year are recognised as finance income or finance cost in the group income statement.
16. CASH AND CASH EQUIVALENTS
2011£000
2010£000
Cash at banks 53,412 48,588Short-term deposits 73,870 96,982
127,282 145,570
Cash at banks earns interest at floating rates based on daily bank deposit rates. Short-term deposits are made for varying periods of between one day and three months, depending on the immediate cash requirements of the Society and earn interest at the respective short-term deposit rates. The fair value of cash and cash equivalents is £127.3m (2010: £145.6m).

Lloyd’s
125W
elcome to Lloyd’s
Society reportM
arket resultsM
arket performance
Strategic overview
Annual Report 2011
17. SUBORDINATED NOTES AND PERPETUAL SUBORDINATED CAPITAL SECURITIES
2011£000
2010£000
Details of loans payable wholly or partly after more than five years:6.875% subordinated notes of £300m maturing 17 November 2025 300,000 300,0005.625% subordinated notes of €253m maturing 17 November 2024 211,063 216,5077.421% perpetual subordinated capital securities of £392m redeemable on 21 June 2017 392,013 419,381
903,076 935,888Less issue costs to be charged in future years (3,880) (4,690)Less discount on issue to be unwound in future years (780) (1,025)
898,416 930,173
SUBORDINATED DEBT ISSUED IN 2004The Sterling Notes mature on 17 November 2025, although the Society may redeem them on 17 November 2015 and 17 November 2020. In the event that the Society does not redeem the Sterling Notes on 17 November 2015, the rate of interest payable will be the rate per annum which is the aggregate of the Gross Redemption Yield on the relevant Benchmark Gilt (a UK government security having a maturity date on or nearest to the next reset date) plus a margin of 3.07%.
The Euro Notes mature on 17 November 2024, although the Society may redeem them on 17 November 2014 or on any interest payment date thereafter.
In the event that the Society does not redeem the Euro Notes on 17 November 2014, the rate of interest payable will be three month Euribor plus a margin of 2.72%.
The Notes are subordinated obligations of the Society. Each tranche of the Notes will rank pari passu with the other in a winding-up of the Society. Upon the occurrence of any winding-up proceedings of the Society, payments on the Notes will be subordinated in right of payment to the prior payment in full of all other liabilities of the Society, except for liabilities which rank equally with or junior to the Notes. Payments on the Notes will also be subordinated to certain payments which may be made out of central assets including payments made to discharge the liabilities of an insolvent member to any person (including any policyholders) arising out of or, in connection with insurance business carried on at Lloyd’s by that insolvent member and payments made in respect of the costs required by or under any insolvency procedure to which the Society or the Lloyd’s market may be subject. However, in the event of a winding-up of the Society, the claims of the holders of the Notes rank senior to the distribution of any central assets to members of Lloyd’s generally (other than payments made to members in their capacity as senior creditors of the Society).
SUBORDINATED DEBT ISSUED IN 2007The perpetual subordinated capital securities (‘capital securities’) are perpetual securities and have no fixed redemption date. However, they are redeemable in whole on 21 June 2017 at the option of the Society or on any interest payment date thereafter provided certain conditions have been met by the Society. The capital securities bear interest at a rate of 7.421% per annum until 20 June 2017, payable annually in arrears on 21 June in each year, and thereafter at a rate per annum reset semi-annually of 2.41% per annum above the London interbank offered rate for six-month sterling deposits, payable semi-annually in arrears on the interest payment dates falling on 21 June and 21 December in each year.
The capital securities are subordinated obligations of the Society. Upon the occurrence of any winding-up proceedings of the Society, the claims of the holders of the capital securities will rank junior to all other claims of creditors of the Society (including any creditor who is the holder of any of the Sterling or Euro Notes issued by the Society in 2004) except for those creditors having claims which rank equally with or junior to the claims of the holders of the capital securities. The claims of the holders of the capital securities will also rank junior to any payments made to discharge the liabilities of a member in connection with insurance business carried on at Lloyd’s by that member and also to the claims of any person in respect of whom a New Central Fund undertaking has been made. However, in the event of a winding-up of the Society, the claims of the holders of the capital securities rank senior to the distribution of any central assets to members of Lloyd’s generally (other than payments made to members in their capacity as senior creditors of the Society).
Subordinated debt repurchasesDuring 2011, the Society of Lloyd’s repurchased a principal amount of £27,368,000 of its 2007 perpetual subordinated capital securities at a cost of £23,120,000. The Society additionally paid accrued interest on the purchased securities. The profit on the repurchase was £4,248,000.
During 2010, The Society of Lloyd’s repurchased £20,988,000 of its outstanding debt securities at a cost of £19,518,000. The Society additionally paid accrued interest on the purchased securities. The profit on the repurchase was £1,469,800.

Lloyd’s
126 Society Report
Annual Report 2011
Notes to the financial statementsContinuedas at 31 December 2011
18. PENSION SCHEMES The Society operates a number of defined benefit and defined contribution pension schemes. The principal scheme is the Lloyd’s Pension Scheme which is a defined benefit scheme. Other schemes have been established for certain employees based overseas.
These schemes are generally funded by the payment of contributions to separately administered funds.
DEFINED BENEFIT PLANSThe pension surplus/(deficits) of the schemes at 31 December 2011 are as follows:
2011£000
2010£000
Schemes in surplus:Lloyd’s Pension Scheme – 25,913
Overseas pension schemes 9 829 25,995
Schemes in deficit:Lloyd’s Pension Scheme (23,679) –Overseas pension schemes (1,337) (858)
(25,016) (858)
The amounts charged to the group income statement and group statement of comprehensive income, in respect of defined benefit plans are as follows:
2011£000
2010£000
Group income statement:Lloyd’s Pension Scheme 24,511 4,941Overseas pension schemes 1,584 901
26,095 5,842Group statement of comprehensive income:Lloyd’s Pension Scheme 56,671 1,271Overseas pension schemes 216 71
56,887 1,342
Lloyd’s Pension Scheme The Lloyd’s Pension Scheme is a defined benefit pension scheme with assets held in a separately administered fund. For the purposes of determining the funding position of the scheme and future contributions, a formal actuarial valuation of the scheme was carried out by Towers Watson, actuaries and consultants, as at 30 June 2010 using the projected unit credit method. The principal actuarial assumptions adopted in the valuation were:
> Assumed future price inflation of 3.5% per annum. > Pensions would increase in payment at 3.5% per annum (relating to benefits accrued between 6 April 1997 and 5 April 2005) or 2.5%
per annum (benefits accrued post 5 April 2005). > Total pensionable remuneration would increase by 4.5% per annum. > The rate of return on investments held at the valuation date and on future contributions receivable after the valuation date was assumed
to be 6.8% per annum for periods before benefits come into payment and 4.7% per annum for periods after benefits come into payment. > Mortality assumptions were based on 110% of SAPS light tables for males/105% SAPS light tables for females, with allowance for future
improvements in line with CMI 2009 core projects with a trend improvement of 1.5% per annum. > An allowance was made for commutation at retirement, assuming 20% of member pension commuted at retirement, on terms mid-way
between current actual terms and ‘cost neutral’ on TP basis.
The next formal actuarial valuation will be carried out as at 30 June 2013.
The total market value of the scheme’s assets at the date of valuation was £418m, and the total value of accrued liabilities was £488.3m showing a shortfall of £70.3m. These figures exclude both liabilities and the related assets in respect of money purchase AVCs. To eliminate the funding shortfall, the Trustees have agreed a Recovery Plan with Lloyd’s. Lloyd’s paid additional contributions of £45m to the Scheme in December 2010, and will make fixed additional monthly contributions from July 2014 to June 2020 inclusive to eliminate the remaining deficit.
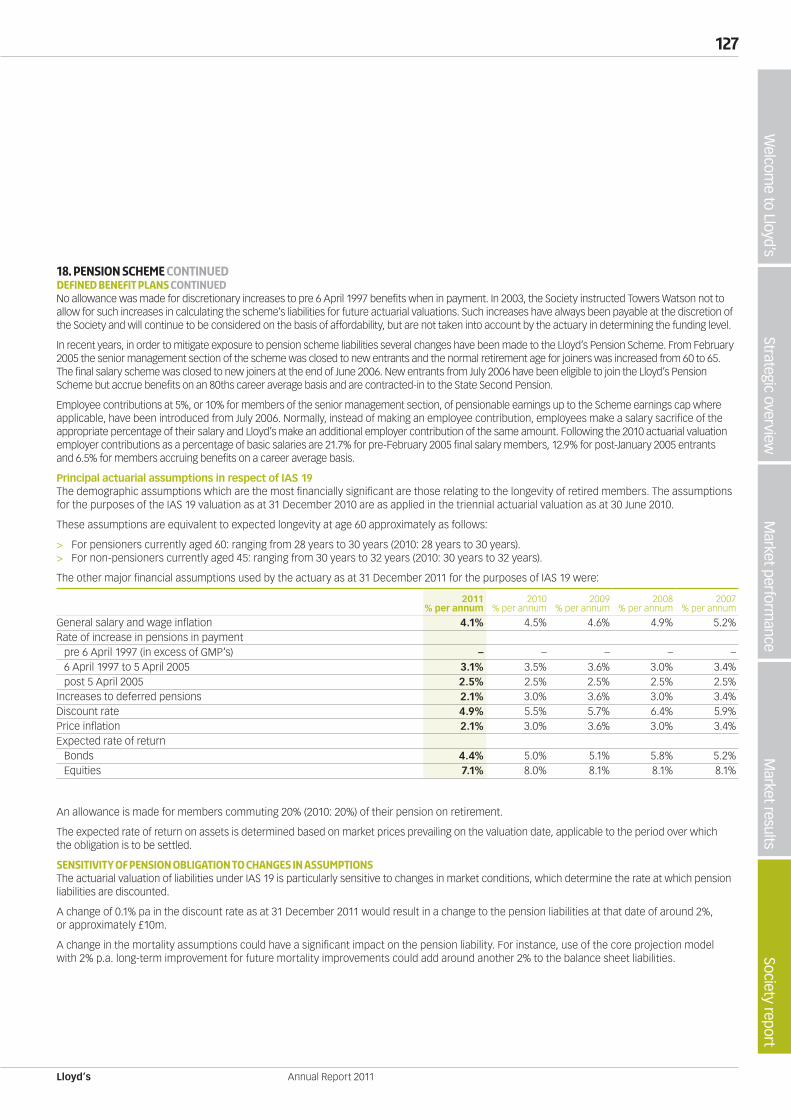
Lloyd’s
127W
elcome to Lloyd’s
Society reportM
arket resultsM
arket performance
Strategic overview
Annual Report 2011
18. PENSION SCHEME ContinuedDEFINED BENEFIT PLANS continued No allowance was made for discretionary increases to pre 6 April 1997 benefits when in payment. In 2003, the Society instructed Towers Watson not to allow for such increases in calculating the scheme’s liabilities for future actuarial valuations. Such increases have always been payable at the discretion of the Society and will continue to be considered on the basis of affordability, but are not taken into account by the actuary in determining the funding level.
In recent years, in order to mitigate exposure to pension scheme liabilities several changes have been made to the Lloyd’s Pension Scheme. From February 2005 the senior management section of the scheme was closed to new entrants and the normal retirement age for joiners was increased from 60 to 65. The final salary scheme was closed to new joiners at the end of June 2006. New entrants from July 2006 have been eligible to join the Lloyd’s Pension Scheme but accrue benefits on an 80ths career average basis and are contracted-in to the State Second Pension.
Employee contributions at 5%, or 10% for members of the senior management section, of pensionable earnings up to the Scheme earnings cap where applicable, have been introduced from July 2006. Normally, instead of making an employee contribution, employees make a salary sacrifice of the appropriate percentage of their salary and Lloyd’s make an additional employer contribution of the same amount. Following the 2010 actuarial valuation employer contributions as a percentage of basic salaries are 21.7% for pre-February 2005 final salary members, 12.9% for post-January 2005 entrants and 6.5% for members accruing benefits on a career average basis.
Principal actuarial assumptions in respect of IAS 19 The demographic assumptions which are the most financially significant are those relating to the longevity of retired members. The assumptions for the purposes of the IAS 19 valuation as at 31 December 2010 are as applied in the triennial actuarial valuation as at 30 June 2010.
These assumptions are equivalent to expected longevity at age 60 approximately as follows:
> For pensioners currently aged 60: ranging from 28 years to 30 years (2010: 28 years to 30 years). > For non-pensioners currently aged 45: ranging from 30 years to 32 years (2010: 30 years to 32 years).
The other major financial assumptions used by the actuary as at 31 December 2011 for the purposes of IAS 19 were:
2011% per annum
2010% per annum
2009% per annum
2008% per annum
2007% per annum
General salary and wage inflation 4.1% 4.5% 4.6% 4.9% 5.2%Rate of increase in pensions in payment
pre 6 April 1997 (in excess of GMP’s) – – – – –6 April 1997 to 5 April 2005 3.1% 3.5% 3.6% 3.0% 3.4%post 5 April 2005 2.5% 2.5% 2.5% 2.5% 2.5%
Increases to deferred pensions 2.1% 3.0% 3.6% 3.0% 3.4%Discount rate 4.9% 5.5% 5.7% 6.4% 5.9%Price inflation 2.1% 3.0% 3.6% 3.0% 3.4%Expected rate of return
Bonds 4.4% 5.0% 5.1% 5.8% 5.2%Equities 7.1% 8.0% 8.1% 8.1% 8.1%
An allowance is made for members commuting 20% (2010: 20%) of their pension on retirement.
The expected rate of return on assets is determined based on market prices prevailing on the valuation date, applicable to the period over which the obligation is to be settled.
SENSITIVITY OF PENSION OBLIGATION TO CHANGES IN ASSUMPTIONSThe actuarial valuation of liabilities under IAS 19 is particularly sensitive to changes in market conditions, which determine the rate at which pension liabilities are discounted.
A change of 0.1% pa in the discount rate as at 31 December 2011 would result in a change to the pension liabilities at that date of around 2%, or approximately £10m.
A change in the mortality assumptions could have a significant impact on the pension liability. For instance, use of the core projection model with 2% p.a. long-term improvement for future mortality improvements could add around another 2% to the balance sheet liabilities.
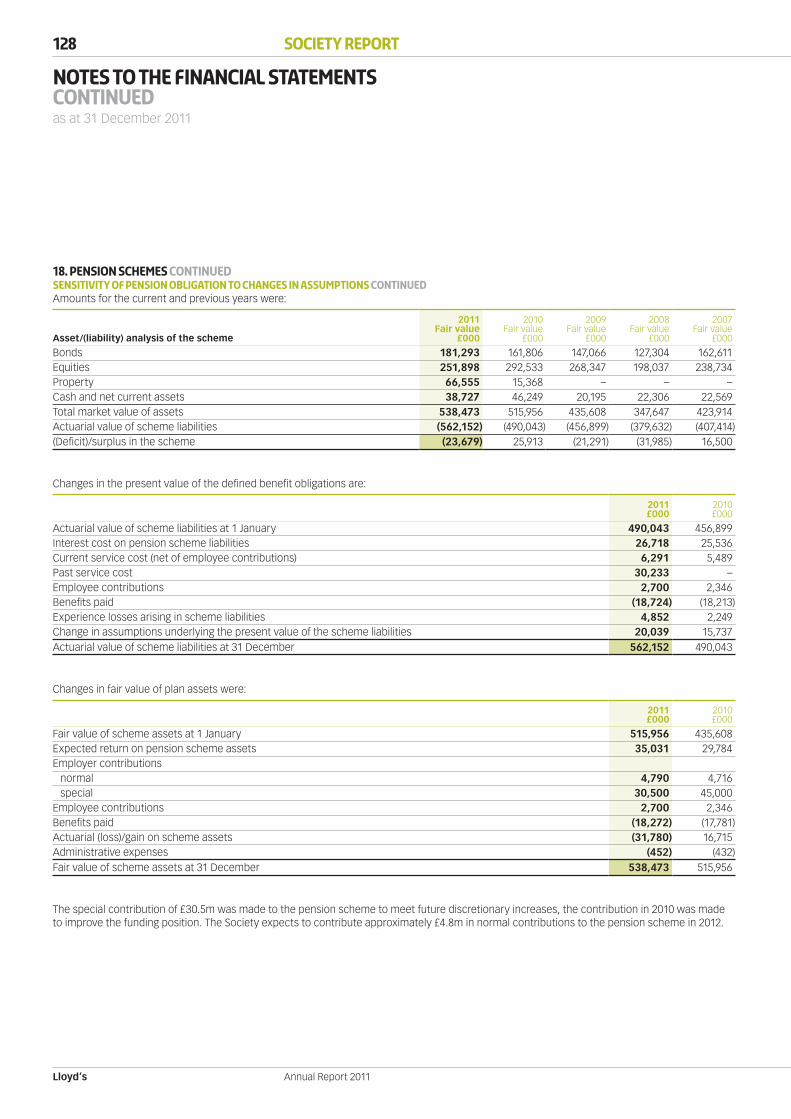
Lloyd’s
128 Society Report
Annual Report 2011
Notes to the financial statementsContinuedas at 31 December 2011
18. Pension Schemes continuedSENSITIVITY OF PENSION OBLIGATION TO CHANGES IN ASSUMPTIONS continuedAmounts for the current and previous years were:
Asset/(liability) analysis of the scheme
2011Fair value
£000
2010Fair value
£000
2009Fair value
£000
2008Fair value
£000
2007Fair value
£000
Bonds 181,293 161,806 147,066 127,304 162,611Equities 251,898 292,533 268,347 198,037 238,734Property 66,555 15,368 – – –Cash and net current assets 38,727 46,249 20,195 22,306 22,569Total market value of assets 538,473 515,956 435,608 347,647 423,914Actuarial value of scheme liabilities (562,152) (490,043) (456,899) (379,632) (407,414)(Deficit)/surplus in the scheme (23,679) 25,913 (21,291) (31,985) 16,500
Changes in the present value of the defined benefit obligations are:
2011£000
2010£000
Actuarial value of scheme liabilities at 1 January 490,043 456,899Interest cost on pension scheme liabilities 26,718 25,536Current service cost (net of employee contributions) 6,291 5,489Past service cost 30,233 –Employee contributions 2,700 2,346Benefits paid (18,724) (18,213)Experience losses arising in scheme liabilities 4,852 2,249Change in assumptions underlying the present value of the scheme liabilities 20,039 15,737Actuarial value of scheme liabilities at 31 December 562,152 490,043
Changes in fair value of plan assets were:
2011£000
2010£000
Fair value of scheme assets at 1 January 515,956 435,608Expected return on pension scheme assets 35,031 29,784Employer contributions
normal 4,790 4,716special 30,500 45,000
Employee contributions 2,700 2,346Benefits paid (18,272) (17,781)Actuarial (loss)/gain on scheme assets (31,780) 16,715Administrative expenses (452) (432)Fair value of scheme assets at 31 December 538,473 515,956
The special contribution of £30.5m was made to the pension scheme to meet future discretionary increases, the contribution in 2010 was made to improve the funding position. The Society expects to contribute approximately £4.8m in normal contributions to the pension scheme in 2012.
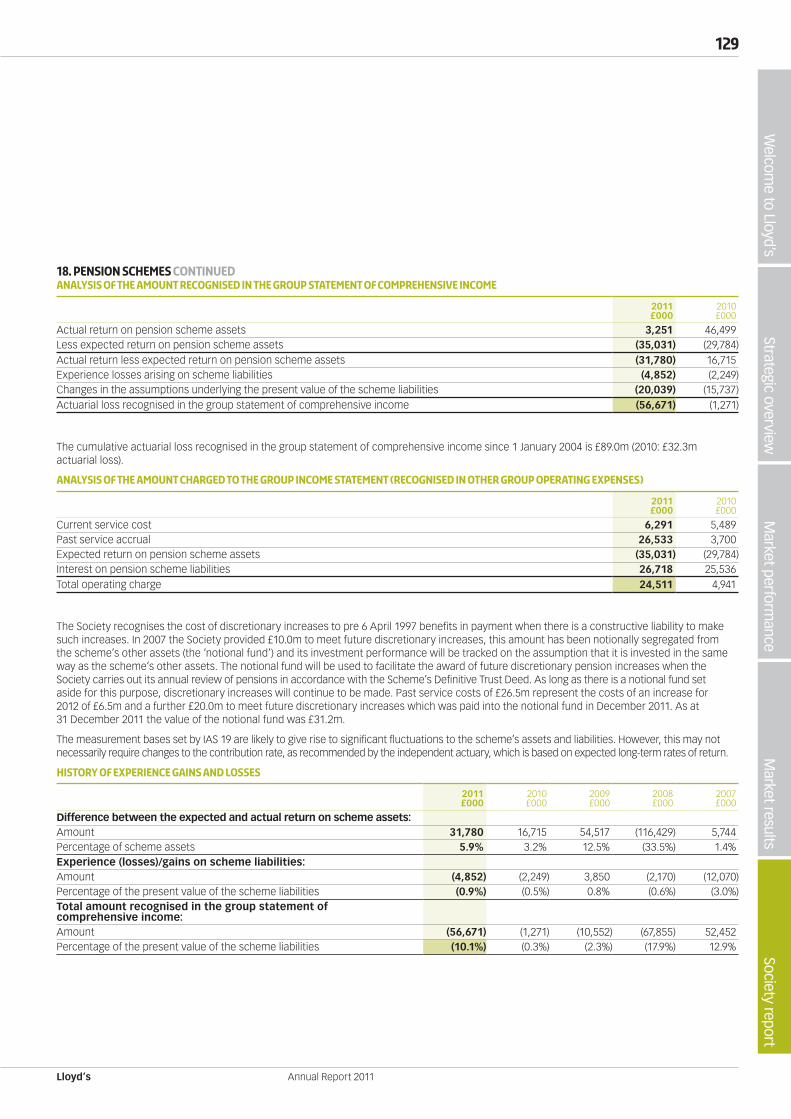
Lloyd’s
129W
elcome to Lloyd’s
Society reportM
arket resultsM
arket performance
Strategic overview
Annual Report 2011
18. Pension Schemes continuedANALYSIS OF THE AMOUNT RECOGNISED IN THE GROUP STATEMENT OF COMPREHENSIVE INCOME
2011£000
2010£000
Actual return on pension scheme assets 3,251 46,499Less expected return on pension scheme assets (35,031) (29,784)Actual return less expected return on pension scheme assets (31,780) 16,715Experience losses arising on scheme liabilities (4,852) (2,249)Changes in the assumptions underlying the present value of the scheme liabilities (20,039) (15,737)Actuarial loss recognised in the group statement of comprehensive income (56,671) (1,271)
The cumulative actuarial loss recognised in the group statement of comprehensive income since 1 January 2004 is £89.0m (2010: £32.3m actuarial loss).
ANALYSIS OF THE AMOUNT charged to the group income statement (recognised in other group operating expenses)
2011£000
2010£000
Current service cost 6,291 5,489Past service accrual 26,533 3,700Expected return on pension scheme assets (35,031) (29,784)Interest on pension scheme liabilities 26,718 25,536Total operating charge 24,511 4,941
The Society recognises the cost of discretionary increases to pre 6 April 1997 benefits in payment when there is a constructive liability to make such increases. In 2007 the Society provided £10.0m to meet future discretionary increases, this amount has been notionally segregated from the scheme’s other assets (the ‘notional fund’) and its investment performance will be tracked on the assumption that it is invested in the same way as the scheme’s other assets. The notional fund will be used to facilitate the award of future discretionary pension increases when the Society carries out its annual review of pensions in accordance with the Scheme’s Definitive Trust Deed. As long as there is a notional fund set aside for this purpose, discretionary increases will continue to be made. Past service costs of £26.5m represent the costs of an increase for 2012 of £6.5m and a further £20.0m to meet future discretionary increases which was paid into the notional fund in December 2011. As at 31 December 2011 the value of the notional fund was £31.2m.
The measurement bases set by IAS 19 are likely to give rise to significant fluctuations to the scheme’s assets and liabilities. However, this may not necessarily require changes to the contribution rate, as recommended by the independent actuary, which is based on expected long-term rates of return.
HISTORY OF EXPERIENCE GAINS AND LOSSES
2011£000
2010£000
2009£000
2008£000
2007£000
Difference between the expected and actual return on scheme assets:Amount 31,780 16,715 54,517 (116,429) 5,744Percentage of scheme assets 5.9% 3.2% 12.5% (33.5%) 1.4%Experience (losses)/gains on scheme liabilities:Amount (4,852) (2,249) 3,850 (2,170) (12,070)Percentage of the present value of the scheme liabilities (0.9%) (0.5%) 0.8% (0.6%) (3.0%)Total amount recognised in the group statement of comprehensive income:Amount (56,671) (1,271) (10,552) (67,855) 52,452Percentage of the present value of the scheme liabilities (10.1%) (0.3%) (2.3%) (17.9%) 12.9%
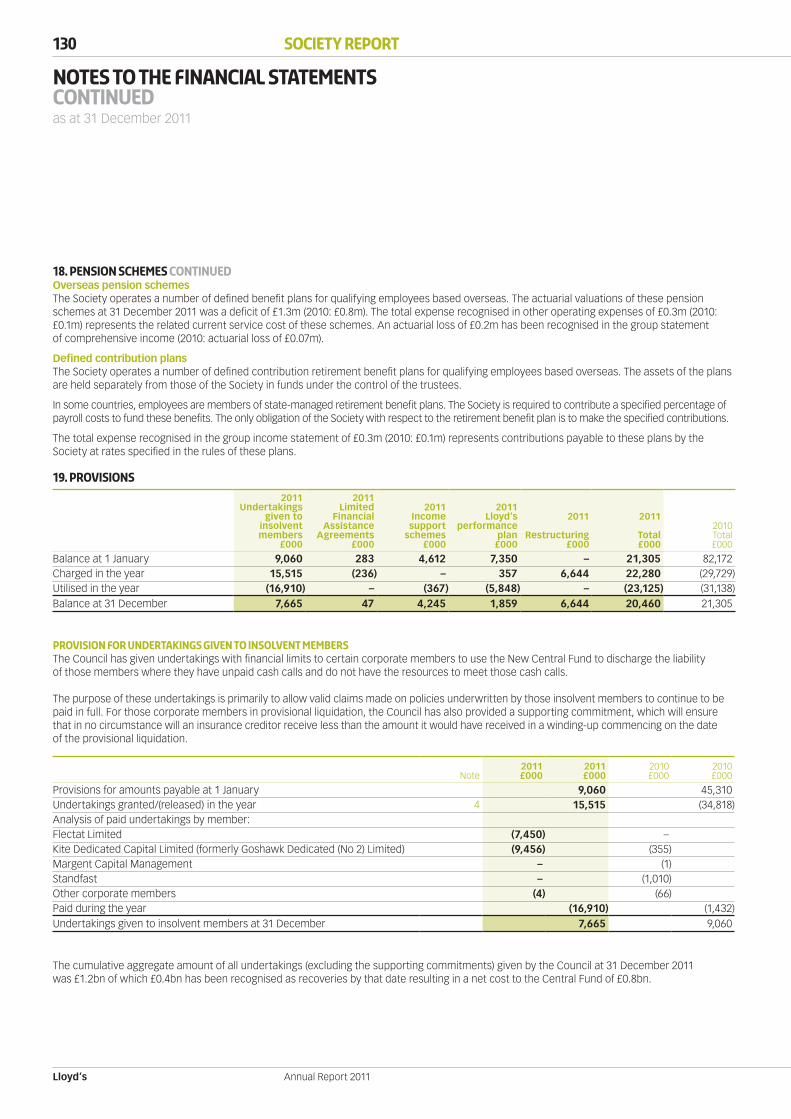
Lloyd’s
130 Society Report
Annual Report 2011
Notes to the financial statementsContinuedas at 31 December 2011
18. Pension Schemes continuedOverseas pension schemesThe Society operates a number of defined benefit plans for qualifying employees based overseas. The actuarial valuations of these pension schemes at 31 December 2011 was a deficit of £1.3m (2010: £0.8m). The total expense recognised in other operating expenses of £0.3m (2010: £0.1m) represents the related current service cost of these schemes. An actuarial loss of £0.2m has been recognised in the group statement of comprehensive income (2010: actuarial loss of £0.07m).
Defined contribution plansThe Society operates a number of defined contribution retirement benefit plans for qualifying employees based overseas. The assets of the plans are held separately from those of the Society in funds under the control of the trustees.
In some countries, employees are members of state-managed retirement benefit plans. The Society is required to contribute a specified percentage of payroll costs to fund these benefits. The only obligation of the Society with respect to the retirement benefit plan is to make the specified contributions.
The total expense recognised in the group income statement of £0.3m (2010: £0.1m) represents contributions payable to these plans by the Society at rates specified in the rules of these plans.
19. PROVISIONs
2011Undertakings
given toinsolvent members
£000
2011Limited
FinancialAssistance
Agreements£000
2011Incomesupport
schemes£000
2011Lloyd’s
performanceplan£000
2011
Restructuring£000
2011
Total£000
2010Total£000
Balance at 1 January 9,060 283 4,612 7,350 – 21,305 82,172Charged in the year 15,515 (236) – 357 6,644 22,280 (29,729)Utilised in the year (16,910) – (367) (5,848) – (23,125) (31,138)Balance at 31 December 7,665 47 4,245 1,859 6,644 20,460 21,305
PROVISION FOR UNDERTAKINGS GIVEN TO INSOLVENT MEMBERSThe Council has given undertakings with financial limits to certain corporate members to use the New Central Fund to discharge the liability of those members where they have unpaid cash calls and do not have the resources to meet those cash calls.
The purpose of these undertakings is primarily to allow valid claims made on policies underwritten by those insolvent members to continue to be paid in full. For those corporate members in provisional liquidation, the Council has also provided a supporting commitment, which will ensure that in no circumstance will an insurance creditor receive less than the amount it would have received in a winding-up commencing on the date of the provisional liquidation.
Note2011£000
2011£000
2010£000
2010£000
Provisions for amounts payable at 1 January 9,060 45,310Undertakings granted/(released) in the year 4 15,515 (34,818)Analysis of paid undertakings by member:Flectat Limited (7,450) –Kite Dedicated Capital Limited (formerly Goshawk Dedicated (No 2) Limited) (9,456) (355)Margent Capital Management – (1)Standfast – (1,010)Other corporate members (4) (66)Paid during the year (16,910) (1,432)Undertakings given to insolvent members at 31 December 7,665 9,060
The cumulative aggregate amount of all undertakings (excluding the supporting commitments) given by the Council at 31 December 2011 was £1.2bn of which £0.4bn has been recognised as recoveries by that date resulting in a net cost to the Central Fund of £0.8bn.
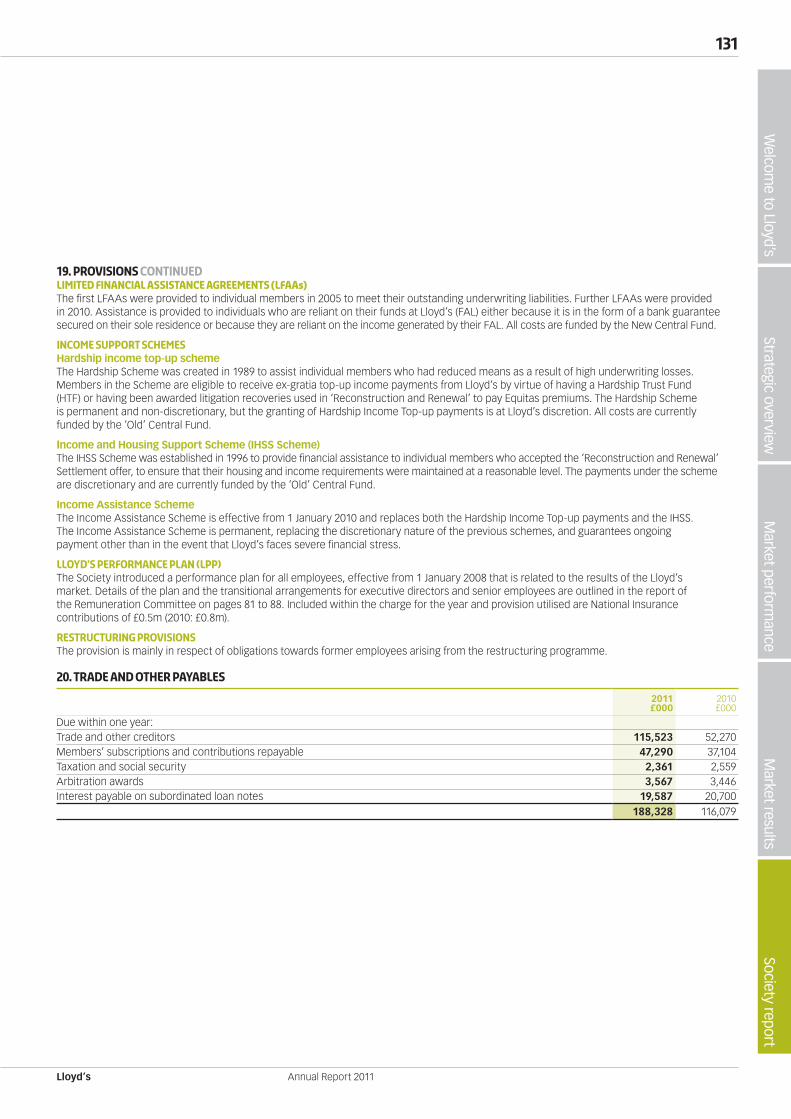
Lloyd’s
131W
elcome to Lloyd’s
Society reportM
arket resultsM
arket performance
Strategic overview
Annual Report 2011
19. PROVISIONS continuedLIMITED FINANCIAL ASSISTANCE AGREEMENTS (LFAAs)The first LFAAs were provided to individual members in 2005 to meet their outstanding underwriting liabilities. Further LFAAs were provided in 2010. Assistance is provided to individuals who are reliant on their funds at Lloyd’s (FAL) either because it is in the form of a bank guarantee secured on their sole residence or because they are reliant on the income generated by their FAL. All costs are funded by the New Central Fund.
INCOME SUPPORT SCHEMESHardship income top-up schemeThe Hardship Scheme was created in 1989 to assist individual members who had reduced means as a result of high underwriting losses. Members in the Scheme are eligible to receive ex-gratia top-up income payments from Lloyd’s by virtue of having a Hardship Trust Fund (HTF) or having been awarded litigation recoveries used in ‘Reconstruction and Renewal’ to pay Equitas premiums. The Hardship Scheme is permanent and non-discretionary, but the granting of Hardship Income Top-up payments is at Lloyd’s discretion. All costs are currently funded by the ‘Old’ Central Fund.
income and Housing Support Scheme (IHSS Scheme)The IHSS Scheme was established in 1996 to provide financial assistance to individual members who accepted the ‘Reconstruction and Renewal’ Settlement offer, to ensure that their housing and income requirements were maintained at a reasonable level. The payments under the scheme are discretionary and are currently funded by the ‘Old’ Central Fund.
Income Assistance Scheme The Income Assistance Scheme is effective from 1 January 2010 and replaces both the Hardship Income Top-up payments and the IHSS. The Income Assistance Scheme is permanent, replacing the discretionary nature of the previous schemes, and guarantees ongoing payment other than in the event that Lloyd’s faces severe financial stress.
LLOYD’S PERFORMANCE PLAN (LPP)The Society introduced a performance plan for all employees, effective from 1 January 2008 that is related to the results of the Lloyd’s market. Details of the plan and the transitional arrangements for executive directors and senior employees are outlined in the report of the Remuneration Committee on pages 81 to 88. Included within the charge for the year and provision utilised are National Insurance contributions of £0.5m (2010: £0.8m).
restructuring provisionsThe provision is mainly in respect of obligations towards former employees arising from the restructuring programme.
20. TRADE AND OTHER PAYABLES
2011£000
2010£000
Due within one year:Trade and other creditors 115,523 52,270Members’ subscriptions and contributions repayable 47,290 37,104Taxation and social security 2,361 2,559Arbitration awards 3,567 3,446Interest payable on subordinated loan notes 19,587 20,700
188,328 116,079
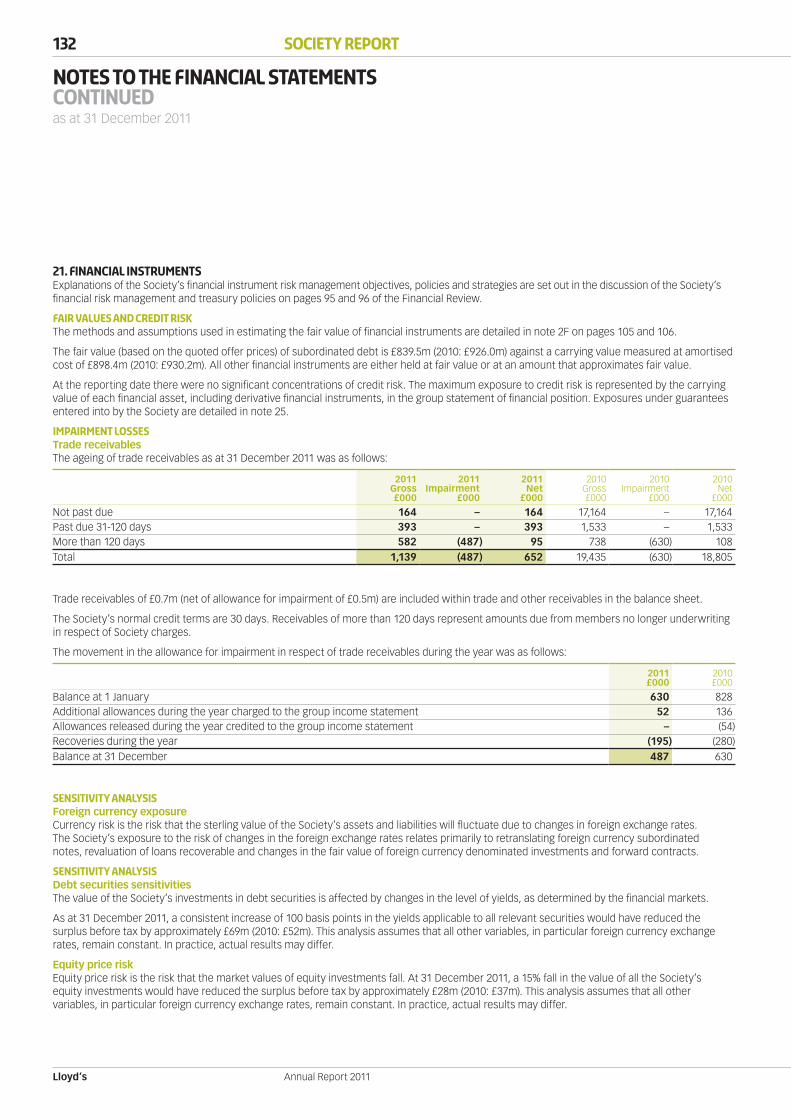
Lloyd’s
132 Society Report
Annual Report 2011
Notes to the financial statementsContinuedas at 31 December 2011
21. Financial instrumentsExplanations of the Society’s financial instrument risk management objectives, policies and strategies are set out in the discussion of the Society’s financial risk management and treasury policies on pages 95 and 96 of the Financial Review.
FAIR VALUES AND CREDIT RISKThe methods and assumptions used in estimating the fair value of financial instruments are detailed in note 2F on pages 105 and 106.
The fair value (based on the quoted offer prices) of subordinated debt is £839.5m (2010: £926.0m) against a carrying value measured at amortised cost of £898.4m (2010: £930.2m). All other financial instruments are either held at fair value or at an amount that approximates fair value.
At the reporting date there were no significant concentrations of credit risk. The maximum exposure to credit risk is represented by the carrying value of each financial asset, including derivative financial instruments, in the group statement of financial position. Exposures under guarantees entered into by the Society are detailed in note 25.
IMPAIRMENT LOSSESTrade receivablesThe ageing of trade receivables as at 31 December 2011 was as follows:
2011Gross£000
2011Impairment
£000
2011Net
£000
2010Gross£000
2010Impairment
£000
2010Net
£000
Not past due 164 – 164 17,164 – 17,164Past due 31-120 days 393 – 393 1,533 – 1,533More than 120 days 582 (487) 95 738 (630) 108Total 1,139 (487) 652 19,435 (630) 18,805
Trade receivables of £0.7m (net of allowance for impairment of £0.5m) are included within trade and other receivables in the balance sheet.
The Society’s normal credit terms are 30 days. Receivables of more than 120 days represent amounts due from members no longer underwriting in respect of Society charges.
The movement in the allowance for impairment in respect of trade receivables during the year was as follows:
2011£000
2010£000
Balance at 1 January 630 828Additional allowances during the year charged to the group income statement 52 136Allowances released during the year credited to the group income statement – (54)Recoveries during the year (195) (280)Balance at 31 December 487 630
SENSITIVITY ANALYSISForeign currency exposureCurrency risk is the risk that the sterling value of the Society’s assets and liabilities will fluctuate due to changes in foreign exchange rates. The Society’s exposure to the risk of changes in the foreign exchange rates relates primarily to retranslating foreign currency subordinated notes, revaluation of loans recoverable and changes in the fair value of foreign currency denominated investments and forward contracts.
SENSITIVITY ANALYSIS Debt securities sensitivitiesThe value of the Society’s investments in debt securities is affected by changes in the level of yields, as determined by the financial markets.
As at 31 December 2011, a consistent increase of 100 basis points in the yields applicable to all relevant securities would have reduced the surplus before tax by approximately £69m (2010: £52m). This analysis assumes that all other variables, in particular foreign currency exchange rates, remain constant. In practice, actual results may differ.
Equity price riskEquity price risk is the risk that the market values of equity investments fall. At 31 December 2011, a 15% fall in the value of all the Society’s equity investments would have reduced the surplus before tax by approximately £28m (2010: £37m). This analysis assumes that all other variables, in particular foreign currency exchange rates, remain constant. In practice, actual results may differ.

Lloyd’s
133W
elcome to Lloyd’s
Society reportM
arket resultsM
arket performance
Strategic overview
Annual Report 2011
21. Financial instruments CONTINUEDLIQUIDITY RISKThe table below summarises the maturity profile of the Society’s non-derivative financial liabilities as at 31 December 2011 based on undiscounted contractual cash flows:
As at 31 December 2011
Carryingamount
£000
Contractualcash flows
£000
Within1 year
£000
1-2years£000
2-5years£000
More than5 years
£000
Subordinated loan notes 508,860 (954,153) (32,497) (32,497) (97,492) (791,667)Perpetual subordinated capital securities 389,556 (566,561) (29,091) (29,091) (87,274) (421,105)Loans funding statutory insurance deposits 352,318 (352,318) (352,318) – – –Trade and other payables 188,328 (188,328) (188,328) – – –
1,439,062 (2,061,360) (602,234) (61,588) (184,766) (1,212,772)
As at 31 December 2010
Carryingamount
£000
Contractualcash flows
£000
Within1 year£000
1-2years£000
2-5years£000
More than5 years
£000
Subordinated loan notes 513,698 (996,381) (32,804) (32,804) (98,410) (832,363)Perpetual subordinated capital securities 416,475 (637,237) (31,122) (31,122) (93,367) (481,626)Loans funding statutory insurance deposits 305,805 (305,805) (305,805) – – –Trade and other payables 116,079 (116,079) (116,079) – – –
1,352,057 (2,055,502) (485,810) (63,926) (191,777) (1,313,989)
Forward currency contracts are settled gross; notional amounts are a close proxy for gross cash flow amounts. Further details regarding the subordinated loan notes and the perpetual subordinated capital securities can be found in note 17 on page 125. Information regarding financial guarantees, all of which could theoretically be called on within one year, can be found in note 25 on page 135.
DERIVATIVE FINANCIAL INSTRUMENTSThe Society enters into forward currency contracts to manage exposures to fluctuation of exchange rates and to provide a service to the Lloyd’s market. The Society’s derivative financial instruments are categorised as fair value Level 2 for disclosure purposes.
Analysis of forward currency contracts:2011£000
2010£000
Outstanding forward foreign exchange gains 45,255 9,746Outstanding forward foreign exchange losses (56,639) (24,170)
The fair value and notional amounts of forward currency contracts, all of which mature within one year, are analysed as follows:
As at 31 December 2011
2011 2011Assets Liabilities
Fair value£000
Notional£000
Fair value£000
Notional£000
Currency Conversion Service (CCS) 18,434 276,773 (19,528) (278,258)Other forward foreign exchange contracts 26,821 1,621,307 (37,111) (1,620,972)
45,255 1,898,080 (56,639) (1,899,230)
As at 31 December 2010
2010 2010Assets Liabilities
Fair value£000
Notional£000
Fair value£000
Notional£000
Currency Conversion Service (CCS) 5,742 213,750 (5,622) (213,902)Other forward foreign exchange contracts 4,004 1,007,053 (18,548) (1,021,596)
9,746 1,220,803 (24,170) (1,235,498)
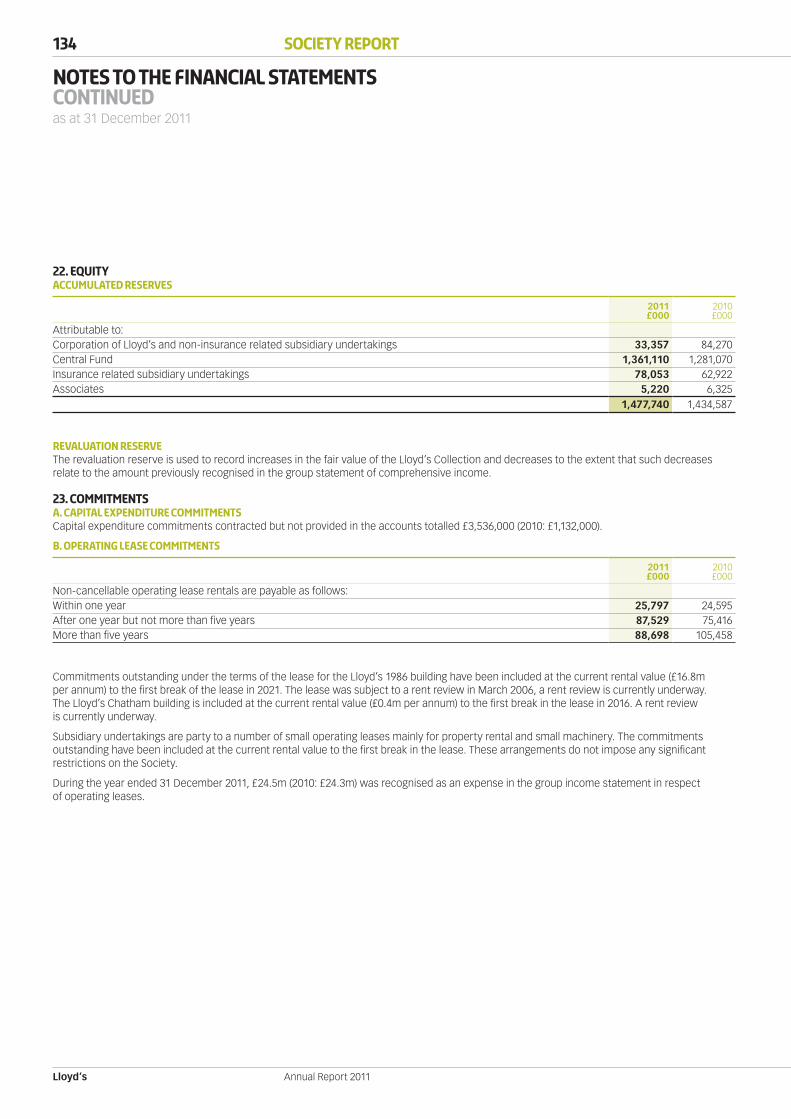
Lloyd’s
134 Society Report
Annual Report 2011
Notes to the financial statementsContinuedas at 31 December 2011
22. EQUITYACCUMULATED RESERVES
2011£000
2010£000
Attributable to:Corporation of Lloyd’s and non-insurance related subsidiary undertakings 33,357 84,270Central Fund 1,361,110 1,281,070Insurance related subsidiary undertakings 78,053 62,922Associates 5,220 6,325
1,477,740 1,434,587
REVALUATION RESERVEThe revaluation reserve is used to record increases in the fair value of the Lloyd’s Collection and decreases to the extent that such decreases relate to the amount previously recognised in the group statement of comprehensive income.
23. CommitmentsA. CAPITAL EXPENDITURE COMMITMENTSCapital expenditure commitments contracted but not provided in the accounts totalled £3,536,000 (2010: £1,132,000).
B. OPERATING LEASE COMMITMENTS
2011£000
2010£000
Non-cancellable operating lease rentals are payable as follows:Within one year 25,797 24,595After one year but not more than five years 87,529 75,416More than five years 88,698 105,458
Commitments outstanding under the terms of the lease for the Lloyd’s 1986 building have been included at the current rental value (£16.8m per annum) to the first break of the lease in 2021. The lease was subject to a rent review in March 2006, a rent review is currently underway. The Lloyd’s Chatham building is included at the current rental value (£0.4m per annum) to the first break in the lease in 2016. A rent review is currently underway.
Subsidiary undertakings are party to a number of small operating leases mainly for property rental and small machinery. The commitments outstanding have been included at the current rental value to the first break in the lease. These arrangements do not impose any significant restrictions on the Society.
During the year ended 31 December 2011, £24.5m (2010: £24.3m) was recognised as an expense in the group income statement in respect of operating leases.
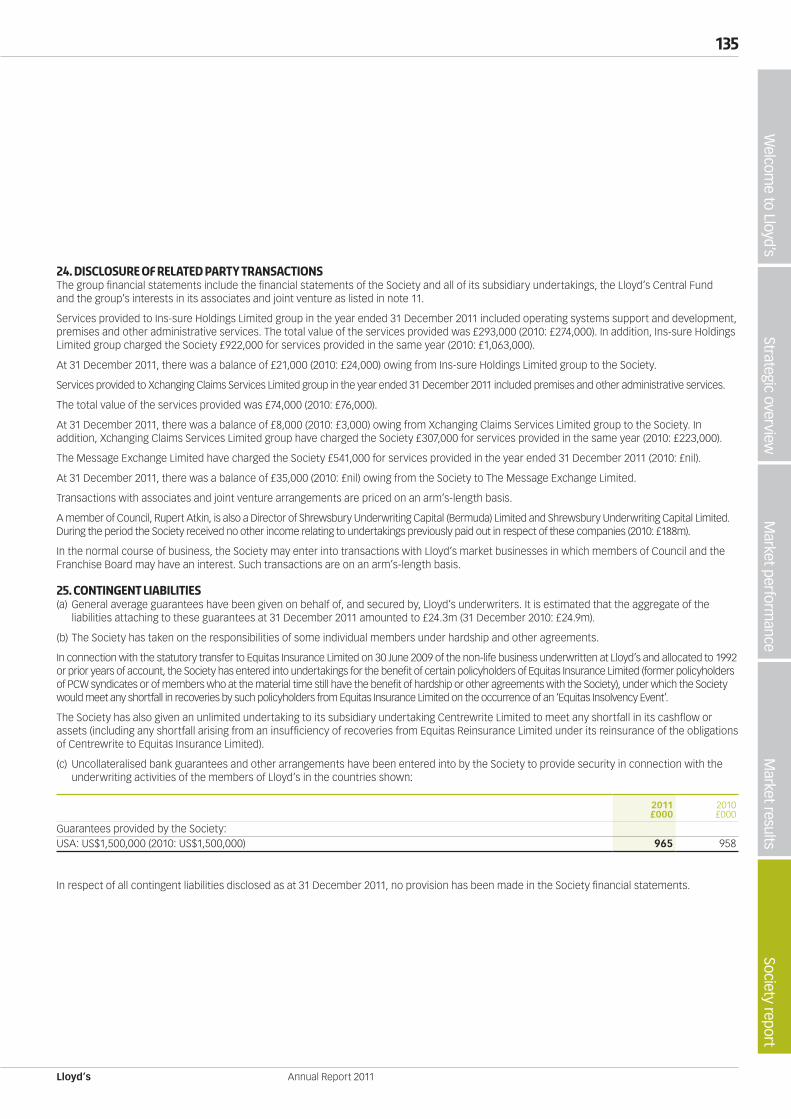
Lloyd’s
135W
elcome to Lloyd’s
Society reportM
arket resultsM
arket performance
Strategic overview
Annual Report 2011
24. Disclosure of related party transactionsThe group financial statements include the financial statements of the Society and all of its subsidiary undertakings, the Lloyd’s Central Fund and the group’s interests in its associates and joint venture as listed in note 11.
Services provided to Ins-sure Holdings Limited group in the year ended 31 December 2011 included operating systems support and development, premises and other administrative services. The total value of the services provided was £293,000 (2010: £274,000). In addition, Ins-sure Holdings Limited group charged the Society £922,000 for services provided in the same year (2010: £1,063,000).
At 31 December 2011, there was a balance of £21,000 (2010: £24,000) owing from Ins-sure Holdings Limited group to the Society.
Services provided to Xchanging Claims Services Limited group in the year ended 31 December 2011 included premises and other administrative services.
The total value of the services provided was £74,000 (2010: £76,000).
At 31 December 2011, there was a balance of £8,000 (2010: £3,000) owing from Xchanging Claims Services Limited group to the Society. In addition, Xchanging Claims Services Limited group have charged the Society £307,000 for services provided in the same year (2010: £223,000).
The Message Exchange Limited have charged the Society £541,000 for services provided in the year ended 31 December 2011 (2010: £nil).
At 31 December 2011, there was a balance of £35,000 (2010: £nil) owing from the Society to The Message Exchange Limited.
Transactions with associates and joint venture arrangements are priced on an arm’s-length basis.
A member of Council, Rupert Atkin, is also a Director of Shrewsbury Underwriting Capital (Bermuda) Limited and Shrewsbury Underwriting Capital Limited. During the period the Society received no other income relating to undertakings previously paid out in respect of these companies (2010: £188m).
In the normal course of business, the Society may enter into transactions with Lloyd’s market businesses in which members of Council and the Franchise Board may have an interest. Such transactions are on an arm’s-length basis.
25. Contingent liabilities(a) General average guarantees have been given on behalf of, and secured by, Lloyd’s underwriters. It is estimated that the aggregate of the
liabilities attaching to these guarantees at 31 December 2011 amounted to £24.3m (31 December 2010: £24.9m).
(b) The Society has taken on the responsibilities of some individual members under hardship and other agreements.
In connection with the statutory transfer to Equitas Insurance Limited on 30 June 2009 of the non-life business underwritten at Lloyd’s and allocated to 1992 or prior years of account, the Society has entered into undertakings for the benefit of certain policyholders of Equitas Insurance Limited (former policyholders of PCW syndicates or of members who at the material time still have the benefit of hardship or other agreements with the Society), under which the Society would meet any shortfall in recoveries by such policyholders from Equitas Insurance Limited on the occurrence of an ‘Equitas Insolvency Event’.
The Society has also given an unlimited undertaking to its subsidiary undertaking Centrewrite Limited to meet any shortfall in its cashflow or assets (including any shortfall arising from an insufficiency of recoveries from Equitas Reinsurance Limited under its reinsurance of the obligations of Centrewrite to Equitas Insurance Limited).
(c) Uncollateralised bank guarantees and other arrangements have been entered into by the Society to provide security in connection with the underwriting activities of the members of Lloyd’s in the countries shown:
2011£000
2010£000
Guarantees provided by the Society:USA: US$1,500,000 (2010: US$1,500,000) 965 958
In respect of all contingent liabilities disclosed as at 31 December 2011, no provision has been made in the Society financial statements.
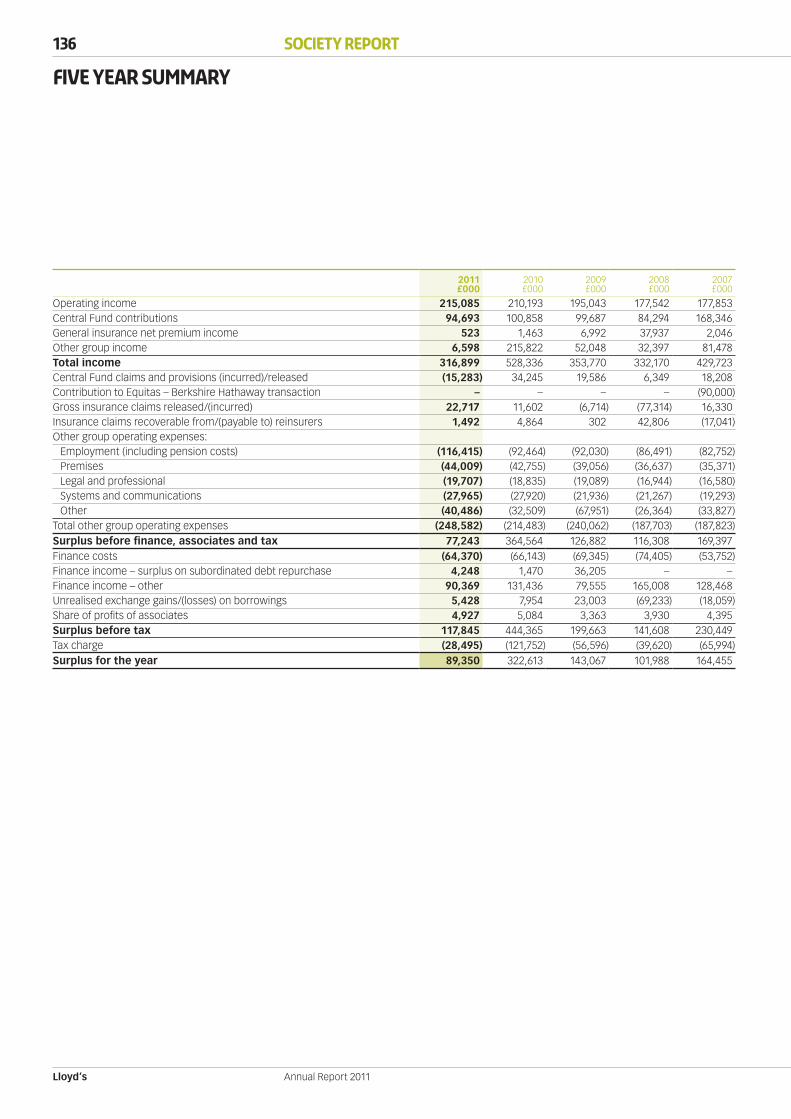
Lloyd’s
136 Society Report
Annual Report 2011
FIVE YEAR SUMMARY
2011£000
2010£000
2009£000
2008£000
2007£000
Operating income 215,085 210,193 195,043 177,542 177,853Central Fund contributions 94,693 100,858 99,687 84,294 168,346General insurance net premium income 523 1,463 6,992 37,937 2,046Other group income 6,598 215,822 52,048 32,397 81,478Total income 316,899 528,336 353,770 332,170 429,723Central Fund claims and provisions (incurred)/released (15,283) 34,245 19,586 6,349 18,208Contribution to Equitas – Berkshire Hathaway transaction – – – – (90,000)Gross insurance claims released/(incurred) 22,717 11,602 (6,714) (77,314) 16,330Insurance claims recoverable from/(payable to) reinsurers 1,492 4,864 302 42,806 (17,041)Other group operating expenses:
Employment (including pension costs) (116,415) (92,464) (92,030) (86,491) (82,752)Premises (44,009) (42,755) (39,056) (36,637) (35,371)Legal and professional (19,707) (18,835) (19,089) (16,944) (16,580)Systems and communications (27,965) (27,920) (21,936) (21,267) (19,293)Other (40,486) (32,509) (67,951) (26,364) (33,827)
Total other group operating expenses (248,582) (214,483) (240,062) (187,703) (187,823)Surplus before finance, associates and tax 77,243 364,564 126,882 116,308 169,397Finance costs (64,370) (66,143) (69,345) (74,405) (53,752)Finance income – surplus on subordinated debt repurchase 4,248 1,470 36,205 – –Finance income – other 90,369 131,436 79,555 165,008 128,468Unrealised exchange gains/(losses) on borrowings 5,428 7,954 23,003 (69,233) (18,059)Share of profits of associates 4,927 5,084 3,363 3,930 4,395Surplus before tax 117,845 444,365 199,663 141,608 230,449Tax charge (28,495) (121,752) (56,596) (39,620) (65,994)Surplus for the year 89,350 322,613 143,067 101,988 164,455