social security and the private pension system: the
TRANSCRIPT
SOCIAL SECURITY AND THE PRIVATE PENSION SYSTEM:THE SIGNIFICANCE OF INTEGRATED PLANS
Pamela Perun*
CRR WP 2002-2July 2002
Center for Retirement Research at Boston College550 Fulton Hall
140 Commonwealth Ave.Chestnut Hill, MA 02467
Tel: 617-552-1762 Fax: 617-552-1750http://www.bc.edu/crr
*Pamela Perun is a consultant on retirement income policy issues for the Urban Institute. The researchreported herein was performed pursuant to a grant from the U.S. Social Security Administration (SSA) tothe Center for Retirement Research at Boston College (CRR). This grant was awarded through the CRR’sSteven H. Sandell Grant Program for Junior Scholars in Retirement Research. The opinions andconclusions are solely those of the author and should not be construed as representing the opinions orpolicy of SSA or any agency of the Federal Government or of the CRR.
© 2002, by Pamela Perun. All rights reserved. Short sections of text, not to exceed two paragraphs, maybe quoted without explicit permission provided that full credit, including © notice, is given to the source.
About the Sandell Grant Program
This paper received funding from the Steven H. Sandell Grant Program for JuniorScholars in Retirement Research. Established in 1999, the Sandell program’s purpose isto promote research on retirement issues by junior scholars in a wide variety ofdisciplines, including actuarial science, demography, economics, finance, gerontology,political science, psychology, public administration, public policy, sociology, socialwork, and statistics. The program is funded through a grant from the Social SecurityAdministration (SSA). Each grant awarded is up to $25,000. In addition to submitting apaper, successful applicants also present their results to SSA in Washington, DC. Formore information on the Sandell program, please visit our web site athttp://www.bc.edu/bc_org/avp/csom/executive/crr/sandellguidelines.shtml, send e-mail [email protected] or call Elizabeth Lidstone at (617) 552-1677.
About the Center for Retirement Research
The Center for Retirement Research at Boston College, part of a consortium that includesa parallel center at the University of Michigan, was established in 1998 through a 5-year$5.25 million grant from the Social Security Administration. The goals of the Center areto promote research on retirement issues, to transmit new findings to the policycommunity and the public, to help train new scholars, and to broaden access to valuabledata sources. Through these initiatives, the Center hopes to forge a strong link betweenthe academic and policy communities around an issue of critical importance to thenation’s future.
Center for Retirement Research at Boston College550 Fulton Hall
140 Commonwealth Ave.Chestnut Hill, MA 02467
phone: 617-552-1762 fax: 617-552-1750e-mail: [email protected]
http://www.bc.edu/crr
Affiliated Institutions:
Massachusetts Institute of TechnologySyracuse University
The Brookings InstitutionNational Academy of Social Insurance
Urban Institute
TABLE OF CONTENTS
ABSTRACT.................................................................................................................................................................. 2 INTRODUCTION ........................................................................................................................................................ 3 BACKGROUND .......................................................................................................................................................... 5
Previous Studies........................................................................................................................................................ 5 Legal Context............................................................................................................................................................ 8 Form 5500 Data ...................................................................................................................................................... 14
ANALYSIS................................................................................................................................................................. 18 Overview of the Private Pension System, 1993-1997............................................................................................. 18 Overview of Integrated Plans, 1993-1997............................................................................................................... 20 Integration, 1993-1997: Defined Benefit versus Defined Contribution Plans ....................................................... 22
Number of Integrated Plans ................................................................................................................................ 22 Number of Participants in Integrated Plans......................................................................................................... 24 Integration by Plan Type and Size ...................................................................................................................... 27 Employer Funding............................................................................................................................................... 30 Total Plan Assets................................................................................................................................................. 33 Other Plan Characteristics................................................................................................................................... 35
Predicting Plan Integration...................................................................................................................................... 35 CONCLUSIONS......................................................................................................................................................... 39 REFERENCES ........................................................................................................................................................... 43 APPENDIX A............................................................................................................................................................. 44
Definitions of Key Classification Variables............................................................................................................ 44 APPENDIX B ............................................................................................................................................................. 45
Preparation of the Data Set ..................................................................................................................................... 45 APPENDIX C ............................................................................................................................................................. 46
Some Comparisons with Department of Labor Statistics........................................................................................ 46 ENDNOTES ............................................................................................................................................................... 48
-2-
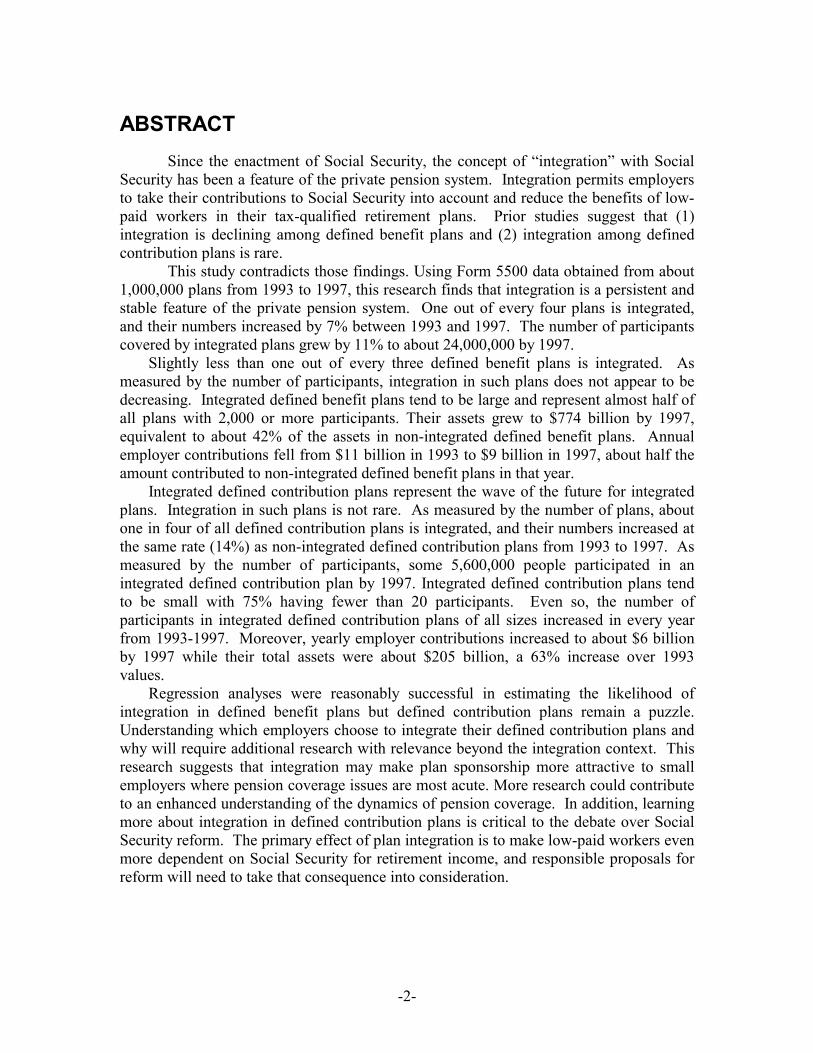
ABSTRACT Since the enactment of Social Security, the concept of “integration” with Social
Security has been a feature of the private pension system. Integration permits employers to take their contributions to Social Security into account and reduce the benefits of low-paid workers in their tax-qualified retirement plans. Prior studies suggest that (1) integration is declining among defined benefit plans and (2) integration among defined contribution plans is rare.
This study contradicts those findings. Using Form 5500 data obtained from about 1,000,000 plans from 1993 to 1997, this research finds that integration is a persistent and stable feature of the private pension system. One out of every four plans is integrated, and their numbers increased by 7% between 1993 and 1997. The number of participants covered by integrated plans grew by 11% to about 24,000,000 by 1997.
Slightly less than one out of every three defined benefit plans is integrated. As measured by the number of participants, integration in such plans does not appear to be decreasing. Integrated defined benefit plans tend to be large and represent almost half of all plans with 2,000 or more participants. Their assets grew to $774 billion by 1997, equivalent to about 42% of the assets in non-integrated defined benefit plans. Annual employer contributions fell from $11 billion in 1993 to $9 billion in 1997, about half the amount contributed to non-integrated defined benefit plans in that year.
Integrated defined contribution plans represent the wave of the future for integrated plans. Integration in such plans is not rare. As measured by the number of plans, about one in four of all defined contribution plans is integrated, and their numbers increased at the same rate (14%) as non-integrated defined contribution plans from 1993 to 1997. As measured by the number of participants, some 5,600,000 people participated in an integrated defined contribution plan by 1997. Integrated defined contribution plans tend to be small with 75% having fewer than 20 participants. Even so, the number of participants in integrated defined contribution plans of all sizes increased in every year from 1993-1997. Moreover, yearly employer contributions increased to about $6 billion by 1997 while their total assets were about $205 billion, a 63% increase over 1993 values.
Regression analyses were reasonably successful in estimating the likelihood of integration in defined benefit plans but defined contribution plans remain a puzzle. Understanding which employers choose to integrate their defined contribution plans and why will require additional research with relevance beyond the integration context. This research suggests that integration may make plan sponsorship more attractive to small employers where pension coverage issues are most acute. More research could contribute to an enhanced understanding of the dynamics of pension coverage. In addition, learning more about integration in defined contribution plans is critical to the debate over Social Security reform. The primary effect of plan integration is to make low-paid workers even more dependent on Social Security for retirement income, and responsible proposals for reform will need to take that consequence into consideration.
-3-
INTRODUCTION Most workers earn retirement income over their work lives through two distinct,
usually independent programs. The vast majority of workers receive income from Social
Security, the almost universal, federally run and regulated program to which both they
and all their employers contribute. Many, but not all, workers also receive retirement
income from the private pension system. The private pension system is a voluntary,
federally regulated program that makes special tax benefits available through the Internal
Revenue Code to encourage employers to sponsor pension plans. If a company chooses
to provide a pension plan, its workers will earn retirement income while employees based
upon either their or their company’s contributions or some combination of the two.
A subset of workers, however, receives retirement income from the private pension
system that is not independent of Social Security benefits. Their companies have taken
advantage of special provisions in the Internal Revenue Code permitting them to take
their contributions to Social Security into account when calculating retirement benefits in
their tax-qualified pension plans. As a result, employees who earn less than the
maximum wage subject to Social Security receive reduced pension benefits from their
employer’s plans.
Integration with Social Security is an important issue for both the private pension
system and Social Security. As Social Security reform is debated, it assumes an added
significance. Because Social Security provides progressive benefits, any reform efforts
will have their greatest impact (for better or for worse) on the retirement income of low-
paid workers. In addition, as commentators have argued, any changes in the current
Social Security program will have repercussions for the private pension system (Gregory,
-4-
1998; Moore, 2001; Olsen, VanDerhei and Salisbury, 1997). The private pension system
is facing its own set of challenges with respect to low-paid workers. There is a persistent
problem of low pension coverage rates for these workers (Copeland, 2001; Munnell and
Sunden, 2001). Even if they do participate in a plan, plan integration will provide low-
paid workers with a reduced benefit, and the magnitude of those reductions in integrated
defined benefit plans is apparently increasing (Bender, 2001). In addition, with the shift
in recent years from defined benefit to defined contribution plans and the increase in “do-
it-yourself” retirement plans, low-paid workers are under more pressure to fund their own
retirement income. The increase in contribution limits now in effect is unlikely to benefit
these workers because few can afford to contribute more (Perun, 2001). Because plan
integration adds to the burden on low-paid workers to generate their own retirement
income, understanding its role in the private pension system is both a relevant and timely
issue.
But, in large part due to difficulties on obtaining data, there is little systematic
information available about the extent of Social Security integration in the private
pension system. The few studies that exist have largely focused on defined benefit plans
and used survey data collected for other purposes. The purpose of this study is to provide
comprehensive information on the prevalence of Social Security integration in the private
pension system. It analyzes a unique dataset of information on the private pension
system that consists of the annual reports, Form 5500s, that retirement plans are required
to file each year. The analysis presented below first discusses the prevalence of
integrated plans in the private pension system between 1993 and 1997 in comparison to
non-integrated plans and the private pension system as a whole. It then compares
-5-
integrated defined benefit and defined contribution plans on a number of measures,
including number of plans, number of participants, amount of employer contributions,
and total plan assets and describes observed changes in these measures during this period.
Finally, it presents the results of logistic regression analyses that attempt to explain the
characteristics of the employers who sponsor integrated plans in conjunction with those
of the plans themselves.
BACKGROUND
Previous Studies
The topic of plan integration with Social Security has received little systematic
attention, an oversight due more to the lack of data than any lack of interest. Previous
studies have analyzed data providing indirect information on the extent of integration in
the private pension system from two sources: the periodic Employee Benefits Survey
(“EBS”) of the Bureau of Labor Statistics; and the Health and Retirement Study (“HRS”)
begun in 1992. Over the last twenty years, the EBS conducted a series of surveys of
employers in state and local governments, medium and large private firms with at least
100 employees, and small private firms with less than 100 employees to obtain
information about the employee benefits they offered. It collected data on Social
Security integration, however, only on defined benefit plans. The EBS data provide
information on the percentage of employees believed to participate in integrated defined
benefit plans, although that information is not available for all years. The HRS, in
contrast, is a longitudinal, nationally representative survey of only one cohort -
individuals aged 51-62 in 1992. It collects data from sample participants on the pension
plans in which they have participated and includes supplemental information on the
-6-
design of those plans. These data can be used to estimate the level of integration in the
private pension system based upon both the defined benefit and defined contribution
plans in which sample members have participated.
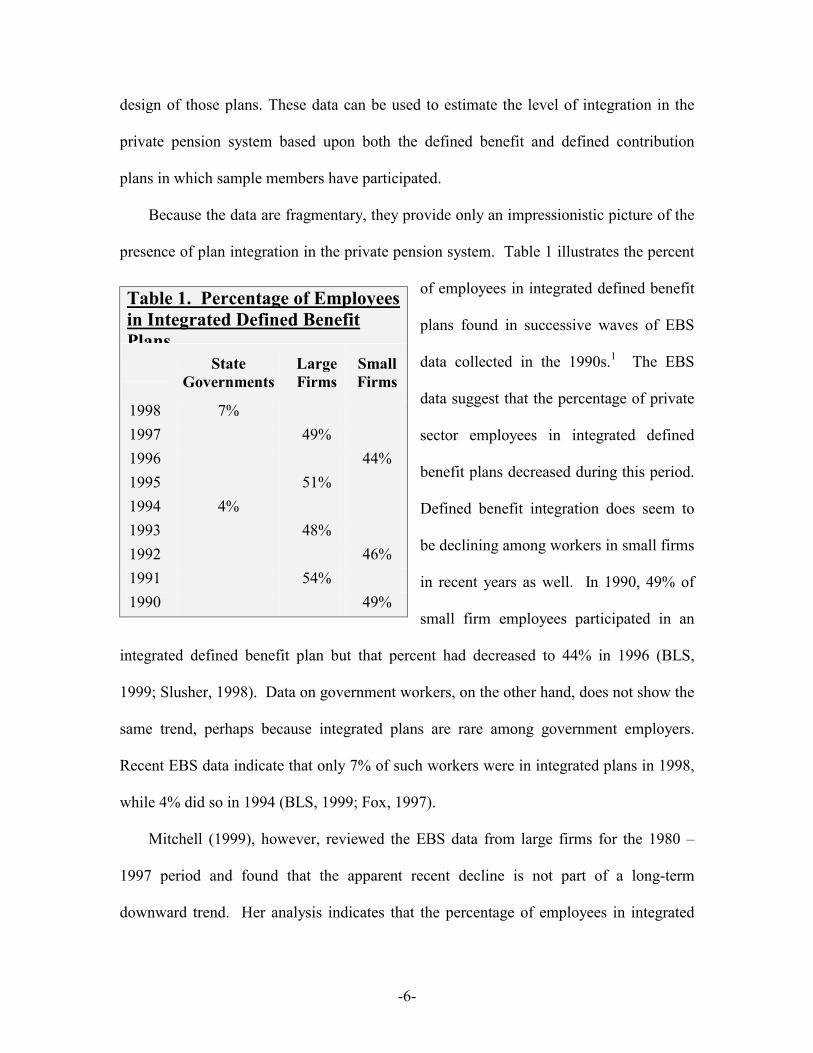
Because the data are fragmentary, they provide only an impressionistic picture of the
presence of plan integration in the private pension system. Table 1 illustrates the percent
of employees in integrated defined benefit
plans found in successive waves of EBS
data collected in the 1990s.1 The EBS
data suggest that the percentage of private
sector employees in integrated defined
benefit plans decreased during this period.
Defined benefit integration does seem to
be declining among workers in small firms
in recent years as well. In 1990, 49% of
small firm employees participated in an
integrated defined benefit plan but that percent had decreased to 44% in 1996 (BLS,
1999; Slusher, 1998). Data on government workers, on the other hand, does not show the
same trend, perhaps because integrated plans are rare among government employers.
Recent EBS data indicate that only 7% of such workers were in integrated plans in 1998,
while 4% did so in 1994 (BLS, 1999; Fox, 1997).
Mitchell (1999), however, reviewed the EBS data from large firms for the 1980 –
1997 period and found that the apparent recent decline is not part of a long-term
downward trend. Her analysis indicates that the percentage of employees in integrated
Table 1. Percentage of Employees in Integrated Defined Benefit Plans
State Governments
Large Firms
Small Firms
1998 7% 1997 49% 1996 44% 1995 51% 1994 4% 1993 48% 1992 46% 1991 54% 1990 49%
-7-
plans has fluctuated greatly during the last twenty years. A smaller percentage of
employees, 45%, participated in such plans in 1980 but that percentage increased to 63%
in 1989. But the increase reversed itself in the 1990s and only 49%, close to the same
percentage of 1980, were in such plans by 1997. Replicating the EBS large firm data
using a subset of the HRS sample, Bender (1999) found that 45% of the sub-sample were
in integrated defined benefit plans in 1992, a similar but slightly smaller figure than that
reported in the 1993 EBS survey.
Integration among defined contribution plans remains a mystery. Because the EBS
does not collect integration information on these plans, the only data available for
analysis comes from the HRS. Those data suggest that integration is rare among defined
contribution plans. Using the 1992 HRS data, Slusher (1998) calculates that less than 2%
of the HRS sample ever participated in an integrated defined contribution plan. Using
that same data set, Bender (1999) estimates that only 8% of HRS workers who participate
only in a defined contribution plan are in an integrated plan.
Information about the characteristics of workers in integrated plans or about the
employers who sponsor such plans is also fragmentary and often contradictory. Slusher,
for example, finds that among the HRS sample there was no clear relationship between
wage level and the prevalence of integration and only small differences by income and
gender. He does report, however, that employees of small firms are less likely to have an
integrated plan. In contrast, Bender (1999), also using the HRS sample, finds that men,
non-Hispanic blacks and workers with less than a graduate level of education are less
likely to have an integrated plan while union members and workers with earnings greater
than the Social Security wage base are more likely. Bender also finds no relationship
-8-
between firm size and plan integration. Slusher reports that the retail trade,
manufacturing and financial industries have the highest incidence of integration and
Bender reports that the natural resources, transportation, professional and public
administration industries have the smallest. The discrepancies between the findings
reported by Slusher and Bender are largely due to the different variables, HRS sub-
samples and techniques used in each analysis.
In summary, previous studies indicate the following. First, recent data indicate that
integration in defined benefit plans appears to be declining among private employers with
less than 50% of employees participating in such plans. Second, integration in defined
contribution plans appears to be small. Third, it is impossible to draw any firm
conclusions about the characteristics of employees in integrated plans or the employers
who sponsor them.
Legal Context
The private pension system provides employers with the option of coordinating, or
“integrating,” the benefits provided through their plans with Social Security benefits.
Because Social Security benefits are progressive, low-paid workers receive benefits that
represent a higher percentage of pay than high-paid workers. The general rationale for
permitting plan integration is that it provides employers with an opportunity to combine
Social Security and plan benefits in order to provide retirement income that represents the
same percentage of pay for both high- and low- paid workers.
In an integrated plan, benefits are slanted towards high-paid workers. This result
would normally violate the fundamental tax code rule that employers may not favor
highly-paid employees in their tax-qualified plans.2 But shortly after the enactment of
-9-
Social Security, the tax code was amended to sanction plan integration. The relevant
rules have changed markedly over the years, and the current regime was enacted as part
of the Tax Reform Act of 1986. The new rules limit the extent to which an employer can
use Social Security to decrease pension benefits for low-paid workers. Under the prior
rules, for example, an integrated plan could be designed to “integrate out” low-paid
workers, that is, to provide low-paid workers in the plan with no benefits. If an employer
provided only one plan that was integrated to the maximum extent, low-paid workers
received only Social Security benefits in retirement, although they ostensibly
“participated” in a pension plan at work. The new rules prevent this result by limiting the
permissible spread between the accruals or contributions earned by low- and high-paid
workers in an integrated plan.
Employers are not permitted to integrate all types of plans. For example, ESOPs,
employee 401(k) contributions and employer matching contributions may not be
integrated. But most other plans are eligible. Under current rules, an employer can
integrate an eligible plan in one of three ways - two direct and one indirect. A plan using
either of the first two methods must satisfy the requirements of Internal Revenue Code §
401(l) or § 401(a)(5)(D). The 401(l) rules apply to both defined benefit and defined
contribution plans while the 401(a)(5) rules apply to defined benefit plans only. Under
401(l), plans are integrated through either an excess or an offset (available only to
defined benefit plans) formula. An excess plan provides higher benefits to employees
who earn more than the plan’s “integration level” but by no more than twice what
employees who earn less than the integration level receive.3 An offset plan reduces
benefits earned by low-paid employees but in general, by no more than 50% of the plan
-10-
benefit. Under 401(l), the reductions permitted are derived from formulas established by
statute rather than from Social Security directly. Under the 401(a)(5) rules, however, a
defined benefit plan may offset low-paid employees’ plan benefits by a portion of their
actual Social Security benefit.
Integrated plans are designed to pay higher-paid workers a proportionately larger
benefit than lower-paid workers. Employers can use this device effectively to reduce
their benefits costs while allocating an increased percentage of their contribution to
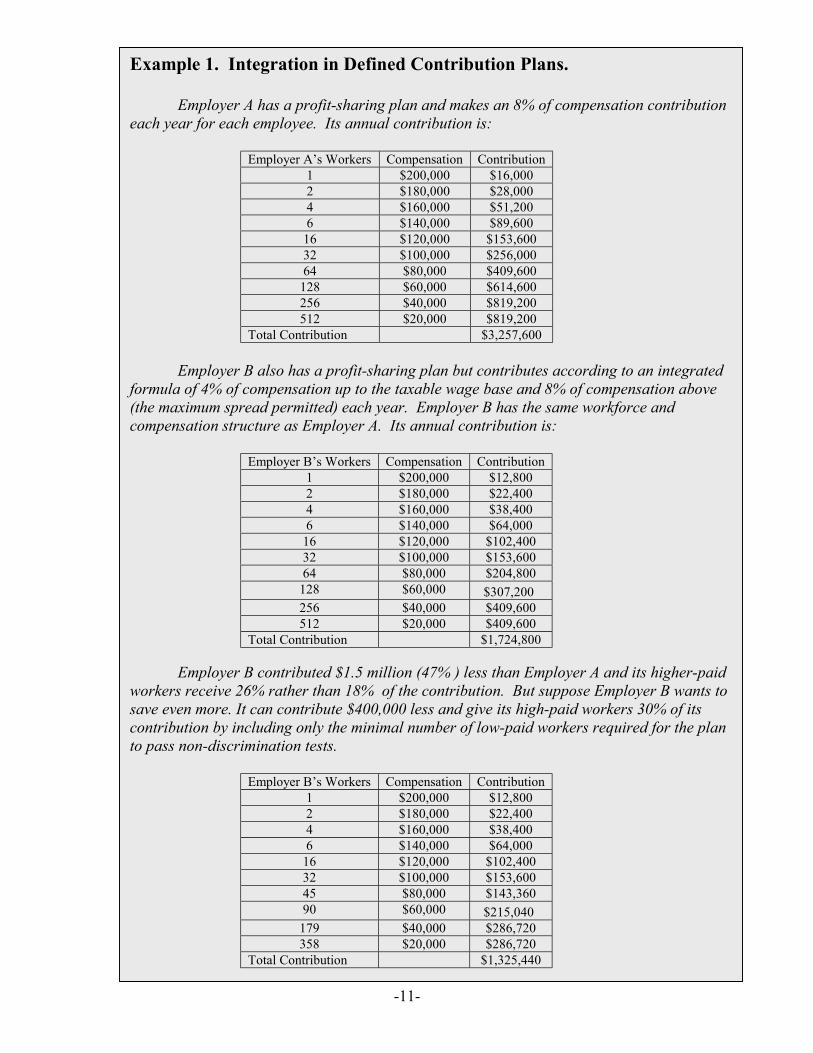
higher-paid workers. Example 1 illustrates how integration works in practice. It
describes the profit-sharing plans of two employers, Employer A which does not have an
integrated formula and Employer B which does. In this example, a “high-paid” worker is
assumed to earn at least $80,000 a year. The taxable wage base in effect under Social
Security is also assumed to be $80,000 for purposes of Employer B’s plan.
-11-
Example 1. Integration in Defined Contribution Plans.
Employer A has a profit-sharing plan and makes an 8% of compensation contribution each year for each employee. Its annual contribution is:
Employer A’s Workers Compensation Contribution 1 $200,000 $16,000 2 $180,000 $28,000 4 $160,000 $51,200 6 $140,000 $89,600
16 $120,000 $153,600 32 $100,000 $256,000 64 $80,000 $409,600
128 $60,000 $614,600 256 $40,000 $819,200 512 $20,000 $819,200
Total Contribution $3,257,600 Employer B also has a profit-sharing plan but contributes according to an integrated
formula of 4% of compensation up to the taxable wage base and 8% of compensation above (the maximum spread permitted) each year. Employer B has the same workforce and compensation structure as Employer A. Its annual contribution is:
Employer B’s Workers Compensation Contribution 1 $200,000 $12,800 2 $180,000 $22,400 4 $160,000 $38,400 6 $140,000 $64,000
16 $120,000 $102,400 32 $100,000 $153,600 64 $80,000 $204,800
128 $60,000 $307,200 256 $40,000 $409,600 512 $20,000 $409,600
Total Contribution $1,724,800
Employer B contributed $1.5 million (47% ) less than Employer A and its higher-paid workers receive 26% rather than 18% of the contribution. But suppose Employer B wants to save even more. It can contribute $400,000 less and give its high-paid workers 30% of its contribution by including only the minimal number of low-paid workers required for the plan to pass non-discrimination tests.
Employer B’s Workers Compensation Contribution 1 $200,000 $12,800 2 $180,000 $22,400 4 $160,000 $38,400 6 $140,000 $64,000
16 $120,000 $102,400 32 $100,000 $153,600 45 $80,000 $143,360 90 $60,000 $215,040
179 $40,000 $286,720 358 $20,000 $286,720
Total Contribution $1,325,440
-12-
Employer B has the same workforce and compensation structure as Employer A. By
using an integrated formula in its profit-sharing plan, Employer B saves $1.5 million
(contributes 47% less than Employer A) every year. In addition, Employer B gives its
high-paid workers a larger share of its annual contribution. High-paid workers in
Employer A’s plan get 18% of the annual contribution while high-paid workers in
Employer B’s plan get 26%. Employer B may also be entitled to reduce its costs further
by including in the plan only the minimum number of low-paid employees required to
pass the non-discrimination tests of Internal Revenue Code §§ 401(a)(4) and 410(b). As
Example 1 indicates, if Employer B can legally reduce the number of low-paid
employees in the plan to the minimum, it will save an additional $400,000, its high-paid
workers will get 30% of the annual contribution and it will contribute only about 40% as
much as Employer A each year.
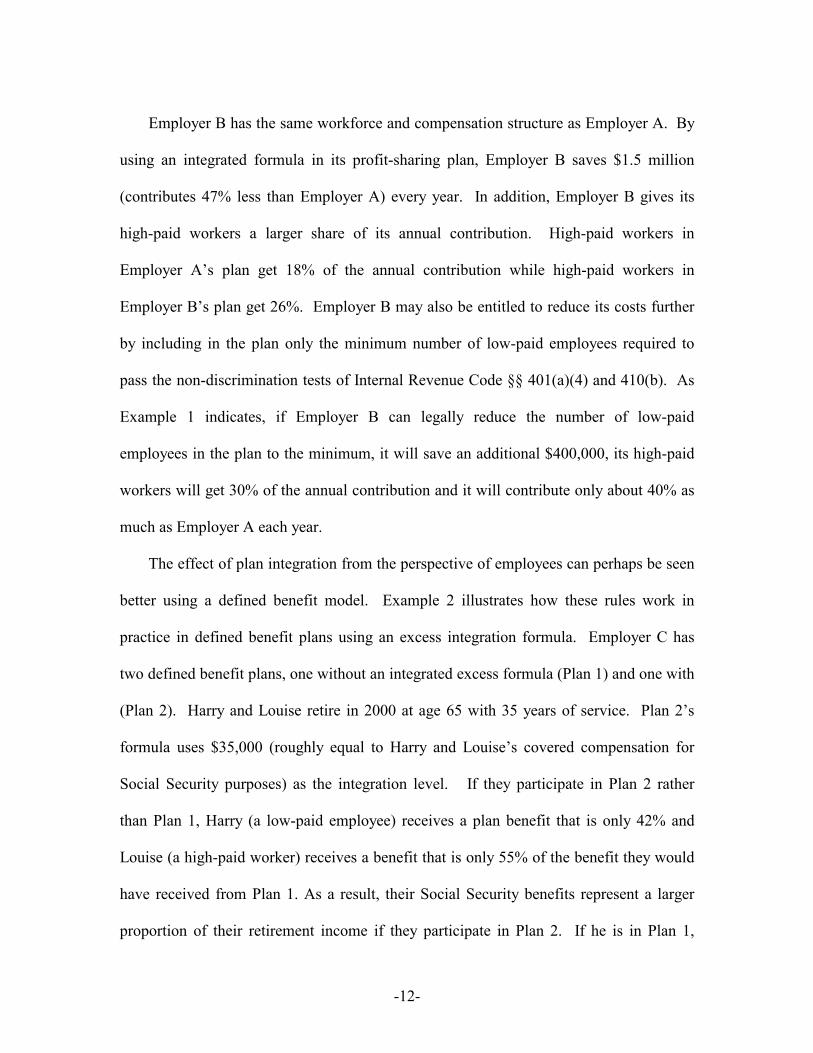
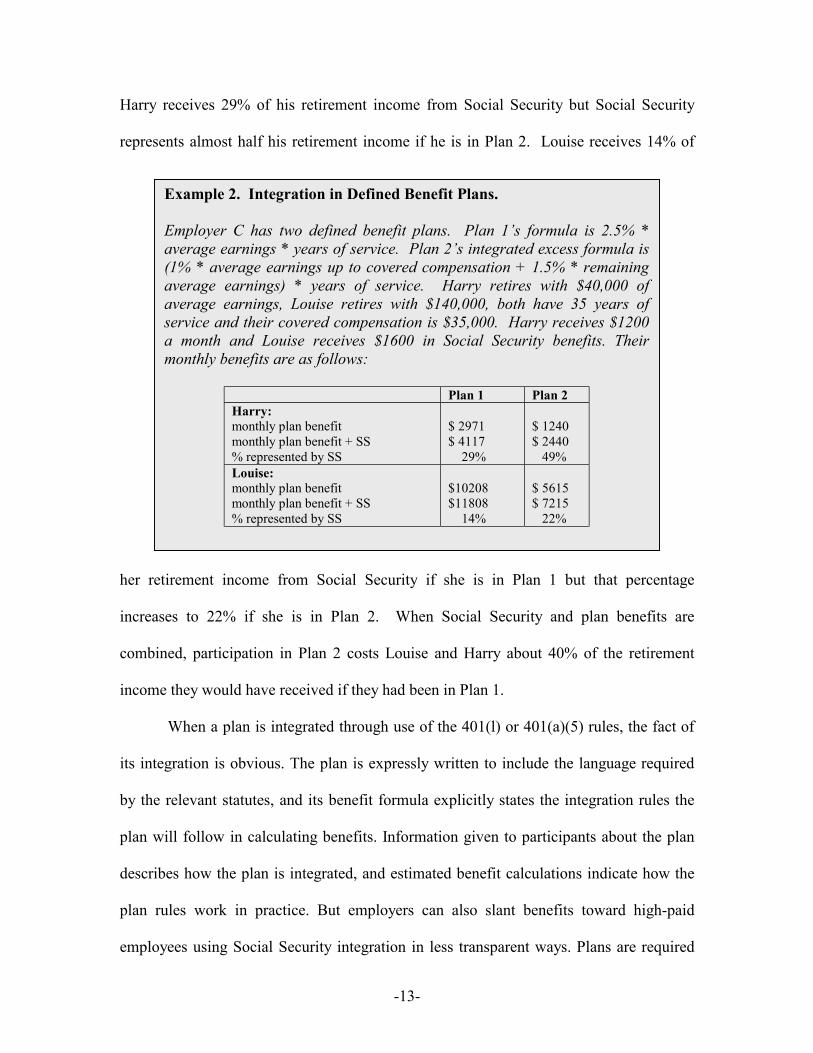
The effect of plan integration from the perspective of employees can perhaps be seen
better using a defined benefit model. Example 2 illustrates how these rules work in
practice in defined benefit plans using an excess integration formula. Employer C has
two defined benefit plans, one without an integrated excess formula (Plan 1) and one with
(Plan 2). Harry and Louise retire in 2000 at age 65 with 35 years of service. Plan 2’s
formula uses $35,000 (roughly equal to Harry and Louise’s covered compensation for
Social Security purposes) as the integration level. If they participate in Plan 2 rather
than Plan 1, Harry (a low-paid employee) receives a plan benefit that is only 42% and
Louise (a high-paid worker) receives a benefit that is only 55% of the benefit they would
have received from Plan 1. As a result, their Social Security benefits represent a larger
proportion of their retirement income if they participate in Plan 2. If he is in Plan 1,
-13-
Harry receives 29% of his retirement income from Social Security but Social Security
represents almost half his retirement income if he is in Plan 2. Louise receives 14% of
her retirement income from Social Security if she is in Plan 1 but that percentage
increases to 22% if she is in Plan 2. When Social Security and plan benefits are
combined, participation in Plan 2 costs Louise and Harry about 40% of the retirement
income they would have received if they had been in Plan 1.
When a plan is integrated through use of the 401(l) or 401(a)(5) rules, the fact of
its integration is obvious. The plan is expressly written to include the language required
by the relevant statutes, and its benefit formula explicitly states the integration rules the
plan will follow in calculating benefits. Information given to participants about the plan
describes how the plan is integrated, and estimated benefit calculations indicate how the
plan rules work in practice. But employers can also slant benefits toward high-paid
employees using Social Security integration in less transparent ways. Plans are required
Example 2. Integration in Defined Benefit Plans. Employer C has two defined benefit plans. Plan 1’s formula is 2.5% * average earnings * years of service. Plan 2’s integrated excess formula is (1% * average earnings up to covered compensation + 1.5% * remaining average earnings) * years of service. Harry retires with $40,000 of average earnings, Louise retires with $140,000, both have 35 years of service and their covered compensation is $35,000. Harry receives $1200 a month and Louise receives $1600 in Social Security benefits. Their monthly benefits are as follows:
Plan 1 Plan 2 Harry: monthly plan benefit monthly plan benefit + SS % represented by SS
$ 2971 $ 4117 29%
$ 1240 $ 2440 49%
Louise: monthly plan benefit monthly plan benefit + SS % represented by SS
$10208 $11808 14%
$ 5615 $ 7215 22%
-14-
to pass mathematical tests every year under Internal Revenue Code §§ 401(a)(4) and
410(b) to demonstrate that their plans do not provide benefits that favor high-paid
employees. In order to pass these tests, employers may “impute” benefits derived from
Social Security in calculating the benefits received by high-paid and low-paid workers.4
This technique permits employers, depending on their employee demographics, to justify
a benefits formula that would otherwise be discriminatory even when their plans do not
comply with the 401(l) rules.
The following analysis considers only those plans that are explicitly integrated
with Social Security through the 401(l) or 401(a)(5) rules. The federal government does
not collect systematic data on the use by employers of “imputed” integration to pass the
tax code’s non-discrimination tests and therefore the extent of this form of integration is
unknown.
Form 5500 Data
As mandated by ERISA § 103, the federal government obtains the equivalent of
census information on the private pension system each year. Every welfare and pension
plan subject to ERISA is required to file an annual report on Form 5500 providing
comprehensive information about the plan and its participants, its financial condition, and
its operation. The Form 5500 is not designed or intended to collect general data on
benefit plans for research purposes. It is instead a report by each plan to the federal
government that it complies with important tax and ERISA requirements and is therefore
entitled to retain its tax-free status as a qualified plan. The data therefore emphasize
information about the plan, its funded status, its assets and income, and its compliance
with relevant aspects of ERISA and tax law. They do not provide information on
-15-
individual plan formulas. Neither do they provide any information on such participant
characteristics as income levels, gender, race, or occupation or permit estimation of
actual participant benefits and account sizes. They do provide some information on
employer characteristics but that information is minimal.
With those qualifications, the Form 5500 data still represent a unique and
important source of information on the private pension system. The unit of analysis is an
individual plan, whether sponsored by one employer or many. Each plan is a separate
record, even if an employer has more than one plan. The meaning of the term “plan” in
this context is highly technical. In legal terms and also for purposes of the Form 5500, a
“plan” is a dedicated pool of assets available to pay benefits to the individuals and on the
terms described in a formal, written document. Separate plans are required to file
separate Form 5500s. There are, however, many plan types, particularly in the defined
contribution world, which can exist either as a stand-alone plan or as one component in a
combination plan. For example, employees in a single company could participate in two
separate plans: an ESOP and a 401(k) plan, neither of which can be integrated. They
might also participate in a third plan: a profit-sharing plan with an integrated contribution
formula. Each of these plans would file a separate Form 5500. Alternatively, their
employer could create a single plan by combining its 401(k) either with its profit-sharing
plan that has an integrated formula or with its ESOP that does not. Either combined plan
would file a single Form 5500. The ways in which employers choose to aggregate or
disaggregate different types of defined contribution plans depends more on the ratio of
low-paid to high-paid workers needed in a particular plan to pass the non-discrimination
-16-
tests than on the plan characteristics themselves. So while the term “plan” has a strict
legal meaning that meaning does not provide much clarity for analytical purposes.
Despite these limitations, these data provide a relatively accurate and comprehensive
picture of the actual plans that make up the private pension system in any given year.
With some notable exceptions such as plans sponsored by state and local government or
by churches, the data encompass the universe of employer-sponsored pension plans. Few
of the omitted plans are permitted to or do take advantage of plan integration so these
data largely represent the universe of integrated plans as well. For years prior to 1999,
plans with at least 100 participants were required to file the full Form 5500, a very
complicated, 6-page form every year.5 Plans with less than 100 participants filed the
more limited Form 5500-C/R series. This series generally required small plans to submit
comprehensive data on their participants and their finances only every third year.
Independent of size, defined benefit and defined contribution plans sponsored by private
employers under Internal Revenue Code § 401(a) must provide the most extensive data.
Plans sponsored by not-for-profit employers under a special section of the tax code,
Internal Revenue Code § 403(b), provide only limited information.
This research analyzes data from the full Form 5500s and the Form 5500C/R
series filed during the 1993-1997 period. Data for 1998 have since been obtained and are
expected to be added to the analysis later. The 1993-1997 period is important because it
spans a period when both the relevant legal rules for integrated plans and the data
collected on Form 5500 were relatively stable. It is also the last period in which
information on the prevalence of Social Security integration by private plans is available.
Beginning in 1999, plans are no longer required to indicate whether they are integrated.
-17-
The dataset analyzed in this study is large and contains about 700,000 individual
plan records in any given year, each with about 500 variables. Appendix B describes
how the dataset was created from the raw data obtained from the Department of Labor.
This dataset differs in some important respects from a similar dataset used by the Pension
and Welfare Benefits Administration to analyze the Form 5500 filings each year.
Appendix C describes the basic differences in the construction of the two datasets. It also
provides some information on the numbers and types of plans in each that indicate that
the datasets are, in fact, quite comparable.
The primary difference between the two datasets, however, is that the dataset used in
this study includes multiple years of data. That factor adds a number of complications to
the analysis. From a preliminary stage, it was apparent that data from individual plans
are often quite inconsistent on a year-to-year basis. In part, this reflects the dynamics of
the private pension system where plans can be merged with others or spun-off as a new
plan from an existing plan from one year to the next. Important plan features can also be
changed through a plan amendment. However, the origin of most inconsistencies seems
to be errors in filling out the forms properly, arising either from ignorance or
carelessness. Many plans file reports each year that contain nonsensical data or
contradict information filed in earlier years in ways that are implausible or impossible. In
order to minimize the effect of such inconsistencies, a number of basic classification
variables were created for analytical purposes. Those variables and their definitions can
be found in Appendix A.
-18-
ANALYSIS
Overview of the Private Pension System, 1993-1997
The private pension system exhibits two important characteristics that are often over-
looked. First, the vast majority of plans are small, that is, they have fewer than 100
participants. Less than 10% of the plans filing Forms 5500s in any given year - some
60,000 to 70,000 plans - have more than 100 participants. So the private pension system
as a whole is largely composed of small plans.
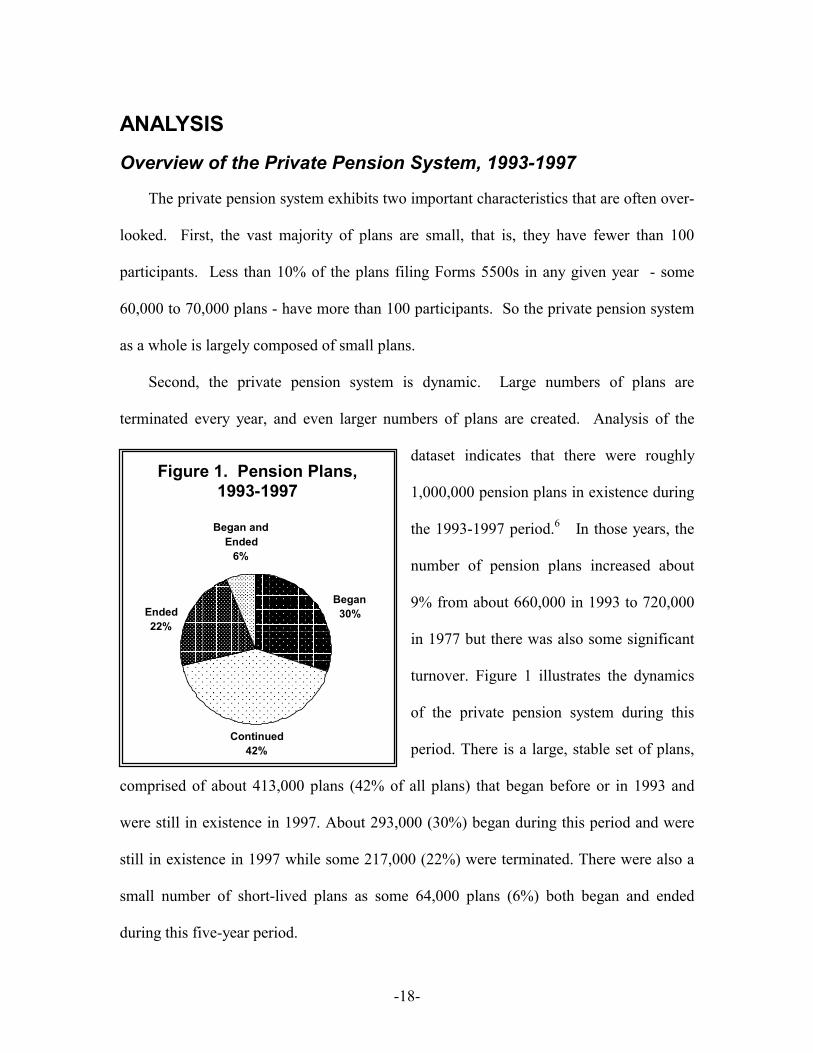
Second, the private pension system is dynamic. Large numbers of plans are
terminated every year, and even larger numbers of plans are created. Analysis of the
dataset indicates that there were roughly
1,000,000 pension plans in existence during
the 1993-1997 period.6 In those years, the
number of pension plans increased about
9% from about 660,000 in 1993 to 720,000
in 1977 but there was also some significant
turnover. Figure 1 illustrates the dynamics
of the private pension system during this
period. There is a large, stable set of plans,
comprised of about 413,000 plans (42% of all plans) that began before or in 1993 and
were still in existence in 1997. About 293,000 (30%) began during this period and were
still in existence in 1997 while some 217,000 (22%) were terminated. There were also a
small number of short-lived plans as some 64,000 plans (6%) both began and ended
during this five-year period.
Figure 1. Pension Plans, 1993-1997
Began and Ended
6%
Began 30% Ended
22%
Continued 42%
-19-
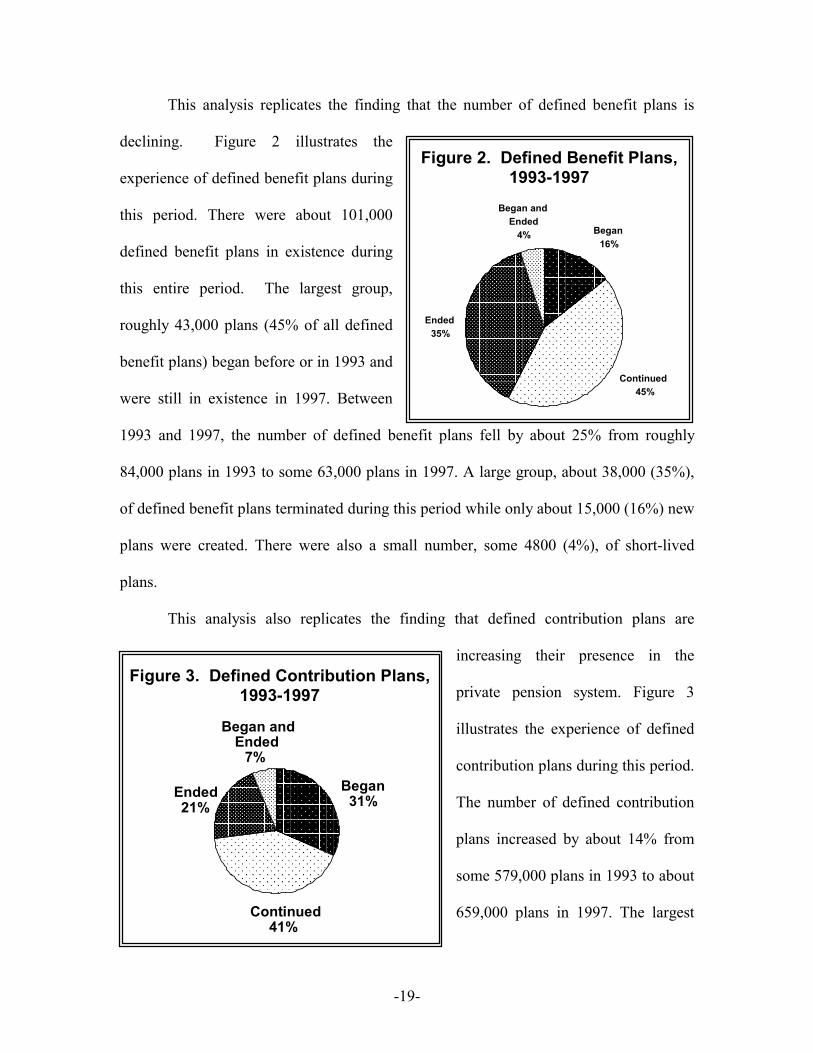
This analysis replicates the finding that the number of defined benefit plans is
declining. Figure 2 illustrates the
experience of defined benefit plans during
this period. There were about 101,000
defined benefit plans in existence during
this entire period. The largest group,
roughly 43,000 plans (45% of all defined
benefit plans) began before or in 1993 and
were still in existence in 1997. Between
1993 and 1997, the number of defined benefit plans fell by about 25% from roughly
84,000 plans in 1993 to some 63,000 plans in 1997. A large group, about 38,000 (35%),
of defined benefit plans terminated during this period while only about 15,000 (16%) new
plans were created. There were also a small number, some 4800 (4%), of short-lived
plans.
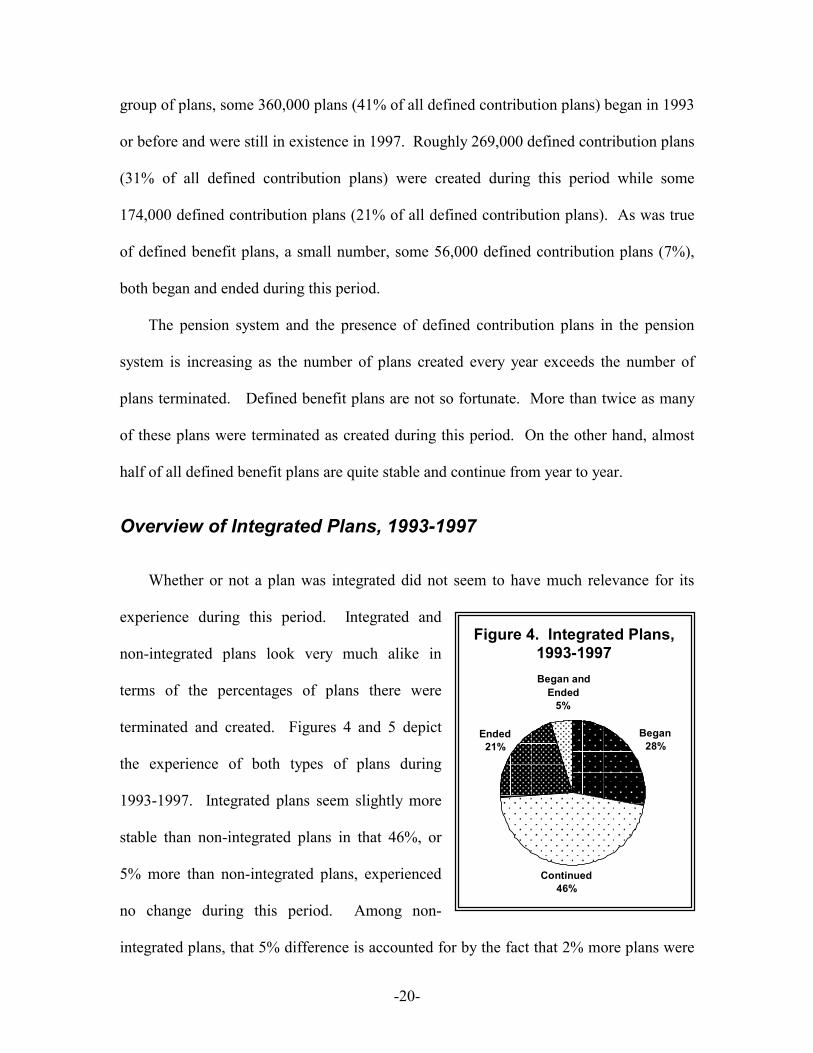
This analysis also replicates the finding that defined contribution plans are
increasing their presence in the
private pension system. Figure 3
illustrates the experience of defined
contribution plans during this period.
The number of defined contribution
plans increased by about 14% from
some 579,000 plans in 1993 to about
659,000 plans in 1997. The largest
Figure 2. Defined Benefit Plans, 1993-1997
Began and Ended
4% Began 16%
Ended 35%
Continued 45%
Figure 3. Defined Contribution Plans,
1993-1997
Continued 41%
Ended 21%
Began 31%
Began and Ended
7%
-20-
group of plans, some 360,000 plans (41% of all defined contribution plans) began in 1993
or before and were still in existence in 1997. Roughly 269,000 defined contribution plans
(31% of all defined contribution plans) were created during this period while some
174,000 defined contribution plans (21% of all defined contribution plans). As was true
of defined benefit plans, a small number, some 56,000 defined contribution plans (7%),
both began and ended during this period.
The pension system and the presence of defined contribution plans in the pension
system is increasing as the number of plans created every year exceeds the number of
plans terminated. Defined benefit plans are not so fortunate. More than twice as many
of these plans were terminated as created during this period. On the other hand, almost
half of all defined benefit plans are quite stable and continue from year to year.
Overview of Integrated Plans, 1993-1997
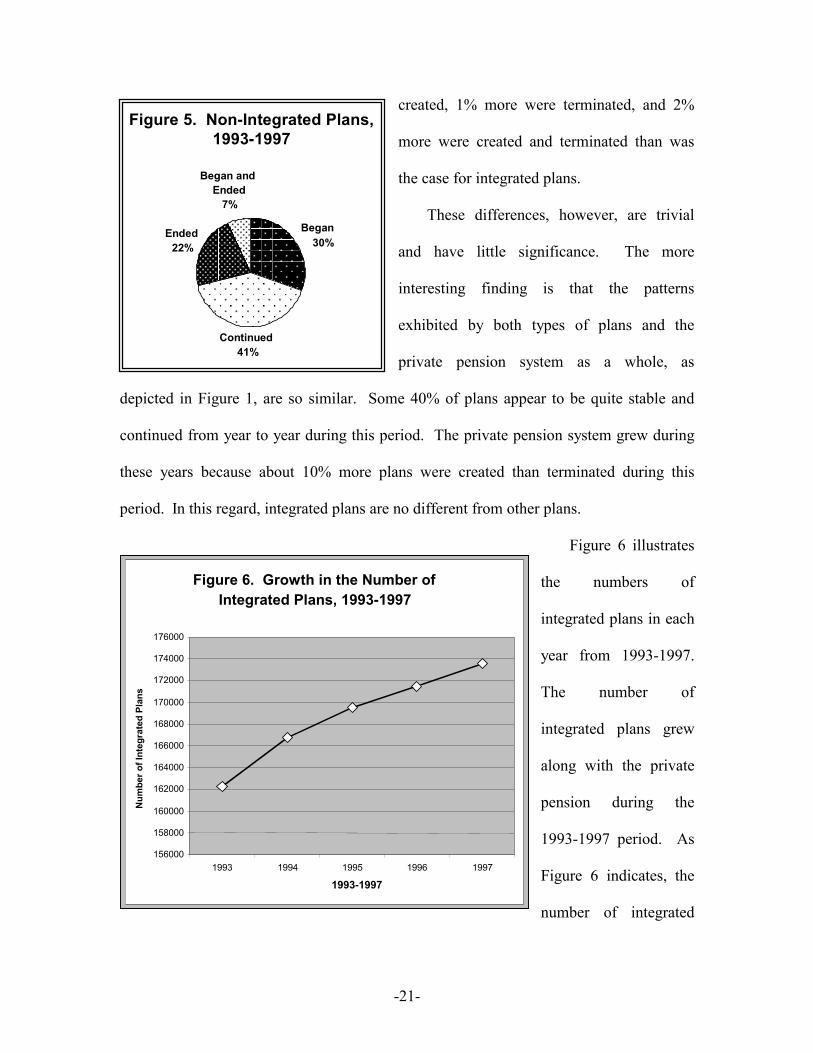
Whether or not a plan was integrated did not seem to have much relevance for its
experience during this period. Integrated and
non-integrated plans look very much alike in
terms of the percentages of plans there were
terminated and created. Figures 4 and 5 depict
the experience of both types of plans during
1993-1997. Integrated plans seem slightly more
stable than non-integrated plans in that 46%, or
5% more than non-integrated plans, experienced
no change during this period. Among non-
integrated plans, that 5% difference is accounted for by the fact that 2% more plans were
Figure 4. Integrated Plans, 1993-1997 Began and
Ended 5%
Began 28% Ended
21%
Continued 46%
-21-
created, 1% more were terminated, and 2%
more were created and terminated than was
the case for integrated plans.
These differences, however, are trivial
and have little significance. The more
interesting finding is that the patterns
exhibited by both types of plans and the
private pension system as a whole, as
depicted in Figure 1, are so similar. Some 40% of plans appear to be quite stable and
continued from year to year during this period. The private pension system grew during
these years because about 10% more plans were created than terminated during this
period. In this regard, integrated plans are no different from other plans.
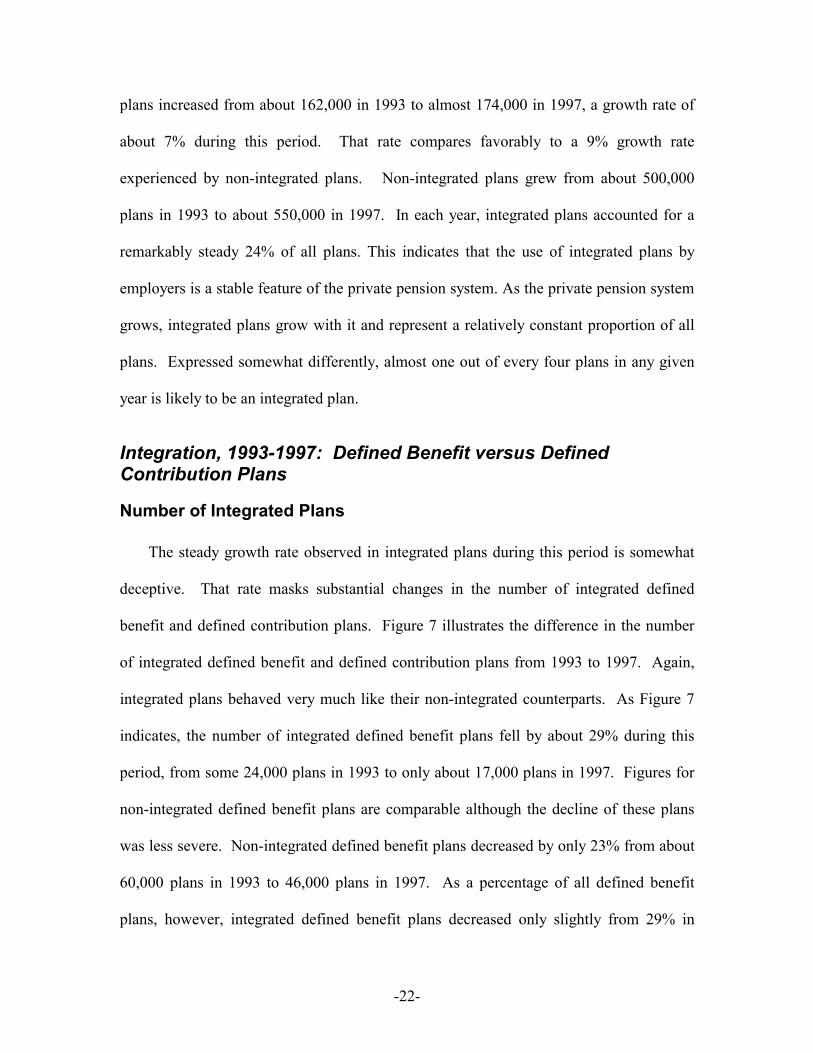
Figure 6 illustrates
the numbers of
integrated plans in each
year from 1993-1997.
The number of
integrated plans grew
along with the private
pension during the
1993-1997 period. As
Figure 6 indicates, the
number of integrated
Figure 6. Growth in the Number of
Integrated Plans, 1993-1997
156000 158000 160000 162000 164000 166000 168000 170000 172000 174000 176000
1993 1994 1995 1996 1997 1993-1997
Num
ber o
f Int
egra
ted
Plan
s Figure 5. Non-Integrated Plans,
1993-1997 Began and
Ended 7%
Began 30%
Continued 41%
Ended 22%
-22-
plans increased from about 162,000 in 1993 to almost 174,000 in 1997, a growth rate of
about 7% during this period. That rate compares favorably to a 9% growth rate
experienced by non-integrated plans. Non-integrated plans grew from about 500,000
plans in 1993 to about 550,000 in 1997. In each year, integrated plans accounted for a
remarkably steady 24% of all plans. This indicates that the use of integrated plans by
employers is a stable feature of the private pension system. As the private pension system
grows, integrated plans grow with it and represent a relatively constant proportion of all
plans. Expressed somewhat differently, almost one out of every four plans in any given
year is likely to be an integrated plan.
Integration, 1993-1997: Defined Benefit versus Defined Contribution Plans
Number of Integrated Plans
The steady growth rate observed in integrated plans during this period is somewhat
deceptive. That rate masks substantial changes in the number of integrated defined
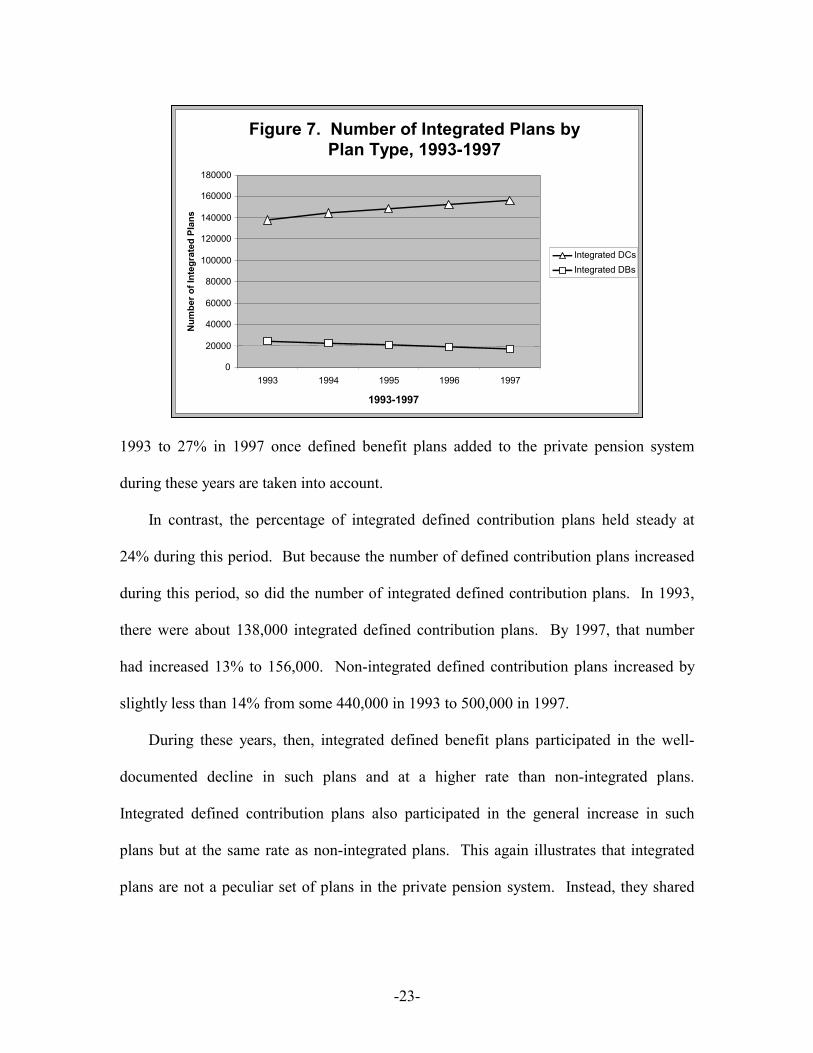
benefit and defined contribution plans. Figure 7 illustrates the difference in the number
of integrated defined benefit and defined contribution plans from 1993 to 1997. Again,
integrated plans behaved very much like their non-integrated counterparts. As Figure 7
indicates, the number of integrated defined benefit plans fell by about 29% during this
period, from some 24,000 plans in 1993 to only about 17,000 plans in 1997. Figures for
non-integrated defined benefit plans are comparable although the decline of these plans
was less severe. Non-integrated defined benefit plans decreased by only 23% from about
60,000 plans in 1993 to 46,000 plans in 1997. As a percentage of all defined benefit
plans, however, integrated defined benefit plans decreased only slightly from 29% in
-23-
1993 to 27% in 1997 once defined benefit plans added to the private pension system
during these years are taken into account.
In contrast, the percentage of integrated defined contribution plans held steady at
24% during this period. But because the number of defined contribution plans increased
during this period, so did the number of integrated defined contribution plans. In 1993,
there were about 138,000 integrated defined contribution plans. By 1997, that number
had increased 13% to 156,000. Non-integrated defined contribution plans increased by
slightly less than 14% from some 440,000 in 1993 to 500,000 in 1997.
During these years, then, integrated defined benefit plans participated in the well-
documented decline in such plans and at a higher rate than non-integrated plans.
Integrated defined contribution plans also participated in the general increase in such
plans but at the same rate as non-integrated plans. This again illustrates that integrated
plans are not a peculiar set of plans in the private pension system. Instead, they shared
Figure 7. Number of Integrated Plans by
Plan Type, 1993-1997
0 20000 40000 60000 80000
100000 120000 140000 160000 180000
1993 1994 1995 1996 1997 1993-1997
Num
ber o
f Int
egra
ted
Plan
s
Integrated DCs Integrated DBs
-24-
the experience of their non-integrated counterparts during this period and exhibited very
similar patterns of change.
Number of Participants in Integrated Plans
Although the number of integrated plans provides some estimate of the
significance of plan integration in the private pension system, it does not provide a
complete picture. Because many plans are small, this measure may exaggerate the
importance of integrated plans. One alternative indicator is the number of participants in
integrated plans. Because of constraints in the data, the available definition of
“participant” covers more than just current employees.7 It generally includes all
individuals who are entitled to a benefit under the plan so retired employees and
beneficiaries of deceased employees entitled to a benefit, among other categories, are
reflected in the number of participants in a given plan. In practice, the term participant is
almost synonymous with current employees in defined contribution plans because most
former employees take their benefits with them when they leave. Defined benefit plans,
on the other hand, usually require participants to attain retirement age before paying out
benefits that then continue for many years. So the number of participants in these plans
will include former employees who are waiting for benefits as well as retirees who are
receiving them.
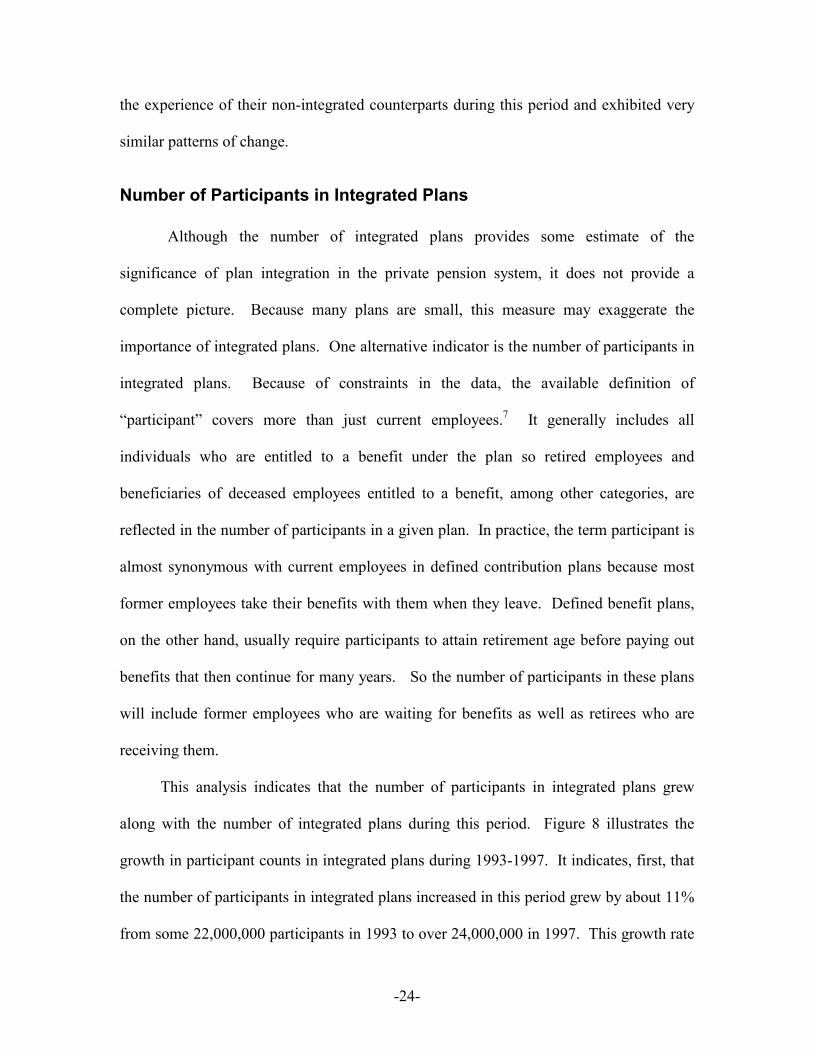
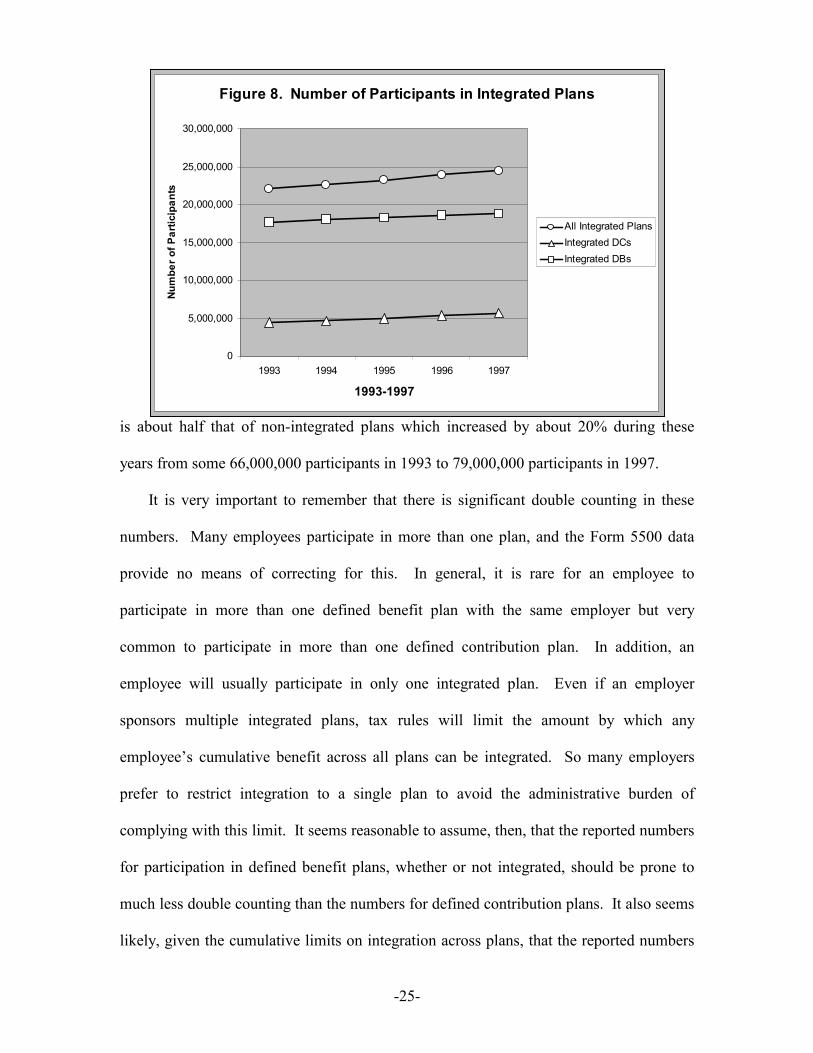
This analysis indicates that the number of participants in integrated plans grew
along with the number of integrated plans during this period. Figure 8 illustrates the
growth in participant counts in integrated plans during 1993-1997. It indicates, first, that
the number of participants in integrated plans increased in this period grew by about 11%
from some 22,000,000 participants in 1993 to over 24,000,000 in 1997. This growth rate
-25-
is about half that of non-integrated plans which increased by about 20% during these
years from some 66,000,000 participants in 1993 to 79,000,000 participants in 1997.
It is very important to remember that there is significant double counting in these
numbers. Many employees participate in more than one plan, and the Form 5500 data
provide no means of correcting for this. In general, it is rare for an employee to
participate in more than one defined benefit plan with the same employer but very
common to participate in more than one defined contribution plan. In addition, an
employee will usually participate in only one integrated plan. Even if an employer
sponsors multiple integrated plans, tax rules will limit the amount by which any
employee’s cumulative benefit across all plans can be integrated. So many employers
prefer to restrict integration to a single plan to avoid the administrative burden of
complying with this limit. It seems reasonable to assume, then, that the reported numbers
for participation in defined benefit plans, whether or not integrated, should be prone to
much less double counting than the numbers for defined contribution plans. It also seems
likely, given the cumulative limits on integration across plans, that the reported numbers
Figure 8. Number of Participants in Integrated Plans
0
5,000,000
10,000,000
15,000,000
20,000,000
25,000,000
30,000,000
1993 1994 1995 1996 1997
1993-1997
Num
ber o
f Par
ticip
ants
All Integrated PlansIntegrated DCsIntegrated DBs
-26-
for participation in integrated defined contribution plans are relatively reliable. The
numbers for participation in non-integrated defined contribution plans, however, are
clearly exaggerated but it is impossible to estimate by how much.
Figure 8 also indicates that, although there are far more integrated defined
contribution plans than defined benefit plans, the majority of participants in integrated
plans are in defined benefit plans. But participation in integrated defined contribution
plans is growing rapidly. In 1993, there were about 4,400,000 participants in integrated
defined contribution plans. By 1997, there were 5,600,000, an increase of about 29%
during that period. Integrated defined benefit plans have about 4 times more participants.
In 1993, there were almost 18,000,000 participants in integrated defined benefit plans
but, by 1997, that number had increased by only about 1,000,000 participants, an increase
of some 6%.
Because the double counting problem makes any conclusions about participation
rates in integrated and non-integrated defined contribution plans suspect, the most that
can be safely said is that integrated defined contribution plans probably represent at a
minimum some 10% of all defined contribution plan participants. In 1993, there were
41,000,000 participants in non-integrated defined contribution plans, and that number
increased to about 54,000,000 in 1997. The story with respect to defined benefit plans is
different. In 1993, there were 24,600,000 participants in non-integrated defined benefit
plans, and that number increased to only 24,800,000 by 1997. This rate of increase
parallels that of integrated defined benefit plans. As a result, integrated defined benefit
plans represented about 42% of all participants in defined benefit plans throughout this
period.

-27-
Integration by Plan Type and Size
One of the reasons why there are more integrated defined contribution plans but
integrated defined benefit plans have many more participants is that integrated defined
contribution plans tend to be small. Figure 9 illustrates the percent of plans that are
integrated by type and size of the plan, determined by using each plan’s average number
of participants during this five-year period. It indicates that there is a bimodal
distribution of integrated defined benefit and defined contribution plans in terms of plan
size. Participants in integrated defined contribution plans are concentrated in small plans,
and about 75% of integrated defined contribution plans have fewer than 20 participants.
Less than 10% of defined contribution plans with more than 200 participants are
integrated. Defined benefit plans exhibit a very different trend. They closely resemble
integrated defined contribution plans among the smallest plans. As the size of the plan
Figure 9. Integration by Plan Type and Plan Size
0%
10%
20%
30%
40%
50%
60%
1-2 2-5 5-10
10-20
20-50
50-10
0
100-2
00
200-5
00
500-1
000
1000
-2000
2000
-5000
5000
-1000
0
1000
0-200
00
2000
0-500
00
5000
0 or m
ore
Average Number of Participants, 1993-1997
Perc
enta
ge o
f Pla
ns th
at a
re In
tegr
ated
Integrated DCsIntegrated DBs
-28-
increases, however, so does the percent of integrated plans. Once defined benefit plans
have more than 2,000 participants they represent about 45-50% of all such plans. The
very largest plans, those with more than 50,000 participants, are slightly less likely (42%)
to be integrated but there are only a few (128) such plans.
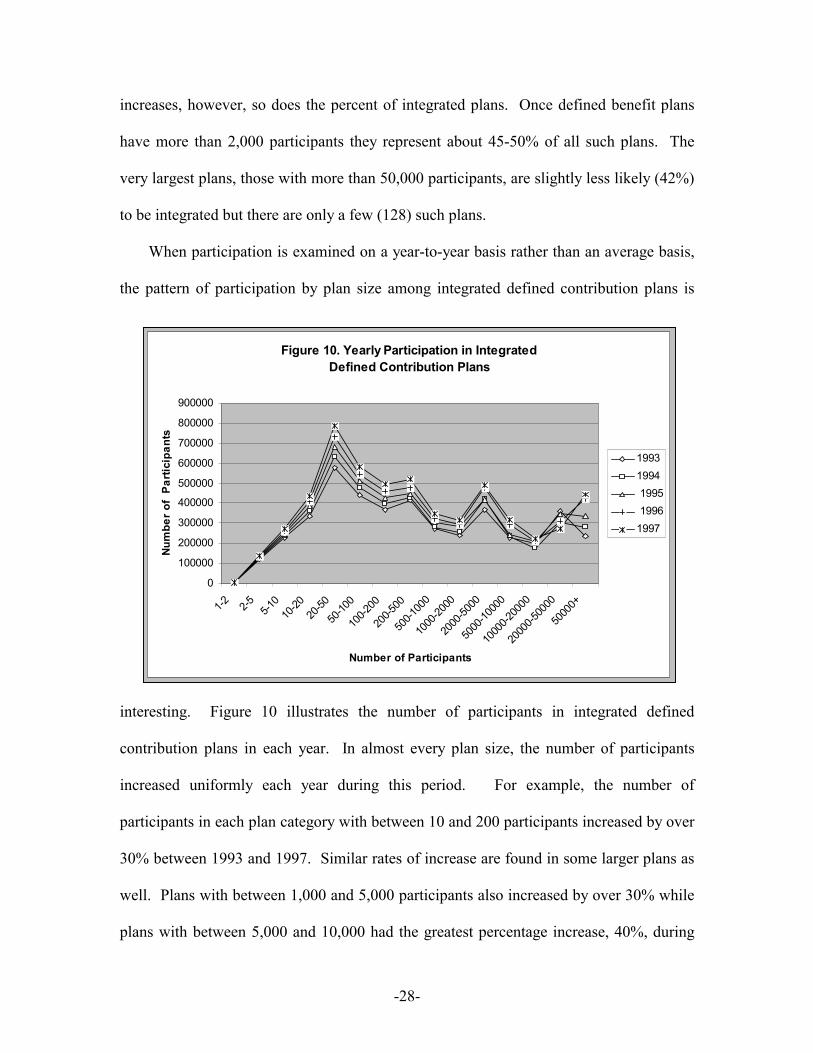
When participation is examined on a year-to-year basis rather than an average basis,
the pattern of participation by plan size among integrated defined contribution plans is
interesting. Figure 10 illustrates the number of participants in integrated defined
contribution plans in each year. In almost every plan size, the number of participants
increased uniformly each year during this period. For example, the number of
participants in each plan category with between 10 and 200 participants increased by over
30% between 1993 and 1997. Similar rates of increase are found in some larger plans as
well. Plans with between 1,000 and 5,000 participants also increased by over 30% while
plans with between 5,000 and 10,000 had the greatest percentage increase, 40%, during
Figure 10. Yearly Participation in Integrated Defined Contribution Plans
0
100000
200000
300000
400000
500000
600000
700000
800000
900000
1-2 2-5 5-10
10-20
20-50
50-10
0
100-2
00
200-5
00
500-1
000
1000
-2000
2000
-5000
5000
-1000
0
1000
0-200
00
2000
0-500
00
5000
0+
Number of Participants
Num
ber o
f Pa
rtici
pant
s
19931994 1995 19961997
-29-
this period. The largest plan size, plans with more than 50,000 participants, had the
highest percentage increase during this period. There are, however, only 4 plans in this
category so this change has little significance.
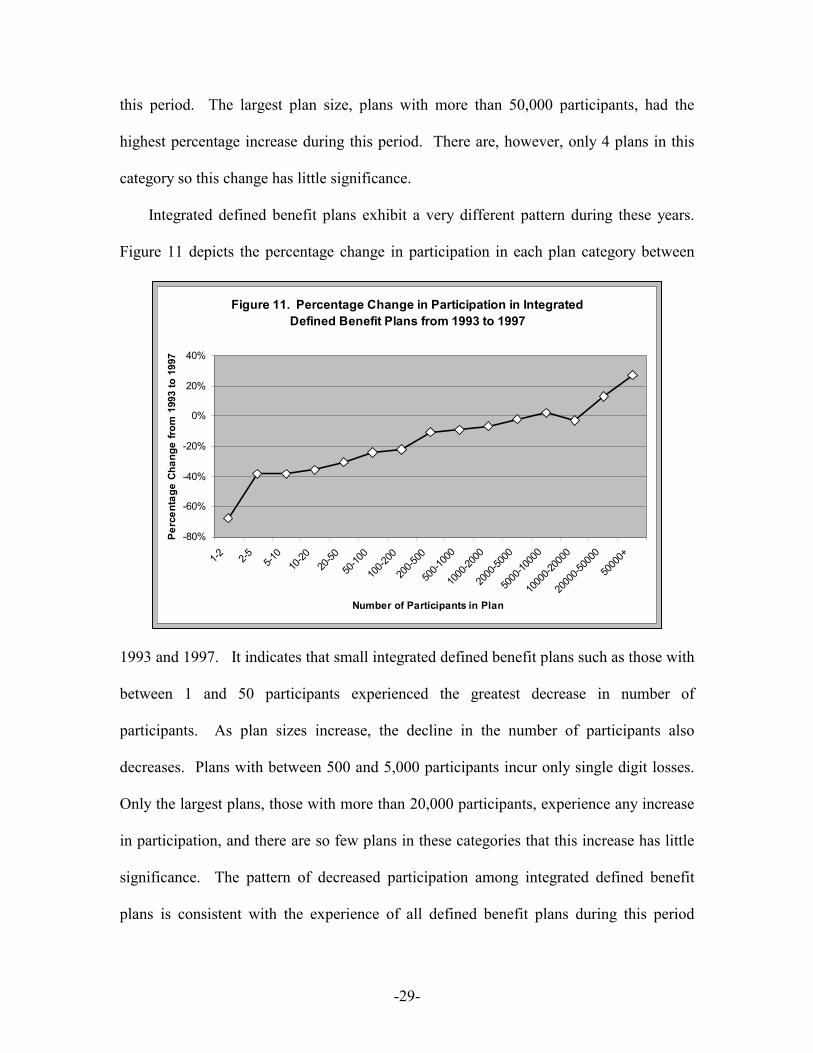
Integrated defined benefit plans exhibit a very different pattern during these years.
Figure 11 depicts the percentage change in participation in each plan category between
1993 and 1997. It indicates that small integrated defined benefit plans such as those with
between 1 and 50 participants experienced the greatest decrease in number of
participants. As plan sizes increase, the decline in the number of participants also
decreases. Plans with between 500 and 5,000 participants incur only single digit losses.
Only the largest plans, those with more than 20,000 participants, experience any increase
in participation, and there are so few plans in these categories that this increase has little
significance. The pattern of decreased participation among integrated defined benefit
plans is consistent with the experience of all defined benefit plans during this period
Figure 11. Percentage Change in Participation in Integrated Defined Benefit Plans from 1993 to 1997
-80%
-60%
-40%
-20%
0%
20%
40%
1-2 2-5 5-10
10-20
20-50
50-10
0
100-2
00
200-5
00
500-1
000
1000
-2000
2000
-5000
5000
-1000
0
1000
0-200
00
2000
0-500
00
5000
0+
Number of Participants in Plan
Perc
enta
ge C
hang
e fro
m 1
993
to 1
997
-30-
which saw a continued decline in the number of defined benefit plans, particularly those
with relatively few participants.
Employer Funding Another indicator of the significance of integration in the private pension system is
the financial standing of integrated plans, and one measure of that standing is the amount
of contributions made each year. The Form 5500 data require plans filing the full Form
5500 and the Form 5500C, but not the Form 5500R, to disclose the amount of
contributions made each year by employers and employees separately. Because only
employer contributions can be integrated, these data can provide at least some estimate of
the relative amounts contributed by employers every year. These amounts are also some
indication of the relative “generosity” of employers who sponsor integrated versus non-
integrated plans.
The data do, however, have some systematic problems. They do not include full
information on employer contributions to plans with fewer than 100 participants on an
annual basis. These plans were required to file a Form 5500C in the year they began,
every third year thereafter, and in the year they terminated. Based on the number of
Form 5500Cs and Form 5500Rs actually filed during this period, only 45% of plans with
less than 100 participants provide data on employer contributions in each year. So the
data presented below are based only upon a sub-sample of the plans in the dataset.
There are several other important biases in the data. The first relates to defined
contribution plans, which can be composed of several components. For example, an
employer may sponsor a profit-sharing plan with an integrated formula that also includes
a 401(k) component with an employer match. The employer will aggregate the amount

-31-
of the profit-sharing contribution with the amount of the match and report it all as an
employer contribution on the relevant Form 5500. The 5500 data provide no means of
estimating how much of that employer contribution is made according to an integrated
formula and how much is not. Therefore, the numbers reported below for integrated
defined contribution plans probably over-estimate the amount of employer contributions
made to integrated profit-sharing plans with a 401(k) component. The second bias relates
to defined benefit plans. Employer contributions to these plans in any year depend on the
funded status of the particular plan. If plan demographics or the investment performance
of plan assets change, the amount an employer must contribute can be very different from
year to year. Therefore, using contributions to gauge the relative wealth of a defined
benefit plan in a given year is not a particularly reliable measure but the data do not
provide more appropriate measures. On the other hand, the numbers for defined benefit
plans, both integrated and non-integrated, are a more reliable measure of employer
contributions than is the case for defined contribution plans.
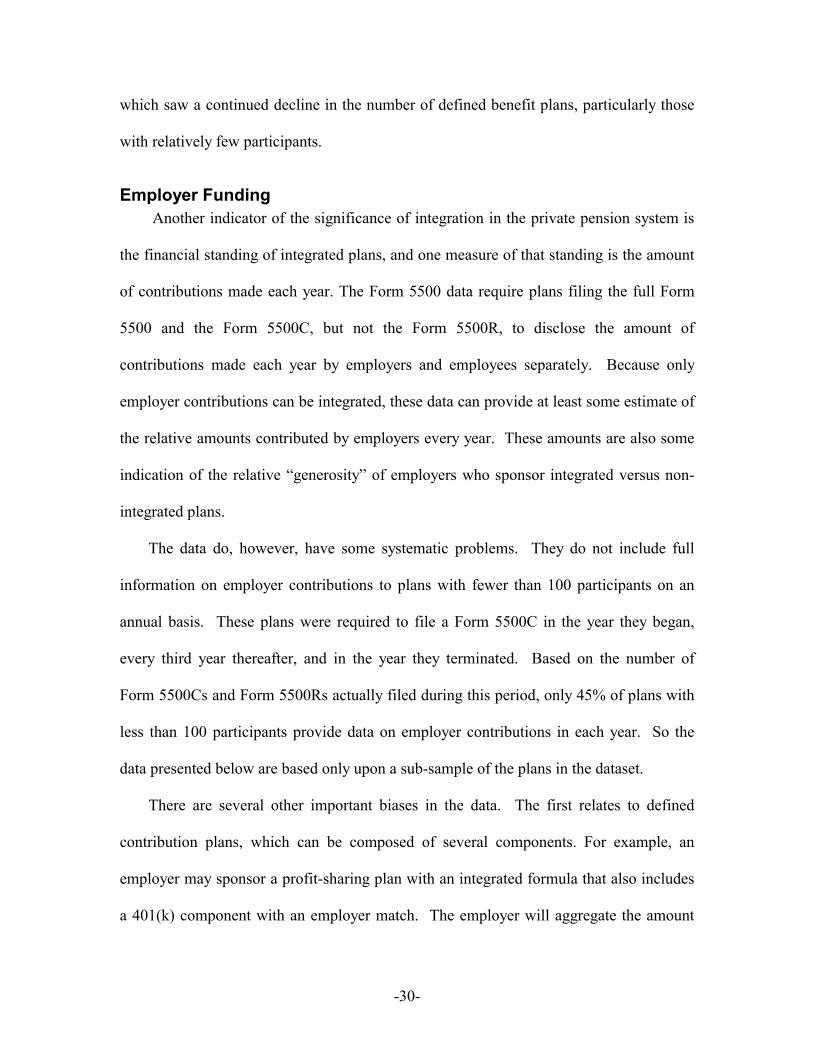
Figure 12 illustrates the amount of employer contributions made each year between
1993 and 1997 to defined benefit and defined contribution plans according to whether
they were integrated or non-integrated plans. Given the problems associated with these
data in defined contribution plans, it is important not to over-emphasize the apparent
differences between integrated and non-integrated plans in the actual dollar amounts
reported. A more reliable comparison is the relative difference between them because it
is likely that any bias in the data affects both types of plans similarly. In Figure 12, it is
apparent that both types of defined contribution plans exhibited the same general upward
trend of increasing employer contributions during these years. The growth in employer
-32-
contributions to non-integrated defined contribution plans outpaced that of integrated
defined contribution plans during these years. They received about 7 times (about $35
billion versus $5 billion) in 1993 the amount of contributions as integrated defined
contribution plans and that number increased to over 8 times ($48 billion versus $6
billion) in 1997.
Defined benefit plans exhibit a very different pattern of declining amounts of
employer contributions during these years.8 With the exception of 1995, the primary
difference is that the magnitude of the difference between integrated and non-integrated
defined benefit plans is much smaller and fell over time. Non-integrated defined benefit
plans received about 3.5 times ($37 billion versus $11 billion) the amount of
contributions in 1993 but just over 2 times ($19 billion versus $9 billion) in 1997.
During preliminary analyses, one additional interesting but tentative finding emerged
with regard to employer contributions. Using data from the sub-sample of Form 5500
and Form 5500C filers that provide information on actual employer contributions, it
Figure 12. Annual Employer Contributions,Integrated and Non-Integrated Plans
0
5,000,000,000
10,000,000,000
15,000,000,000
20,000,000,000
25,000,000,000
30,000,000,000
35,000,000,000
40,000,000,000
45,000,000,000
50,000,000,000
1993 1994 1995 1996 1997
1993-1997
Empl
oyer
Con
tribu
tions
in $
Integrated DCsIntegrated DBsNon-Integrated DCsNon-Integrated DBs
-33-
appeared that the ratio of the amount of employer contributions to the number of plan
participants was different in defined contribution and defined benefit plans. These
analyses indicated that while integrated defined contribution plans comprised only about
9% of the participants in all defined contribution plans they received about 13% of the
employer contributions. The opposite trend was observed in integrated defined benefit
plans. They comprised about 41% of participants in all defined benefit plans but received
on average only about 24% of the contributions. The analysis was expanded to include
imputed data from Form 5500R files in each year, and the same results were obtained.9
The meaning of this finding is unclear. It may be that integrated defined benefit
plans which tend to be large are used by employers to provide far less generous benefits.
On the other hand, it may just be that these plans are older and are better funded so they
have a reduced need for additional contributions. They may also be shrinking in terms of
their number of participants who are active employees accruing additional benefits so
their funding requirements are less. It may also be that integrated defined contribution
plans which tend to be smaller are found in companies that can afford to make large
contributions. These companies may choose to integrate their plans so a larger
proportion of that contribution goes to higher-paid employees. The Form 5500 data,
however, provide so little information about employer characteristics that it is difficult to
account for this difference between the types of plans.
Total Plan Assets
A final indicator of the significance of integrated plans is the financial status of such
plans as measured by their total assets during the 1993-1997 period. The terms “assets”
for this purpose means the value of all assets held in each plan at the end of every plan
-34-
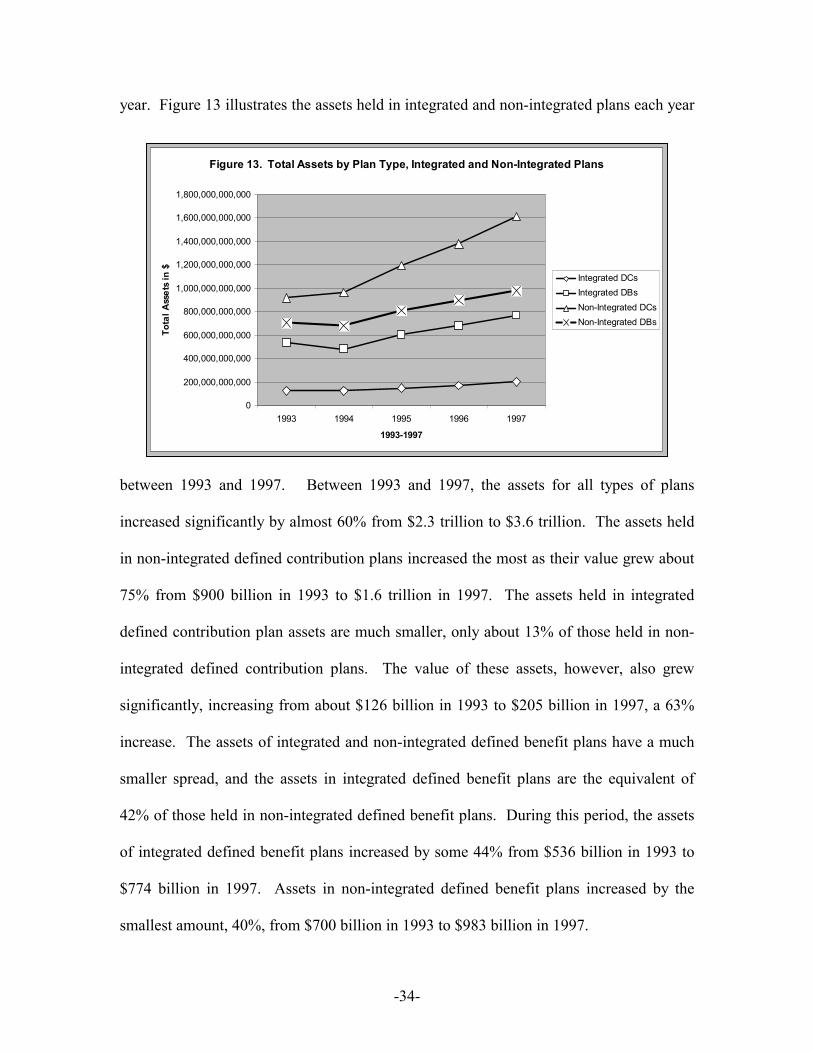
year. Figure 13 illustrates the assets held in integrated and non-integrated plans each year
between 1993 and 1997. Between 1993 and 1997, the assets for all types of plans
increased significantly by almost 60% from $2.3 trillion to $3.6 trillion. The assets held
in non-integrated defined contribution plans increased the most as their value grew about
75% from $900 billion in 1993 to $1.6 trillion in 1997. The assets held in integrated
defined contribution plan assets are much smaller, only about 13% of those held in non-
integrated defined contribution plans. The value of these assets, however, also grew
significantly, increasing from about $126 billion in 1993 to $205 billion in 1997, a 63%
increase. The assets of integrated and non-integrated defined benefit plans have a much
smaller spread, and the assets in integrated defined benefit plans are the equivalent of
42% of those held in non-integrated defined benefit plans. During this period, the assets
of integrated defined benefit plans increased by some 44% from $536 billion in 1993 to
$774 billion in 1997. Assets in non-integrated defined benefit plans increased by the
smallest amount, 40%, from $700 billion in 1993 to $983 billion in 1997.
Figure 13. Total Assets by Plan Type, Integrated and Non-Integrated Plans
0
200,000,000,000
400,000,000,000
600,000,000,000
800,000,000,000
1,000,000,000,000
1,200,000,000,000
1,400,000,000,000
1,600,000,000,000
1,800,000,000,000
1993 1994 1995 1996 1997
1993-1997
Tota
l Ass
ets
in $
Integrated DCsIntegrated DBsNon-Integrated DCsNon-Integrated DBs
-35-
Other Plan Characteristics The analysis revealed several other variables, with industry classification and
union status being the most interesting, which provide more information about integrated
plans. All plans are required to indicate the SSIC classification of the plan sponsor on
their Form 5500 each year. The largest number of all plans designated SSIC
classification 8, which covers the healthcare industry and the professions. Some 52% of
integrated defined contribution plans were in this category as were 24% of integrated
defined benefit plans. SSIC classification 5, which covers retail industries, was the
second largest category and represented between 12-14% of integrated and non-
integrated plans. Union status also provided some interesting data that distinguish
integrated from non-integrated plans. Analysis of these data indicates that union plans
are far less likely to be integrated. Only 5% of union defined contribution plans and 14%
of union defined benefit plans were integrated. Among non-union plans, the comparable
percentages are 23% and 29%, respectively.
Predicting Plan Integration
In an effort to test what factors influence the use of plan integration, a series of
logistic regressions were performed on a number of variables in the dataset. The dataset
is not rich in information about the characteristics of employers who sponsor plans but it
does provide some limited data about their corporate structure and the industry in which
they operate. There is also information about whether a plan is a union plan, when it was
created and how many low- and high-paid current employees there are in the plan as well
as in the company (or related companies) as a whole.
-36-
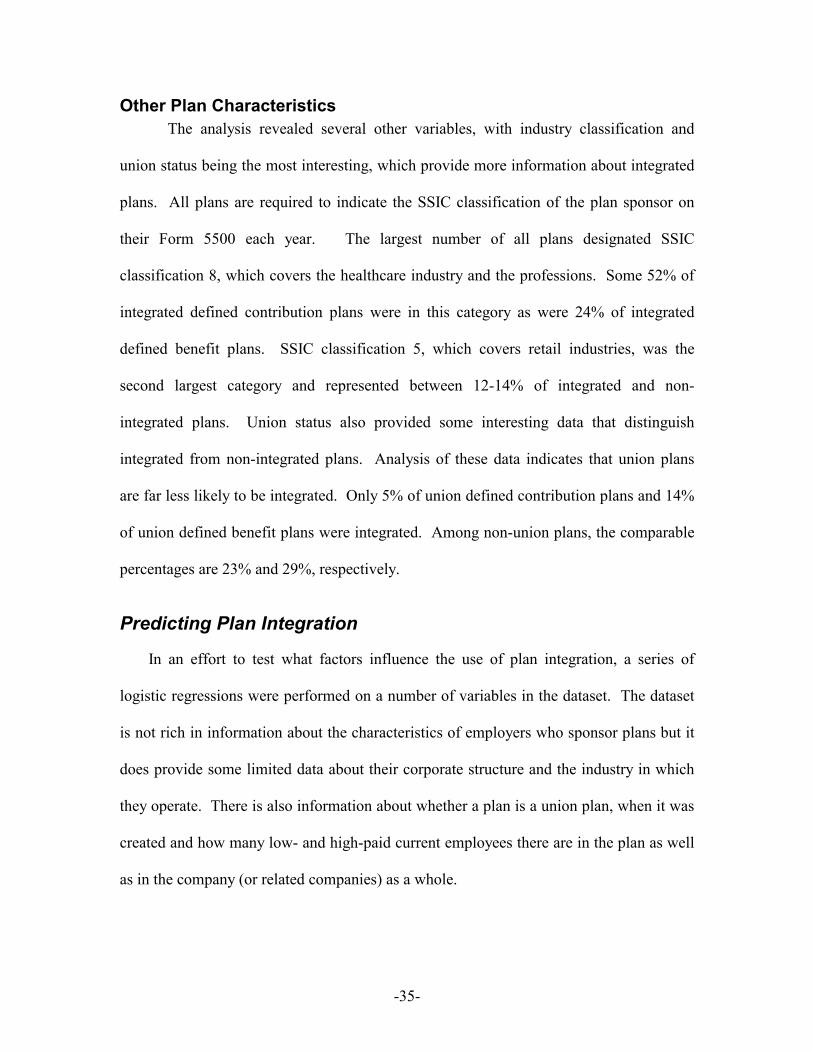
Table 2. Regression Variables Name Definition Union DB5 DB10 DB1000 DC2-50 NewDB NewDC EndedDB EndedDC SIC5DB SIC5DC SIC8DB SIC8DC Low High Single Group Early Mid80s DyingDB
Plan is a union plan DB has more than 5 participants DB has more than 10 participants DB has more than 1000 participants DC has between 2 and 50 participants DB was created 1993-1997 DC was created 1993-1997 DB was terminated 1993-1997 DC was terminated 1993-1997 DB in retail industries company DC in retail industries company DB in healthcare or professional services company DC in healthcare or professional services company Plan has a high percentage of low-paid employees Plan has a high percentage of high-paid employees Employer is a single company Employer is part of a controlled group of companies Plan was created before 1983 Plan was created in the mid-1980s DB has less than 75% active employees
Table 2 describes the final set of variables used in the regression described below,
and each variable is coded “1” if the defined characteristic is present and “0” if it is not.
The variables indicate if the plan is a union plan, when it was created, its size, the
industry code (SSIC) of the plan sponsor, its concentration of high- and low-paid
employees, whether the plan sponsor was a single company or part of a controlled group,
and the concentration of active employees. In general, these variables were selected to
explore the following hypotheses about plan integration, namely, that integration is less
likely if the plan (1) is a union plan or (2) has a high percentage of low-paid workers and
more likely if it is a plan (1) is in the retail or healthcare industries or the professions, (2)
is part of a controlled group of companies, or (3) if a defined benefit plan, has a low
percentage of active employees.
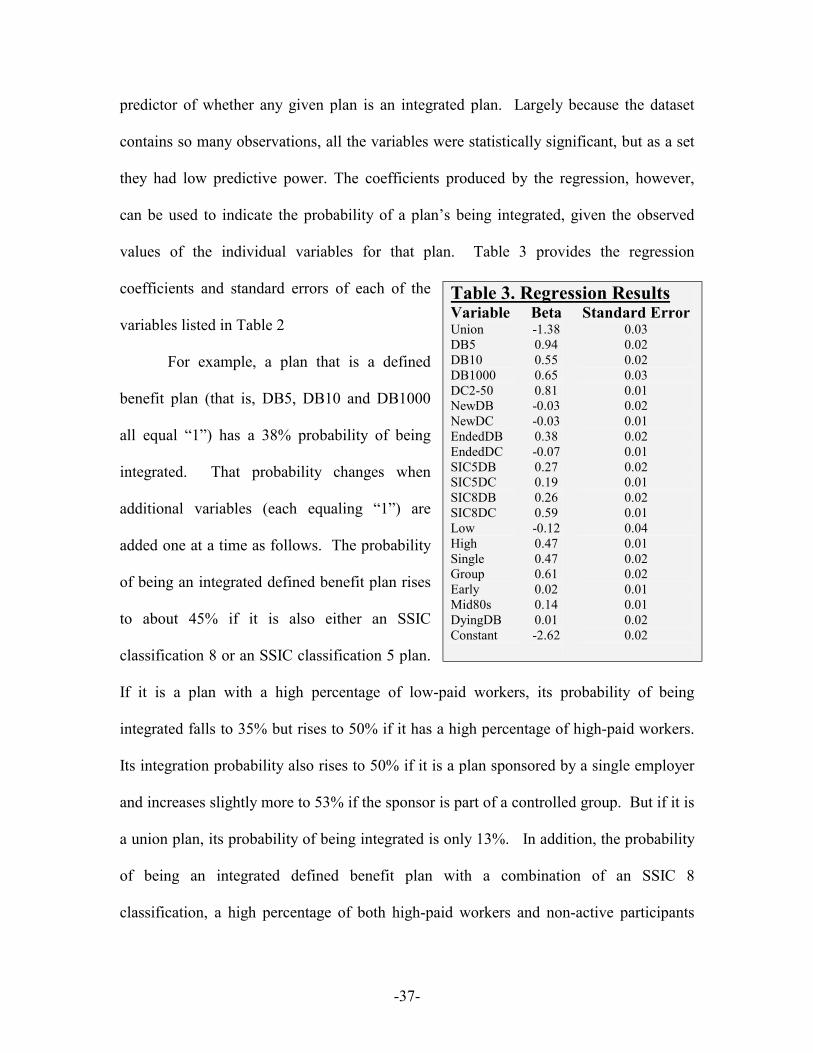
The results of the regression indicate that this set of variables is not a strong
-37-
predictor of whether any given plan is an integrated plan. Largely because the dataset
contains so many observations, all the variables were statistically significant, but as a set
they had low predictive power. The coefficients produced by the regression, however,
can be used to indicate the probability of a plan’s being integrated, given the observed
values of the individual variables for that plan. Table 3 provides the regression
coefficients and standard errors of each of the
variables listed in Table 2
For example, a plan that is a defined
benefit plan (that is, DB5, DB10 and DB1000
all equal “1”) has a 38% probability of being
integrated. That probability changes when
additional variables (each equaling “1”) are
added one at a time as follows. The probability
of being an integrated defined benefit plan rises
to about 45% if it is also either an SSIC
classification 8 or an SSIC classification 5 plan.
If it is a plan with a high percentage of low-paid workers, its probability of being
integrated falls to 35% but rises to 50% if it has a high percentage of high-paid workers.
Its integration probability also rises to 50% if it is a plan sponsored by a single employer
and increases slightly more to 53% if the sponsor is part of a controlled group. But if it is
a union plan, its probability of being integrated is only 13%. In addition, the probability
of being an integrated defined benefit plan with a combination of an SSIC 8
classification, a high percentage of both high-paid workers and non-active participants
Table 3. Regression Results Variable Union DB5 DB10 DB1000 DC2-50 NewDB NewDC EndedDB EndedDC SIC5DB SIC5DC SIC8DB SIC8DC Low High Single Group Early Mid80s DyingDB Constant
Beta -1.38 0.94 0.55 0.65 0.81 -0.03 -0.03 0.38 -0.07 0.27 0.19 0.26 0.59 -0.12 0.47 0.47 0.61 0.02 0.14 0.01 -2.62
Standard Error 0.03 0.02 0.02 0.03 0.01 0.02 0.01 0.02 0.01 0.02 0.01 0.02 0.01 0.04 0.01 0.02 0.02 0.01 0.01 0.02 0.02
-38-
and included in a controlled group is 72%. If, instead of being just a “dying” plan, the
plan actually terminated between 1993 and 1997 and had the other previously-stated
characteristics its integration probability rises to 78%. In either case, its probability of
being integrated decreases by some 30% if the plan is a union plan.
Alternatively, if a plan is a defined contribution plan with between 2 and 50
participants (DC2-50 equals “1”), its probability of being an integrated plan is just 14%.
By changing one additional variable at a time, its probability of being integrated plan
rises to about 18% if it is also either an SSIC classification 8 or an SSIC classification 5
plan. If it is a plan with a high percentage of low-paid workers, its probability of being
integrated falls to 13% but rises to 21% if it has a high percentage of high-paid workers.
Its integration probability also rises to 21% if it is a plan sponsored by a single employer
and increases slightly more to 23% if the sponsor is part of a controlled group. But if it is
a union plan, its probability of being integrated is only 4%. The probability of being an
integrated defined contribution plan in combination with having an SSIC 8 classification
and a high percentage of both high-paid workers while included in a controlled group is
39%. If it is also a relatively “old” plan, that is, created in the mid-1980s, in addition to
the variables described above, its integration probability rises to 42%. In either case, its
probability of being integrated decreases by some 30% if the plan is a union plan.
The regression results largely confirm the hypotheses about plan integration.
Union status substantially decreases the likelihood that a plan is integrated and having a
high percentage of low-paid workers decreases it slightly. A plan is also more likely to be
integrated if its sponsor is in the retail or healthcare industries or the professions and is
part of a controlled group of companies. If the plan is a defined benefit plan, having a

-39-
low percentage of active employees or actually terminating raises the likelihood of being
an integrated plan.
The regression analysis indicates that, at least with respect to these variables, it is
easier to account for integration among defined benefit than defined contribution plans.
Integration in defined contribution plans remains a puzzle. With the exception of union
status, the regression variables are so much weaker for defined contribution than defined
benefit plans that, as a set, they fail to account for even a 50% likelihood of plan
integration. Obviously, there is much more to be learned about plan integration among
defined contribution plans. It may be that there is much more variability among
integrated defined contribution plans, given that there are so many more plans and so
many plans are quite small, than among defined benefit plans. In any event, more
research on integrated defined contribution plans is warranted because they are the future
of plan integration. As a practical matter, it would be particularly helpful to have more
data on the employers who sponsor integrated plans, their reasons for choosing an
integrated plan and the characteristics of their workforces in addition to more
comprehensive information about all the plans they sponsor.
CONCLUSIONS Integration with Social Security is a persistent and stable feature of the private
pension system. One out of every four plans is an integrated plan, and the number of
integrated plans increased by 7% between 1993 and 1997. Integrated plans exhibit very
similar rates of plan creation and termination to those of non-integrated plans. The
number of participants in all integrated plans grew by 11% during this period to
24,000,000 by 1997. Integrated plans are most commonly found in the healthcare
-40-
industry and the professions (SSIC classification 8) and also in retail industries (SSIC
classification 5). Union plans are far less likely to be integrated than other plans.
There are far fewer integrated defined benefit than integrated defined contribution
plans, but slightly less than one out of every three defined benefit plans is an integrated
plan. As measured by the number of participants on an annual basis, integration in
defined benefit plans does not appear to be decreasing. These plans represented about
42% of participants in all defined benefit plans each year. Integrated defined benefit
plans have about 4 times as many participants as integrated defined contribution plans but
they grew only modestly in participation (6%) between 1993 and 1997 to about
19,000,000 participants. Integrated defined benefit plans tend to be large and represent
almost half of all plans with 2,000 or more participants. Integration will increasingly be a
large plan phenomenon in the defined benefit world because the observed decline in the
number and participation rates of small integrated defined benefit plans is expected to
continue. Although there are fewer integrated defined benefit plans, the surviving plans
seem to be financially stable. Their assets grew to $774 billion by 1997, equivalent
to about 42% of the assets in non-integrated defined benefit plans. Annual employer
contributions, however, fell from $11 billion in 1993 to $9 billion in 1997, but they
increased as a proportion of the employer contribution to non-integrated defined benefit
plans from 30% in 1993 to 50% in 1997.
Integrated defined contribution plans represent the wave of the future for
integrated plans. Integration in such plans is not rare. As measured by the number of
plans, about one in four of all defined contribution plans is integrated, and their numbers
increased at the same rate (14%) as non-integrated defined contribution plans from 1993
-41-
to 1997. As measured by the number of participants, some 5,600,000 people participated
in an integrated defined contribution plan by 1997. It is difficult to estimate the
proportion of defined contribution plans that are integrated with any rigor. Neither the
number of plans nor the number of participants is an accurate measure; the first is biased
by the various ways different plan types can be combined and the second is subject to
double counting. It is evident, however, that integrated defined contribution plans tend
to be small with 75% having fewer than 20 participants. Even so, the number of
participants in integrated defined contribution plans of all sizes increased in every year
from 1993-1997. Moreover, by 1997, the amount of annual employer contributions
increased to about $6 billion, and the total assets held in such plans was about $205
billion, a 63% increase over 1993 values.
Regression analyses of several key variables were reasonably successful in
accounting for integration in defined benefits. The likelihood of integration in such plans
is related to not being a union plan or having a high percentage of low-paid employees in
the plan. It is also related to being a plan in the healthcare industry, the professions or the
retail trade, to having a high percentage of high-paid employees in the plan, to being
sponsored by a controlled group of corporations, and to having a large percentage of
former employees in the plan. The regression results for defined contribution plans were
similar but much weaker.
Additional research will be required to broaden our understanding of integration
in defined contribution plans. Such research will require, at a minimum, more data on the
employers who sponsor integrated plans, their reasons for choosing an integrated plan
and the characteristics of their workforces in addition to more comprehensive information
-42-
about all the plans they sponsor. Learning more about integration in defined contribution
plans is important beyond the integration context. Defined contribution plan integration
seems to an important characteristic of very small plans. This suggests that integration
may make plan sponsorship more attractive to small employers. Because this is the
employer group where pension coverage issues are most acute, more research could
contribute to an enhanced understanding of the dynamics of pension coverage. Finally,
learning more about integration in defined contribution plans is both relevant and critical
to the debate over Social Security reform. The primary effect of plan integration is to
make low-paid workers even more dependent on Social Security for retirement income,
and responsible proposals for reform will need to take that consequence into
consideration.
-43-
REFERENCES Bender, Keith A. 1999. “Characteristics of Individuals with Integrated Pensions,” Social Security Bulletin, Vol. 62, No. 3, October, pp.28 – 38. ______________. 2001. “Pension Integration and Retirement Benefits, Monthly Labor Review, February, pp. 49 – 58. Bureau of Labor Statistics. 2000. Employee Benefits in State and Local Governments, 1998, Bulletin 2531,U.S. Department of Labor, December. ____________________. 1999a. Employee Benefits in Small Private Establishments, 1996, Bulletin 2507, U.S. Department of Labor, April. _____________________. 1999b. Employee Benefits in Medium and Large Private Establishments, 1997, Bulletin 2517, U.S. Department of Labor, September. Copeland, Craig. 2001. “Pension Participation: February 2001,” EBRI Notes, Vol. 22, No. 12, December. Foster, Ann C. 1997. “Public and Private Sector Defined Benefit Pensions: A Comparison," Compensation and Working Conditions, Summer, pp. 37-43.
Gregory, Janice A.. 1998. “Possible Employer Responses to Social Security Reform” in Prospects for Social Security Reform, Olivia Mitchell, Robert Myers, and Howard Young (eds.), Pension Research Council: University of Pennsylvania Press. Mitchell, Olivia A. 1999. “New Trends in Pension Benefit and Retirement Provisions,” Working Paper 7381, National Bureau of Economic Research, Cambridge, MA. Moore, Kathryn L. 2001. “The Effects of Partial Privatization of Social Security upon Private Pensions, 58 Washington & Lee Law Review 1255. Munnell, Alicia H. and Annika Sunden. 2001. “Private Pensions: Coverage and Benefit Trends,” Paper prepared for the “Conversation on Coverage,” July 24, 2001, Washington, D.C. Olsen, Kelly, Jack VanDerhei and Dallas I. Salisbury. 1997. “A Framework for Analyzing and Comparing Social Security Policies,” in Assessing Social Security Reform Alternatives, Employee Benefit Research Institute ERF Policy Forum. Perun, Pamela. 2001. “The Limits of Saving,” 49 Buffalo Law Review 893. Slusher, Chuck. 1998. “Pension Integration and Social Security Reform,” Social Security Bulletin, Vol. 61, No. 3, pp. 20 –27.
-44-
APPENDIX A
Definitions of Key Classification Variables
When viewed over a period of several years, the data present a number of problems
of consistency. Some plans report that they are a welfare plan in one year and a pension plan in the next. Others declare that they are integrated in some but not all years. Some are confused about whether they are a defined benefit plan or a defined contribution plan from year to year. In order to handle some of these inconsistencies, a number of classification variables were created and are explained below.
Type of Plan: This variable categorizes plans into “defined benefit” or “defined
contribution” plans. A plan is treated as a defined benefit plan if it filed a Schedule B in any year in which it filed a Form 5500 or reported that it was a defined benefit plan in at least 50% of the years in which it filed a Form 5500.
Integrated Plan: This variable categorizes plans into “integrated” or “non-integrated”
plans. A plan is treated as an integrated plan if it reported that it was an integrated plan in at least 50% of the years in which it filed a Form 5500.
Plan History: This variable categorizes plans as “new”, “continuing”, “ended” or
“began and ended” during the years 1993-1997. A plan was treated as “new” if it either did not file a form in 1993 or it filed a form in 1993 indicating that it was a new plan. A plan was treated as “ended” if it did not file a form in 1997 or reported in 1997 that it was filing its final report. A plan was treated as “began and ended” if it satisfied the criteria for being both a new and an ended plan. Plans that never indicated they were beginning or ending plans were treated as “continuing” plans. Plans whose history could not be determined were treated as missing data in this variable.
Union Plan: This variable categorizes plans into “union” or “non-union” plans. A plan is treated as a union plan if it indicated that it was a collectively-bargained plan at least 50% of the years in which it filed a Form 5500.
Plan Effective Date: In cases where a plan reported different effective dates in
different years, this variable assigns an effective date, where a plan reports identical values 75% of the time, equal to the minimum or maximum date, whichever is most common. If this rule can’t be applied and the difference between the minimum and maximum dates is less than 4.5 years, this variable assigns an effective date equal to the minimum date. Cases where neither of these rules could be applied are treated as missing data.
-45-
APPENDIX B
Preparation of the Data Set
The data used in this analysis were purchased at a nominal charge from the
Department of Labor and included all filings for the full Form 5500 and the Form 5500C/R series for 1993-1997. The data as a whole comprise all required Form 5500 filings and therefore include information about welfare and fringe benefit plans as well as pension plans. The following procedures were used to create the dataset used in this paper from the Department of Labor data:
• plans with plan numbers designated for welfare and fringe benefit plans were
deleted; • plans that had multiple filings in a single year were reviewed and only the
filing which provided the most comprehensive information for that year was retained;
• plans that used plan numbers designated for pension plans but claimed they were a welfare plan and provided information on the type of benefits provided were marked as unusable;
• plans that had a single filing or multiple filings in a single year that were nonsensical, e.g., plans that claimed they both began and terminated in a single year, were marked as unusable for that year; and
• multiple plans that provided duplicative data (“multiple-employer-other” pension plans) in a given year were marked so the data appeared only with respect to one plan.
From these data, several classification variables described in Appendix A were
created to clarify observed inconsistencies in plan reports from year to year. There were also major problems observed in variables used in year-by-year analyses. In many cases, there were extreme swings in the data reported from year to year or incredible numbers reported in a single year. For example, some plans reported unbelievable changes in the number of participants from year to year. In one case, a plan reported having 9 participants in one year and 20,000,000 the next. One year, another plan reported having 60,000,000 participants or roughly 50% of the entire labor force in its plan. Another plan with less than 100 participants reported having $45,000 in assets one year and $932,000,000 the next. Many plans also filed forms that were incorrectly completed by reporting, for example, having paid out negative amounts of benefits in a given year or paid in negative amounts of contributions. Because there were close to 1,000,000 records in the dataset, only minimal cleaning of the variables or individual plan data was feasible. In many cases, given how much a plan can change from year to year because of a merger, spin-off or plan amendment, it would have been impossible to divine what the “right” numbers should have been. All variables, however, were cleaned of the most extreme bad data when they were obvious. The result is by no means a clean dataset but it is a dataset cleaned of its most egregious values.
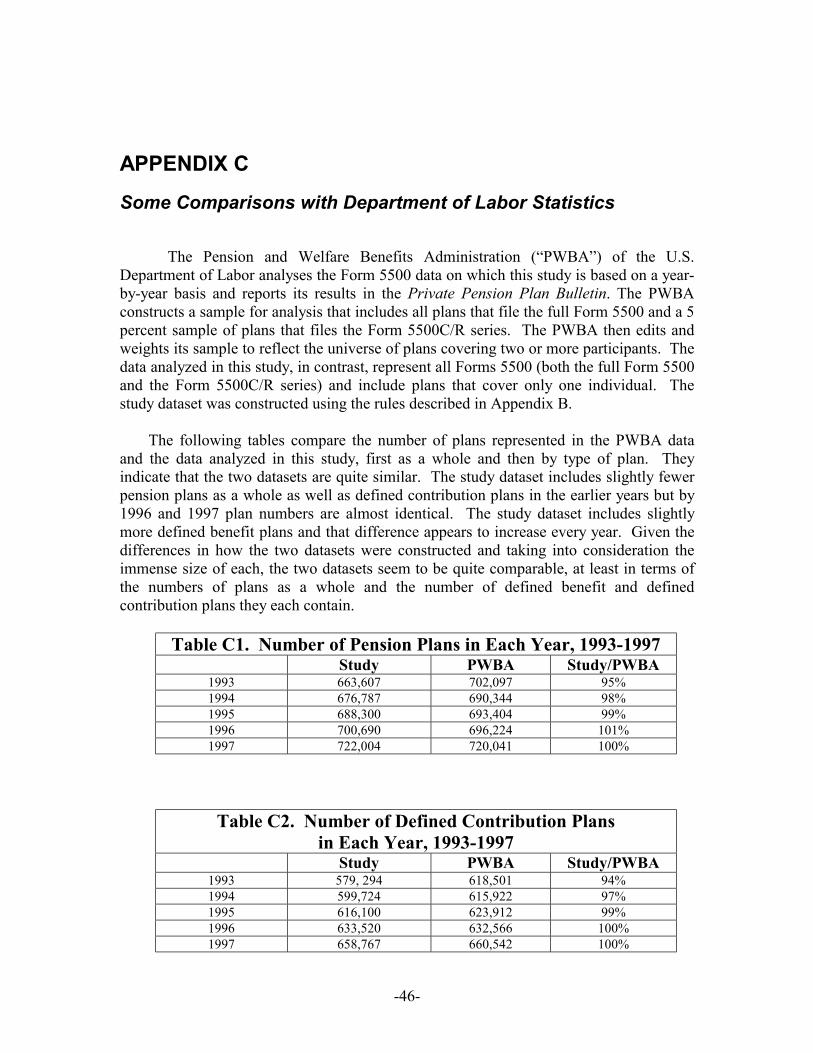
-46-
APPENDIX C
Some Comparisons with Department of Labor Statistics
The Pension and Welfare Benefits Administration (“PWBA”) of the U.S.
Department of Labor analyses the Form 5500 data on which this study is based on a year-by-year basis and reports its results in the Private Pension Plan Bulletin. The PWBA constructs a sample for analysis that includes all plans that file the full Form 5500 and a 5 percent sample of plans that files the Form 5500C/R series. The PWBA then edits and weights its sample to reflect the universe of plans covering two or more participants. The data analyzed in this study, in contrast, represent all Forms 5500 (both the full Form 5500 and the Form 5500C/R series) and include plans that cover only one individual. The study dataset was constructed using the rules described in Appendix B.
The following tables compare the number of plans represented in the PWBA data
and the data analyzed in this study, first as a whole and then by type of plan. They indicate that the two datasets are quite similar. The study dataset includes slightly fewer pension plans as a whole as well as defined contribution plans in the earlier years but by 1996 and 1997 plan numbers are almost identical. The study dataset includes slightly more defined benefit plans and that difference appears to increase every year. Given the differences in how the two datasets were constructed and taking into consideration the immense size of each, the two datasets seem to be quite comparable, at least in terms of the numbers of plans as a whole and the number of defined benefit and defined contribution plans they each contain.
Table C1. Number of Pension Plans in Each Year, 1993-1997
Study PWBA Study/PWBA 1993 663,607 702,097 95% 1994 676,787 690,344 98% 1995 688,300 693,404 99% 1996 700,690 696,224 101% 1997 722,004 720,041 100%
Table C2. Number of Defined Contribution Plans in Each Year, 1993-1997
Study PWBA Study/PWBA 1993 579, 294 618,501 94% 1994 599,724 615,922 97% 1995 616,100 623,912 99% 1996 633,520 632,566 100% 1997 658,767 660,542 100%
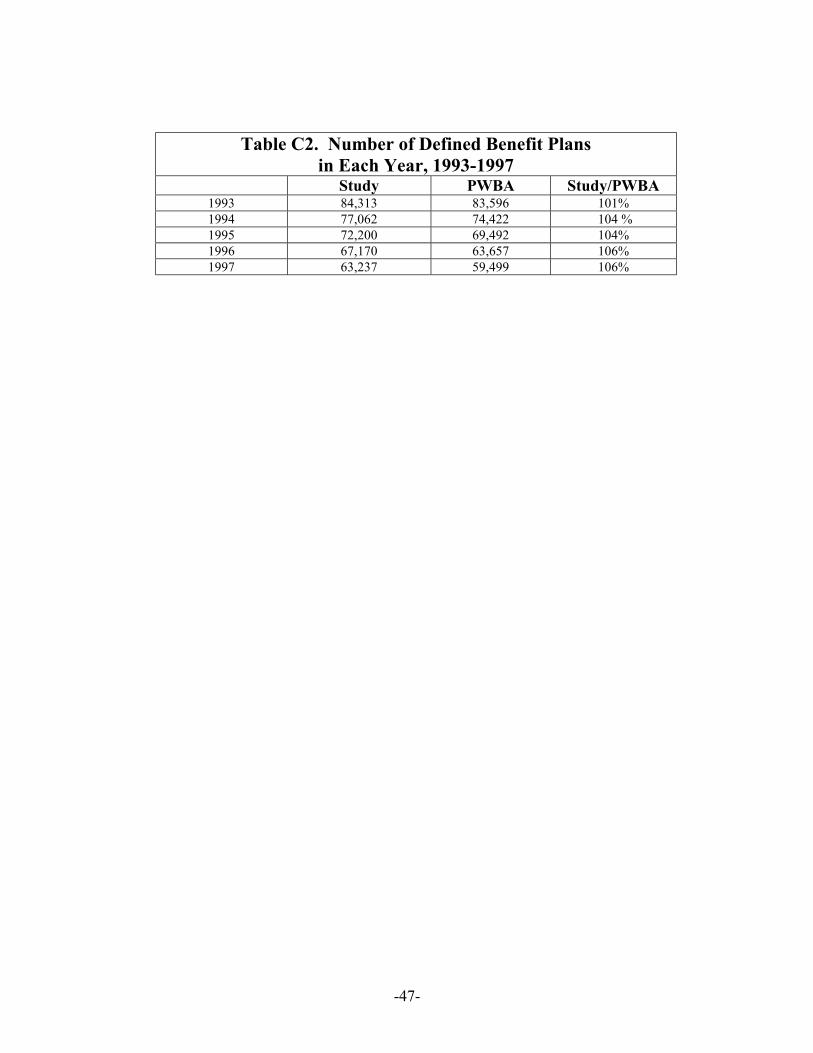
-47-
Table C2. Number of Defined Benefit Plans in Each Year, 1993-1997
Study PWBA Study/PWBA 1993 84,313 83,596 101% 1994 77,062 74,422 104 % 1995 72,200 69,492 104% 1996 67,170 63,657 106% 1997 63,237 59,499 106%
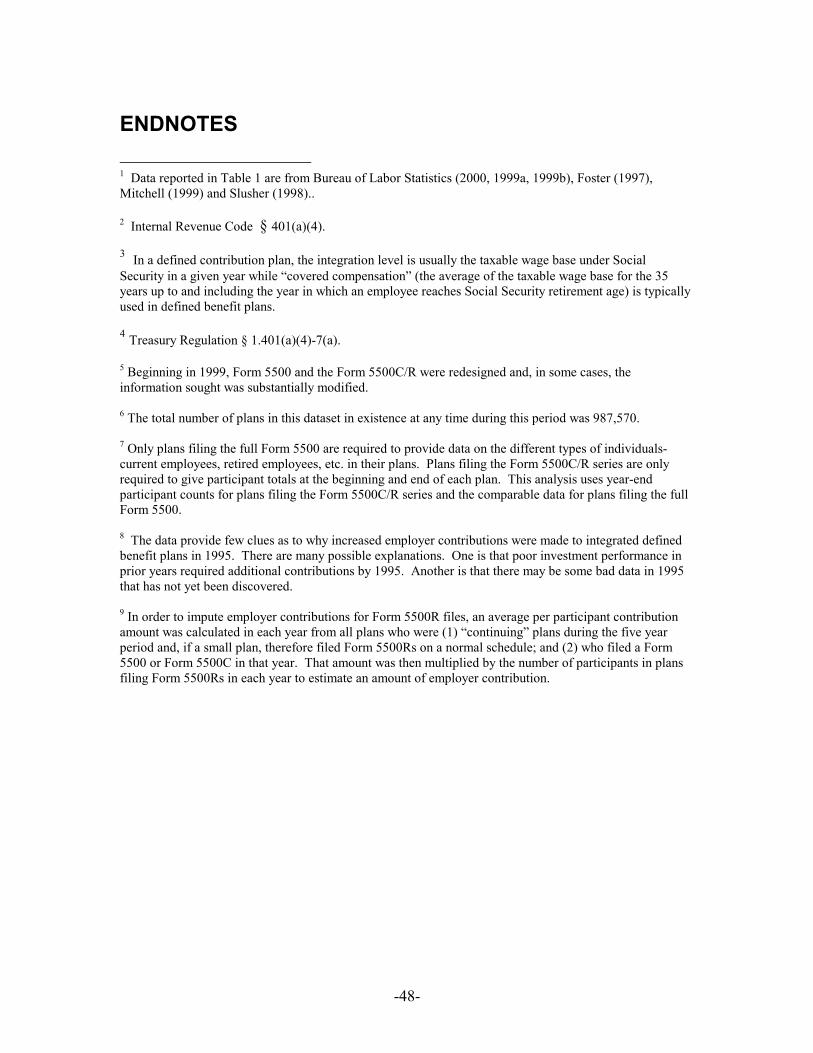
-48-
ENDNOTES 1 Data reported in Table 1 are from Bureau of Labor Statistics (2000, 1999a, 1999b), Foster (1997), Mitchell (1999) and Slusher (1998).. 2 Internal Revenue Code § 401(a)(4). 3 In a defined contribution plan, the integration level is usually the taxable wage base under Social Security in a given year while “covered compensation” (the average of the taxable wage base for the 35 years up to and including the year in which an employee reaches Social Security retirement age) is typically used in defined benefit plans.
4 Treasury Regulation § 1.401(a)(4)-7(a).
5 Beginning in 1999, Form 5500 and the Form 5500C/R were redesigned and, in some cases, the information sought was substantially modified. 6 The total number of plans in this dataset in existence at any time during this period was 987,570. 7 Only plans filing the full Form 5500 are required to provide data on the different types of individuals- current employees, retired employees, etc. in their plans. Plans filing the Form 5500C/R series are only required to give participant totals at the beginning and end of each plan. This analysis uses year-end participant counts for plans filing the Form 5500C/R series and the comparable data for plans filing the full Form 5500. 8 The data provide few clues as to why increased employer contributions were made to integrated defined benefit plans in 1995. There are many possible explanations. One is that poor investment performance in prior years required additional contributions by 1995. Another is that there may be some bad data in 1995 that has not yet been discovered. 9 In order to impute employer contributions for Form 5500R files, an average per participant contribution amount was calculated in each year from all plans who were (1) “continuing” plans during the five year period and, if a small plan, therefore filed Form 5500Rs on a normal schedule; and (2) who filed a Form 5500 or Form 5500C in that year. That amount was then multiplied by the number of participants in plans filing Form 5500Rs in each year to estimate an amount of employer contribution.