social security and retirement in canada - nber
TRANSCRIPT

2 Social Security and Retirement in Canada Jonathan Gruber
Government transfers to older persons in Canada are one of the largest and fastest-growing components of the government budget. Total expenditures on the four primary transfer programs for older Canadians amounted to $41 bil- lion in 1995, which was 23 percent of the federal budget and 5.3 percent of GNP in that year. In 1970, total expenditures were only $2 billion, amounting to just 14 percent of the federal budget and 2.3 percent of GNP. Moreover, unless the system is changed, rapid growth appears likely for the near future. The ratio of persons age sixty-five and over to persons age twenty to age sixty- four is projected to grow from its current level of 19 percent to over 40 percent by the year 2075. As a result, the payroll tax necessary to finance the major social insurance program for older persons, the CanaddQuebec Pension Plan (CPP/QPP), is projected to grow from its current level of 5.6 percent of wages to over 14 percent by the year 2075 (Office of the Superintendent of Financial Institutions Canada 1993). Similar cost increases are in store for the other three major transfer programs to older Canadians, programs financed from general revenues: the Old Age Security (OAS) demogrant and the means-tested Guar- anteed Income Supplement (GIS) and Spousal Allowance (SPA) programs.
As a result of this growing fiscal imbalance, Canada may be required to consider a number of reforms to its social security system over the coming years. But, for understanding the implications of any potential reforms, it is critical to understand how this complicated web of programs affects the retire- ment decisions of older Canadians. Public income support is the dominant fea- ture of the opportunity set facing households over age sixty-five in Canada. For the median household where the head is over age sixty-five, these social
Jonathan Gruber is professor of economics at the Massachusetts Institute of Technology and
The author is grateful to Sue Dynarski and especially Courtney Coile for excellent research director of the Children’s Program at the National Bureau of Economic Research.
assistance and to the National Institute on Aging for financial support.
73
74 Jonathan Gruber
security programs represent 61 percent of total family income; for 23 percent of such households, they provide more than 90 percent of family income.' As a result, it seems likely that the structure of the social security program has important effects on the life-cycle savings and labor supply decision making of households and in particular on their retirement decisions. But little empirical analysis has been conducted of either the retirement incentives under the Cana- dian system or the effects of those incentives on behavior.
The purpose of this paper is to provide an overview of the interaction be- tween social security and the labor force behavior of older persons in the Can- ada. I do so in four steps. First, in section 2.1, I document the pertinent facts about the labor market behavior of older persons in Canada, both today and over time. Then, in section 2.2, I describe the structure of the system of income support programs for older persons in Canada, summarizing the relevant insti- tutional details for thinking about retirement behavior. Finally, in section 2.3, I present the results of a simulation model designed to document the retirement incentives inherent in these programs for current cohorts of retirees. Section 2.4 concludes by considering the implications of my findings.
2.1 The Labor Market Behavior of Older Persons in Canada
As in most industrialized nations, the second half of the twentieth century in Canada has been marked by a declining attachment to the labor force of older persons. In 1960, 87 percent of men aged fifty-five to sixty-four and 30 percent of men age sixty-five and above were participating in the labor force; by 1993, these ratios had fallen to 61 and 10 percent, respectively. One possible explanation for this shift is the increasing generosity of the income support programs for older Canadians. But, before addressing the effects of these pro- grams, it is useful to provide some more background on the labor market be- havior of older men and women.
The historical and contemporaneous facts presented in this section are drawn from a number of different data sources. These are summarized in the appendix. In the appendix, I also provide a brief overview of the databases that are used by researchers in Canada to study retirement behavior.
2.1.1 Historical Trends Figures 2.1 and 2.2 graph the labor force participation rates of men and
women in different age groups since 1960. I focus on three age groups: forty- five to fifty-four; fifty-five to sixty-four; and over sixty-five. For men, there is a decline in the labor force participation of all these groups. The decline for the youngest group is slight, while the decline for the other groups is much more precipitous. The percentage decline is most dramatic for those age sixty- five and over, who by the end of the sample period were very rarely participat- ing in the labor force.
1. Author's tabulations of the 1992 Survey of Consumer Finances.

75 Social Security and Retirement in Canada
45-54 men a 65+ men
A 55-64 men
100 7 -
70
60
0 I I I I I I I I
1960 1965 1970 1975 1980 1985 1990 1993 year
Fig. 2.1 Historical trends in labor force participation of older men
45-54 women D 65+ women
70 -
60 -
50 -
40 -
30 -
20 -
A 55-64 women
lo 0 ? 1960 1965 1970 1975 1980 1985 1990 1993
y e a r
Fig. 2.2 Historical trends in labor force participation of older women
For women, the pattern is quite different: any trend toward earlier retirement is dominated by increased labor force participation. For the two younger groups, participation is rising; for the oldest group, it declines slightly.
One first-pass approach to considering whether social security is associated with these labor force trends is to examine related trends in social security

76 Jonathan Gruber
0 OAS Recipients 0 GlSlSPA Recipients
A CPPIQPP Retirement Recip CPPIQPP Disability Recip
7 4
I 1 I I 1 I I I 1961 1966 1970 1975 1980 1985 19901993
year
Fig. 2.3 Receipt of public retirement income
generosity. I do so in two ways. First, in figure 2.3, I show the share of the population over age fifty-five receiving various sources of retirement income. I consider four types of income: OAS; GIS or SPA; CPP/QPP retirement bene- fits; and CPP/QPP disability benefits. I do not have data on age-specific receipt rates before 1981, so I simply normalize total receipt by the age fifty-five and over population. This is not a problem for all the retirement programs, which are restricted to those age sixty and above; this will slightly overstate the size of the disability program since some recipients are under age fifty-five.
There has been a steady growth in receipt of OAS income and disability benefits. There has been a much more rapid growth in receipt of CPPIQPP retirement benefits, rising from zero to roughly half the over fifty-five popula- tion by 1993. Perhaps owing to the growth in this income source, there was little growth in GIS/SPA benefits after 1975 and even a decline after 1985.
Figures 2.4 and 2.5 explore this time series in more detail, focusing on the period after 1980, for which I have data on receipt rates by age and sex for the CPP only. Each figure has four lines, representing OAS receipt, GISISPA re- ceipt, CPP retirement receipt, and receipt of any of these benefits, including CPP disability. These figures parallel figure 2.3 above: slightly rising OAS re- ceipt (more so for women than for men), more rapidly rising CPP retirement receipt, and a somewhat offsetting decline in GIS/SPA receipt. Of particular interest in these graphs is the jump in CPP retirement receipt in 1987; as dis- cussed below, in this year, early eligibility at age sixty was made available. Overall, there is a steady rise in receipt of income from these programs, with a jump in 1987.

77 Social Security and Retirement in Canada
a .5 - s + vl In .4 - e
C 0
.3 - .- L
e .2 - U
.1 -
0 OAS Receipt 0 GlSlSPA Receipt
.8 i
A CPPIQPP Receipt OAS,GIS/SPA.CPPIQPP.Disability
I 1 I I
1981 1985 1990 1993 year
Fig. 2.4 Program receipt for men
0 OAS Receipt 0 GISISPA Receipt
.a -I
0 CPPIQPP Receipt 0AS.GISISPA.CPPIQPP.Disability
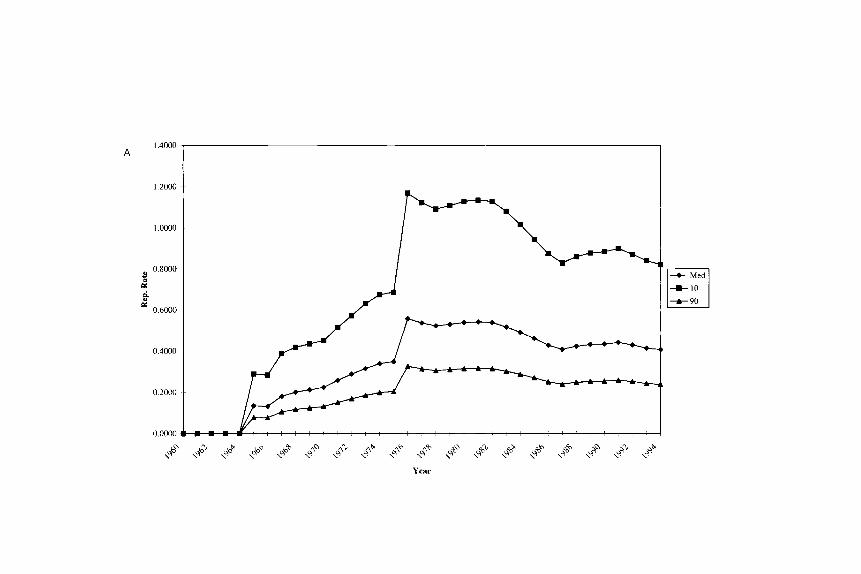
Second, in figure 2.6, I show the change in generosity of benefits payments over time. I show the replacement rate through all these four income support programs from 1960 to 1991 for low-, medium-, and high-earnings workers. These replacement rates are computed (according to the algorithm described in the simulation section below) for a sixty-five-year-old man in 1995 with a
1.4000 A
I 2000
I 0000
(y 0.8ooO
- 2 c crl 0
60
00
0.4000
0 2oInl

0 Boon
0 70MI
0 6000
2 05000
2 e p: 04000
0 1000
0 21m
0 1000
o own
Fig. 2.6 Replacement rates: a, without asset income; b, with asset income
80 Jonathan Gruber
sixty-two-year-old wife.2 A key consideration in computing replacement rates is the level of other income (i.e., asset income) available to potential retirees since the GIS and SPA programs are means tested. As a result, I consider two cases: a couple with no asset income (fig. 2 . 6 ~ ) and a couple with $4,818 in other income (in 1990 dollars), which is the median level of nongovernment income available in 1990 for families where the head is over age sixty-five (fig. 2.6b).
Replacement rates grow substantially over time. In all cases, they start at zero until 1965 since OAS benefits were restricted to those age seventy and over until that year. Then, in 1966, CPP/QPP benefits were introduced; as de- scribed below, this program was phased in over a ten-year period; in 1967, the GIS program was introduced as well. As a result of these two features, the replacement rate grew steadily until 1975, reaching roughly 35 percent in that year for the median earner. In 1975, the SPA program was introduced, leading to a discrete jump in replacement rates due to the fact that the couple in our example has an eligible wife. Replacement rates then declined somewhat over time, as the growth rate in earnings exceeded inflation by a substantial amount in the rn id -1980~~ The replacement rates for the tenth and ninetieth percentiles follow a pattern similar to that of the median case, although more pronounced for the tenth percentile; in the late 1970s, replacement rates exceeded one for this sample.
In figure 2.6b, I consider the effect of introducing asset income. This sub- stantially lowers replacement rates by reducing the benefits received through the means-tested GIS and SPA programs. But the time-series pattern is similar to that in figure 2 . 6 ~ .
These time-series patterns yield a mixed picture of the influence of social security. Clearly, there is a strong correlation between the size of the program and the labor force participation rate of older men. But the decline in participa- tion of older men has continued unabated in the 1980s and 1990s, even as program generosity has declined.
2.1.2 Labor Market Behavior in 1993 For a more detailed understanding of the time pattern of labor force partici-
pation in recent times, I turn to the April 1992 and 1993 Survey of Consumer Finances (SCF). The SCF is a large, nationally representative survey that asks individuals about their labor force attachment at both the point of the survey and the previous year as well as about income in the previous year. I pool two years of the SCF for added precision in my estimates of labor force participa- tion by age.
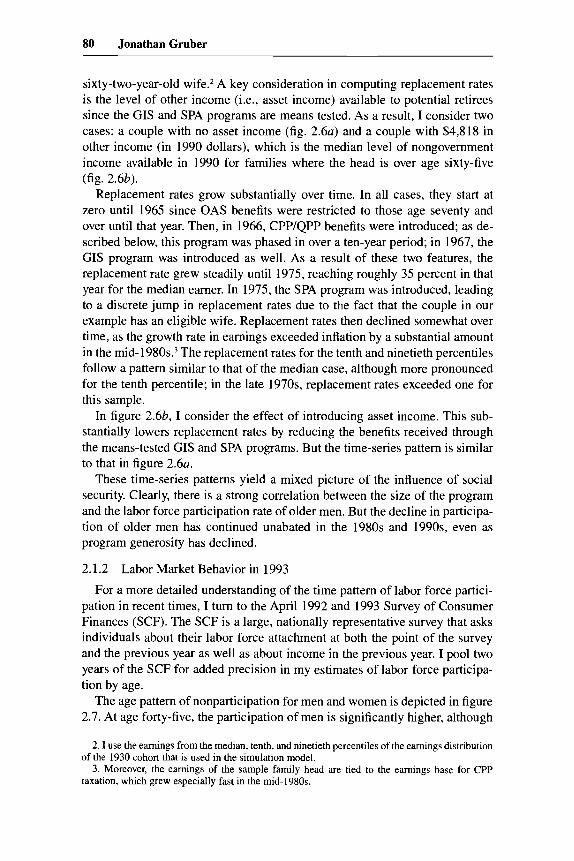
The age pattern of nonparticipation for men and women is depicted in figure 2.7. At age forty-five, the participation of men is significantly higher, although
2. I use the earnings from the median, tenth, and ninetieth percentiles of the earnings distribution
3. Moreover, the earnings of the sample family head are tied to the earnings base for CPP of the 1930 cohort that is used in the simulation model.
taxation, which grew especially fast in the mid-1980s.
81 Social Security and Retirement in Canada
aJ " L 0
LL
L 0 D rn
Labor F o r c e P a r t i c - Men A Labor F o r c e P a r t l c - Women
I I I I I I I
45 50 55 60 65 70 75 age
Fig. 2.7 Participation rates by age and sex
almost 80 percent of forty-five-year-old women are working. There is then a gradual parallel decline for men and women until age fifty-five, at which point the pace steepens; this is particularly true for men, with the result that the participation gap closes substantially by age sixty-five. By age seventy, partici- pation has dropped quite low, with fewer than 10 percent of men or women participating in the labor force.
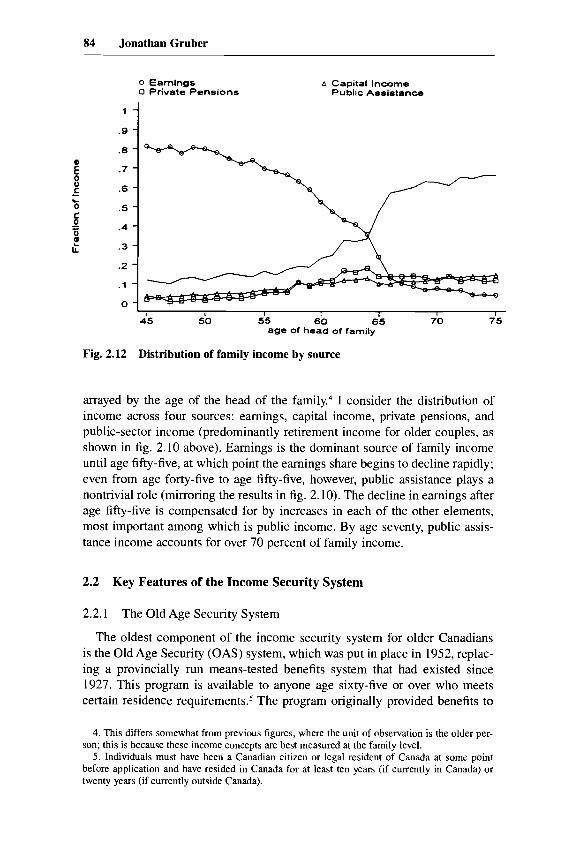
Figure 2.8 considers in more detail the allocation of time among men as they age, by dividing activities at each age into employment, unemployment, disability, and retirement. There is a steady decline in employment among men. Most of this decline is reflected in an increase in retirement and in an increase in disability after age fifty-five; unemployment rates are fairly constant until age sixty. After age sixty, employment falls more rapidly, and unemployment falls as well; disability begins to fall after age sixty-five. These declines are reflected in rapid increases in retirement. This same exercise is repeated for women in figure 2.9. The patterns are similar, with the exception that a much larger share of women is not pursuing any of these activities (these women are out of the labor force for other reasons).
2.1.3 Figures 2.10 and 2.11 examine the incidence of public and private retirement
income for older persons. Figure 2.10 graphs two series for men only: the rate of receipt of OAS, CPP/QPP, and GIS/SPA and the rate of receipt of other public assistance through the unemployment insurance and social assistance (means-tested welfare) programs. This figure highlights the fact that, even be- fore retirement, a large share of men are receiving public assistance. As a re-
Income Sources of Older Persons
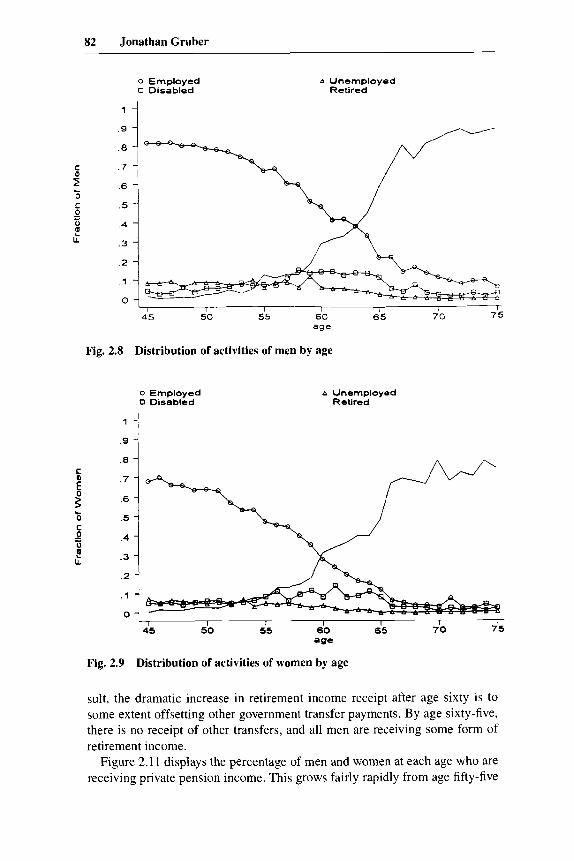
82 Jonathan Gruber
o Employed 0 Disabled
A Unemployed Retired
1
.9
.8
.7
.6
.5
.4
.3
.2
.1
0
45 50 55 60 65 70 75
age
Fig. 2.8 Distribution of activities of men by age
o Employed 0 Disabled
A Unemployed Retired
.9
.8
.7
.6
.5
.4
.3
.2
.1
0
age
Fig. 2.9 Distribution of activities of women by age
sult, the dramatic increase in retirement income receipt after age sixty is to some extent offsetting other government transfer payments. By age sixty-five, there is no receipt of other transfers, and all men are receiving some form of retirement income.
Figure 2.11 displays the percentage of men and women at each age who are receiving private pension income. This grows fairly rapidly from age fifty-five

83 Social Security and Retirement in Canada
CPP/QPP. O A S . GIs, o r SPA A O t h e r P u b l i c Ass ls tance
I I I I I I I
45 50 55 60 65 70 75 age
Fig. 2.10 Public income recipiency for men
Pension Receipt - Men A Pens ion Rece ip t - Women
- Y
U m i LL
.5 -
.4 -
.3 -
.2 -
.I -
0 - I
1 I I I I I I 45 50 55 60 65 7 0 75
age
Fig. 2.11 Private pension receipt by sex
on, particularly for men, so that by age sixty-seven more than half the male population is receiving pension income. Pension receipt for women at older ages is only about two-thirds as common. At the same time, however, many women will be benefiting from these income streams through their husband's pension.
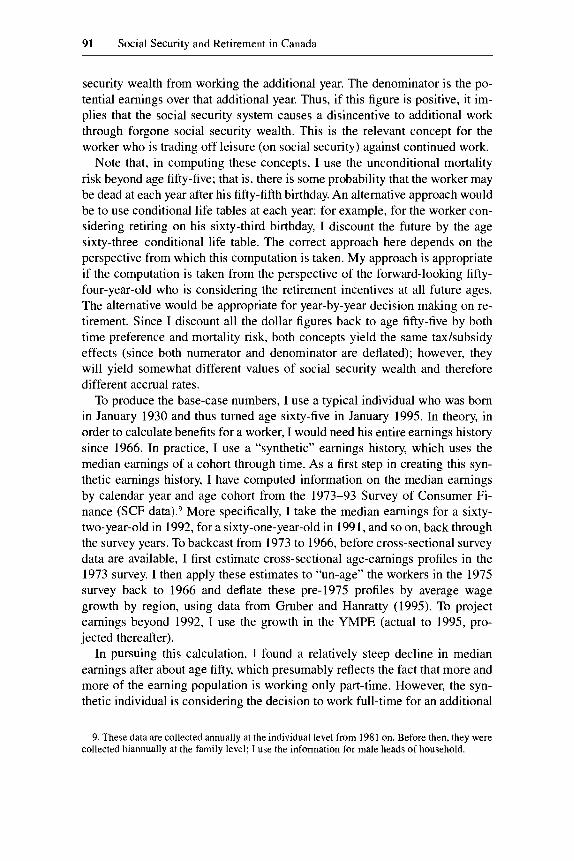
Finally, figure 2.12 shows the distribution of income sources for couples,
84 Jonathan Gruber
0 Earnings 0 Private Pensions
A Capital Income Public Assistance
.8 -
.7 - C .6 - 0 .5 - C
0 E - c
.4 -
.3 -
.2 -
.1 - 0 -
- - e U
I I I I I I I
45 50 55 60 65 70 75 age of head of family
Fig. 2.12 Distribution of family income by source
arrayed by the age of the head of the family.4 I consider the distribution of income across four sources: earnings, capital income, private pensions, and public-sector income (predominantly retirement income for older couples, as shown in fig. 2.10 above). Earnings is the dominant source of family income until age fifty-five, at which point the earnings share begins to decline rapidly; even from age forty-five to age fifty-five, however, public assistance plays a nontrivial role (mirroring the results in fig. 2.10). The decline in earnings after age fifty-five is compensated for by increases in each of the other elements, most important among which is public income. By age seventy, public assis- tance income accounts for over 70 percent of family income.
2.2 Key Features of the Income Security System
2.2.1 The Old Age Security System
The oldest component of the income security system for older Canadians is the Old Age Security (OAS) system, which was put in place in 1952, replac- ing a provincially run means-tested benefits system that had existed since 1927. This program is available to anyone age sixty-five or over who meets certain residence requirement^.^ The program originally provided benefits to
4. This differs somewhat from previous figures, where the unit of observation is the older per- son; this is because these income concepts are best measured at the family level.
5. Individuals must have been a Canadian citizen or legal resident of Canada at some point before application and have resided in Canada for at least ten years (if currently in Canada) or twenty years (if currently outside Canada).

85 Social Security and Retirement in Canada
those age seventy or over, and the age of eligibility was dropped to sixty-five in 1965.
The OAS pension itself is a uniform demogrant that was equal to $387.74 (19 percent of median monthly earnings of twenty- to sixty-four-year-old males in Canada) in 1995. Individuals who do not meet residence requirements are entitled to a partial OAS benefit. OAS benefits have been indexed to the consumer price index since 1972. OAS benefits are fully subject to both federal and provincial income taxes. In addition, there is a clawback of OAS benefits from very high-income individuals: in 1993, the OAS for a single individual was reduced by fifteen cents per dollar of net income exceeding $53,215. OAS benefits are financed from general taxation revenues.
2.2.2 The CanaddQuebec Pension Plan The largest component of the income security system is the Canada Pension
Plan (CPP) and the Quebec Pension Plan (QPP). These programs began on 1 January 1966 and are administered separately by Quebec and the rest of Canada.
The plan is financed by a payroll tax of 2.7 percent each on both employers and employees. This payroll tax is levied up to the year's maximum pension- able earnings (YMPE), $34,900 in 1995 (or 145 percent of median annual earnings). The YMPE is indexed to the growth in average wages in Canada. In addition, earnings up to the year's basic exemption (YBE) are exempted from the computation; this is defined as 10 percent of the YMPE.
Eligibility for this plan is conditioned on contributions for at least one calen- dar year during the contributory period, which is the period from attainment of age eighteen or 1 January 1966 if later. Benefits are then computed in several steps. First, the number of months used to compute the retirement pension is computed by subtracting from the number of months in the contributory period (a ) months receiving a disability pension, (b) months spent rearing small chil- dren,'j (c) months between age sixty-five and the commencement of the pen- sion, and ( d ) 15 percent of the remaining months. The last three of these condi- tions are subject to the provision that they not reduce the contributory period below 120 months minus months of disability pension receipt. In addition, excess earnings in one month above one-twelfth of the YMPE may be applied to months in the same year where earnings are below one-twelfth of the YMPE.
Second, the remaining months of earnings history are converted to current dollars, using as a deflator the ratio of the YMPE in each year to the average of the YMPE over the three years prior to (and including) the year of pension receipt. Finally, the benefit is computed as 25 percent of the average of this real earnings history. This 25 percent ratio has been in place since 1976; from 1967 to 1976, the program was phased in, with the share of average earnings paid out in benefits rising from 2.5 percent in 1967 to 25 percent in 1976. In
6. This is defined as months where there was a child younger than seven years of age and the worker had annual earnings of at least one-twelfth of the YBE. This provision was introduced in 1983.

86 Jonathan Gruber
addition, before the YMPE reached the average industrial wage in 1986, it was rising more rapidly than average wages (12.5 percent per year).
Until 1984 for the QPP and 1987 for the CPP, benefits could not be claimed before the sixty-fifth birthday, and there was no actuarial adjustment for de- layed claiming. Beginning at these times, individuals were allowed to claim benefits as early as age sixty, with an actuarial reduction of 0.5 percent for each month of early claiming (before age sixty-five) and an actuarial increase of 0.5 percent for each month of delayed claiming (after age sixty-five).
Until 1975, receipt of benefits under the CPP and QPP was conditioned on low earnings levels, with earnings above these ceilings taxed away at high rates. In 1975, these earnings tests were eliminated. With the introduction of early retirement in 1984 and 1987, however, an earnings test was reintroduced: workers can claim early benefits only if their annual earnings do not exceed the maximum retirement pension payable at age sixty-five for the year in which the pension is claimed ($713.19, or 36 percent of median monthly earnings, in 1995). This earnings test is applied only at the point of application, however; after that point, there is no additional check on the individual’s earnings.’ Moreover, the earnings test does not apply any more once the individual reaches age sixty-five.
CPP/QPP benefits are independent across spouses and are a function of an individual spouse’s earnings history only.8 But there is an interdependence through survivor benefits (as well as the interdependences through the means- tested programs described below). Spouses are eligible for survivor pensions if the deceased contributor made contributions for at least 10 years or one-third the number of years in the contributory period and if the spouse is over age thirty-five or has dependent children. For spouses under age sixty-five, the sur- vivor pension is a combination of a flat-rate portion plus 37.5 percent of the earnings-related pension of the deceased spouse. For spouses age sixty-five and over, the survivor’s pension is equal to 60 percent of the earnings-related pension. The pension used to calculate the survivor benefit is not subject to actuarial adjustment. If the surviving spouse is receiving his or her own earnings-related pension, then the combination of the two pensions cannot ex- ceed the maximum retirement pension available in the year that the later of these two pensions commences. Children of deceased contributors are also entitled to a survivor benefit if under eighteen or a full-time student between the ages of eighteen and twenty-five; this benefit is a flat amount. There is also a lump-sum death benefit, which is generally equal to half the annual CPP/ QPP pension amount.
Benefits are legislated to increase with the consumer price index (since 1973), average over the twelve-month period ending with October of the pre- ceding year. Benefits are fully subject to federal and provincial income taxes.
7. Earnings after the initial receipt of a CPP/QPP pension are not included in the subsequent
8. Couples do have the option of sharing their benefits for income tax purposes since taxation average earnings used to compute future benefits.
is at the individual level.

87 Social Security and Retirement in Canada
2.2.3 The Guaranteed Income Supplement and Spousal Allowance The Guaranteed Income Supplement (GIS) is a means-tested supplement
available to recipients of OAS that was introduced in 1967. Individuals must reapply for the GIS each year, and the means test for eligibility (and benefit) levels is repeated. The income level for means testing is defined in the same way as for income tax purposes, with the important exclusion of OAS pension income. Unlike OAS or CPP/QPP benefits, GIS benefits are based on family income levels.
There are separate single and married guarantee levels for the GIs; in 1995, these were $460.79 for singles and $300.14 (each person) monthly for married couples (23 percent and 15 percent of median monthly income, respectively). Benefits are then taxed away as income rises at a rate of 50 percent, although a couple with one member over age sixty-five and one under age sixty is taxed at only 25 percent with an initial amount of income exempted.
The Spousal Allowance (SPA), which was introduced in 1975, is a means- tested monthly benefit available to sixty- to sixty-four-year-old spouses of OAS recipients and to sixty- to sixty-four-year-old widowdwidowers. For the spouse of an OAS recipient, the benefit is equal to the OAS benefit plus GIS at the married rate; the OAS portion is then taxed at 75 percent as income rises until it is reduced to zero, and then the combined GIS benefits are taxed at 50 percent. For a widowed spouse, the benefit is equal to the OAS plus the GIS at the widowed rate and is taxed equivalently. Both the GIS and the SPA guar- antees are also indexed to inflation, and neither source of income is subject to either the federal or the provincial tax system.
2.2.4 Hazard Rates One natural question is whether the labor force behavior of older Canadians
lines up with the incentives inherent in the systems described above. I explore this in figures 2.13 and 2.14, which show hazard rates out of the labor force for men and women, respectively. This is measured as the increase in the rate at which workers leave the labor force from the previous age, relative to the stock of workers participating at the previous age.
For men, there is clear evidence of a dramatic increase in the rate at which workers leave the labor force at age sixty-five, which is the age of normal retirement for CPP/QPP and of entitlement to OAS benefits. Fully 40 percent of the men who remain in the labor force at age sixty-five leave during that year. There is also evidence of a response to the CPP/QPP early retirement age of sixty, but it is not particularly strong relative to the hazards in surrounding years. This is consistent with the notion that the response to early retirement entitlements emerges only slowly, as documented by Burtless and Moffitt (1986) for the United States. For women, the pattern is similar: a pronounced spike at age sixty-five, with some evidence of a response around age sixty, but nothing particularly pronounced.

88 Jonathan Gruber
I I I I 1 I
45 50 55 60 65 69 age
Fig. 2.13 Hazard rate out of labor force for men
I I I I I I
45 50 55 60 65 69 age
Fig. 2.14 Hazard rate out of labor force for women
2.2.5 Other Public Programs In addition to the federal retirement programs, there are a variety of provin-
cial programs that provide supplements to low-income retirees. For example, a program in Ontario provides $80.00 per month to Ontario residents who are recipients of the GIs; but these funds are taxed back at 50 percent as other (non-OAS or -GIs) income rises.

89 Social Security and Retirement in Canada
A final program that is important for considering retirement incentives is the disability insurance program that is operated through the CPP/QPP. This program provides benefits to those workers unable to work owing to disability. The basic benefits structure consists of two portions: a flat-rate portion, which is a lump sum paid to all disabled workers, and an earnings-related portion, which is 75 percent of the applicable CPP/QPP retirement pension, calculated with the contributory period ending at the date of disability. This program is fairly stringently screened, and fewer than 5 percent of older Canadian men are on disability insurance. Nevertheless, recent research shows that the benefit structure of this program has important effects on labor supply (Gruber 1996).
2.2.6 Private Pension Coverage Another important feature of the retirement landscape is private pensions.
Defined-benefit pension plans share many of the same incentive features as public insurance plans. In fact, many Canadian workers are covered by occupa- tional pensions, or RRPs. In 1992,47.5 percent of paid workers were covered by occupational pensions, with coverage being slightly higher for males than for females. Ninety percent of plan members were in defined-benefit plans, although the share in defined-contribution plans has been growing recently. Defined-contribution plans may also affect retirement through income effects, but there should not be tax/subsidy effects on the work decision since the pay- out is not dependent on work patterns.
2.2.7 The Retirement Effects of Income Support Programs in Canada While a large U.S. literature on social security and retirement exists (for a
review, see Diamond and Gruber, chap. 11 in this volume), much less work has been done in the Canadian context. Recently, Baker and Benjamin (1996) have explored the effects of the introduction of the early retirement option under the QPP in 1984 and the CPP in 1987. They found that there was little effect of this policy change on the labor force behavior of sixty- to sixty-four-year-olds in the short run. But there is some suggestion of a longer-run response, as a “spike” in the rate at which workers leave the labor force has emerged at age sixty in recent years (as shown in fig. 2.13 above). Baker and Benjamin (1997) explore another important policy change, the removal of earnings tests under the CPP and QPP in the 1970s. They find that the removal of earnings testing was associated with a significant shift from part-time to full-time work among older workers.
2.3 Retirement Incentives
2.3.1 Simulation Modeling
In this section, I use a model of benefits determination under these four programs to assess the incentives of social security on retirement through ac-

90 Jonathan Gruber
crual rate effects. Given the similarities of the CPP and QPP programs, the incentives are calculated for the representative CPP worker. This program em- beds the benefits computation and clawback structure of these four programs to compute benefits for a worker, given his age, spouse’s age, earnings history, and date of retirement. 1 use the base-case assumptions about the CPP for wage and price growth, as well as assumptions about the growth of the program contribution rate, to model incentives. The program computes benefits for the worker and survivor and death benefits for the case where the worker has died.
The next step in the simulation is to take these monthly benefit entitlements and compute an expected net present discounted value of social security wealth (SSW); this includes the future entitlements from all four programs. This re- quires projecting benefits out until workers reach age one hundred and then taking a weighted sum that discounts future benefits by both the individual discount rate and the prospects that the worker will live to a given future age. The methodology for doing so is described in Diamond and Gruber (chap. 11 in this volume). For the worker himself, this is fairly straightforward; it is simply a sum of future benefits, discounted backward by time preference rates and mortality rates. For survivor benefits, it is more complicated since I must account for the joint likelihood of survival of the worker and the dependent. In the base case, I use a real discount rate of 3 percent, although I vary this below. To adjust for mortality prospects, I use sex/age-specific life tables for 1990 from Statistics Canada. Finally, to compute net social security wealth, I sub- tract out the CPP payroll tax payments that the individual would make during any continued work. I add both the employee and the employer shares of the payroll tax, under the assumption that the employer shares fully borne by the worker in the form of lower wages. All figures are discounted back to age fifty- five by both time preference rates and mortality risk.
For the output of the simulations, I calculate three different concepts. The first is the net of tax replacement rate, the rate at which social security replaces the (after-tax) earnings of the worker should he continue working in that year. It is important to do this calculation on an after-tax basis in order to account for the facts that (a ) OAS, GIs, and SPA benefits are not taxable and (b), even for taxable CPP benefits, the individual may be in a lower tax bracket when retired. I model the average tax rate faced by earners of different earnings lev- els in each year, assuming that the tax system stays constant into the future (with the same rate structure and indexed tax brackets). The second concept is the accrual rate, the percentage change in social security wealth from the previous year.
Finally, I compute a taxkubsidy rate, which is the absolute change in social security wealth over the potential earnings from working that next year. This represents the implicit tax on or subsidy to continued work, in terms of the net change in social security wealth that is implied by that additional year of work. The numerator of this tax/subsidy rate is the opposite of the change in social
91 Social Security and Retirement in Canada
security wealth from working the additional year. The denominator is the po- tential earnings over that additional year. Thus, if this figure is positive, it im- plies that the social security system causes a disincentive to additional work through forgone social security wealth. This is the relevant concept for the worker who is trading off leisure (on social security) against continued work.
Note that, in computing these concepts, I use the unconditional mortality risk beyond age fifty-five; that is, there is some probability that the worker may be dead at each year after his fifty-fifth birthday. An alternative approach would be to use conditional life tables at each year: for example, for the worker con- sidering retiring on his sixty-third birthday, I discount the future by the age sixty-three-conditional life table. The correct approach here depends on the perspective from which this computation is taken. My approach is appropriate if the computation is taken from the perspective of the forward-looking fifty- four-year-old who is considering the retirement incentives at all future ages. The alternative would be appropriate for year-by-year decision making on re- tirement. Since I discount all the dollar figures back to age fifty-five by both time preference and mortality risk, both concepts yield the same taxhbsidy effects (since both numerator and denominator are deflated); however, they will yield somewhat different values of social security wealth and therefore different accrual rates.
To produce the base-case numbers, I use a typical individual who was born in January 1930 and thus turned age sixty-five in January 1995. In theory, in order to calculate benefits for a worker, I would need his entire earnings history since 1966. In practice, I use a “synthetic” earnings history, which uses the median earnings of a cohort through time. As a first step in creating this syn- thetic earnings history, I have computed information on the median earnings by calendar year and age cohort from the 1973-93 Survey of Consumer Fi- nance (SCF data).9 More specifically, I take the median earnings for a sixty- two-year-old in 1992, for a sixty-one-year-old in 1991, and so on, back through the survey years. To backcast from 1973 to 1966, before cross-sectional survey data are available, I first estimate cross-sectional age-earnings profiles in the 1973 survey. I then apply these estimates to “un-age” the workers in the 1975 survey back to 1966 and deflate these pre-1975 profiles by average wage growth by region, using data from Gruber and Hanratty (1995). To project earnings beyond 1992, I use the growth in the YMPE (actual to 1995, pro- j ected thereafter).
In pursuing this calculation, I found a relatively steep decline in median earnings after about age fifty, which presumably reflects the fact that more and more of the earning population is working only part-time. However, the syn- thetic individual is considering the decision to work full-time for an additional
9. These data are collected annually at the individual level from 1981 on. Before then, they were collected biannually at the family level; I use the information for male heads of household.

92 Jonathan Gruber
year, so this skews the true nature of the underlying earnings history. As a result, I use this synthetic earnings profile through age fifty and then assume that earnings stay constant in real terms from age fifty-one on.
For the purposes of the simulations presented below, I assume that workers claim social security benefits at the point of their retirement or when they be- come eligible if they retire before the point of eligibility. I assume initially that the worker’s wife is exactly three years younger than he. I also assume that she has never worked. Finally, a critical parameter is the level of outside (i.e., asset) income available to the worker since the GIS and SPA benefits are means tested. Following the computation of replacement rates above, I consider two cases: zero outside income and outside income of $4,818.
2.3.2 Base-Case Results Table 2.1 shows the base-case results, with zero asset income. Each row
represents the age of the worker in the last year that he worked; that is, the first row represents the effect of working during the fifty-fourth year and retiring on the fifty-fifth birthday (1 January 1985). The first column shows the net replacement rate. This concept is not defined until the worker can actually claim benefits, which occurs if his last year of work is at age fifty-nine so that he retires at age sixty.
At that first point of possible claiming, the replacement rate is roughly 18 percent. The replacement rate then rises slowly to age sixty-five, as workers increase their social security benefits by delaying claiming. At age sixty-five, there is a large discrete jump, as the OAS benefit begins, and then a continued slow rise from actuarial adjustment. Then, at age sixty-eight, there is another
Table 2.1 Base-Case Incentive Calculations, No Outside Income
Last Year Replacement Accrual Tax I of Work Rate ssw Accrual Rate Subsidy
54 55 56 57 58 59 60 61 62 63 64 65 66 67 68 69
. . .
,1760 ,1964 ,2116 ,2520 ,2806 ,6037 .6 124 .62 12 ,9285 ,9545 .9838
148,138 149,053 148,944 148,188 147,437 146,685 145,232 143,667 142,162 140,528 137,502 131,793 125,678 120,112 115,755 11 1,473
0 916
- 109 -756 -751 -753
- 1,453 - 1,565 - 1,505 - 1,634 - 3,025 -5,709 -6,115 -5,565 -4,357 -4,282
0
- ,0007 - ,005 1 - ,005 1 - .005 1 - ,0099 -.0108 -.0105 -.0115 -.0215 -.0415 - ,0464 - ,0443 -.0363 -.0370
,0062 0 -.0415
,005 1 .0355 ,0365 ,0380 ,0771 .0848 .0848 ,0962 .I859 ,3672 ,4128 .3955 .3269 .3403

93 Social Security and Retirement in Canada
discrete jump from the wife’s OAS benefit and a continued rise from actuarial adjustment. Thus, for the worker who works through his sixty-ninth year and collects on his seventieth birthday, social security replaces roughly all his after- tax earnings.
The next three columns show the evolution of social security wealth over time. In order to understand these results, it is useful to recap the five mecha- nisms through which additional work affects the computation of social security wealth: (1) The worker must pay social security taxes on his earnings, lowering net social security wealth. (2) The additional year of earnings is used in the recomputation of social security benefits, replacing a previous low (or zero) earnings year (besides the 15 percent of lowest months that have already been excluded). Additional work raises net social security wealth through this chan- nel. But this is true only if these additional years of earnings are above the YMPE and some earlier years of earnings were below. For the median worker, in fact, all years of earnings are above the YMPE. (3) The additional year of work, for work at ages sixty-two and beyond, implies a delay in claiming. This raises future benefits through the actuarial adjustment, but it implies fewer years over which benefits can be claimed. As a result, there is an ambiguous effect on net social security wealth. (4) The additional year of work will lower GIS and SPA benefits through means testing, both of the income from work and of the higher CPP benefit that results from additional work. (5) For each year into the future that I consider, there is some chance that the worker will die, lowering his net social security wealth. Thus, it is unclear ex ante whether the social security system will tax or subsidize additional work in any given case.
As table 2.1 shows, a worker who retires on his fifty-fifth birthday has accu- mulated $148,138 in social security wealth. There is then a small increase in social security wealth for work during the fifty-fifth year. This is because the worker still has not completed his earnings history, with the result that addi- tional years of work therefore replace a zero in the benefits computation. Simi- larly, the system is neutral with respect to work during the fifty-sixth year since roughly (in this example) six months of work in that year are required to com- plete the earnings history. After this point, additional earnings do not affect average earnings, as noted above, since earnings in every year are above the YMPE. From age fifty-seven on, therefore, social security wealth uniformly declines, with the result that the system is placing a net tax on work. As a result, the accrual rate is negative in all years except the first.
The final column shows the taxhbsidy rate. There is a slight subsidy to work of 4.2 percent in the fifty-fifth year, as noted above, and then taxes on work thereafter. This tax is lower than the payroll tax that finances the CPP through age sixty since earnings below the YBE and earnings above the YMPE are exempted from tax. But there is no other form of taxbenefit linkage in this range since there is no benefit recomputation for additional work for a worker whose earnings each year were above the YMPE.
94 Jonathan Gruber
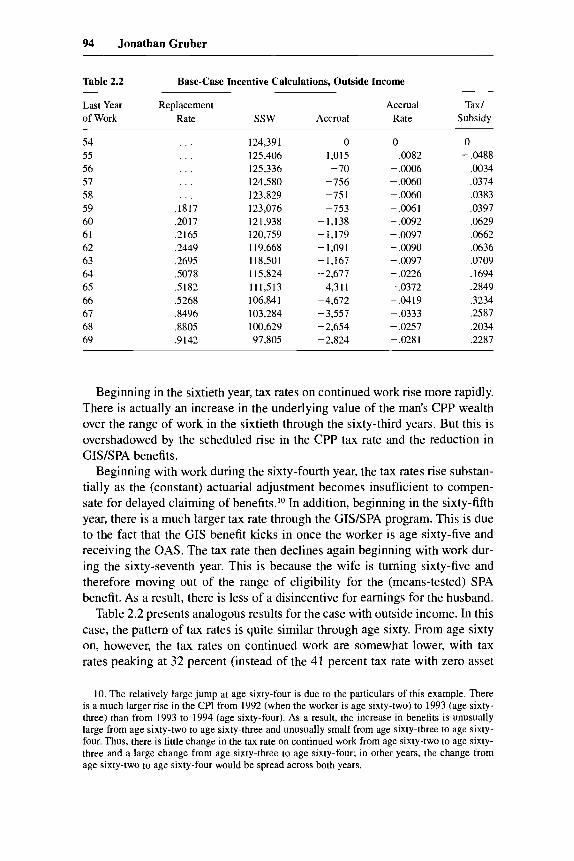
Table 2.2 Base-Case Incentive Calculations, Outside Income
Last Year Replacement Accrual Tax I of Work Rate ssw Accrual Rate Subsidy
54 55 56 57 58 59 60 61 62 63 64 65 66 67 68 69
. .
. . . .I817 .2017 .2165 .2449 .2695 .5078 .5 182 ,5268 ,8496 ,8805 .9 142
124,391 125,406 125,336 124,580 123,829 123,076 121,938 120,759 119,668 118,501 115,824 111,513 106,841 103,284 100.629 97,805
0 1,015 - 70
-756 -751 -753
-1,138 -1,179 -1,091 -1,167 -2,677 -4,311 -4,672 -3,557 -2,654 -2,824
0 ,0082
- .0006 - ,0060 - ,0060 -.0061 - ,0092 -.0097 - ,0090 -.0097 - ,0226 -.0372 -.0419 -.0333 -.0257 - ,028 1
0 -.0488
,0034 .0374 .0383 .0397 .0629 ,0662 ,0636 .0709 .I694 .2849 .3234 .2587 .2034 ,2287
Beginning in the sixtieth year, tax rates on continued work rise more rapidly. There is actually an increase in the underlying value of the man's CPP wealth over the range of work in the sixtieth through the sixty-third years. But this is overshadowed by the scheduled rise in the CPP tax rate and the reduction in CISISPA benefits.
Beginning with work during the sixty-fourth year, the tax rates rise substan- tially as the (constant) actuarial adjustment becomes insufficient to compen- sate for delayed claiming of benefits.I0 In addition, beginning in the sixty-fifth year, there is a much larger tax rate through the GIS/SPA program. This is due to the fact that the CIS benefit kicks in once the worker is age sixty-five and receiving the OAS. The tax rate then declines again beginning with work dur- ing the sixty-seventh year. This is because the wife is turning sixty-five and therefore moving out of the range of eligibility for the (means-tested) SPA benefit. As a result, there is less of a disincentive for earnings for the husband.
Table 2.2 presents analogous results for the case with outside income. In this case, the pattern of tax rates is quite similar through age sixty. From age sixty on, however, the tax rates on continued work are somewhat lower, with tax rates peaking at 32 percent (instead of the 41 percent tax rate with zero asset
10. The relatively large jump at age sixty-four is due to the particulars of this example. There is a much larger rise in the CPI from 1992 (when the worker is age sixty-two) to 1993 (age sixty- three) than from 1993 to 1994 (age sixty-four). As a result, the increase in benefits is unusually large from age sixty-two to age sixty-three and unusually small from age sixty-three to age sixty- four. Thus, there is little change in the tax rate on continued work from age sixty-two to age sixty- three and a large change from age sixty-three to age sixty-four; in other years, the change from age sixty-two to age sixty-four would be spread across both years.
95 Social Security and Retirement in Canada
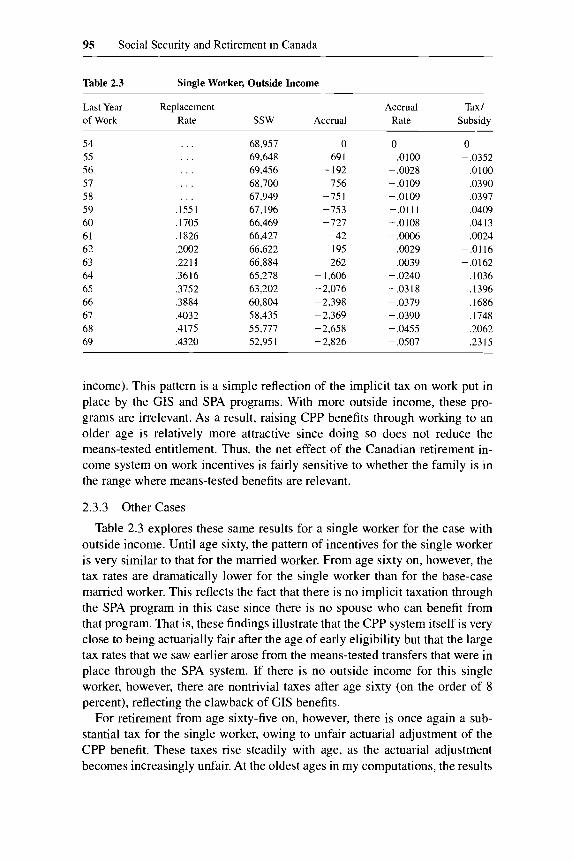
Table 2.3
Last Year Replacement Accrual Tax / of Work Rate SSW Accrual Rate Subsidy
Single Worker, Outside Income
54 55 56 57 58 59 60 61 62 63 64 65 66 67 68 69
. . .
. . .
,1551 ,1705 ,1826 ,2002 ,2211 .36 I6 ,3752 ,3884 .4032 ,4175 ,4320
68,957 69,648 69,456 68,700 67,949 67,196 66,469 66,427 66,622 66,884 65,278 63,202 60,804 58,435 55,117 52,95 1
0 69 I
- 192 -756 -751 -753 -727 - 42 195 262
- 1,606 -2,076 -2,398 -2,369 -2,658 -2,826
0 .0100
- ,0028 -.0109 -.0109 -.0111 -.0108 - ,0006
,0029 ,0039
- ,0240 -.0318 - ,0379 - ,0390 - ,0455 -.0507
0 - ,0352
.0100
.0390 ,0397 ,0409 .04 13 ,0024
-.0116 -.0162
,1036 ,1396 ,1686 ,1748 .2062 ,2315
income). This pattern is a simple reflection of the implicit tax on work put in place by the GIS and SPA programs. With more outside income, these pro- grams are irrelevant. As a result, raising CPP benefits through working to an older age is relatively more attractive since doing so does not reduce the means-tested entitlement. Thus, the net effect of the Canadian retirement in- come system on work incentives is fairly sensitive to whether the family is in the range where means-tested benefits are relevant.
2.3.3 Other Cases Table 2.3 explores these same results for a single worker for the case with
outside income. Until age sixty, the pattern of incentives for the single worker is very similar to that for the married worker. From age sixty on, however, the tax rates are dramatically lower for the single worker than for the base-case married worker. This reflects the fact that there is no implicit taxation through the SPA program in this case since there is no spouse who can benefit from that program. That is, these findings illustrate that the CPP system itself is very close to being actuarially fair after the age of early eligibility but that the large tax rates that we saw earlier arose from the means-tested transfers that were in place through the SPA system. If there is no outside income for this single worker, however, there are nontrivial taxes after age sixty (on the order of 8 percent), reflecting the clawback of GIS benefits.
For retirement from age sixty-five on, however, there is once again a sub- stantial tax for the single worker, owing to unfair actuarial adjustment of the CPP benefit. These taxes rise steadily with age, as the actuarial adjustment becomes increasingly unfair. At the oldest ages in my computations, the results

96 Jonathan Gruber
Table 2.4 Tenth Percentile Earner, No Outside Income
Last Year Replacement Accrual Tax/ of Work Rate ssw Accrual Rate Subsidy
54 . . . 140,871 0 0 0 55 . . . 141,388 517 .0037 - ,0474 56 . . . 141,377 -12 - .ooo 1 .0011 57 . . . 141,042 -335 - ,0024 ,0322 58 . . . 140,696 - 346 - .0025 ,0348 59 .28 10 140,344 -352 - .0025 ,0369 60 ,3141 139,124 - 1,220 -.0087 ,1362 61 ,3373 137,743 -1,381 - ,0099 ,1580 62 .4143 136,422 -1,321 -.0096 ,1584 63 .4608 135 ,O 14 ~ 1,408 -.0103 ,1711 64 1.2210 132,699 -2,315 -.0171 .3057 65 1.2427 128,110 -4,589 -.0346 ,6377 66 1.2650 123,311 -4,799 -.0375 ,7035 67 1.7663 11 8,940 -4,370 -.0354 ,6776 68 1.8110 115,124 -3,816 -.0321 ,6276 69 1.8596 11 1,432 -3,692 - ,032 1 ,6548
are once again similar for married couples and singles as wives have moved out of the range of SPA eligibility.
One particularly interesting dimension of heterogeneity is the lifetime earn- ings of workers. Tables 2.4 and 2.5 contrast the case of a worker whose earn- ings are at the tenth percentile of the earnings distribution with that of one whose earnings are at the ninetieth percentile. In doing this calculation, I as- sume that the age-earnings profiles of both workers are the same; I simply shift the intercept at age fifty for these profiles. For the tenth-percentile worker, I assume no outside income; for the ninetieth-percentile case, I assume the me- dian outside income.
Before age sixty, these cases yield fairly similar results. One interesting finding is that the tax rates on both high and low earners are lower than those on the base-case worker. This is because more of the earnings of the high earner are above the YMPE and therefore exempt from taxation; similarly, more of the earnings of the low earner are below the YBE and also exempt from taxation. But these differences are fairly slight.
But, from age sixty on, a striking difference emerges. For the low-income worker, this system is very generous, replacing 28 percent of his income if he retires after his fifty-ninth year, 122 percent of his income if he retires after his sixty-fourth year, and 186 percent of his income if he retires after his sixty- ninth year. At the same time, the tax rates in place are very large; they reach a peak of over 70 percent for retirement on the seventieth birthday. Thus, the worker with low lifetime earnings and no outside income faces a large disin- centive in considering further work after age sixty and particularly from age sixty-five on.

97 Social Security and Retirement in Canada
Table 2.5 Ninetieth Percentile Earner, Outside Income
Last Year Replacement Accrual Tax/ of Work Rate ssw Accrual Rate Subsidy
54 55 56 57 58 59 60 61 62 63 64 65 66 67 68 69
. . . ,1146 ,1264 ,1355 . I529 . I679 ,3152 ,3207 .325 1 ,5228 ,5404 ,5594
124,391 125,406 125,336 124,580 123,829 123,076 121,938 120,759 119,668 118,501 115,824 11 1,5 13 106,841 103,284 100,629 97,805
0 1,015 -70
-756 -751 -753
-1,138 -1,179 -1,091 -1,167 -2,677 -4,311 -4,672 -3,557 -2,654 -2,824
0
- .0006 - ,0060 - ,0060 -.0061 - ,0092 - ,0097 - ,0090 - ,0097 - ,0226 -.0372 -.0419 -.0333 - ,0257 - .028 1
,0082 0 -.0318
,0022 .0239 ,0243 ,0250 ,0394 ,0414 ,0397 ,0441 ,1050 .1761 .1993 ,1591 ,1247 ,1398
Base Case A Tenth Percentile n Ninetieth Percentile
.05 1 l 1 1 1 1 1 1 1 1 1 1 1 l I I
55 56 57 58 59 60 61 62 63 64 65 66 67 68 69 age
Fig. 2.15 Taxhbsidy rates by earnings level
For workers with higher lifetime earnings, the replacement rates through the system are much lower, as are the implicit tax rates. Even at their peak, the tax rates on continued work are below 20 percent. These patterns are compared in figure 2.15, which illustrates these differences: similar tax rates until age sixty, with a growing divergence thereafter.
Finally, table 2.6 considers a different permutation to the earnings history:

98 Jonathan Gruber
Table 2.6 Incomplete Earnings History, Outside Income
Last Year Replacement Accrual Tax/ of Work Rate ssw Accrual Rate Subsidy
54 . . . 117,249 0 0 0 55 . . . 11 8,264 1,015 ,0087 - ,0488 56 . . . 119,252 988 .0084 - ,0487 57 . . . 120,247 995 .0083 - ,0492 58 . . . 121,237 990 .0082 - ,0505 59 ,1783 122,213 977 ,008 I -.0515 60 ,1995 121,293 -920 -.0075 .0508 61 .2155 120,387 - 906 -.0075 ,0509 62 ,2450 119,462 -925 - .0077 .0539 63 ,2696 118,295 -1,167 - ,0098 .0709 64 .5085 115,617 -2,678 -.0226 ,1695 65 .5 186 111,257 -4,361 -.0377 .2882 66 .5275 106,582 -4,675 - ,0420 ,3236 67 ,8497 102,978 -3,604 -.0338 .2621 68 3807 100,323 -2,654 -.0258 .2034 69 ,9143 97,499 -2,824 - ,028 1 .2287
assuming that the worker was unemployed for four years and that he therefore has an incomplete earnings history (for the case with outside income). This offers an incentive for the worker to retire later since additional years of work replace zeros in the computation of CPP benefits. This is illustrated by the sizable subsidy to work through age fifty-nine; this subsidy arises because of the replacement of zero values in the earnings history. From age sixty to age sixty-two, there is a tax rate on continued work, but it is smaller than in the base case. Then, from age sixty-three on, the tax rate is the same as in the base case as the earnings history has been completed.
2.4 Conclusions
The system of retirement income provision in Canada is a critically impor- tant feature of the opportunity set of older workers who are considering retire- ment. This set of four programs provides a large source of income support for retired workers, but it also potentially taxes continued work among those who wish to work beyond the age of early retirement eligibility. I have documented that there is clearly an important effect of these programs on the timing of retirement. Future work on retirement in Canada could usefully explore the effect of program generosity on retirement behavior. In particular, it is impor- tant to assess the role that these (often quite large) implicit taxes play in de- termining retirement decisions, both on average and across groups of workers that face very different incentives, for example, high and low earners.
99 Social Security and Retirement in Canada
Appendix Data Sources
Historical Data
Labor force participation data are from Statistics Canada’s CANSIM CD- rom. Data were also provided directly by Statistics Canada. Population data are from Economic Council of Canada (1976), Denton and Ostry (1967), and Statistics Canada ( 1 995). Data on program receipt are from Human Resources Development Canada ( I 996).
Contemporaneous Data
data for 1992 and 1993. All contemporaneous figures were tabulated by the author from April SCF
References
Baker, Michael, and Dwayne Benjamin. 1996. Early retirement provisions and the la- bour force behaviour of older men: Evidence from Canada. University of Toronto, Department of Economics. Mimeo.
. 1997. How do retirement tests affect the labor supply of older men? University of Toronto, Department of Economics. Mimeo.
Burtless, Gary, and Robert Moffitt. 1986. Social security, earnings tests, and age at re- tirement. Public Finance Quarterly 14:3-27.
Denton, Frank D., and Sylvia Ostry. 1967. Historical estimates of the Canadian labour force. Ottawa: Dominion Bureau of Statistics.
Economic Council of Canada. 1976. People and jobs: A study of the Canadian labor market. Ottawa: Information Canada.
Gruber, Jonathan. 1996. Disability insurance benefits and labor supply of older persons. Massachusetts Institute of Technology, Department of Economics. Mimeo.
Gruber, Jonathan, and Maria Hanratty. 1995. The labor market effects of introducing national health insurance: Evidence from Canada. Journal of Economics and Busi- ness Statistics 13, no. 2 (April): 163-74.
Human Resources Development Canada. 1996. Statistics related to income security programs. Ottawa.
Office of the Superintendant of Financial Institutions Canada. 1993. Canada Pension Plan: Fifteenth actuarial report. Ottawa.
Statistics Canada. 1995. Historical labor force statistics. Ottawa.