social security and medicare lifetime benefits and taxes · 2 social security and me dicare...
TRANSCRIPT
C. Eugene Steuerle and Caleb Quakenbush
September 2015
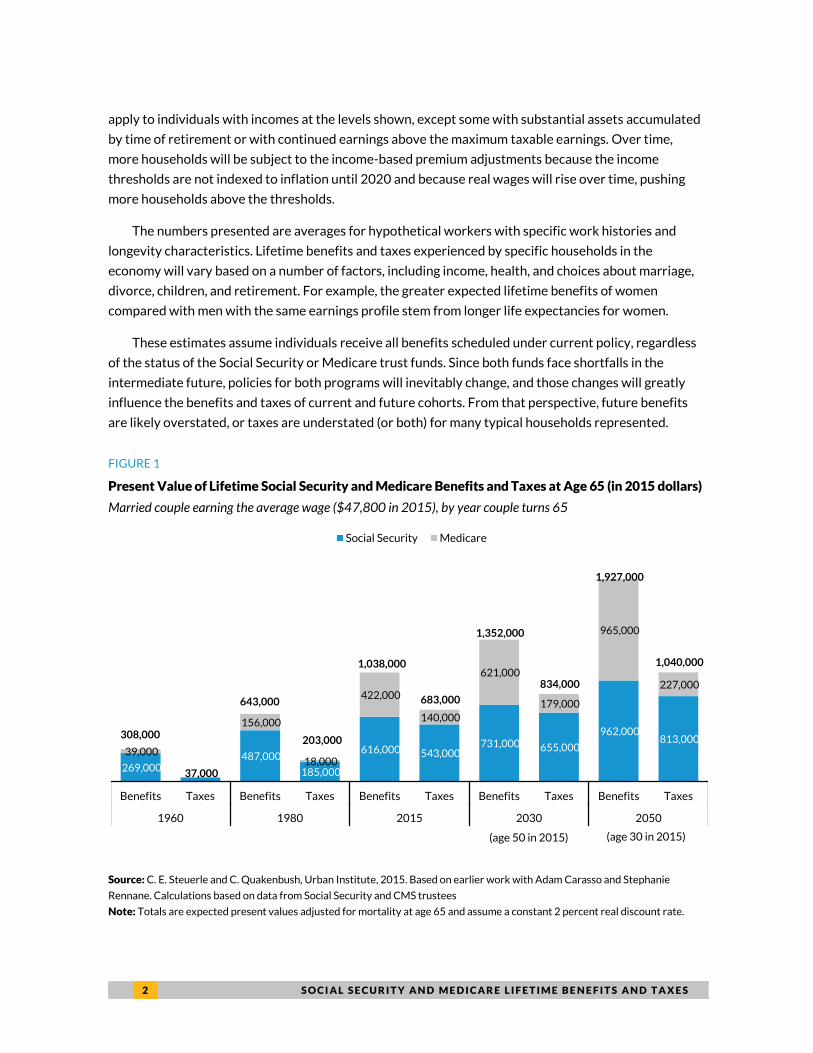
How big is your retirement package? Benefits from government retirement
programs—Social Security and Medicare—vary over time, but the trend has been
toward higher lifetime benefits for each successive cohort. Expansion derives mainly
from increases in real annual benefits, more years of benefits through longer lifespans,
and better and more expensive health care. In 1960, a couple where each spouse
earned constant “average” wages over a career beginning at age 22 and retired on his
or her 65th birthday would receive about $300,000 in health and retirement benefits;
today, that figure is over $1 million in health and retirement benefits (figure 1). The
expected benefits for couples turning 65 in 2050—age 30 today—are scheduled to rise
under current law to almost $2 million.
The following tables show the expected present value at age 65 of benefits received in retirement
and taxes paid over a career for households with different wage and marriage histories. The underlying
data come from the 2015 Social Security and Medicare trustees’ reports and supplemental data
published by the Social Security Administration and Centers for Medicare and Medicaid Services (CMS).
For Medicare lifetime benefits, we use an alternative cost scenario from CMS that assumes that certain
measures that result in declining reimbursement rates relative to private insurance are not fully
realized over time, resulting in higher Medicare expenditures in the out years. In calculating expected
present values, we use sex-adjusted probabilities to account for chance of death after age 65 and a
discount rate of 2 percent plus inflation.
Medicare premiums paid by individuals are subtracted from Medicare benefits. Higher income-
adjusted Medicare premiums for high-income retirees are not included here since they generally do not
E X E C U T I V E O F F I C E R E S E A R C H
Social Security and Medicare Lifetime
Benefits and Taxes 2015 Update
Social Security and Medicare Lifetime
Benefits and Taxes 2015 Update
E X E C U T I V E O F F I C E R E S E A R C H
2 S O C I A L S E C U R I T Y A N D M E D I C A R E L I F E T I M E B E N E F I T S A N D T A X E S
269,000 487,000
185,000
616,000 543,000 731,000 655,000
962,000 813,000
39,000
156,000
18,000
422,000
140,000
621,000
179,000
965,000
227,000
308,000
37,000
643,000
203,000
1,038,000
683,000
1,352,000
834,000
1,927,000
1,040,000
Benefits Taxes Benefits Taxes Benefits Taxes Benefits Taxes Benefits Taxes
1960 1980 2015 2030 2050
Social Security Medicare
(age 50 in 2015) (age 30 in 2015)
apply to individuals with incomes at the levels shown, except some with substantial assets accumulated
by time of retirement or with continued earnings above the maximum taxable earnings. Over time,
more households will be subject to the income-based premium adjustments because the income
thresholds are not indexed to inflation until 2020 and because real wages will rise over time, pushing
more households above the thresholds.
The numbers presented are averages for hypothetical workers with specific work histories and
longevity characteristics. Lifetime benefits and taxes experienced by specific households in the
economy will vary based on a number of factors, including income, health, and choices about marriage,
divorce, children, and retirement. For example, the greater expected lifetime benefits of women
compared with men with the same earnings profile stem from longer life expectancies for women.
These estimates assume individuals receive all benefits scheduled under current policy, regardless
of the status of the Social Security or Medicare trust funds. Since both funds face shortfalls in the
intermediate future, policies for both programs will inevitably change, and those changes will greatly
influence the benefits and taxes of current and future cohorts. From that perspective, future benefits
are likely overstated, or taxes are understated (or both) for many typical households represented.
FIGURE 1
Present Value of Lifetime Social Security and Medicare Benefits and Taxes at Age 65 (in 2015 dollars)
Married couple earning the average wage ($47,800 in 2015), by year couple turns 65
Source: C. E. Steuerle and C. Quakenbush, Urban Institute, 2015. Based on earlier work with Adam Carasso and Stephanie
Rennane. Calculations based on data from Social Security and CMS trustees
Note: Totals are expected present values adjusted for mortality at age 65 and assume a constant 2 percent real discount rate.
S O C I A L S E C U R I T Y A N D M E D I C A R E L I F E T I M E B E N E F I T S A N D T A X E S 3
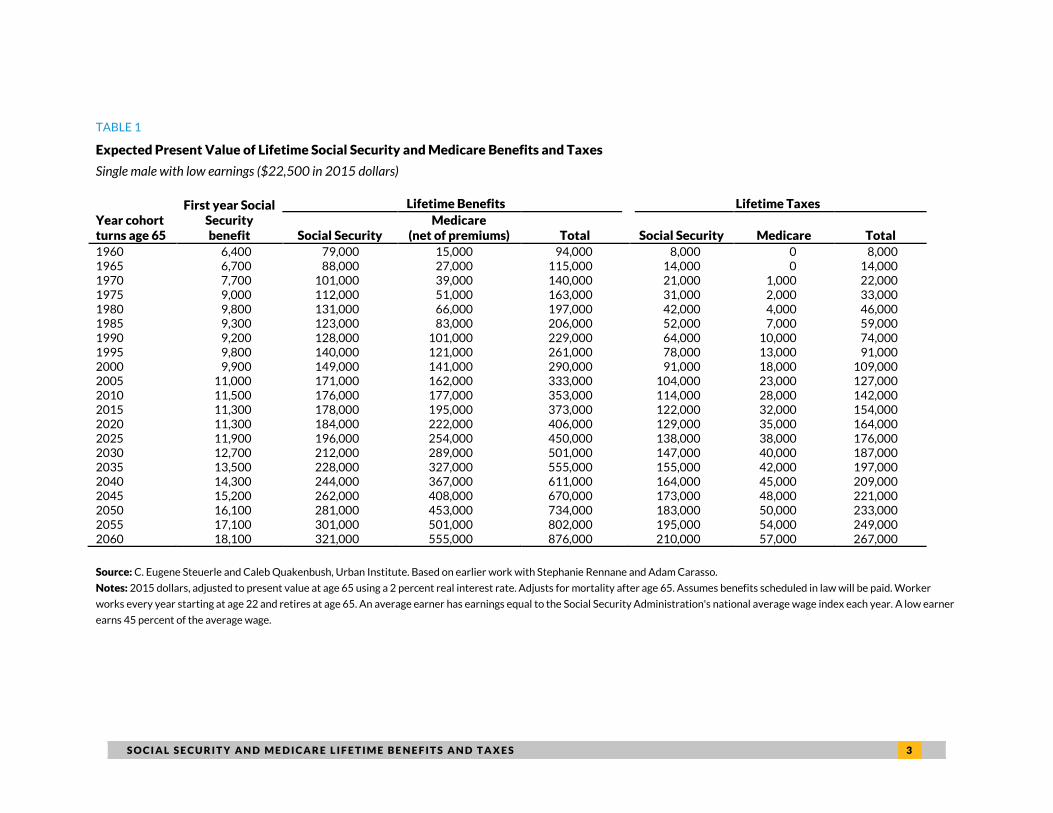
TABLE 1
Expected Present Value of Lifetime Social Security and Medicare Benefits and Taxes
Single male with low earnings ($22,500 in 2015 dollars)
Year cohort turns age 65
First year Social Security benefit
Lifetime Benefits Lifetime Taxes
Social Security Medicare
(net of premiums) Total Social Security Medicare Total
1960 6,400 79,000 15,000 94,000 8,000 0 8,000 1965 6,700 88,000 27,000 115,000 14,000 0 14,000 1970 7,700 101,000 39,000 140,000 21,000 1,000 22,000 1975 9,000 112,000 51,000 163,000 31,000 2,000 33,000 1980 9,800 131,000 66,000 197,000 42,000 4,000 46,000 1985 9,300 123,000 83,000 206,000 52,000 7,000 59,000 1990 9,200 128,000 101,000 229,000 64,000 10,000 74,000 1995 9,800 140,000 121,000 261,000 78,000 13,000 91,000 2000 9,900 149,000 141,000 290,000 91,000 18,000 109,000 2005 11,000 171,000 162,000 333,000 104,000 23,000 127,000 2010 11,500 176,000 177,000 353,000 114,000 28,000 142,000 2015 11,300 178,000 195,000 373,000 122,000 32,000 154,000 2020 11,300 184,000 222,000 406,000 129,000 35,000 164,000 2025 11,900 196,000 254,000 450,000 138,000 38,000 176,000 2030 12,700 212,000 289,000 501,000 147,000 40,000 187,000 2035 13,500 228,000 327,000 555,000 155,000 42,000 197,000 2040 14,300 244,000 367,000 611,000 164,000 45,000 209,000 2045 15,200 262,000 408,000 670,000 173,000 48,000 221,000 2050 16,100 281,000 453,000 734,000 183,000 50,000 233,000 2055 17,100 301,000 501,000 802,000 195,000 54,000 249,000 2060 18,100 321,000 555,000 876,000 210,000 57,000 267,000
Source: C. Eugene Steuerle and Caleb Quakenbush, Urban Institute. Based on earlier work with Stephanie Rennane and Adam Carasso.
Notes: 2015 dollars, adjusted to present value at age 65 using a 2 percent real interest rate. Adjusts for mortality after age 65. Assumes benefits scheduled in law will be paid. Worker
works every year starting at age 22 and retires at age 65. An average earner has earnings equal to the Social Security Administration's national average wage index each year. A low earner
earns 45 percent of the average wage.
4 S O C I A L S E C U R I T Y A N D M E D I C A R E L I F E T I M E B E N E F I T S A N D T A X E S
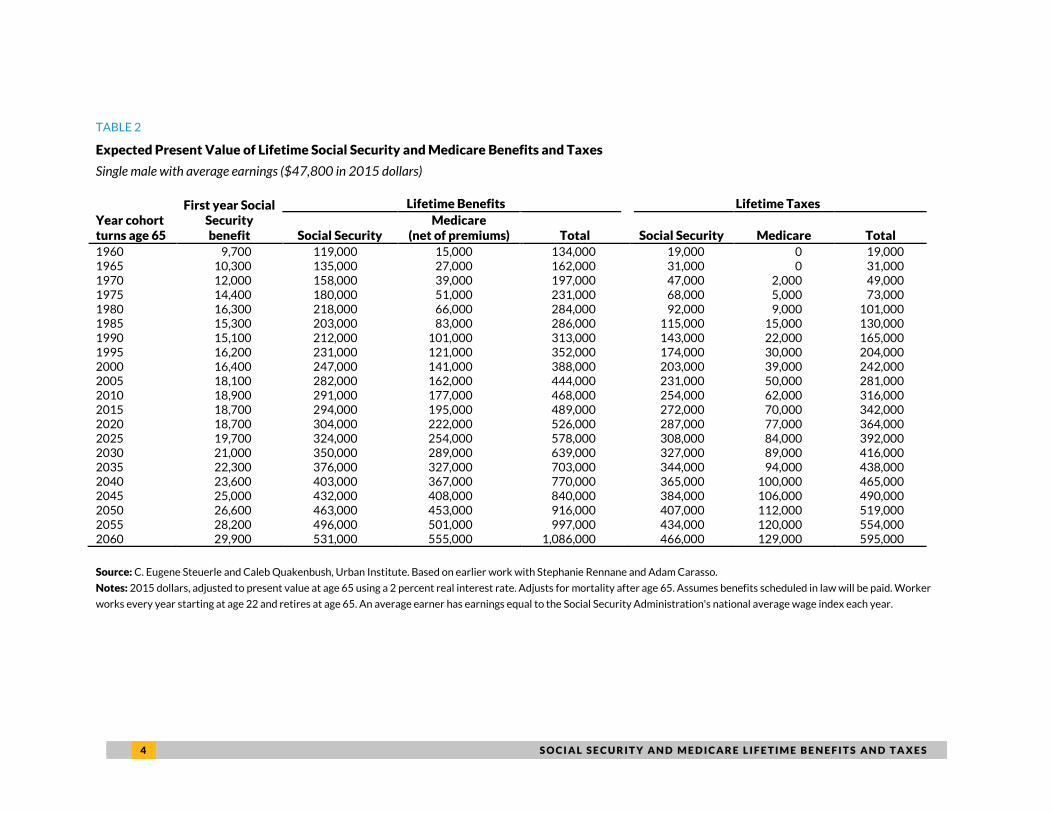
TABLE 2
Expected Present Value of Lifetime Social Security and Medicare Benefits and Taxes
Single male with average earnings ($47,800 in 2015 dollars)
Year cohort turns age 65
First year Social Security benefit
Lifetime Benefits Lifetime Taxes
Social Security Medicare
(net of premiums) Total Social Security Medicare Total
1960 9,700 119,000 15,000 134,000 19,000 0 19,000 1965 10,300 135,000 27,000 162,000 31,000 0 31,000 1970 12,000 158,000 39,000 197,000 47,000 2,000 49,000 1975 14,400 180,000 51,000 231,000 68,000 5,000 73,000 1980 16,300 218,000 66,000 284,000 92,000 9,000 101,000 1985 15,300 203,000 83,000 286,000 115,000 15,000 130,000 1990 15,100 212,000 101,000 313,000 143,000 22,000 165,000 1995 16,200 231,000 121,000 352,000 174,000 30,000 204,000 2000 16,400 247,000 141,000 388,000 203,000 39,000 242,000 2005 18,100 282,000 162,000 444,000 231,000 50,000 281,000 2010 18,900 291,000 177,000 468,000 254,000 62,000 316,000 2015 18,700 294,000 195,000 489,000 272,000 70,000 342,000 2020 18,700 304,000 222,000 526,000 287,000 77,000 364,000 2025 19,700 324,000 254,000 578,000 308,000 84,000 392,000 2030 21,000 350,000 289,000 639,000 327,000 89,000 416,000 2035 22,300 376,000 327,000 703,000 344,000 94,000 438,000 2040 23,600 403,000 367,000 770,000 365,000 100,000 465,000 2045 25,000 432,000 408,000 840,000 384,000 106,000 490,000 2050 26,600 463,000 453,000 916,000 407,000 112,000 519,000 2055 28,200 496,000 501,000 997,000 434,000 120,000 554,000 2060 29,900 531,000 555,000 1,086,000 466,000 129,000 595,000
Source: C. Eugene Steuerle and Caleb Quakenbush, Urban Institute. Based on earlier work with Stephanie Rennane and Adam Carasso.
Notes: 2015 dollars, adjusted to present value at age 65 using a 2 percent real interest rate. Adjusts for mortality after age 65. Assumes benefits scheduled in law will be paid. Worker
works every year starting at age 22 and retires at age 65. An average earner has earnings equal to the Social Security Administration's national average wage index each year.
S O C I A L S E C U R I T Y A N D M E D I C A R E L I F E T I M E B E N E F I T S A N D T A X E S 5
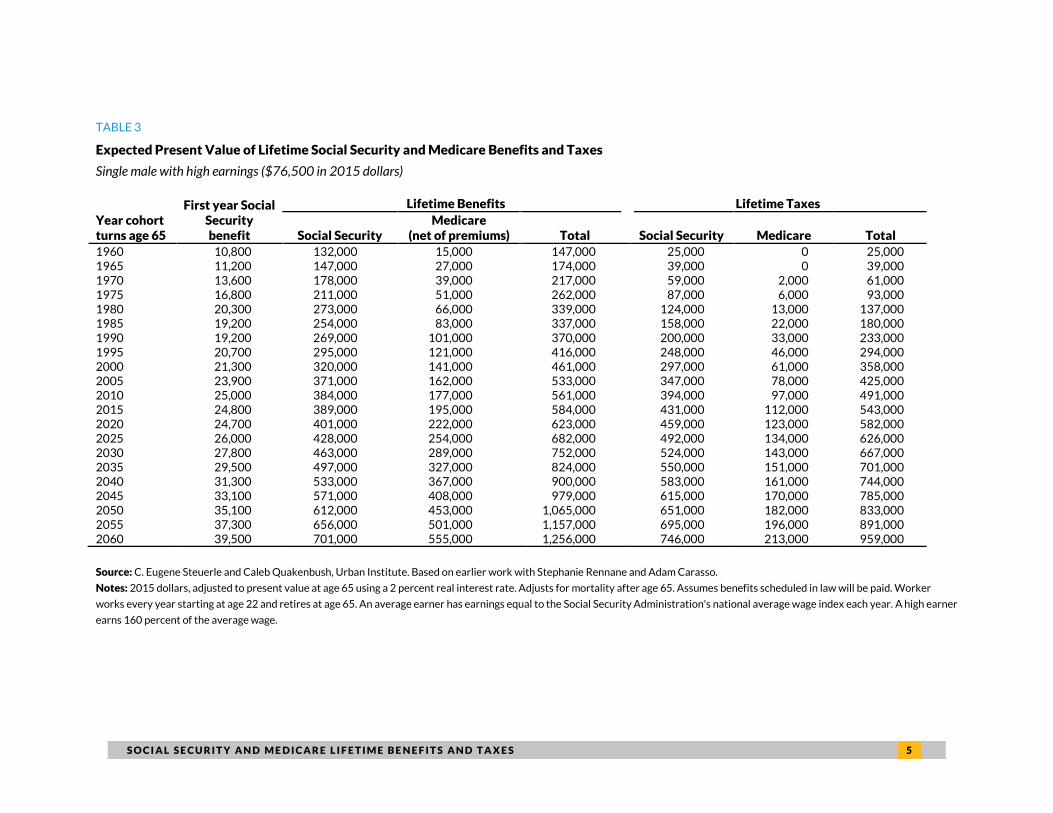
TABLE 3
Expected Present Value of Lifetime Social Security and Medicare Benefits and Taxes
Single male with high earnings ($76,500 in 2015 dollars)
Year cohort turns age 65
First year Social Security benefit
Lifetime Benefits Lifetime Taxes
Social Security Medicare
(net of premiums) Total Social Security Medicare Total
1960 10,800 132,000 15,000 147,000 25,000 0 25,000 1965 11,200 147,000 27,000 174,000 39,000 0 39,000 1970 13,600 178,000 39,000 217,000 59,000 2,000 61,000 1975 16,800 211,000 51,000 262,000 87,000 6,000 93,000 1980 20,300 273,000 66,000 339,000 124,000 13,000 137,000 1985 19,200 254,000 83,000 337,000 158,000 22,000 180,000 1990 19,200 269,000 101,000 370,000 200,000 33,000 233,000 1995 20,700 295,000 121,000 416,000 248,000 46,000 294,000 2000 21,300 320,000 141,000 461,000 297,000 61,000 358,000 2005 23,900 371,000 162,000 533,000 347,000 78,000 425,000 2010 25,000 384,000 177,000 561,000 394,000 97,000 491,000 2015 24,800 389,000 195,000 584,000 431,000 112,000 543,000 2020 24,700 401,000 222,000 623,000 459,000 123,000 582,000 2025 26,000 428,000 254,000 682,000 492,000 134,000 626,000 2030 27,800 463,000 289,000 752,000 524,000 143,000 667,000 2035 29,500 497,000 327,000 824,000 550,000 151,000 701,000 2040 31,300 533,000 367,000 900,000 583,000 161,000 744,000 2045 33,100 571,000 408,000 979,000 615,000 170,000 785,000 2050 35,100 612,000 453,000 1,065,000 651,000 182,000 833,000 2055 37,300 656,000 501,000 1,157,000 695,000 196,000 891,000 2060 39,500 701,000 555,000 1,256,000 746,000 213,000 959,000
Source: C. Eugene Steuerle and Caleb Quakenbush, Urban Institute. Based on earlier work with Stephanie Rennane and Adam Carasso.
Notes: 2015 dollars, adjusted to present value at age 65 using a 2 percent real interest rate. Adjusts for mortality after age 65. Assumes benefits scheduled in law will be paid. Worker
works every year starting at age 22 and retires at age 65. An average earner has earnings equal to the Social Security Administration's national average wage index each year. A high earner
earns 160 percent of the average wage.
6 S O C I A L S E C U R I T Y A N D M E D I C A R E L I F E T I M E B E N E F I T S A N D T A X E S
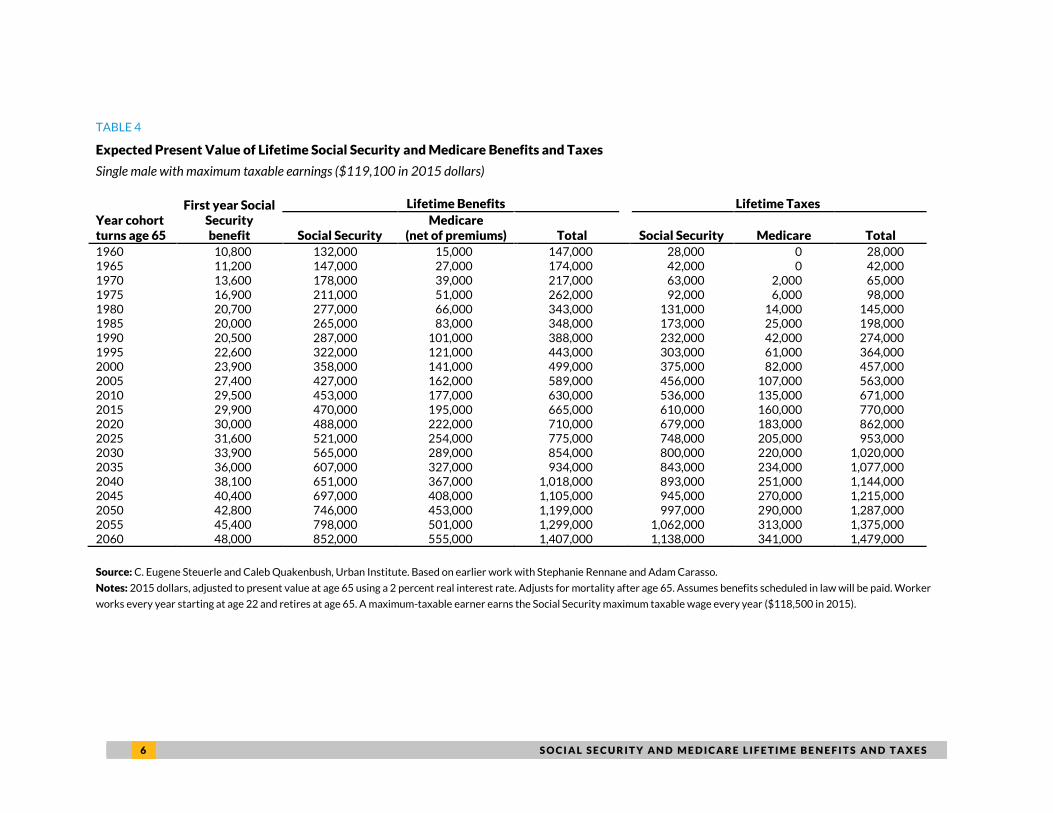
TABLE 4
Expected Present Value of Lifetime Social Security and Medicare Benefits and Taxes
Single male with maximum taxable earnings ($119,100 in 2015 dollars)
Year cohort turns age 65
First year Social Security benefit
Lifetime Benefits Lifetime Taxes
Social Security Medicare
(net of premiums) Total Social Security Medicare Total
1960 10,800 132,000 15,000 147,000 28,000 0 28,000 1965 11,200 147,000 27,000 174,000 42,000 0 42,000 1970 13,600 178,000 39,000 217,000 63,000 2,000 65,000 1975 16,900 211,000 51,000 262,000 92,000 6,000 98,000 1980 20,700 277,000 66,000 343,000 131,000 14,000 145,000 1985 20,000 265,000 83,000 348,000 173,000 25,000 198,000 1990 20,500 287,000 101,000 388,000 232,000 42,000 274,000 1995 22,600 322,000 121,000 443,000 303,000 61,000 364,000 2000 23,900 358,000 141,000 499,000 375,000 82,000 457,000 2005 27,400 427,000 162,000 589,000 456,000 107,000 563,000 2010 29,500 453,000 177,000 630,000 536,000 135,000 671,000 2015 29,900 470,000 195,000 665,000 610,000 160,000 770,000 2020 30,000 488,000 222,000 710,000 679,000 183,000 862,000 2025 31,600 521,000 254,000 775,000 748,000 205,000 953,000 2030 33,900 565,000 289,000 854,000 800,000 220,000 1,020,000 2035 36,000 607,000 327,000 934,000 843,000 234,000 1,077,000 2040 38,100 651,000 367,000 1,018,000 893,000 251,000 1,144,000 2045 40,400 697,000 408,000 1,105,000 945,000 270,000 1,215,000 2050 42,800 746,000 453,000 1,199,000 997,000 290,000 1,287,000 2055 45,400 798,000 501,000 1,299,000 1,062,000 313,000 1,375,000 2060 48,000 852,000 555,000 1,407,000 1,138,000 341,000 1,479,000
Source: C. Eugene Steuerle and Caleb Quakenbush, Urban Institute. Based on earlier work with Stephanie Rennane and Adam Carasso.
Notes: 2015 dollars, adjusted to present value at age 65 using a 2 percent real interest rate. Adjusts for mortality after age 65. Assumes benefits scheduled in law will be paid. Worker
works every year starting at age 22 and retires at age 65. A maximum-taxable earner earns the Social Security maximum taxable wage every year ($118,500 in 2015).

S O C I A L S E C U R I T Y A N D M E D I C A R E L I F E T I M E B E N E F I T S A N D T A X E S 7
TABLE 5
Expected Present Value of Lifetime Social Security and Medicare Benefits and Taxes
Single female with low earnings ($22,500 in 2015 dollars)
Year cohort turns age 65
First year Social Security benefit
Lifetime Benefits Lifetime Taxes
Social Security Medicare
(net of premiums) Total Social Security Medicare Total
1960 6,500 102,000 25,000 127,000 8,000 0 8,000 1965 6,800 116,000 41,000 157,000 14,000 0 14,000 1970 7,900 132,000 57,000 189,000 21,000 1,000 22,000 1975 9,200 145,000 73,000 218,000 31,000 2,000 33,000 1980 9,800 162,000 90,000 252,000 42,000 4,000 46,000 1985 9,300 147,000 108,000 255,000 52,000 7,000 59,000 1990 9,200 151,000 128,000 279,000 64,000 10,000 74,000 1995 9,800 161,000 148,000 309,000 78,000 13,000 91,000 2000 9,900 168,000 167,000 335,000 91,000 18,000 109,000 2005 11,000 190,000 189,000 379,000 104,000 23,000 127,000 2010 11,500 194,000 206,000 400,000 114,000 28,000 142,000 2015 11,300 195,000 227,000 422,000 122,000 32,000 154,000 2020 11,300 201,000 257,000 458,000 129,000 35,000 164,000 2025 11,900 214,000 293,000 507,000 138,000 38,000 176,000 2030 12,700 231,000 331,000 562,000 147,000 40,000 187,000 2035 13,500 247,000 373,000 620,000 155,000 42,000 197,000 2040 14,300 264,000 417,000 681,000 164,000 45,000 209,000 2045 15,200 282,000 463,000 745,000 173,000 48,000 221,000 2050 16,100 302,000 512,000 814,000 183,000 50,000 233,000 2055 17,100 323,000 566,000 889,000 195,000 54,000 249,000 2060 18,100 345,000 625,000 970,000 210,000 57,000 267,000
Source: C. Eugene Steuerle and Caleb Quakenbush, Urban Institute. Based on earlier work with Stephanie Rennane and Adam Carasso.
Notes: 2015 dollars, adjusted to present value at age 65 using a 2 percent real interest rate. Adjusts for mortality after age 65. Assumes benefits scheduled in law will be paid. Worker
works every year starting at age 22 and retires at age 65. An average earner has earnings equal to the Social Security Administration's national average wage index each year. A low earner
earns 45 percent of the average wage.

8 S O C I A L S E C U R I T Y A N D M E D I C A R E L I F E T I M E B E N E F I T S A N D T A X E S
TABLE 6
Expected Present Value of Lifetime Social Security and Medicare Benefits and Taxes
Single female with average earnings ($47,800 in 2015 dollars)
Year cohort turns age 65
First year Social Security benefit
Lifetime Benefits Lifetime Taxes
Social Security Medicare
(net of premiums) Total Social Security Medicare Total
1960 9,800 155,000 25,000 180,000 19,000 0 19,000 1965 10,600 180,000 41,000 221,000 31,000 0 31,000 1970 12,400 209,000 57,000 266,000 47,000 2,000 49,000 1975 14,900 235,000 73,000 308,000 68,000 5,000 73,000 1980 16,300 269,000 90,000 359,000 92,000 9,000 101,000 1985 15,300 243,000 108,000 351,000 115,000 15,000 130,000 1990 15,100 249,000 128,000 377,000 143,000 22,000 165,000 1995 16,200 265,000 148,000 413,000 174,000 30,000 204,000 2000 16,400 277,000 167,000 444,000 203,000 39,000 242,000 2005 18,100 313,000 189,000 502,000 231,000 50,000 281,000 2010 18,900 320,000 206,000 526,000 254,000 62,000 316,000 2015 18,700 322,000 227,000 549,000 272,000 70,000 342,000 2020 18,700 332,000 257,000 589,000 287,000 77,000 364,000 2025 19,700 353,000 293,000 646,000 308,000 84,000 392,000 2030 21,000 381,000 331,000 712,000 327,000 89,000 416,000 2035 22,300 408,000 373,000 781,000 344,000 94,000 438,000 2040 23,600 436,000 417,000 853,000 365,000 100,000 465,000 2045 25,000 466,000 463,000 929,000 384,000 106,000 490,000 2050 26,600 499,000 512,000 1,011,000 407,000 112,000 519,000 2055 28,200 533,000 566,000 1,099,000 434,000 120,000 554,000 2060 29,900 569,000 625,000 1,194,000 466,000 129,000 595,000
Source: C. Eugene Steuerle and Caleb Quakenbush, Urban Institute. Based on earlier work with Stephanie Rennane and Adam Carasso.
Notes: 2015 dollars, adjusted to present value at age 65 using a 2 percent real interest rate. Adjusts for mortality after age 65. Assumes benefits scheduled in law will be paid. Worker
works every year starting at age 22 and retires at age 65. An average earner has earnings equal to the Social Security Administration's national average wage index each year.

S O C I A L S E C U R I T Y A N D M E D I C A R E L I F E T I M E B E N E F I T S A N D T A X E S 9
TABLE 7
Expected Present Value of Lifetime Social Security and Medicare Benefits and Taxes
Single female with high earnings ($76,500 in 2015 dollars)
Year cohort turns age 65
First year Social Security benefit
Lifetime Benefits Lifetime Taxes
Social Security Medicare
(net of premiums) Total Social Security Medicare Total
1960 11,000 174,000 25,000 199,000 25,000 0 25,000 1965 11,600 196,000 41,000 237,000 39,000 0 39,000 1970 14,100 237,000 57,000 294,000 59,000 2,000 61,000 1975 17,700 279,000 73,000 352,000 87,000 6,000 93,000 1980 20,300 335,000 90,000 425,000 124,000 13,000 137,000 1985 19,200 305,000 108,000 413,000 158,000 22,000 180,000 1990 19,200 316,000 128,000 444,000 200,000 33,000 233,000 1995 20,700 339,000 148,000 487,000 248,000 46,000 294,000 2000 21,300 359,000 167,000 526,000 297,000 61,000 358,000 2005 23,900 413,000 189,000 602,000 347,000 78,000 425,000 2010 25,000 424,000 206,000 630,000 394,000 97,000 491,000 2015 24,800 427,000 227,000 654,000 431,000 112,000 543,000 2020 24,700 438,000 257,000 695,000 459,000 123,000 582,000 2025 26,000 466,000 293,000 759,000 492,000 134,000 626,000 2030 27,800 503,000 331,000 834,000 524,000 143,000 667,000 2035 29,500 539,000 373,000 912,000 550,000 151,000 701,000 2040 31,300 577,000 417,000 994,000 583,000 161,000 744,000 2045 33,100 616,000 463,000 1,079,000 615,000 170,000 785,000 2050 35,100 659,000 512,000 1,171,000 651,000 182,000 833,000 2055 37,300 705,000 566,000 1,271,000 695,000 196,000 891,000 2060 39,500 752,000 625,000 1,377,000 746,000 213,000 959,000
Source: C. Eugene Steuerle and Caleb Quakenbush, Urban Institute. Based on earlier work with Stephanie Rennane and Adam Carasso.
Notes: 2015 dollars, adjusted to present value at age 65 using a 2 percent real interest rate. Adjusts for mortality after age 65. Assumes benefits scheduled in law will be paid. Worker
works every year starting at age 22 and retires at age 65. An average earner has earnings equal to the Social Security Administration's national average wage index each year. A high earner
earns 160 percent of the average wage.

1 0 S O C I A L S E C U R I T Y A N D M E D I C A R E L I F E T I M E B E N E F I T S A N D T A X E S
TABLE 8
Expected Present Value of Lifetime Social Security and Medicare Benefits and Taxes
Single female with maximum taxable earnings ($119,100 in 2015 dollars)
Year cohort turns age 65
First year Social Security benefit
Lifetime Benefits Lifetime Taxes
Social Security Medicare
(net of premiums) Total Social Security Medicare Total
1960 11,000 174,000 25,000 199,000 28,000 0 28,000
1965 11,600 196,000 41,000 237,000 42,000 0 42,000
1970 14,100 237,000 57,000 294,000 63,000 2,000 65,000
1975 17,800 280,000 73,000 353,000 92,000 6,000 98,000
1980 20,700 341,000 90,000 431,000 131,000 14,000 145,000
1985 20,000 318,000 108,000 426,000 173,000 25,000 198,000
1990 20,500 337,000 128,000 465,000 232,000 42,000 274,000
1995 22,600 370,000 148,000 518,000 303,000 61,000 364,000
2000 23,900 402,000 167,000 569,000 375,000 82,000 457,000
2005 27,400 474,000 189,000 663,000 456,000 107,000 563,000
2010 29,500 500,000 206,000 706,000 536,000 135,000 671,000
2015 29,900 516,000 227,000 743,000 610,000 160,000 770,000
2020 30,000 533,000 257,000 790,000 679,000 183,000 862,000
2025 31,600 567,000 293,000 860,000 748,000 205,000 953,000
2030 33,900 614,000 331,000 945,000 800,000 220,000 1,020,000
2035 36,000 658,000 373,000 1,031,000 843,000 234,000 1,077,000
2040 38,100 703,000 417,000 1,120,000 893,000 251,000 1,144,000
2045 40,400 752,000 463,000 1,215,000 945,000 270,000 1,215,000
2050 42,800 804,000 512,000 1,316,000 997,000 290,000 1,287,000
2055 45,400 858,000 566,000 1,424,000 1,062,000 313,000 1,375,000
2060 48,000 914,000 625,000 1,539,000 1,138,000 341,000 1,479,000
Source: C. Eugene Steuerle and Caleb Quakenbush, Urban Institute. Based on earlier work with Stephanie Rennane and Adam Carasso.
Notes: 2015 dollars, adjusted to present value at age 65 using a 2 percent real interest rate. Adjusts for mortality after age 65. Assumes benefits scheduled in law will be paid. Worker
works every year starting at age 22 and retires at age 65. A maximum-taxable earner earns the Social Security maximum taxable wage every year ($118,500 in 2015).
S O C I A L S E C U R I T Y A N D M E D I C A R E L I F E T I M E B E N E F I T S A N D T A X E S 1 1
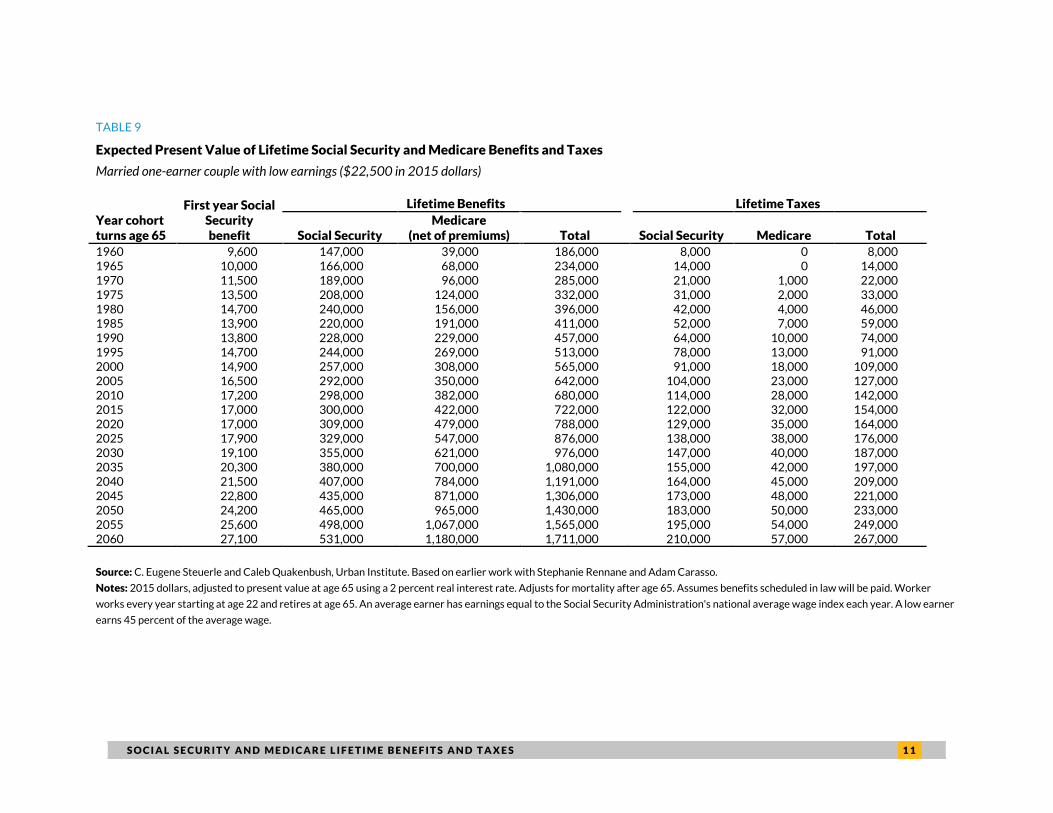
TABLE 9
Expected Present Value of Lifetime Social Security and Medicare Benefits and Taxes
Married one-earner couple with low earnings ($22,500 in 2015 dollars)
Year cohort turns age 65
First year Social Security benefit
Lifetime Benefits Lifetime Taxes
Social Security Medicare
(net of premiums) Total Social Security Medicare Total
1960 9,600 147,000 39,000 186,000 8,000 0 8,000 1965 10,000 166,000 68,000 234,000 14,000 0 14,000 1970 11,500 189,000 96,000 285,000 21,000 1,000 22,000 1975 13,500 208,000 124,000 332,000 31,000 2,000 33,000 1980 14,700 240,000 156,000 396,000 42,000 4,000 46,000 1985 13,900 220,000 191,000 411,000 52,000 7,000 59,000 1990 13,800 228,000 229,000 457,000 64,000 10,000 74,000 1995 14,700 244,000 269,000 513,000 78,000 13,000 91,000 2000 14,900 257,000 308,000 565,000 91,000 18,000 109,000 2005 16,500 292,000 350,000 642,000 104,000 23,000 127,000 2010 17,200 298,000 382,000 680,000 114,000 28,000 142,000 2015 17,000 300,000 422,000 722,000 122,000 32,000 154,000 2020 17,000 309,000 479,000 788,000 129,000 35,000 164,000 2025 17,900 329,000 547,000 876,000 138,000 38,000 176,000 2030 19,100 355,000 621,000 976,000 147,000 40,000 187,000 2035 20,300 380,000 700,000 1,080,000 155,000 42,000 197,000 2040 21,500 407,000 784,000 1,191,000 164,000 45,000 209,000 2045 22,800 435,000 871,000 1,306,000 173,000 48,000 221,000 2050 24,200 465,000 965,000 1,430,000 183,000 50,000 233,000 2055 25,600 498,000 1,067,000 1,565,000 195,000 54,000 249,000 2060 27,100 531,000 1,180,000 1,711,000 210,000 57,000 267,000
Source: C. Eugene Steuerle and Caleb Quakenbush, Urban Institute. Based on earlier work with Stephanie Rennane and Adam Carasso.
Notes: 2015 dollars, adjusted to present value at age 65 using a 2 percent real interest rate. Adjusts for mortality after age 65. Assumes benefits scheduled in law will be paid. Worker
works every year starting at age 22 and retires at age 65. An average earner has earnings equal to the Social Security Administration's national average wage index each year. A low earner
earns 45 percent of the average wage.
1 2 S O C I A L S E C U R I T Y A N D M E D I C A R E L I F E T I M E B E N E F I T S A N D T A X E S
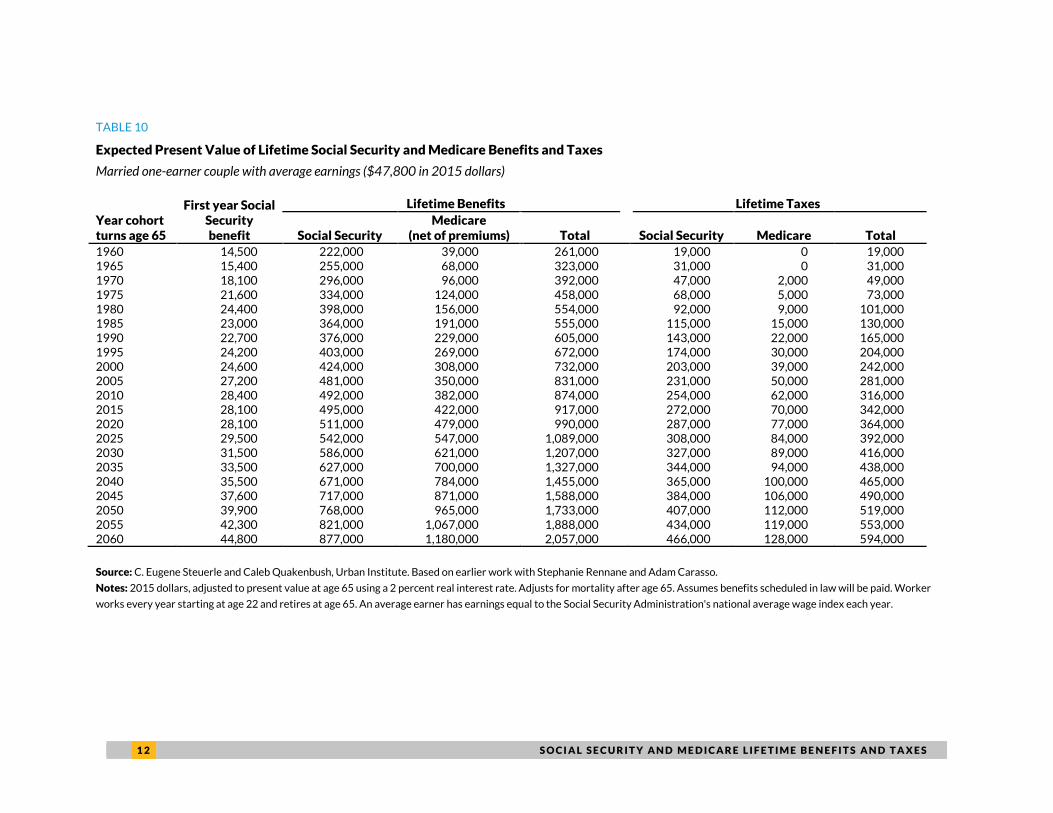
TABLE 10
Expected Present Value of Lifetime Social Security and Medicare Benefits and Taxes
Married one-earner couple with average earnings ($47,800 in 2015 dollars)
Year cohort turns age 65
First year Social Security benefit
Lifetime Benefits Lifetime Taxes
Social Security Medicare
(net of premiums) Total Social Security Medicare Total
1960 14,500 222,000 39,000 261,000 19,000 0 19,000 1965 15,400 255,000 68,000 323,000 31,000 0 31,000 1970 18,100 296,000 96,000 392,000 47,000 2,000 49,000 1975 21,600 334,000 124,000 458,000 68,000 5,000 73,000 1980 24,400 398,000 156,000 554,000 92,000 9,000 101,000 1985 23,000 364,000 191,000 555,000 115,000 15,000 130,000 1990 22,700 376,000 229,000 605,000 143,000 22,000 165,000 1995 24,200 403,000 269,000 672,000 174,000 30,000 204,000 2000 24,600 424,000 308,000 732,000 203,000 39,000 242,000 2005 27,200 481,000 350,000 831,000 231,000 50,000 281,000 2010 28,400 492,000 382,000 874,000 254,000 62,000 316,000 2015 28,100 495,000 422,000 917,000 272,000 70,000 342,000 2020 28,100 511,000 479,000 990,000 287,000 77,000 364,000 2025 29,500 542,000 547,000 1,089,000 308,000 84,000 392,000 2030 31,500 586,000 621,000 1,207,000 327,000 89,000 416,000 2035 33,500 627,000 700,000 1,327,000 344,000 94,000 438,000 2040 35,500 671,000 784,000 1,455,000 365,000 100,000 465,000 2045 37,600 717,000 871,000 1,588,000 384,000 106,000 490,000 2050 39,900 768,000 965,000 1,733,000 407,000 112,000 519,000 2055 42,300 821,000 1,067,000 1,888,000 434,000 119,000 553,000 2060 44,800 877,000 1,180,000 2,057,000 466,000 128,000 594,000
Source: C. Eugene Steuerle and Caleb Quakenbush, Urban Institute. Based on earlier work with Stephanie Rennane and Adam Carasso.
Notes: 2015 dollars, adjusted to present value at age 65 using a 2 percent real interest rate. Adjusts for mortality after age 65. Assumes benefits scheduled in law will be paid. Worker
works every year starting at age 22 and retires at age 65. An average earner has earnings equal to the Social Security Administration's national average wage index each year.

S O C I A L S E C U R I T Y A N D M E D I C A R E L I F E T I M E B E N E F I T S A N D T A X E S 1 3
TABLE 11
Expected Present Value of Lifetime Social Security and Medicare Benefits and Taxes
Married one-earner couple with high earnings ($76,500 in 2015 dollars)
Year cohort turns age 65
First year Social Security benefit
Lifetime Benefits Lifetime Taxes
Social Security Medicare
(net of premiums) Total Social Security Medicare Total
1960 16,200 247,000 39,000 286,000 25,000 0 25,000 1965 16,900 279,000 68,000 347,000 39,000 0 39,000 1970 20,400 334,000 96,000 430,000 59,000 2,000 61,000 1975 25,200 390,000 124,000 514,000 87,000 6,000 93,000 1980 30,500 498,000 156,000 654,000 124,000 13,000 137,000 1985 28,800 456,000 191,000 647,000 158,000 22,000 180,000 1990 28,800 476,000 229,000 705,000 200,000 33,000 233,000 1995 31,000 516,000 269,000 785,000 248,000 46,000 294,000 2000 31,900 550,000 308,000 858,000 297,000 61,000 358,000 2005 35,800 633,000 350,000 983,000 347,000 78,000 425,000 2010 37,500 651,000 382,000 1,033,000 394,000 97,000 491,000 2015 37,100 656,000 422,000 1,078,000 431,000 112,000 543,000 2020 37,100 674,000 479,000 1,153,000 459,000 123,000 582,000 2025 39,000 717,000 547,000 1,264,000 492,000 134,000 626,000 2030 41,700 775,000 621,000 1,396,000 524,000 143,000 667,000 2035 44,200 829,000 700,000 1,529,000 550,000 151,000 701,000 2040 46,900 888,000 784,000 1,672,000 583,000 161,000 744,000 2045 49,700 948,000 871,000 1,819,000 615,000 170,000 785,000 2050 52,700 1,015,000 965,000 1,980,000 651,000 180,000 831,000 2055 55,900 1,085,000 1,067,000 2,152,000 695,000 193,000 888,000 2060 59,200 1,159,000 1,180,000 2,339,000 746,000 209,000 955,000
Source: C. Eugene Steuerle and Caleb Quakenbush, Urban Institute. Based on earlier work with Stephanie Rennane and Adam Carasso.
Notes: 2015 dollars, adjusted to present value at age 65 using a 2 percent real interest rate. Adjusts for mortality after age 65. Assumes benefits scheduled in law will be paid. Worker
works every year starting at age 22 and retires at age 65. An average earner has earnings equal to the Social Security Administration's national average wage index each year. A high earner
earns 160 percent of the average wage.
1 4 S O C I A L S E C U R I T Y A N D M E D I C A R E L I F E T I M E B E N E F I T S A N D T A X E S
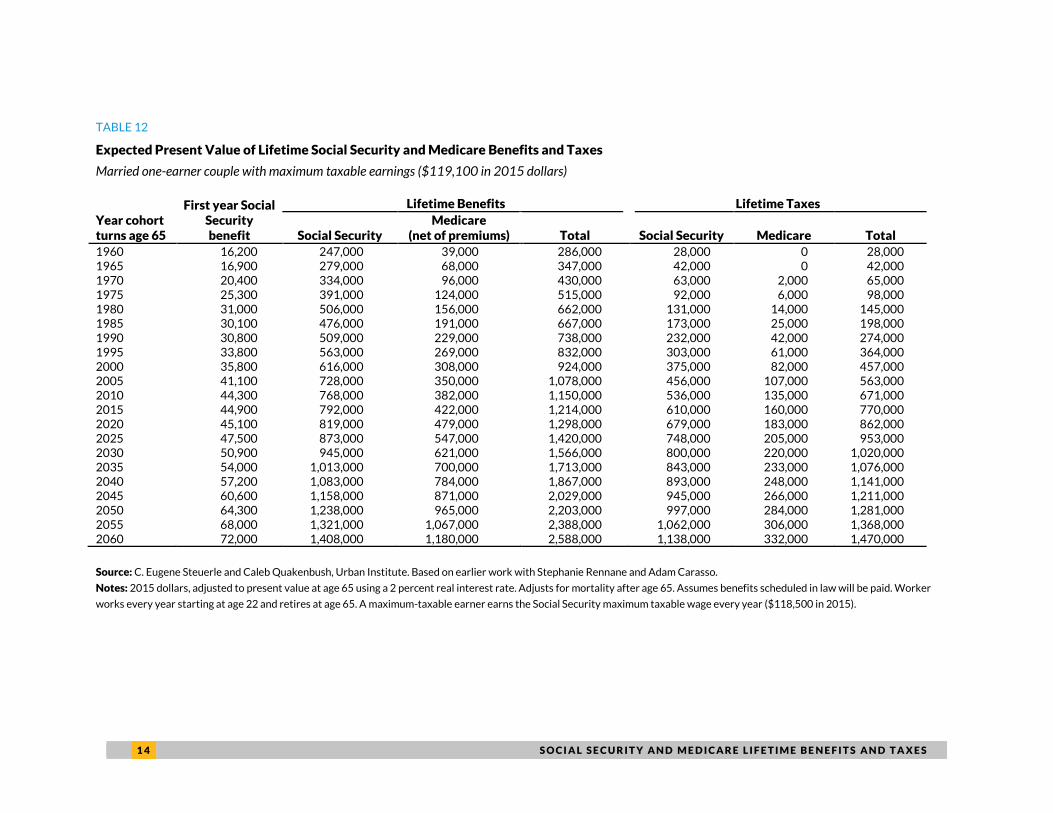
TABLE 12
Expected Present Value of Lifetime Social Security and Medicare Benefits and Taxes
Married one-earner couple with maximum taxable earnings ($119,100 in 2015 dollars)
Year cohort turns age 65
First year Social Security benefit
Lifetime Benefits Lifetime Taxes
Social Security Medicare
(net of premiums) Total Social Security Medicare Total
1960 16,200 247,000 39,000 286,000 28,000 0 28,000 1965 16,900 279,000 68,000 347,000 42,000 0 42,000 1970 20,400 334,000 96,000 430,000 63,000 2,000 65,000 1975 25,300 391,000 124,000 515,000 92,000 6,000 98,000 1980 31,000 506,000 156,000 662,000 131,000 14,000 145,000 1985 30,100 476,000 191,000 667,000 173,000 25,000 198,000 1990 30,800 509,000 229,000 738,000 232,000 42,000 274,000 1995 33,800 563,000 269,000 832,000 303,000 61,000 364,000 2000 35,800 616,000 308,000 924,000 375,000 82,000 457,000 2005 41,100 728,000 350,000 1,078,000 456,000 107,000 563,000 2010 44,300 768,000 382,000 1,150,000 536,000 135,000 671,000 2015 44,900 792,000 422,000 1,214,000 610,000 160,000 770,000 2020 45,100 819,000 479,000 1,298,000 679,000 183,000 862,000 2025 47,500 873,000 547,000 1,420,000 748,000 205,000 953,000 2030 50,900 945,000 621,000 1,566,000 800,000 220,000 1,020,000 2035 54,000 1,013,000 700,000 1,713,000 843,000 233,000 1,076,000 2040 57,200 1,083,000 784,000 1,867,000 893,000 248,000 1,141,000 2045 60,600 1,158,000 871,000 2,029,000 945,000 266,000 1,211,000 2050 64,300 1,238,000 965,000 2,203,000 997,000 284,000 1,281,000 2055 68,000 1,321,000 1,067,000 2,388,000 1,062,000 306,000 1,368,000 2060 72,000 1,408,000 1,180,000 2,588,000 1,138,000 332,000 1,470,000
Source: C. Eugene Steuerle and Caleb Quakenbush, Urban Institute. Based on earlier work with Stephanie Rennane and Adam Carasso.
Notes: 2015 dollars, adjusted to present value at age 65 using a 2 percent real interest rate. Adjusts for mortality after age 65. Assumes benefits scheduled in law will be paid. Worker
works every year starting at age 22 and retires at age 65. A maximum-taxable earner earns the Social Security maximum taxable wage every year ($118,500 in 2015).

S O C I A L S E C U R I T Y A N D M E D I C A R E L I F E T I M E B E N E F I T S A N D T A X E S 1 5
TABLE 13
Expected Present Value of Lifetime Social Security and Medicare Benefits and Taxes
Married couple with two low earners ($45,000 in 2015 dollars)
Year cohort turns age 65
First year Social Security benefit
Lifetime Benefits Lifetime Taxes
Social Security Medicare
(net of premiums) Total Social Security Medicare Total
1960 12,900 178,000 39,000 217,000 17,000 0 17,000 1965 13,500 203,000 68,000 271,000 28,000 0 28,000 1970 15,500 234,000 96,000 330,000 42,000 1,000 43,000 1975 18,200 258,000 124,000 382,000 61,000 4,000 65,000 1980 19,600 293,000 156,000 449,000 83,000 8,000 91,000 1985 18,500 270,000 191,000 461,000 104,000 13,000 117,000 1990 18,300 279,000 229,000 508,000 129,000 20,000 149,000 1995 19,600 301,000 269,000 570,000 156,000 27,000 183,000 2000 19,900 317,000 308,000 625,000 182,000 35,000 217,000 2005 22,000 361,000 350,000 711,000 208,000 45,000 253,000 2010 22,900 370,000 382,000 752,000 229,000 56,000 285,000 2015 22,700 373,000 422,000 795,000 245,000 63,000 308,000 2020 22,600 385,000 479,000 864,000 258,000 69,000 327,000 2025 23,800 410,000 547,000 957,000 277,000 75,000 352,000 2030 25,500 443,000 621,000 1,064,000 295,000 80,000 375,000 2035 27,000 475,000 700,000 1,175,000 309,000 85,000 394,000 2040 28,700 509,000 784,000 1,293,000 328,000 90,000 418,000 2045 30,400 544,000 871,000 1,415,000 346,000 95,000 441,000 2050 32,200 583,000 965,000 1,548,000 366,000 101,000 467,000 2055 34,200 624,000 1,067,000 1,691,000 391,000 107,000 498,000 2060 36,200 666,000 1,180,000 1,846,000 420,000 115,000 535,000
Source: C. Eugene Steuerle and Caleb Quakenbush, Urban Institute. Based on earlier work with Stephanie Rennane and Adam Carasso.
Notes: 2015 dollars, adjusted to present value at age 65 using a 2 percent real interest rate. Adjusts for mortality after age 65. Assumes benefits scheduled in law will be paid. Workers
work every year starting at age 22 and retire at age 65. An average earner has earnings equal to the Social Security Administration's national average wage index each year. A low earner
earns 45 percent of the average wage.
1 6 S O C I A L S E C U R I T Y A N D M E D I C A R E L I F E T I M E B E N E F I T S A N D T A X E S
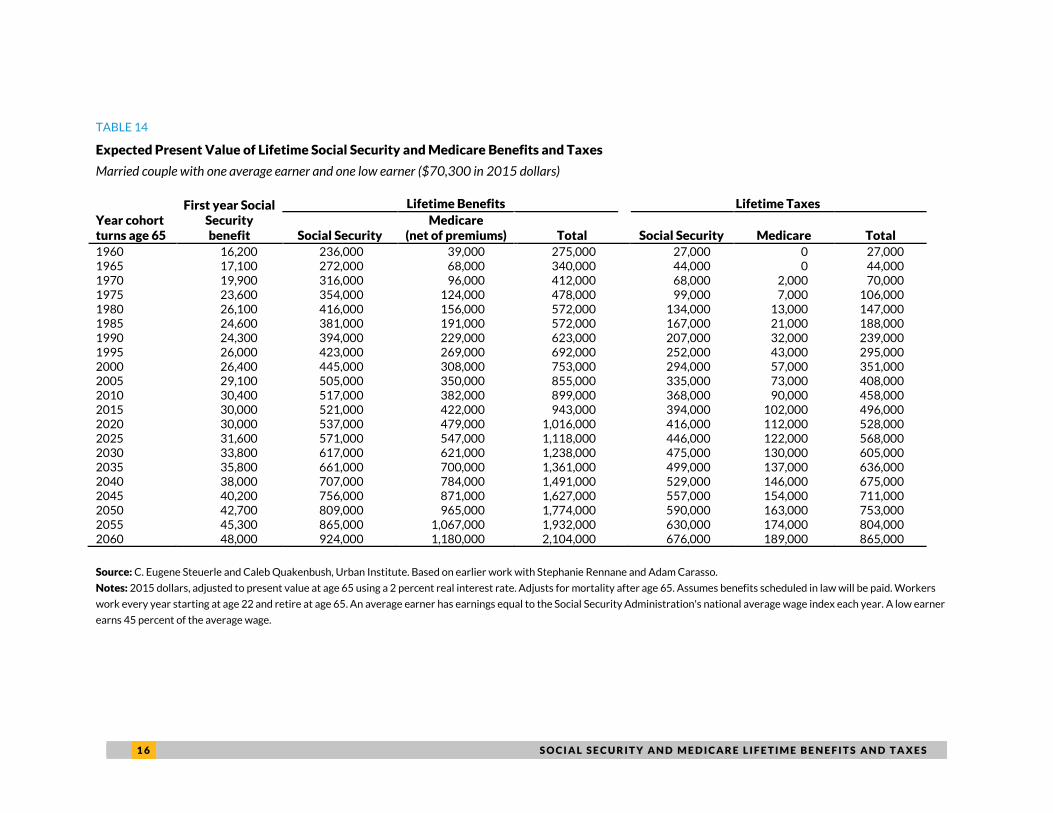
TABLE 14
Expected Present Value of Lifetime Social Security and Medicare Benefits and Taxes
Married couple with one average earner and one low earner ($70,300 in 2015 dollars)
Year cohort turns age 65
First year Social Security benefit
Lifetime Benefits Lifetime Taxes
Social Security Medicare
(net of premiums) Total Social Security Medicare Total
1960 16,200 236,000 39,000 275,000 27,000 0 27,000 1965 17,100 272,000 68,000 340,000 44,000 0 44,000 1970 19,900 316,000 96,000 412,000 68,000 2,000 70,000 1975 23,600 354,000 124,000 478,000 99,000 7,000 106,000 1980 26,100 416,000 156,000 572,000 134,000 13,000 147,000 1985 24,600 381,000 191,000 572,000 167,000 21,000 188,000 1990 24,300 394,000 229,000 623,000 207,000 32,000 239,000 1995 26,000 423,000 269,000 692,000 252,000 43,000 295,000 2000 26,400 445,000 308,000 753,000 294,000 57,000 351,000 2005 29,100 505,000 350,000 855,000 335,000 73,000 408,000 2010 30,400 517,000 382,000 899,000 368,000 90,000 458,000 2015 30,000 521,000 422,000 943,000 394,000 102,000 496,000 2020 30,000 537,000 479,000 1,016,000 416,000 112,000 528,000 2025 31,600 571,000 547,000 1,118,000 446,000 122,000 568,000 2030 33,800 617,000 621,000 1,238,000 475,000 130,000 605,000 2035 35,800 661,000 700,000 1,361,000 499,000 137,000 636,000 2040 38,000 707,000 784,000 1,491,000 529,000 146,000 675,000 2045 40,200 756,000 871,000 1,627,000 557,000 154,000 711,000 2050 42,700 809,000 965,000 1,774,000 590,000 163,000 753,000 2055 45,300 865,000 1,067,000 1,932,000 630,000 174,000 804,000 2060 48,000 924,000 1,180,000 2,104,000 676,000 189,000 865,000
Source: C. Eugene Steuerle and Caleb Quakenbush, Urban Institute. Based on earlier work with Stephanie Rennane and Adam Carasso.
Notes: 2015 dollars, adjusted to present value at age 65 using a 2 percent real interest rate. Adjusts for mortality after age 65. Assumes benefits scheduled in law will be paid. Workers
work every year starting at age 22 and retire at age 65. An average earner has earnings equal to the Social Security Administration's national average wage index each year. A low earner
earns 45 percent of the average wage.
S O C I A L S E C U R I T Y A N D M E D I C A R E L I F E T I M E B E N E F I T S A N D T A X E S 1 7
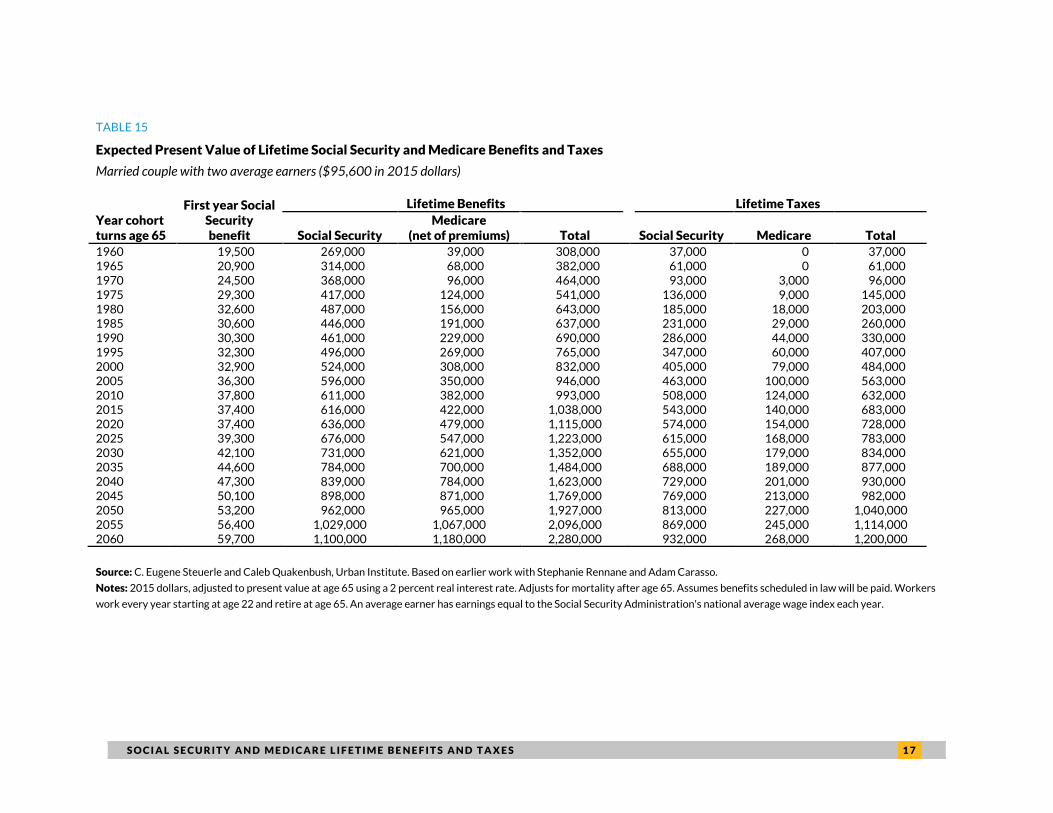
TABLE 15
Expected Present Value of Lifetime Social Security and Medicare Benefits and Taxes
Married couple with two average earners ($95,600 in 2015 dollars)
Year cohort turns age 65
First year Social Security benefit
Lifetime Benefits Lifetime Taxes
Social Security Medicare
(net of premiums) Total Social Security Medicare Total
1960 19,500 269,000 39,000 308,000 37,000 0 37,000 1965 20,900 314,000 68,000 382,000 61,000 0 61,000 1970 24,500 368,000 96,000 464,000 93,000 3,000 96,000 1975 29,300 417,000 124,000 541,000 136,000 9,000 145,000 1980 32,600 487,000 156,000 643,000 185,000 18,000 203,000 1985 30,600 446,000 191,000 637,000 231,000 29,000 260,000 1990 30,300 461,000 229,000 690,000 286,000 44,000 330,000 1995 32,300 496,000 269,000 765,000 347,000 60,000 407,000 2000 32,900 524,000 308,000 832,000 405,000 79,000 484,000 2005 36,300 596,000 350,000 946,000 463,000 100,000 563,000 2010 37,800 611,000 382,000 993,000 508,000 124,000 632,000 2015 37,400 616,000 422,000 1,038,000 543,000 140,000 683,000 2020 37,400 636,000 479,000 1,115,000 574,000 154,000 728,000 2025 39,300 676,000 547,000 1,223,000 615,000 168,000 783,000 2030 42,100 731,000 621,000 1,352,000 655,000 179,000 834,000 2035 44,600 784,000 700,000 1,484,000 688,000 189,000 877,000 2040 47,300 839,000 784,000 1,623,000 729,000 201,000 930,000 2045 50,100 898,000 871,000 1,769,000 769,000 213,000 982,000 2050 53,200 962,000 965,000 1,927,000 813,000 227,000 1,040,000 2055 56,400 1,029,000 1,067,000 2,096,000 869,000 245,000 1,114,000 2060 59,700 1,100,000 1,180,000 2,280,000 932,000 268,000 1,200,000
Source: C. Eugene Steuerle and Caleb Quakenbush, Urban Institute. Based on earlier work with Stephanie Rennane and Adam Carasso.
Notes: 2015 dollars, adjusted to present value at age 65 using a 2 percent real interest rate. Adjusts for mortality after age 65. Assumes benefits scheduled in law will be paid. Workers
work every year starting at age 22 and retire at age 65. An average earner has earnings equal to the Social Security Administration's national average wage index each year.

1 8 S O C I A L S E C U R I T Y A N D M E D I C A R E L I F E T I M E B E N E F I T S A N D T A X E S
TABLE 16
Expected Present Value of Lifetime Social Security and Medicare Benefits and Taxes
Married couple with one high earner and one average earner ($124,300 in 2015 dollars)
Year cohort turns age 65
First year Social Security benefit
Lifetime Benefits Lifetime Taxes
Social Security Medicare
(net of premiums) Total Social Security Medicare Total
1960 20,600 288,000 39,000 327,000 43,000 0 43,000 1965 21,800 329,000 68,000 397,000 69,000 0 69,000 1970 26,000 394,000 96,000 490,000 106,000 4,000 110,000 1975 31,700 457,000 124,000 581,000 156,000 11,000 167,000 1980 36,600 564,000 156,000 720,000 217,000 22,000 239,000 1985 34,500 517,000 191,000 708,000 274,000 36,000 310,000 1990 34,300 539,000 229,000 768,000 343,000 55,000 398,000 1995 36,800 583,000 269,000 852,000 422,000 76,000 498,000 2000 37,700 620,000 308,000 928,000 499,000 100,000 599,000 2005 42,000 711,000 350,000 1,061,000 578,000 129,000 707,000 2010 43,900 731,000 382,000 1,113,000 648,000 159,000 807,000 2015 43,500 738,000 422,000 1,160,000 702,000 182,000 884,000 2020 43,400 759,000 479,000 1,238,000 747,000 200,000 947,000 2025 45,700 807,000 547,000 1,354,000 800,000 218,000 1,018,000 2030 48,800 873,000 621,000 1,494,000 851,000 233,000 1,084,000 2035 51,800 935,000 700,000 1,635,000 894,000 246,000 1,140,000 2040 54,900 1,002,000 784,000 1,786,000 948,000 263,000 1,211,000 2045 58,200 1,071,000 871,000 1,942,000 1,000,000 281,000 1,281,000 2050 61,700 1,147,000 965,000 2,112,000 1,057,000 303,000 1,360,000 2055 65,500 1,227,000 1,067,000 2,294,000 1,129,000 331,000 1,460,000 2060 69,300 1,310,000 1,180,000 2,490,000 1,212,000 364,000 1,576,000
Source: C. Eugene Steuerle and Caleb Quakenbush, Urban Institute. Based on earlier work with Stephanie Rennane and Adam Carasso.
Notes: 2015 dollars, adjusted to present value at age 65 using a 2 percent real interest rate. Adjusts for mortality after age 65. Assumes benefits scheduled in law will be paid. Workers
work every year starting at age 22 and retire at age 65. An average earner has earnings equal to the Social Security Administration's national average wage index each year. A high earner
earns 160 percent of the average wage.
S O C I A L S E C U R I T Y A N D M E D I C A R E L I F E T I M E B E N E F I T S A N D T A X E S 1 9
References
Board of Trustees, Federal Old-Age and Survivors Insurance and Federal Disability Insurance Trust Funds. 2014. “The 2014 Annual Report of the Board of Trustees of the Federal Old-Age and Survivors Insurance and Federal Disability Insurance Trust Funds.” Washington, DC: US Government Printing Office.
Boards of Trustees of the Federal Hospital Insurance and Federal Supplementary Medical Insurance Trust Funds. 2014. “2014 Annual Report of the Boards of Trustees of the Federal Hospital Insurance and Federal Supplementary Medical Insurance Trust Funds.” Washington, DC: US Government Printing Office.
Center for Medicare and Medicaid Services, Office of the Actuary. 2014. “Projected Medicare Expenditures under Current Law, the Projected Baseline, and an Illustrative Alternative Scenario.” Baltimore, MD: Center for Medicare and Medicaid Services.
About the Authors
C. Eugene Steuerle is an Institute fellow and the Richard B. Fisher chair at the Urban
Institute. Among past positions, he served as deputy assistant secretary of the US
Department of the Treasury for Tax Analysis (1987–89), president of the National Tax
Association (2001–02), codirector of the Urban-Brookings Tax Policy Center, and chair
of the 1999 Technical Panel advising Social Security on its methods and assumptions.
Between 1984 and 1986 he served as economic coordinator and original organizer of
the Treasury’s tax reform effort, which led to the Tax Reform Act of 1986. His latest
book, Dead Men Ruling, won the 2014 TIAA-CREF Paul A. Samuelson Award. .
Caleb Quakenbush is a research associate at the Urban Institute, where he works with
the Opportunity and Ownership Initiative, the Program on Retirement Policy, and the
Urban-Brookings Tax Policy Center. His areas of research include the interaction of
federal tax and transfer programs, Social Security, state and local pensions, low income
finance, mobility, and federal budget issues.
Acknowledgments
This brief was funded by the Urban Institute. The views expressed are those of the authors and should
not be attributed to the Urban Institute, its trustees, or its funders.

2 0 S O C I A L S E C U R I T Y A N D M E D I C A R E L I F E T I M E B E N E F I T S A N D T A X E S
ABOUT THE URBAN INST ITU TE The nonprofit Urban Institute is dedicated to elevating the debate on social and
economic policy. For nearly five decades, Urban scholars have conducted research
and offered evidence-based solutions that improve lives and strengthen
communities across a rapidly urbanizing world. Their objective research helps
expand opportunities for all, reduce hardship among the most vulnerable, and
strengthen the effectiveness of the public sector.
Copyright © September 2015. Urban Institute. Permission is granted for
reproduction of this file, with attribution to the Urban Institute.
2100 M Street NW
Washington, DC 20037
www.urban.org