social security actuarial status - ssa.gov
TRANSCRIPT
Social Security Actuarial StatusThe 2017 Annual Report of the Board of Trustees of the OASI and
DI Trust Funds
Key Results under Intermediate Assumptions
Presented by Stephen C. Goss, Chief Actuary, SSAAGA Meeting DCOctober 24, 2017

What Is the Legislative Mandate for the Annual Report?
1) Trust Fund operations of the past year and the next five years
2) Actuarial status of the trust funds– This means the ability to meet the cost of scheduled
benefits with scheduled revenue and trust fund reserves
– And the extent to which scheduled revenue will fall short, forcing cuts or delays in benefits in the absence of legislative change
2

Also—Full Scope Audit of the 75-year projections
1) Statement of Social Insurance in the Agency Financial Statement, and in the Federal GovtConsolidated Financial Statement
2) Mandated by the FASAB– This year KPMG, actuaries, economists AND
accountants!!– We are anticipating a clean opinion---again!!
3
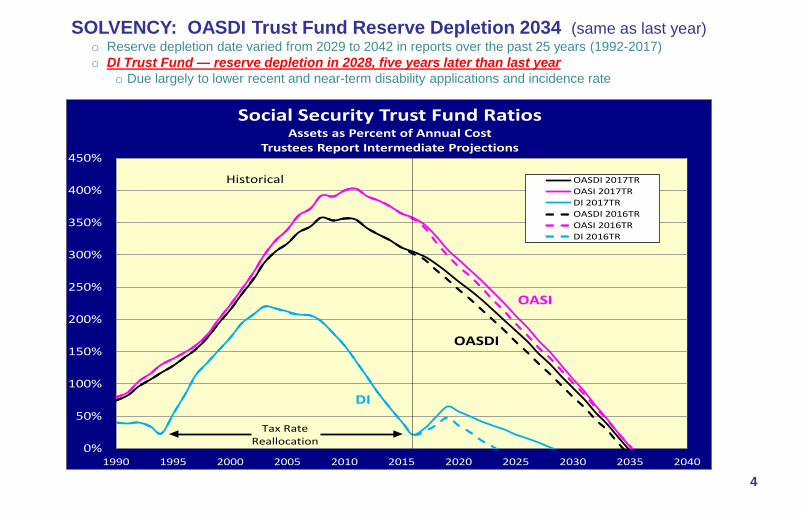
SOLVENCY: OASDI Trust Fund Reserve Depletion 2034 (same as last year)o Reserve depletion date varied from 2029 to 2042 in reports over the past 25 years (1992-2017) o DI Trust Fund — reserve depletion in 2028, five years later than last year
o Due largely to lower recent and near-term disability applications and incidence rate
4
0%
50%
100%
150%
200%
250%
300%
350%
400%
450%
1990 1995 2000 2005 2010 2015 2020 2025 2030 2035 2040
Social Security Trust Fund RatiosAssets as Percent of Annual Cost
Trustees Report Intermediate Projections
OASDI 2017TROASI 2017TRDI 2017TROASDI 2016TROASI 2016TRDI 2016TR
Historical
Tax RateReallocation
DI
OASDI
OASI

Applications for Disability Benefits Continue to FallAt the peak of the last economic cycle in 2007, applications were low, but increased
rapidly in the recession to over 2 million in 2010. In 2016, with the economy still below the sustainable full-employment level, applications have dropped below the 2007 level
51.5
1.6
1.7
1.8
1.9
2.0
2.1
2003 2005 2007 2009 2011 2013 2015 2017 2019 2021 2023 2025
(milli
ons)
Total Social Security Disability Receipts by Calendar Year:Historical and Intermediate Assumptions for 2012 through 2017 Trustees Reports
2012TR
2017TR
2016TR
2015TR
2014TR2013TR
6
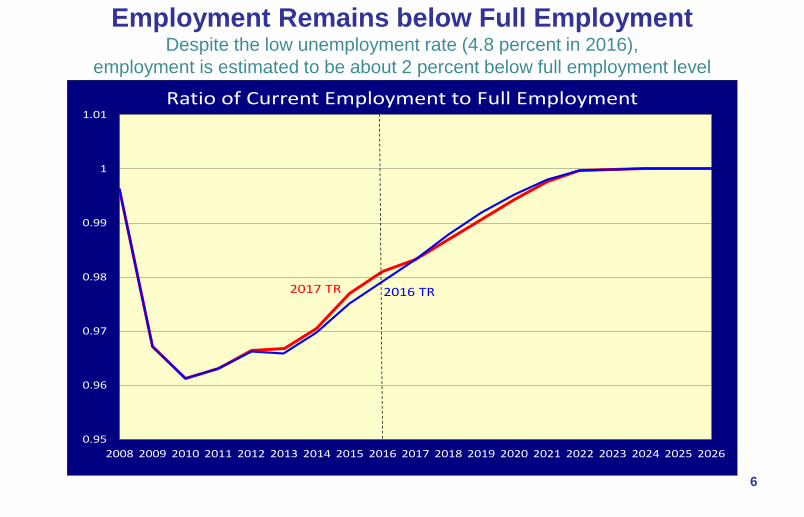
Employment Remains below Full EmploymentDespite the low unemployment rate (4.8 percent in 2016),
employment is estimated to be about 2 percent below full employment level
0.95
0.96
0.97
0.98
0.99
1
1.01
2008 2009 2010 2011 2012 2013 2014 2015 2016 2017 2018 2019 2020 2021 2022 2023 2024 2025 2026
Ratio of Current Employment to Full Employment
2016 TR2017 TR
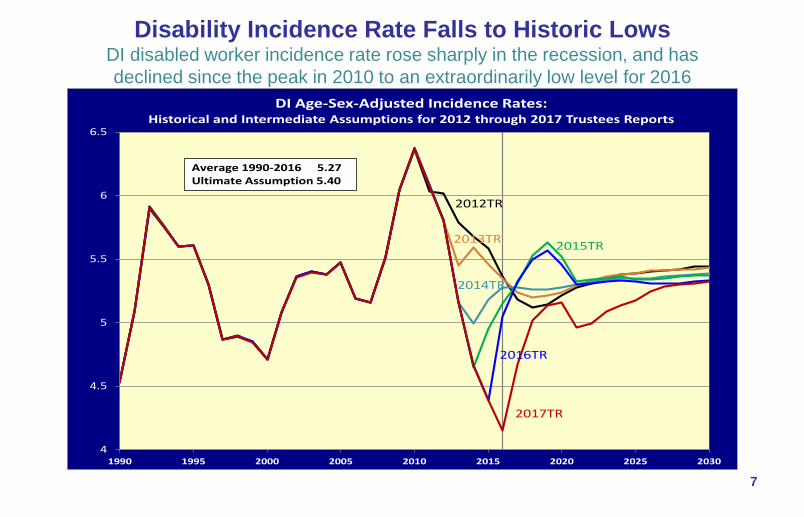
Disability Incidence Rate Falls to Historic LowsDI disabled worker incidence rate rose sharply in the recession, and has declined since the peak in 2010 to an extraordinarily low level for 2016
7
4
4.5
5
5.5
6
6.5
1990 1995 2000 2005 2010 2015 2020 2025 2030
DI Age-Sex-Adjusted Incidence Rates:Historical and Intermediate Assumptions for 2012 through 2017 Trustees Reports
2012TR
2017TR
2016TR
2015TR
2014TR
2013TR
Average 1990-2016 5.27Ultimate Assumption 5.40
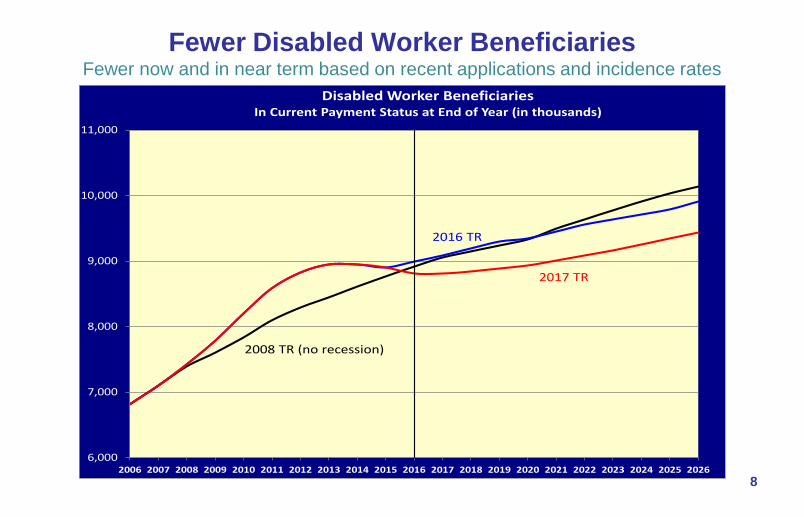
Fewer Disabled Worker Beneficiaries Fewer now and in near term based on recent applications and incidence rates
8
6,000
7,000
8,000
9,000
10,000
11,000
2006 2007 2008 2009 2010 2011 2012 2013 2014 2015 2016 2017 2018 2019 2020 2021 2022 2023 2024 2025 2026
Disabled Worker BeneficiariesIn Current Payment Status at End of Year (in thousands)
2008 TR (no recession)
2017 TR
2016 TR

9
DI Annual Cost and Non-Interest Income as Percent of Taxable Payroll 93% of scheduled benefits still payable at trust fund reserve depletion
Annual deficit in 2091: 0.38 percent of payroll — 0.01 percent smaller than last year
0%
1%
2%
3%
4%
5%
2005 2015 2025 2035 2045 2055 2065 2075 2085 2095
Calendar year
Cost: Scheduled and payable benefits
Non-interestIncome
Payable benefits as percentof scheduled benefits:2016-27: 100%2028: 93%2091: 82%
Cost: Scheduled but not fully payable benefits
Expenditures: Payable benefits = income after trust fund depletion in 2028
10
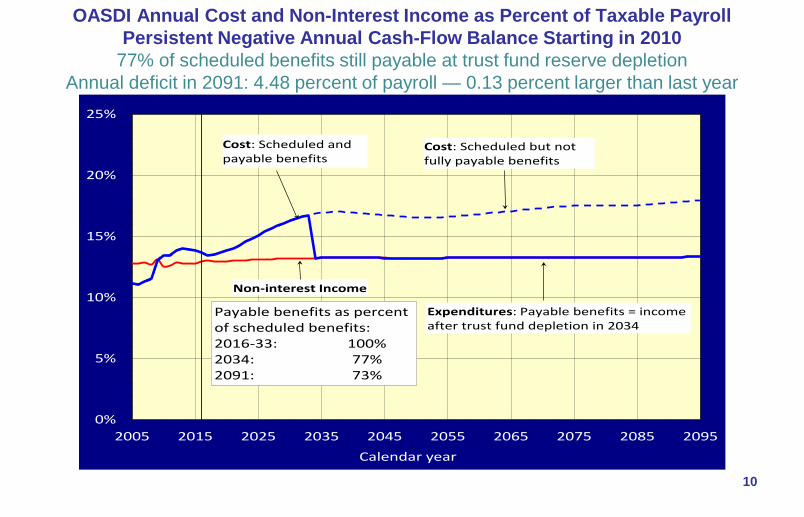
OASDI Annual Cost and Non-Interest Income as Percent of Taxable Payroll Persistent Negative Annual Cash-Flow Balance Starting in 2010
77% of scheduled benefits still payable at trust fund reserve depletionAnnual deficit in 2091: 4.48 percent of payroll — 0.13 percent larger than last year
0%
5%
10%
15%
20%
25%
2005 2015 2025 2035 2045 2055 2065 2075 2085 2095Calendar year
Cost: Scheduled and payable benefits
Non-interest Income
Payable benefits as percentof scheduled benefits:2016-33: 100%2034: 77%2091: 73%
Cost: Scheduled but not fully payable benefits
Expenditures: Payable benefits = income after trust fund depletion in 2034

11
SUSTAINABILITY: OASDI Cost as Percent of GDP Rises from a 4.2-percent average in 1990-2008, to about 6.1% by 2037, then
declines to under 5.9% by 2050, and generally increases to 6.1% by 2091
0%
2%
4%
6%
8%
10%
1990 2000 2010 2020 2030 2040 2050 2060 2070 2080 2090Calendar year
Non-interest Income
Historical Estimated
Cost
12
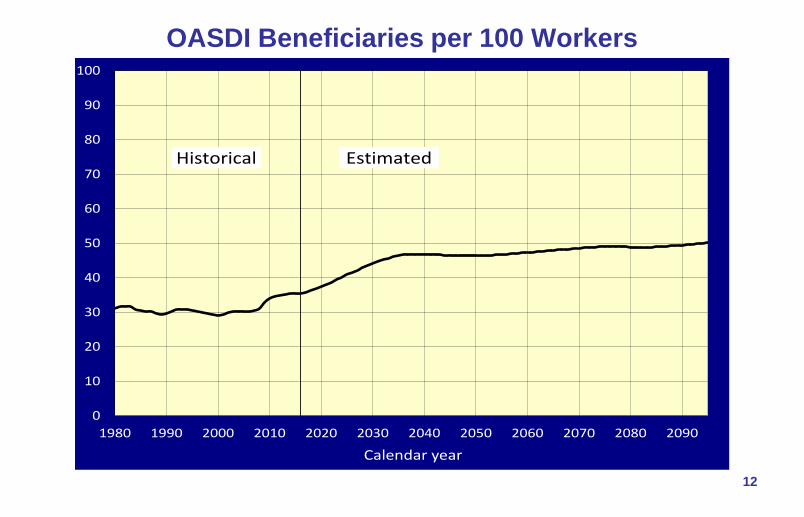
OASDI Beneficiaries per 100 Workers
0
10
20
30
40
50
60
70
80
90
100
1980 1990 2000 2010 2020 2030 2040 2050 2060 2070 2080 2090
Calendar year
Historical Estimated

Aging (change in age distribution)mainly due to drop in birth rates
13
0.00
0.05
0.10
0.15
0.20
0.25
0.30
0.35
0.40
0.45
0.50
1940 1950 1960 1970 1980 1990 2000 2010 2020 2030 2040 2050 2060 2070 2080 2090 2100
Aged Dependency Ratio 2017 TRPopulation 65+/(20-64)
Actual and TR Intermediate
TFR remains at 3.0 after 1964
TFR remains at 3.3 after 1964
14

Changing Adult Age Distribution: Boomers increase of prime disability age (45-64) is over ----- Next is increasing share at retirement age (65+) as boomers replaced at working ages
15
0%
10%
20%
30%
40%
50%
60%
70%
80%
90%
100%
1940 1950 1960 1970 1980 1990 2000 2010 2020 2030 2040 2050 2060 2070 2080 2090 2100
Perce
nt of
Popu
lation
at A
ges 2
5+
Age Distribution of the Population Age 25+, 1940 to 2100 (2017TR)
25-44
45-64
65-84
85+
Boomers become 25-44
Boomers become 45-64
Boomers become 65-84
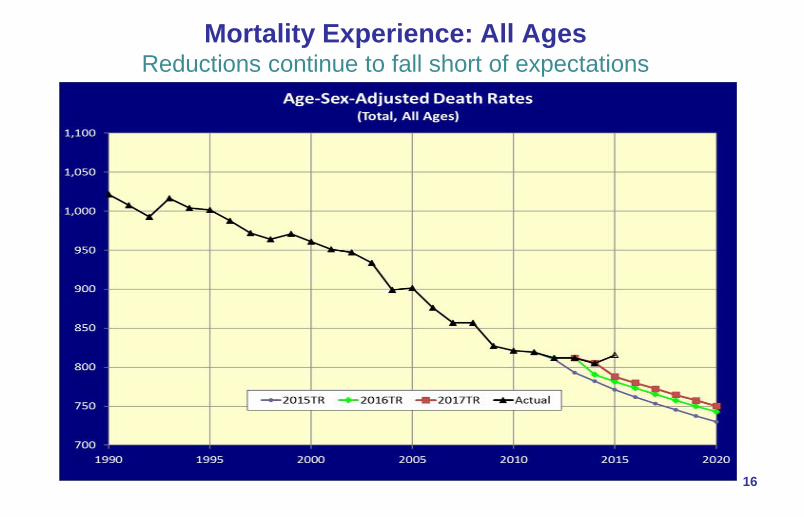
Mortality Experience: All AgesReductions continue to fall short of expectations
16
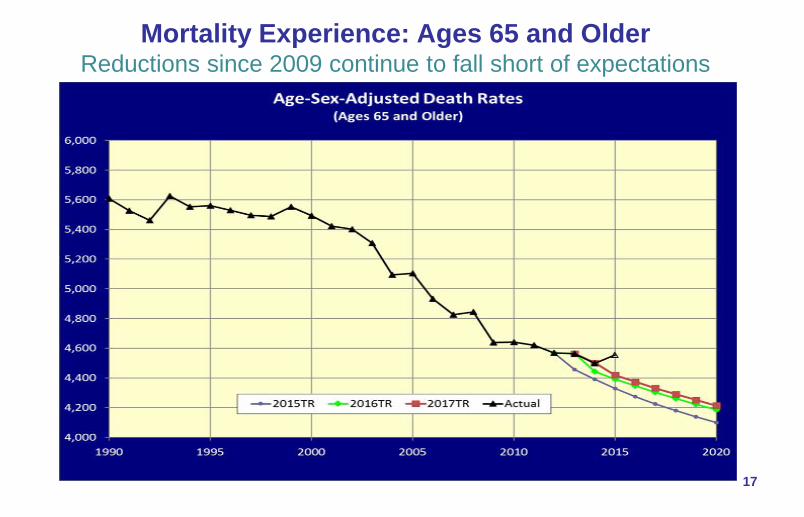
Mortality Experience: Ages 65 and OlderReductions since 2009 continue to fall short of expectations
17

Mortality Experience: Ages under 65 Actual Increase since 2010
18
19
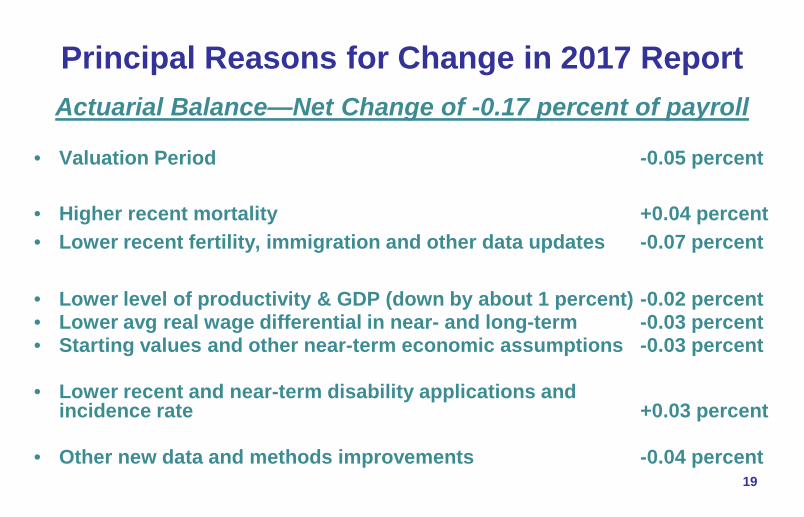
Actuarial Balance—Net Change of -0.17 percent of payroll
• Valuation Period -0.05 percent
• Higher recent mortality +0.04 percent• Lower recent fertility, immigration and other data updates -0.07 percent
• Lower level of productivity & GDP (down by about 1 percent) -0.02 percent• Lower avg real wage differential in near- and long-term -0.03 percent• Starting values and other near-term economic assumptions -0.03 percent
• Lower recent and near-term disability applications and incidence rate +0.03 percent
• Other new data and methods improvements -0.04 percent
Principal Reasons for Change in 2017 Report
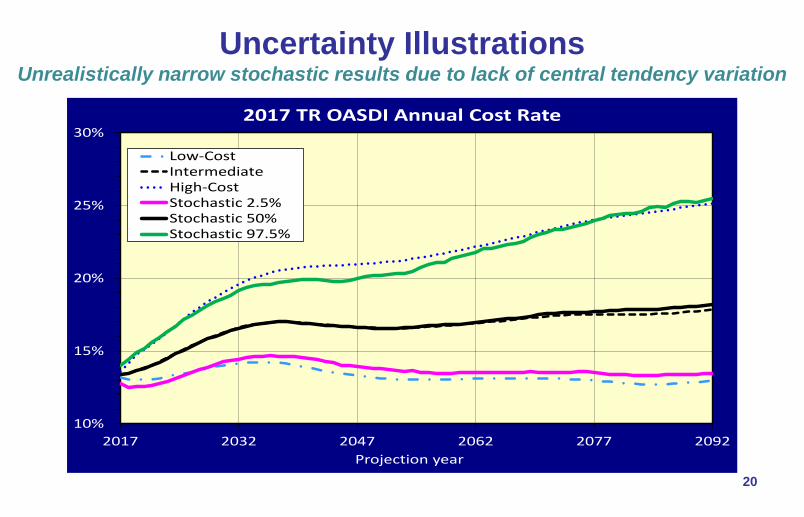
Uncertainty IllustrationsUnrealistically narrow stochastic results due to lack of central tendency variation
20
10%
15%
20%
25%
30%
2017 2032 2047 2062 2077 2092Projection year
2017 TR OASDI Annual Cost Rate
Low-CostIntermediateHigh-CostStochastic 2.5%Stochastic 50%Stochastic 97.5%

Replacement Rates Based on the 2017TR
Source: Annual Recurring Actuarial Note #9 at www.ssa.gov/oact/NOTES/ran9/index.html21
0
10
20
30
40
50
60
70
1940 1960 1980 2000 2020 2040 2060 2080
Scheduled Monthly Benefit Levels as Percent of Career-Average Earnings
by Year of Retirement at age 65
Low Earner ($23,091 for 2017; 25th percentile)
Medium Earner ($51,314 for 2017; 57th percentile)
High Earner ($82,103 for 2017; 82nd percentile)
Max Earner ($127,200 for 2017; 100th percentile)

How About at Age 62, Where Most Start Benefits?
Source: Annual Recurring Actuarial Note #9 at www.ssa.gov/oact/NOTES/ran9/index.html22
0
10
20
30
40
50
60
70
1960 1980 2000 2020 2040 2060 2080
Scheduled Monthly Benefit Levels as Percent of Career-Average Earnings
by Year of Retirement at age 62
Low Earner ($23,091 in 2017; 25th percentile)
Medium Earner ($51,314 in 2017; 57th percentile)
High Earner ($82,103 in 2017; 82nd percentile)
Max Earner ($127,200 in 2017; 100th percentile)

Payable Benefits Under the Law, After Trust Fund Reserves Are Depleted, Are Even Lower
Source: Annual Recurring Actuarial Note #9 at www.ssa.gov/oact/NOTES/ran9/index.html23
0
10
20
30
40
50
60
70
1960 1980 2000 2020 2040 2060 2080
PAYABLE Monthly Benefit Levels as Percent of Career-Average Earnings by Year
of Retirement at age 62
Low Earner ($23,091 in 2017; 25th percentile)
Medium Earner ($51,314 in 2017; 57th percentile)
High Earner ($82,103 in 2017; 82nd percentile)
Max Earner ($127,200 in 2017; 100th percentile)

24
But, Wait—How About Budget Scoring?Don’t entitlements just keep borrowing?
Source: Congressional Budget Office, June 2016
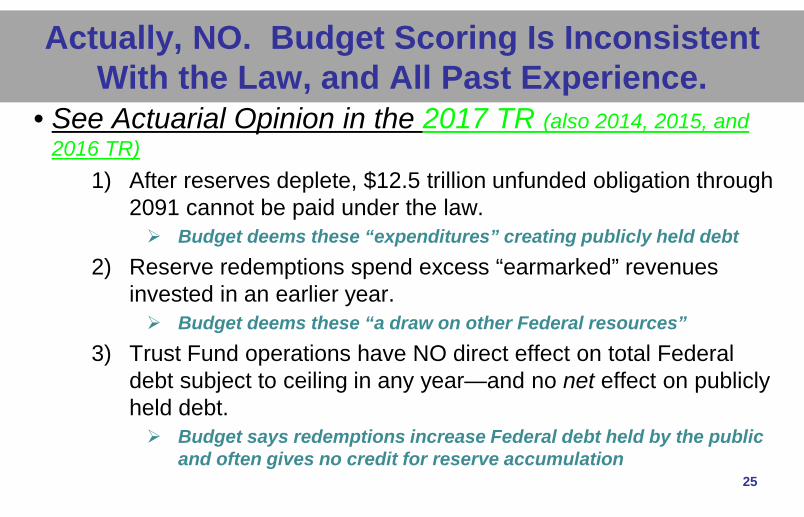
Actually, NO. Budget Scoring Is Inconsistent With the Law, and All Past Experience.
• See Actuarial Opinion in the 2017 TR (also 2014, 2015, and 2016 TR)
1) After reserves deplete, $12.5 trillion unfunded obligation through 2091 cannot be paid under the law. Budget deems these “expenditures” creating publicly held debt
2) Reserve redemptions spend excess “earmarked” revenues invested in an earlier year. Budget deems these “a draw on other Federal resources”
3) Trust Fund operations have NO direct effect on total Federal debt subject to ceiling in any year—and no net effect on publicly held debt. Budget says redemptions increase Federal debt held by the public
and often gives no credit for reserve accumulation25
26
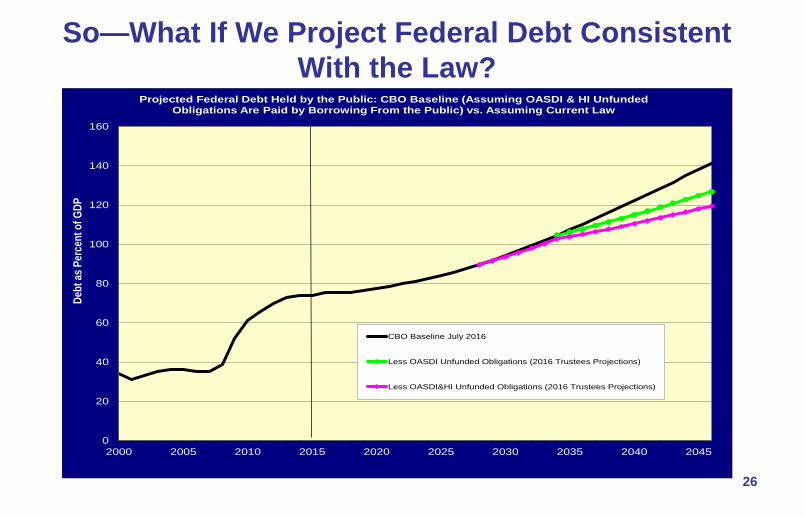
So—What If We Project Federal Debt Consistent With the Law?
0
20
40
60
80
100
120
140
160
2000 2005 2010 2015 2020 2025 2030 2035 2040 2045
Debt
as P
erce
nt of
GDP
Projected Federal Debt Held by the Public: CBO Baseline (Assuming OASDI & HI Unfunded Obligations Are Paid by Borrowing From the Public) vs. Assuming Current Law
CBO Baseline July 2016
Less OASDI Unfunded Obligations (2016 Trustees Projections)
Less OASDI&HI Unfunded Obligations (2016 Trustees Projections)

27
So—What If We Project Federal Debt Consistent With the Law? Projection to 2090 back in 2015
0
20
40
60
80
100
120
140
160
180
200
2000 2010 2020 2030 2040 2050 2060 2070 2080 2090
Publi
cly H
eld D
ebt a
s a Pe
rcent
age o
f GDP
Projected Federal Debt Held by the Public: CBO Baseline (Assuming OASDI & HI Unfunded Obligations Are Paid by Borrowing From the Public) vs.
Assuming Current Law
CBO Baseline July 2015
Less OASDI Unfunded Obligations (CBO Dec 2015)
Less OASDI (CBO Dec 2015) and HI (Trustees 2015)Unfunded Obligations
28
The Bottom Line• Long-term projections provide information to assess
solvency and changes needed to eliminate shortfalls• If trust fund reserves were to deplete:
– Full benefits cannot be paid timely– NO pressure on the Budget or Federal Debt– So Congress must and WILL act, as always
• Straightforward solutions:– Add revenue and/or lower cost for OASDI
• Comprehensive changes implemented by 2034
How to Fix Social Security Long-TermMake choices addressing OASDI deficits 2034-2091:
• Raise scheduled revenue after 2033 by about 33%: increase revenue from 4.6 to 6.1% of GDP
• Reduce scheduled benefits after 2033 by about 25%: lower benefits from 6.1 to 4.6% of GDP
• Or some combination of the two• Invest trust funds for higher return?
– Limited help—it is a PAYGO world– So invest in coming generations of workers
29
Ways to Lower Cost• Lower benefits for retirees—not disabled?
– Increase normal retirement age (lowers OASDI cost, but increases DI cost)
– Can exempt long-career low earners
• Lower benefits mainly for high earners?– Reduce PIA above some level– Often combined with increasing PIA below some level, subject to
work year requirements
• Lower benefits mainly for the oldest old?– Reduce the COLA– Some say increase it with the CPI-E (based on purchases of
consumers over age 6230

Ways to Increase Revenue• Raise tax on highest earners?
– Increase taxable maximum amount– Some tax on all earnings above the maximum
• Tax employer group health insurance premiums?– Affects only middle class if taxable maximum remains
• Maintain larger trust fund reserves?– Added interest can lower needed taxes
31

For More Information Go Tohttp://www.ssa.gov/oact/
• There you will find:– This and all prior OASDI Trustees Reports– Detailed single-year tables for recent reports– Our estimates for comprehensive proposals– Our estimates for the individual provisions– Actuarial notes; including replacement rates– Actuarial studies; including stochastic– Extensive databases– Congressional testimonies
32