social report 2004 - key processes of structural transformation and mobility in hungarian society...
TRANSCRIPT
8/3/2019 Social Report 2004 - Key Processes of Structural Transformation and Mobility in Hungarian Society Since the Fall of Communism
http://slidepdf.com/reader/full/social-report-2004-key-processes-of-structural-transformation-and-mobility 1/32
TÁRKI Social Report Reprint Series No 2.Tamás Kolosi and Key Processes of Structural
Péter Róbert Transformation and Mobility
in Hungarian Society since
the Fall of Communism
Abstract
The paper investigates labor market participation patterns and its consequences for acquired status. The analysis builds on detailed information on labor market partici- pation between 1988 and 2003 as well as on status characteristics in 2003 with re-spect to housing, wealth and consumption. The latter part of information served as basis for a complex status index, the dependent variable of the research. The retro-spective questions were used to develop a labor market career typology, the mainindependent variable. Regression analysis is applied to detect how labor market participation (and other demographic and status variables) affect the acquired status.The paper shows that both demographic and sociological factors influenced thesuccess or failure of respondents during transformation. The conclusion underlinesthe importance of separating different effects in status attainment research, like theage when one ‘meets’ historical changes and opportunities, or the difference in labor
market interruptions caused by demographic or sociological reasons.
Keywords: social mobility, labor market, status attainment, life course analysisJEL Classification: J21. J62
Authors:TAMÁS K OLOSI is a social scientist; founder and President of TÁRKI; Pro-
fessor at the Sociology Institute, Faculty of Social Sciences, EötvösLoránd University, Budapest. Research interests: social stratification,regime change, methodology.
PÉTER R ÓBERT is a sociologist, Senior Researcher at TÁRKI; Reader at theSociology Institute, Faculty of Social Science, Eötvös Loránd Univer-sity, Budapest; Hungarian representative of the International Social
Survey Programme (ISSP) and the European Social Survey (ESS). Ma- jor research interests include social inequalities, social mobility, educa-tional and occupational life paths, attitudes and preferences relating tosocial inequalities.
TÁRKIBudapest, 2005
8/3/2019 Social Report 2004 - Key Processes of Structural Transformation and Mobility in Hungarian Society Since the Fall of Communism
http://slidepdf.com/reader/full/social-report-2004-key-processes-of-structural-transformation-and-mobility 2/32
Reprint from Tamás Kolosi, György Vukovich, István György
Tóth eds.: Social Report 2004, Budapest: TÁRKI, 2004pp. 47–71.
Please use the book reference for citation.
English translation:Katalin Román
Published by:TÁRKI Social Research Centre Inc.
P.O. Box 71, H-1518 Budapest, HungaryTel: +361 309-7676, http://www.tarki.hu
Coordinator: Ildikó NagyLanguage Editor: Clive Liddiard-Maár
All rights reserved, including the right of reproduction in whole or in part in any form.
© TÁRKI, Tamás Kolosi and Péter Róbert, 2004
The Social Report 2004 was published with the support of the Hungarian Ministry of Health
andthe Hungarian Ministry of Youth, Family, Social Affairs and Equal
Opportunities.

8/3/2019 Social Report 2004 - Key Processes of Structural Transformation and Mobility in Hungarian Society Since the Fall of Communism
http://slidepdf.com/reader/full/social-report-2004-key-processes-of-structural-transformation-and-mobility 3/32
Key Processes of Structural Transformation and Mobility… 47
Introduction
The aim of this paper is to examine the change in social inequalities andindividual mobility over the 15 years since the fall of communism, from1988 to 2003. The analysis consists of two parts. The first section is a timeseries comparison based on data from Hungarian Household Panel Surveys(henceforth: HHPS) and Household Monitor Surveys of the TÁRKI Social
Research Centre (henceforth: TÁRKI Monitor Survey). HHPS, one of thesets of data used here, is essentially a longitudinal database, but in thisanalysis we will not draw on this feature of our data. 1 For the purpose of this
paper, HHPS data will be treated as cross-section data and the time seriesderived will be supplemented with data from TÁRKI Monitor Surveys gen-erated in genuine cross-section assessments. The first part of the study willfocus on three main issues: (1) changes in economic activity-inactivity over the period examined; (2) the shaping of the strata of workers; and (3) keytrends in income disparities. At the end of the first section, two combinedindicators of the stratification of Hungarian society will be introduced: astatus index based on the respondents’ per capita family income, housingconditions, financial situation and consumption, and a combined class pat-tern based primarily on the respondents’ occupation, but also drawing ontheir status index described above.
In the second part of the study, retrospective life-course data from the2003 TÁRKI Monitor Survey will be used to typify the mobility processesof the period between 1988 and 2002. This part will also contain an analysisof the social status acquired by the respondents as a result of various typicallife histories. In the analysis, four life history types will be mentioned. Theoldest generation consists of respondents who were no longer active in thelabour market in 1988. From the perspective of the transition they are a ‘lostgeneration’. One segment of the next generation is the so-called ‘exit genera-tion’, whose members left, or were forced out of, the labour market between
1988 and 2002 due to demographic (reaching the retirement age) or eco-nomic reasons (lost their jobs, became unemployed or dependent in the longterm, chose early retirement). The other segment of the mid-generation is the‘active generation’, whose members remained present in the labour marketeffectively throughout the period between 1988 and 2002 by either maintain-
1 Longitudinal analyses of the HHPS database were conducted in other research projects (seeKolosi and Sági 1998; Bukodi and Róbert 2002).
8/3/2019 Social Report 2004 - Key Processes of Structural Transformation and Mobility in Hungarian Society Since the Fall of Communism
http://slidepdf.com/reader/full/social-report-2004-key-processes-of-structural-transformation-and-mobility 4/32
Tamás Kolosi and Péter Róbert 48
ing their gainful employment or by becoming unemployed or dependent inthe short term. The last group, the ‘entry generation’ consists of the youngestrespondents who, as students, were still dependent in 1988. Members of thisgeneration ‘grew up’ and finished their studies between 1988 and 2002, anda large proportion of them found work after 1988. In the life history analysiswe will seek to identify the social class status reached by these generationsand the various subgroups via different mobility paths by 2003.
Structural transformation and key features of stratificationin Hungarian society, 1992–2003
Changes in economic activity
Our data show clearly that one of the key features of the post-1988 transforma-tional crisis is the low level of economic activity (see Table 1). According todata from the first wave of HHPS, less than half (46.5 per cent) of the popu-lation aged over 16, including occasional workers and those who remainedactive after retirement, were present in the labour market in 1992 in one formor another. Although impossible to compare precisely with other sources,our data suggest that the rate of employment began to fall as early as in the1980s and that its decrease accelerated after 1990.2 A similar analysis of datafrom 1992 to 2003, however, shows a trend that forms a very flat U-curve. In
the 1990s, the employment rate dropped slightly lower. According to HHPSdata from 1996—also covering occasional workers and those who remainedactive after retirement—43 per cent of the population were active in the la-
bour market at the time. The respective figure in 2000 was 42.4 per cent.3 After 2000, the employment rate began to show signs of moderate growth.The latest data from 2003 indicate that the employment rate was practicallythe same as in the initial year, 1992 (46.2 per cent).
2 E.g. certain time series in the publications of the Hungarian Central Statistics Office(HCSO) offer data concerning the ‘working age population’ (men aged 15–59, women aged15–54). In these cases, economic activity rates were as follows: 79.5 per cent in 1980, 75.2
per cent in 1990, 56.8 per cent in 1996. (HCSO 1997: 17) Figures in Table 1 are obviouslylower as they refer to the population aged 16 and over, without an upper limit.3 The data from 1996 belong to the longitudinal HHPS research, therefore the problem of sample attrition applies (adjusted with the appropriate weighting). The year 2000 data, how-ever, come from the cross-section assessment of the respective TÁRKI Monitor Survey. Havingdifferent data sources therefore has no effect on the trend.
8/3/2019 Social Report 2004 - Key Processes of Structural Transformation and Mobility in Hungarian Society Since the Fall of Communism
http://slidepdf.com/reader/full/social-report-2004-key-processes-of-structural-transformation-and-mobility 5/32
Key Processes of Structural Transformation and Mobility… 49
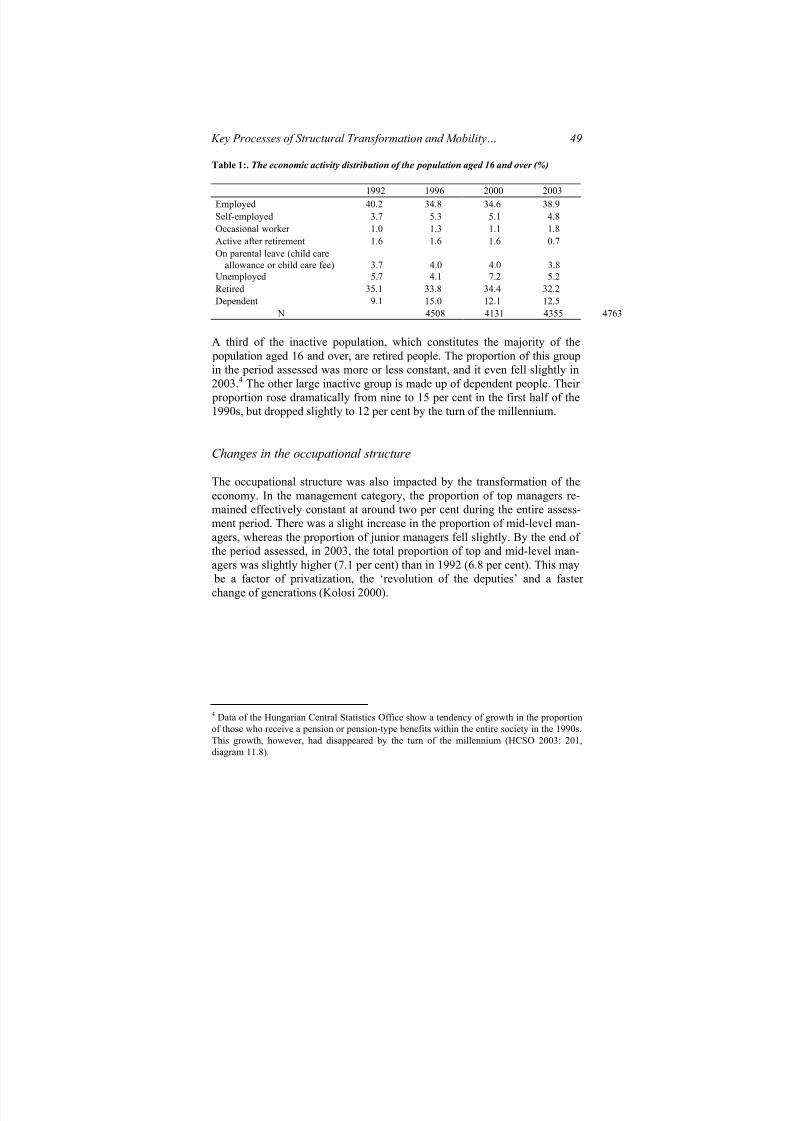
Table 1:. The economic activity distribution of the population aged 16 and over (%)
1992 1996 2000 2003Employed 40.2 34.8 34.6 38.9Self-employed 3.7 5.3 5.1 4.8Occasional worker 1.0 1.3 1.1 1.8Active after retirement 1.6 1.6 1.6 0.7On parental leave (child care
allowance or child care fee) 3.7 4.0 4.0 3.8Unemployed 5.7 4.1 7.2 5.2Retired 35.1 33.8 34.4 32.2Dependent 9.1 15.0 12.1 12.5
N 4508 4131 4355 4763
A third of the inactive population, which constitutes the majority of the population aged 16 and over, are retired people. The proportion of this groupin the period assessed was more or less constant, and it even fell slightly in2003.4 The other large inactive group is made up of dependent people. Their
proportion rose dramatically from nine to 15 per cent in the first half of the1990s, but dropped slightly to 12 per cent by the turn of the millennium.
Changes in the occupational structure
The occupational structure was also impacted by the transformation of theeconomy. In the management category, the proportion of top managers re-mained effectively constant at around two per cent during the entire assess-ment period. There was a slight increase in the proportion of mid-level man-agers, whereas the proportion of junior managers fell slightly. By the end of the period assessed, in 2003, the total proportion of top and mid-level man-agers was slightly higher (7.1 per cent) than in 1992 (6.8 per cent). This may
be a factor of privatization, the ‘revolution of the deputies’ and a faster change of generations (Kolosi 2000).
4 Data of the Hungarian Central Statistics Office show a tendency of growth in the proportionof those who receive a pension or pension-type benefits within the entire society in the 1990s.This growth, however, had disappeared by the turn of the millennium (HCSO 2003: 201,diagram 11.8).
8/3/2019 Social Report 2004 - Key Processes of Structural Transformation and Mobility in Hungarian Society Since the Fall of Communism
http://slidepdf.com/reader/full/social-report-2004-key-processes-of-structural-transformation-and-mobility 6/32
Tamás Kolosi and Péter Róbert 50
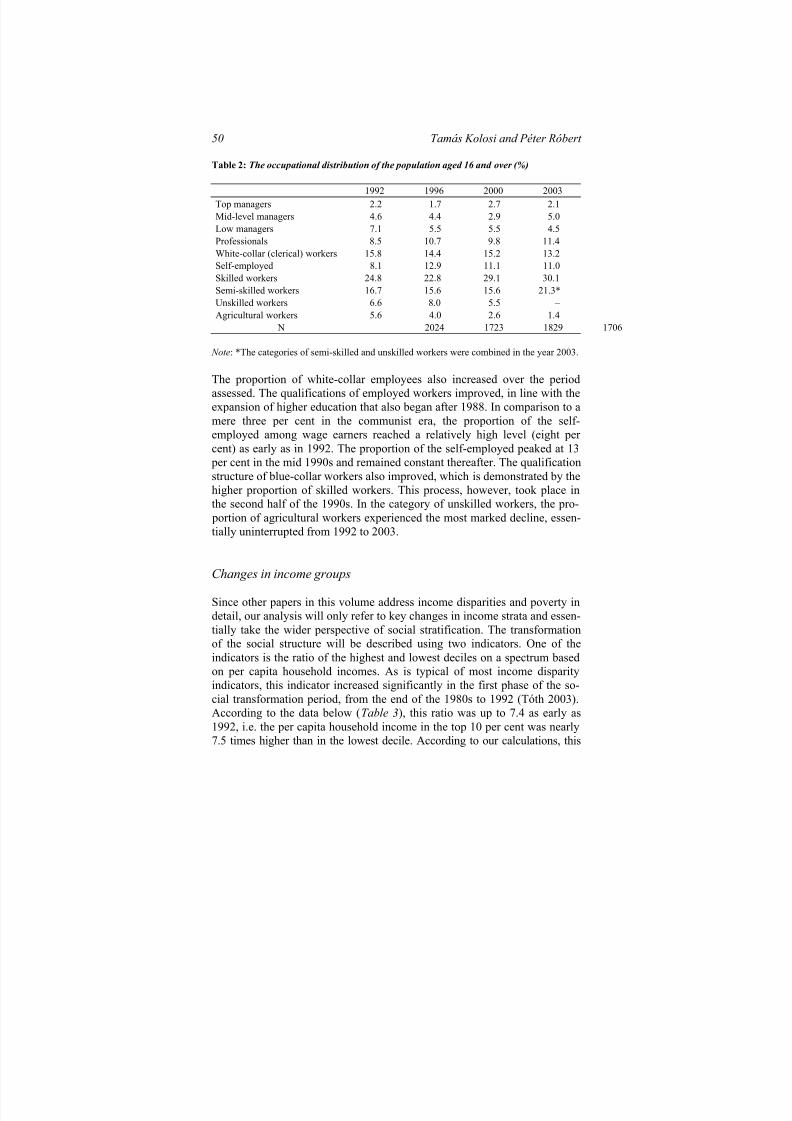
Table 2: The occupational distribution of the population aged 16 and over (%)
1992 1996 2000 2003Top managers 2.2 1.7 2.7 2.1Mid-level managers 4.6 4.4 2.9 5.0Low managers 7.1 5.5 5.5 4.5Professionals 8.5 10.7 9.8 11.4White-collar (clerical) workers 15.8 14.4 15.2 13.2Self-employed 8.1 12.9 11.1 11.0Skilled workers 24.8 22.8 29.1 30.1Semi-skilled workers 16.7 15.6 15.6 21.3*Unskilled workers 6.6 8.0 5.5 – Agricultural workers 5.6 4.0 2.6 1.4
N 2024 1723 1829 1706
Note: *The categories of semi-skilled and unskilled workers were combined in the year 2003.
The proportion of white-collar employees also increased over the periodassessed. The qualifications of employed workers improved, in line with theexpansion of higher education that also began after 1988. In comparison to amere three per cent in the communist era, the proportion of the self-employed among wage earners reached a relatively high level (eight per cent) as early as in 1992. The proportion of the self-employed peaked at 13
per cent in the mid 1990s and remained constant thereafter. The qualificationstructure of blue-collar workers also improved, which is demonstrated by thehigher proportion of skilled workers. This process, however, took place inthe second half of the 1990s. In the category of unskilled workers, the pro-
portion of agricultural workers experienced the most marked decline, essen-tially uninterrupted from 1992 to 2003.
Changes in income groups
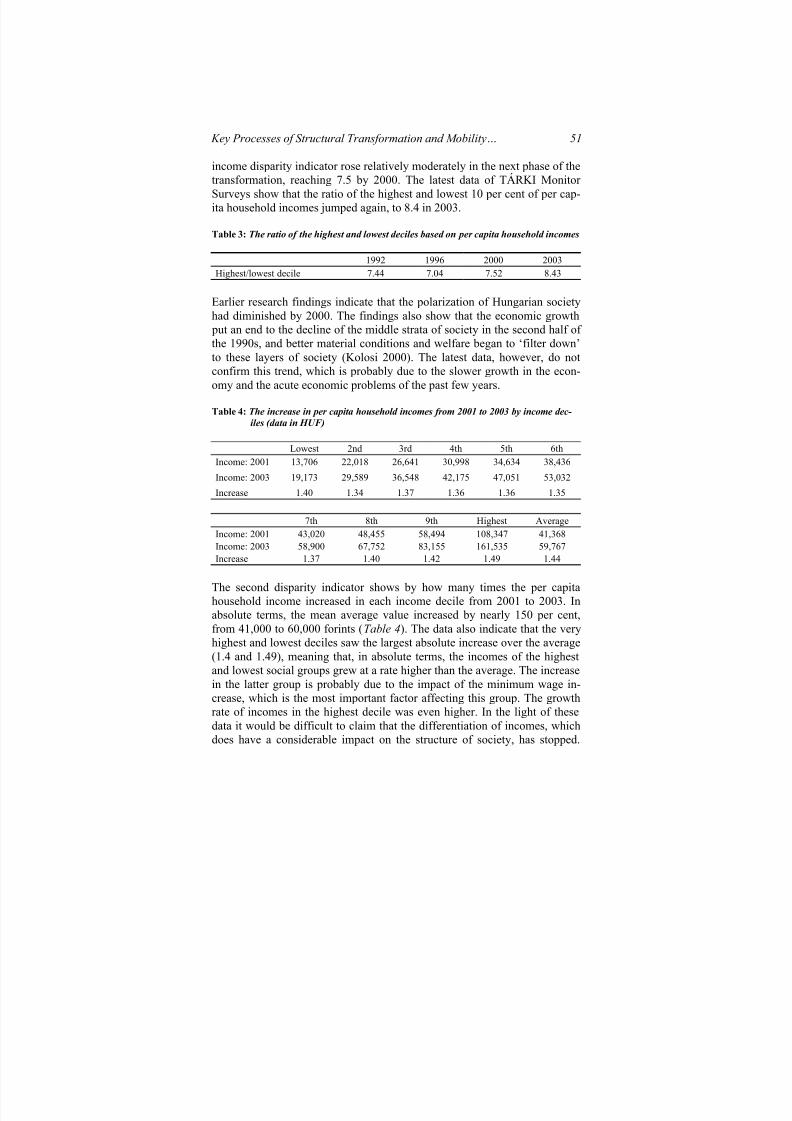
Since other papers in this volume address income disparities and poverty indetail, our analysis will only refer to key changes in income strata and essen-tially take the wider perspective of social stratification. The transformation
of the social structure will be described using two indicators. One of theindicators is the ratio of the highest and lowest deciles on a spectrum basedon per capita household incomes. As is typical of most income disparityindicators, this indicator increased significantly in the first phase of the so-cial transformation period, from the end of the 1980s to 1992 (Tóth 2003).According to the data below (Table 3), this ratio was up to 7.4 as early as1992, i.e. the per capita household income in the top 10 per cent was nearly7.5 times higher than in the lowest decile. According to our calculations, this
8/3/2019 Social Report 2004 - Key Processes of Structural Transformation and Mobility in Hungarian Society Since the Fall of Communism
http://slidepdf.com/reader/full/social-report-2004-key-processes-of-structural-transformation-and-mobility 7/32
Key Processes of Structural Transformation and Mobility… 51
income disparity indicator rose relatively moderately in the next phase of thetransformation, reaching 7.5 by 2000. The latest data of TÁRKI Monitor Surveys show that the ratio of the highest and lowest 10 per cent of per cap-ita household incomes jumped again, to 8.4 in 2003.
Table 3: The ratio of the highest and lowest deciles based on per capita household incomes
1992 1996 2000 2003Highest/lowest decile 7.44 7.04 7.52 8.43
Earlier research findings indicate that the polarization of Hungarian societyhad diminished by 2000. The findings also show that the economic growth
put an end to the decline of the middle strata of society in the second half of the 1990s, and better material conditions and welfare began to ‘filter down’to these layers of society (Kolosi 2000). The latest data, however, do notconfirm this trend, which is probably due to the slower growth in the econ-omy and the acute economic problems of the past few years.
Table 4: The increase in per capita household incomes from 2001 to 2003 by income dec-
iles (data in HUF)
Lowest 2nd 3rd 4th 5th 6thIncome: 2001 13,706 22,018 26,641 30,998 34,634 38,436
Income: 2003 19,173 29,589 36,548 42,175 47,051 53,032
Increase 1.40 1.34 1.37 1.36 1.36 1.35
7th 8th 9th Highest AverageIncome: 2001 43,020 48,455 58,494 108,347 41,368Income: 2003 58,900 67,752 83,155 161,535 59,767Increase 1.37 1.40 1.42 1.49 1.44
The second disparity indicator shows by how many times the per capitahousehold income increased in each income decile from 2001 to 2003. Inabsolute terms, the mean average value increased by nearly 150 per cent,from 41,000 to 60,000 forints (Table 4). The data also indicate that the very
highest and lowest deciles saw the largest absolute increase over the average(1.4 and 1.49), meaning that, in absolute terms, the incomes of the highestand lowest social groups grew at a rate higher than the average. The increasein the latter group is probably due to the impact of the minimum wage in-crease, which is the most important factor affecting this group. The growthrate of incomes in the highest decile was even higher. In the light of thesedata it would be difficult to claim that the differentiation of incomes, whichdoes have a considerable impact on the structure of society, has stopped.

8/3/2019 Social Report 2004 - Key Processes of Structural Transformation and Mobility in Hungarian Society Since the Fall of Communism
http://slidepdf.com/reader/full/social-report-2004-key-processes-of-structural-transformation-and-mobility 8/32
Tamás Kolosi and Péter Róbert 52
Moreover, the absolute growth of incomes in the middle of the social spec-trum was below the average from 2001 to 2003. This also indicates that the
positive trend in the middle segments of society in the second half of the1990s has been derailed in the past few years: the ‘downward spread’ of
prosperity in society has—hopefully only temporarily—come to a halt.
The vertical differentiation of Hungarian society in 2003
Generating status indices that allow for the vertical differentiation of societyhas been a long-standing tradition in social stratification research both in
Hungary and abroad. In this analysis, we will not engage in the debate onstratification that sets vertical and horizontal differentiation against eachother, and that focuses on the consistency and inconsistency of socialstatuses. Instead, the focus of our analysis will be on hierarchical inequali-ties.5
As in several of our earlier research projects in which we analysed datafrom HHPS and TÁRKI Monitor Surveys, this social status analysis willagain be measured against several vertical dimensions.6 Based on the dataavailable from the 2003 TÁRKI Monitor Survey, the first factor of verticalsocial differentiation is the per capita household income examined above.Housing conditions constitute the second factor, generated from the follow-ing four basic categories of data: population density; household infrastruc-
ture (toilets, form of hot water provision, provision of cables: ISDN, ADSL);housing deficiencies (musty, damp, dark, noisy, poor state of repair—basedon the opinion of the respondents); and finally the standards of the interior (based on the opinion of the interviewer). The third index reflects the re-spondents’ financial situation and (material) circumstances and also drawson four basic information categories including savings (savings accounts,shares and securities, cash savings); properties (second house, land); avail-ability of the usual consumer durables (colour TV, automatic washing ma-chine, microwave oven, VCR, DVD, home theatre, hi-fi equipment, dish-washer, video camera, digital camera), cars and assets such as PCs or accessto the Internet. Holiday practices were also considered in the third index. Wedifferentiated between those who never went on holiday and those who had
5 Vertical stratification models which lay great emphasis on inconsistencies also rely onvertical dimensions and analyse typical combinations of hierarchical positions in the contextof various social inequalities, as seen at Lenski (1954) and in the first such analysis in Hun-gary, the Stratification Model Survey (Kolosi 1987).6 E.g. Fábián, Róbert and Szivós (1998) looked at dimensions such as income status, volumeof savings, availability of consumer durables; in Fábián, Kolosi and Róbert (2000) statusindex analyses were based on dimensions such as housing conditions, material consumptionand cultural consumption.
8/3/2019 Social Report 2004 - Key Processes of Structural Transformation and Mobility in Hungarian Society Since the Fall of Communism
http://slidepdf.com/reader/full/social-report-2004-key-processes-of-structural-transformation-and-mobility 9/32
Key Processes of Structural Transformation and Mobility… 53
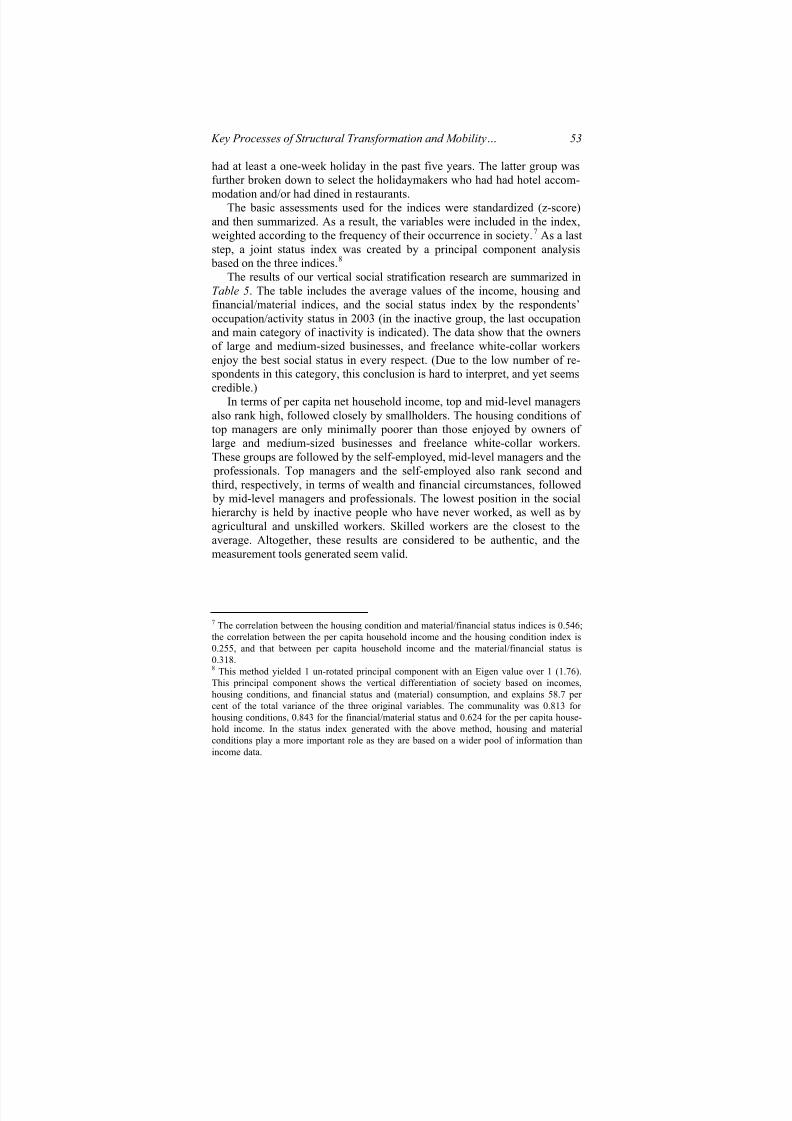
had at least a one-week holiday in the past five years. The latter group wasfurther broken down to select the holidaymakers who had had hotel accom-modation and/or had dined in restaurants.
The basic assessments used for the indices were standardized (z-score)and then summarized. As a result, the variables were included in the index,weighted according to the frequency of their occurrence in society.7 As a laststep, a joint status index was created by a principal component analysis
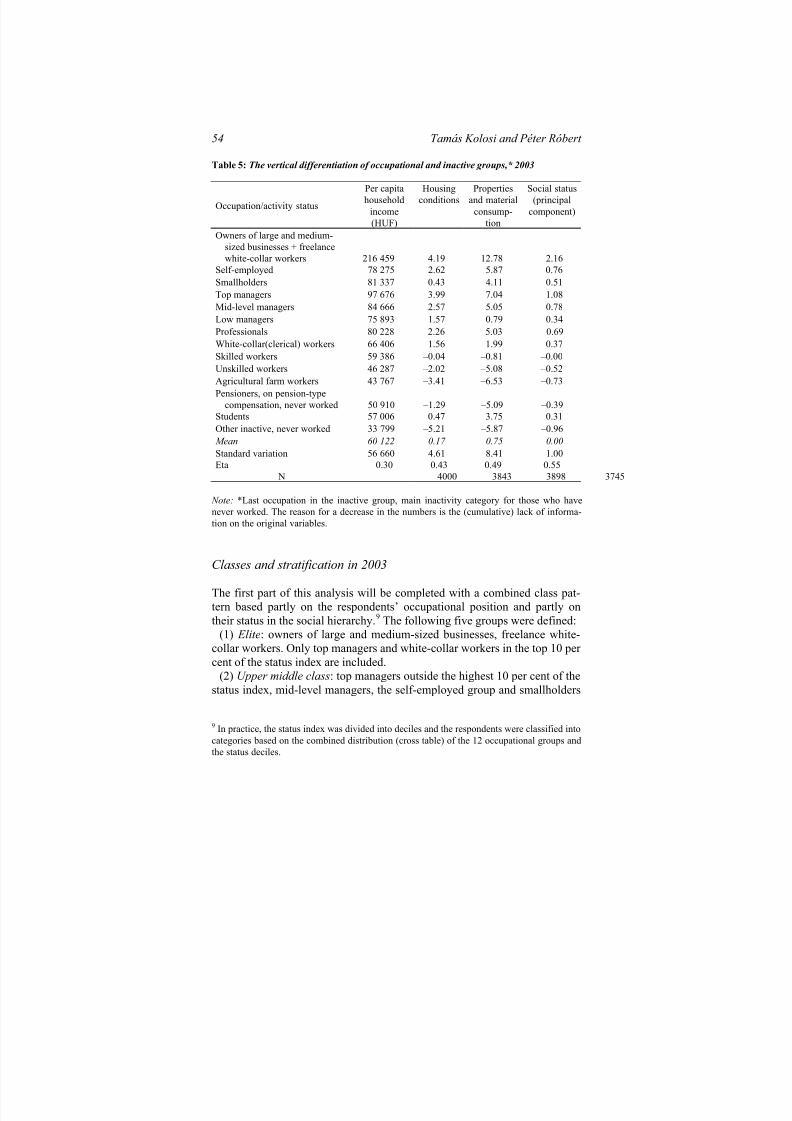
based on the three indices.8 The results of our vertical social stratification research are summarized in
Table 5. The table includes the average values of the income, housing andfinancial/material indices, and the social status index by the respondents’
occupation/activity status in 2003 (in the inactive group, the last occupationand main category of inactivity is indicated). The data show that the ownersof large and medium-sized businesses, and freelance white-collar workersenjoy the best social status in every respect. (Due to the low number of re-spondents in this category, this conclusion is hard to interpret, and yet seemscredible.)
In terms of per capita net household income, top and mid-level managersalso rank high, followed closely by smallholders. The housing conditions of top managers are only minimally poorer than those enjoyed by owners of large and medium-sized businesses and freelance white-collar workers.These groups are followed by the self-employed, mid-level managers and the
professionals. Top managers and the self-employed also rank second and
third, respectively, in terms of wealth and financial circumstances, followed by mid-level managers and professionals. The lowest position in the socialhierarchy is held by inactive people who have never worked, as well as byagricultural and unskilled workers. Skilled workers are the closest to theaverage. Altogether, these results are considered to be authentic, and themeasurement tools generated seem valid.
7 The correlation between the housing condition and material/financial status indices is 0.546;the correlation between the per capita household income and the housing condition index is
0.255, and that between per capita household income and the material/financial status is0.318.8 This method yielded 1 un-rotated principal component with an Eigen value over 1 (1.76).This principal component shows the vertical differentiation of society based on incomes,housing conditions, and financial status and (material) consumption, and explains 58.7 per cent of the total variance of the three original variables. The communality was 0.813 for housing conditions, 0.843 for the financial/material status and 0.624 for the per capita house-hold income. In the status index generated with the above method, housing and materialconditions play a more important role as they are based on a wider pool of information thanincome data.
8/3/2019 Social Report 2004 - Key Processes of Structural Transformation and Mobility in Hungarian Society Since the Fall of Communism
http://slidepdf.com/reader/full/social-report-2004-key-processes-of-structural-transformation-and-mobility 10/32
Tamás Kolosi and Péter Róbert 54
Table 5: The vertical differentiation of occupational and inactive groups,* 2003
Occupation/activity status
Per capitahousehold
income(HUF)
Housingconditions
Propertiesand material
consump-tion
Social status(principal
component)
Owners of large and medium-sized businesses + freelancewhite-collar workers 216 459 4.19 12.78 2.16
Self-employed 78 275 2.62 5.87 0.76Smallholders 81 337 0.43 4.11 0.51Top managers 97 676 3.99 7.04 1.08Mid-level managers 84 666 2.57 5.05 0.78
Low managers 75 893 1.57 0.79 0.34Professionals 80 228 2.26 5.03 0.69White-collar(clerical) workers 66 406 1.56 1.99 0.37Skilled workers 59 386 –0.04 –0.81 –0.00Unskilled workers 46 287 –2.02 –5.08 –0.52Agricultural farm workers 43 767 –3.41 –6.53 –0.73Pensioners, on pension-type
compensation, never worked 50 910 –1.29 –5.09 –0.39Students 57 006 0.47 3.75 0.31Other inactive, never worked 33 799 –5.21 –5.87 –0.96Mean 60 122 0.17 0.75 0.00Standard variation 56 660 4.61 8.41 1.00Eta 0.30 0.43 0.49 0.55
N 4000 3843 3898 3745
Note: *Last occupation in the inactive group, main inactivity category for those who havenever worked. The reason for a decrease in the numbers is the (cumulative) lack of informa-tion on the original variables.
Classes and stratification in 2003
The first part of this analysis will be completed with a combined class pat-tern based partly on the respondents’ occupational position and partly ontheir status in the social hierarchy.9 The following five groups were defined:
(1) Elite: owners of large and medium-sized businesses, freelance white-
collar workers. Only top managers and white-collar workers in the top 10 per cent of the status index are included.
(2) Upper middle class: top managers outside the highest 10 per cent of thestatus index, mid-level managers, the self-employed group and smallholders
9 In practice, the status index was divided into deciles and the respondents were classified intocategories based on the combined distribution (cross table) of the 12 occupational groups andthe status deciles.
8/3/2019 Social Report 2004 - Key Processes of Structural Transformation and Mobility in Hungarian Society Since the Fall of Communism
http://slidepdf.com/reader/full/social-report-2004-key-processes-of-structural-transformation-and-mobility 11/32
Key Processes of Structural Transformation and Mobility… 55
in the top 10 per cent of the status index; and professionals in deciles 6–9 of the status index.
(3) Middle class: mid-level managers, self-employed respondents andsmallholders whose status falls outside the highest 10 per cent, professionalswhose status is within deciles 1–5, low managers, other white-collar (office)workers and skilled workers whose status falls within the top three deciles.
(4) Working class: skilled workers with a lower status, as well as unskilledand agricultural workers whose status indices fall into decile 4 or higher.
(5) Deprived : unskilled and agricultural workers in the lowest three decilesof the status index.
In line with stratification research practices in Hungary and abroad, this class pattern builds primarily on the occupational status, adjusted with the socialstatus index. For respondents who were no longer employed or were tempo-rarily unemployed in 2003, the last occupational position was taken intoconsideration. Also, the earlier occupational position was adjusted with thesocial status index achieved in 2003. Those who had never had an occupa-tion were not included in this classification.
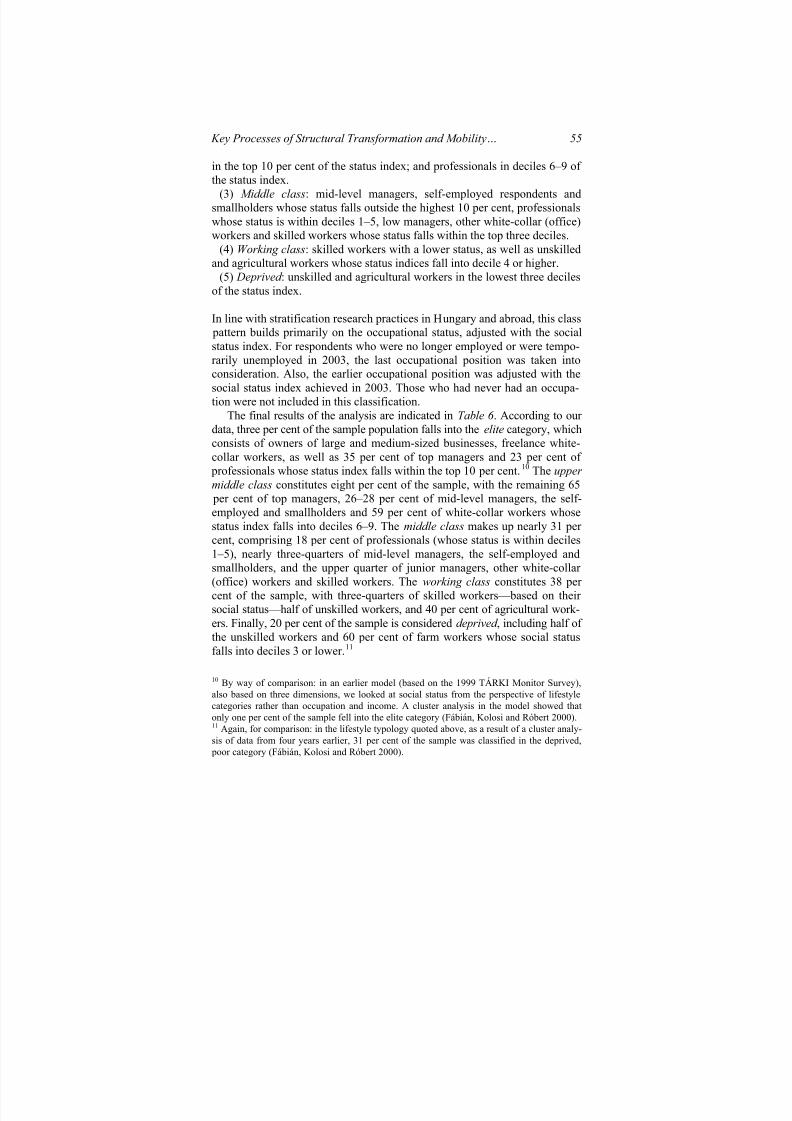
The final results of the analysis are indicated in Table 6 . According to our data, three per cent of the sample population falls into the elite category, whichconsists of owners of large and medium-sized businesses, freelance white-collar workers, as well as 35 per cent of top managers and 23 per cent of
professionals whose status index falls within the top 10 per cent.10 The upper
middle class constitutes eight per cent of the sample, with the remaining 65 per cent of top managers, 26–28 per cent of mid-level managers, the self-employed and smallholders and 59 per cent of white-collar workers whosestatus index falls into deciles 6–9. The middle class makes up nearly 31 per cent, comprising 18 per cent of professionals (whose status is within deciles1–5), nearly three-quarters of mid-level managers, the self-employed andsmallholders, and the upper quarter of junior managers, other white-collar (office) workers and skilled workers. The working class constitutes 38 per cent of the sample, with three-quarters of skilled workers—based on their social status—half of unskilled workers, and 40 per cent of agricultural work-ers. Finally, 20 per cent of the sample is considered deprived , including half of the unskilled workers and 60 per cent of farm workers whose social status
falls into deciles 3 or lower.11
10 By way of comparison: in an earlier model (based on the 1999 TÁRKI Monitor Survey),also based on three dimensions, we looked at social status from the perspective of lifestylecategories rather than occupation and income. A cluster analysis in the model showed thatonly one per cent of the sample fell into the elite category (Fábián, Kolosi and Róbert 2000).11 Again, for comparison: in the lifestyle typology quoted above, as a result of a cluster analy-sis of data from four years earlier, 31 per cent of the sample was classified in the deprived,
poor category (Fábián, Kolosi and Róbert 2000).
8/3/2019 Social Report 2004 - Key Processes of Structural Transformation and Mobility in Hungarian Society Since the Fall of Communism
http://slidepdf.com/reader/full/social-report-2004-key-processes-of-structural-transformation-and-mobility 12/32
Tamás Kolosi and Péter Róbert 56
Table 6: Social classes in the population aged 16 and above,* 2003 (%)
Social class DistributionElite 3.0Upper middle class 8.1Middle class 30.8Working class 37.8Deprived 20.3
N 360
Note: * Inactive (retired, unemployed, dependent) respondents were classified based on their last occupation. Their classification was also adjusted by the value of the social status princi-
pal component (which refers to the current situation). Persons who had never worked (homemakers, dependants, students) were not included in the classification.
Typical life histories and their impact on stratification
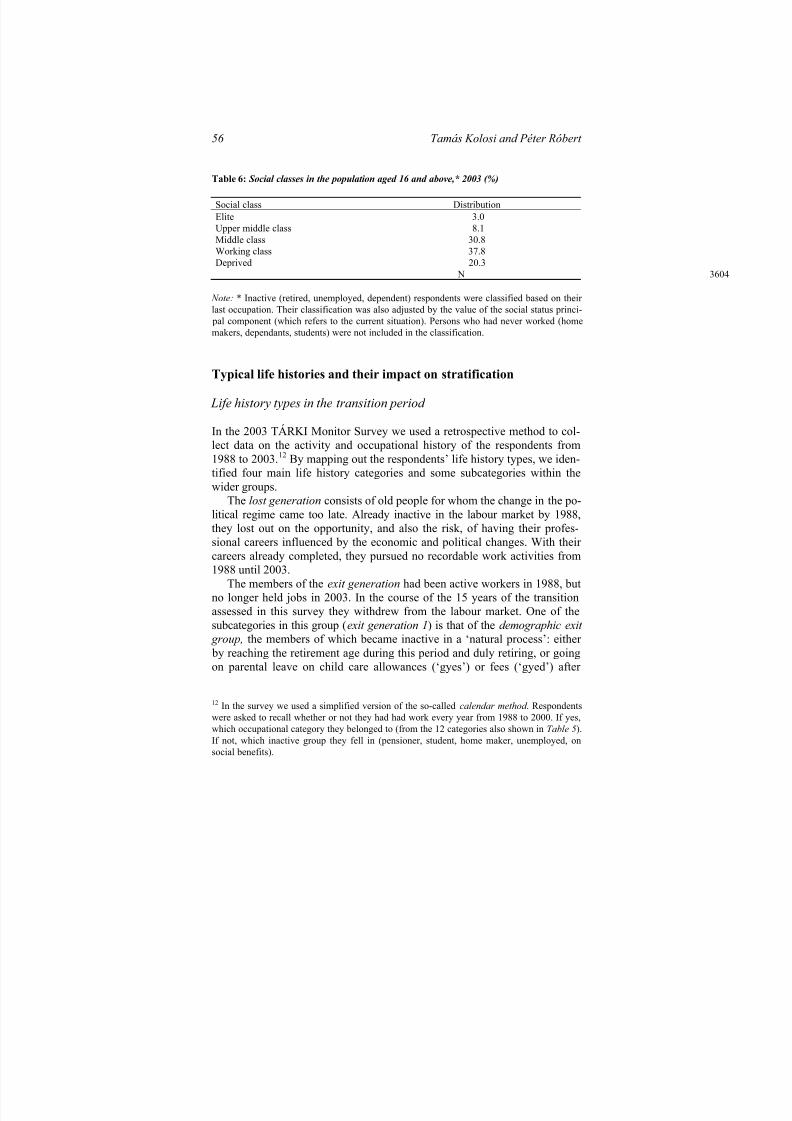
Life history types in the transition period
In the 2003 TÁRKI Monitor Survey we used a retrospective method to col-lect data on the activity and occupational history of the respondents from1988 to 2003.12 By mapping out the respondents’ life history types, we iden-tified four main life history categories and some subcategories within the
wider groups.The lost generation consists of old people for whom the change in the po-
litical regime came too late. Already inactive in the labour market by 1988,they lost out on the opportunity, and also the risk, of having their profes-sional careers influenced by the economic and political changes. With their careers already completed, they pursued no recordable work activities from1988 until 2003.
The members of the exit generation had been active workers in 1988, butno longer held jobs in 2003. In the course of the 15 years of the transitionassessed in this survey they withdrew from the labour market. One of thesubcategories in this group (exit generation 1) is that of the demographic exit
group, the members of which became inactive in a ‘natural process’: either by reaching the retirement age during this period and duly retiring, or goingon parental leave on child care allowances (‘gyes’) or fees (‘gyed’) after
12 In the survey we used a simplified version of the so-called calendar method . Respondentswere asked to recall whether or not they had had work every year from 1988 to 2000. If yes,which occupational category they belonged to (from the 12 categories also shown in Table 5).If not, which inactive group they fell in (pensioner, student, home maker, unemployed, onsocial benefits).

8/3/2019 Social Report 2004 - Key Processes of Structural Transformation and Mobility in Hungarian Society Since the Fall of Communism
http://slidepdf.com/reader/full/social-report-2004-key-processes-of-structural-transformation-and-mobility 13/32
Key Processes of Structural Transformation and Mobility… 57
childbirth. Such parents had left the labour market with the possible prospectof returning, but had not returned by the date of the data collection (2003).The other subcategory (exit generation 2), however, consists of people whodid not leave the labour market of their own will, but were compelled toleave. Between 1988 and 2003 they left the market and became unemployed,home makers or dependent on social benefits. In theory, they could return,
but have not done so as yet. Many of them became pensioners after a periodof inactivity, and therefore are certain not to return. Those who became pen-sioners through early retirement also belong to the forced exit generation.13
Those who worked both in 1988 and in 2003 were identified as the active generation of the transition. Respondents who were active in the labour
market throughout the 15-year period form one subgroup (active generation1). The second subgroup (active generation 2), however, had some sort of break in their career during this period—either demographic or occupational;i.e. during their active earning career they went through a period of unem-
ployment, had children and became full-time parents, or lived on social benefits, etc.
The entry generation consists of young people who were not yet presentin the labour market in 1988. At the time they were either dependent minorsor students engaged in some level of education. The genuine ‘entry group’— the members of which ‘grew up’, finished their studies and started to work during the 15 years of the transition period—form the largest subgroup (en-try generation 1). Young people who had not completed their studies by the
date of the survey also belong to this generation, but, being students, theywere not yet able to become a ‘natural’ component of the labour market.Within their generation, they form a smaller subgroup ( pre-entry genera-tion). Also in this group are those young people (entry generation 2) whowere no longer students but, unable to find work, had joined other inactivegroups (unemployed, full-time parents, social benefit recipients). This thirdgroup failed its entry and became inactive not of their own will, but becausethey were unable to find gainful employment.
13 The official retirement age was not considered strictly here. Obviously, early retirement for men is at and before the age of 54, and for women at and before the age of 49. We also sup-
posed an ‘escape’ into retirement and therefore a non-voluntary exit for those who retired atan age between these age brackets and the official retirement age (therefore not so ‘early’),
but had been inactive before retirement (e.g. as unemployed, home makers or on social bene-fits), therefore did not retire from an active position. Those who had been on parental leave,
but later joined another inactive category (except for students), were classified in the involun-tary exit group.
8/3/2019 Social Report 2004 - Key Processes of Structural Transformation and Mobility in Hungarian Society Since the Fall of Communism
http://slidepdf.com/reader/full/social-report-2004-key-processes-of-structural-transformation-and-mobility 14/32
Tamás Kolosi and Péter Róbert 58
Table 7: Life history types in Hungarian society from 1988 to 2003 (%)
Life history type ProportionLost generation 15.6Exit generation 1 (demographic exit) 16.8Exit generation 2 (forced exit) 16.1Active generation 1 (active working career without interruptions) 16.7Active generation 2 (active working career with interruptions) 11.1Entry generation 1 (youth able to launch working career) 15.7Entry generation 2 (youth unable to launch working career) 2.1Pre-entry generation (students) 5.9
N*
Note: *This classification was prepared for the entire population aged 16 and over, exceptwhere impossible due to lack of data.
Table 7 shows the result of the classification. According to the data, the transi-tion had no effect on the occupational life history of 15.6 per cent of the
population aged 16 and over. These people were either no longer active inthe labour market in 1988 or never had jobs. Exactly one third of the popula-tion left the labour market during the period from 1988 to 2003. Half of these people left the market for demographic reasons, whereas the other half consisted of those who had been compelled to leave. Some 28 per cent wereactive in the labour market in the period assessed. Most of these people con-tinued to work without any interruptions in the transition period as well. A
significant group (11 per cent), however, left their jobs temporarily duringthis period. Nearly 18 per cent completed their education in the transition period after 1988. Most of them (16 per cent) found jobs, but the remainingtwo per cent had still been unable to find work with their qualifications in2003. The latter group, which, in terms of the qualifications they had, should
be called ‘school drop outs’ rather than simply ‘school leavers’, makes up arather significant 11–12 per cent of their age group. Finally, nearly 6 per cent of the population aged 16 and over are still full-time students.
The impact of life histories on social status
This part of the analysis will look at social classes and statuses generated bydifferent life histories. On the one hand, the analysis will draw on descriptivestatistical results to explore the social class status achieved by respondentswith different life histories and the average social status of each generationin 2003. On the other hand, causal models will also be assessed to test spe-cific research questions for each generation. We will look for answers to thefollowing questions:
8/3/2019 Social Report 2004 - Key Processes of Structural Transformation and Mobility in Hungarian Society Since the Fall of Communism
http://slidepdf.com/reader/full/social-report-2004-key-processes-of-structural-transformation-and-mobility 15/32
Key Processes of Structural Transformation and Mobility… 59
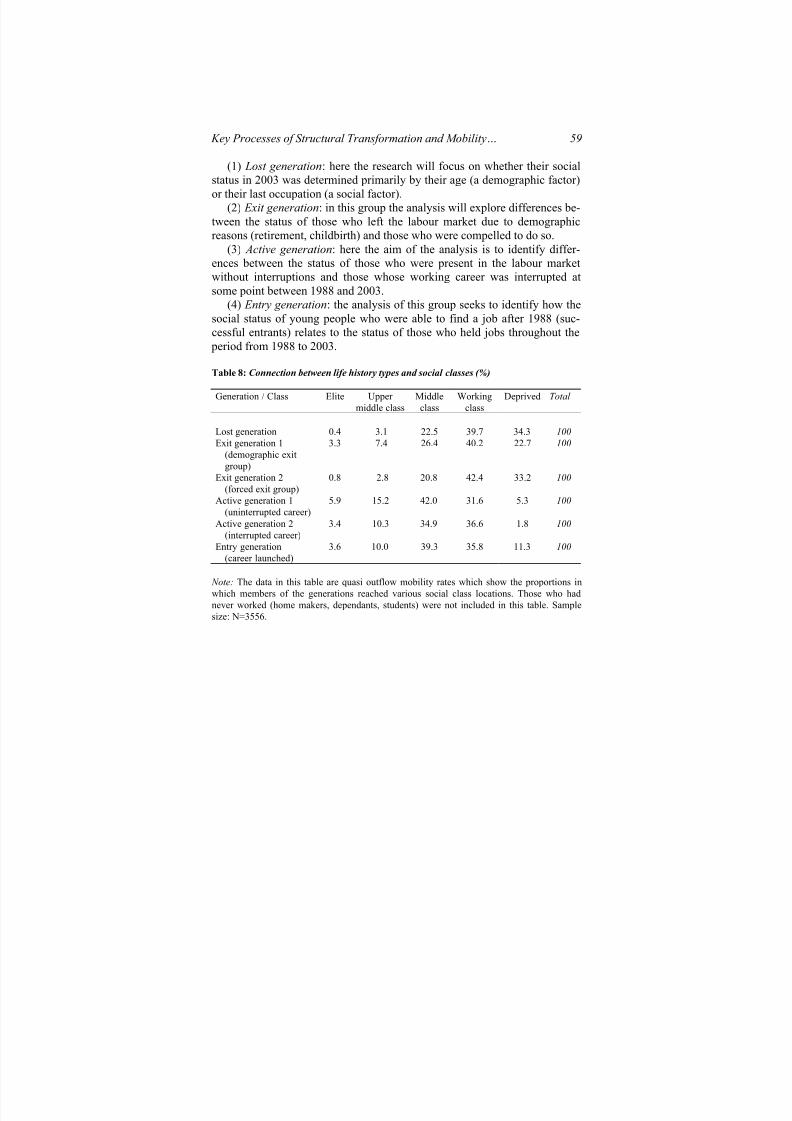
(1) Lost generation: here the research will focus on whether their socialstatus in 2003 was determined primarily by their age (a demographic factor)or their last occupation (a social factor).
(2) Exit generation: in this group the analysis will explore differences be-tween the status of those who left the labour market due to demographicreasons (retirement, childbirth) and those who were compelled to do so.
(3) Active generation: here the aim of the analysis is to identify differ-ences between the status of those who were present in the labour marketwithout interruptions and those whose working career was interrupted atsome point between 1988 and 2003.
(4) Entry generation: the analysis of this group seeks to identify how the
social status of young people who were able to find a job after 1988 (suc-cessful entrants) relates to the status of those who held jobs throughout the period from 1988 to 2003.
Table 8: Connection between life history types and social classes (%)
Generation / Class Elite Upper middle class
Middleclass
Workingclass
Deprived Total
Lost generation 0.4 3.1 22.5 39.7 34.3 100Exit generation 1
(demographic exitgroup)
3.3 7.4 26.4 40.2 22.7 100
Exit generation 2(forced exit group)
0.8 2.8 20.8 42.4 33.2 100
Active generation 1(uninterrupted career)
5.9 15.2 42.0 31.6 5.3 100
Active generation 2(interrupted career)
3.4 10.3 34.9 36.6 1.8 100
Entry generation(career launched)
3.6 10.0 39.3 35.8 11.3 100
Note: The data in this table are quasi outflow mobility rates which show the proportions inwhich members of the generations reached various social class locations. Those who hadnever worked (home makers, dependants, students) were not included in this table. Samplesize: N=3556.
8/3/2019 Social Report 2004 - Key Processes of Structural Transformation and Mobility in Hungarian Society Since the Fall of Communism
http://slidepdf.com/reader/full/social-report-2004-key-processes-of-structural-transformation-and-mobility 16/32
Tamás Kolosi and Péter Róbert 60
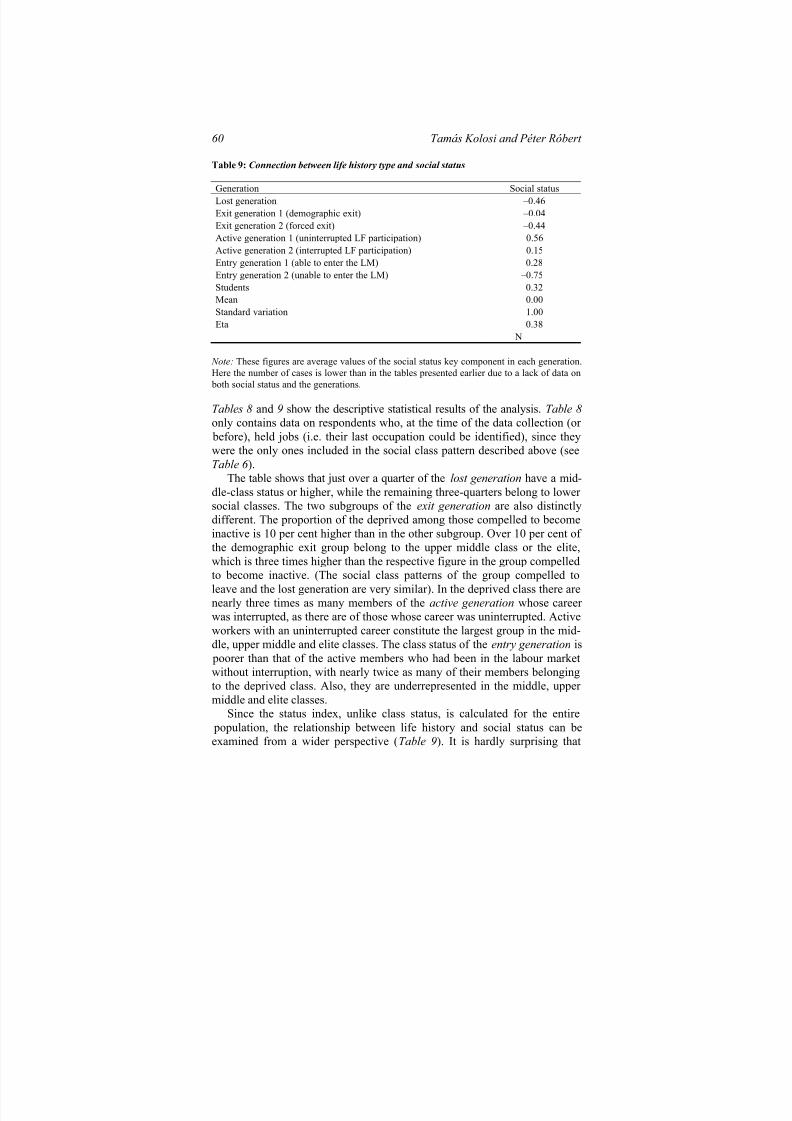
Table 9: Connection between life history type and social status
Generation Social statusLost generation –0.46Exit generation 1 (demographic exit) –0.04Exit generation 2 (forced exit) –0.44Active generation 1 (uninterrupted LF participation) 0.56Active generation 2 (interrupted LF participation) 0.15Entry generation 1 (able to enter the LM) 0.28Entry generation 2 (unable to enter the LM) –0.75Students 0.32Mean 0.00Standard variation 1.00
Eta 0.38 N
Note: These figures are average values of the social status key component in each generation.Here the number of cases is lower than in the tables presented earlier due to a lack of data on
both social status and the generations.
Tables 8 and 9 show the descriptive statistical results of the analysis. Table 8only contains data on respondents who, at the time of the data collection (or
before), held jobs (i.e. their last occupation could be identified), since theywere the only ones included in the social class pattern described above (seeTable 6 ).
The table shows that just over a quarter of the lost generation have a mid-dle-class status or higher, while the remaining three-quarters belong to lower social classes. The two subgroups of the exit generation are also distinctlydifferent. The proportion of the deprived among those compelled to becomeinactive is 10 per cent higher than in the other subgroup. Over 10 per cent of the demographic exit group belong to the upper middle class or the elite,which is three times higher than the respective figure in the group compelledto become inactive. (The social class patterns of the group compelled toleave and the lost generation are very similar). In the deprived class there arenearly three times as many members of the active generation whose career was interrupted, as there are of those whose career was uninterrupted. Activeworkers with an uninterrupted career constitute the largest group in the mid-
dle, upper middle and elite classes. The class status of the entry generation is poorer than that of the active members who had been in the labour marketwithout interruption, with nearly twice as many of their members belongingto the deprived class. Also, they are underrepresented in the middle, upper middle and elite classes.
Since the status index, unlike class status, is calculated for the entire population, the relationship between life history and social status can beexamined from a wider perspective (Table 9). It is hardly surprising that
8/3/2019 Social Report 2004 - Key Processes of Structural Transformation and Mobility in Hungarian Society Since the Fall of Communism
http://slidepdf.com/reader/full/social-report-2004-key-processes-of-structural-transformation-and-mobility 17/32
Key Processes of Structural Transformation and Mobility… 61
those who were active in the labour market without interruptions from 1988until 2003 rank highest (0.56) in the list. Members of the middle-age genera-tion whose career was interrupted during this period, e.g. they became un-employed, come significantly behind the top group (with 0.15 points). Their life history group is outstripped even by the successful members of the entrygeneration (0.28) who began their careers after 1988. Even more interest-ingly, the social status of those who were still studying in 2003 is evenhigher (0.32).14 The social status of the demographic exit group (–0.04) isclose to the grand mean. However, those who were forced out of the labour market between 1988 and 2003 and the lost generation have a markedly
poorer status (–0.44 and –0.46). The worst social status (–0.75) was held by
those who had completed their education (or dropped out) but had been un-able to find a job. Descriptive data therefore suggest that social status de- pends primarily on whether or not people can secure their presence in thelabour market. Among the unemployed, those who drop out of the marketirrevocably are in a worse position than those whose unemployment is tem-
porary. People unable to even start working face an even more severe social problem.
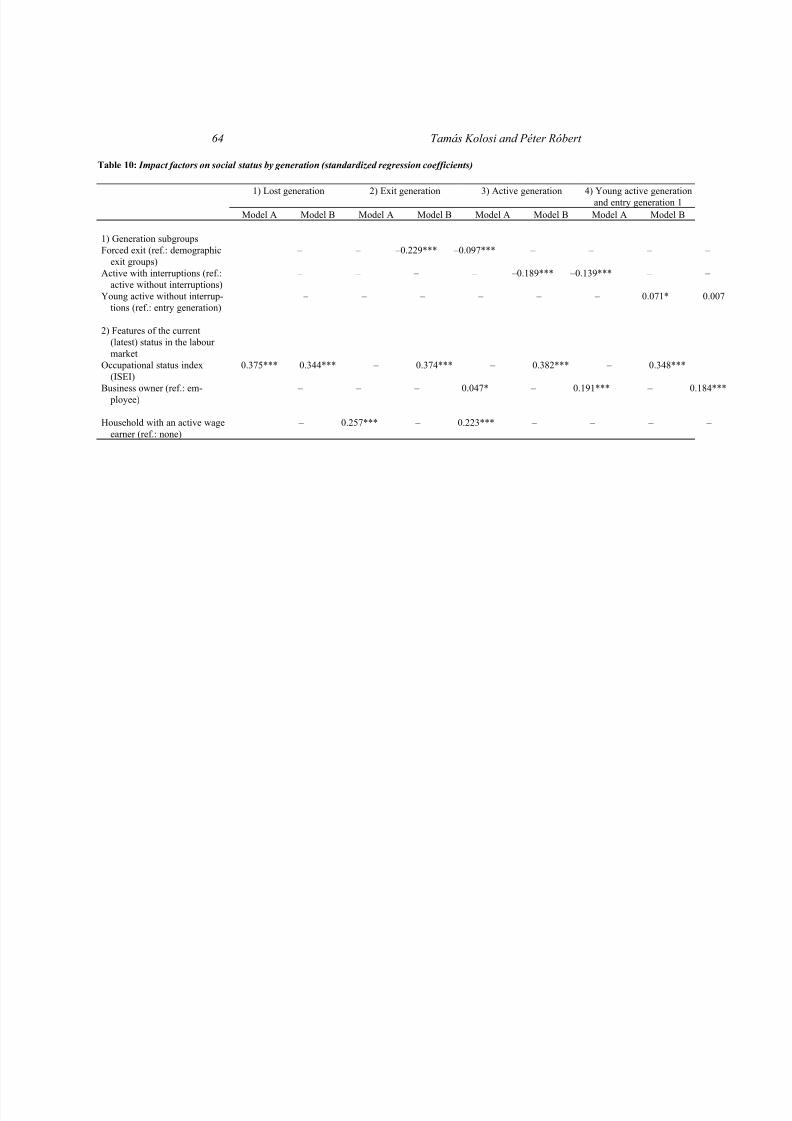
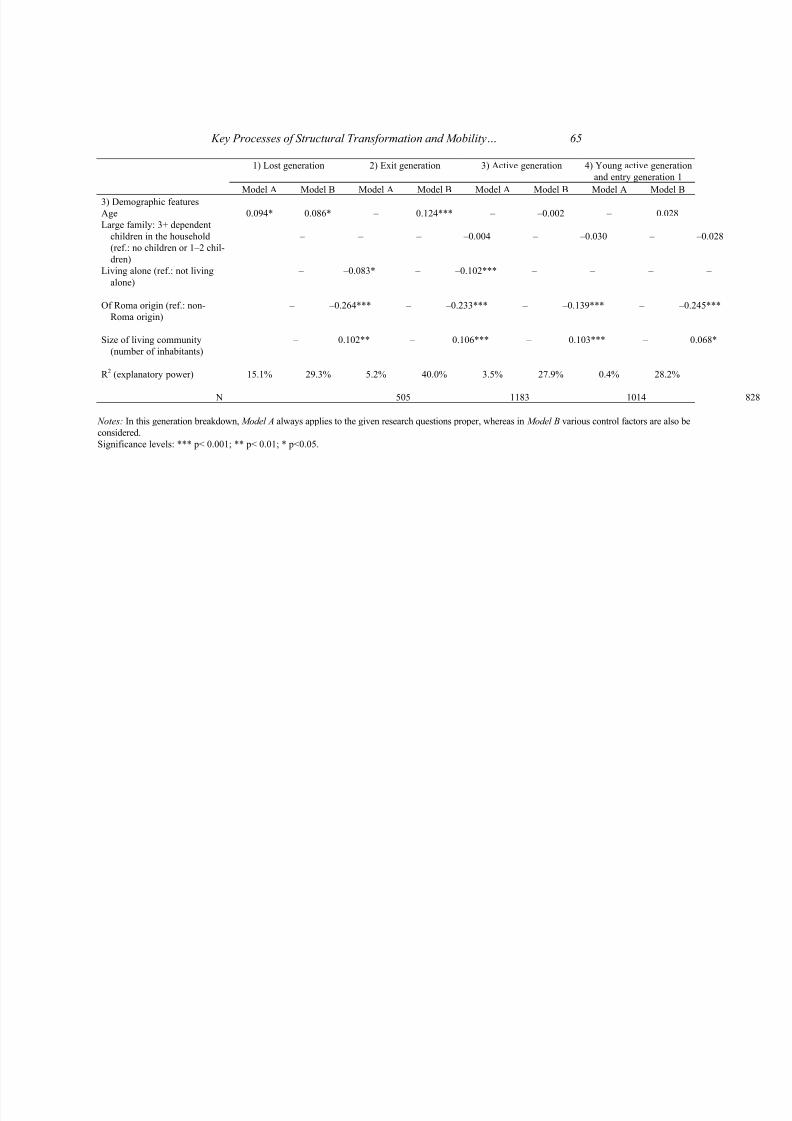
For the causal analysis the regression method was applied. A total of four models will be presented here in the search for answers to the four researchquestions pinned down earlier. In all instances, social status is the dependentvariable. All four models will use the data in two phases: Model A will alwaysapply to the given specific question of the analysis, whereas in Model B vari-
ous control factors will also be considered. For the results, see Table 10.The answer to the first research question is clearly that the last occupa-tion15 of the members of the lost generation had a much greater impact ontheir current social status in 2003 than their age (Model 1/A). This appliesdespite the fact that the members of the lost generation completed their ca-reers at least 15 years ago, before 1988. The conclusion remains valid evenwhen the control factors are added.16 Accordingly, these elderly people en-
14 The social status of students, of course, usually means the social status of their parentalfamilies: the per capita net income, housing conditions, material/financial situation of thefamilies. These data therefore provide additional information on the relationship between(further) education and a good family background.15 Here, as in the other models, occupations (whether current or last) were based on the de-tailed occupational code (ISCO). Each respondent who was active or ever had been activewas assigned the respective ISEI rating used in mobility research internationally. (For moreabout the method, see Ganzeboom and Treiman (1996)). As such, those who had never worked were not included in the analysis on the lost generation.16 Control factors such as whether there were active wage earners in the family, whether therespondents lived alone or whether the respondents came from a Roma household, weremeasured by binary variables: (yes: 1, no: 0). Settlement categories for the place of livingwere coded according to the respective population numbers to ensure the appropriate level of measurement for the variable.
8/3/2019 Social Report 2004 - Key Processes of Structural Transformation and Mobility in Hungarian Society Since the Fall of Communism
http://slidepdf.com/reader/full/social-report-2004-key-processes-of-structural-transformation-and-mobility 18/32
Tamás Kolosi and Péter Róbert 62
joy a much better status if they have active wage earners in their families.Their status, however, deteriorates if they live alone. Coming from a Roma
background has the same negative effect on social status. People living inlarge cities have a better status than those who live in small communities(Model 1/B).
The answer to the second question of our research is that—within the exit generation —the social status of the group forced out is significantly lower than that of those who left the labour market for demographic reasons(Model 2/A). As such, the difference based on descriptive data (Table 9) hasstatistical significance as well. However, once the control factors are alsoapplied (Model 2/B), the distinction between the two subgroups drops by
over 50 per cent, but remains significant (beta values are –0.229 and – 0.097). This shows that other factors—such as occupation, whether the oc-cupation is in the form of self-employment or employment,17 age, the com-
position of the family, the number of children, being of Roma origin, the sizeof the living community—are in strong correlation with being forced out of the labour market. The impact of the control factors corresponds to expecta-tions: a better occupation and, to a lesser extent, being self-employed im-
proves one’s social status. Also, those who live in larger cities or who haveactive wage earners in their families enjoy a significantly higher status than
people who live alone or are of Roma origin.18 The answer to the third question of the research is that—within the active
generation —the social status of people whose work career was interrupted
in the period from 1988 to 2003 is significantly lower (Model 3/A). Again,our descriptive results (Table 9) have been confirmed. The control factors(Model 3/B), however, ‘destroy’ more moderately the main effects than inQuestion 2 (beta values are –0.189 and –0.139). The factors that had astronger correlation to whether people were forced out of the labour marketfor good during the transition period from 1988 to 2003 had a smaller impacton temporary unemployment during the same period.
17 Given that the ISEI rating applies to occupations regardless of whether they are in the formof employment or self-employment, a separate binary variable was applied to the self-employed category (self-employed: 1, other: 0).18 The number of children does not really ‛work’ here, since the assessment (3 or more chil-dren: 1, other: 0) shows that this factor is not significant in comparison to other variables inthe analysis (although the estimate has a negative sign, i.e. a high number of children resultsin a lower social status).

8/3/2019 Social Report 2004 - Key Processes of Structural Transformation and Mobility in Hungarian Society Since the Fall of Communism
http://slidepdf.com/reader/full/social-report-2004-key-processes-of-structural-transformation-and-mobility 19/32
Key Processes of Structural Transformation and Mobility… 63
Another interesting aspect concerning control factors in this model is thathere people’s social status was relatively less affected by the fact if theycame from a Roma background (–0.139 as opposed to the beta values of –0.264and –0.233 in Models 1/B and 2/B, respectively). In other words, though stillsignificantly lower than non-Roma respondents in a similar situation, thestatus of Roma who manage to remain in the labour market over a long pe-riod of time—or with short interruptions—will not be so poor as it would beif they had no jobs, either because of old age or because they had beenforced to withdraw from the labour market.
As regards the fourth question, our inquiry goes beyond simply checkinghow the social status of those active in the labour market during the entire
period from 1988 to 2003 compares to that of respondents who started work-ing after 1988. The descriptive results (Table 9) show that the former grouphas a clear edge over the latter in terms of social status. The difference, how-ever, could simply be the consequence of ‘ageing’, since the active genera-tion had more time to accumulate higher status than the entry generation.Therefore, only active generation respondents under the age of 45 are con-sidered in the comparison to reduce the impact of the age factor. As such, inthe model (Model 4/A) the status of the young members of the active genera-tion is only minimally higher than that of the next, entry generation (‘claim-ants to the throne’). Moreover, this impact disappears completely when thecontrol factors are applied (Model 4/B). The conclusion, therefore, is that thevariance in the social status of the two successive cohorts is not the result of
generation factors (the impact of age is not significant), but rather of factorssuch as occupation, place of residence and ethnic origin. This last factor plays a prominent role in this model as well. Additionally, in the model of the entry generation (but also in that applied to the active generation), self-employment has a stronger positive impact on social status.
Occupational mobility and social status
In the last part of our analysis, we will examine the active generation, toexplore in more detail the relationship between the occupational mobilityand social status of the mid-generation. A conventional intragenerationalmobility table is used to compare occupational statuses in 1988 and 2003.Based on this, the members of this generation are classified as upwardlymobile, immobile and downwardly mobile. Then the social status achieved
by each category by 2003 is analysed. Those who worked throughout the period, and those whose careers were in some way interrupted, are examinedseparately. Data concerning men and women are also explored in a separateanalysis.
8/3/2019 Social Report 2004 - Key Processes of Structural Transformation and Mobility in Hungarian Society Since the Fall of Communism
http://slidepdf.com/reader/full/social-report-2004-key-processes-of-structural-transformation-and-mobility 20/32
Tamás Kolosi and Péter Róbert 64
Table 10: Impact factors on social status by generation (standardized regression coefficients)
1) Lost generation 2) Exit generation 3) Active generation 4) Young active generationand entry generation 1
Model A Model B Model A Model B Model A Model B Model A Model B
1) Generation subgroupsForced exit (ref.: demographic
exit groups) – – –0.229*** –0.097*** – – – –
Active with interruptions (ref.:active without interruptions)
– – – – –0.189*** –0.139*** – –
Young active without interrup-tions (ref.: entry generation)
– – – – – – 0.071* 0.007
2) Features of the current(latest) status in the labour market
Occupational status index(ISEI)
0.375*** 0.344*** – 0.374*** – 0.382*** – 0.348***
Business owner (ref.: em- ployee)
– – – 0.047* – 0.191*** – 0.184**
Household with an active wageearner (ref.: none)
– 0.257*** – 0.223*** – – – –
8/3/2019 Social Report 2004 - Key Processes of Structural Transformation and Mobility in Hungarian Society Since the Fall of Communism
http://slidepdf.com/reader/full/social-report-2004-key-processes-of-structural-transformation-and-mobility 21/32
Key Processes of Structural Transformation and Mobility… 65
1) Lost generation 2) Exit generation 3) Active generation 4) Young active generationand entry generation 1
Model A Model B Model A Model B Model A Model B Model A Model B3) Demographic featuresAge 0.094* 0.086* – 0.124*** – –0.002 – 0.028Large family: 3+ dependent
children in the household(ref.: no children or 1–2 chil-dren)
– – – –0.004 – –0.030 – –0.028
Living alone (ref.: not livingalone)
– –0.083* – –0.102*** – – – –
Of Roma origin (ref.: non-Roma origin)
– –0.264*** – –0.233*** – –0.139*** – –0.245***
Size of living community(number of inhabitants)
– 0.102** – 0.106*** – 0.103*** – 0.068*
R 2 (explanatory power) 15.1% 29.3% 5.2% 40.0% 3.5% 27.9% 0.4% 28.2%
N 505 1183 1014
Notes: In this generation breakdown, Model A always applies to the given research questions proper, whereas in Model B various control factors are also beconsidered. Significance levels: *** p< 0.001; ** p< 0.01; * p<0.05.
8/3/2019 Social Report 2004 - Key Processes of Structural Transformation and Mobility in Hungarian Society Since the Fall of Communism
http://slidepdf.com/reader/full/social-report-2004-key-processes-of-structural-transformation-and-mobility 22/32
Tamás Kolosi and Péter Róbert 66
Table 11: Intragenerational mobility and social status in the active generation, 1988–2003
1) Ownersof large
and med. businesses
+freel.white-collar
2) Topand mid-
levelmanagers+ profes-sionals
3) Self-employed+ small-holders
4) Lowmanagers+ white-
collar
5) Skilledworkers
6) Un-skilled
workers
Total
1) Owners of large and me-dium busi-nesses + free-lance white-
collar
(2.34)2
.(2.96)
2. . .
(2.64)4
2) Top and mid-level managers+ profession-als
(2.39)6
1.01148
(1.44)20
(0.94)22
(0.24)5
(0.05)3
1.0204
3) Self-employed+ smallholders
. (0.68)7
(0.71)23
(0.82)2
(-0.05)2
(0.12)2
0.6436
4) Low managers+ white –collar
workers
. 1.2330
(1.25)15
0.45106
(0.53)7
(0.11)13
0.61171
5) Skilled work-ers
. (0.83)15
0.7247
(0.48)25
0.23287
–0.1952
0.27 426
6) Unskilledworkers
. (0.45)4
(0.15)16
(0.53)3
(–0.04)20
–0.39146
–0.27 189
Total (2.37)8
1.01204
0.85123
0.53158
0.22321
–0.30216
0.401030
Note: The data above show the mean average of social status points and the number of cases.Where the number of cases is under 30, status points are indicated in brackets.
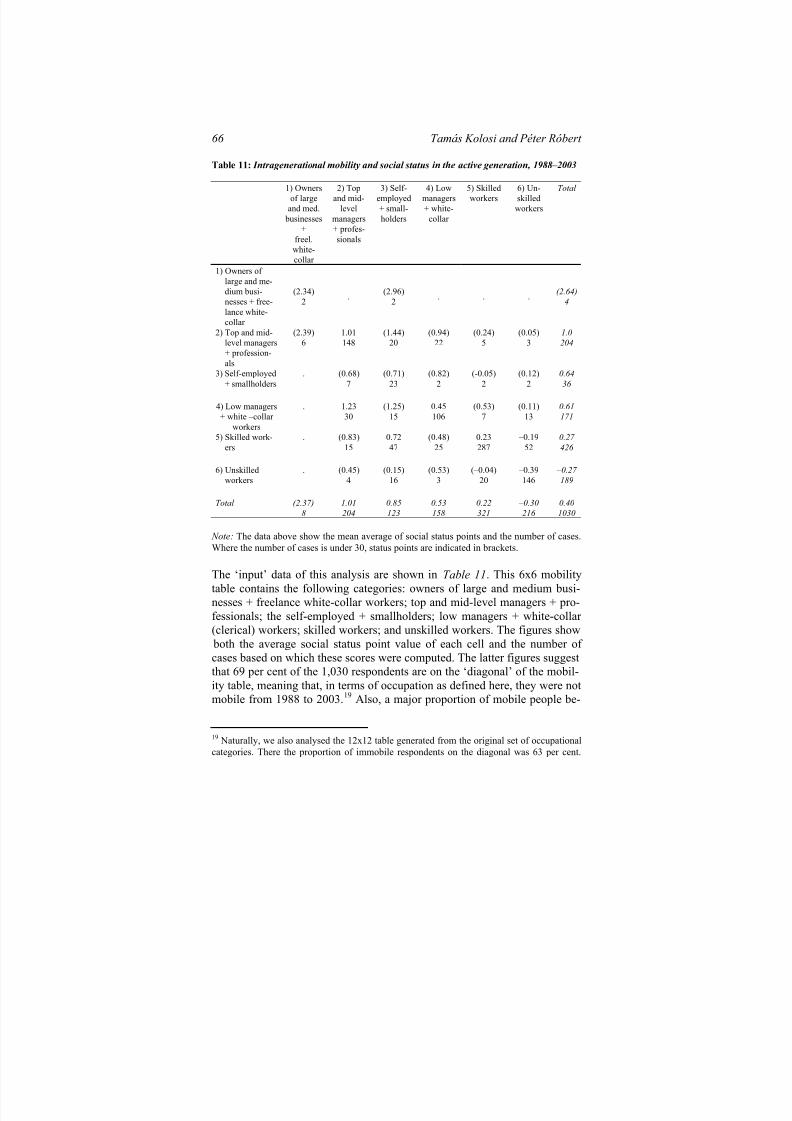
The ‘input’ data of this analysis are shown in Table 11. This 6x6 mobilitytable contains the following categories: owners of large and medium busi-nesses + freelance white-collar workers; top and mid-level managers + pro-fessionals; the self-employed + smallholders; low managers + white-collar (clerical) workers; skilled workers; and unskilled workers. The figures show
both the average social status point value of each cell and the number of cases based on which these scores were computed. The latter figures suggestthat 69 per cent of the 1,030 respondents are on the ‘diagonal’ of the mobil-ity table, meaning that, in terms of occupation as defined here, they were notmobile from 1988 to 2003.19 Also, a major proportion of mobile people be-
19 Naturally, we also analysed the 12x12 table generated from the original set of occupationalcategories. There the proportion of immobile respondents on the diagonal was 63 per cent.

8/3/2019 Social Report 2004 - Key Processes of Structural Transformation and Mobility in Hungarian Society Since the Fall of Communism
http://slidepdf.com/reader/full/social-report-2004-key-processes-of-structural-transformation-and-mobility 23/32
Key Processes of Structural Transformation and Mobility… 67
long to cells close to the ‘diagonal’.20 The data, therefore, show no signs of mass occupational restratification. However, we are not in a position tocheck our results against other data, as such information does not exist. It is,however, very likely that occupational mobility has been slightly underratedin the approach taken here. Another occupational analysis of the 1988–2003
period based, for instance, on ISEI ratings would very likely show a moredynamic mobility pattern, since our categories would be intrinsically moreheterogeneous in a more detailed assessment such as this.
Table 11 also highlights the fact that movements in various directionsamong occupational categories are not in obvious correlation with socialstatus. The assumption that upward and downward mobility are always asso-
ciated with, respectively, higher and lower status ratings than immobilitydoes not hold. As such, there is no ‘linear’ relation between occupationalmobility in the traditional sense and social status, as proven by the results
presented in Table 12.
Table 12: Occupational mobility and social status in subcategories of the active generation
Type of mobility
Career with no interruptions Career with interruptions Total
Men Women Men Women(%) Status (%) Status (%) Status (%) Status (%) Status
Down-ward
8.1 0.84 8.6 0.77 21.3 –0.01 18.6 0.24 12.5 0.40
Immobile 69.5 0.48 80.5 0.42 56.2 –0.23 65.3 0.21 69.3 0.32
Upward 22.4 0.89 10.9 0.77 22.5 0.34 16.1 0.67 18.2 0.72
Total 100.0 0.59 100.0 0.49 100.0 –0.06 100.0 0.29 100.0 0.40
N 394 267 170 1991030
The merger of the categories therefore brought only a minor change in the mobility rates.However, the mobile persons in the 12x12 table varied very highly.20 We checked a few ‘extreme’ mobility cases. Two people who moved ‘down’ from the topcategory to category 3 had been freelance white-collar workers who became self-employed.Some manual workers who showed a strong upward tendency and were classified in category2, had become mid-level managers, rather than top-level managers or professionals. Somerespondents who ‘sank’ to the manual worker category from category 2 had been either pro-fessionals or mid-level managers earlier, but not top managers.

8/3/2019 Social Report 2004 - Key Processes of Structural Transformation and Mobility in Hungarian Society Since the Fall of Communism
http://slidepdf.com/reader/full/social-report-2004-key-processes-of-structural-transformation-and-mobility 24/32
Tamás Kolosi and Péter Róbert 68
In the active generation, respondents whose career had been interrupteddemonstrated greater mobility than those who had been in the labour marketduring the entire period from 1988 to 2003. Also, men were more mobilethan women. Among mobile workers, those who had interrupted their activecareer show a stronger tendency for downward mobility. Women, in general,were less upwardly mobile than their male counterparts. In terms of socialstatus, the results show that the social status generated by upward mobilitywas much higher than the status of respondents who had been immobile inthe past 15 years, whereas the social status of downwardly mobile respon-dents was slightly better than that of the immobile group. The status ratingsof respondents with an uninterrupted career form a U-shaped curve in both
sexes, with slightly lower values for women. It is clear, therefore, that such‘downward’ movements were deliberate, not forced, as a traditional occupa-tional mobility approach would suggest; in effect, these respondents drifted‘upwards’. It is more likely, however, that downward occupational move-ments (or in fact mobility in any direction) after career breaks were involun-tary. In this group, upwardly mobile respondents of both sexes had a higher social status rating than those who had been immobile, but their status rat-ings are lower than those whose career rise in the occupational hierarchy had
been uninterrupted. The social status of downwardly mobile respondents isonly slightly higher than that of respondents whose career had been inter-rupted but who remained in the same occupational category.21
Interestingly, among respondents whose career had been interrupted,
women had a higher social status than men. Unit numbers here did not allowfor a differentiation between interruptions of a demographic and non-demo-graphic nature, but the results show that interruptions were more ‘damaging’for men than for women. It is likely that career interruptions for women weremore often due to demographic reasons (childbirth), whereas for men suchinterruptions were non-voluntary, i.e. the consequence of a temporary loss of employment. On the whole, the analysis also suggests that career interrup-tions are a greater risk factor for social status, and respondents whose careershad been interrupted in the past 15 years suffered a greater loss of status thanthose who were able to remain in the labour market throughout the period,even if in a lower occupation position.
21 An alternative interpretation of this is that housing and material/financial factors whichwould not necessarily be lost by ‘downward’ mobility played an important role in the socialstatus assessment.
8/3/2019 Social Report 2004 - Key Processes of Structural Transformation and Mobility in Hungarian Society Since the Fall of Communism
http://slidepdf.com/reader/full/social-report-2004-key-processes-of-structural-transformation-and-mobility 25/32
Key Processes of Structural Transformation and Mobility… 69
Some conclusions
Our analyses outline three distinct phases of social stratification in the post-communist period. First, at the turn of the 1990s, pro-forma employmentwas replaced by real unemployment as a result of the grave economic crisisthat accompanied the transformation of the political system. This period
brought a radical surge in social inequalities and income disparities. A largenumber of business owners and, subsequently, owners of large businessesappeared in the market. The economic position of managers who met therequirements of the market and white-collar workers improved rapidly. Thevolume of poverty remained effectively unchanged. However, a decline in
the standards of living due to the economic crisis drove a large proportion of the mainly middle strata of society near to poverty. The growth of the econ-omy in the 1990s, for the second phase, effectively stabilized the inequali-ties. The first beneficiaries of economic growth were the upper strata, and, asthe growth spread downwards in society, a further 10 per cent of society
benefited from the positive changes every year. As a result, the position of the middle strata became stable and another third of these strata shrugged off
poverty to join the upper third that had been one of the obvious beneficiariesof the transition. The first years of the new millennium, the third phase,
brought new trends. The increase in the minimum wage, as well as socialand pension policies, on the one hand, and the good market positions carvedout by business players, and government actions benefiting public workers,
on the other, led to greater material improvement in the upper and lower strata than in the 40–50 per cent in the centre of the social spectrum.
All in all, the structure of society is moving towards greater stability. Theupper middle class, which makes up 10–12 per cent of society, thoughhighly heterogeneous, has clearly improved its status in the past 15 years.The classic middle class, with its 30 per cent of the population, is also het-erogeneous, but a majority of its members are among the beneficiaries of thetransition. Unlike the upper strata, the status of the working class, whichcomprises nearly 40 per cent of society, was badly hit by the effects of theeconomic crisis and a narrowing labour market in the 1990s. It was also thisgroup that benefited least from the new economic growth and the ‘spendinggenerosity’ of various governments during their terms in office. The remain-ing 20 per cent form the deprived group, whose members have lived in con-tinuous poverty and dependence on the state, even though the growth rate of their income has been above the average over the past two to three years.
Our analyses confirmed the decisive role of labour activity in social strati-fication. Analyses that take into consideration generation aspects lead to thesame conclusion. Generation analyses show that the social status of those whohad been inactive in the labour market before the fall of communism is muchless determined by age (i.e. the number of years they have spent in retire-
8/3/2019 Social Report 2004 - Key Processes of Structural Transformation and Mobility in Hungarian Society Since the Fall of Communism
http://slidepdf.com/reader/full/social-report-2004-key-processes-of-structural-transformation-and-mobility 26/32
Tamás Kolosi and Péter Róbert 70
ment) than by the occupational status held before the transition period. Thereare significant differences among those who have withdrawn from the labour market over the past 15 years, depending on whether they retired for demo-graphic reasons or were compelled to become inactive. Moreover, the secondgreatest factor of differentiation even in the active generation, preceded only
by the occupational status of the respondents, is whether their economicactivity was interrupted or not for any length of time. Conspicuously, theworst drawback affecting the Roma is also whether or not they can maintaina continuous presence in the labour market and whether they can enter themarket in the first place. Ethnic segregation has a considerably smaller im-
pact on those who find and can keep their jobs. And finally, the worst status
is not that of pensioners, but of young people (10–12 per cent of each entrantgeneration) who finish their education but cannot find a job.Our data indicate that the occupational mobility of the active generation
was relatively moderate in contrast to the turbulent changes of the transition.This phenomenon can better be described using the language of voluntary or involuntary actions, rather than ‘upward’ or ‘downward’ movement used inthe classical approach. Over the entire period, two-thirds of the male andthree-quarters of the female respondents were immobile in terms of occupa-tion. Over 20 per cent of men and nearly 15 per cent of women have been‘upwardly’ mobile in all aspects since 1988. However, there is a high num-
ber of ‘downwardly mobile’ workers who opted for an occupational statuswith lower prestige in return for higher material benefits. Altogether, over 10
per cent of the active generation have been forced into a ‘downward’ mobil-ity that has also generated a lower standard of living for them.
R EFERENCES
Bukodi, E. and Róbert, P. 2002: Men’s career mobility in Hungary during the 1990s. GLOBALIFE—Life Courses in the Globalization Process. Working Paper (38). Bamberg.
Fábián, Z., P. Róbert and P. Szivós 1998: ‘The social milieu of material-welfare statusgroups.’ In: Kolosi, T., I. Gy. Tóth, and Gy. Vukovich eds. Social Report 1998. Budapest:TÁRKI, pp. 72–91.
Fábián, Z., T. Kolosi and P. Róbert 2000: ‘Fogyasztás és életstílus. [Consumption and lifestyle]’. In: Kolosi, T., I. Gy. Tóth and Gy. Vukovich eds. Társadalmi riport 2000. [Social
Report 2000]. Budapest: TÁRKI, pp. 225–259.Ganzeboom, H. B. G. and D. Treiman 1996: ‘Internationally comparable measures of occupa-
tional status for the 1988 International Standard Classification of Occupations’, Social Science Research, vol. 25, no. 1.
Kolosi, T. 1987: Tagolt társadalom. [Structured Society]. Budapest: Gondolat.Kolosi, T. 2000: A terhes babapiskóta. Budapest: Osiris.Kolosi, T. and M. Sági 1998: ‘Hullámzó háztartások. [Fluctuating households]’. In: Kolosi,
T., I. Gy. Tóth and Gy. Vukovich eds. Társadalmi Riport 1998. [Social Report 1998].Budapest: TÁRKI, pp. 45–71.
8/3/2019 Social Report 2004 - Key Processes of Structural Transformation and Mobility in Hungarian Society Since the Fall of Communism
http://slidepdf.com/reader/full/social-report-2004-key-processes-of-structural-transformation-and-mobility 27/32
Key Processes of Structural Transformation and Mobility… 71
HCSO 1997: Mikrocenzus, 1996. A foglalkoztatottság alakulása, 1980–1996 [Micro-census,1996. Trends of Employment, 1980–1996 ]. Budapest: Központi Statisztikai Hivatal [Hun-garian Central Statistical Office].
HCSO 2003: Társadalmi helyzetkép, 2002. [ Report on the Hungarian Society 2002]. Buda- pest: Központi Statisztikai Hivatal [Hungarian Central Statistical Office].
Lenski, G. 1954: ‘Status crystallization: A non-vertical dimension of social status.’ AmericanSociological Review, vol. 19, no. 2.
Tóth, I. Gy. 2003: ‘Jövedelemegyenlőtlenségek: tényleg növekszenek vagy csak úgy látjuk?[Income inequalities: increasing or seem to be increased?]’. Közgazdasági Szemle, vol. 50,
pp. 209–234.

8/3/2019 Social Report 2004 - Key Processes of Structural Transformation and Mobility in Hungarian Society Since the Fall of Communism
http://slidepdf.com/reader/full/social-report-2004-key-processes-of-structural-transformation-and-mobility 28/32

8/3/2019 Social Report 2004 - Key Processes of Structural Transformation and Mobility in Hungarian Society Since the Fall of Communism
http://slidepdf.com/reader/full/social-report-2004-key-processes-of-structural-transformation-and-mobility 29/32
Social Report 2004, Budapest: TÁRKI, 2004 Tamás Kolosi, György Vukovich, István György Tóth eds.
Table of Contents
IntroductionTamás Kolosi, István György Tóth and György Vukovich
PART I: SOCIAL INDICATORS, SOCIAL STRUCTURE
1 Hungarian Society Reflected in Indicators(Erzsébet Bukodi, István Harcsa and György Vukovich)2 Key Processes of Structural Transformation and Mobility
in Hungarian Society since the Fall of Communism(Tamás Kolosi and Péter Róbert)
3 Income Composition and Inequalities, 1987–2003(István György Tóth)
4 Poverty in Hungary on the Eve of Entry to the EU(András Gábos and Péter Szivós)
PART II: DEMOGRAPHIC PROCESSES AND WELFARE SYSTEM 5 Hungarian Population Characteristics in the EU Context
(Gabriella Vukovich)6 Fertility Decline, Changes in Partnership Formation and Their Linkages
(Zsolt Spéder)7 Lifestyle and Well-being in the Elderly Population
(Edit S. Molnár)8 Effects of Intergenerational Public Transfers on Fertility: Test on Hungarian Data(Róbert Iván Gál and András Gábos)
9 Housing Conditions and State Assistance, 1999–2003(János Farkas, József Hegedüs and Gáborné Székely)
10 Educational Performance and Social Background in International Comparison(Péter Róbert)
PART III: LABOUR MARKET AND HOUSEHOLD ECONOMICS 11 Labour Market Trends, 2000–2003
(Gábor Kézdi, Hedvig Horváth, and Péter Hudomiet)12 Business Expectations of the Largest Exporters at the Beginning of 2004
(István János Tóth)13 Low Participation among Older Men and the Disincentive Effects
of Social Transfers: The Case of Hungary(Orsolya Lelkes and Ágota Scharle)14 Overeducation, Undereducation and Demand
(Péter Galasi)15 The Labour Market and Migration: Threat or Opportunity?
(Ágnes Hárs, Bori Simonovits and Endre Sik)16 General Characteristics of Household Consumption with Focus
on Two Fields of Expenditure(Anikó Bernát and Péter Szivós)

8/3/2019 Social Report 2004 - Key Processes of Structural Transformation and Mobility in Hungarian Society Since the Fall of Communism
http://slidepdf.com/reader/full/social-report-2004-key-processes-of-structural-transformation-and-mobility 30/32
PART IV: INFORMATION SOCIETY
17 Digital Inequality and Types of Info-communication Tool Use(Róbert Angelusz, Zoltán Fábián and Róbert Tardos)
18 The Spread of Information Technology: Objective and Subjective Obstacles(Tibor Dessewffy and Zsófia Rét)
19 The Development of Electronic Commerce in Hungaryand in Countries of the European Union(László Szabó)
20 E-government in Hungary Today(Teréz N. Vajdai)
PART V: MINORITY AND MAJORITY IN HUNGARY 21 Is Prejudice Growing in Hungary
(Zsolt Enyedi, Zoltán Fábián and Endre Sik)
22 The Income Situation of Gypsy Families(Béla Janky)23 Residential Segregation and Social Tensions in Hungarian Settlements
(Marianna Kopasz) 24 The Social Position of Immigrants
(Irén Gödri and Pál Péter Tóth)
PART VI: POLITICAL BEHAVIOUR, SOCIAL ATTITUDES 25 Trends in Party Choice after the Change in Government
(István Stumpf) 26 Public Support for EU Accession in Hungary
(Gergely Karácsony) 27 National Identity in Hungary at the Turn of the Millennium
(György Csepeli, Antal Örkény, Mária Székelyi and János Poór)
28 The Individual and Social Components of Insecurity(György Lengyel and Lilla Vicsek)

8/3/2019 Social Report 2004 - Key Processes of Structural Transformation and Mobility in Hungarian Society Since the Fall of Communism
http://slidepdf.com/reader/full/social-report-2004-key-processes-of-structural-transformation-and-mobility 31/32
------------------------------------------------------------------------------Cataloging in Publication Data
Social Report 2004 /ed. by Tamás Kolosi, István György Tóth,György Vukovich—Budapest: TÁRKI, 2004 487 p.
Society—Hungary—Social structure—Social indicators—Welfare systems Labour market—Information society—Migration—Election.
-------------------------------------------------------------------------------
Hard copies of the book can be ordered directly from TÁRKI.Order form: www.tarki.hu/
Contact information:Ilona Pallagi
H-1518 Budapest, Pf. 71., HungaryE-mail: [email protected]
8/3/2019 Social Report 2004 - Key Processes of Structural Transformation and Mobility in Hungarian Society Since the Fall of Communism
http://slidepdf.com/reader/full/social-report-2004-key-processes-of-structural-transformation-and-mobility 32/32
Research Areas: • social structure, labour market• income distribution, poverty, inequalities• social policy, welfare systems• boom study, economic attitudes•
election research, market research• survey methodology, statistical analyses• microsimulation implementation
References: • government agencies• international organizations• professional organizations• local councils• financial institutions• major companies
Services:
• non-profit public data archive with more than 650 databases• empirical surveys carried out with the help of highly qualified survey apparatus• acclaimed research results, wide-ranging training experience• revealing analyses, advance effect studies• occasional, half-yearly and yearly reports, Social Report,
TÁRKI Public Policy Discussion Papers
Contact Information for TÁRKI Social Research Centre:Address: Budaörsi út 45, H-1112 Budapest, HungaryPostal address:P.O. Box 71, H-1518 Budapest, HungaryPhone: +36 1 309-7676Fax: +36 1 309-7666E-mail: [email protected]
Internet: http://www.tarki.huUseful Addresses:President: Tamás Kolosi, [email protected] Director: István György Tóth, [email protected] Director: Tamás Rudas, [email protected] Dept: Matild Sági, [email protected] Archive Dept: Zoltán Fábián, [email protected] Manager: Katalin Werner, [email protected]