social protection: definitions, objectives and politics protection: definitions, objectives and...
TRANSCRIPT
Social Protection: Definitions, Objectives and Politics
Nicholas Freeland December 2012

Contents
• Background
• Conceptual framework
• Typology
• Links with food security
• [Impacts]
• Myths
• Politics
• Conclusion

Background
• Hunger is increasing as a result of global crises, despite sustained economic growth
• Achievement of MDGs is in doubt
• Poverty is a product of inequality within countries (>50% of the poor in MICs)
• Social protection is playing an increasingly important role in the response to vulnerability
• Transfers are politically acceptable to donors

Social Protection: shifting the development paradigm
• Traditional (the poor are the problem): – Focus development on economic growth
– Wait for economic growth to reduce poverty
– Residual interim safety nets
– Donor (expensive) emergency assistance where necessary
… IS NOT WORKING (in Africa)
• Emerging (the poor are the solution): – Provide comprehensive social protection
– Social protection will help to generate economic growth
– This will reduce poverty and the cost of social protection
– Reduced emergency assistance, freeing donor resources

Poverty Risk Agency Voice
VULNERABILITY =
Social Protection is a response to:

SP responds to/through:
Poverty
Needs
Provision
Risk
Shocks
Prevention
Agency
Potential
Promotion
Voice
Rights
Trans-formation

using different interventions:
Poverty Social
assistance
Food aid
Supplementary feeding
Old age grant
Risk Social
insurance
Unemployment benefit
Weather insurance
Burial society
Agency Social
empowerment
Asset transfers
Public works
School feeding
Voice Social justice
Labour laws
Health & safety
Anti-discrimination
Gender policy

with different drivers and players:
Poverty
Moral
Donors/ UN/ NGOs
Risk
Technical
Private sector/IFIs
Agency
Political
Govern-ment/IFIs
Voice
Ideological
NGOs/ civil
society

but common objectives:
Poverty
Equity
Reducing food
insecurity
Risk
Resilience
Improving resilience to
shocks
Agency
Opportunity
Increasing productive
capacity
Voice
?
Strength-ening
human capital

RESILIENCE =
Social Protection thereby builds:
Assets Risk Agency Voice

Types of social transfer Cash-based social transfers In-kind social transfers Cash transfers Food transfers Unconditional cash transfer School feeding Conditional cash transfer Take-home rations Cash-for-work/asset Targeted food transfers Labour-intensive public works Food-for-work/asset Food-for-training Preventive supplementary feeding
Near-cash transfers Commodity vouchers Value-based vouchers Food vouchers Other commodity vouchers
Grants Asset and input transfers Lump sum grant Livestock transfer Agricultural input transfer Asset transfer

Links with food security

Social transfers and FS: availability
• Seeds, tools and agricultural inputs
• Vouchers and fairs
• Asset/livelihood transfers
• Agricultural input subsidy programmes
• Public works programme assets:
– Irrigation
– Terracing
– Market/rural infrastructure

Social transfers and FS: access
• Short term – “Food assistance” (food/vouchers/coupons) – Cash transfers
• Medium term – Cash transfers – Lump-sum grants – Asset/livelihood transfers – Public works/employment guarantee programmes
• Long term – School meals – Conditional cash transfers (and unconditional!) – Social policy instruments (fee waivers; free education)

Social transfers and FS: utilisation
• Important contribution to improved nutrition
– Improved nutritional status (focus on first 1000 days, inc supplements and training)
– Improved diet
– School meals/take-home rations (esp combined with deworming and micronutrients)

Social transfers and FS: stability
• Response to sudden shocks – Scale up existing programmes
– Importance of indexing to retain value
• Response to cyclical stresses – Seasonal transfers
– Employment guarantee schemes
• Response to longer-term threats – State-building and stability
– DRR: increased resilience/reduced risks
– Climate change adaptation
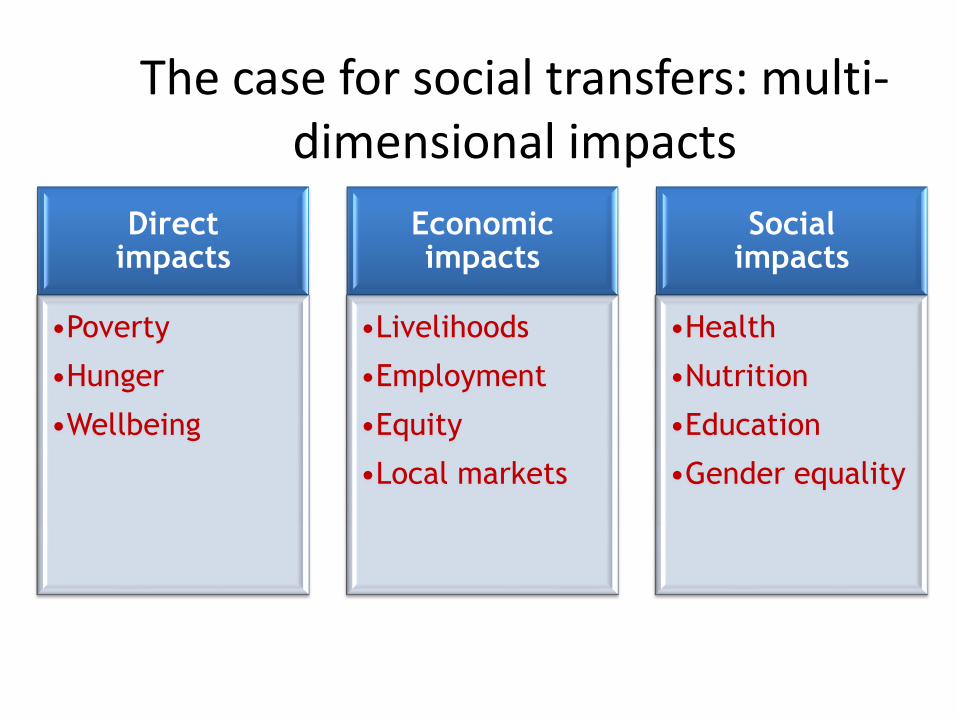
The case for social transfers: multi-dimensional impacts
Direct impacts
•Poverty
•Hunger
•Wellbeing
Economic impacts
•Livelihoods
•Employment
•Equity
•Local markets
Social impacts
•Health
•Nutrition
•Education
•Gender equality
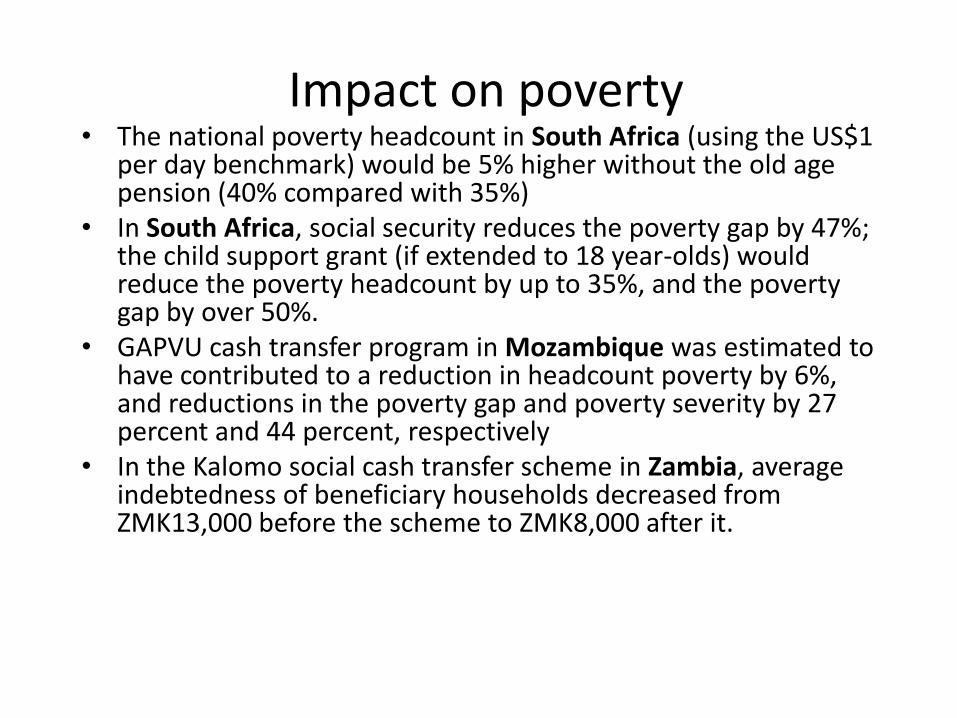
Impact on poverty • The national poverty headcount in South Africa (using the US$1
per day benchmark) would be 5% higher without the old age pension (40% compared with 35%)
• In South Africa, social security reduces the poverty gap by 47%; the child support grant (if extended to 18 year-olds) would reduce the poverty headcount by up to 35%, and the poverty gap by over 50%.
• GAPVU cash transfer program in Mozambique was estimated to have contributed to a reduction in headcount poverty by 6%, and reductions in the poverty gap and poverty severity by 27 percent and 44 percent, respectively
• In the Kalomo social cash transfer scheme in Zambia, average indebtedness of beneficiary households decreased from ZMK13,000 before the scheme to ZMK8,000 after it.

Impact on hunger • In Lesotho, between 50% and 80% of the old age pension is
spent on food. The percentage of Lesotho’s old age pensioners who reported that they “never went hungry” increased from 19% before the pension to 48% after it was introduced.
• In Malawi’s FACT Programme, 75.5% of the transfer was spent on basic needs (food and groceries)
• An extensive assessment of Ethiopia’s Productive Safety Net Programme (PSNP) finds that three-quarters of participants consumed a higher quantity and quality of food compared to the previous year, and were less likely to sell assets in order to buy food.
• In Zambia, as a result of receiving a cash transfer, 12% more households consumed proteins every day, and 35% more households consumed oil every day.
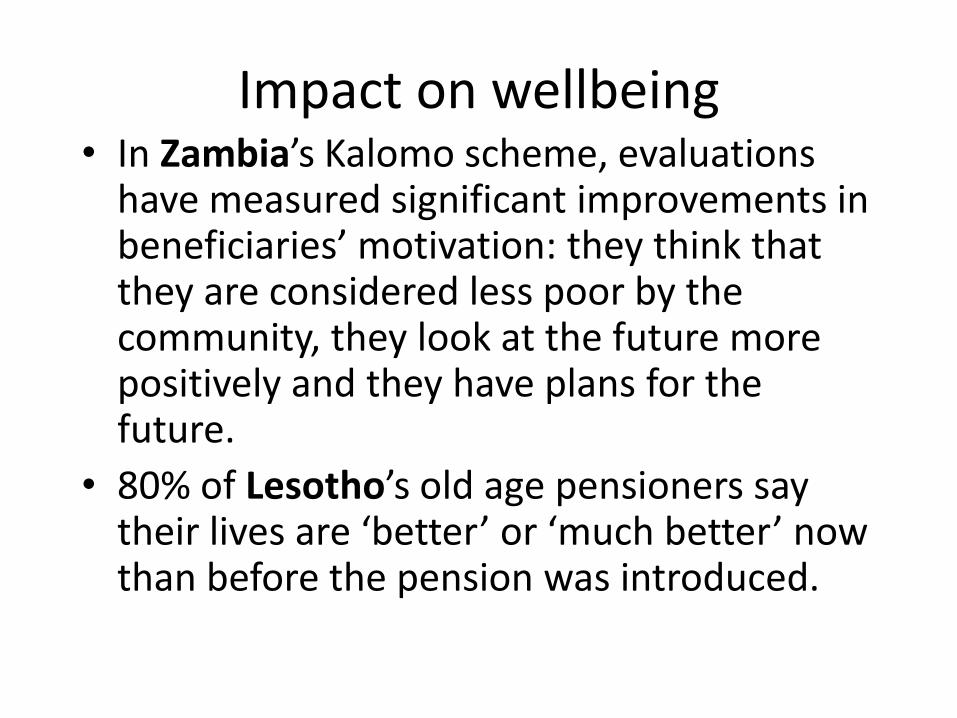
Impact on wellbeing • In Zambia’s Kalomo scheme, evaluations
have measured significant improvements in beneficiaries’ motivation: they think that they are considered less poor by the community, they look at the future more positively and they have plans for the future.
• 80% of Lesotho’s old age pensioners say their lives are ‘better’ or ‘much better’ now than before the pension was introduced.

Impact on livelihoods • Under the Kalomo social cash transfer scheme
in Zambia, 29% of income transferred was invested, either in purchases of livestock, farming inputs, or informal enterprises. – seven times as many households owned goats
– ownership of chickens increased by 15 percentage points
– households making investments quadrupled from roughly 14% to 50%
– average value of investment doubled
– 52% of households generated extra income
• In a DFID-supported asset transfer programme for ultra-poor women in Bangladesh, the value of the livestock provided by the asset transfer is estimated to be doubling every 18 months.

Impact on employment • An evaluation of the Mchinji cash transfer
programme in Malawi, found that 50% of recipients reported being more likely to produce crops since receiving the cash transfer.
• Research into the social pension in Lesotho shows that 18% of recipients spent part of their pension on creating jobs for other people.
• The number of recipients of the Basic Income Grant in Namibia involved in income-generating activities increased from 44% to 55% in a year.

Impact on equity • Data from the South African 2000 Income
and Expenditure Survey indicate that a full uptake of the state old age pension, disability grant, and child support grant would reduce the Gini coefficient (an indicator of the severity of income inequality in a country) from 63% to 60%.
• From 1995 to 2004, Brazil’s Gini coefficient fell from 60% to 57% - 25% of this was attributed to Bolsa Familia and the pension.
Impact on local markets • A study of the Dowa Emergency Cash Transfer (DECT) in Malawi
showed that for every $1 made as a social transfer, a regional multiplier of 2.02 to 2.45 was observed in the local economy, benefiting traders, suppliers, services and other non-recipients within the community and beyond.
• In Namibia the social pension has increased the volume of trade for grocery stores, and contributed to the growth of marketing infrastructure and trade nationwide.
• In Zambia 70% of social transfers is spent on locally-produced goods, increasing incentives for local businesses and infrastructure to develop.
• Positive effects on the market and stimulating the formation of new businesses have also been attributed to South Africa’s pension

Impact on health • Incidence of illnesses reduced from 42.8% to 35% in the
Zambia SCTs. Incidence of partial sightedness among beneficiary households reduced from 7.2% to 3.3% (potentially due to the fact that beneficiary households could afford minor eye surgery).
• Monthly income at the local clinic in the Nambia BIG pilot area increased fivefold, from N$250 to N$1300.
• In Malawi the DECT transfer allowed better purchasing power for health related expenses, and this was particularly important for groups with the weakest resistance to disease, such as those with HIV/AIDS.
• In South Africa, positive correlations are observed between households containing a pensioner, and a flush toilet and access to piped water.
Impact on nutrition • South Africa’s child support grant increased the
height of its beneficiaries by 3.5cm if it was paid during their first year and for two out of the three first years.
• Recipients of Namibia’s BIG improved in WHO weight-for-age scores from 42% underweight (Nov 07) to 17% underweight (Jun 08) to 10% underweight (Nov 08).
• In Bangladesh, BRAC’s Challenging the Frontiers of Poverty Reduction (CFPR) programme has led to an improvement in calorie intake from 1632 Kcal per day to 2236 Kcal per day

Impact on education • Using data from the national household survey in 2000
in South Africa, modelled data shows that household receipt of an OAP or CSG is associated with a 20 to 25 percent reduction in the non-attendance gap.
• In Lesotho, 50% of pensioners spend at least some of their transfer on education.
• In Brazil, participants in the Bolsa Familia programme are 63% less likely to drop out of school and 24% more likely to advance an additional year than comparable children in non-participant households.
• As a result of Namibia’s BIG pilot, school non-attendance due to financial reasons dropped by 42%, and drop-out rates fell from almost 40% to 5% in a year.

Impact on gender equality • In South Africa, the effects of social transfers on the
education of girls are strong. South Africa’s old age pension has also had particularly positive effects on girls’ nutritional status, with girls in recipient households an average of 3-4 centimetres taller than in non-recipient households.
• In Brazil, the impact of Bolsa Familia on women’s labour market participation is very strong – 16% greater than for women in similar non-participating households.
• In Bangladesh, the School Stipend programme has helped achieve gender parity in primary education.
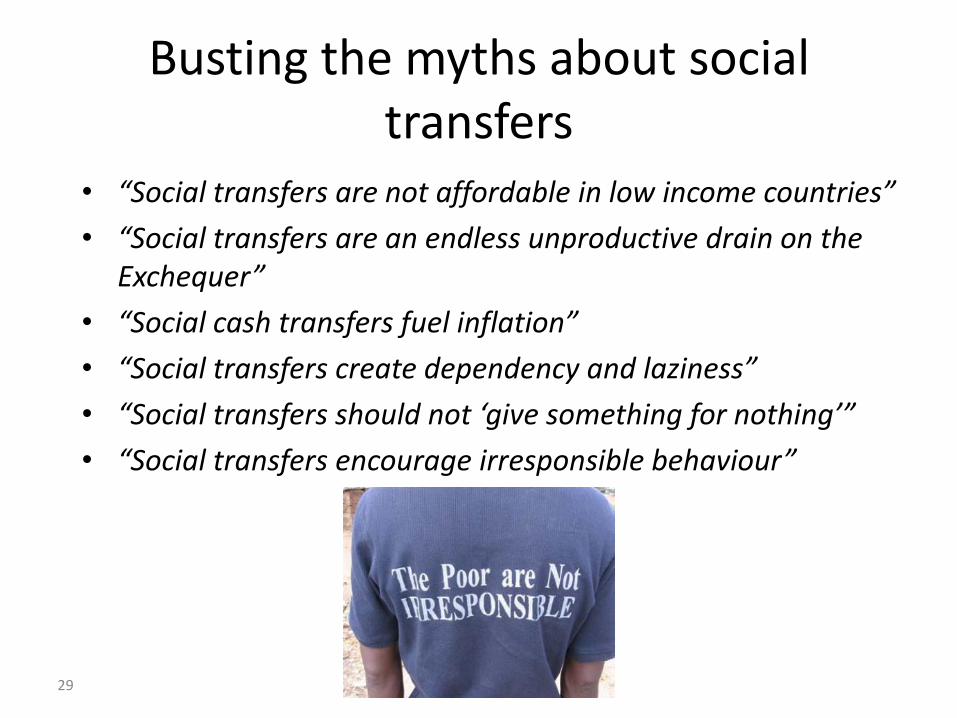
Busting the myths about social transfers
• “Social transfers are not affordable in low income countries”
• “Social transfers are an endless unproductive drain on the Exchequer”
• “Social cash transfers fuel inflation”
• “Social transfers create dependency and laziness”
• “Social transfers should not ‘give something for nothing’”
• “Social transfers encourage irresponsible behaviour”
29
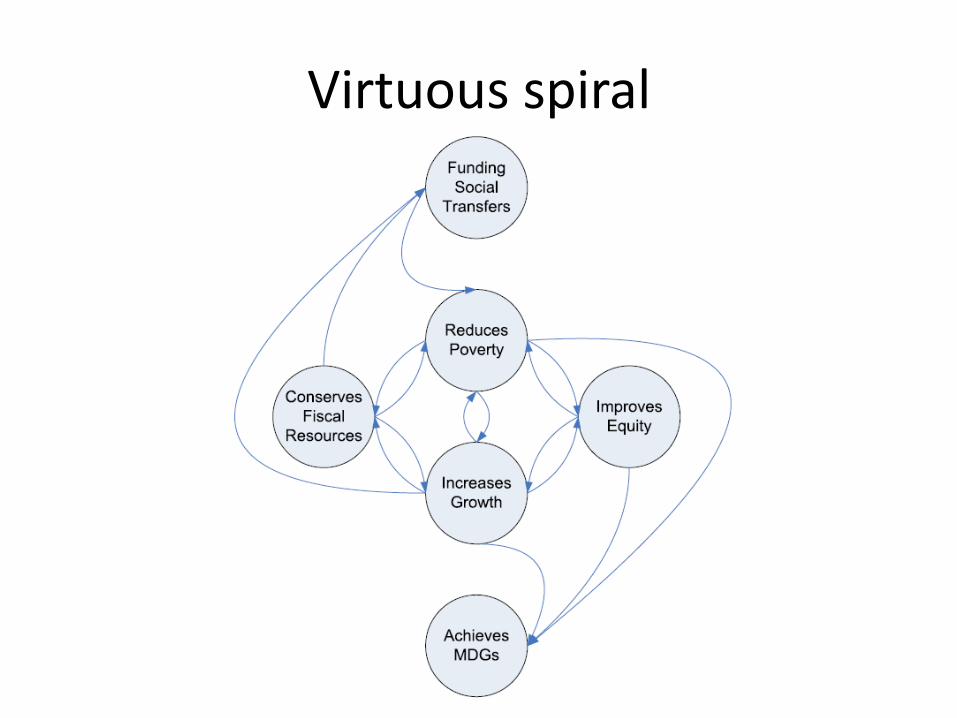
Virtuous spiral

Politics: “tea-party” social protection
• Rooted in a C19th “Anglo-Saxon” worldview of “poor relief” • Poverty-targeted, with scant resources focussed on the poor • Beneficiaries should do something in exchange for receiving the
benefit • Careful targeting, often through proxy means testing, community-
or self-selection • Impose a condition: either work (as on a public works or
employment guarantee scheme), or a set of behaviours (such as visiting a health clinic or sending a child to school)
• Emphasis on “graduation” and “exit strategy” • Key DP advocate: World Bank • Examples: Latin America’s CCTs; Ethiopia’s PSNP; Rwanda’s VUP

Politics: universal social protection
• Universal approach, akin to a Nordic view of social security • Emphasis on tackling inequality as a means of combating poverty • Support much broader “vulnerable groups”: PWD, elderly, children • Benefits to all (or almost all) in identified groups, even those that
are not poor • More inclusive, so more expensive approach; but more popular
with stronger political appeal, so ultimately better funded and fiscally sustainable
• Argument that the poor get a more valuable (and more sustainable) transfer than if a (much smaller) programme had been targeted exclusively at them
• Tend not to be conditional, but entitlement-based • Less emphasis on graduation, since exiting happens naturally • Proponents: ILO and UN agencies – Social Protection Floor • Examples: South Africa’s social grants; Lesotho’s old age pension;
India’s MGNREGA
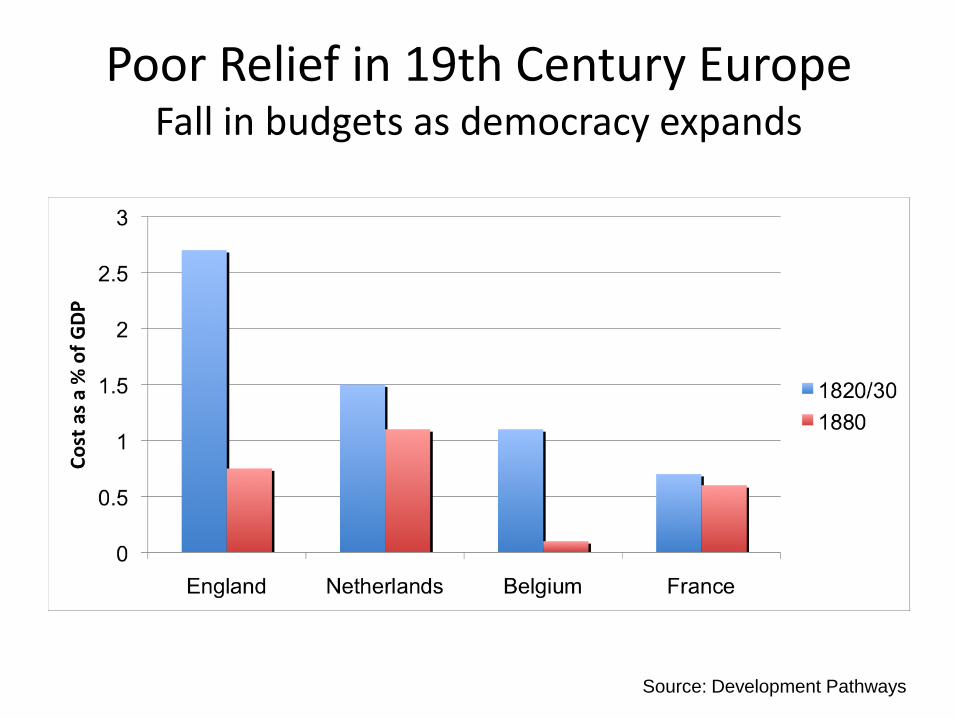
Poor Relief in 19th Century Europe Fall in budgets as democracy expands
Source: Development Pathways

Late 19th and early 20th Century: Growth in programs including middle class
Source: Development Pathways
State pension schemes:
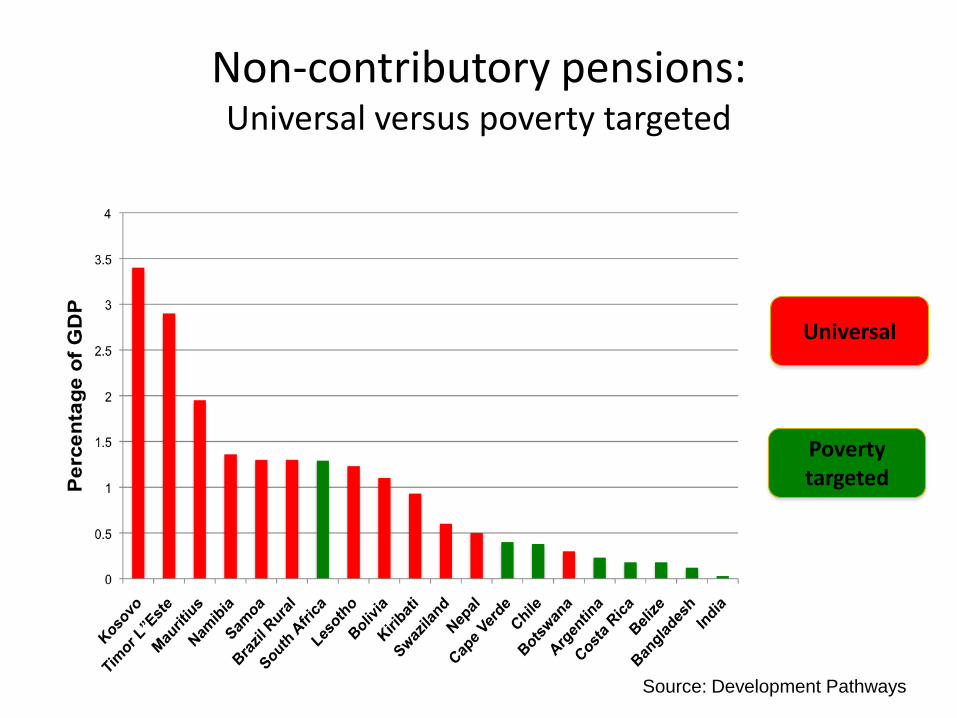
Non-contributory pensions: Universal versus poverty targeted
Universal
Poverty targeted
Source: Development Pathways

Benefit levels of non-contributory pension programs
Universal
Poverty targeted
Source: Development Pathways

Conclusions • Social protection is as political as it is technical
• Need to recognise that governments in developing countries do want to win elections
• If we want larger social protection programs, it will require the middle class and, potentially, the rich to be incorporated
• More expensive programs may be more sustainable
• The programs we design now should be aimed at delivering long-term political support for significant social spending • Targeting the poor through pilots will not deliver this
• Need to plan for a 20-30 year horizon and design programs that will deliver comprehensive social protection system within this time-frame; and not sabotage a more progressive vision by poor design of current programs

Thank you!

Typology of social protection
Social
Protection
Social
Transfers
Social
Assistance
Social
Insurance
Social
Develop
ment
Health
Social
Justice
Education
Free Basic
Health
Universal
Education

Chara
cte
rist
ic 4
:
Pre
dic
table
tra
nsf
er
SOCIAL
DEVELOPMENT
SOCIAL
PROTECTION
SOCIAL
ASSISTANCE
SOCIAL
TRANSFERS
Chara
cte
rist
ic 1
:
On-b
udget
Chara
cte
rist
ic 2
:
Pro
-poor
Chara
cte
rist
ic 3
:
Non-c
ontr
ibuto
ry
Four characteristics of social transfers

Universal approach and inequality
Quintile Average Income
Tax (40%)
Transfers Income after tax and transfers
5 1000 400 240 840
4 800 320 240 720
3 600 240 240 600
2 400 160 240 480
1 200 80 240 360
Ratio of 5:1
5/1 (=1200) (=1200) 2.33/1

Indonesia

Indonesia fuel subsidy reform

Targeting errors: In-built errors of proxy means test

45
Malawi Income Distribution, by Decile
1 2 3 4 5 6 7 8 9 10
Expenditure Deciles
0.0
5.0
10.0
15.0
(MK
'00
0 p
er
mo
nth
)
Pe
r C
ap
ita E
xpe
nd
iture
20
05
-06
Urban
Rural
Total


Leap-frogging
6 5 4 3 2 1
(in descending order)
Expenditure Deciles
0
4
8
12
16
Per C
apita C
onsum
ption (U
S$ p
er m
onth
)
$2 $4 $8

EVIDENCE
See also:
RHVP Evidence paper
DFID Evidence paper
www.socialtransfersevidence.org