social norms and rank-based nudging: changing …dspace.stir.ac.uk/bitstream/1893/23937/1/aldrovandi...
TRANSCRIPT
1
Social Norms and Rank-Based Nudging: Changing Willingness to Pay for Healthy Food
Reference: Aldrovandi, S., Brown, G. D. A., & Wood, A. M. (2015). Social Norms and Rank-
Based Nudging: Changing Willingness to Pay for Healthy Food. Journal of Experimental
Psychology: Applied, 21, 242-254.
Final version as submitted, pre-proofing, the copy of record and copyright reside with the
journal. This article may not exactly replicate the final version published in the APA journal.
It is not the copy of record
Author Note
Silvio Aldrovandi and Gordon D.A. Brown, Department of Psychology, University of
Warwick; Alex M. Wood, Behavioural Science Centre, Stirling Management School,
University of Stirling.
Silvio Aldrovandi is now at the Division of Psychology, Birmingham City University.
This work was supported by the Economic and Social Research Council [grant
numbers RES-062-23-2462, ES/K002201/1, and ES/K00588X/1] and the Leverhulme Trust
[grant number RP2012-V-022]. Some of the data were collected by Sabina Duonni (Study 1a)
and by Helen Griffiths and Hanna Winn (Study 2).
Correspondence concerning this article should be addressed to Silvio Aldrovandi,
Division of Psychology, Birmingham City University, Franchise Street, Birmingham, B42
2SU, United Kingdom.
Email: [email protected]

SOCIAL NORMS AND RANK-BASED NUDGING 2
Abstract
People’s evaluations in the domain of healthy eating are at least partly determined by the
choice context. We systematically test reference level and rank-based models of relative
comparisons against each other and explore their application to social norms nudging, an
intervention that aims at influencing consumers’ behavior by addressing their inaccurate
beliefs about their consumption relative to the consumption of others. Study 1 finds that the
rank of a product or behavior amongst others in the immediate comparison context, rather
than its objective attributes, influences its evaluation. Study 2 finds that when a comparator is
presented in isolation the same rank-based process occurs based on information retrieved
from memory. Study 3 finds that telling people how their consumption ranks within a
normative comparison sample increases willingness to pay for a healthy food by over 30%
relative to the normal social norms intervention that tells them how they compare to the
average. We conclude that social norms interventions should present rank information (e.g.,
“you are in the most unhealthy 10% of eaters”) rather than information relative to the average
(e.g., “you consume 500 calories more than the average person”).
Keywords: food perception; healthy eating; Decision by Sampling; Range Frequency
Theory; social norms marketing

SOCIAL NORMS AND RANK-BASED NUDGING 3
Social Norms and Rank-Based Nudging: Changing Willingness to Pay for Healthy Food
Despite extensive nutrition information campaigns and food labeling policies (e.g.,
Burton, Creyer, Kees, & Huggins, 2006; Freelands-Graves & Nitzke, 2002), the prevalence
of health-related issues arising from poor dietary choices is on the rise. It has been suggested
that one factor contributing to food overconsumption is the relative nature of people’s
evaluation of food products and their healthiness, which can lead to the same foods being
appraised differently depending on the other food options available in the decision-making
context (Chandon & Wansink, 2012; Chernev, 2011; Geier, Rozin, & Doros, 2006; Sharpe,
Staelin, & Huber, 2008; Wansink, Just, & Payne, 2009).
In the present study, we first contribute to this literature using the rank principle as
embodied in rank-based models such as Range Frequency Theory (RFT; Parducci, 1965) and
Decision by Sampling (DbS; Stewart, Chater, & Brown, 2006), which have previously been
applied in cognitive and social psychology. We extend the models here to both the
consumption and the broader consumer research (cf. also Niedrich, Sharma, & Wedell, 2001;
Niedrich, Weathers, Hill, & Bell, 2009). In doing so we explain how people’s evaluations and
purchase of products involve integration of information about a product with information on
rival products present in the choice context or retrieved from memory. Second, in direct tests
across three studies we advance theory in the field of consumers’ food choice by finding
support for the predictions of rank-based models rather than the extant dominant model
(based on reference level; Helson, 1947). Third, we show how to improve social norms
interventions, as commonly used in social marketing and public health, through a minor
reframing of the interventional messages to target people’s natural ways of processing
information as suggested by DbS and RFT.
Contextual Influence on Food Evaluation and Choice

SOCIAL NORMS AND RANK-BASED NUDGING 4
How do people assess the healthiness of their own diet or of the food they purchase?
If people make judgments purely in absolute terms, then the same food product will be
evaluated in the same way regardless of other food options available. However, people
perform poorly when making judgments based on the absolute magnitude of food or drink
portions. For example, if the size of a food portion is doubled, people usually report this
increase to be only around 50 to 70%. This bias is associated with higher likelihood of food
overconsumption, especially because of the increasingly widespread offers of larger package
sizes which are more profitable for food marketers (Chandon & Wansink, 2012).
In contrast to the absolute account, evidence from both cognitive (e.g., Stewart,
Brown, & Chater, 2005) and consumer psychology (e.g., Sharpe et al., 2008) has suggested
that people evaluate size in relative terms – that is, people are highly sensitive to the context
in which an evaluation (or a choice) is made. An individual product (e.g., a cereal bar, a ready
meal) is evaluated with reference to other products (e.g., other cereal bars, other ready meals)
available in the decision-making context – these can be labeled as effects of the immediate
context. In real world scenarios, it has been observed that people’s choices about food are
influenced by the sizes of available options. For example, in a menu with three drink options
(12, 16, and 24 fl. oz.), removing the 12 fl. oz. option leads around 25% of consumers who
previously chose a 16 fl. oz. drink to switch a larger one; the 16 fl. oz. option is chosen less
when it becomes the smallest available (Sharpe et al., 2008). Similar work has shown that
such context effects can lead to up to 30% differences in how much food is consumed
(Wansink et al., 2009). Context also affects taste; a sweetness that is judged ‘most pleasant’
in one context may be deemed unpleasantly sweet in another (Riskey, Parducci, &
Beauchamp, 1979). Finally, adding a healthy option can reduce the estimate of the number of
calories in an unhealthy food.

SOCIAL NORMS AND RANK-BASED NUDGING 5
Similarly, social norms approaches propose that people are influenced by another type
of contextual influence—the interpersonal context—which are the norms that people derive
when they compare themselves to others (Campbell, 1964; Henrich et al., 2001; Wansink,
2004). A person consumes more or less food depending on how much other people around
them are consuming (Herman, Roth, & Polivy, 2003; Wansink et al., 2009). Also, people
evaluate their own eating habits by comparing them to what they think other people
(especially relevant others, like friends and family) consume (similarly to what people do
when they decide whether to pay taxes or not; Posner, 2000).
Models of Relative Judgment
Thus, immediate and interpersonal contexts lead to a variety of effects including; (a)
biased estimation of information about a given food (e.g., how many calories it contains,
consequences of consumption), and (b) changes in behavior (e.g., product purchase, amount
consumed). These context effects reflect cognitive processes of judgment and choice
(Wansink et al., 2009).
Reference-level accounts, derived from Adaptation Level Theory (ALT; Helson,
1964) suggest that judgments of a stimulus depend on how its magnitude compares to a
single reference point. For example, a person may judge the healthiness of a sandwich based
on how its fat, calorie, sugar, and salt content compares to that of a single ‘typical’, ‘average’,
‘prototypical’, or ‘reference’ sandwich. People are hypothesized to form an internalized
reference point (the ‘adaptation level’) derived from both the current context (sandwiches on
the menu) and prior context retrieved from memory (previously encountered sandwiches).
The healthiness of the product under consideration will then be judged against the adaptation
level, which here is operationalized as the mean of remembered quantities or items available
in the decision-making context. The theory proposes that people continually update their
adaptation level, so that new relevant information (e.g., a particularly calorific sandwich on a

SOCIAL NORMS AND RANK-BASED NUDGING 6
menu) will shift the adaptation level upwards or downwards depending on its size. Reference-
level effects have been observed in different domains. For instance, recent models suggest
that income is evaluated relative to a reference level (Clark & Oswald, 1996), although where
such demonstrations have been made they have typically not controlled for the predictions of
alternative rank-based models of judgment.
The Decision by Sampling (DbS; Stewart et al., 2006) model suggests that when
people make judgments about the magnitude of a target they are influenced by the rank
principle – that is, people appear to be sensitive to how a quantity ranks within a given
context. DbS extends earlier accounts such as Range Frequency Theory (Parducci, 1965) both
in specifying the underlying process giving rise to rank-based comparison and in emphasizing
the role of samples drawn from long-term memory in forming a context of comparison.
Consider how a person would evaluate the healthiness of a sandwich that has 560
calories. DbS suggests that when a judgment is made, people sample from memory and from
the decision-making context in order to make a relative judgment based on binary ordinal
comparison. People would retrieve calorie-content information from memory and look at the
labels of other sandwiches on display; for example, one might think of half a dozen
sandwiches that contained fewer calories, but only one or two with higher calorific content.
The subjective evaluation of the healthiness of the sandwich is assumed to be directly
determined by its relative rank value within this sample. As a consequence, if different
samples are retrieved from memory or available in the decision-making context, the same
content might be regarded very differently. DbS provides a plausible description of the
psychological processes underlying judgment formation. RFT works efficiently as a
descriptive account of judgments in context; however, it seems unlikely that people would
keep in memory the entire distribution of values they had encountered in a given domain as
would be needed to compute relative rank accurately (although see Parducci, 1992).

SOCIAL NORMS AND RANK-BASED NUDGING 7
However, the present paradigm was not designed to test the predictions of DbS against those
of RFT, and thus we will refer to the broader class of rank-based models.
Rank effects have been observed for the evaluation of different entities, ranging from
psychophysical stimuli (Parducci & Perrett, 1971) to cognitive and social quantities such as
satisfaction with body image (Wedell, Santoyo, & Pettibone, 2005), wages (Brown, Gardner,
Oswald, & Qian, 2008; Hagerty, 2000), health and well-being (Boyce, Brown, & Moore,
2010; Boyce & Wood, in press; Wood, Boyce, Moore, & Brown, 2012), gratitude (Wood,
Brown, & Maltby, 2011), satisfaction with educational provision (Brown, Wood, Ogden, &
Maltby, 2015), fairness of sentencing (Aldrovandi, Wood, & Brown, 2013), indebtedness
(Aldrovandi, Wood, Maltby, & Brown, in press), and perception of health risks due to alcohol
consumption (Wood, Brown, & Maltby, 2012). However, the implications of the rank-based
models have not been explored within the literature on food evaluation or within the
marketing and consumer research literature more generally (although see Niedrich et al.,
2001; Niedrich et al., 2009). In these literatures, the reference level account still
predominates.
Social Norms and Practical Implications
Rank-based and reference-level accounts both address context effects in judgment and
decision-making, but they make different predictions about people’s evaluations of food
products and have different implications for the design of interventions to nudge healthy food
consumption.
Recently behavioral ‘nudging’, a method for guiding and influencing consumer’s
behavior by shaping the environment but without unduly restricting their freedom of choice
(Thaler & Sunstein, 2008), has been implemented within the social norms framework
(Agostinelli, Brown, & Miller, 1995). Indeed, many behavioral ‘nudges’ provide social norm
information and have been found to induce behavior change in a variety of contexts such as
SOCIAL NORMS AND RANK-BASED NUDGING 8
energy consumption (Ayres, Raseman, & Shih, 2013; Schultz, Nolan, Cialdini, Goldstein, &
Griskevicius, 2007) and recycling (Goldstein, Cialdini, & Griskevicius, 2008). Social norm
approaches propose that people evaluate and choose their own behavior at least partly with
reference to their beliefs, which are often inaccurate (Prentice & Miller, 1993), about what
other people do. To address these inaccurate beliefs, norm-based nudging interventions
typically expose people to normative information about what other people actually do. This
information can cause an individual’s behavior to move towards the social norm, because of a
preference for social conformity (Festinger, 1957) or because of an assumption that others’
behavior is informed by additional knowledge that the individual does not have
(Bikhchandani, Hirshleifer, & Welch, 1992).
Beneficial effects are however sometimes small in magnitude (Loewenstein & Ubel,
2010), population-specific (Beshears, Choi, Laibson, Madrian, & Milkman, 2011; Costa &
Kahn, 2013) or absent (Russell, Clapp, & DeJong, 2005; Werch et al., 2000). Informed by the
rank-based models, we hypothesize that the behavior-changing effect of social norms will
depend on precisely what information is presented.
Many interventions provide information about mean levels of others’ behavior
(Moreira, Smith, & Foxcroft, 2009; Schultz et al., 2007); such interventions can be seen as
deriving from reference-level accounts (Helson, 1964). Applied to social norms, reference-
level approaches could provide support for the idea that people judge the level of their own
behavior (e.g., amount of energy consumption) with reference to the mean of the social
distribution of levels of such behavior.
However, the contextual effects reviewed in the previous section suggest that the
provision of mean-based social norms may not resonate with people’s natural ways of making
subjective judgments about their own behavior. Thus, motivated by rank-based models, we
examine whether rank-based nudging (“90% of people consume less chocolate than you do”)

SOCIAL NORMS AND RANK-BASED NUDGING 9
will be more effective than mean-based nudging (“you eat 5 bars of chocolate per week; on
average, other people consume 3 bars per week”) in influencing consumers’ choices about
food products. DbS suggests that nudging based on social rank information might be more
influential than mean-based nudging because it is beliefs about rank that determine
judgments. Intuitively, telling someone only the average level of a behavior provides
relatively impoverished social norm information: A consumption of five chocolate bars a
week relative to a mean of three might place a consumer in the top 10% of consumers, or in
the top 40%, depending on the variance in consumption.
The Present Studies
Attributions regarding health eating can involve both product evaluations and one’s
own consumption. We predict that judgments regarding the attributes of products will be
made relative to the rank position of the product amongst others that are (a) either present in
the actual environment, or (b) retrieved from memory. Similarly, we predict that judgments
of one’s own consumption will be made relative to the rank position of one’s consumption
amongst other people’s, again involving individuals present in the environment or retrieved
from memory. Studies 1a and 1b manipulate the context in which products or people’s
consumption is presented to experimentally test our predictions regarding rank based
contextual effects. Study 2 tests whether the same process occurs in the absence of
experimentally provided contextual cues, where one’s own consumption is judged relative to
a sample of other people retrieved from memory. Finally, Study 3 presents a proof-of-concept
intervention, testing whether telling people the rank of the consumption relative to others may
improve the effectiveness of a social norms intervention relative to the normal presentation of
information which focuses on providing nutritional information or how one’s consumption
differs from the mean.
Study 1a: Evaluating Food Healthiness

SOCIAL NORMS AND RANK-BASED NUDGING 10
Study 1a tests (a) whether people’s evaluation of the healthiness of a given ready meal
(or cereal) will depend on what other products are viewed at the same time (as on a
supermarket shelf or in an advertisement), and (b) whether rank- or mean-based models can
explain how these contextual effects occur. To achieve this, we experimentally manipulated
the rank position of a given product content of salt, fat, and sugar relative to other products
viewed at the same time. The rank principle was tested for three different products, in order
to increase the generalizability of the results. Participants considered either the salt or fat
content of ready meals, or the content of sugar for different cereals. An additional outcome
variable measured calorific content; however, as data for the latter showed ceiling effects,
they were not further analyzed.
Method
Participants. A total of 72 undergraduate students (47 females) from a large public
university volunteered to take part in this study. Participants’ ages ranged from 18 to 49 years
(M = 21.65, SD = 2.94). Students were enrolled in a variety of undergraduate courses; most
students were White (88.33%).
Design and procedure. Participants filled in a 3-page questionnaire, one for each
different product type (i.e., first ready meal, second ready meal and cereals). On each page,
11 different food items were presented, each with a different content of either salt, fat or
sugar (the latter for cereals). For each item, participants were asked to rate its healthiness, on
a 1 (“Very healthy”) to 7 (“Very unhealthy”) Likert scale.
To test DbS and ALT, the distribution of the 11 amounts of content of each substance
was manipulated between subjects in order to create two different distributions of the stimuli.
Different participants also saw two other distributions of stimuli to examine hypotheses not
examined in the present paper; the results from these are not reported here. The substance
content in these two distributions is different, with the exception of five amounts which are

SOCIAL NORMS AND RANK-BASED NUDGING 11
presented in both the first (distribution A or unimodal) and second (distribution B or bimodal)
distributions (the five ‘common points’).
Consider the example of salt content (in grams) for ready meals (see Figure 1 below).
The smallest amount (1.40g; common point 1) was the same in both distributions. This
amount has also the same rank position within both distributions (i.e. its rank is equal to 1)
and is the same distance from the mean (3.40g) of the set. Therefore no differences in
participants’ responses are predicted according to both the absolute and relative accounts of
food judgments. The second common point is 2.40g; in distribution A, 2.40g ranks as the 2nd
lowest (i.e. rank = 2)—while it ranks as the 5th in the distribution B (rank = 5). If rank
determines people’s evaluations about food, the perceived healthiness of a ready meal
containing 2.40g should be lower in distribution B than in distribution A, despite the fact that
the content of salt is the same for both ready meals. Also, as 2.40g is the same distance from
the distribution’s mean (i.e., it contains 1.00g less than the mean amount of 3.40g), any
difference in perceived healthiness for 2.40g cannot be readily explained by reference-level
theories.
The distribution mean (3.40g) is the third common point; both its value and its rank
position (rank = 6) are the same in both distributions; hence, as for the first common point, no
differences in participants’ responses are predicted according to both the absolute and relative
accounts of food judgments. Conversely, 4.30g (common point 4) ranks lower in distribution
B (rank = 7) than in distribution A (rank = 10)—hence according to rank-based models it
should be rated as more unhealthy in distribution A; mean-based accounts on the other hand
would predict no differences between the two distributions, as the distance of the fourth
common point from the mean of both distributions is the same (i.e. it is 0.90g heavier than the
mean). Finally, the largest amount (5.30g) is the fifth common point, and its rank is the same

SOCIAL NORMS AND RANK-BASED NUDGING 12
for both distributions (rank = 11); as for the first and third common points, participants are
expected to rate this amount as equally unhealthy in both distributions.
We removed from the analyses participants who responded erratically (see also
Melrose, Brown, & Wood, 2013). Specifically, we excluded participants when (1) the
Kendall’s τ coefficient between stimuli (i.e., the 11 food items) and responses (i.e.,
participants’ ratings for the 11 items) was < .50; such results were mostly likely due to
participants misunderstanding the instructions, for example by (a) assigning progressively
low unhealthiness ratings to food items progressively high in content of salt, fat, and sugar –
and vice versa – which would cause the τ coefficient to be negative and (b) assigning high
ratings to high contents and middle ratings for middle contents, only to assign again high
ratings for low contents; this would lead τ coefficients to be positive but small in size. We
also excluded participants if (2) the response range for their ratings within each food domain
was < 1.00; this criterion ensured that we could remove from the analyses those participants
who provided the same unhealthiness ratings regardless of the salt, fat and sugar content
under consideration. Application of these criteria resulted in exclusions of 6.94%, 4.17% and
11.11% of participants for salt, sugar and fat contents, respectively. The results were however
qualitatively the same when all participants were included in the analyses.
Product scenario (first and second ready meal, cereals) was manipulated within-
subjects. The presentation order of the products scenarios was counterbalanced across
participants through a Latin square design. The order in which the 11 amounts were presented
to each participant was manipulated between-subjects and counterbalanced across products;
in the ascending order condition the first of the 11 amounts presented was the smallest, while
the opposite was true for the descending order condition.
Results and Brief Discussion
SOCIAL NORMS AND RANK-BASED NUDGING 13
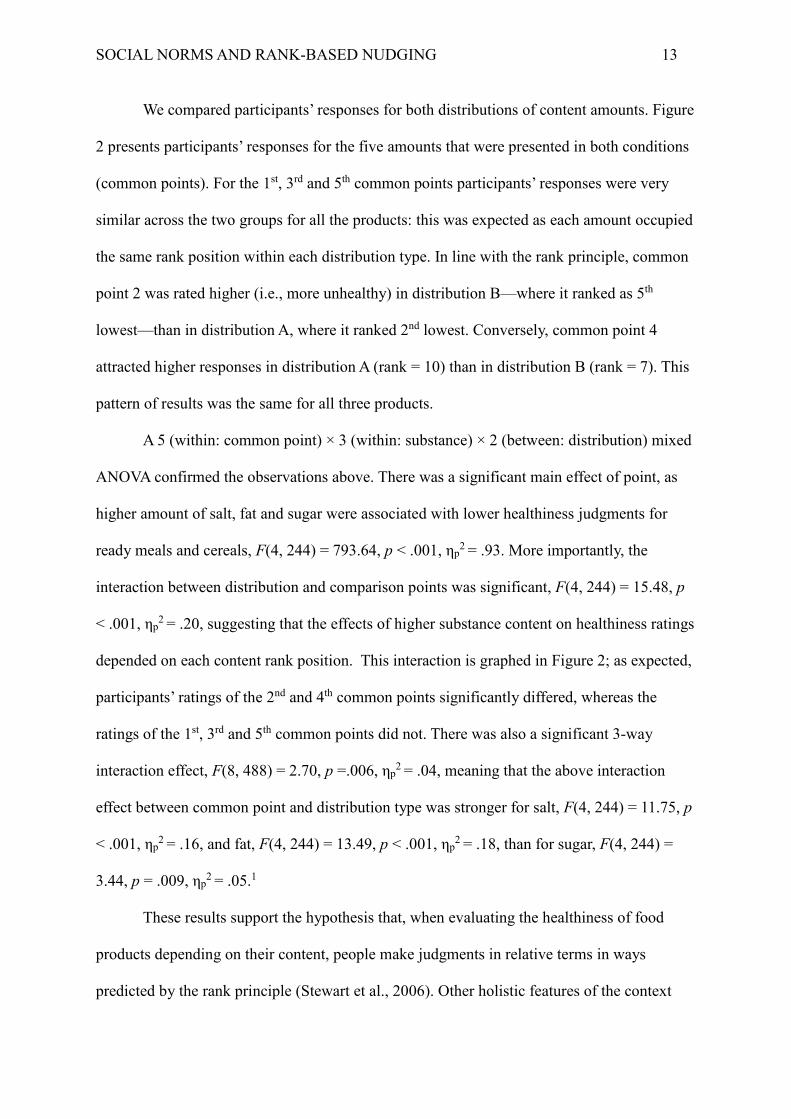
We compared participants’ responses for both distributions of content amounts. Figure
2 presents participants’ responses for the five amounts that were presented in both conditions
(common points). For the 1st, 3rd and 5th common points participants’ responses were very
similar across the two groups for all the products: this was expected as each amount occupied
the same rank position within each distribution type. In line with the rank principle, common
point 2 was rated higher (i.e., more unhealthy) in distribution B—where it ranked as 5th
lowest—than in distribution A, where it ranked 2nd lowest. Conversely, common point 4
attracted higher responses in distribution A (rank = 10) than in distribution B (rank = 7). This
pattern of results was the same for all three products.
A 5 (within: common point) × 3 (within: substance) × 2 (between: distribution) mixed
ANOVA confirmed the observations above. There was a significant main effect of point, as
higher amount of salt, fat and sugar were associated with lower healthiness judgments for
ready meals and cereals, F(4, 244) = 793.64, p < .001, ηp2 = .93. More importantly, the
interaction between distribution and comparison points was significant, F(4, 244) = 15.48, p
< .001, ηp2 = .20, suggesting that the effects of higher substance content on healthiness ratings
depended on each content rank position. This interaction is graphed in Figure 2; as expected,
participants’ ratings of the 2nd and 4th common points significantly differed, whereas the
ratings of the 1st, 3rd and 5th common points did not. There was also a significant 3-way
interaction effect, F(8, 488) = 2.70, p =.006, ηp2 = .04, meaning that the above interaction
effect between common point and distribution type was stronger for salt, F(4, 244) = 11.75, p
< .001, ηp2 = .16, and fat, F(4, 244) = 13.49, p < .001, ηp
2 = .18, than for sugar, F(4, 244) =
3.44, p = .009, ηp2 = .05.1
These results support the hypothesis that, when evaluating the healthiness of food
products depending on their content, people make judgments in relative terms in ways
predicted by the rank principle (Stewart et al., 2006). Other holistic features of the context

SOCIAL NORMS AND RANK-BASED NUDGING 14
(e.g., content average) did not play a role, thus no empirical support was observed for
alternative theories such as reference-level approaches (ALT; Helson, 1947).
Study 1b: Perceived Health Risks
Study 1a showed that the perceived healthiness of a product is heavily determined by
the information available in the decision-making context. Study 1b, using the same
procedure, extended these findings to another important category of food-related judgments
— the perceived health risk as a result of food intake. Participants were asked to rate the
perceived likelihood that 11 different people would suffer a health-related illness (e.g., a
stroke) as a result of a daily intake of different amounts of salt, fat and sugar. As in Study 1a,
different participants also saw two other distributions of stimuli to examine hypotheses not
examined in the present paper; the results from these are not reported here.
Method
Participants. A total of 42 undergraduate students (26 females) from a large public
university in the UK volunteered to take part in this study. Participants’ ages ranged from 18
to 41 years (M = 20.10, SD = 4.53). Students were enrolled in a large variety of
undergraduate courses; roughly equal proportions were in either their 1st, 2nd or 3rd year of
study. The majority of participants were of White background (64.29%), while smaller
proportions were of Chinese (14.29%) and Indian (11.90%) backgrounds.
Design and procedure. The method and procedure were similar to those of Study 1a.
The participants’ task was to rate the likelihood that each of 11 different people—who
differed for the daily intake of either salt, fat or sugar—would have a myocardial infarction
(for fat), a stroke (for salt), or a generic health difficulty (for sugar). For example, for fat
intake, participants indicated the likelihood (as a percentage) in response to the question: “For
each person, please indicate the % chance that each person would suffer a myocardial

SOCIAL NORMS AND RANK-BASED NUDGING 15
infarction (commonly known as a heart attack)”. As in Study 1, the comparison between
distributions A and B allowed us to test the rank principle (see Table 1 below).
As in Study 1a, participants who provided erratic responses were excluded from the
analyses (9.52%, 4.76% and 7.14% for salt, sugar and fat conditions, respectively), as either
(a) the Kendall’s τ coefficient between stimuli and responses was < .50 or (b) the response
range for their ratings within each question scenario was < 5 (i.e. 5% of the possible range of
100). Again, the results were the same when all participants were included in the analyses.
Results and Brief Discussion
Figure 3 presents the estimated percentage likelihood of health-related risks due to
food intake for the five common points. As in Study 1a, the 1st, 3rd and 5th common points
attracted similar responses; moreover, the same interaction as in Study 1a was observed,
whereby the 2nd common point attracted higher ratings in distribution B, while the 5th
common point was rated as riskier in distribution A than in distribution B.
A 5 (within: common point) × 3 (within: substance) × 2 (between: distribution) mixed
ANOVA confirmed the observations above. As in Study 1 there was a significant main effect
of point, F(4, 128) = 199.74, p < .001, ηp2 = .86. More importantly, the interaction between
distribution and comparison points was significant, F(4, 128) = 4.82, p = .001, ηp2 = .13,
confirming that the effects of higher substance content on healthiness ratings depended on
each content’s rank position. This interaction is graphed in Figure 3; the 95% confidence
intervals for a group that do not bound the mean of the other group indicate statistically
significant differences —hence, as expected, participants’ ratings of the 2nd and 4th common
points significantly differed, whereas the ratings of the 1st, 3rd and 5th common points did not.
As the 3-way interaction was not significant, F(8, 256) = 1.02, p = .418, there was no
evidence that the effect differed across the three substances.2

SOCIAL NORMS AND RANK-BASED NUDGING 16
The results of Study 1b support the conclusions drawn in Study 1a, as the rank
principle determined how participants perceived the risk of consuming given amounts of
food. No support was observed for either an absolute approach or for reference-level accounts
of judgment.
Study 2: Social Norms Comparisons
This study tests whether the rank-based model holds when the context is not
represented by other products available at the time of a choice is elicited, but rather the
context is the beliefs that the consumer holds in memory. Such a procedure may more closely
resemble real-world valuations, in which there may be no comparison items physically
present. We elicited participants’ perceived distribution of food consumption behavior,
specifically how much they think other people consume. As well as looking at a different type
of context effects, this study ensures that the previously observed results are not simply an
artifact of study design, and that the model holds when questions are based on distributions
provided by participants.
In this study, participants reported their weekly consumption of coffee, chocolate, and
pizza as well as their attitudes towards consumption. However, as weekly consumption
quantities for the latter were very small, data for pizza consumption were not included. We
elicited from each participant their beliefs about the social distribution of amounts of
consumption of each product. It was hypothesized that individuals’ (likely often erroneous)
beliefs about their ranked position of their consumption of the products—rather than their
beliefs about mean consumption levels, as would be predicted by ALT—will predict their
concern about coffee and chocolate consumption.
Method
Participants. A total of 201 undergraduate students (138 females) from a large public
university volunteered for the study. Participants’ ages ranged from 18 to 44 years (M =
SOCIAL NORMS AND RANK-BASED NUDGING 17
20.78, SD = 2.43); 77.11% were of White ethnic origin, followed by Chinese (5.97%) and
Indian (4.98%) ethnicities.
Design and procedure. Participants filled in questionnaires individually. Participants
first reported their weight and height, to enable computation of body-mass index (BMI).
Next, a task elicited participants’ beliefs about the social distribution of consumption of each
of two products. There are different ways to elicit probability distributions (Manski, 2004);
here, based on pilot work to establish the easiest method for students, we asked participants
to estimate different percentiles points of the distribution (Melrose et al., 2013). Nine
questions were phrased as follows: “The highest consuming x% of students drink more (eat
more) than ___ cups of coffee (bars of chocolate) per week”, where x had values of [10, 20,
30, 40, 50, 60, 70, 80, and 90]. Participants provided estimates for each of the nine percentile
points. Results were checked using the same exclusion criteria as in previous studies, and
data from approximately 20% of participants were excluded from the analyses (40 for coffee
and 41 for chocolate). As before, results were qualitatively the same when all participants
were included in the analyses.
Next, participants reported how many cups of coffee (chocolate bars) they drank (ate)
per week on average (‘own consumption’). Finally, concern about own consumption was
measured. Participants answered two questions: “How high do you think your consumption
of coffee (chocolate) is” on a 1 (“Very low”) to 7 (“Excessive”) point scale; and “How
concerned are you with your level of coffee drinking (chocolate eating)?” on a on a 1 (“Not at
all concerned”) to 7 (“Very concerned”) point scale.
Statistical analyses. To compute the rank position of each participant within what she
believed to be the distribution of consumption, we fitted a cumulative distribution function,
separately for each participant, to the 9 percentile estimates for each product. We chose either
a lognormal function or a linear function depending on which fitted best. We then computed

SOCIAL NORMS AND RANK-BASED NUDGING 18
for each participant (a) the mean of the elicited cumulative distribution (‘subjective mean’)
and (b) the relative rank position of each participant’s consumption within such distribution
(‘subjective rank’).
Results and Brief Discussion
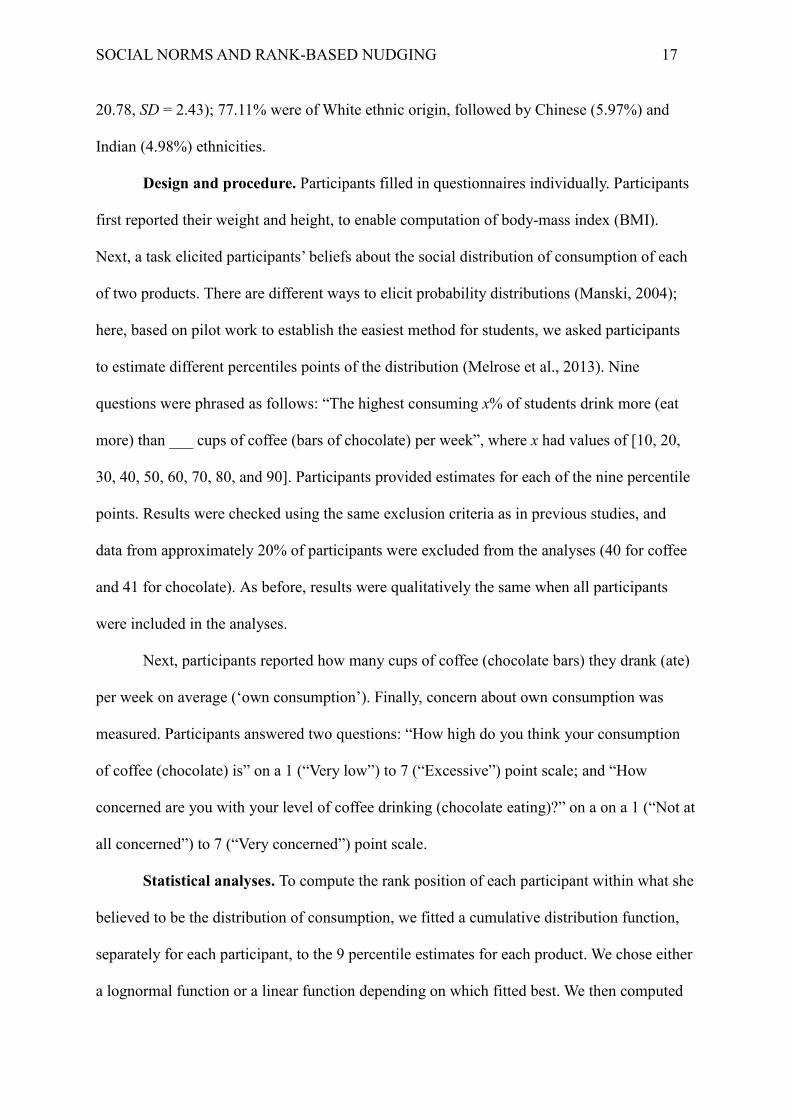
Estimating coffee and chocolate consumption. Students greatly overestimated the
consumption of others (see Figure 4 below) and underestimated their own rank position
within the true consumption distribution. On average, students believed that 70% of students
consumed more of the two products than they did themselves: Subjective rank was well
below .50 for coffee (M = .35, SD = .25; interquartile range, IQR = [.15, .52]) and chocolate
(M = .25, SD = .20; IQR = [.10, .33]).
The large variation in beliefs about other people’s consumption is exemplified in
Figure 6, which shows the beliefs about the number of bars of chocolate consumed by other
students for participants 68 and 190. Although participant 190 consumed more bars of
chocolate per week than did participant 68, she believed that only 20% of students consumed
less than she did herself (whereas the subjective rank for participant 68 was above .50),
and—as predicted—she reported lower concern about her own chocolate consumption.
Predicting attitudes towards food consumption. We ran ordinal regression analyses
to predict students’ attitudes towards their diet (i.e., how high they considered their
consumption, and how concerned they were about it). Predictors were ‘subjective rank’,
‘subjective mean’, and ‘own consumption’; control variables were BMI, gender (1=Females,
2=Males), and age.
Table 2 shows that the results were as predicted by the rank-based models. Judgments
about own consumption were predicted by own consumption level and subjective rank, but
not by beliefs about mean consumption within the social comparison group (with the
exception of concern about own coffee consumption). An additional effect was observed for

SOCIAL NORMS AND RANK-BASED NUDGING 19
gender, whereby male students generally reported lower level of concern for chocolate and
coffee consumption than did female students.3 The regression models were further analyzed
as suggested in Andraszewicz et al. (2014). In particular, the full regression model (f)
including the critical predictor (subjective rank) was compared to the constraint model (c)
that excluded it (i.e., the model that included only own consumption, subjective mean, age,
gender and BMI as the predictors) for each of the four outcome variable. The analyses
showed that for chocolate, the evidence in favor of the full model was anecdotal (BFfc = 0.57
and BFfc = 0.34 for high consumption and concern about consumption, respectively). On the
other hand, the results for coffee consumption provided moderate evidence for the full model
(BFfc = 0.14 and BFfc = 0.12 for high consumption and concern about consumption,
respectively). Thus for chocolate consumption the evidence in favor of rank-based models
was somewhat weaker than for coffee consumption, although the qualitative pattern of data
was similar. It may be that participants’ prior knowledge about daily recommendations for
sugar intake may have moderate the observed contextual effect, although further research
could address this issue directly.
We also analyzed the moderating roles of gender and BMI on the relative rank effects
we observed; however, no moderating effects were found. For instance, we analyzed whether
gender moderated the effects of rank on participants’ perception of the healthiness of their
own consumption of chocolate and coffee. We did so by adding to the regression equation the
term gender by subjective rank, this interaction term never reaching significance (all ps >
.185). Similarly, when the term BMI by subjective rank was entered in the equations, no
moderation effects were observed (all ps > .116). At the same time, when the interaction
terms were entered into the equations, no significant changes were observed for the
coefficients of three main predictors (i.e., subjective rank, subjective mean and own
consumption). These findings indicate that the same pattern of findings is observed regardless

SOCIAL NORMS AND RANK-BASED NUDGING 20
of gender and BMI. The results suggest that judgments about food consumption, and attitudes
towards diet were determined by how participants thought their consumption ranked within
what they believed other students consume, with an additional contribution of own
consumption level.
Study 3: Behavioral Nudging
Study 2 showed that concern about food intake is driven by individuals’ beliefs about
where their own consumption ranks amongst others. Study 3 tests whether providing
information about the rank of participants’ own consumption levels influences their food
preferences more strongly than information about mean consumption. We used an incentive
compatible paradigm (the Becker-DeGroot-Marschak procedure, BDM; Becker, DeGroot, &
Marschak, 1964) to examine participants’ willingness to pay (WTP) for relatively healthy and
unhealthy products. Thus, the present study builds on the previous ones in order to ascertain
whether attitudes and hypothetical choices and judgments can predict actual behavior.
The present study also tests whether rank-based models (Parducci, 1965; Stewart et
al., 2006) can predict actual behavioral outcomes, which here have been operationalized as
monetary choices for food products. We also test whether manipulating the way in which
social normative information (i.e., the actual level of consumption of other students) is
provided has an effect in people’s actual choices for food products. In line with DbS and
rank-based approaches more generally, we hypothesize that providing rank-based normative
information (e.g., “90% of people consume less chocolate than you do”) will be more
effective than mean-based ‘nudging’ (“you eat 5 bars of chocolate per week; on average,
other people consume 3 bars per week”) in influencing consumers’ choice of food products.
Method
Participants. Ninety five participants (55 females) who reported any consumption of
either coffee or chocolate were included. Participants were recruited from a large public

SOCIAL NORMS AND RANK-BASED NUDGING 21
university campus; ages ranged from 18 to 49 years (M = 22.18, SD = 4.48). Participants
received £5 (at the time of the study, £GBP 1 = $USD 1.58) in exchange for their
participation, minus any cost incurred in the BDM procedure.
Design and procedure. Participants first (a) performed the distribution elicitation task
for either coffee or chocolate consumption and (b) indicated their own weekly consumption
of either product. These tasks were counterbalanced between participants. Distribution
elicitation questions were worded as follows: “The highest consuming x% of students drink
(eat) ___ cups of coffee (bars of chocolate) per week”, where x values were [10, 20, 30, 40,
50, 60, 70, 80, and 90]. Using the same criteria as in the previous studies, prior to analysis we
removed data from 12 participants who responded erratically (12.63% of the total), although
including all participants in the analyses did not affect the results.
Participants were then provided with information relating to their coffee (or
chocolate) consumption. There were three conditions. In a “mean product information
nudging” condition participants were told the average calorific (chocolate) or caffeine
(coffee) content of the foods. In a “mean consumption nudging” condition participants were
told what they believed the average consumption to be (based on the estimates they provided
in the elicitation task), and what the actual average consumption was (based on normative
data previously collected from 263 students at the university under consideration). In the final
condition, “rank-based nudging”, participants were told where they believed they ranked
among the university student population for coffee (or chocolate) consumption, and what
their actual rank position was; the former was the participant’s percentile position within their
inferred distribution of consumption, while the latter was the percentile position within the
actual distribution of consumption (estimated from the normative study).
Participants were then asked how much they would pay to purchase each of two
products. Depending on group, participants were told that the pairs of products on sale were

SOCIAL NORMS AND RANK-BASED NUDGING 22
either (a) a standard 49g (1.73 oz.) Cadbury® bar of chocolate and a red apple, or (b) a 250ml
(8.45 fl. oz.) bottle of Starbucks® Mocha Frappuccino and a 250ml Tropicana® orange juice.
The store prices of the products were reasonably matched: The bar of chocolate cost 59p
(while the apple cost 50p) and the frappuccino cost £1.49 (while the orange juice cost £1.29).
Participants first stated how much (in pence) they would be willing to pay for each of
the products. A random number generator then determined whether it was the chocolate
(frappuccino) or the apple (fruit juice) that was on sale. A random number generator then
determined the price. If the random price was lower or equal to their bid, participants had to
buy the (randomly selected) product for the randomly generated price. Otherwise, if the
random price was higher, no transaction took place. It was clearly explained to participants
that this procedure ensured that it was best for them to truthfully reveal the price they were
willing to pay for each product.
Results and Brief Discussion
Estimating coffee and chocolate consumption. As in Study 2, participants in the
rank-based condition underestimated their own rank position; on average, the difference
between their subjective rank position (their rank position within the inferred distribution)
and their actual rank position (their rank position within the normative distribution) was
around 30% (M = -.33, SD = .18, IQR = [-.26, -.44]). Similarly, participants in the mean
consumption feedback condition overestimated other people’s mean weekly consumption by
around three cups of coffees (or bars of chocolate; M = 3.02, SD = 4.86, IQR = [0.17, 4.87];
see Figure 5 below). As in Study 2, participants underestimated their rank position within the
normative distribution of consumption. The empirical data do not allowed us to us to
determine whether people incorrectly reported their own consumption (underestimating it) or
they misestimated other people’s behavior (overestimating it), although evidence in the
domain of alcohol consumption suggests the latter (Perkins, Haines, & Rice, 2005). However,

SOCIAL NORMS AND RANK-BASED NUDGING 23
our result provides support for the need for social norms interventions which tell people about
their actual rank position within the social distribution of food consumption.
The effects of feedback information on bidding behavior. We computed the
“healthy bid ratio” (i.e., the bid for the healthy product over total bid) to minimize the effects
of inter-individual differences in bidding behavior. A bid ratio below .50 shows a preference
for the unhealthy food. The bid ratio was considerably higher for participants in the rank
group (M = .53, SD = .17) than for participants in the mean product information (M = .40, SD
= .14) and mean consumption conditions (M = .39, SD = .13). A one-way between subjects
ANOVA confirmed these observations, F(2, 82) = 7.73, p < .001, ηp2 = .16; follow-up t-tests
(with Bonferroni adjustments) revealed that the ratio bid was significantly higher for the rank
group compared to mean product and mean consumption information groups (both ps < .01; d
= 0.81 and d = 0.93, respectively) – the latter two did not differ (p > .95).4
These results show that participants in the rank group were willing to spend relatively
more for a healthier product compared to the other two groups. Moreover, providing mean
consumption feedback information had no effect on WTP.
Finally, to test the effects of feedback information on bidding behavior, we examined
whether, in the rank-based condition, greater underestimation of an individual’s own rank
position was associated with greater willingness to pay for the healthy option. Regression
analysis was used to predict the healthy bid ratio from both the feedback difference (i.e., the
difference between the actual values of average or rank consumption and participants’
estimates of average consumption or their own rank position) and participants’ own
consumption—separately for the rank- and mean- consumption based groups. Consistent with
the rank-based model of judgment, feedback difference significantly predicted bid ratio in the
rank-based feedback condition, β = .40, p = .036, but not in the mean consumption feedback
condition, β = - .12, p = .609—the two coefficients differing significantly, z = 1.77, p = .039
SOCIAL NORMS AND RANK-BASED NUDGING 24
(1-tailed). Thus, in the latter feedback condition, participants’ bidding was independent of the
feedback they received; conversely, in the rank group, the higher the underestimation of own
rank position, the higher the willingness to pay for the healthy option (compared to the
unhealthier one).5 The procedure we used aimed to elicit the true prices participants were
willing to pay for each product; thus, the healthy bid ratio reflected participants’ preferences
at the time of testing. Nonetheless, it remains an empirical question whether the same results
would be observed in a forced choice task paradigm, and we hope that future research will
aim to replicate these findings using different decision-making paradigms.
The results of this study show that feeding back information about rank consumption
is an effective way to reduce people’s willingness to pay for unhealthy products. Providing
information about average content of calories (or caffeine), or about average consumption,
did not exert any effect on bidding behavior.
General Discussion
The environmental context in which a food is encountered influences how that food is
evaluated and whether it is purchased (Chandon & Wansink, 2012). This occurs because
foods are not naturally chosen for purchase or consumption in isolation, but are compared
(automatically) to similar foods present in the immediate proximity or retrieved from
memory. Thus, different immediate or remembered contexts would be expected to lead to
different food evaluations and purchase. Previous studies of context effects in food related
judgments have however not provided a model of the precise cognitive mechanisms involved,
and have rarely tested how results could inform interventions to improve health food
behavior. Thus, we tested the ability of rank-based models of judgment and decision-making
(DbS and RFT) to explain the cognitive processes through which context impacts on food
evaluation and choice—against the ability of a reference-level approach (ALT) to account for
the same effects. Studies 1a and 1b showed that participants’ perception of the harmfulness of
SOCIAL NORMS AND RANK-BASED NUDGING 25
food products and risk as a consequence of food intake is highly rank-dependent. Study 2
showed that participants’ concern about their own consumption of relatively unhealthy
products depends both on (a) the consumption level and (b) how they believe their
consumption ranks amongst others’. Study 3 showed that a rank-based nudge affected
purchasing behavior. Although participants held inaccurate beliefs about both (a) the average
consumption of relatively unhealthy food and (b) their own rank position among other
consumers, only addressing the latter had a positive effect on participants’ willingness to pay
for a healthy food option.
Through understanding the precise cognitive mechanisms through which behavioral
decisions are made, interventions can be precisely targeted to work with the grain of human
nature, and products can be designed and packaged to have the biggest impact on healthy
consumer behavior. The results of Study 3 may inform social norm-based feedback
components of multi-component and theoretically driven social marketing intervention
studies: We showed that the provision of rank-based social norm information may be a more
effective nudge than provision of mean-based information (Schultz et al., 2007). These results
suggest ways in which psychological principles can be used (e.g., via "nudging") to increase
consumption of healthy foods. For example, personalized rank-relevant information could be
provided to the wider public through an internet-based campaign. Respondents would be
invited to fill in a short on-line questionnaire; the items would mimic those used for Study 3
and would refer to the respondents’ consumption of particularly unhealthy foods. Normative
data would have been collected on these particular foods and it would be used to easily
extrapolate rank-relevant information for each respondent as s/he enters his/her answer about
food consumption. We believe that this way of delivering personalized, rank-relevant
information could prove a rather effective way in “nudging” people into healthier decision-

SOCIAL NORMS AND RANK-BASED NUDGING 26
making about food consumption—at least to a greater extent than general and impersonal
information campaigns.
The applicability of the present rank-based model to the domain of judgments about
food may however be limited by several factors. First, in Study 2 participants provided what
they believed to be the distributions of others' consumption before they answered questions
about their own consumption. It is possible that this primed people to make judgments in a
more relative way than normal. However, this task order was preferred as it was thought to
parallel how judgments are made in practice; consumption occurs within a context and then
judgments are made, rather than judgments creating contexts (at least on the occasion that
judgments are made). Conversely, if people made the judgments first, they may have been led
to estimate the distributions in a way that is consistent with the judgments they made, which
was considered to be a greater potential problem. However, as the tasks were counterbalanced
in Study 3, we could analyze the influence of order effects and we found none. We note
nonetheless the limitation and that future work should address this issue further.
In addition, in some of the reported studies it was necessary for quantities to be
present in the decision-making context as participants had to provide evaluations based on
numerical values (e.g., the likelihood of health risks due to food intake or the amount of cups
of coffee drunk each week). In many real world contexts – such as when browsing
supermarket shelves – people are indeed exposed to quantities and different options in a
similar fashion and they have to make decisions accordingly. We also note that the same
relative rank effects emerged in experimental contexts where people had to make judgments
based on information available in the immediate decision context and on information
retrieved from memory.
Conclusions

SOCIAL NORMS AND RANK-BASED NUDGING 27
Our key theoretical advance is the application of rank-based models of contextual and
social comparisons to consumer research. We demonstrated the utility of this approach
through direct comparison with the mean-based reference level model which is normally
applied in consumer research to explain how people make relative comparisons. In Studies 1a
and 1b we held constant across conditions the distance between individual people/products
and the mean of those in the comparison set, such that any observed differences between
groups would not be predicted by the reference level account. In the cross-sectional Study 2
we controlled for distance for the mean statistically, and in the third, intervention, study we
directly tested the differences in purchase behavior resulting from telling a person their rank
position amongst others rather than how they compare to the average person.
Social norms interventions – information on how one’s undesirable behavior
compares to other – are very widely used across social marketing and health research more
generally. However, their effectiveness is limited. Our key applied advance is the suggestion
that social norms interventions can be improved through a minor change of presentation of
information, focusing on providing rank position of one’s behavior rather than how one’s
behavior compares to others. This subtle reframing provides information in ways in which
people naturally process it and as such increases effectiveness substantially.
Finally we present a theoretical advance for the DbS model itself. Previous research
on DbS has often used subjective evaluations rather than actual behavior as the outcome.
Often this is appropriate as such evaluations are the variable of interest. However, criticisms
have previously been made that the observed effects are simply artifactual, in that they
represent differences in how the rating scales are used (e.g., “label stretching”) due to
different contexts, rather than actual differences in true evaluation. In Study 3 we address this
concern through showing that the model predicts actual behavior. Study 3 also illustrates the
potential real-world application of rank-based models: It is argued that social norms
SOCIAL NORMS AND RANK-BASED NUDGING 28
intervention can maximize their effectiveness by providing rank-relevant information (e.g.,
“you are in the most unhealthy 10% of eaters”) rather than information relative to average
behaviors (e.g., “you consume 500 calories more than the average person”).

SOCIAL NORMS AND RANK-BASED NUDGING 29
References
Agostinelli, G., Brown, J. M., & Miller, W. R. (1995). Effects of normative feedback on
consumption among heavy drinking college students. Journal of Drug Education, 25,
31-40.
Aldrovandi, S., Wood, A. M., & Brown, G. D. A. (2013). Sentencing, severity, and social
norms: A rank-based model of contextual influence on judgments of crimes and
punishments. Acta Psychologica, 144, 538-547.
Aldrovandi, S., Wood, A. M., Maltby, J., & Brown, G. D. A. (in press). Students’ concern
about indebtedness: A rank based social norms account. Studies in Higher Education.
Andraszewicz, S., Scheibehenne, B., Rieskamp, J., Grasman, R., Verhagen, J., &
Wagenmakers, E.-J. (2014). An introduction to Bayesian hypothesis testing for
management research. Journal of Management, 41, 521-543.
Ayres, I., Raseman, S., & Shih, A. (2013). Evidence from two large field experiments that
peer comparison feedback can reduce residential energy usage. Journal of Law,
Economics, and Organization, 29, 992-1022.
Becker, G. M., DeGroot, M. H., & Marschak, J. (1964). Measuring utility by a single-
response sequential method. Behavioral Science, 9, 226-232.
Beshears, J., Choi, J. J., Laibson, D., Madrian, B. C., & Milkman, K. L. (2011). The effect of
providing peer information on retirement savings decisions (Working paper no.
17345). Cambridge, MA: National Bureau of Economic Research.
Bikhchandani, S., Hirshleifer, D., & Welch, I. (1992). A theory of fads, fashion, custom, and
cultural change as informational cascades. Journal of Political Economy, 100, 992-
1026.
Boyce, C. J., Brown, G. D. A., & Moore, S. C. (2010). Money and happiness: Rank of
income, not income, affects life satisfaction. Psychological Science, 21, 471-475.

SOCIAL NORMS AND RANK-BASED NUDGING 30
Boyce, C. J., & Wood, A. M. (in press). A social rank explanation of how money influence
health. Health Psychology.
Brown, G. D. A., Gardner, J., Oswald, A. J., & Qian, J. (2008). Does wage rank affect
employees' well-being? Industrial Relations, 47, 355-389.
Brown, G. D. A., Wood, A. M., Ogden, R. S., & Maltby, J. (2015). Do student evaluations of
university reflect inaccurate beliefs or actual experience? A relative rank model.
Journal of Behavioral Decision Making, 28, 14-26.
Burton, S., Creyer, E. H., Kees, J., & Huggins, K. (2006). Attacking the obesity epidemic:
The potential health benefits of providing nutrition information in restaurants.
American Journal of Public Health, 96, 1669-1675.
Campbell, E. Q. (1964). The internalization of moral norms. Sociometry, 27, 391-412.
Chandon, P., & Wansink, B. (2012). Does food marketing need to make us fat? A review and
solutions. Nutrition Reviews, 571-593.
Chernev, A. (2011). The dieter's paradox. Journal of Consumer Psychology, 21, 178-183.
Clark, A. E., & Oswald, A. J. (1996). Satisfaction and comparison income. Journal of Public
Economics, 61, 359-381.
Costa, D. L., & Kahn, M. E. (2013). Energy conservation ‘nudges’ and environmentalist
ideology: Evidence from a randomized residential electricity field experiment.
Journal of the European Economic Association, 11, 680-702.
Festinger, L. (1957). A theory of cognitive dissonance. Stanford, CA: Stanford University
Press.
Freelands-Graves, J. H., & Nitzke, S. A. (2002). Position of the American Dietetic
Association: Total diet approach to communicating food and nutrition information.
Journal of the American Dietetic Association, 100-108.
Geier, A. B., Rozin, P., & Doros, G. (2006). Unit bias. Psychological Science, 521-525.

SOCIAL NORMS AND RANK-BASED NUDGING 31
Goldstein, N. J., Cialdini, R. B., & Griskevicius, V. (2008). A room with a viewpoint: Using
social norms to motivate environmental conservation in hotels. Journal of Consumer
Research, 35, 472-482.
Hagerty, M. R. (2000). Social comparisons of income in one's community: Evidence from
national surveys of income and happiness. Journal of Personality and Social
Psychology, 78, 764-771.
Helson, H. (1947). Adaptation-level as frame of reference for prediction of psychophysical
data. American Journal of Psychology, 60, 1-29.
Helson, H. (1964). Current trends and issues in adaptation-level theory. American
Psychologist, 19, 26-38.
Henrich, J., Boyd, R., Bowles, S., Camerer, C. F., Fehr, E., Gintis, H., & McElreath, R.
(2001). In search of homo economicus: Behavioral experiments in 15 small-scale
societies. American Economic Review, 91, 73-78.
Herman, C. P., Roth, D. A., & Polivy, J. (2003). Effects of the presence of others on food
intake: A normative interpretation. Psychological Bulletin, 129, 873-886.
Loewenstein, G., & Ubel, P. (2010, 10/09/2012). Economics behaving badly, NY Times
(Print). Retrieved from
http://www.nytimes.com/2010/07/15/opinion/15loewenstein.html
Manski, C. F. (2004). Measuring expectations. Econometrica, 72, 1329-1376.
Melrose, K. L., Brown, G. D. A., & Wood, A. M. (2013). Am I abnormal? Relative rank and
social norm effects in judgments of anxiety and depression symptoms severity.
Journal of Behavioral Decision Making, 26, 174-184.
Moreira, M. T., Smith, L. A., & Foxcroft, D. (2009). Social norms interventions to reduce
alcohol misuse in university or college students (Vol. 8, pp. CD006748). Cochrane
Database of Systematic Reviews.

SOCIAL NORMS AND RANK-BASED NUDGING 32
Niedrich, R. W., Sharma, S., & Wedell, D. H. (2001). Reference price and price perceptions:
A comparison of alternative models. Journal of Consumer Research, 28(3), 339-354.
Niedrich, R. W., Weathers, D., Hill, C. R., & Bell, D. R. (2009). Specifying price judgments
with range-frequency theory in models of brand choice. Journal of Marketing
Research, 46, 693-702.
Parducci, A. (1965). Category judgment: A range-frequency model. Psychological Review,
72, 407-418.
Parducci, A. (1992). Elaborations upon psychophysical contexts for judgment: Implications
of cognitive models. In H. G. Geissler, S. W. Link & J. T. Townshend (Eds.),
Cognition, information processing, and psychophysics: Basic issues (pp. 207-223).
Hillsdale, NJ: Lawrence Erlbaum Associates.
Parducci, A., & Perrett, L. F. (1971). Category rating scales: Effects of relative spacing and
frequency of stimulus values. Journal of Experimental Psychology, 89, 427-452.
Perkins, H. W., Haines, M. P., & Rice, R. (2005). Misperceiving the college drinking norm
and related problems: A nationwide study of exposure to prevention information,
perceived norms and student alcohol misuse. Journal of Studies on Alcohol, 66, 470-
478.
Posner, E. A. (2000). Law and social norms: The case of tax compliance. Virginia Law
Review, 86, 1781-1819.
Prentice, D. A., & Miller, D. T. (1993). Pluralistic ignorance and alcohol use on campus:
Some consequences of misperceiving the social norm. Journal of Personality and
Social Psychology, 64, 243-256.
Riskey, D. R., Parducci, A., & Beauchamp, G. K. (1979). Effects of context on judgments of
sweetness and pleasantness. Perception & Psychophysics, 26, 171-176.
SOCIAL NORMS AND RANK-BASED NUDGING 33
Russell, C. A., Clapp, J. D., & DeJong, W. (2005). "Done 4": Analysis of a failed social
norms marketing campaign. Health Communication, 17, 57-65.
Schultz, P. W., Nolan, J. M., Cialdini, R. B., Goldstein, N. J., & Griskevicius, V. (2007). The
constructive, destructive, and reconstructive power of social norms. Psychological
Science, 18, 429-434.
Sharpe, K. M., Staelin, R., & Huber, J. (2008). Using extremeness aversion to fight obesity:
Policy implications of context dependent demand. Journal of Consumer Research, 35,
406-422.
Stewart, N., Brown, G. D. A., & Chater, N. (2005). Absolute identification by relative
judgment. Psychological Review, 112, 881-911.
Stewart, N., Chater, N., & Brown, G. D. A. (2006). Decision by sampling. Cognitive
Psychology, 53, 1-26.
Thaler, R. H., & Sunstein, C. R. (2008). Nudge: Improving decisions about health, wealth,
and happiness. New Haven, CT: Yale University Press.
Wansink, B. (2004). Environmental factors that increase the food intake and consumption
volume of unknowing consumers. Annual Review of Nutrition, 24, 455-479.
Wansink, B., Just, D. R., & Payne, C. R. (2009). Mindless eating and healthy heuristics for
the irrational. American Economic Review, 99, 165-169.
Wedell, D. H., Santoyo, E. M., & Pettibone, J. C. (2005). The thick and the thin of it:
Contextual effects in body perception. Basic and Applied Social Psychology, 27, 213-
227.
Werch, C. E., Pappas, D. M., Carlson, J. M., DiClemente, C. C., Chally, P. M., & Sinder, J. S.
(2000). Results of a social norm intervention to prevent binge drinking among first-
year residential college students. Journal of American College Health, 49, 85-92.

SOCIAL NORMS AND RANK-BASED NUDGING 34
Wood, A. M., Boyce, C. J., Moore, S. C., & Brown, G. D. A. (2012). An evolutionary based
social rank explanation of why low income predicts mental distress: A 17 year cohort
study of 30,000 people. Journal of Affective Disorders, 136, 882-888.
Wood, A. M., Brown, G. D. A., & Maltby, J. (2011). Thanks, but I'm used to better: A relative
rank model of gratitude. Emotion, 11, 175-180.
Wood, A. M., Brown, G. D. A., & Maltby, J. (2012). Social norm influences on evaluations of
the risks associated with alcohol consumption: Applying the rank based Decision by
Sampling model to health judgments. Alcohol and Alcoholism, 47, 57-62.
SOCIAL NORMS AND RANK-BASED NUDGING 35
Footnotes
1 When all participants were included in the analyses, the following significant effects
were observed: (a) a main effect of point, F(4, 280) = 516.16, p < .001, ηp2 = .88, (b) an
interaction between point and distribution, F(4, 280) = 7.73, p < .001, ηp2 = .10 and (c) a 3-
way interaction, F(8, 560) = 2.21, p =.025, ηp2 = .03. However, the interaction between point
and distribution was significant for salt, F(4, 280) = 8.14, p < .001, ηp2 = .10, and fat, F(4,
280) = 10.15, p < .001, ηp2 = .13, but not for sugar, F(4, 280) = 0.56, p =.692.
2 The same results were observed when all participants were included in the analyses,
as we observed (a) a main effect of point, F(4, 160) = 163.88, p < .001, ηp2 = .80, (b) an
interaction between point and distribution, F(4, 160) = 3.62, p = .007, ηp2 = .08, while (c) the
3-way interaction was not significant, F(8, 320) = 0.33, p = .953.
3 Results were similar when all participants were included in the analyses. For coffee,
for the dependent variables (a) concern about consumption, subjective rank, B = 5.21, Wald =
26.94, p < .001, was the only significant predictor (all other ps > .152) and (b) high
consumption, subjective rank, B = 5.02, Wald = 24.34, p < .001, own consumption, B = 0.31,
Wald = 38.88, p < .001, and subjective mean, B = 0.13, Wald = 4.44, p = .035, were all
significant predictors, while no other variable was (all ps > .475). For chocolate, for the
dependent variables (a) concern about consumption, subjective rank, B = 1.79, Wald = 6.84, p
= .009, and own consumption were significant predictors, B = 0.03, Wald = 7.45, p = .006,
while subjective mean was not, B = 0.01, Wald = 1.02, p = .312; BMI, B = -0.03, Wald =
4.38, p = .036, and gender, B = -0.80, Wald = 7.33, p = .007, were significant predictors, too;
and (b) high consumption, both subjective rank, B = 5.11, Wald = 44.40, p < .001, and own
consumption, B = 0.07, Wald = 17.37, p < .001, were significant predictors, while the
subjective mean was not, B = 0.01, Wald = 2.47, p = .116; gender was the only other
significant predictor, B = -0.79, Wald = 7.34, p = .007.

SOCIAL NORMS AND RANK-BASED NUDGING 36
4As for the previous studies we performed additional analyses, including all
participants; the main effect of feedback type on bid ratio was significant, F(2, 92) = 7.33, p
= .001; t-tests with Bonferroni adjustments confirmed that the bid ratio was higher for the
rank group (M = .51, SD = .17) compared to mean-based feedback (M = .39, SD = .12; p =
.007) and control group (M = .40, SD = .12; p = .003)—the latter two groups did not differ (p
> .97).
5 We ran further analyses in order to rule out the possibility that task order effects
might have moderated the above findings. The results showed order did not influence
participants’ misestimations, as no main effect of the variable order was detected on
misestimations, nor its interaction with the feedback type (both Fs < 1). The same was true
when the same analysis was run on the healthy bid ratio: Neither the main effect of order,
F(1, 77) = 1.27, p = .263, nor the interaction order by feedback type (F < 1) was significant.
Lastly, when the variable order was entered in the last regression analyses on healthy bid ratio
with own consumption and feedback difference as the predictors, it did not significantly
predict nor interact with any of the predictors (al ps > .07).

SOCIAL NORMS AND RANK-BASED NUDGING 37
Table 1
Average daily consumption of salt, fat and sugar (in g) for distribution A (unimodal) and
distribution B (bimodal). Underlined amounts represent the five common points between the
distributions.
Substance intake
Salt Fat Sugar
Distribution
A B A B A B
0.40 0.40 10.00 10.00 10.00 10.00
2.80 0.90 50.00 18.00 66.00 22.00
3.50 1.40 58.00 26.00 82.00 34.00
4.00 2.10 66.00 38.00 94.00 50.00
4.50 2.80 74.00 50.00 106.00 66.00
5.00 5.00 82.00 82.00 118.00 118.00
5.50 7.20 90.00 114.00 130.00 170.00
6.00 7.90 98.00 126.00 142.00 186.00
6.50 8.60 106.00 138.00 154.00 102.00
7.20 9.10 114.00 146.00 170.00 214.00
9.60 9.60 154.00 154.00 226.00 226.00

SOCIAL NORMS AND RANK-BASED NUDGING 38
Table 2
Regression coefficients for the analyses on attitudes towards own consumption of chocolate and coffee.
Estimate SE Wald p Estimate SE Wald p
Coffee Chocolate
Consumption, High Consumption, High
Subjective Rank 6.49 1.50 18.77 <.001*** Subjective Rank 1.86 1.23 2.29 .130
Own consumption 0.12 0.06 4.92 .027* Own consumption 0.70 0.11 37.37 <.001***
Subjective Mean 0.01 0.04 0.10 .754 Subjective Mean <0.01 0.02 0.19 .662
BMI 0.02 0.02 0.52 .471 BMI <0.01 0.02 <0.01 .982
Gender -0.27 0.42 0.40 .526 Gender -0.92 0.36 6.55 .011*
Age 0.01 0.10 0.02 .888 Age -0.04 0.06 0.35 .556
Consumption, Concern
Consumption, Concern
Subjective Rank 4.36 1.31 11.08 <.001*** Subjective Rank 2.79 1.18 5.58 .018*
Own consumption 0.06 0.04 2.78 .096• Own consumption 0.17 0.08 4.41 .036*
Subjective Mean 0.07 0.03 4.55 .033* Subjective Mean <0.01 0.02 0.16 .689
BMI -0.01 0.03 0.04 .840 BMI -0.03 0.02 1.73 .189
Gender -0.91 0.47 3.79 .052• Gender -1.48 0.37 15.91 <.001***
Age 0.07 0.10 0.44 .509 Age -0.10 0.07 1.88 .171
Note. BMI = Body-Mass Index; *** significant at 0.1% level; ** significant at 1% level; * significant at 5% level; • p < .10.

SOCIAL NORMS AND RANK-BASED NUDGING 39
Figure 1. Illustration of distribution A (bottom line of black dots) and distribution B (upper
line of black dots) constructed to test relative rank effects. Highlighted amounts are common
points 2 and 4, which differ only in their rank position within the distribution and not in their
magnitude or in how they differ from the mean of the set.

SOCIAL NORMS AND RANK-BASED NUDGING 40
Figure 2. Interactions between distribution type and common points (1 to 5) for the three substances. To take account of individual differences in
scale use, all participants’ responses were rescaled between 0 and 1 (see Brown et al., 2008). Error bars represent 95% confidence intervals.

SOCIAL NORMS AND RANK-BASED NUDGING 41
Figure 3. Interactions between distribution type and common points (1 to 5) for the three substances. To take account of the individual
differences in scale use, all participants’ responses were rescaled between 0 and 1 as in Study 1b. Error bars represent 95% confidence intervals.

SOCIAL NORMS AND RANK-BASED NUDGING 42
Figure 4. Consumption mean estimates (and SD) and actual values for coffee (cups; on the left) and chocolate (bars; on the right) provided in the
probability elicitation task for different percentile points. LL and UL represent the lower and upper limit of the Interquartile Range (IQR).
Whiskers present the SD of participants’ estimates.

SOCIAL NORMS AND RANK-BASED NUDGING 43
Figure 5. Consumption mean estimates (and SD) and actual values for coffee (cups; on the left) and chocolate (bars; on the right) provided in the
probability elicitation task for different percentile points. LL and UL represent the lower and upper limit of the Interquartile Range (IQR).
Whiskers present the SD of participants’ estimates.

SOCIAL NORMS AND RANK BASED NUDGING
41
Figure 6. The cumulative distribution (filled circles) along with a best-fit cumulative density
function (solid lines) elicited from participants 68 (top panel) and 190 (bottom panel).Vertical
lines indicate own consumption, while the horizontal line represents the subjective rank
position.
0 5 10 15 20 25 300
0.2
0.4
0.6
0.8
1
Cum
ula
tive P
roport
ion
Bars Per Week
Participant 190
0 5 10 15 20 25 300
0.2
0.4
0.6
0.8
1C
um
ula
tive P
roport
ion
Bars Per Week
Participant 68