social network analysis of team dynamics … dynamics and intra-organizational development in an...
TRANSCRIPT

SOCIAL NETWORK ANALYSIS OF TEAM DYNAMICS AND
INTRA-ORGANIZATIONAL DEVELOPMENT IN AN AEROSPACE FIRM
Kristie Ogilvie and Dimitris Assimakopoulos Grenoble Ecole de Management
Europole, 12 rue Pierre Semard, BP 127, 38003 Grenoble, FRANCE [email protected], [email protected]
This research examines resultsfrom a dual case study in defining a model for high productivity and performance o{ cross~{unctional development teams in an aerospace engineering community. More specifical~v it explores cohesiveness and team dynamics over an approximate 4-year period in a project team that recently designed and built a high~v innovative propulsion system. The 'successful' team delivered this propulsion system ahead o{ schedule. helow cost. and was considered a high~v productive team within the researched Aerospacejirm. Ucinet is used to map k-cores. month hy month. jar the entire Iile cycle o{the project. This methodology is then compared to a 'less successful' team to determine those variables responsiblefor high productivity and overall success of a high~v technical research and development team. The results encompass the critical times in networked teams that inclusion in memhership o{the team is most critical/or success.
1 AEROSPACE AND TEAM INTRODUCTION
In the aerospace community, the most common project teams are arranged in an Integrated Product Team (lPT) organization, which is a multidiscipline team approach. This type of organizational structure brings members of functional organizations, otherwise known as " experts" , together to enhance a broad base of knowledge to the organization. Each of these experts brings a core knowledge that must be communicated and maintained throughout the project, and to other projects within the company.
Research has been conducted for integrated product teams, learning within organizations, and innovation, but these studies have gaps in the perspective of the how technology is changing the learning, team environments, and specific operations experienced in today's communities in relation to social network analysis. Aerospace communities share a dynamic like none in any other industry and only limited research has been conducted in this industry. Both the methods and the environmental implications must be explored in tandem, to accurately build a model for learning and innovation to be successful.
In the simplest form, there are two types of contracts within an aerospace company, development and production. Development programs are leading edge projects that usually require one unit, either in experimental form or for a specialized project to its customer. Production programs that are involved in production lines and a large numbers of similar type units that are produced. In production programs,
Ogilvie, K., Assimakopoulos, D., 2007, in IFIP International Federation for Information Processing, Volume 243, Establishing the Foundation of Collaborative Networks; eds. Camarinha-Matos, L., Afsarmanesh, H., Novais, P., Analide, c.; (Boston: Springer), pp. 417-424.

418 Establishing the foundation of collaborative networks
operational aspects and manufacturing practices are key; while in development projects, learning, creativity, innovation, and leading edge technology are the roots for success. In the development projects that require new and state of the art technology to be applied, productivity, and team success is crucial for the success of an aerospace company. Requirements tend to change throughout this process and this makes an additional set of restraints for the organization. Constant team interaction will be the key to enable these changes in the development environment to be compensated and integrated, making the final product robust.
The successful team delivered the propUlsion system, ahead of schedule, below cost, and was considered a highly productive team within the organization. After careful analysis of the successful team, the next phase took these best practices and explored their impact in relation to another program similar in size, makeup, and mission. The personnel, especially the core teams, were of the same members of the company, during a different period of time.
2 METHODOLOGY
The overall schedule and methodology was found in the following figure. As illustrated the research project first completed the pertinent literature relating to this study, then moving onto the successful team's strategy and implementation, followed by the less successful team's strategy and implementation. This is followed by the comparative analysis of the two teams, followed by the write up of the findings. The methodology included in depth interviews, social network analysis with UCInet, and statistical analysis. Team A was the successful team, while the Team B designation was the not-as-successful team.
Phase 1 Phase 2
Figure 1: Overall Methodology Process
3 SOCIAL NETWORK ANALYSIS INTRODUCTION
Social network mapping (Hannemann 2001) begins with the conventional rectangular measurement of actors or players within a selected team. Each cell will be assigned either a 0 (in which no relationship or data was transferred between actors), or a I (in which a relationship or data was transferred between actors). This creates a table of comparison of actors in their relationship in binary form. The data is captured that could further the relationship from binary form to a strength of tie, but due to the timing constraints and the overall objectives, the binary analysis was

Social network analysis in an aerospacefirm 419
sufficient to show the necessary data. This is the foundation data that is used for the mapping portion of the analysis. Network mapping is a special form of conventional data, as it looks at data in a different way. Actors are described by their relations, not by their attributes. This puts an emphasis on the relationships of the actors, not just the individual within the network.
'The major difference between conventional and network data is that conventional data focuses on the actor and their attributes, network data focuses on actors and relations. The difference in emphasis is consequential for the choices that a researcher must make in deciding on research design in conducting sampling, developing measurement, and handling the resulting data." (Hannemann 2001).
The population analyzed is made up of all persons who had vested interest and charged the successful and less than successful team projects. This has made the actors define the population, as well as a demographic approach. In a demographic approach, the criterion is fulfilled for the team members, but in some cases there was no direct interaction with team members. In this case, the actor will be present in the social network map, but not encounter any ties to the team or population. For example, an administrative support person may be forwarded an expense report that needs to have a manager's signature. The support person may charge the work order, including themselves in the population. Since no direct interaction or information was exchanged, no social tie would be made. This would not be considered an interaction in the social network mapping definition, hence no tie will be present.
The collection method for which actors interfaced was a sound methodology for the desired accuracy of the team. The combination of the" full network" approach is one that" yields the maximum information, but can also be costly and difficult to execute" (Hannemann, 2001), hence the snowball method was used. The full network method requires a collection of information from each actor. This enables a full picture, as the entire population has been utilized.
The scale for measurement was a binary measure, as it is the most common, (assigning 0 for no relationship or a 1 where a relationship exists). This enables the network to illustrate whether the relationship existed or not, not the tie between information. This was selected for several reasons. First, it was a starting point for the network analysis. This keeps the illustration simple, and will illustrate the network very clearly. Secondly, and more importantly, the differentiation during the interviews for the core team members seemed to indicate that the core members had many more relationships with others in the team, not that there was a differentiation factor of the strength of the ties between the members. This further proves the selection of the binary measurement fit the methodology. The major advantage of the strength illustration in social network mapping is it shows the strength of the given parameter. This can be at the interaction level, frequency of interaction, membership of the team, etc.
4 RESUL TS/KEY FINDINGS
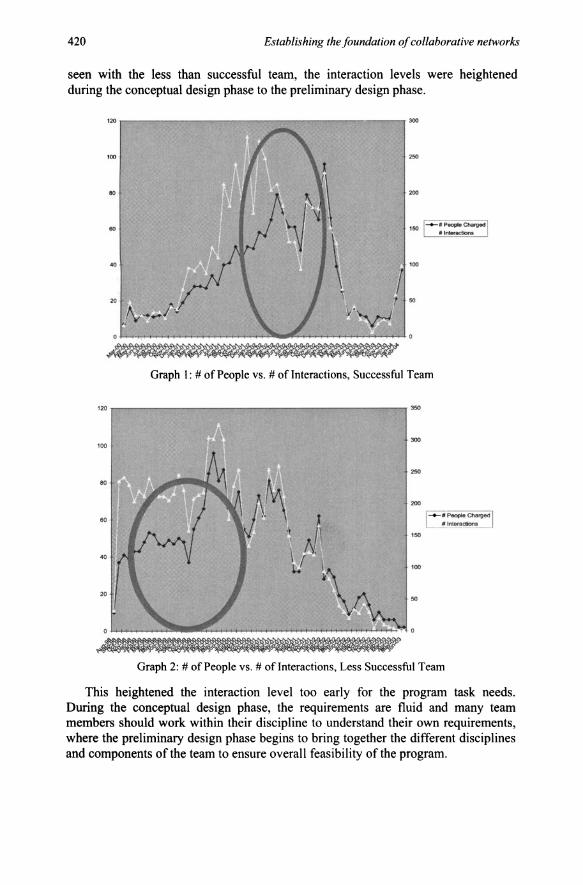
A key finding from the successful team was the number of people and interactions were dramatically disproportional during the preliminary design review phase to the critical design review phase, where interaction levels seemed consistent with the efforts of the program. This is the portion of the program in which the design efforts are heightened and the communication process needs to be streamlined and heightened. The following figure shows this trend, which aided in their success. As
420 Establishing the foundation of collaborative networks
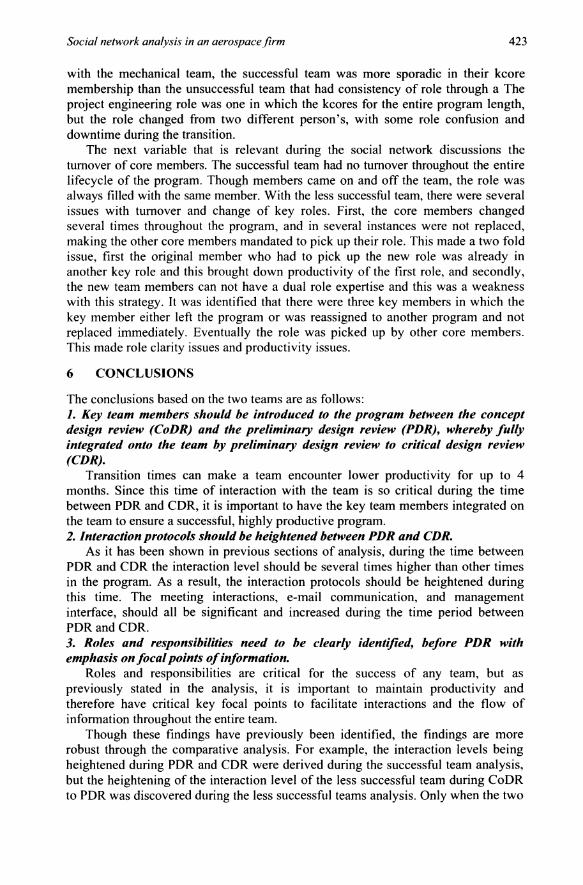
seen with the less than successful team, the interaction levels were heightened during the conceptual design phase to the preliminary design phase.
I~ .r-------=-------------------------------,-
100
50
_0 100
~ 50
Graph I: # of People vs. # ofInteractions, Successful Team
120 350
300 100
,.., 80
200
60 J c;-~l • Intetactiont
\ ,J 150
_0
J 100
~ 50
Graph 2: # of People vs. # ofInteractions, Less Successful Team
This heightened the interaction level too early for the program task needs. During the conceptual design phase, the requirements are fluid and many team members should work within their discipline to understand their own requirements, where the preliminary design phase begins to bring together the different disciplines and components of the team to ensure overall feasibility of the program.

Social network analysis in an aerospace firm 421
5 ADDITIONAL SOCIAL NETWORK FINDINGS
As previously discussed, the social dynamics are best captured within the team were not only seen as critical by the team members through primary data collection, but also by the social network analysis conducted.
The next comparison worth noting is the ramp up of the team membership and social network. As seen in month 2 for the successful team versus the unsuccessful team as shown in the following figures.
. \
.--- ..
\ \
Graph 3: Social Network Analysis, Successful Team
Sept 98
Graph 4: K-Core Social Network Analysis, Not Successful Team
As seen, the successful team was comprised of the core members and only a small number of other team members, as ramp up has not occurred on this team yet. This is not the case with the unsuccessful team, as there are not only the set team members, but membership phase ballooned with many non-core members. As noted in existing research, it takes any new member up to 90 days to become familiar and productive in a new role. With the successful team, the core team is becoming familiar with their role during this time and is focusing their productivity to the team's goals and objectives rather than manage a team before they have a full understanding of the team's requirements.
The ramp up did not occur until month seven, as shown in the following figure. This shows that the core team had been together for over 200 days, and were experts

422 Establishing the foundation of collaborative networks
in their given role making their productivity, and in turn the productivity of the team they managed, much more suc-
Oct 00 cessful. With the less successful
Graph 5: K-Core Social Network Analysis, Ramp up, Successful Team
team, the ramp up occurred within 30-60 days of contract award.
Next will be a discussion of specific roles and implications in light of the social network findings. First, the systems engineer. This is a role that should have critical importance during the beginning stages of a development program, in that they concrete on defining the requirements and communicating this to the remainder of the team. This role also communicated the dif-
ferent requirements throughout the team and ensures that the different functions changes in these requirements do not conflict with other team tasks, and that the program will meet their overall mission goals. The role then is critical again during the delivery of the unit, as the documentation needs to be updated and submitted. The criticality of the role comes early in the program, and tapers off after design of the unit.
With the successful team, the systems engineer is a Kcore member in months: I through 44 of the program and again in months 46-50. The team's goal was to take this person and ensure continued success, so varied the role of this particular person. Though the team member was a systems engineer and provided those function, the person also provided a management role during those times that the systems role was not needed. This prevented turnover and downtime for the team member.
With the less successful team, the systems engineer was a k-core member in months: 1-23, 25-27, and 30. There was no Kcore analysis present or even membership in the later months of the program. This shows the criticality of this role and the strategy of success for the team members to ensure that not only the role, but the particular person throughout the lifecycle of the program is needed for success.
Next, the mechanical engineers one in which the design phase is most critical such that the heightened Kcore analysis should show during the beginning phase to the critical design review. The successful team had mechanical design role (between several people) as a kcore from months 1,2, 5-8, 11-41,44-48. Note this role was shared by three members of the team in the same role, based on demand. With the less successful team, the kcores were seen in months: 1-35, 37-44, 56. There does not seem to be any concrete difference between the two roles, only that the successful team was more sporadic with this roles Kcore membership consistently throughout the program.
Next, the manufacturing function is one that is most critical after design and upon build up of the deliverable, making the latter part of the program most critical. The successful team had this role a kcore in months: 7-11, 16-37,40,45-50. The less successful team had this role in a kcore in months: 2-40, 42-44. As previously notes
Social network analysis in an aerospace firm 423
with the mechanical team, the successful team was more sporadic in their kcore membership than the unsuccessful team that had consistency of role through a The project engineering role was one in which the kcores for the entire program length, but the role changed from two different person's, with some role confusion and downtime during the transition.
The next variable that is relevant during the social network discussions the turnover of core members. The successful team had no turnover throughout the entire Iifecycle of the program. Though members came on and off the team, the role was always filled with the same member. With the less successful team, there were several issues with turnover and change of key roles. First, the core members changed several times throughout the program, and in several instances were not replaced, making the other core members mandated to pick up their role. This made a two fold issue, first the original member who had to pick up the new role was already in another key role and this brought down productivity of the first role, and secondly, the new team members can not have a dual role expertise and this was a weakness with this strategy. It was identified that there were three key members in which the key member either left the program or was reassigned to another program and not replaced immediately. Eventually the role was picked up by other core members. This made role clarity issues and productivity issues.
6 CONCLUSIONS
The conclusions based on the two teams are as follows: 1. Key team members should be introduced to the program between the concept design review (CoDR) and the preliminary design review (PDR), whereby fully integrated onto the team by preliminary design review to critical design review (CDR).
Transition times can make a team encounter lower productivity for up to 4 months. Since this time of interaction with the team is so critical during the time between PDR and CDR, it is important to have the key team members integrated on the team to ensure a successful, highly productive program. 2. Interaction protocols should be heightened between PDR and CDR.
As it has been shown in previous sections of analysis, during the time between PDR and CDR the interaction level should be several times higher than other times in the program. As a result, the interaction protocols should be heightened during this time. The meeting interactions, e-mail communication, and management interface, should all be significant and increased during the time period between PDR and CDR. 3. Roles and responsibilities need to be clearly identified, before PDR with emphasis on focal points of information.
Roles and responsibilities are critical for the success of any team, but as previously stated in the analysis, it is important to maintain productivity and therefore have critical key focal points to facilitate interactions and the flow of information throughout the entire team.
Though these findings have previously been identified, the findings are more robust through the comparative analysis. For example, the interaction levels being heightened during PDR and CDR were derived during the successful team analysis, but the heightening of the interaction level of the less successful team during CoDR to PDR was discovered during the less successful teams analysis. Only when the two

424 Establishing the foundation of collaborative networks
teams were compared was it discovered this seemingly small difference, but critical for the success of the project.
There are several areas that need further analysis, as the scope of this research was limited. Specific areas that were seen as significant, but ranged outside of the scope of the project were are as follows. The analysis based on function and interaction levels were an area that was found to be significant and there could be trends that could be analyzed based on function over the lifecycle of the program. This could bring a level of analysis to a management team based on function, which is the make up of many aerospace companies. The interaction levels vary greatly based on function, so exploring a model based on function could be very beneficial and value added both to the industry and to the theoretical perspective. Secondly, the social network analysis was the foundation of this research, but one area that was not analyzed was the strength of the ties between the different members of the team. This would more accurately illustrate the importance of the ties and not a sheer number of interactions between members. Though the number of interactions shows the overall trends, the strength of ties could provide a differing model of what team members had stronger and weaker ties throughout the lifecycle of the program. Additional analysis in the social network analysis area that could further explore the results of this research is to weigh the actors in the social network analysis with the weight of hours that they spent on the program, month to month, over the lifecycle of the program. This would better analyze the contribution and efforts of each team member and fully illustrate the importance of each team member. One could easily argue that the time committed to a program has a direct correlation to the ties that are brought to the team and its members. This additional research methodology would continue to explore the trends and results of this assumption.
7 REFERENCES
1. Barthelemy, J.-F., Waszak, M. R., Jones, K. M., Silcox, R. J., Silva, W. A and Nowaczyk, R.H., "Charting Multidisciplinary Team External Dynamics using a Systems Thinking Approach," AIAA Paper 98-4939, AIAAlUSAFfNASAIISSMO
2. Borgatti, S. & Cross, R. (2003). A Social Network View of Organizational Learning: Relational and Structural Dimensions of 'Know Who'. Management Science, 49 pp. 432-445.
3. Brown Seely, John and Duguid, Paul. "Organizing Knowledge." California Management Review 40, no. 3 (1998): 90-111.
4. Brown, J. S., & Duguid, P. (2000). The social life of information. Boston, MA: Harvard Business School Press.
5. Burt, Ronald S. "Structural Holes Versus Network Closure As Social Capital." Social Capital: Theory and Research (200 I): 31-56.
6. Cross, R., Parker, A., Prusak, L. & Borgatti, S.P. "Knowing What We Know: Supporting Knowledge Creation and Sharing in Social Networks." Organizational Dynamics 30, no. 2 (2001): 100-20.
7. Dodgson, Mark. "Learning, trust, and technological collaboration" . Human Relations, New York, Jan 1993, Volume 46, Issue I, Page 77,19 pages.
8. Hannemann, Robert A. Introduction to Social Networking Methods, 2001. 9. Powell, W. W., K. W. Koput, L. Smith-Doerr, and J. Owen-Smith. 1999. "Network Position and Firm
Performance." pp. 129-59 in Research in the Sociology of Organizations, edited by S. Andrews and D. Knoke, vol. 16, JAI Press.
10. Rothwell, Roy. Towards the Fifth generation Innovation Process;, Science Policy Research Unit, University of Sussexm UK, International Marketing Review Vol 11m No I, 1994 pp. 7-31 MCB University Press 0265-1335.
II. Wassermann, S. and Faust, K (1994). Social Network Analysis: Methods and Applications. Cambridge: Cambridge University Press.
12. Wellman, B. Networks in the global village: life in contemporary communities. - 1999 - Boulder, Colo: Westview Press.