social mobility & status attainment i three generations of comparative intergenerational...
Post on 22-Dec-2015
224 views
TRANSCRIPT
Social Mobility & Status Social Mobility & Status Attainment IAttainment I
Three Generations of Three Generations of Comparative Comparative
Intergenerational Intergenerational Stratification ResearchStratification Research
3 Generations of Research in 3 Generations of Research in Intergenerational StratificationIntergenerational Stratification
The core issue: what are the The core issue: what are the mechanisms of transmission of mechanisms of transmission of socioeconomic advantage from socioeconomic advantage from generation to generationgeneration to generation
I follow the outline of Ganzeboom et I follow the outline of Ganzeboom et al. (1991); 3 generations of research al. (1991); 3 generations of research after WW II are distinguishedafter WW II are distinguished
The 1The 1stst Generation Generation
An example of 1An example of 1stst generation research is generation research is Lipset et al. (originally published 1956)Lipset et al. (originally published 1956)
Focus is on tables representing Focus is on tables representing occupational mobility from fathers to sonsoccupational mobility from fathers to sons
Analysis is “little more than the inspection Analysis is “little more than the inspection of inflow and outflow percentages” (p. of inflow and outflow percentages” (p. 280)280)
It is recognized that observed mobility It is recognized that observed mobility rates are a function of marginal rates are a function of marginal distributions, thus not comparabledistributions, thus not comparable
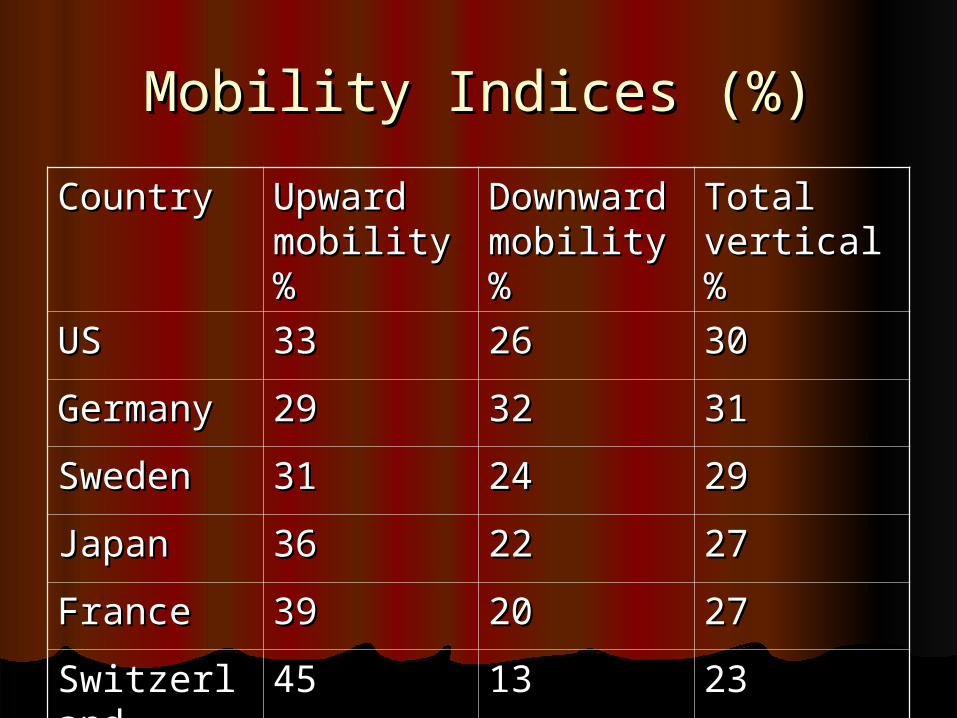
Mobility Indices (%)Mobility Indices (%)
CountryCountry Upward Upward mobility mobility %%
DownwarDownward mobility d mobility %%
Total Total vertical %vertical %
USUS 3333 2626 3030
GermanyGermany 2929 3232 3131
SwedenSweden 3131 2424 2929
JapanJapan 3636 2222 2727
FranceFrance 3939 2020 2727
SwitzerlanSwitzerlandd
4545 1313 2323
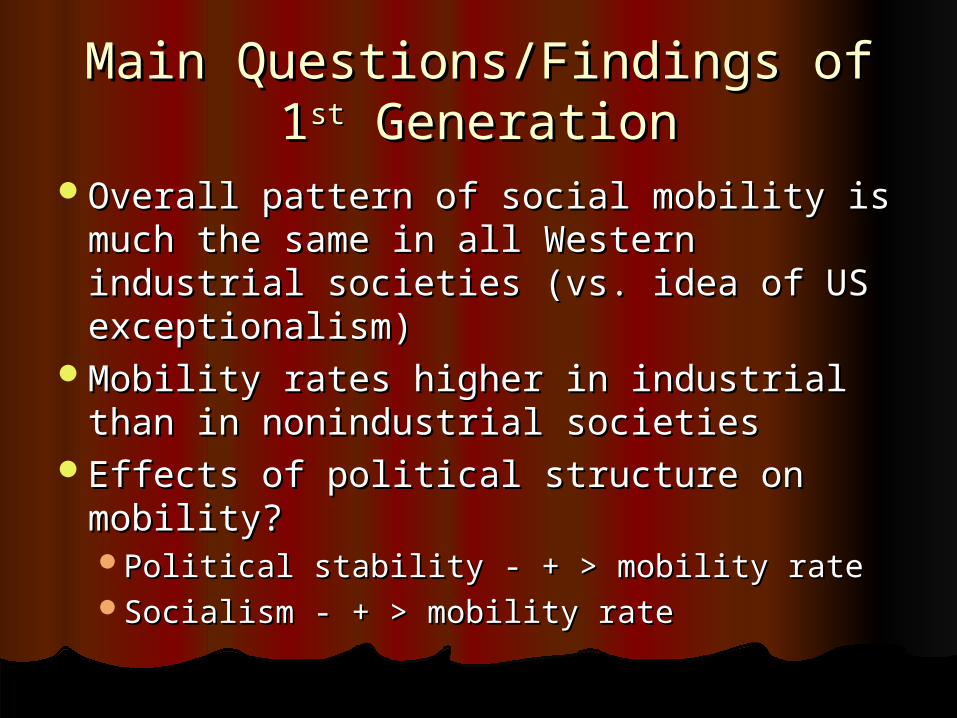
Main Questions/Findings of 1Main Questions/Findings of 1stst GenerationGeneration
Overall pattern of social mobility is Overall pattern of social mobility is much the same in all Western industrial much the same in all Western industrial societies (vs. idea of US exceptionalism)societies (vs. idea of US exceptionalism)
Mobility rates higher in industrial than in Mobility rates higher in industrial than in nonindustrial societiesnonindustrial societies
Effects of political structure on mobility? Effects of political structure on mobility? Political stability - + > mobility ratePolitical stability - + > mobility rateSocialism - + > mobility rateSocialism - + > mobility rate
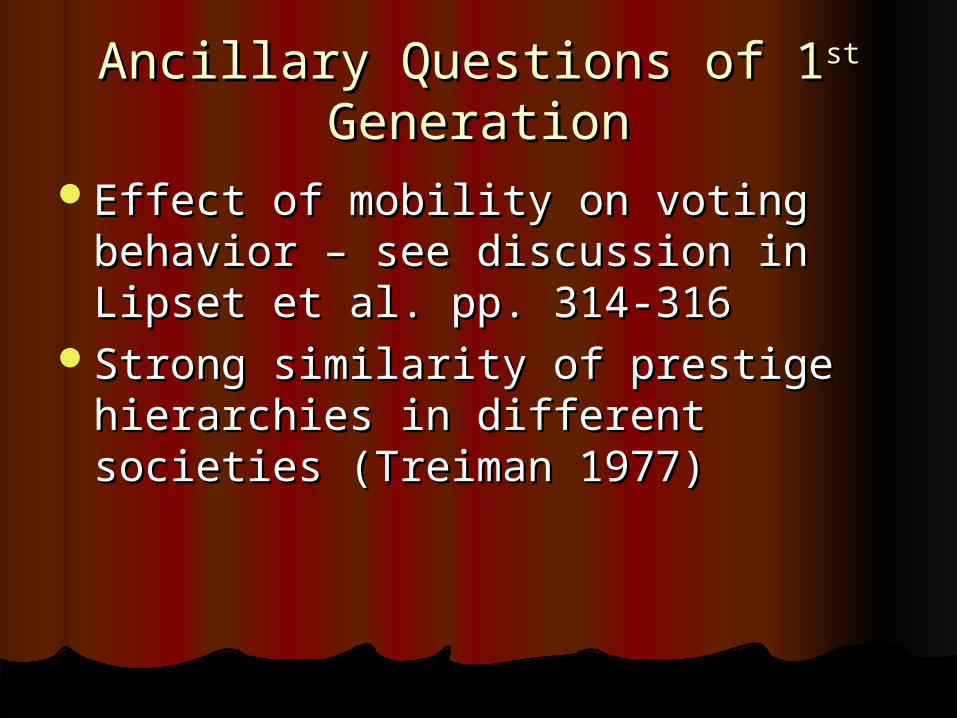
Ancillary Questions of 1Ancillary Questions of 1stst GenerationGeneration
Effect of mobility on voting behavior Effect of mobility on voting behavior – see discussion in Lipset et al. pp. – see discussion in Lipset et al. pp. 314-316314-316
Strong similarity of prestige Strong similarity of prestige hierarchies in different societies hierarchies in different societies (Treiman 1977)(Treiman 1977)
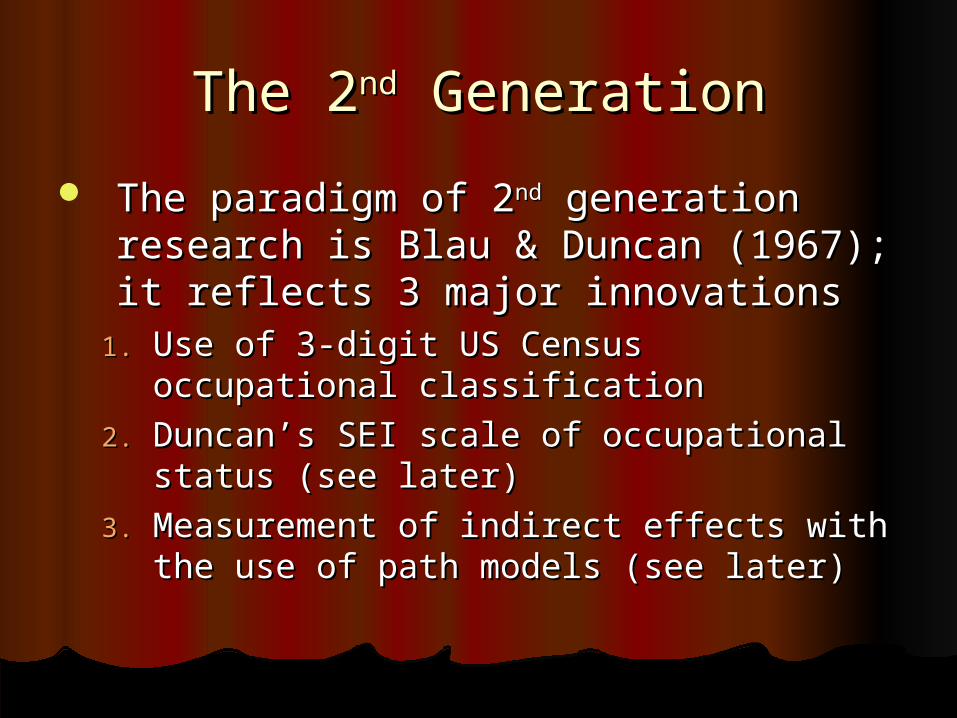
The 2The 2ndnd Generation Generation
The paradigm of 2The paradigm of 2ndnd generation generation research is Blau & Duncan (1967); it research is Blau & Duncan (1967); it reflects 3 major innovationsreflects 3 major innovations
1.1. Use of 3-digit US Census occupational Use of 3-digit US Census occupational classificationclassification
2.2. Duncan’s SEI scale of occupational Duncan’s SEI scale of occupational status (see later)status (see later)
3.3. Measurement of indirect effects with Measurement of indirect effects with the use of path models (see later)the use of path models (see later)
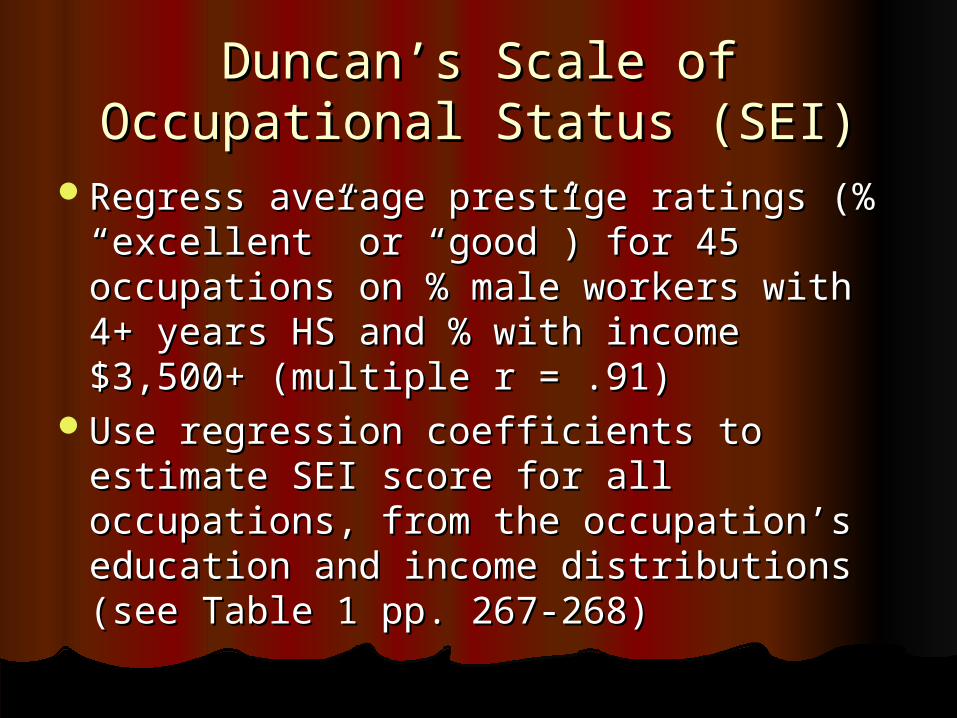
Duncan’s Scale of Occupational Duncan’s Scale of Occupational Status (SEI)Status (SEI)
Regress average prestige ratings (% Regress average prestige ratings (% “excellent” or “good”) for 45 “excellent” or “good”) for 45 occupations on % male workers with occupations on % male workers with 4+ years HS and % with income 4+ years HS and % with income $3,500+ (multiple r = .91)$3,500+ (multiple r = .91)
Use regression coefficients to estimate Use regression coefficients to estimate SEI score for all occupations, from the SEI score for all occupations, from the occupation’s education and income occupation’s education and income distributions (see Table 1 pp. 267-268)distributions (see Table 1 pp. 267-268)
More on Measurement of More on Measurement of Occupational StatusOccupational Status
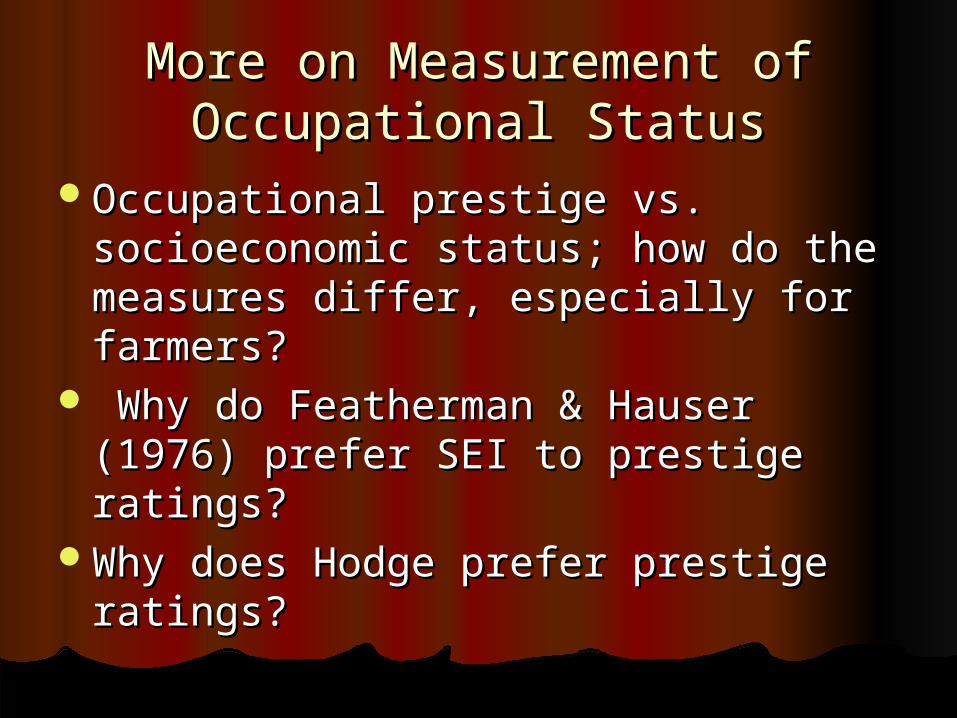
Occupational prestige vs. Occupational prestige vs. socioeconomic status; how do the socioeconomic status; how do the measures differ, especially for measures differ, especially for farmers?farmers?
Why do Featherman & Hauser Why do Featherman & Hauser (1976) prefer SEI to prestige ratings?(1976) prefer SEI to prestige ratings?
Why does Hodge prefer prestige Why does Hodge prefer prestige ratings?ratings?

Measurement of Status Measurement of Status (cont’d)(cont’d)
Hauser & Warren (GRUSKY pp. 281-Hauser & Warren (GRUSKY pp. 281-286) conclude: “Although composite 286) conclude: “Although composite measures of occupational status may measures of occupational status may have heuristic uses, the global have heuristic uses, the global concept of occupational status is concept of occupational status is scientifically obsolete.” (p. 285) How scientifically obsolete.” (p. 285) How do they get to that conclusion?do they get to that conclusion?
What do they propose instead of SEI? What do they propose instead of SEI? Why? Why?
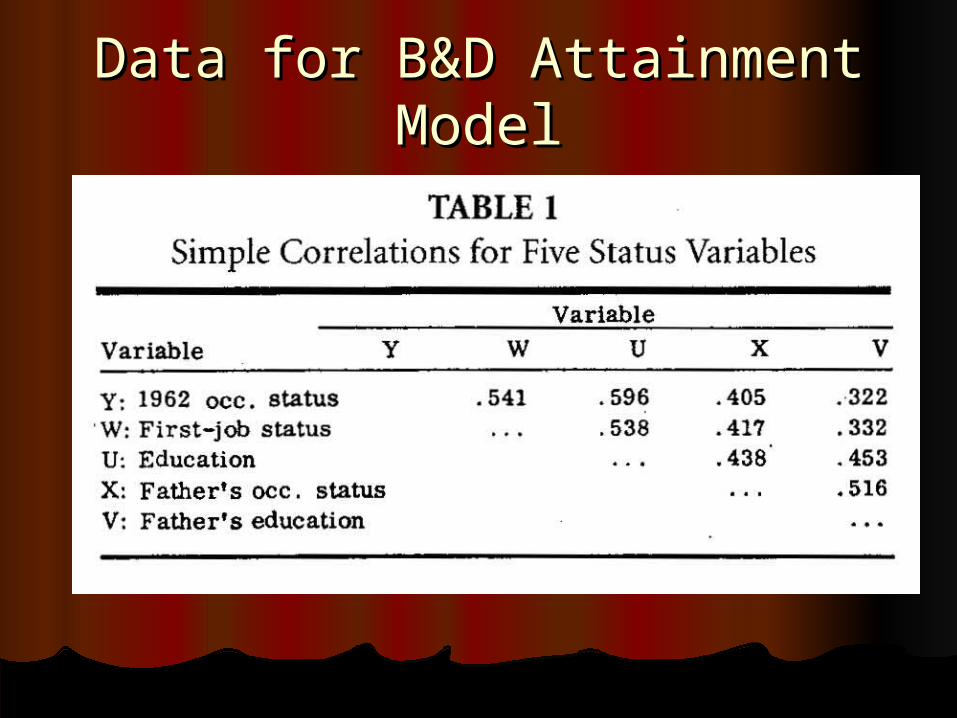
Data for B&D Attainment Data for B&D Attainment ModelModel
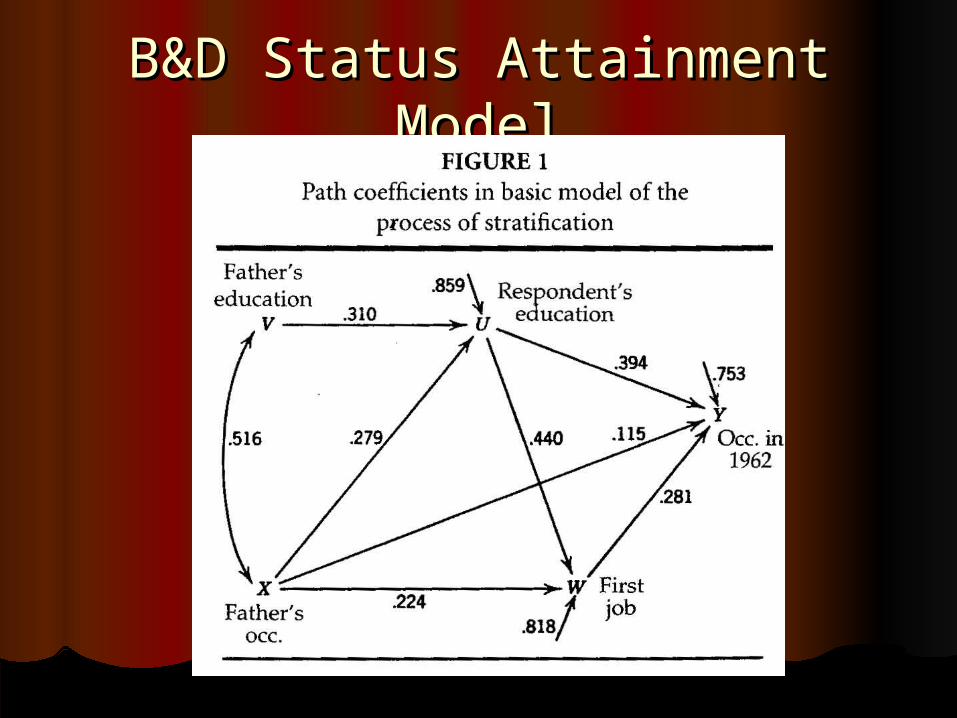
B&D Status Attainment ModelB&D Status Attainment Model
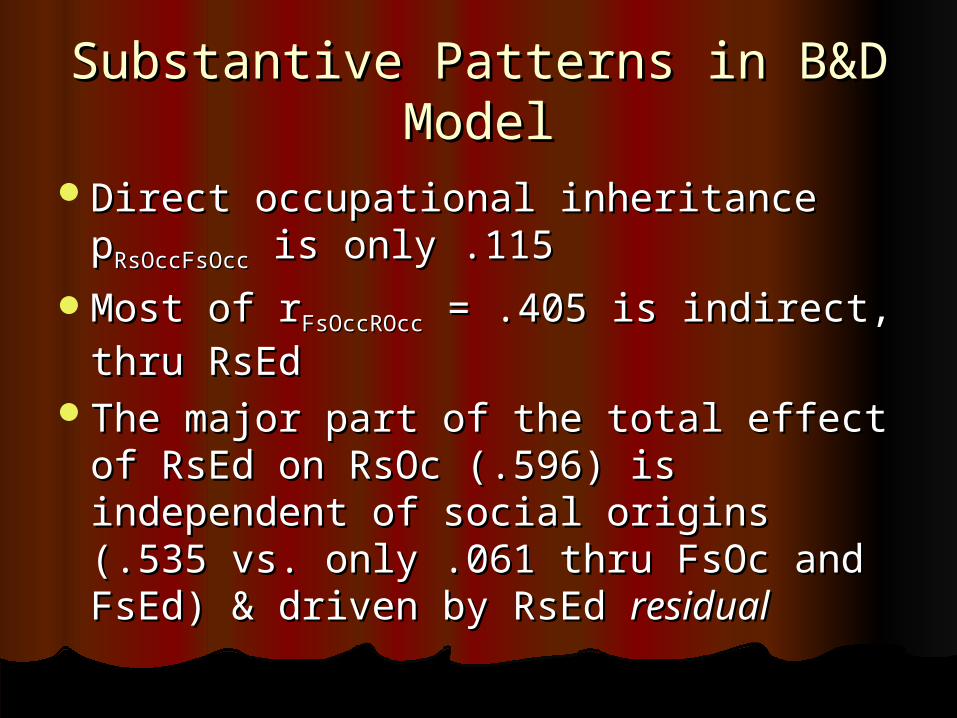
Substantive Patterns in B&D Substantive Patterns in B&D ModelModel
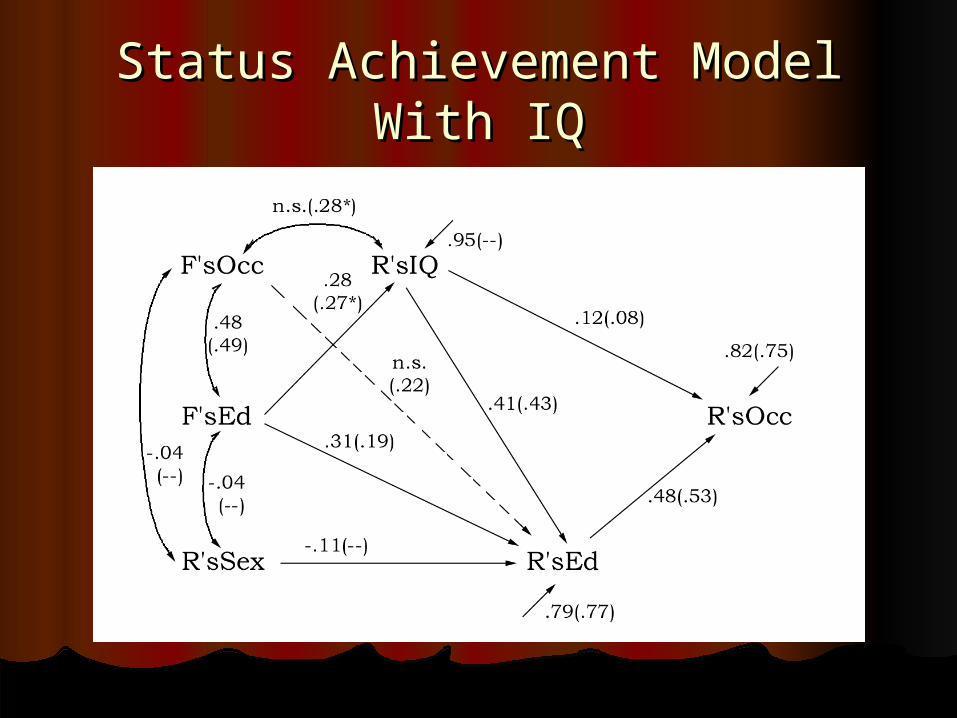
Direct occupational inheritance Direct occupational inheritance ppRsOccFsOccRsOccFsOcc is only .115 is only .115
Most of rMost of rFsOccROccFsOccROcc = .405 is indirect, thru = .405 is indirect, thru RsEdRsEd
The major part of the total effect of The major part of the total effect of RsEd on RsOc (.596) is independent of RsEd on RsOc (.596) is independent of social origins (.535 vs. only .061 thru social origins (.535 vs. only .061 thru FsOc and FsEd) & driven by RsEd FsOc and FsEd) & driven by RsEd residualresidual
Substantive Patterns (cont’d)Substantive Patterns (cont’d)
What is the substantive What is the substantive interpretation of the RsEd residual: interpretation of the RsEd residual: unmeasured ability, effort, free will unmeasured ability, effort, free will or or agencyagency??
Status Achievement Model With Status Achievement Model With IQIQ
New Substantive QuestionsNew Substantive Questions
How does effect of R’sEd on R’sOcc How does effect of R’sEd on R’sOcc compare with direct effect of F’sEd on compare with direct effect of F’sEd on R’sOcc? B&D find ratio is 2.9:1. They R’sOcc? B&D find ratio is 2.9:1. They conclude that in mid-20conclude that in mid-20thth century US century US achievementachievement was more important than was more important than ascriptionascription in determining occupational in determining occupational statusstatus
B&D reckon that industrialization B&D reckon that industrialization increases importance of increases importance of achievementachievement relative to relative to ascriptionascription processes processes
Substantive Questions Substantive Questions (cont’d)(cont’d)
Note how Note how ascriptionascription is associated is associated with relative effect of family with relative effect of family background (e.g., F’sOcc), and background (e.g., F’sOcc), and achievementachievement is associated with is associated with relative effect of education (R’sEd)relative effect of education (R’sEd)
Treiman (1970) – In more developed Treiman (1970) – In more developed countries F’sOcc -> R’sEd and F’sOcc countries F’sOcc -> R’sEd and F’sOcc -> R’sOcc weaker (less ascription)-> R’sOcc weaker (less ascription)
Effect of political structure – less Effect of political structure – less ascription under socialismascription under socialism
The 3rd GenerationThe 3rd Generation
Shift from multivariate linear Shift from multivariate linear regression to loglinear models regression to loglinear models (Hauser 1978)(Hauser 1978)
Advantages of loglinear models Advantages of loglinear models “believed by their advocates to be”:“believed by their advocates to be”:
1.1. Can distinguish absolute from relative Can distinguish absolute from relative mobility chances (social fluidity)mobility chances (social fluidity)
2.2. Can model diagonal (=class immobility) Can model diagonal (=class immobility) and off-diagonal cells separatelyand off-diagonal cells separately
Results from CASMIN ProjectResults from CASMIN Project
1.1. Common classification of Common classification of occupational occupational classesclasses (EGP (EGP categories) categories)
2.2. CASMIN “core model” parameters CASMIN “core model” parameters associated with inheritance effects, associated with inheritance effects, hierarchical effects, sectoral effects, hierarchical effects, sectoral effects, and (dis)affinity effectsand (dis)affinity effects
3.3. Specific substantive conclusions:Specific substantive conclusions:
Results from CASMIN (cont’d)Results from CASMIN (cont’d)
a.a. Inheritance & sectoral effects more Inheritance & sectoral effects more important than hierarchical effects important than hierarchical effects for relative mobility patternsfor relative mobility patterns
b.b. Patterns of relative Patterns of relative intergenerational mobility do not intergenerational mobility do not differ much across industrial differ much across industrial countries (except that relative countries (except that relative mobility is slightly higher in Sweden mobility is slightly higher in Sweden & US)& US)
Problems with CASMINProblems with CASMIN
Other research finds large between-Other research finds large between-country variation in parameters of country variation in parameters of mobility tables (vs. common fluidity mobility tables (vs. common fluidity model)model)
CASMIN loglinear levels model does CASMIN loglinear levels model does not estimate overall characterization not estimate overall characterization of mobility regimeof mobility regime
Other models that do reveal single Other models that do reveal single dimension resembling occupational dimension resembling occupational status ordering of classes status ordering of classes
Results from 3 Generations of Results from 3 Generations of ResearchResearch
Throughout the world intergenerational Throughout the world intergenerational occupational mobility is driven by SES occupational mobility is driven by SES as measured by SEI-type scalesas measured by SEI-type scales
Throughout the world there is excess Throughout the world there is excess intergenerational occupational intergenerational occupational immobility immobility especially in classes with especially in classes with significant proprietorshipsignificant proprietorship
Mobility patterns differ across time and Mobility patterns differ across time and countries; responsible factors not clearcountries; responsible factors not clear
Results (cont’d)Results (cont’d)
Status attainment research suggests Status attainment research suggests that R’sEd is more important that R’sEd is more important determinant of R’sOcc than parental determinant of R’sOcc than parental Occ, and that bulk of R’sEd effect is Occ, and that bulk of R’sEd effect is independent of social originsindependent of social origins
At same time Ed is important At same time Ed is important mechanism of transfer of advantage mechanism of transfer of advantage from generation to generationfrom generation to generation
ConclusionConclusion
““It is evident that firmly established It is evident that firmly established conclusions regarding societal conclusions regarding societal variations and similarities in the variations and similarities in the structure and process of structure and process of intergenerational social mobility are intergenerational social mobility are not numerous. There is much work not numerous. There is much work to be done.” (Ganzeboom et al., p. to be done.” (Ganzeboom et al., p. 297) 297)