social media in teaching and learning --an example of the
TRANSCRIPT
Social Media in Teaching and Learning --an Example of the Tourism Management Faculty in Haikou
Hongjun Fan1,a Dan Cai2,b
1. School of Tourism Management of Hainan College of Economics and Business, Haikou571127, China
2. Haikou Yiyuande Commercial Consultation Co. Ltd, Haikou571127, China [email protected],[email protected]
Keywords: Social Media; UTAUT; Garrett's Ranking; Learning Management System; Privacy Concerns; Tourism Management Faculty
Abstract. The tourism management Faculty personal use of social media has shown an ever increasing trend the professional use of social media has lagged somewhat behind. A majority of tourism management faculty now use social media in a professional context (including all aspects of their profession outside of teaching). This paper attempts to ascertain the current faculty usage of social media. The study used the Unified Theory of Acceptance and Use Technology (UTAUT) to ascertain the faculty perception towards social media Garret's Ranking method to rank tourism management faculty preferences while choosing a social media site for teaching learning purpose. Statistical tools along with percentage analysis were used to analyze the data. The results indicated that although tourism management faculty had high effort expectancy, performance expectancy, behavioral intention, social influence and facilitating conditions for the adoption of social media their usage was largely found to be high for the purpose of reading /listening /watching content rather than for creation of new content. The study also reports the prime barriers to social media usage by tourism management faculty as the lack of integration of social media with the learning management system, lack of social media effectiveness measures and privacy concerns.
1. Introduction Social Media is the future of communication. It provides a countless array of Internet based tools
and platforms that increase and enhance the sharing of information. Social media is becoming an integral part of life online as social websites and applications proliferate. Social Media is not only popular for its capability to allow social networking with friends but it also throws open a plethora of options to educational institutions for promoting their course and curriculum, network with stakeholders, provide personalized services and share knowledge even better than ever before.
Tourism management faculty in higher education form an integral part of the consumer base of social media. Virtually all higher education teaching faculty are aware of the major social media sites and literature from previous research reveals that more than three-quarter visited a social media sites within the past month for their personal use and nearly one-half posted content.
Even more impressive is their rate of adoption of social media in their professional lives: over 90% of all tourism management faculties are using social media in courses they’re teaching or for their professional careers outside the classroom. There are big differences, though, among the pattern of use from one social media site to another. On the side of academy, we still have tourism management faculty who firmly believe that traditional classroom teaching is the most effective way to reach out to our students. When Web 2.0 social media technologies emerged in the market, students quickly bonded themselves to those tools such as YouTube, iTunes, Facebook, blogging, wechat and twittering, to mention a few. The most popular types of social media include social networks such as Facebook and Twitter, file sharing sites such as YouTube and Flicker, blogging sites such as Blogger and also micro blogging sites such as Wechat and Twitter.
International Conference on Education, E-learning and Management Technology (EEMT 2016)
© 2016. The authors - Published by Atlantis Press 498

2. Unified Theory of Acceptance and Use Technology (UTAUT) The acceptance of Social Media by tourism management faculty for teaching may be treated as
information and communication technology acceptance. The UTAUT [12] theory could predict the acceptance of an information communication technology in approximately 70% of the cases. Comparing with TAM, it could only predict the acceptance of an information communication technology in approximately 40% of the cases. On the other hand, the validity of UTAUT in the information system context needs further testing.
Therefore in this study the UTAUT with some of information system successful factors that mentioned below in this section are tested. Thus, the following hypotheses have been proposed for this study. H1: Performance expectancy of tourism management faculty with respect to their intention to use social media for teaching is high H2: Effort expectancy of tourism management faculty with respect to their intention to use social media for teaching is high H3: Social influence of tourism management faculty with respect to their intention to use social media for teaching is high H4: Facilitating conditions of tourism management faculty with respect to their intention to use social media for teaching is high H5: Behavior Intention of tourism management faculty with respect to their intention to use social media for teaching is high
3. Research methodology The questionnaire was developed after thorough review of literature. The structured
questionnaire contained the questions to elicit information based on the various levels of data measurement. The survey was conducted using print copies of structured questionnaire as well as the online forms which were circulated among the tourism management faculty in Haikou city Hainan Province. Most of the questions used the 5-point Likert scale format to record the social media usage pattern of tourism management faculty.
The sampling method is used for the study is snowball sampling. Each respondent referred the next respondent for the study, so the process was repeated for the collection samples used for the study. One -Sample t-test was used for analyzing the data. The one sample t-Test is a statistical procedure for testing the mean value of distribution. It is often used for testing the mean value of hypothesis.
4. Results and discussions 4.1 Factors that act as Barriers to Social Media Usage 4.1.1 Friedman Test
The Friedman test is the non-parametric alternative to the one-way ANOVA with repeated measures. It is used to test for differences between groups when the dependent variable being measured is ordinal. It can also be used for continuous data that has violated the assumptions necessary to run the one-way ANOVA with repeated measures (e.g., data that has marked deviations from normality). This test has been used to rank the various barriers to the usage of Social Media reported by tourism management faculty.
Table l: Friedman Test Test Statistics
Number 100 Chi-Square 90.542 Df 8 Asymp. Sig. .000
a. Friedman Test
499
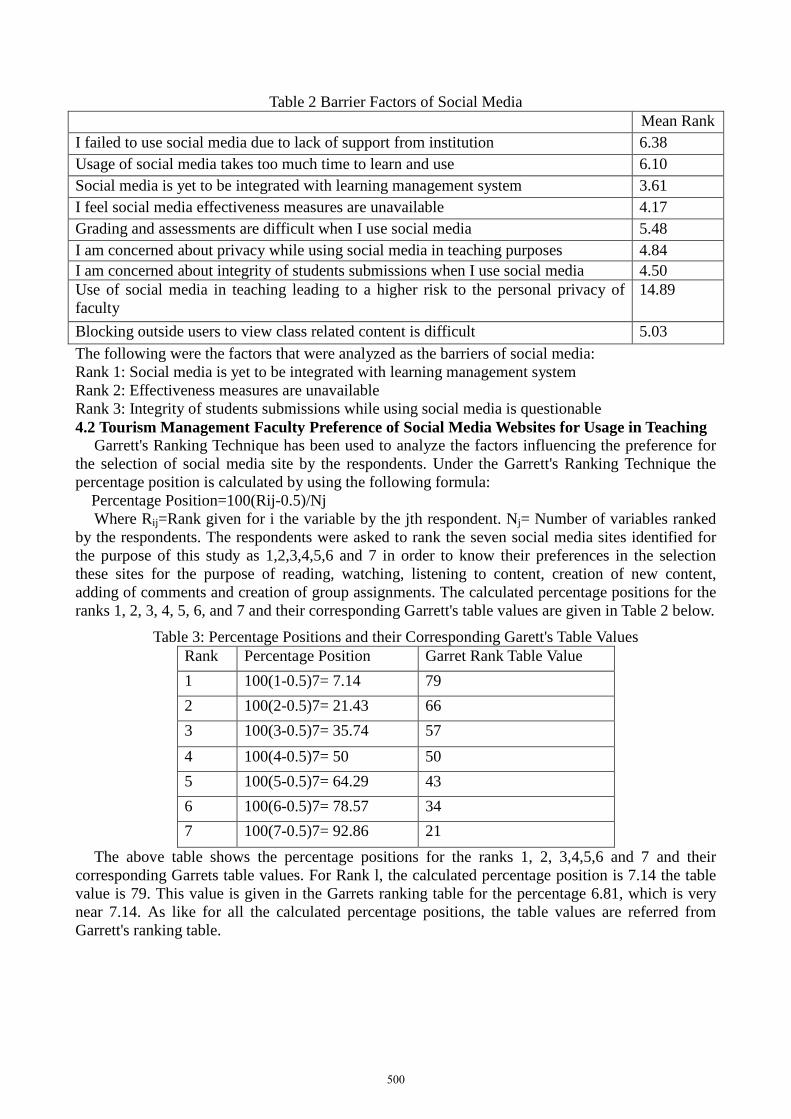
Table 2 Barrier Factors of Social Media Mean Rank I failed to use social media due to lack of support from institution 6.38 Usage of social media takes too much time to learn and use 6.10 Social media is yet to be integrated with learning management system 3.61 I feel social media effectiveness measures are unavailable 4.17 Grading and assessments are difficult when I use social media 5.48 I am concerned about privacy while using social media in teaching purposes 4.84 I am concerned about integrity of students submissions when I use social media 4.50 Use of social media in teaching leading to a higher risk to the personal privacy of faculty
14.89
Blocking outside users to view class related content is difficult 5.03 The following were the factors that were analyzed as the barriers of social media: Rank 1: Social media is yet to be integrated with learning management system Rank 2: Effectiveness measures are unavailable Rank 3: Integrity of students submissions while using social media is questionable 4.2 Tourism Management Faculty Preference of Social Media Websites for Usage in Teaching
Garrett's Ranking Technique has been used to analyze the factors influencing the preference for the selection of social media site by the respondents. Under the Garrett's Ranking Technique the percentage position is calculated by using the following formula:
Percentage Position=100(Rij-0.5)/Nj Where Rij=Rank given for i the variable by the jth respondent. Nj= Number of variables ranked
by the respondents. The respondents were asked to rank the seven social media sites identified for the purpose of this study as 1,2,3,4,5,6 and 7 in order to know their preferences in the selection these sites for the purpose of reading, watching, listening to content, creation of new content, adding of comments and creation of group assignments. The calculated percentage positions for the ranks 1, 2, 3, 4, 5, 6, and 7 and their corresponding Garrett's table values are given in Table 2 below.
Table 3: Percentage Positions and their Corresponding Garett's Table Values Rank Percentage Position Garret Rank Table Value 1 100(1-0.5)7= 7.14 79 2 100(2-0.5)7= 21.43 66 3 100(3-0.5)7= 35.74 57 4 100(4-0.5)7= 50 50 5 100(5-0.5)7= 64.29 43 6 100(6-0.5)7= 78.57 34 7 100(7-0.5)7= 92.86 21
The above table shows the percentage positions for the ranks 1, 2, 3,4,5,6 and 7 and their corresponding Garrets table values. For Rank l, the calculated percentage position is 7.14 the table value is 79. This value is given in the Garrets ranking table for the percentage 6.81, which is very near 7.14. As like for all the calculated percentage positions, the table values are referred from Garrett's ranking table.
500

Table 4: Ranking of Social Media Websites
Media site
Read/Watch/Listen content
Add Comments
Create Content
Group Assignments
Total Respondents
Total Score
Mean Rank
Rank 1 Rank 2 Rank 3 Rank 4 Facebook 50 6 3 1 100 93 0.93 4 Twitter 10 4 2 - 100 24 0.24 7 YouTube 42 - - - 100 42 0.42 6 LinkedIn 18 1 - - 100 18 0.18 8 WhtsApp 19 21 10 3 100 103 1.03 3 Google Drive
3 - 18 36 100 201 2.01 2
Blogs & Wikis
63 - - - 100 63 0.63 5
Wechat 87 - 26 78 100 210 2.1 1
Source: primary Data The study found that among the eight social media websites reviewed, Wechat, Google Drive
and WhtsApp followed by Facebook were the most preferred by the tourism management faculty for teaching and learning purposes. Blogs& Wikis was the fifth most preferred social media followed by Youtube in the sixth position, Twitter was found to be in the seventh position and LinkedIn being the least preferred in the eighth position. 4.3 Performance Expectancy
Performance expectancy is the degree to which an individual believes that using the system will help him or her to attain gains in job performance or improve job performance. In this context performance expectancy refers to social media usage by teachers, performance expectancy denotes the beliefs of tourism management faculty that the usage of social media would be beneficial to them and the student community at large with whom they interact. High performance expectancy denotes a high amount of positive expectation that the usage of social media would result in improved and enhanced results.
Table 5: One Sample Statistics for Performance Expectancy One- Sample Statistics
Number Mean Std. Deviation Std. Error Mean Effort Expectancy 100 14.8391 1.74458 0.18704
One- Sample Statistics Test Value=12
T Df Sig.(2-tailed)
Mean Difference 95%Confidence Interval of the Difference
Lower Upper Effort Expectancy 15.179 86 0.000 2.83908 2.4673 3.2109 Source: primary Data
Ho=Performance expectancy of tourism management faculty with respect to their intention to use social media for teaching is equal to Test mean, H1=Performance expectancy of tourism management faculty with respect to their intention to use social media for teaching is higher than test mean
This test mean compared with the sample mean is found to less. So we reject the null hypothesis. From above One sample T-test, it was found that the test was significant i.e.; p value =.000, so it is statistically proven that the Performance expectancy mean is higher than the test mean. So we infer that the tourism management faculty has high performance expectancy with respect to the use of
501
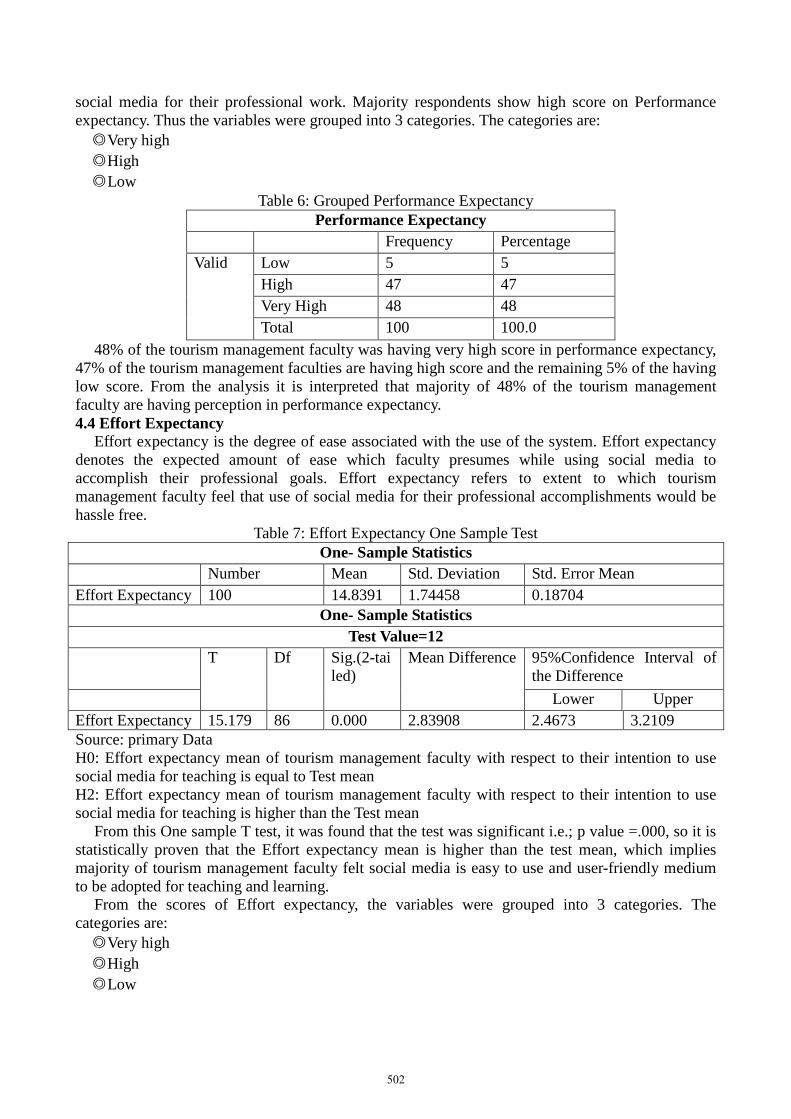
social media for their professional work. Majority respondents show high score on Performance expectancy. Thus the variables were grouped into 3 categories. The categories are: ◎Very high ◎High ◎Low
Table 6: Grouped Performance Expectancy Performance Expectancy
Frequency Percentage Valid Low 5 5
High 47 47 Very High 48 48 Total 100 100.0
48% of the tourism management faculty was having very high score in performance expectancy, 47% of the tourism management faculties are having high score and the remaining 5% of the having low score. From the analysis it is interpreted that majority of 48% of the tourism management faculty are having perception in performance expectancy. 4.4 Effort Expectancy
Effort expectancy is the degree of ease associated with the use of the system. Effort expectancy denotes the expected amount of ease which faculty presumes while using social media to accomplish their professional goals. Effort expectancy refers to extent to which tourism management faculty feel that use of social media for their professional accomplishments would be hassle free.
Table 7: Effort Expectancy One Sample Test One- Sample Statistics
Number Mean Std. Deviation Std. Error Mean Effort Expectancy 100 14.8391 1.74458 0.18704
One- Sample Statistics Test Value=12
T Df Sig.(2-tailed)
Mean Difference 95%Confidence Interval of the Difference
Lower Upper Effort Expectancy 15.179 86 0.000 2.83908 2.4673 3.2109 Source: primary Data H0: Effort expectancy mean of tourism management faculty with respect to their intention to use social media for teaching is equal to Test mean H2: Effort expectancy mean of tourism management faculty with respect to their intention to use social media for teaching is higher than the Test mean
From this One sample T test, it was found that the test was significant i.e.; p value =.000, so it is statistically proven that the Effort expectancy mean is higher than the test mean, which implies majority of tourism management faculty felt social media is easy to use and user-friendly medium to be adopted for teaching and learning.
From the scores of Effort expectancy, the variables were grouped into 3 categories. The categories are: ◎Very high ◎High ◎Low
502
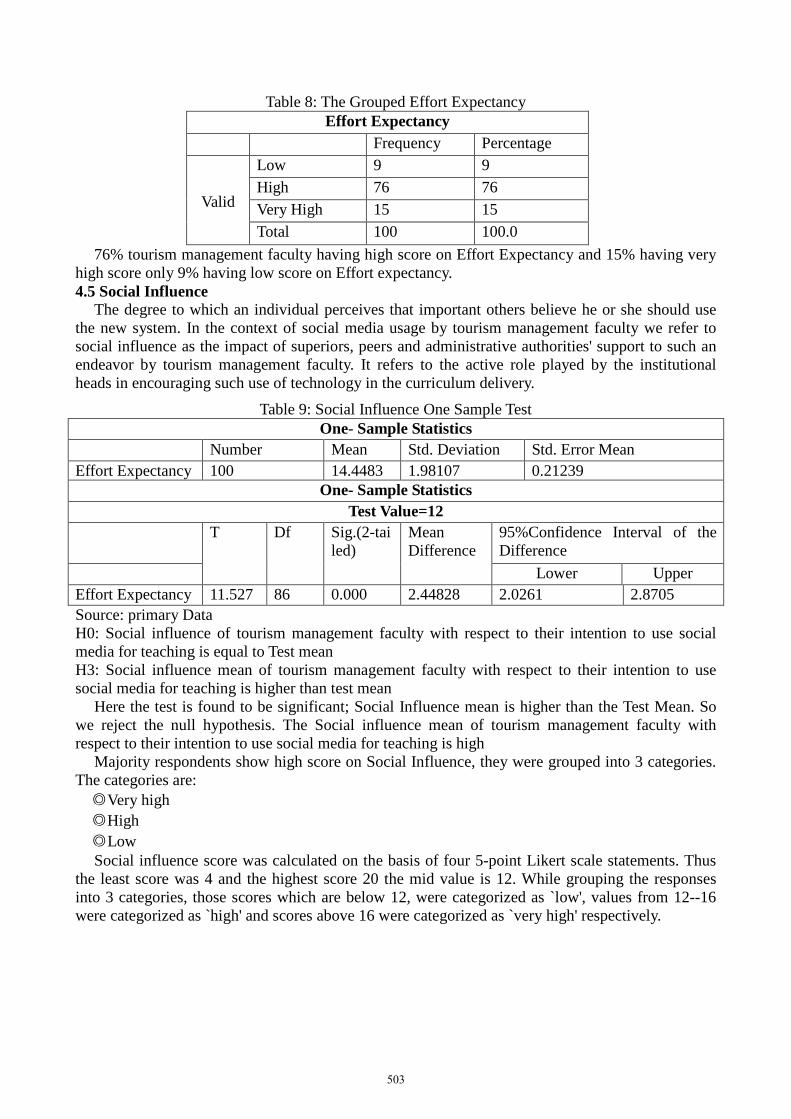
Table 8: The Grouped Effort Expectancy Effort Expectancy
Frequency Percentage
Valid
Low 9 9 High 76 76 Very High 15 15 Total 100 100.0
76% tourism management faculty having high score on Effort Expectancy and 15% having very high score only 9% having low score on Effort expectancy. 4.5 Social Influence
The degree to which an individual perceives that important others believe he or she should use the new system. In the context of social media usage by tourism management faculty we refer to social influence as the impact of superiors, peers and administrative authorities' support to such an endeavor by tourism management faculty. It refers to the active role played by the institutional heads in encouraging such use of technology in the curriculum delivery.
Table 9: Social Influence One Sample Test One- Sample Statistics
Number Mean Std. Deviation Std. Error Mean Effort Expectancy 100 14.4483 1.98107 0.21239
One- Sample Statistics Test Value=12
T Df Sig.(2-tailed)
Mean Difference
95%Confidence Interval of the Difference
Lower Upper Effort Expectancy 11.527 86 0.000 2.44828 2.0261 2.8705 Source: primary Data H0: Social influence of tourism management faculty with respect to their intention to use social media for teaching is equal to Test mean H3: Social influence mean of tourism management faculty with respect to their intention to use social media for teaching is higher than test mean
Here the test is found to be significant; Social Influence mean is higher than the Test Mean. So we reject the null hypothesis. The Social influence mean of tourism management faculty with respect to their intention to use social media for teaching is high
Majority respondents show high score on Social Influence, they were grouped into 3 categories. The categories are: ◎Very high ◎High ◎Low Social influence score was calculated on the basis of four 5-point Likert scale statements. Thus
the least score was 4 and the highest score 20 the mid value is 12. While grouping the responses into 3 categories, those scores which are below 12, were categorized as `low', values from 12--16 were categorized as `high' and scores above 16 were categorized as `very high' respectively.
503

Table 10: Grouped Social Influence Social Influence
Frequency Percentage
Valid
Low 17 17 High 73 73 Very High 10 10 Total 100 100.0
This shows the high score on Social influence by tourism management faculty is 73%, 17% having low score and 10% having very high score. 4.6 Facilitating Conditions
Facilitating conditions means the degree to which an individual believes that an organizational and technical infrastructure exists to support use of the system. It includes training to tourism management faculty, hands-on user support through user manuals and expert solutions to faculty queries, physical infrastructure support in terms of dedicated networks connecting classrooms with Internet, uninterrupted power supply ready availability of laptops, desktops scanners and printers.
Table 11: One Sample Test of Facilitating Conditions One- Sample Statistics
Number Mean Std. Deviation Std. Error Mean Effort Expectancy 100 14.3103 1.90660 0.20441
One- Sample Statistics Test Value=12
T Df Sig.(2-tailed)
Mean Difference 95%Confidence Interval of the Difference
Lower Upper Effort Expectancy 11.303 86 0.000 2.31034 1.9040 2.87167 Source: primary Data Ho: Facilitating conditions of tourism management faculty with respect to their intention to use social media for teaching is equal to Test mean H1: Facilitating conditions of tourism management faculty with respect to their intention to use social media for teaching is higher than the Test mean This test mean compared with the sample mean...So we reject the null hypothesis. The test was significant, so it is statistically proven that the Facilitating conditions mean is higher than the test mean. Thus it can be concluded that tourism management faculty perceive facilitating conditions as conducive for the usage of social media. The respondents for this study shows high score on Facilitating conditions were, they were grouped into 3 categories. The categories are: ◎Very high ◎High ◎Low
Table 12: Grouped Facilitating Conditions score Facilitating Conditions
Frequency Percentage
Valid
Low 20 20 High 70 70 Very High 10 10 Total 100 100.0
Low Facilitating conditions variable include 4 questions of 5 point Likert scale. Thus the least score will be 4 and the highest score would be 20. The mid value is 12. While grouping the
504
responses into 3 categories, those scores which are below 12, were categorized as `low', values from 12--16 were categorized as `high' and scores above 16 were categorized as `very high' respectively.
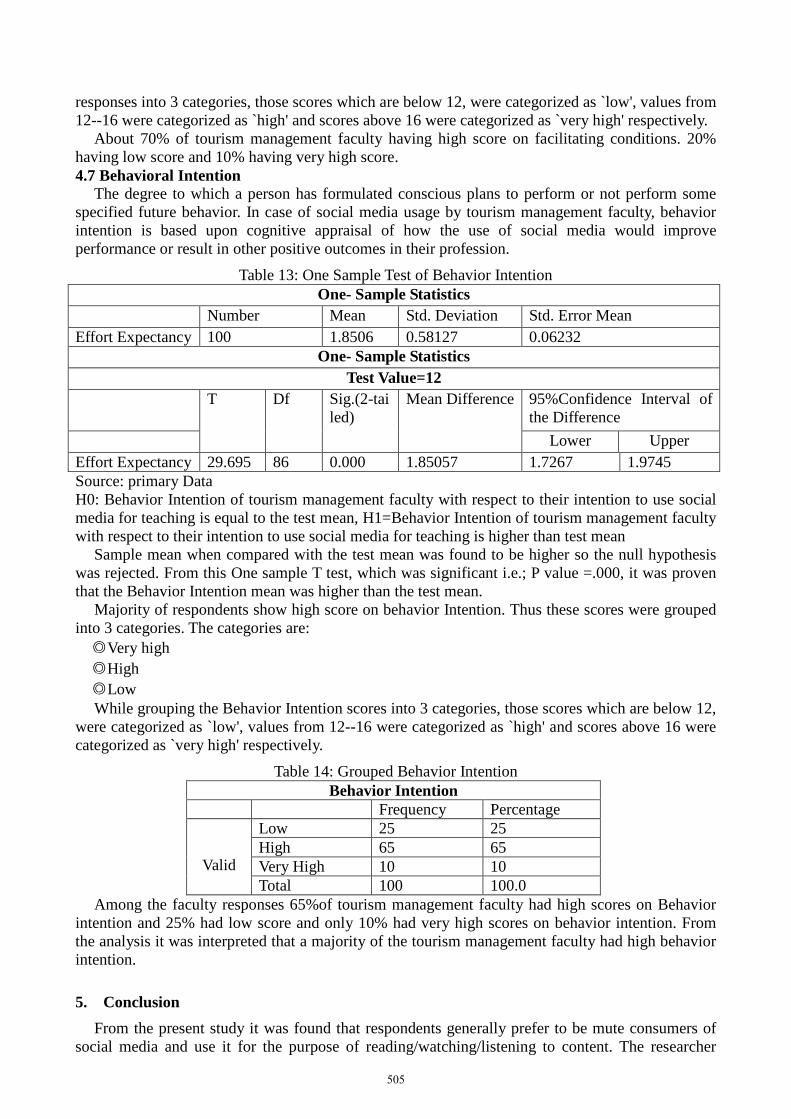
About 70% of tourism management faculty having high score on facilitating conditions. 20% having low score and 10% having very high score. 4.7 Behavioral Intention
The degree to which a person has formulated conscious plans to perform or not perform some specified future behavior. In case of social media usage by tourism management faculty, behavior intention is based upon cognitive appraisal of how the use of social media would improve performance or result in other positive outcomes in their profession.
Table 13: One Sample Test of Behavior Intention One- Sample Statistics
Number Mean Std. Deviation Std. Error Mean Effort Expectancy 100 1.8506 0.58127 0.06232
One- Sample Statistics Test Value=12
T Df Sig.(2-tailed)
Mean Difference 95%Confidence Interval of the Difference
Lower Upper Effort Expectancy 29.695 86 0.000 1.85057 1.7267 1.9745 Source: primary Data H0: Behavior Intention of tourism management faculty with respect to their intention to use social media for teaching is equal to the test mean, H1=Behavior Intention of tourism management faculty with respect to their intention to use social media for teaching is higher than test mean
Sample mean when compared with the test mean was found to be higher so the null hypothesis was rejected. From this One sample T test, which was significant i.e.; P value =.000, it was proven that the Behavior Intention mean was higher than the test mean.
Majority of respondents show high score on behavior Intention. Thus these scores were grouped into 3 categories. The categories are: ◎Very high ◎High ◎Low While grouping the Behavior Intention scores into 3 categories, those scores which are below 12,
were categorized as `low', values from 12--16 were categorized as `high' and scores above 16 were categorized as `very high' respectively.
Table 14: Grouped Behavior Intention Behavior Intention
Frequency Percentage
Valid
Low 25 25 High 65 65 Very High 10 10 Total 100 100.0
Among the faculty responses 65%of tourism management faculty had high scores on Behavior intention and 25% had low score and only 10% had very high scores on behavior intention. From the analysis it was interpreted that a majority of the tourism management faculty had high behavior intention.
5. Conclusion From the present study it was found that respondents generally prefer to be mute consumers of
social media and use it for the purpose of reading/watching/listening to content. The researcher
505
through the study attempted to ascertain the extent to which tourism management faculty were using social media for creation of content. The result however show that although social media is popular among tourism management faculty for the purpose of reading/watching/listening to content the same as not true when it comes to creation of content. It is worthwhile to note that Wechat and Google Drive have emerged as the most popular social media among the tourism management faculty. Further on the study analyzes various barriers that deterred tourism management faculty from using social media for teaching, learning purposes. Among the various factors that were analyzed, the most highly ranked was the lack of social media integration with learning management system followed by lack of social media effectiveness measures. The dearth of mechanisms to ensure the integrity of student's submissions while using social media for teaching learning purposes was ranked as third most important deterrent in this study. This study reiterates the fact that although social media is all so popular among the masses, due to the lack of proper mechanisms which integrate Social media it to the learning management system, tourism management faculty are still unable to explore the full potential of this mode of communication to share with the student community their valuable insights.
6. Acknowledgment This paper was a mid-term study result of the Planning Research Project of Hainan’s Society of
Philosophy and Social Sciences, “The Research on Tourism Marketing Model based on the micro-computer Information Platform”(NO:HNSK(JD)15-23).
7. References
[1] Brooks, S. (2015). Does personal social media usage affect efficiency and well-being? Computers in Huwan Behavior, pp.26-37.
[2] Alwagait, E., Shahzad B., & Alim, S. (2014). Impact of social media usage on students academic performance in Saudi Arabia. Computers in Huwan Behavior.
[3] Chen, B., & Marcus, J. (2012).Students` self-presentation on Facebook: An examination of personality and self-construct factors. Computers in Huwan Behavior, pp.2091-2099.
[4] Rooyen, A. V. (2015). Distance Education Accounting Students’ Perceptions of Social Media Integration. Proceed-Social and Behavioral Sciences, pp.444-450
[5] Rienties B., Brouwer N.,& Lygo-Baker S. (2013). The effects of online professional development on higher education teachers' beliefs and intentions towards learning facilitation and technology. Teaching and Teacher Education, pp.122-131.
[6] Gruzd, A., Staves, K., & Wilk, A. (2012). Connected scholars: Examining the role of social media in research practices of faculty using the UTAUT model. Computers in Huwan Behavior, pp.2340-2350.
[7] Zolkepli, I. A. & Kamarulzaman, Y (2015). social media adoption: The role of media needs and innovation characteristics. Computers in Huwan Behavior, pp.189-209
[8] Mohammadi, H. (2015). Factors affecting the e-learning outcomes: An integration of TAM and IS success model. Telematics and Informality, pp.701-719.
[9] Rosmala, D., & Falahah.(2012). Study of Social Networking usage in Higher Education Environment. Social and Behavioral Sciences, pp.156-166.
[10]Ainin S., Naqshbandi M., Moghavvemi S. & jaafar N. I. (2015). Facebook usage, socialization and academic performance. Computers & Education, pp.64-73
506
[11] Aqda M., Hamidi F., & Rahimi M. (2011). The comparative effect of computer-aided instruction and traditional teaching on student`s creativity in math classes. Proceed Computer Science, pp.266-270.
[12] J. Marchewka C. Liu and K. Kostiwa. "An Application of the UTAUT Model for Understanding Student Perceptions Using Course Management Software." Communications of the IIMA, vol. 7, PP. 93-104, 2007
507