social inequalities in educational attainment. the
TRANSCRIPT

1
Social inequalities in educational attainment. The
changing impact of parents’ social class, social status,
education, and family: England 1986 and 2010
Nicola Pensiero UCL Institute of Education, UK
Ingrid Schoon UCL Institute of Education, UK
Abstract
There is controversy regarding trends over time in the
association between social origins and educational outcomes
in the UK. An explanation may lie in different methods of
analysis. This article provides new evidence about trends in
inequality between the 1980s and 2010s and informs the
debate about the conceptualisation and operationalisation of
social origins. It expands the multidimensional
conceptualisation of social origins proposed by Bukodi and
Goldthorpe (2013) by adding a separate indicator of family
income to those of class, status, and education of parents.
Results from two UK age cohorts born in 1970 (BCS70) and
1989/90 (Next Steps) show that social class, social status,
education and income all have independent effects on
educational attainment and can show different patterns of
stability or variability over time. Moreover, the study
highlights the importance of transitions to upper
secondary education for a more comprehensive

2
understanding of inequalities in educational progression
and attainment.
1 Introduction
A series of longitudinal studies has confirmed social origins as
important determinants of educational attainment. However, there is
still controversy about the trend across British cohorts in educational
inequalities, that is in the association between social origins and
educational attainment (Blanden, Gregg & Macmillan, 2013;
Goldthorpe, 2013; Bukodi and Goldthorpe, 2016). The UK seems to have
followed an equalising trend in educational attainment in the first half
of the 20th century (Breen, Luijkx, Müller, & Pollak, 2009), while
throughout the second half, when radical changes in educational
policy occurred, it is not clear whether educational inequality was
falling, rising or on a flat line (Goldthorpe, 2013, 2016).
Plausible explanations of the diverging evidence concern differences
in methodology and conceptualisation of constructs. Some researchers
model education outcomes as the highest level of qualification attained
(for example Breen et al., 2009), whilst others consider a sequence of
transitions from lower to higher levels (Mare, 1981; 1980). The
definition of individuals’ educational attainment can also differ in
respect to absolute versus relative value assigned to education (the
latter treating education as a ‘positional’ good (Bukodi &
Goldthorpe, 2016).
This article argues that the uncertain direction of trends has another
cause that has received relatively little attention: the incomplete

3
conceptualisation and measurement of social origins (Bukodi, Eibl,
Buchholz, Marzadro, Minello, Wahler & Schizzerotto, 2018; Bukodi,
Erikson & Goldthorpe, 2014; Bukodi & Goldthorpe, 2013). We use four
distinct indicators of social origin, i.e. social class, social status, family
income and parental education.
We conceptualise educational attainment as a series of three transitions
of increasing difficulty up the qualification ladder up until A-levels, the
higher set of school leaving exams which are the gateway to university.
Our analysis of these transitions examines variations in the influence of
social origins at different stages of the education progression instead at a
distinct outcome.
In analysing the effect of social origins on the probability of
obtaining qualifications in England, the present article advances existing
research in three ways. First, it includes four key indicators of
social origins: social class, parental education, social status and family
income. Second, it updates evidence on recent trends, using cohorts born
in 1970 and 1989/1990. Third, viewing educational attainment as progress
transitions, it explores variations in the influence of social origins at
different stages of education progression instead of one distinct outcome.
The results should help inform interventions to boost education equality at
critical windows of development.
2 The conceptualisation of social origins
By social origins we refer to different strata of hierarchy in society,
which can be conceptualised i n different ways. Traditionally, among

4
sociologists, social origins have been seen through a one-dimensional
lens, focus ing primarily on parental social class (Breen et al., 2009;
Goldthorpe, 2016; Shavit, Arum, & Gamoran, 2007). The notion of social
class identifies the worker’s position within the relationships of production
in firms and labour markets (Erikson & Goldthorpe, 1992; Erikson,
Goldthorpe, & Portocarero, 1979). Parental education h a s been also
included to complement the definition of social origins, especially when
the outcome of interest is the child’s education. Economists h a v e
mostly used family income instead of parental social class, as for
example in the literature on educational inequalities in Britain (Blanden,
Gregg & Machin, 2005; Blanden & Macmillan, 2016; Gregg &
Macmillan, 2010). Others suggested that the predominantly one-
dimensional treatment of social origins is inadequate and might partly
explain the divergent findings on trends in educational inequalities
(Bukodi, Erikson, & Goldthorpe, 2014; Bukodi & Goldthorpe, 2013;
Goldthorpe, 2013; Jæger, 2007).
Jæger (2007), following Bourdieu (1984), p r o p o s e s that in
analysing the effect of social origins on educational outcomes, social
class should be accompanied by other factors aiming at capturing the
resources that social class might proxy – parental economic, cultural
and social capital. In this way he argues the effect of social class can
be decomposed into more specific effects.While Bukodi and
Goldthorpe (2013) endorsed the multi-dimensional treatment of social
origins, they criticised Jæger’s approach from a Weberian perspective. In
particular they contend that commonly used social class schemata such
as such as the Erikson-Goldthorpe-Portocarero (EGP) or the
Comparative Analysis of Social Mobility in Industrial Nations
(CASMIN) (Erikson & Goldthorpe, 1992; Erikson et al., 1979) are not
designed to proxy other kinds of resources, but rather are intended to

5
distinguish occupations in terms of social relations in labour market and
in the production process. Social class thus defined, it is argued, is a
valid indicator of income levels, security and prospects (Chan &
Goldthorpe, 2007; Goldthorpe & McKnight, 2006) and therefore it well
covers parental economic resources, making the use of an additional
indicator of economic resources unnecessary. Furthermore, social class
is at the same level of abstraction of socio-cultural resources rather
than serving as a proxy for them and is, similarly, a relational concept.
Thus, Bukodi and Goldthorpe (2013) suggest decomposing social origin
instead of decomposing social class. They would complement social
class with social status as an indicator of socio-cultural resources. Social
status is understood as an indicator of a structure of relations of
perceived social superiority, social equality, and s o c i a l inferiority, as
expressed in selective intimate relationships and in distinctive
lifestyles. While the class structure is grounded in relationships within
labour markets and production units (Erikson & Goldthorpe, 1992;
Erikson et al., 1979), the social status order refers to relations of
perceived social standing. It distinguishes between those who, by virtue
of their higher position and ascribed attributes, behave as superiors and
those who have a less advantaged position and consequently behave
with deference. Although the expression of social status is less overt and
more implicit nowadays, it is still recognisable in social networks (Chan
& Goldthorpe, 2007; 2010).
Another indicator considered is parental education, understood as an
indicator of “educational resources”, providing a supportive home
learning environment and knowledge about how to navigate the
educational system (Bukodi & Goldthorpe, 2013; Erikson & Jonsson,
1996;). Although they did also find some very small independent effect of
family income in one cohort, Bukodi and Goldthorpe (2013) conclude

6
that social status in combination with social class and parental
education should comprehensively account for social origin effects on
educational attainment.
In this article we follow Bukodi and Goldthorpe (2013) and Bukodi
et al. (2014) in decomposing social origins into social, occupational
and educational components, but add family income as a separate
indicator. A substantial portion of permanent income, in fact, is
unrelated to social class, which therefore might not be a sufficient
proxy of the variation in economic status between families (Blanden et
al., 2013; Grusky and Weeden, 2001; McIntosh and Munk, 2009).
Furthermore, the relevance of social class for children’s educational
attainment is not limited to the opportunities that income entails.
More generally, social classes specify the s o c i a l r e l a t i o n s w i t h i n
t h e labour market and can determine standards of living and life
chances. Apart from the opportunities for income, social class also
determines the quality of work conditions (job security, career
opportunities, working hours and stress) which in turn have a specific
relevance for children’s educational attainment by influencing the
quality and quantity of the relationship between family members
including family disruptions (Furstenberg & Kiernan, 2001; Menning,
2002, Perry-Jenkins, Goldberg, Pierce & Sayer, 2007; White & Keith,
1990).
3 Changes in the educational
system
In considering trends in educational inequality it is important to take
account of the changing socio-historical context. Both of our cohorts
faced a compulsory school leaving age of 16 (introduced in 1973), but this

7
study covers a period of further educational expansion and major
changes in the education system from the late 1980s onwards. In 1988
there was a switch from GCE O-levels system (General Certificate of
Education, Ordinary levels) to GCSEs (General Certificate of
Secondary Education), see Table 1. Under the former regime, more
academically oriented students took O(Ordinary)-levels at age 16 and
A(Advanced)-levels at age 18. A-levels are the requirement for
entering higher education. Less “academic” pupils could take the
Certificate of Secondary Education (CSE) at 16 (which we treat as the
lowest academic qualification) or vocationally oriented programs. The
1970 cohort was one of the last to be educated under the GCE O- level
system. The 1988 reform combined O- level and CSE exams into General
Certificate of Secondary Education (GCSEs), which were u s u a l l y
taken at age 16 Students no longer had to decide whether to take the
less academic CSE or the more academic O-level exams. This, in turn,
is thought to increase the participation of those in the middle of the
skill distribution and in particular of those at the borderline between
academically oriented and less academically oriented students.
Moreover, the GCE O-level system was based exclusively on exam
performance whilst the GCSEs also take into account the coursework.
Table 1 here
GCSEs turned out to be more accessible than the O-levels and the
result of the reform was that a higher proportion of students – 93% of
members of the Next Steps (1990) cohort against 76% of the 1970 cohort
– left the school with at least some academic qualifications. Focusing on
the post-compulsory phase, 38% of the more recent cohort attained an
A-level qualification, against 16% of the previous (Table 2). Level 2
8
academic qualifications were reached by 58% of the more recent cohort.
The previous cohort’s attainment of level 2 appears higher (64%), but
this could reflect an overstatement of GCSEs qualifications as discussed
later.
Table 2 Around here
In the 1980s, participation i n post-compulsory education in the UK
was low by international standards. In an attempt to raise it, two other
major policies were introduced. The first was designed to enhance the
labour market value of vocational qualifications. The second was the
introduction of an Education Maintenance Allowance (EMA), which
paid individuals from disadvantaged backgrounds a small means-tested
allowance if they stayed on in full-time education beyond the age of 16.
Evaluations of the EMA suggest that the subsidy increased
participation not only in full- time education beyond the compulsory
school leaving age but also in full-time education subsequently. Started
in 1999 on a pilot basis, EMA was rolled out throughout the UK in
2004 and would have been available to the Next Steps cohort. Research
suggests that it is one the factors that have enhanced the post-
compulsory participation (Dearden, Emmerson, Frayne, & Meghir,
2005).
The most recent reforms of the vocational education system, the development
of the General National Vocational Qualifications ( GNVQs), introduced in
1992 and National Vocational Qualifications (NVQs) from 1998, have not,
overall, been successful in terms of enhancing the labour market value of
vocational qualifications (Dearden, McIntosh, Myck. & Vignoles, 2002; Machin &
Vignoles, 2006). The system of vocational training and qualifications in the UK

9
is complex and is not unified, as in other countries such as Germany or Austria.
Regulation and governance is generally more liberal and market-oriented than
in other systems, with much diversity in programmes and types of providers,
including private training organisations (Crawford-Lee, 2016; Green, 2002;
Raffe, Brannen, Fairgrieve, & Martin, 2001; Wolf, 2011). The perennial
attempts to enhance the attractiveness of vocational qualifications have not
succeeded in increasing the esteem of the different vocational qualifications
available. Despite the confusion that this has generated regarding the value of
vocational qualifications, full-time vocational education represents a substantial
part of the UK education system and the proportion of children choosing it has
risen from 15% in the mid-1980s to around 25% of all 16- and 17-year olds
in the 1990s in the UK (West & Steedman, 2003). Research documents that
NVQs and GNVQs have little value in the labour market and in the case of
NVQs they are even detrimental to wages (Dearden et a., 2002; Dieckhoff,
2008). Given the variability of the content and economic value of vocational
qualifications across subsequent reforms, we decided to exclude vocational
qualifications from the definition of children’s educational attainment and to
focus exclusively on the academic ones. Academic qualifications have a higher
status and have retained their esteem and labour market value in the period of
expansion of education that is under investigation (Machin & Vignoles, 2006).
Another major transformation of the UK education system that might
have affected social inequality in educational attainment is the
introduction of market mechanisms. In response to widespread concerns
about falling standards in UK education, Conservative as well as Labour
governments in the 1980s and 1990s set up “market mechanisms” in the
UK education system, including parental choice, parent representation
on governing bodies and linking school funding with student enrolment
numbers (Gregg & Macmillan 2010; Heath, Sullivan, Boliver & Zimdars
201; Lupton, Heath & Salter, 2009). Alongside greater parental choice,

10
the reforms also made more information about the effectiveness of schools
available to parents and the public, in the form of publicly available test
score information, known as’ League Tables’ (Hansen & Vignoles, 2005;
Machin & Vignoles, 2006). Increased competition among schools and
decentralisation of school finance can potentially enhance attainment,
but can raise inequality as well because advantaged families are better
able to take advantage of the diverse opportunities created by a more
market-oriented system (Blanden, Gregg & Machin, 2005; Galindo-
Rueda & Vignoles, 2005; Gibbons & Machin, 2008). While the 1970
cohort was educated in the period prior to the market-oriented reforms,
the 1990 cohort experienced a system that was already transformed by
those reforms. Whether the reforms are reflected in a change in social class
differentials in attainment is explored in the next section.
4 Previous research
Previous evidence suggests that the dependence of educational
attainment on household income has increased over time in the UK at
the tertiary level, while it has gone down for secondary qualifications after
the introduction of GCSEs in 1988. Blanden and Gregg (2004) found
that the relationship between family income and final educational
outcome has been strengthening across cohorts born in 1958 and 1970.
By contrast, Gregg and Macmillan (2010) showed that the gradient of
educational attainment at age 16 by social origins (income or class) has
lessened between generations born in the 1970s and those born in the
1980s and early 1990s. They relate the improvement in equality of
educational opportunity in educational attainment at age 16 to the 1988
reform introducing GCSE qualifications.

11
Blanden, et al., (2005) confirmed an initial increase in inequality in post-
16 participation by family income, followed by a decline after the
introduction of GCSEs in 1988, and an increase at the tertiary level.
The rapid expansion of higher education, they argue, had benefited
children from wealthier families, disproportionately. The argument is
supported by Galindo-Rueda and Vignoles (2005). They examined the
relative importance of family background and ability and found that the
importance of ability in accounting for educational attainment has
declined over time, whilst that of parental class and parental
education has increased. They attribute this partly to the fact that less
able children from advantaged backgrounds have benefited most from the
largest increase in educational participation.
Boliver (2011) has shown that educational expansion, in and of
itself, has not caused educational inequalities to decline in the UK.
Instead, she found that social class inequalities in British higher
education (HE) have been maintained both quantitatively, in terms of
persistence of social class differentials in HE enrolment, and
qualitatively, in terms of differential access to higher status courses.
Similarly, Schoon (2010) confirmed that the association between
academic attainment and a composite index of family social
background comprising parental education and social class has
remained stable over time, while the association between academic
attainment a n d general cognitive ability decreased for the 1970
cohort compared to the 1958 and 1946 cohorts. Social background
(whether as class or parental education) also showed persisting
associations with transitions at 16 to A-levels and at age 18 to
university in cohorts born from 1958 to 1991 (Jackson, 2013).
Most of these studies examined a limited variety of family
background factors. Bukodi and Goldthorpe (2013) have dealt with the
12
omission of relevant factors from a conceptual perspective, by
decomposing social origins into parental class, parental status and
parental education. Using evidence from the 1946, 1958 and 1970
British birth cohorts, they found that these three components of social
origins have independent and distinctive effects on children’s
educational attainment. In detail they found a stable effect of parental
class, a weakening effect of parental status and a stronger effect of
parental education. From this follows that if any of these factors was
chosen as the sole indicator of social origin, it would cause an
overestimation of the effect of that factor and an underestimation of
the total effect of social origins.
5 Research questions
This article contributes to the debate over trends in educational
inequality by addressing the following questions. Do parents’ class,
education, social status and family income show an independent effect on
children’s educational attainment? If so, which of the different socio-
economic family resources are implicated in producing educational
inequalities. Does one set of resources become more important compared
to another? Do the different indicators show similar or different trends?
For the younger cohort, we include information on highest
qualifications attained by 2010, as collected at age 19/20. By then most
cohorts members will already have attained level 3 qualifications (entry to
university qualifications), but not all of them will have decided whether to
enter university. For this reason we focus on level 3 qualifications as the
final educational outcome, which enables us to assess inequalities before
making the step to university.

13
6 Data and operationalisations
6.1 Data
We use data from two cohort studies, the 1970 British Cohort Study
(BCS70) and Next Steps, formerly the Longitudinal Study of Young
People in England (LSYPE). The BCS70 has collected rich information
from a sample of around 17,000 individuals, all of whom were born in
one week in 1970 (Elliott & Shepherd, 2006). Subsequent surveys took
place when the cohort members were aged 5, 10, 16, 26, 30, 34, 38
and 42 years. Our study sample comprises around 8,500 study members
who l ived in England a t age 10 and participated in both the 10-
year survey (for the social origins indicators) and 30-year survey
(when education history was collected through self-reports).
Next Steps is a cohort study of pupils in England born between
September 1989 and August 1990 and their parents (or carers). Data
were collected annually between 2004 and 2010 (waves 1–7), with data
currently available up to wave 8, collected in 2015 at age 25/26. A
sample of around 15,800 members participated in wave 1. Next Steps
uses a complex survey design to over-sample deprived areas, thus
requiring the use of sample weights in order to restore population
representativeness. The data on educational qualifications are taken
from administrative records, the National Pupil Data (NPD) which were
linked to the survey members by the Department of Education. This
study sample comprises 12,264 individuals who participated in the
13/14 years-old survey and had non-missing values on educational
attainment by age 20/21 (from the NPD).

14
6.2 Variables
In operationalising cohort members’ highest educational
attainment, we focus on academic qualifications (ie excluding vocational
qualifications). The coding of educational qualifications reflects the step
structure of the UK education system. Our sequence of qualifications
has a baseline of no academic qualifications (level 0); Level (1)
is attainments immediately above this GCSE grades D-G; and CSE
grades 2-5; Level ( 2) is /O-levels / CSE grade1/ and, for the second
cohort, GCSE grades A*–C. Level (3) for both cohorts is A-levels (see
table 1). Data on completed qualifications in the Next Steps are available
up age 20/21, using NPD. In order to generate a comparable indicator for
the BCS70, we used the history data of qualifications reported by the
BCS70 members at age 30. From the retrospective self-reported
information regarding qualifications, we were able to derive the A-level
qualifications obtained at age 20. The definition of the qualifications
implies that if cohort members have not gained A-levels by age 20
they are assigned a level 2 qualifications (if they have one) regardless
of qualifications attained later on. It should be noted that in the BCS
30-year-old survey, level 2 qualifications are likely to be biased
upward. More than 1000 cohort members reported having obtained
one or more GCSEs before the introduction of GCSEs examinations
(1988) (Shepherd 2001 p 42), possibly due to confusion of CSE and
GSCE qualifications (the former are more likely to have been level 1
than GCSE). On the other hand, in Next Steps, there is a possible
small downward bias to records of Level 2+ qualifications due to
under-reporting of students attending independent schools (personal
communication, Dr Morag Henderson).The variables available in the
datasets on parental social class allow us to code class origins in the
Goldthorpe schema, seven-category version. The BCS70 contains

15
information on the Socio-Economic Group of both parents (SEG) at
respondents’ age 10. Following the recoding procedure described in
Goldthorpe and Jackson (2007) we recoded the SEG to the Goldthorpe
class schema. In the Next Steps cohort we coded parental class using
the National Statistics Socio-economic Classification (NS-SEC), which
represent the Goldthorpe class schema for Britain (Goldthorpe, 2007)
(see also Office of National Statistics – The National Statistics Socio-
economic classification (NS-SEC)). In cases where both parents are
employed we select the higher of the parents’ class in line with the
dominance approach (Erikson, 1984).
Our indicator of parental social status is based on the scale proposed
by Chan and Goldthorpe (2004), which is derived from the occupational
structure of close friendship relations. Cohort members’ parents are
coded to the 31 categories of the scale on the basis of the allocation to
Standard Occupational Classification 1990 (SOC90) occupational unit-
groups. Where both parents can be allocated to the scale, we adopted the
dominance approach. In the first wave of the Next Steps, there was
insufficient detail on both parents’ occupational unit group, so we used
data from the second sweep to construct the social status indicator.
Parental education is defined as the highest academic qualification of
either parent (dominance approach). It has been shown that the
commonly used qualifications variable, which treats vocational and
academic qualifications (NVQ) as equivalents has less predictive power
of children’s educational outcomes than a variable giving prominence to
academic qualifications (Sullivan, Ketende & Joshi, 2013). Accordingly we
classified parental education on the basis of academic-qualifications in the
same way as the cohort members, adding a level (4) for degree level
qualification or higher.

16
Information on family income is banded in both in the BCS and
Next Steps, therefore income cannot be directly operationalised as an
interval variable (or percentiles). We constructed an indicator of four
groups that is the finest-grained possible given the limits imposed by
those bands. The resulting variable distinguishes between the bottom
7% of families, a second group comprising the next 30%, a third group of
34% , and finally the top 29% of families. We did not attempt to
construct a continuous estimate of income because the covariates that
would be used to impute values within intervals might introduce
multicollinearity.
In order to deal with the potential issue of multicollinearity arising
from the use of different indicators of social origins we used two main
diagnostic procedures: regressing each of the independent variables on
the others (and a dummy variable indicating the cohort) and calculating
the (pseudo)- R-squared value; and secondly, latent class analysis of the
different indicators, assuming that they are manifestations of a single
latent factor (Hagenaars & McCutcheon, 2002; Muthén, 2001). The
findings disconfirm that multi-collinearity is an issue that might bias the
estimates of our models. The (pseudo)-R-squared value for the
multinomial logistic regression estimating social class is 0.2, the adjusted
R-squared value for the OLS regression estimating social status is 0.39,
and the pseudo-R-squared values of the ordinal logistic regression
estimating parental education and family income are respectively 0.16 and
0.12. The magnitude of the (pseudo)-R-squared values does not reach the
threshold of 0.8 one would expect in the case of large communality. The
highest R-squared value found in the case of social status (0.39) indicates
a low level of multicollinearity. If multicollinearity were an issue and the
use of a common factor were the best fitting strategy, then the results from
the latent class analysis would show the number of classes to be “limited”,

17
most cases would be found in classes representing consistent combination
of indicators, for example a class comprising cases with high scores on all
indicators, a class with middling scores on all and one with low scores on
all indicators. Inconsistent classes in which indicators behave differently
(high scores on one indicator and low scores on other indicators) should
not emerge or would only contain a residual proportion of cases in such a
hypothesis. The results show that the solution with 8 classes including
inconsistent classes fits better the patterns of relationships between the
indicators than the consistent 4 class solution. The sample-size adjusted
Bayesian Information Criterion (BIC), in fact, equals 328693.437 in the
first case and 343358.265 in the second.
7 Results
Table 2 shows that a considerable number of cohort members did not
achieve level 2 qualifications by age 20, 42% of the 1990 cohort compared
to 36% in the 1970 cohort, pointing to persisting low levels of
achievement. However, it has to be taken into account that while BCS70
data is based on self-report, information about qualifications in Next Steps
is taken from the NPD. We also see that there had been an increase in level
3 qualifications for the later born cohort and a decrease in children not
attaining any academic qualification.
Table 2 around here
Do social status, parental class and education and family income
show an independent effect on children’s educational attainment? We
adopt a sequence of logit models that reflect the ladder structure
implied by the English education system (Mare, 1981; 1980) to estimate
the likelihood of attaining 1) at least level 1 qualifications versus

18
none; 2) at least level 2 versus staying at level 1; and 3) attaining
level 3 qualifications versus staying at level 2. The results of logistic
regression model are presented in Table 3.
The estimates show a monotonic relationship between parental
social class and educational attainment of their offspring at the first
transition: the social class advantage of completing the first transition
becomes, as expected, stronger as we compare the routine class (VII) with
more advantaged classes. At the second transition, the same monotonic
pattern is observed, yet, this time, the attainment gap between classes
becomes significant from the small employers (IV and below).
Table 3 here
Whether cohort members have parents with semi-routine occupations
(VI) or lower supervisory occupations (V) rather than the routine class
(VII) makes no significant difference for the transition to level 2
qualifications. At the higher transition (to level 3), social class
differentials are like those observed at the lower transition, except for
intermediate occupations whose chances this time are not different from
the most disadvantaged classes. Social status shows a significant and
moderate association across all transitions. The findings confirm that
the categories of social class and social status indicate distinct and non-
overlapping constructs.
Parental education shows generally a significant and monotonic
relationship with children’s educational attainment at each of the three
transitions. Children of parents with level 2 qualifications have higher
chances of educational progression across all transitions than children
of parents with no qualifications. Children of parents with levels 3 or 4
qualifications have even higher relative chances. However, children of

19
parents with level 1 qualifications do not have a significant relative
advantage over parents with no qualifications.
Family income shows some independent association with both earlier
transitions, over and above the other social origins’ indicators. There is
a significant difference between children from families at the bottom
income group and children from families at the third and at top income
group at transitions 1and 2, At the third transition, the likelihood of
success does not seem to be associated with family income.
To assess the relative importance of the predictors, we looked at the
proportion of correctly predicted cases in the full model and then
remove one predictor at a time to assess how much predictive power is
lost each time. The full model for progressing to A-levels correctly
predicts 68% of cases; parental education is the most important variable
(predicted cases drop to 67.2%), followed by income (predicted cases
drop to 67.8%), social status (predicted cases drop to 67.9%) and social
class (predicted cases do not drop).
In summary, Table 3 suggests that when considered together,
parental social class, social status, education and family income each
exerts an independent effect on educational attainment. Consequently
social origins indicators should be regarded as distinct aspects of social
origins, with the implication that if one or more of them were missing,
the total effect of social origins would be underestimated.
We now turn to the question of whether the effects of parental class
and education, social status and family income on children’s educational
outcomes changed across the two birth cohorts, addressed by adding an
interaction term between cohort and each of the social origins
indicators into the logistic models.

20
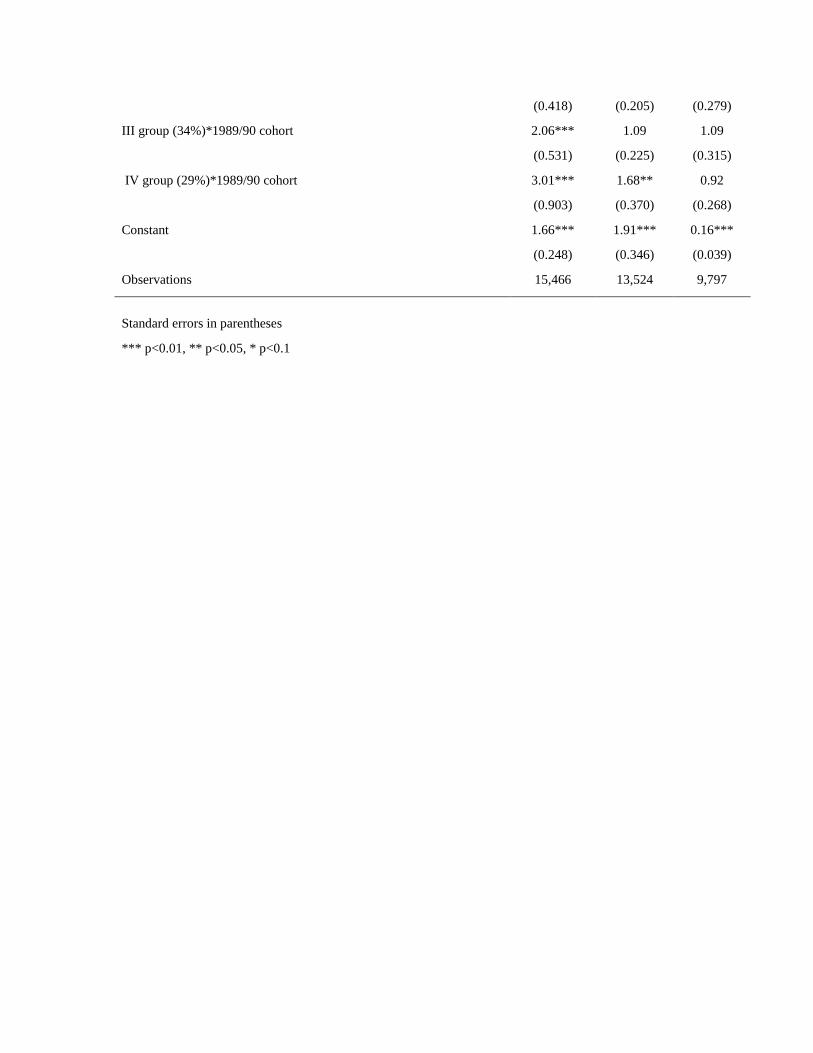
Table 4 shows various patterns of change and stability of
inequality in educational attainment across the social origins
indicators.
Table 4 here
The social class attainment gap had a prevailing pattern of stability,
there is no clear indication of reducing inequality, although it widened
somewhat for specific groups at certain transitions. The differentials
between class VII (routine) and class III (intermediate) in attaining at
least level 1 qualifications have widened across cohorts, there is no
support for a change in the gap between class VII and other classes at
that transition. At transition 2, the gap between class VII and class
IV has widened. At transition 3, only the attainment gap between
class VII and class VI (semi-routine) has widened across cohorts.
The social status attainment gap appears to have slightly increased
across the three transitions, reaching statistical significance only at
transition 2.
With respect to parental education, the gap in the first transition has
become wider when comparing children of parents with levels 1 and 2
qualifications with those of unqualified parents. The pattern is reversed at
the next transition (to ‘O-level’), where the differentials between no
parental qualification and parental qualifications at levels 1 or 2 are
significantly narrower. Similarly, at the transition to A-level, among those
qualified to level 2, the trend over time is equalising for all parental
education categories.
Household income: the attainment gap between the least affluent
income group and the (two) more affluent income groups enlarged at
transition 1. At transition 2, the progression gap in academic

21
qualifications has widened in a significant way only between the two
extreme income groups. At transition 3 there is no evidence of a
significant change inequality in attainment over time.
In summary, the most salient patterns of changes in inequality are
that at transition 1, from no to any qualifications, there has been a
widening or persisting attainment gap between children from families
with different socio-economic resources, while at transitions 2 and 3
there has been a reduction regarding the role of parental education.
This means that the different socio-economic groups have taken
advantage of the expansion of the access to and attainment of
academic qualifications at different paces. The later born cohort
experienced a generalised increase in the rates of completion of the first
transition: the proportion of children without any qualification at age
20 declined from 23% to 7% roughly (Table 2). Yet, children from
advantaged parents have experienced a more rapid decline, indicating
that the expansion of educational attainment at the first transition has
benefited the advantaged groups more than the disadvantaged. At
transition 2 (attainment of at least ‘O-level-type’ academic
qualifications at age 20), there does not appear to have been expansion
and, at face value, the proportion of children completing this transition
declined from 64% to 58% (Table 2). This decline may be overstated or
even artefactual, given the possible biases noted above of overstatement
of GCSEs reported BCS (Shepherd, 2001) and a possible small
downward bias to records of Level 2+ qualifications in Next Steps. Even
considering this caveat, many of the Next Steps cohort still found the
second transition beyond their reach. Assuming that the overstatement of
GCSEs reported in BCS is not systematically related to cohort members
social origin’s indicators, we argue that the results regarding the variation
of inequality of opportunity in educational attainment are not affected by

22
the likely upward bias in level 2 qualifications in BCS.At the third
transition another major expansion has occurred, which more than
doubled the proportion of children who have attained an A- level
academic qualification, which increased from 17% to 38%. At this point,
the expansion was accompanied by a reduction of inequality associated
with parental education and by stable inequality in relation to social
class, social status and family income.
8 Conclusions
This article addresses a vexed question about change or stability in
social inequalities in educational attainment. We compared two British
age cohorts born in 1970 and 1989/90. We argue that the controversy
regarding trends in social inequalities arises partly because parental
social class or income should not be the sole indicators of social origins.
A multidimensional conceptualisation of social origins should embrace,
social class, social status, parental education and family income. Each of
these factors shows independent associations with offspring’s
educational attainment, suggesting independent mechanisms by which
growing up in different families leads to diverging educational
outcomes. When social class is used as the sole indicator of social
origins the extent of social inequality in educational attainment is
underestimated and the extent of social class inequality is
overestimated. The findings also suggest that omitting family income
from a more differentiated and comprehensive conceptualisation of
social origins would still lead to incomplete conclusions. in that family
income has an independent effect on educational attainment.

23
The multidimensional treatment of social origins has not only
methodological implications but also substantive ones, advancing the
interpretation of the social processes generating educational inequalities
across generations. Educational attainments in the two cohorts are
a s so c i a t ed in different ways with parental social class, education,
family income and social status. Overall the results regarding social
class provide support for a stable trend of inequality across the three
transitions. The role of family income strengthened at transition 1
and 2, while remaining stable at transition 3. Social status has become
more important over time for educational attainment only at
transitions 1 and 2. Parental education shows different patterns of
influence at different transitions. It has become somehow more
important at transition 1, and less important at transitions 2 and 3.
This latter pattern is the only clear sign of declining inequality over
time.
The stability - in case of parents’ social class - or even
strengthening – in case of family income – of the association between
social origins and educational transition 1 and 2 are at odds w i t h
p r e v i o u s r e s e a r c h s h o w i n g a n i m p r o v e m e n t o f
e q u a l i t y o f o p p o r t u n i t y i n t h e a t t a i n m e n t o f G C S E
q u a l i f i c a t i o n s ( Gregg and Macmillan, 2010). A reason may be
differing the definitions of social background. Gregg and Macmillan use
either family income or class. The use of a single indicator of social
origins is likely to capture the trend of inequality of opportunity in respect
to social origins in general, hiding potentially diverse trends for each
dimension of social origins.
The findings point to the importance of specifying each transition
when analysing trends in inequality in social origins indicators. The
increase or persistence in social inequality at transition 1 and 2 can

24
potentially be explained by the large proportion of underachieving
students in the UK context. The so-called “tail of poor achievers” is a
persistent problem in the UK and is particularly relevant in the
discussion around inequality because it is particularly pronounced
among the poor and disadvantaged students (Brooks, Pugh and
Schagenl., 1996; Machin & Vignoles, 2005; Marshall, 2013). This
aspect is clearly shown in our data, with about 42% of young people
in the 1989/90 cohort leaving education with below level 2
qualifications. Indeed, our findings suggest that the importance of
early educational transitions should not be dismissed especially
when they are quite selective. While government policy since the
late 1990s is focused on getting more disadvantaged students into
tertiary education, it might be even more important to ensure that
young people have more equal chances to get level 2 qualifications. Our
findings point to the importance of improving support for achieving lower
level qualifications, which are a springboard for later achievements.
The reforms discussed in section 3 probably did little to reduce social
inequality in poor achievement. The introduction of market-oriented
mechanisms might have even exacerbated it. It is plausible in fact that
advantaged and more educated parents benefit the most from increased
choice in the provision of education. They have better information on,
and understanding of, school performance, via league tables and, in
general, provide better guidance in navigating the education system (i.e.
making intelligible the examination procedures and helping to distinguish
between the high number of courses and qualifications to take and the
institutions to attend (Bukodi & Goldthorpe, 2013; Erikson & Jonsson,
1996)). The persistence over time of large strata of low achievers among
disadvantaged children is a plausible explanation of the persistent
inequality at the first transitions. Other plausible explanations of the

25
strengthened impact of family income at the first two transitions is the
marked rise in income inequality (Johnson & Webb, 1993) and child
poverty in the UK during the 1980s (Department of Social Security,
1998:1999; Gregg, Harkness & Machin, 1999).
The stable impact of social class indicates that the advantages that
the concept of class captures have changed little during the time period
considered. Relating this finding to the results from Bukodi and
Goldthorpe (2013) regarding the stability of class-related inequality for
older cohorts, a long-term trend emerges indicating that the social class
inequalities in educational attainment have not changed since the 1950s
up to 2000s. The increasing gap across cohorts in attainment at the
second transition associated with social status might reflect the
increasing return to information associated with social status. It might
also indicate that social networks have become more important in
facilitating access and progression in the educational system.
Among our four a s p ec t s o f social origins, only parental education
had a generalised expansion and equalisation, due to the educational
expansion at the secondary and higher level that occurred since the late
1960s. The parents of the 1990 cohort benefited from the rapid increase
in participation in secondary and higher education that was
determined by this expansion. Other dimensions of social stratification
have not changed in this equalising and expansive way. This is probably
the reason why inequalities in relation to parents’ education have reduced
over time at transition 3, while there hasn’t been a reduction in
inequality in relation to other factors. Another aspect to be
considered is that the students who have passed level 2 qualifications
are a selected group with relatively high skills. At transition 3 part of
the effect of parents’ education on skills is captured by previous
attainments; once p a s t the hurdle of obtaining at least level 2
26
qualifications, the expansion of education among the parental generation
can finally lead to an improvement in equality of opportunity. By
contrast, at transition 1, the expansion of education participation
has mostly b e n e f i t t e d advantaged children from well-educated
parents because of the persistent inequality in the long tail of low
achievement.
In summary, the results suggest that social class, social status,
education and income all have independent effects on educational
attainment. Furthermore, their effects can vary in different ways, i.e. they
show different patterns of stability or variability over time and for
different qualification levels. When they vary, they can trend in either
direction. What is needed for a better understanding of these independent
effects is to hypothesise and test the specific social processes or
mechanisms that underlie the observed associations.
Acknowledgements: This article is based on research in the LLAKES
Research Centre funded by the ESRC: grant reference ES/J019135/1.
We thank Tak Wing Chan for providing his code converting SOC90 to the social status scores. We thank Heather Joshi for her comments.
References
Blanden, J., Gregg, P. & Machin, S. (2005). Educational inequality and
intergenerational mobility. In S. Machin and A. Vignoles (Eds.). What’s
the Good of Education? The Economics of Education in the UK, chapter 6.
Princeton, NJ: Princeton University Press.

27
Blanden, J., & Gregg, P. (2004). Family income and educational attainment:
a review of approaches and evidence for Britain. Oxford Review of
Economic Policy, 20(2), 245–263.
Blanden, J., Gregg, P., & Macmillan, L. (2013). Intergenerational persistence in
income and social class: the effect of within group inequality. Journal of the
Royal Statistical Society: Series A (Statistics in Society), 176(2), 541–563.
Blanden, J., & Macmillan, L. (2016). Educational Inequality, Educational
Expansion and Intergenerational Mobility. Journal of Social Policy, 45(4),
589–614
Boliver, V. (2011). Expansion, differentiation, and the persistence of social class
inequalities in British higher education. Higher Education, 61(3), 229–242.
Bourdieu, P. (1984). Distinction: A Social Critique of the Judgement of
Taste. Cambridge, MA: Harvard University Press.
Breen, R., Luijkx, R., Müller, W., & Pollak, R. (2009). Nonpersistent inequality in
educational attainment: Evidence from eight European countries. American
Journal of Sociology, 114(5), 1475–1521.
Brooks, G., Pugh, A. K., & Schagen, I. (1996). Reading performance at nine.
Slough: NFER.
Bukodi, E., Eibl, F., Buchholz, S., Marzadro, S., Minello, A., Wahler, S., . . .
Schizzerotto, A. (2018). Linking the macro to the micro: a multidimensional
approach to educational inequalities in four European countries. European
Societies, 20(1), 26-64.
Bukodi, E., & Goldthorpe, J. H. (2013). Decomposing ‘social origins’: The effects
of parents’ class, status, and education on the educational attainment of their
children. European Sociological Review, 29(5), 1024–1039.

28
Bukodi, E., Erikson, R., & Goldthorpe, J. H. (2014). The effects of social origins
and cognitive ability on educational attainment: Evidence from Britain and
Sweden. Acta Sociologica, 57(4), 293–310.
Bukodi, E. & Goldthorpe, J. H. (2016). ‘Educational Attainment – Relative
or Absolute – as a Mediator of Intergenerational Class Mobility in
Britain’, Research in Social Stratification and Mobility, 43: 5–15.
Chan, T. W., & Goldthorpe, J. H. (2004). Is there a status order in
contemporary British society? Evidence from the occupational structure
of friendship. European Sociological Review, 20(5), 383–401.
Chan, T. W., & Goldthorpe, J. H. (2007). Class and status: The conceptual
distinction and its empirical relevance. American Sociological Review, 72(4),
512–532.
Chan, T. W. & Goldthorpe, J.H. (2010). Social status and cultural consumption.
Cambridge: Cambridge University Press.
Crawford-Lee, M. S. (2016). Towards a sustainable apprenticeship system. Higher
Education Skills and Work-Based Learning, 6(4), 324–328.
Dearden, L., McIntosh, S., Myck, M., & Vignoles, A. (2002). The returns to
academic and vocational qualifications in Britain. Bulletin of Economic
Research, 54(3), 249–274.
Dearden, L., Emmerson, C., Frayne, C., & Meghir, C. (2005). Education subsidies
and school drop-out rates (No. 05/11). IFS Working Papers, Institute for Fiscal
Studies (IFS).
Department of Social Security (1998). Households below average income 1979–
1996/97. Technical report, Corporate Document Services, London,.
Department of Social Security (1999). Households below average income
1994/95–1997/98. Technical report, Corporate Document Services, London,
1999.

29
Dieckhoff, M. (2008). Skills and occupational attainment: a comparative study of
Germany, Denmark and the UK. Work Employment and Society, 22(1), 89–108.
Elliott, J., & Shepherd, P. (2006). Cohort profile: 1970 British birth cohort
(BCS70). International Journal of Epidemiology, 35(4), 836–843.
Erikson, R. (1984). Social class of men, women and families. Sociology, 18(4),
500–514.
Erikson, R., & Goldthorpe, J. H. (1992). The constant flux: A study of class
mobility in industrial societies. Oxford: Oxford University Press.
Erikson, R., & Jonsson, J. O. (1996). Explaining class inequality in education: The
Swedish test case. In R. Erikson & J. O. Jonsson (Eds.). Can education be
equalized? The Swedish case in comparative perspective, page1–63. Boulder:
Westview Press.
Erikson, R., Goldthorpe, J. H., & Portocarero, L. (1979). Intergenerational class
mobility in three Western European societies: England, France and Sweden. The
British Journal of Sociology, 30(4), 415–441.
Furstenberg, F. F., & Kiernan, K. E. (2001). Delayed parental divorce: How much
do children benefit? Journal of Marriage and Family, 63(2), 446–457.
Galindo-Rueda, F., & Vignoles, A. (2005). The declining relative importance of
ability in predicting educational attainment. Journal of Human
Resources, 40(2), 335–353.
Gibbons, S., & Machin, S. (2008). Valuing school quality, better transport, and
lower crime: evidence from house prices. Oxford Review of Economic
Policy, 24(1), 99–119.
Goldthorpe, J. H. (2007). On Sociology: Illustration and Retrospect, volume 2
Stanford: Stanford University Press.
Goldthorpe, J. H. (2013). Understanding - and Misunderstanding - Social
Mobility in Britain: The Entry of the Economists, the Confusion of

30
Politicians and the Limits of Educational Policy, Journal of Social
Policy, 42: 431-50.
Goldthorpe, J. H. (2016). Social class mobility in modern Britain: Changing
structure, constant process. Journal of the British Academy, 4, 89–111.
Goldthorpe, J. H., & Jackson, M. (2007). Intergenerational class mobility in
contemporary Britain: political concerns and empirical findings 1. The British
Journal of Sociology, 58(4), 525–546.
Goldthorpe, J, H. & McKnight, A. (2006) The economic basis of social class. In S.
Morgan, D. B. Grusky, & G. S. Fields (Eds.). Mobility and Inequality: Frontiers
of Research from Sociology and Economics. Stanford: Stanford University
Press.
Green, A. (2002). The many faces of lifelong learning: recent education policy
trends in Europe. Journal of Education Policy, 17(6):611–626.
Gregg, P., Harkness, S., & Machin, S. (1999). Poor kids: trends in child poverty in
Britain, 1968–96. Fiscal Studies, 20(2), 163–187.
Gregg, P., & Macmillan, L. (2010). Family income, education and cognitive ability
in the next generation: exploring income gradients in education and test scores
for current cohorts of youth. Longitudinal and Life Course Studies, 1(3), 259-
280.
Grusky, D. B., & Weeden, K. A. (2001). Decomposition without death: A research
agenda for a new class analysis. Acta Sociologica, 44(3), 203–218.
Hagenaars, J. A., & McCutcheon, A. L. (Eds.). (2002). Applied latent class
analysis. Cambridge: Cambridge University Press.
Hansen, K. & Vignoles, A. (2005). The United Kingdom education system in a
comparative context. In What’s the Good of Education? The Economics of
Education in the UK, chapter 2. Princeton: Princeton University Press.

31
Heath, A., Sullivan, A., Boliver, V., & Zimdars, A. (2013). Education under New
Labour, 1997–2010. Oxford Review of Economic Policy, 29(1), 227–247.
Jackson, M. (2013). Determined to succeed? Performance versus choice in
educational attainment. Stanford: Stanford University Press.
Jæger, M. M. (2007). Educational mobility across three generations: The changing
impact of parental social class, economic, cultural and social capital. European
Societies, 9(4), 527–550.
Johnson, P., & Webb, S. (1993). Explaining the growth in UK income inequality:
1979–1988. The Economic Journal, 103(417), 429–435.
Lupton, R., Heath, N., & Salter, E. (2009). Education: New Labour's top priority
In J. Hills, T. Sefton, & K. Stewart (Eds.). A More Equal Society? Assessing
Policy Towards Poverty, Inequality and Social Exclusion 1997–2008 (Vol.
CASE Studies on poverty, place and policy. pp. 71–90). Bristol, UK: Policy
Press.
Machin, S. & Vignoles, A. (2006) Education policy in the UK. Technical report,
Centre for the Economics of Education, LSE.
Machin, S., & Vignoles, A. (Eds.). (2005). What's the Good of Education? The
Economics of Education in the UK. Princeton: Princeton University Press
Mare, R. D. (1980). Social background and school continuation decisions. Journal
of the American Statistical Association, 75(370), 295–305.
Mare, R. D. (1981). Change and stability in educational stratification. American
Sociological Review, 46(1), 72–87.
Marshall, P. (2013). The Tail: How England’s schools fail one child in five – and
what can be done. London: Profile Books.
McIntosh, J., & Munk, M. D. (2009). Social class, family background, and
intergenerational mobility. European Economic Review, 53(1), 107–117.

32
Menning, C. L. (2002). Absent parents are more than money: The joint effect of
activities and financial support on youths' educational attainment. Journal of
Family Issues, 23(5), 648–671.
Muthen, B. (2001). Latent variable mixture modeling. In G. A. Marcoulides & R.
E. Schumacker (Eds.). New developments and techniques in structural equation
modeling, pages 1–33. Mahwah: Lawrence Erlbaum Associates.
Office for National Statistics. The National Statistics Socio-economic
classification (NS-SEC). Website name: Ons.gov.uk. Available at:
https://www.ons.gov.uk/methodology/classificationsandstandards/otherclassifi
cations/thenationalstatisticssocioeconomicclassificationnssecrebasedonsoc201
0. Accessed 19/11/2018:
Perry-Jenkins, M., Goldberg, A. E., Pierce, C. P., & Sayer, A. G. (2007). Shift
work, role overload, and the transition to parenthood. Journal of Marriage and
Family, 69(1), 123–138.
Raffe, D., Brannen, K., Fairgrieve, J., & Martin, C. (2001). Participation,
Inclusiveness, Academic Drift and Parity of Esteem: a comparison of post-
compulsory education and training in England, Wales, Scotland and Northern
Ireland. Oxford Review of Education, 27(2), 173–203.
Schoon, I. (2010). Childhood cognitive ability and adult academic attainment:
evidence from three British cohort studies. Longitudinal and Life Course
Studies, 1(3):241–258.
Shavit, Y., Arum, R. & Gamoran, A. (2007). Stratification in higher education: A
comparative study. Stanford: Stanford University Press.
Shepherd, P., (2001). NCDS/BCS70 1999-2000 Follow-ups Guide to the
Combined Dataset. Joint Centre for Longitudinal Research. Available at:
https://cls.ucl.ac.uk/wp-content/uploads/2018/05/guide.pdf. Accessed
02/12/2018.
Sullivan, A., Ketende, S., & Joshi, H. (2013). Social class and inequalities in early
cognitive scores. Sociology, 47(6), 1187–1206.

33
West, J., & Steedman, H. (2003). Finding our way: vocational education in
England. Centre for Economic Performance, London School of Economics and
Political Science.
White, L., & Keith, B. (1990). The effect of shift work on the quality and stability
of marital relations. Journal of Marriage and the Family, 52(2), 453–462.
Wolf, A. (2011). Review of vocational education: the Wolf report. United
Kingdom: Department of Education.

Table 1: Education qualifications of cohort members across the 1970 and 1990 cohorts
Less than
level 1
Level 1 Level 2 Level 3
1970
cohort
(BCS70)
No
academic
qualificati
ons
CSE grades
2-5
Ordinary(O)
-levels/
CSE grade 1
Advanced
(A)-levels
1990
cohort
(Next
Steps)
No
academic
qualificati
ons
GCSE level
grades D-G
GCSE level
grades A*-C
Advanced
(A)-levels

11
Table 2: Descriptive statistics:: row percentages unless otherwise specified
Academic qualifications
1970 cohort
1989/90 cohort (weighted values)
None Level 1 Level 2 Level 3 Total None Level 1 Level 2 Level 3
Sex
Male 24.97 13.54 44.94 16.55 100.00 8.70 37.64 20.38 33.28 100.00
Female 20.69 13.19 48.52 17.60 100.00 5.35 31.99 20.84 41.82 100.00
Total 22.77 13.36 46.78 17.09 100.00 7.05 34.85 20.60 37.50 100.00
N 8480 12264
Social class
Routine occupations 34.18 18.72 39.29 7.80 100.00 19.21 53.22 14.61 12.96 100.00
Semi-routine occupations 31.84 17.09 45.31 5.76 100.00 12.63 48.52 18.66 20.19 100.00
Lower supervisory
occupations 29.22 16.39 47.51 6.89 100.00 8.39 52.94 20.86 17.81 100.00
Small employers 25.29 15.69 45.69 13.33 100.00 5.41 40.30 22.09 32.19 100.00
intermediate occupations 23.77 15.24 50.66 10.33 100.00 4.04 34.60 25.41 35.95 100.00
Lower managerial and
professionals
occupations 15.41 9.95 49.23 25.41 100.00 2.93 26.14 22.50 48.43 100.00
Higher managerial and
professional occupations 9.29 5.52 44.53 40.66 100.00 2.27 14.29 18.47 64.97 100.00
Total 22.86 12.56 48.30 16.28 100.00 6.26 34.34 20.88 38.52 100.00
N 7638 11214
Social status (mean) -0.33 -0.38 -0.10 0.50 -0.10 -0.52 -0.15 0.32 0.74 0.26
N 7682 11686
Parental education
No qualifications 30.55 19.18 43.83 6.45 100.00 18.54 49.38 14.67 17.41 100.00

Level 1 27.75 15.76 48.43 8.06 100.00 11.07 53.82 17.43 17.68 100.00
Level 2 20.82 12.52 49.69 16.98 100.00 5.53 40.94 24.55 28.98 100.00
Level 3 15.53 8.82 54.61 21.05 100.00 3.39 25.98 23.78 46.85 100.00
Level 4 8.70 3.98 43.18 44.14 100.00 2.19 11.58 17.79 68.45 100.00
Total 22.48 13.33 46.79 17.40 100.00 7.01 34.62 20.62 37.76 100.00
N 7771 12029
Family income (percentile)
I group (7%) 29.27 19.27 42.93 8.54 100.00 15.23 42.72 15.87 26.18 100.00
II group (30%) 30.00 15.39 45.30 9.30 100.00 13.15 45.30 18.57 22.98 100.00
III group (34%) 22.07 14.36 50.29 13.28 100.00 5.37 39.78 21.63 33.22 100.00
IV group (29%) 18.14 10.63 47.22 24.00 100.00 2.11 19.64 22.04 56.21 100.00
Total 22.50 13.29 47.10 17.11 100.00 7.12 34.52 20.53 37.82 100.00
7283 9468

Table 3
Transitions through three academic levels by age 20/21 by cohort, parental class,
social status and education, and family income:
Main effects, binary logistic models, odds ratios
Level 1 and
higher
Level 2
and higher Level 3
vs No
qualifications vs Level 1 vs Level 2
Cohort (Ref.: 1970)
1989/90 cohort 3.93*** 0.24*** 4.37***
(0.265) (0.013) (0.230)
Female 1.45*** 1.42*** 1.20***
(0.079) (0.063) (0.058)
Parental Class (Ref.: Routine occupations (VII))
Semi-routine occupations (VI) 1.19* 1.11 0.90
(0.119) (0.103) (0.125)
Lower supervisory occupations (V) 1.32** 0.98 0.86
(0.156) (0.099) (0.131)
Small employers and own account workers (IV) 1.68*** 1.35*** 1.28*
(0.219) (0.144) (0.189)
Intermediate occupations (III) 1.80*** 1.52*** 1.06
(0.171) (0.145) (0.140)
Lower managerial and professional occupations (II) 2.17*** 1.50*** 1.30*
(0.238) (0.149) (0.174)
Higher managerial and professional occupations (I) 2.76*** 2.00*** 1.71***
(0.427) (0.248) (0.248)
Family social status 1.07** 1.16*** 1.13***
(0.030) (0.031) (0.031)
Parental education (Ref.: No qualifications)
Level 1 1.09 1.04 0.97
(0.082) (0.075) (0.096)
Level 2 1.47*** 1.63*** 1.36***

(0.113) (0.110) (0.116)
Level 3 2.12*** 2.57*** 1.72***
(0.237) (0.213) (0.162)
Level 4 and higher 2.52*** 5.31*** 2.89***
(0.306) (0.536) (0.276)
Family income (Ref.: I group (7%)
II group (30%) 1.00 1.15 0.97
(0.125) (0.113) (0.138)
III group (34%) 1.33** 1.23** 0.99
(0.169) (0.120) (0.137)
IV group (29%) 1.54*** 1.78*** 1.19
(0.209) (0.184) (0.167)
Constant 1.08 1.57*** 0.16***
(0.146) (0.189) (0.028)
Observations 15,466 13,524 9,797
Standard errors in parentheses
*** p<0.01, ** p<0.05, * p<0.1

Table 4: Transition analysis with interactions by cohort, binary logistic models: odds ratios
Level 1 and
higher
Level 2
and higher Level 3
vs No
qualifications vs Level 1 vs Level 2
Cohort (Ref.: 1970)
1989/90 cohort 1.21 0.19*** 5.89***
(0.351) (0.046) (2.086)
Female 1.35*** 1.10 1.03
(0.081) (0.083) (0.075)
Female*1989/90 cohort 1.27* 1.46*** 1.27**
(0.167) (0.136) (0.124)
Parental Class (Ref.: Routine occupations (VII))
Semi-routine occupations (VI) 1.12 1.04 0.56***
(0.125) (0.152) (0.125)
Lower supervisory occupations (V) 1.14 1.08 0.73
(0.161) (0.198) (0.193)
Small employers and own account workers (IV) 1.39** 0.99 1.09
(0.202) (0.179) (0.254)
Intermediate occupations (III) 1.51*** 1.25* 0.88
(0.156) (0.166) (0.164)
Lower managerial and professional occupations (II) 1.95*** 1.54*** 1.34
(0.232) (0.232) (0.248)
Higher managerial and professional occupations (I) 2.81*** 1.76*** 1.48*
(0.479) (0.367) (0.298)
Semi-routine occupations (VI)*1989/90 cohort 1.12 1.11 2.13**
(0.236) (0.217) (0.631)
Lower supervisory occupations (V)*1989/90 cohort 1.30 0.94 1.36
(0.317) (0.213) (0.450)
Small employers and own account workers (IV)*1989/90 cohort 1.55 1.55* 1.33
(0.452) (0.354) (0.406)
Intermediate occupations (III)*1989/90 cohort 1.78* 1.37 1.50
(0.528) (0.273) (0.415)

Lower managerial and professional occupations (II)*1989/90 cohort 1.19 0.97 1.01
(0.337) (0.202) (0.275)
Higher managerial and professional occupations (I)*1989/90 cohort 0.87 1.18 1.31
(0.336) (0.315) (0.385)
Family social status 1.00 1.09** 1.12***
(0.030) (0.042) (0.042)
Family social status*1989/90 cohort 1.15* 1.11** 1.04
(0.091) (0.060) (0.062)
Parental education (Ref.: No qualifications)
Level 1 1.01 1.32*** 1.08
(0.081) (0.132) (0.157)
Level 2 1.28*** 1.86*** 1.95***
(0.106) (0.196) (0.241)
Level 3 1.90*** 2.68*** 1.97***
(0.241) (0.420) (0.282)
Level 4 and higher 2.43*** 5.17*** 3.70***
(0.327) (0.919) (0.483)
Level 1*1989/90 cohort 1.43* 0.65*** 0.64**
(0.266) (0.096) (0.140)
Level 2*1989/90 cohort 1.59*** 0.78* 0.41***
(0.278) (0.111) (0.077)
Level 3*1989/90 cohort 1.36 0.86 0.57***
(0.343) (0.163) (0.119)
Level 4 and higher*1989/90 cohort 1.24 0.95 0.46***
(0.379) (0.207) (0.096)
Family income (Ref.: I group (7%)
II group (30%) 0.81 1.18 0.98
(0.114) (0.195) (0.227)
III group (34%) 1.02 1.17 0.94
(0.144) (0.193) (0.214)
IV group (29%) 1.08 1.23 1.25
(0.164) (0.219) (0.288)
II group (30%)*1989/90 cohort 1.71** 0.99 0.95
(0.418) (0.205) (0.279)
III group (34%)*1989/90 cohort 2.06*** 1.09 1.09
(0.531) (0.225) (0.315)
IV group (29%)*1989/90 cohort 3.01*** 1.68** 0.92
(0.903) (0.370) (0.268)
Constant 1.66*** 1.91*** 0.16***
(0.248) (0.346) (0.039)
Observations 15,466 13,524 9,797
Standard errors in parentheses
*** p<0.01, ** p<0.05, * p<0.1