social, economic, and educational factors …€¦ · social, economic, and educational factors...
TRANSCRIPT
Social, Economic, and Educational Factors that Influence Health Healthiest Wisconsin 2020 Focus Area Profile May 2013
1
SOCIAL, ECONOMIC, AND EDUCATIONAL
FACTORS THAT INFLUENCE HEALTH Drafted by the Wisconsin Center for Health Equity, May 2013
Note to readers and users of the Healthiest Wisconsin 2020 Profiles: This Healthiest Wisconsin 2020 (HW2020) Profile is designed to provide background information leading to collective action and results. It was prepared by the Wisconsin Center for Health Equity (WCHE: Koltun R, and Swain G) with review and input by the HW2020 Focus Area Strategic Team and the Wisconsin Minority Health Leadership Council – Executive Committee. This profile reflects the discussions of the HW2020 Focus Area Strategic Team and related literature reviews, and is not a policy document of the Department of Health Services. This profile is available at www.wche.org. The objectives from this Focus Area have been recognized as objectives of Healthiest Wisconsin 2020. (Refer to Section 3 of the Healthiest Wisconsin 2020 plan.) Please note that since the plan’s original publication in July 2010, the focus area of “Social, Economic and Educational Factors that Influence Health” and the focus area “Health Disparities” have been grouped into the category entitled “Crosscutting Focus Areas.” A complete list of Healthiest Wisconsin 2020 Focus Area Strategic Team Members can be found in Appendix A, pages 152-153 of the plan.
Table of Contents Definitions……………………………………………………………………….……….1-2 Importance of the Focus Area……………………………………………………............2-6 Wisconsin Data Highlights..………………………………………………….………….6-8 HW2020 Objectives Related to the Health Disparities Focus Area……………………9-10 Evidence- or Science-Based Programs and Policies to Advance the Objectives……..11-12 Summary…………………………….....……………………………………....................12 References and Resources…………………………………………………………….12-15 Definitions Social, economic, and educational factors that influence health – also known as the social determinants of health (SDoH) – are defined by the World Health Organization (WHO) as “the conditions in which people are born, grow, live, work and age.”1 The U.S. Centers for Disease Control and Prevention (CDC) further explains SDoH as circumstances that are shaped by broader forces, including “economics, social policies and politics.”2 Examples of SDoH include employment, community safety, income, educational attainment, family and social support, as well as racism and other forms of discrimination. Socioeconomic status (SES) is one of the most commonly cited and important SDoH examined. Socioeconomic status refers to an individual’s or family’s economic and social position in relation to others, usually measured by a combination of certain specific SDoH, which typically include income, education, and/or measures of occupational prestige. The terms health disparities and health inequities are sometimes used interchangeably. Some people distinguish the two by using the term health disparity to indicate any difference in health between groups of people. In this light, some health disparities, such as those due to innate biological differences, are unavoidable; while a health inequity is a disparity that is avoidable or

Social, Economic, and Educational Factors that Influence Health Healthiest Wisconsin 2020 Focus Area Profile May 2013
2
preventable, which is often the result of social or economic conditions or policies, and which, therefore, represents an unfair or unjust disparity.”3,4,5 As a result, the Wisconsin Minority Health Leadership Council included the following definition in Healthiest Wisconsin 2020:
In 2009, the Wisconsin Minority Health Leadership Council defined health disparity as “. . . differences in the incidence, prevalence, mortality, burden of diseases and other adverse health conditions or outcomes that exist between population groups based on gender, age, race, ethnicity, socioeconomic status, geography, sexual orientation and identification, disability or special health care needs, or other categories. Most health disparities are also considered to be health inequities - disparities that are avoidable, unfair, or unjust and/or are the result of social or economic conditions or policies that occur among groups who have persistently experienced historical trauma, social disadvantage or discrimination, and systematically experience worse health or greater health risks than more advantaged social groups.”6
Health equity is defined as “fairness in the distribution of power and resources and the freedom to achieve healthy outcomes between groups of differing levels of social disadvantage.”7 Put another way, “health equity is the right of all members of society to achieve their best possible health and to not have their health negatively affected by avoidable, unfair and unjust policies or conditions within the system in which they live.”8 The concept of health equity provides a vision and a framework for improving health across the life span and reducing health disparities. In other words, efforts to address root causes of health, such as efforts to improve SDoH, are strategies to reducing or eliminating health disparities / health inequities and moving Wisconsin toward health equity. Importance of the Focus Area Social, economic and educational factors that influence health is one of two crosscutting focus areas (the other is health disparities) in Healthiest Wisconsin 2020. Crosscutting focus areas have the power to influence all the health and infrastructure focus areas. They are the heart of Healthiest Wisconsin 2020 and represent Wisconsin’s public health system transformation. The County Health Rankings, developed at the University of Wisconsin Population Health Institute (UWPHI), provide a model of population health that emphasizes the many factors that, if improved, can help make communities healthier places.9 Through its nationally recognized work, UWPHI has determined that only 20% of the modifiable factors that influence health relate to access to high-quality health care, while 40% of the factors that influence health are social and economic. Links between SDoH and Health Health literature and research consistently find that people with lower socioeconomic status (SES) (e.g., limited financial and educational assets) have poorer health outcomes. The Milwaukee Health Report illustrates the SES-health pattern well, showing a consistent health

Social, Economic, and Educational Factors that Influence Health Healthiest Wisconsin 2020 Focus Area Profile May 2013
3
gradient whereby groups with higher SES are healthier on most measures than those with moderate SES, who are in turn generally healthier than those with lower SES.10,11 This is an example of what is known as “the social gradient” in health. The documented links between SES and health outcomes are broadly consistent across time, geography, and a variety of health outcomes, and there are solid, plausible mechanisms proposed for why low SES groups have poorer health outcomes.12 SDoH include more than traditional basic measures of SES (e.g., income, employment, education), and extend to other factors such as social cohesion and support, community safety, affordable housing, and food security (see Table 1). Further, various SDoH are often tightly linked to each other; for example, individuals living in poverty tend to have higher rates of unemployment, lower levels of education, and lower-quality housing. Still more insidiously, poverty and health are bidirectional; poverty can lead to poor health and poor health can lead to poverty. Through the years, many studies have confirmed these relationships. For example:
x People who have fewer economic resources are at higher risk of cardiovascular disease and premature death as those who have economic stability.13
x Mother’s education is a direct predictor of perinatal health; children born to women with low educational levels have a higher risk of dying in the first year compared to those born to educated mothers. This risk persists even if the infants are adopted by more educated parents.14 Similarly, research indicates that children of more highly educated parents have better health than children of less educated parents.15
x Poor people are more likely to suffer chronic illnesses, experience more severe complications, and die younger.15
x People who work in high-demand environments or who have little control over their job situations are more likely to suffer from low back pain and cardiovascular disease, and require higher numbers of sick leave days..16
x Societies with less social cohesion tend to have higher rates of violent crime, while communities with good social cohesion have lower rates of heart disease and better pregnancy outcomes.17
Social, economic, and educational factors influence health through several different mechanisms: for example, they affect people’s ability to access health care, understand health information, and apply health messages. They also constrain people’s ability to make healthy behavioral choices (for example, it’s difficult to eat a healthy, balanced diet when one lives in a community where healthy food is unavailable or unaffordable). Further, these factors affect health directly, because they result in chronic stress due to living with poverty and experiencing burdens imposed by discrimination and racism. Prolonged social stress takes a physical toll by increasing circulating levels of stress hormones (e.g., cortisol, adrenaline). Because these hormones directly affect blood pressure, glucose metabolism, and immune system functioning, increased levels of stress hormones over time in turn increase the risk of health problems such as preterm labor, diabetes, hypertension, heart disease, stroke, and certain types of cancer – not to mention the direct effects of chronic stress on risk of depression and other mental health disturbances.18,19
Social, Economic, and Educational Factors that Influence Health Healthiest Wisconsin 2020 Focus Area Profile May 2013
4
Table 1. Examples of major changeable* economic and social factors related to health (Adopted from S. A. Robert’s “Health Priority: Social and Economic Factors that Influence Health)20 Socioeconomic Status Income, assets, home ownership, education, occupation Stress
Chronic stressors financial difficulties; unemployment; workplace stress; low sense of control; problems with relationships; poor physical/mental health; exposure to discrimination based on race, gender, sexual preference, or physical abilities Acute stressors unemployment; death of family and friends; divorce and marital discord; losing one’s social roles (e.g., in retirement, widowhood); being a victim of crime; being a victim of a discriminatory act; financial catastrophe; having a health event
Social networks and support Social networks frequency of social contact; size of social networks Social support emotional support; instrumental support (practical); negative interactions
Neighborhood/community context
Social environment size and strength of formal and informal networks; health behaviors of social networks; exposure to crime; community cohesion and participation; racial climate Physical environment availability of safe leisure space; exposure to environmental toxins in work, home, and recreational areas; availability of safe and comfortable housing Service environment availability and acceptability of health and social services; location of and access to services; availability of transportation
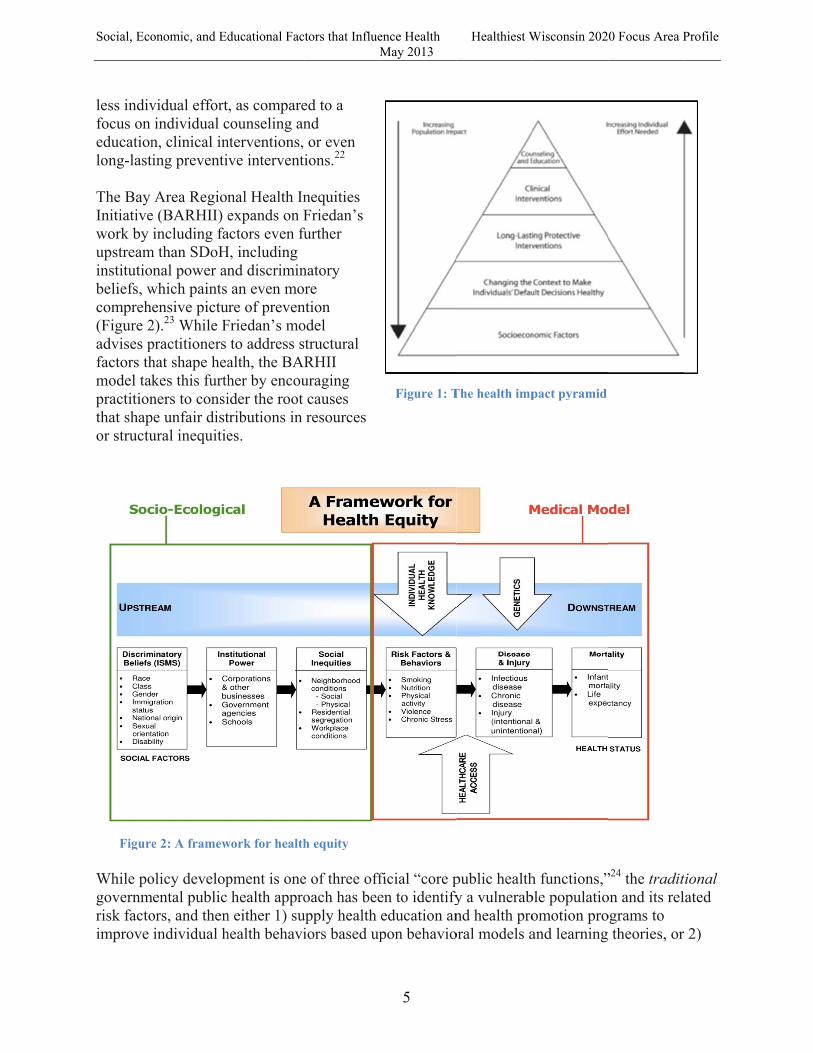
*Age, race/ethnicity, and gender are all strongly related to health as well, though these are unchangeable individual characteristics. Although age, race/ethnicity, and gender are unchangeable, some of the reasons they are linked to health are changeable. For example, older adults, racial/ethnic minorities, and women have worse health partly because of their overall lower income levels. Therefore, improving income among these groups should reduce health inequalities by age, race/ethnicity, and gender. Addressing Social, Economic and Educational Factors that Influence Health Despite an increasing awareness about SDoH, many people still believe that the two main factors to improving health are reducing unhealthy behaviors and increasing access to health care.21 Thomas Frieden, Director of the CDC, fueled a growing movement to focus on broader factors that affect health with the development of the Health Impact Pyramid (Figure 1). The five-tier pyramid displays levels of health interventions and gauges the potential impact of the interventions. Frieden states that a focus on SDoH has increasing population health impact with
Social, Eco
less indivfocus on educationlong-last The Bay Initiativework by upstreaminstitutiobeliefs, wcompreh(Figure 2advises pfactors thmodel takpractitionthat shapor structu
Figure While pogovernmrisk factoimprove
onomic, and Ed
vidual effortindividual c
n, clinical ining preventi
Area Regione (BARHII) eincluding fa
m than SDoHnal power an
which paints ensive pictu
2).23 While Fpractitioners hat shape heakes this furthners to consi
pe unfair distural inequitie
e 2: A framew
olicy developmental public ors, and thenindividual h
ducational Fac
, as comparecounseling annterventions, ve intervent
nal Health Inexpands on F
actors even fuH, including
nd discriminan even mo
ure of prevenFriedan’s mo
to address salth, the BARher by encouider the root tributions in es.
work for health
pment is onehealth appro
n either 1) suhealth behavi
ctors that InflueM
ed to a nd or even
ions.22
nequities Friedan’s
further
natory re
ntion odel structural RHII uraging causes resources
h equity
e of three offoach has bee
upply health iors based up
ence Health May 2013
5
Figure 1: T
ficial “core pen to identifyeducation anpon behavio
Healthiest W
The health imp
public healthy a vulnerabnd health pro
oral models a
Wisconsin 202
pact pyramid
h functions,”ble populatioomotion proand learning
0 Focus Area P
”24 the traditon and its relograms to
theories, or
Profile
tional ated
2)
Social, Economic, and Educational Factors that Influence Health Healthiest Wisconsin 2020 Focus Area Profile May 2013
6
try to improve access to health care and individual service provision. However, good health requires not only healthy behaviors and access to high-quality medical care, but also attention to a broader set of factors that lie outside the individual and beyond the traditional spheres of both medical care and public health (Figure 2, left side). Generally speaking, most investment in public health has traditionally been on the level of individual service provision, providing health services such as immunizations, screening for sexually transmitted diseases, social services for new mothers, and education. And the vast majority of U.S. investments in health overall are at the level of individual clinical interventions. However, the overarching social structure and policy environment produces powerful effects on individuals and groups that account for an outsized proportion of the inequities in health outcomes. Therefore, to be most effective, we professionals dedicated to improving health —including public health professionals and practicing clinicians—must not only continue our traditional roles, including promoting healthy behaviors and access to high-quality health care. We must also balance our repertoire by adding the skills, competencies, tools, and methods to address the broad policies, systems and environments that so strongly influence health, including taking an active role in the process by which policies are made. This policy work must focus on multiple areas with which we may be relatively unfamiliar—policies that drive the systemic root causes of health and disease in our communities—for it is these policies that both support (or constrain) healthy behaviors as well as directly affect individual physiology, both of which drive health or illness, and the eventual need for health care. Wisconsin Data Highlights Social Factors Over the last two decades, there has been increasing interest in whether and how social factors such as social support, social cohesion, social capital and social inclusion are related to health. Social support has generally been conceptualized as positive and has been found to relate to health and mortality.25 For example, having larger social networks, frequent social contact, and at least one close relationship is associated with better health and longer life.26,27 Social support influences a wide range of health outcomes, affecting our psychological, behavioral, and physiological functioning. Research has found that social support has both direct effects on health and buffering effects on health. Direct effects of social support on health: Positive emotional support and social contact affect positive perceptions of self-efficacy, self-worth, and well-being, which then maintain or improve health through biological responses (e.g., through the immune system).22 Support from others also encourages healthier behaviors, while poor health behaviors among friends, family, and in the community produce or reinforce negative health behaviors in the individual.28 Buffering effects of social support on health: All people are exposed to acute and chronic stressors. Some research indicates that in the face of acute or chronic stressors, social support can “buffer” the potential negative consequences of those stressors. For example, talking with a
Social, Economic, and Educational Factors that Influence Health Healthiest Wisconsin 2020 Focus Area Profile May 2013
7
supportive person can help a person reappraise or more effectively deal with a stressor. Moreover, the instrumental support received from people—such as having someone help with transportation, child care, or meal preparation—may also help deal with a stressor. Community/neighborhood social environment: The social environment of communities can affect the health of all community residents in a number of ways. For example, poorer communities often have higher levels of both actual and perceived crime,29 which can affect the health of all residents.30,31 Actual crime can directly affect health through bodily harm, while fear of crime can indirectly affect health by increasing stress, promoting social isolation, preventing health-promoting behaviors (e.g., walking for exercise), and preventing access to services for those fearful of traveling freely in the community. Living in communities with lower average levels of income and education can negatively affect a person’s health-promoting attitudes and behaviors by exposing a person to lower socioeconomic status neighbors who are, themselves, less likely to practice health-promoting behaviors. Some evidence indicates that living in communities with lower socioeconomic levels is associated with a greater likelihood of smoking, higher blood pressure and cholesterol levels, and other health behaviors and health risk factors, even after controlling for individual socioeconomic status.32,33,34,35 In addition, recent literature has examined the health impact of community “social cohesion and social capital.” Community social cohesion and social capital have been defined in a number of ways. Kawachi and Berkman suggest that “social cohesion refers to the extent of connectedness and solidarity among groups in society.”36 To measure group social cohesion, Kawachi and colleagues looked at national surveys to see how people responded in agreement or disagreement to statements like: “Most people can be trusted,” “Most people would try to take advantage of you if they got the chance,” and “Most people are helpful.”37 They then created profiles for each state in the country based on the responses of state residents in order to characterize each state as being low trust, medium trust, or high trust states (Wisconsin had better than average social capital as measured in this study). Kawachi and colleagues found that individuals living in states with lower levels of social capital were more likely to have poorer self-rated health, even after controlling for their own socioeconomic status, health behaviors, and access to health care.38 Economic Factors Those who are unemployed, underemployed, or employed at a very low income suffer health effects related to their low income. Lower income can have a drastic effect on life expectancy—an inequity of more than six years can result between those with lowest and highest income levels. There are many pathways by which this gradient operates.39 One is that those with lower income often have worse access to health care. Income also influences whether or not people can live in safe houses and neighborhoods, buy healthy foods, or have time for physical activity. Furthermore, research has shown that people with lower incomes have a higher allostatic stress load—the accumulation of high levels of stress. A high allostatic load has been linked with higher levels of heart disease, diabetes, and other chronic conditions, likely through biological pathways involving chronically elevated levels of stress hormones like cortisol and adrenaline.40
Social, Economic, and Educational Factors that Influence Health Healthiest Wisconsin 2020 Focus Area Profile May 2013
8
Between 2003 and 2012 the unemployment rate in Wisconsin has fluctuated between 5% and 9%, although there is wide variability within the population.41 For example, the employment rate for the white population of Milwaukee in 2010 was 77.4 %, while the rate of employment for the African American population was only 44.7 %.42,43 Similar trends are seen with income, one of the most commonly used indicators of economic well-being. Increasing employment rates and income levels typically requires systemic policy changes, and although income- and employment-based policies often do not have health improvement as a primary goal, they often have major health effects. Research has shown that many such policies, from an expanded Earned Income Tax Credit (EITC) and minimum wage laws to various job training and job creation policies, are effective in improving health outcomes.44
Educational Factors Education and poverty are closely linked—as one’s educational background improves, so typically do opportunities for higher-paying employment, better housing, and improved quality of life.45,46 With education serving as a pathway out of poverty, and income affecting health status, it is clear that education is an important factor in predicting health. Beyond these pathways, education level is also an independent predictor of health.47 Many studies have shown significant positive associations between educational attainment and measures such as mental health, physical health, risk of mortality, and cognitive functioning,48,49,50,51,52 while some studies still find mixed results.53,54 Early childhood education, however, has strong and consistent evidence for positively influencing health over the life course. Wisconsin’s high school graduation rates are among the highest in the nation, and its dropout rates - the rate at which enrolled students fail to enroll in subsequent terms - are among the nation’s lowest.55 Nearly three-quarters of the state’s sophomores score at proficient or advanced levels in reading. At the Milwaukee District level, however, the situation is starkly different. The Milwaukee graduation rate is 61.1%; only 40.2% of the district’s sophomores score above the basic level in reading. Among Milwaukee students who are economically disadvantaged, the rates are even more discouraging.56 When a substantial proportion of school funding is linked to property taxes, this may adversely affect schools in poorer areas of Milwaukee and other less-wealthy regions in the state, and may be a factor in sustaining (or even increasing) the funding gap between high-poverty and low-poverty school districts, which may be a key factor driving disparities in educational attainment.. The link between education and health—both directly and by driving income and employment—is one of the strongest SDoH and has great potential for policy interventions. The World Health Organization’s Commission on Social Determinants of Health has identified early childhood education as a priority area, urging governments to put resources into the area.57 Two randomized controlled preschool intervention trials have shown that early childhood education is associated with improved adult health status, lower behavioral risk factors, and lower criminal activity,58,59 and another showed that these early childhood programs are cost-effective.60
Social, Economic, and Educational Factors that Influence Health Healthiest Wisconsin 2020 Focus Area Profile May 2013
9
HW2020 Objectives Related to Social, Economic and Educational Focus Area The HW2020 objectives related to social, economic, and educational factors were originally listed as Objectives 3, 4, and 5 in the Healthiest Wisconsin 2020 state health plan (pages 77-78). This profile renumbers the objectives and includes a rich list of potential indicators. Objective 1: Policies to reduce discrimination and increase social cohesion By 2020, state and local governments will develop and implement policies and programs that improve social cohesion and social support for all by reducing racism and other forms of discrimination; creating health-enhancing environments at home, in the workplace and throughout the community; and promoting the values of diversity and social connectedness. Objective 1 Indicators61,62,63
x Social cohesion: o Incarceration rates o Family structure o Trust o Confidence in social institutions o Pro- and anti-social behavior o Tolerance
x Discrimination: o Perceptions of discrimination and equity o Data on racism and discriminatory acts o Data on racially violent crimes and harassment
x Participation in social, cultural and political life o Registered to vote rates o Cast a ballot rates o Volunteer in community rates
Objective 2: Policies to reduce poverty By 2020, local, state, and federal governments will develop and implement health-promoting policies and programs that reduce poverty to a residual level.
Objective 2 Indicators64
x Prevalence of household poverty x Employment status x Access to employment x Proportion of children living with at least one parent employed year round x Prevalence of childhood poverty
Objective 3: Policies to improve education By 2020, state and local governments will develop and implement educational policies and practices supporting healthy outcomes, including universal early childhood education, universal
Social, Economic, and Educational Factors that Influence Health Healthiest Wisconsin 2020 Focus Area Profile May 2013
10
completion of at least high school equivalency, and curricula in each community that support cultural competency, valuing diversity, health literacy and informed decision-making about health.
Objective 3 Indicators65
x High school graduation rates x Enrollment in higher education
Additional Potential Process Indicators:
x Social Factors o Measures of social cohesion and community civic capacity o Measures of incarceration vs. treatment rates for non-violent drug offenders
x Economic Factors o Expansion of anti-poverty policies such as the Earned Income Tax Credit (EITC)
or Transitional Jobs programs o Increase in minimum wage, and/or indexing minimum wage to inflation o Measures of housing stability
x Educational Factors o Expansion of access – preferably universal access – to pre-K education o Rates of enrollment in higher-education programs immediately after high school
graduation o Expansion of vocational training programs
x Measures that do not lend themselves to being categorized as primarily social vs. economic vs. educational:
o The extent to which health is a consideration in the development or implementation of any policy that is passed that could influence people’s social, economic, and educational context.
o The impact on health of any policy that is passed that could influence people’s social, economic, and educational context.
o The degree to which evidence-based policies and programs (such as those listed in the What Works for Health database) have been implemented in Wisconsin66
Evidence- or science-based programs and policies to move the objectives forward There has been increased attention paid to the development of an evidence base for programs and policies that work to improve health equity. Currently, there are several sources available that describe evidence-based programs and policies that improve social, economic and educational factors that influence health. One important resource is the Wisconsin-grown “What Works for Health” database – a compilation of strategies to improve health, with a section devoted to social, economic and educational factors.67 Other useful action-oriented resources include:
x Commission to Build a Healthier America, a report from the Robert Wood Johnson Foundation. This report includes policy recommendations, as well as an assessment of needed collaborators to improve health equity.15
Social, Economic, and Educational Factors that Influence Health Healthiest Wisconsin 2020 Focus Area Profile May 2013
11
x Closing the gap in a generation: health equity through action on the social determinants of health. Final Report of the WHO’s Commission on Social Determinants of Health. This report provides recommendations for addressing social, economic and educational factors, as well as a framework for action, public and political will-building.68
x Solid Facts, a report from the World Health Organization. This report describes ten critical social determinants of health, with policy implications for each.69
x Reaching for a healthier life: facts on socioeconomic status and health in the U.S. (a report from the MacArthur Foundation). The report describes various social determinants of health and concludes with a framework for policy action.70
x Tackling health inequities through public health practice: theory to action. This book offers a health equity framework and then dives deeply into case studies for organization change and working with communities to achieve health equity.71
x Socioeconomic disparities in health in the U.S.: an agenda for action. This paper provides action strategies based on European and U.S. experience to place public health priorities on the policy agenda.72
x Policy to tackle the social determinants of health: using conceptual models to understand the policy process. This paper provides an overview of the policy-making process, including the framework for how social determinants of health fit into that process.73
x Reducing poverty in Wisconsin: analysis of the Community Advocates Public Policy Institute policy package. This report created by the Urban Institute provides an analysis of a poverty-reducing policy package that it concluded would reduce poverty at least 58 percent.74
Below is a sample of some commonly cited evidence-based and promising practices and policies that would improve the social, economic and educational factors that influence health. Social Factors
x Legislation that protects minority and vulnerable groups from discrimination and social exclusion.60
x Labor market, education and family welfare policies that reduce social stratification. x Programs and policies that increase opportunity for healthy social interaction and
networking. 60 x Implement zoning strategies to promote mixed income communities. 58 x Create neighborhood associations. 58 x Promote community art programs. 58 x Develop accessible local food systems/farmers markets. 58 x Build community capacity to organize and advocate for policy change. x Treatment alternatives to prison that will keep communities together. 75
Economic Factors
x Tax credit for seniors and adults with disabilities.65 x Transitional Jobs program for unemployed jobseekers.65 x Higher minimum wage for workers.65 x Reformed Earned Income Tax Credit for low earners.65 x Incentives to attract and retain employers.58
Social, Economic, and Educational Factors that Influence Health Healthiest Wisconsin 2020 Focus Area Profile May 2013
12
Educational Factors
x Improve quality of Head Start and other early education programs, including smaller teacher-child ratios, increasing the number of teachers with four-year college degrees in early childhood education, decreasing staff turnover, increasing home visits with families, and more monitoring by government or accrediting agencies.76
x Comprehensive school reform to improve student achievement.58 x Broad youth development programs that aim to improve graduation rates through a
collaboration of school, home and community approaches.58 x Policies that improve teacher quality, including improving professional development
practices; improving teacher accountability; improving teacher preparation; providing professional support to beginning teachers; raising licensing and certification standards; recruiting talented and diverse teachers.58
x Increase funding for college access programs that prepare students academically and help them complete the college entry process. 58
x School environment that is safe and conducive to learning.58 x School policies that support health promotion.58
Summary It is clear that social, economic, and educational factors are strongly linked with health outcomes—more strongly, even, than access to high-quality health care. It is also clear that different Wisconsin populations live, work, and play in neighborhoods and environments with stark differences in social, economic, and educational factors, and that those differences lead directly to significant health disparities / inequities in Wisconsin. Thus, addressing social, economic, and educational factors is crucial to meet HW2020’s overall goal of eliminating health disparities and achieving health equity. References 1 WHO. Social determinants of health. Available at: http://www.who.int/social_determinants/en/. Accessed December 23, 2011. 2 CDC. Social Determinants of Health. Available at: http://www.cdc.gov/socialdeterminants/. Accessed December 23, 2011. 3 Brennan Ramirez L, Baker E, Metzler M. Promoting Health Equity: A Resource to Help Communities Address Social Determinants of Health. In: Department of Health and Human Services, Centers for Disease Control and Prevention; 2008:6. 4 U.W. Population Health Institute, Brief Report, v1, n5, August 2006: Using Measures of Disparities as Indicators of the Health of Wisconsin; Kempf AM, Peppard PE, Booske BC, Kindig DA, Remington PL. http://uwphi.pophealth.wisc.edu/publications/other/briefReportv01n05.pdf, Accessed May 4, 2013. 5 Kawachi I, Subramanian SV, Almeida-Filho N. A glossary for health inequalities. Journal of Epidemiology and Community Health. 2002;56(9):647-652. 6 Wisconsin Department of Health Services. Wisconsin State Health Plan - Healthiest Wisconsin 2020. 2012. Available at: http://www.dhs.wisconsin.gov/hw2020/. Accessed April 3, 2012. 7 Wisconsin Department of Health Services. Wisconsin State Health Plan - Healthiest Wisconsin 2020. 2012. Available at: http://www.dhs.wisconsin.gov/hw2020/. Accessed April 3, 2012.

Social, Economic, and Educational Factors that Influence Health Healthiest Wisconsin 2020 Focus Area Profile May 2013
13
8 American Medical Student Association. Health Equity & Health Justice. Available at: http://www.amsa.org/AMSA/Homepage/About/Committees/REACH/healthequity.aspx. Accessed December 23, 2011. 9 University of Wisconsin Population Health Institute, Robert Wood Johnson Foundation. County Health Rankings. Available at: http://www.countyhealthrankings.org/. Accessed December 23, 2011. 10 Chen H-Y, Baumgardner DJ, Galvao LW, et al. Milwaukee Health Report 2011: Health Disparities in Milwaukee by Socioeconomic Status. Milwaukee, WI: Center for Urban Population Health; 2011. 11 Vila P, Swain G, Baumgardner D, et al. Health Disparities in Milwaukee by Socioeconomic Status. Wisconsin Medical Journal. 2007;106(7):366–372. 12 Marmot M. Fair society, healthy lives: The Marmot Review. Institute of Health Equity; 2010. Available at: http://www.instituteofhealthequity.org/Content/FileManager/pdf/fairsocietyhealthylives.pdf. 13 Marmot, M; Smith, G.D; Stanfeld, S; Patel, C; Brunner, E. Health Inequalities among British Civil Servants: the Whitehall ii Study Lancet 1991; 338:58-9 14 Chen, Y; Li, H.D Mother’s Education and Child Health: Is There A Nurturing Effect? Journal of Health Economics.2009; 28:413-26 15 Robert Wood Johnson Foundation-Commission to Build a Healthier America: Beyond Health Care: New Directions to a Healthier America-Recommendations from the Robert Wood Johnson Foundation Commission to Build a Healthier America. April 2009. Available at: www.commissiononhealth.org 16 Bosma, H; Marmot, M; Hemingway, Harry. Low job control and risk of coronary heart disease in Whitehall ii. British Medical Journal 1997; 314-558 17 Pickett, KE; Mookherjee J; Wilkinson RG. Adolescents birth rates, total homicides and income inequalities in rich countries. American Journal of Public Health, 2005. July; 95 (7) 1181-3 18 Brunner EJ. Stress and the biology of inequality. British Medical Journal, 1997, 314: 1472-1476 19 Brunner EJ et al. Adrenocortical, autonomic and inflammatory causes of metabolic syndrome. Circulation, 2002, 106: 2659-2665. 20 Robert S. Health priority: social and economic factors that influence health. Prepared for the Wisconsin Turning Point Initiative, 2002 (unpublished). 21 Robert SA, Booske BC, Rigby E, Rohan AM. Public views on determinants of health, interventions to improve health, and priorities for government. WMJࣟ: official publication of the State Medical Society of Wisconsin. 2008;107(3). 22 Frieden T. A framework for public health action: The health impact pyramid. American Journal of Public Health. 2010;100(4):590–595. 23 Prentice B. Confronting the social determinants of health inequities: Rethinking public health. 2009. Available at: http://www.barhii.org/resources/downloads/prentice_feb2009.pdf. 24 Wisconsin Department of Health and Family Services, Division of Public Health. Core functions and essential services for public health in Wisconsin. 2005. Available at: http://dhs.wisconsin.gov/statehealthplan/shp-pdf/corefunctions.pdf. Accessed December 30, 2011. 25 Berkman, L.F., Glass, T., Brissette, I. & Seeman, T. E. (2000). From social integration to health: Durkheim in the new millennium. Social Science & Medicine, 51:843-857. 26 Cohen, S., & Syme, S.L. (1985). Social support and health. New York: Academy Press. 27 House, J.S., Landis, K.R., & Umberson, D. (1988). Social Relationships and Health. Science, 241(4865): 540-545. 28 Emmons, K.M. (2000). Health behaviors in a social context. In: L.F. Berkman, & I. Kawachi, eds. Social Epidemiology. New York: Oxford University Press. 29 Hsieh, C.C., & Pugh, M.D. (1993). Poverty, income inequality, and violent crime: a meta-analysis of recent aggregate data studies. Crime Justice Review,18:182-202. 30 Macintyre, S., Maciver, S., & Sooman, A. (1993). Area, class and health: Should we be focusing on places or people? Journal of Social Policy, 22(2):213-34 31 Sooman, A., & Macintyre, S. (1995). Health and perceptions of the local environment in socially contrasting neighborhoods in Glasgow. Health & Place, 1(1):15-26. 32 Winkleby, M.A., Fortmann, S.P., & Barrett, D. C. (1990). Social class disparities in risk factors for disease: eight-year prevalence patterns by level of education. Preventive Medicine, 19:1-12. 33 Kleinschmidt, I., Hills, M., & Elliott, P. (1995). Smoking behaviour can be predicted by neighbourhood deprivation measures. Journal of Epidemiology and Community Health, 49(2):S72-S7 34 Diez-Roux, A.V., Nieto, F.J., Muntaner, C., Tyroler, H.A., Comstock, G. W., Shahar, E., Cooper, L. S., Watson, R. L. & Szklo. M. (1997). Neighborhood environments and coronary heart disease: a multilevel analysis. American
Social, Economic, and Educational Factors that Influence Health Healthiest Wisconsin 2020 Focus Area Profile May 2013
14
Journal of Epidemiology, 146(1):48-63. 35 Reijneveld, S.A. (1998). The impact of individual and area characteristics on urban socioeconomic differences in health and smoking. International Journal of Epidemiology, 27:33-40 36 Kawachi, I., & Berkman, L. (2000) Social cohesion, social capital, and health. In: Berkman L.F., & Kawachi I., eds. Social Epidemiology. New York: Oxford University Press. 37 Kawachi, I., Kennedy, B.P., Lochner, K., & Prothrow-Stith, D. (1997). Social Capital, Income Inequality, and Mortality. American Journal of Public Health, 87 (9): 1491–1498. 38 Kawachi, I., Kennedy, B.P., & Glass, R. (1999). Social capital and self-rated health: A contextual analysis. American Journal of Public Health, 89(8):1187-1193. 39 Marmot M. Fair society, healthy lives: The Marmot Review. Institute of Health Equity; 2010. Available at: http://www.instituteofhealthequity.org/Content/FileManager/pdf/fairsocietyhealthylives.pdf. 40 Szanton SL, Gill JM, Allen JK. Allostatic Load: A Mechanism of Socioeconomic Health Disparities? Biological Research For Nursing. 2005;7(1):7 –15. 41 Bureau of Labor Statistics. Wisconsin Economy at a Glance. Available at: http://www.bls.gov/eag/eag.wi.htm; also see http://data.bls.gov/timeseries/LASST55000003?data_tool=XGtable.Accessed December 23, 2011. 42 Center on Wisconsin Strategy. The state of working Wisconsin. Center on Wisconsin Strategy; 2011. 43 Levine, Marc V. Race and Male Employment in the Wake of the Great Recession: Black Male Employment Rates in Milwaukee and the Nation’s Largest Metro Areas 2010. UW-Milwaukee Center for Economic Development. Available at http://www4.uwm.edu/ced/publications/black-employment_2012.pdf. 44 University of Wisconsin Population Health Institute, University of Wisconsin School of Medicine and Public Health. What Works for Health: Policies and Programs to Improve Wisconsin’s Health. Available at: http://www.whatworksforhealth.wisc.edu/. Accessed December 23, 2011. 45 Dahlgren G, Whitehead M. Levelling up (part 2): a discussion paper on European strategies for tackling social inequities in health. In: WHO EURO.; 2006. 46 DeNavas-Walt C, Proctor B, Smith J. U.S. Census Bureau, Current Population Reports, P60-239, Income, Poverty, and Health Insurance Coverage in the United States: 2010. Washington DC: U.S. Census Bureau; 2011. Available at: www.census.gov/prod/2011pubs/p60-239.pdf. 47 Lantz PM, Lynch JW, House JS, et al. Socioeconomic disparities in health change in a longitudinal study of US adults: the role of health-risk behaviors. Social Science & Medicine. 2001;53(1):29–40. 48Glymour MM, Kawachi I, Jencks CS, Berkman LF. Does childhood schooling affect old age memory or mental status? Using state schooling laws as natural experiments. Journal of epidemiology and community health. 2008;62(6):532. 49 Kunst AE, Mackenbach JP. The size of mortality differences associated with educational level in nine industrialized countries. American Journal of Public Health. 1994;84(6):932. 50 Marmot M, Ryff CD, Bumpass LL, Shipley M, Marks NF. Social inequalities in health: next questions and converging evidence. Social Science & Medicine. 1997;44(6):901–910. 51 Winkleby MA, Jatulis DE, Frank E, Fortmann SP. Socioeconomic status and health: how education, income, and occupation contribute to risk factors for cardiovascular disease. American journal of public health. 1992;82(6):816. 52 Krokstad S, Kunst AE, Westin S. Trends in health inequalities by educational level in a Norwegian total population study. Journal of epidemiology and community health. 2002;56(5):375 53 Fujiwara T, Kawachi I. Is education causally related to better health? A twin fixed-effect study in the USA. International journal of epidemiology. 2009;38(5):1310. 54 Herd P. Education and Health in Late-life among High School Graduates. Journal of health and social behavior. 2010;51(4):478. 55 Stillwell R. Public School Graduates and Dropouts From the Common Core of Data: School Year 2007–08 (NCES 2010-341). Institute of Education Sciences, U.S. Department of Education. Washington, DC.: National Center for Education Statistics; 2010. Available at: http://nces.ed.gov/pubsearch/pubsinfo.asp?pubid=2010341. 56 Wisconsin Information Network for Successful Schools. Data Analysis. WINSS Successful School Guide. 2010. Available at: http://data.dpi.state.wi.us/data/questions.aspx?GraphFile=BlankPageUrl&S4orALL=1&SRegion=1&SCounty=47&SAthleticConf=45&SCESA=05&OrgLevel=st. Accessed August 23, 2011. 57 WHO. Closing the gap in a generation: Health equity through action on the social determinants of health. Geneva, Switzerland: World Health Organization; 2008. Available at: http://www.who.int/social_determinants/thecommission/finalreport/en/index.html. Accessed November 16, 2011.

Social, Economic, and Educational Factors that Influence Health Healthiest Wisconsin 2020 Focus Area Profile May 2013
15
58 Muennig P, Schweinhart L, Montie J, Neidell M. Effects of a prekindergarten educational intervention on adult health: 37-year follow-up results of a randomized controlled trial. American journal of public health. 2009;99(8):1431. 59 Muennig P, Robertson D, Johnson G, et al. The Effect of an Early Education Program on Adult Health: The Carolina Abecedarian Project Randomized Controlled Trial. Am J Public Health. 2011:AJPH.2010.200063. 60 Braveman P, Sadegh-Nobari T, Egerter S. Issue brief series: Exploring the social determinants of health: Early childhood experiences and health. San Francisco Center on Disparities in Health: Robert Wood Johnson Foundation; 2011. 61 Council of Europe. Concerted development of social cohesion indicators: Methodological guide. 2005 62 Spoonley P, et al. Social cohesion: a policy and indicator framework for assessing immigrant and host outcomes. Available at: http://www.msd.govt.nz/documents/about-msd-and-our-work/publications-resources/journals-and-magazines/social-policy-journal/spj24/24-pages85-110.pdf 63 OECD. Society at a Glance 2011 - OECD Social Indicators. 2011. Available at: http://www.oecd.org/els/socialpoliciesanddata/societyataglance2011-oecdsocialindicators.htm 64 U.S. Census Bureau; generated using American FactFinder; <http://factfinder2.census.gov>; (2 October 2012). 65 U.S. Census Bureau; generated using American FactFinder; <http://factfinder2.census.gov>; (2 October 2012). 66 University of Wisconsin Population Health Institute, University of Wisconsin School of Medicine and Public Health. What Works for Health: Policies and Programs to Improve Wisconsin’s Health. Available at: http://www.whatworksforhealth.wisc.edu/. Accessed December 23, 2011. 67 University of Wisconsin Population Health Institute, University of Wisconsin School of Medicine and Public Health. What Works for Health: Policies and Programs to Improve Wisconsin’s Health. Available at: http://www.whatworksforhealth.wisc.edu/. Accessed December 23, 2011. 68 CSDH: Closing the gap in a generation: health equity through action on the social determinants of health. Final Report of the Commission on Social Determinants of Health. Geneva, World Health Organization. 2008. Available at: http://whqlibdoc.who.int/publications/2008/9789241563703_eng.pdf 69 WHO. Social determinants of health: the solid facts. 2nd edition. Geneva, Switzerland: World Health Organization; 2003: available at: http://www.euro.who.int/__data/assets/pdf_file/0005/98438/e81384.pdf 70 McArthur Foundation. Reaching for a healthier life: facts on socioeconomic status and health in the US. Available at: http://www.macses.ucsf.edu/downloads/Reaching_for_a_Healthier_Life.pdf. 71 Hofrichter R and Bhatia R. Tackling health inequities through public health practice: theory to action. New York: Oxford University Press, 2010. Print. 72 Moss N. Socioeconomic disparities in health in the US: an agenda for action. Social Science & Medicine. 2000;51:1627-1638. 73 Exworthy M. Policy to tackle the social determinants of health: using conceptual models to understand the policy process. Health Policy and Planning. 2008;23:318-327 74 Urban Institute. Reducing poverty in Wisconsin: analysis of the Community Advocates Public Policy Institute policy package. 2012. Available at: http://urban.org/UploadedPDF/412604-Reducing-Poverty-in-Wisconsin.pdf. 75 Human Impact Partners. Wisconsin Treatment Instead of Prison, Health Impact Assessment. In progress. 76 Kovach M, Dickman A, Lam E, Henken R. The price of quality: Estimating the Cost of a Higher Quality Early Childhood Care and Education System for Southeast Wisconsin. Milwaukee, WI: Public Policy Forum; 2010.