social dynamics within decomposer communities lead to nitrogen
TRANSCRIPT
ARTICLE
Received 26 Jan 2015 | Accepted 21 Oct 2015 | Published 1 Dec 2015
Social dynamics within decomposer communitieslead to nitrogen retention and organic matterbuild-up in soilsChristina Kaiser1,2, Oskar Franklin3,4, Andreas Richter2 & Ulf Dieckmann1
The chemical structure of organic matter has been shown to be only marginally important for
its decomposability by microorganisms. The question of why organic matter does accumulate
in the face of powerful microbial degraders is thus key for understanding terrestrial carbon
and nitrogen cycling. Here we demonstrate, based on an individual-based microbial com-
munity model, that social dynamics among microbes producing extracellular enzymes
(‘decomposers’) and microbes exploiting the catalytic activities of others (‘cheaters’) regulate
organic matter turnover. We show that the presence of cheaters increases nitrogen retention
and organic matter build-up by downregulating the ratio of extracellular enzymes to total
microbial biomass, allowing nitrogen-rich microbial necromass to accumulate. Moreover,
increasing catalytic efficiencies of enzymes are outbalanced by a strong negative feedback on
enzyme producers, leading to less enzymes being produced at the community level. Our
results thus reveal a possible control mechanism that may buffer soil CO2 emissions in a
future climate.
DOI: 10.1038/ncomms9960 OPEN
1 Evolution and Ecology Program, International Institute for Applied Systems Analysis (IIASA), Schlossplatz 1, A-2361 Laxenburg, Austria. 2 Department ofMicrobiology and Ecosystem Science, University of Vienna, Althanstrasse 14, A-1090 Vienna, Austria. 3 Ecosystem Services and Management Program,International Institute for Applied Systems Analysis (IIASA), Schlossplatz 1, A-2361 Laxenburg, Austria. 4 Department of Forest Ecology and Management,Swedish University of Agricultural Sciences, SE-901 83 Umeå, Sweden. Correspondence and requests for materials should be addressed to C.K.(email: [email protected]).
NATURE COMMUNICATIONS | 6:8960 | DOI: 10.1038/ncomms9960 | www.nature.com/naturecommunications 1
In biogeochemistry, microbial decomposition of organic matterhas traditionally been modelled using first-order decay ratesbased on the chemical quality of the litter. Over the last
decades, it has become increasingly evident that physiologicalprocesses and microbial responses to environmental conditionscontrol decay rates, rather than litter chemistry1–3. Consequently,during the last decade conceptual models with a more explicitimplementation of microbial controls, such as microbial biomass,extracellular enzyme activities and microbial physiologyhave been developed4–13 and the incorporation of microbialphysiology into ecosystem models has repeatedly beensuggested4,5,14.
First attempts to account for microbial physiology in large-scale biogeochemical models have demonstrated a strong impacton model predictions5,6,11,15. In particular, the scaling ofmicrobial physiological parameters (regulating, for example,microbial growth efficiency or extracellular enzyme kinetics)with expected environmental change has led to largely divergingprojections of future soil carbon (C) stocks11,14. The highsensitivity of model predictions to small changes in microbialphysiological parameters highlights the need to better understandmicrobial mechanisms of organic matter decay in order to be ableto make robust predictions of future soil C stocks.
The microbial physiology currently implemented in soilmodels is generally based on mechanistic concepts for singlemicrobial cells3–5,15, which are scaled up to microbialcommunities. This follows the inherent assumption that theeffects of physiological responses of microbes will be additive.Soil, however, is a complex system characterized by nonlinearinteractions among functionally different microorganisms in aspatially structured and chemically heterogeneous environment.Albeit often neglected in microbial ecology, it is well known fromother scientific disciplines such as physics, mathematics andtheoretical biology that in complex systems nonlinear interactionsbetween components at the micro-scale can lead to emergent
system behaviour and new qualitative features at the macro-scale16–18. One key question for adding mechanistic details to soilmodels thus is: is it feasible simply to scale up physiologicalresponses expected from single microbes to microbialcommunities? In a previous modelling study, we have shownthat adaptations at the community level regulate the relative ratesof C and nitrogen (N) recycling, which in turn improvesnutritional conditions for microbes. The possibility of suchself-regulating features of microbial communities is not yetconsidered in earth system models.
A specific characteristic of microbes is that they producecompounds that are released to their environment, for example,extracellular enzymes for the deconstruction of polymericresources, polysaccharides for biofilm formation or quorum-sensing molecules19. Once released by the producingmicroorganism, these compounds become functionally availableto other microbes in their surroundings20–22. The inevitableproduction of such ‘public goods’ fosters social (synergistic andexploitive) interactions among microbes19. Experiments haveshown that subpopulations of microbial ‘cheaters’, which exploitpublic goods in which they did not invest resources, arise quicklywhenever microbes producing these goods are present23–25.Microbial ‘cheaters’, as a special form of opportunistic microbes,are thus an inevitable part of any microbial decomposercommunity. In a pioneering study, Allison demonstratedthrough individual-based modelling that competition betweencheaters and microbes producing extracellular enzymesconstrains the decomposition of complex compounds13. Takingthis approach one step further, here we examine how socialinteractions at the micro-scale can affect and control large-scalefluxes and dynamics of C and N during organic matter turnover.
We use a recently developed individual based, spatial andstoichiometrically explicit model, which simulates C and Nturnover during litter decomposition at the mm-scale in a spatiallystructured environment. In our model, ‘decomposers’ produce
0.40
0.35
0.30
0.25Without cheatersWith cheaters (mild)With cheaters (strong)With cheaters (full)With cheaters (full and fast-growing)
0.20
60
50
40
30
20
10
0.25
0.20
0.15
0.10
0.05
0.00
20
15
10
5
15 25 35 45 55 65 75 85 95Initial litter C:N ratio
15 25 35 45 55 65 75 85 95
N in
mic
robi
al p
rodu
cts
(% to
tal N
)C
arbo
n us
e ef
ficie
ncy
Initial litter C:N ratio
C in
mic
robi
al p
rodu
cts
(% to
tal C
)
Dec
ay r
ate
(% lo
ss o
f ini
tial C
per
day
)
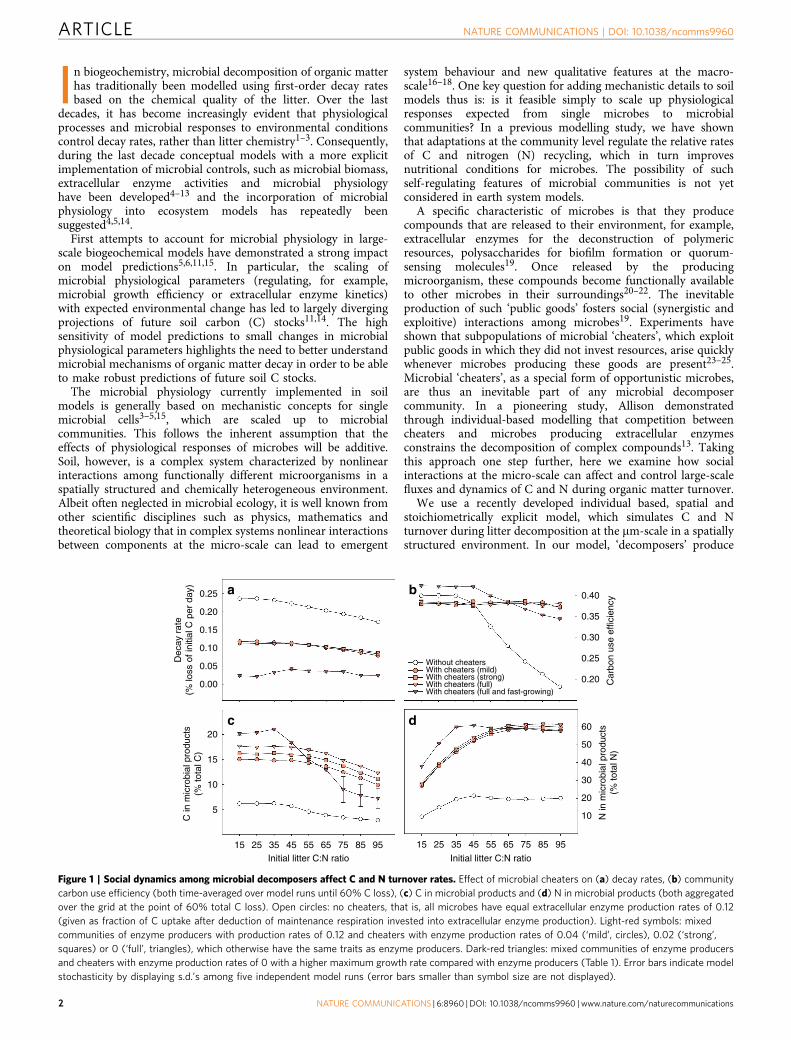
Figure 1 | Social dynamics among microbial decomposers affect C and N turnover rates. Effect of microbial cheaters on (a) decay rates, (b) community
carbon use efficiency (both time-averaged over model runs until 60% C loss), (c) C in microbial products and (d) N in microbial products (both aggregated
over the grid at the point of 60% total C loss). Open circles: no cheaters, that is, all microbes have equal extracellular enzyme production rates of 0.12
(given as fraction of C uptake after deduction of maintenance respiration invested into extracellular enzyme production). Light-red symbols: mixed
communities of enzyme producers with production rates of 0.12 and cheaters with enzyme production rates of 0.04 (‘mild’, circles), 0.02 (‘strong’,
squares) or 0 (‘full’, triangles), which otherwise have the same traits as enzyme producers. Dark-red triangles: mixed communities of enzyme producers
and cheaters with enzyme production rates of 0 with a higher maximum growth rate compared with enzyme producers (Table 1). Error bars indicate model
stochasticity by displaying s.d.’s among five independent model runs (error bars smaller than symbol size are not displayed).
ARTICLE NATURE COMMUNICATIONS | DOI: 10.1038/ncomms9960
2 NATURE COMMUNICATIONS | 6:8960 | DOI: 10.1038/ncomms9960 | www.nature.com/naturecommunications
extracellular enzymes to break down complex organic com-pounds, which are either of plant origin (primary substrate) ordead microbial cells (microbial remains, secondary substrate).The products of this enzymatic activity become availableto nearby microbes via diffusion, allowing competitive andsynergistic interactions at the micro-scale, which lead to emergentsystem dynamics at the macro-scale. We define ‘cheaters’ asmicrobes investing less into extracellular enzyme production thandecomposers, which means that they benefit from the invest-ments of their competitors26. Our results demonstrate that thepresence of microbial cheaters not only slows down decay rates,but also significantly increases the accumulation of N-richmicrobial products during litter decay. Moreover, the presenceof microbial cheaters made the decomposer system behave like abuffer: any increase in extracellular enzyme efficiency isoutbalanced by increased abundances of cheating microbes,which lowers the amount of enzymes produced at the communitylevel. Our results suggest that microbial cheaters may play anessential, but so far overlooked, role for C and N cycling interrestrial ecosystems.
ResultsSocial interactions slow down decay rates. The presence ofcheating microbes in our model has a strong negative effect onoverall litter decay rates across all initial litter C:N ratios (Fig. 1a).If cheaters possess the same functional traits as the main enzymeproducers (except for enzyme production), the model predictsthat decay rates are reduced by around 50%, no matter if theformer are only partly or fully cheating (Fig. 1). If cheatingmicrobes have a higher maximum growth rate than themain enzyme producers, as often observed for opportunisticmicrobes27, the slowing-down effect is magnified due to cheatersbeing more competitive, with decay rates being reduced by up to90%. Initial litter N content also influences decay rates in themodel: decay rates decrease with increasing initial litter C:Nratios, particularly in the absence of cheaters, due to increasingN limitation (Fig. 1a). The presence or absence of microbialcheaters, however, has a far stronger influence on decay rates thaninitial litter N content (Fig. 1a). Decay rates slow downspecifically at low initial litter C:N ratios when fast-growingcheaters are present, as fast-growing microbes are especiallycompetitive at high N availability28 (Fig. 1a, dark-red triangles).When initial C:N ratios are high, however, fast-growing cheatersare less competitive compared with cheaters that grow at the same(slow) rate as enzyme producers, because slow-growing microbescope better with N limitation in our model28. The negativeinfluence of fast-growing cheaters on decay rates is thusdiminished when C:N ratios are high, which is visible fromdecreasing microbial products and carbon use efficiency (CUE),both coming closer to the levels seen in the absence of cheaters(Fig. 1c,d).
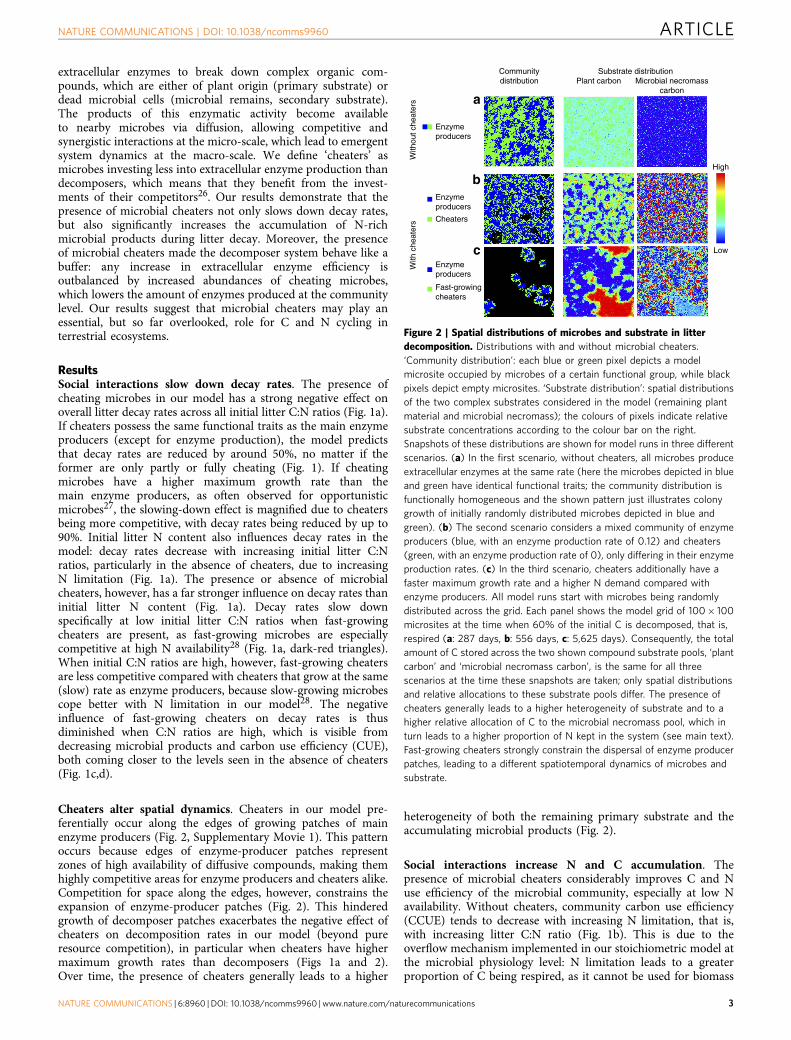
Cheaters alter spatial dynamics. Cheaters in our model pre-ferentially occur along the edges of growing patches of mainenzyme producers (Fig. 2, Supplementary Movie 1). This patternoccurs because edges of enzyme-producer patches representzones of high availability of diffusive compounds, making themhighly competitive areas for enzyme producers and cheaters alike.Competition for space along the edges, however, constrains theexpansion of enzyme-producer patches (Fig. 2). This hinderedgrowth of decomposer patches exacerbates the negative effect ofcheaters on decomposition rates in our model (beyond pureresource competition), in particular when cheaters have highermaximum growth rates than decomposers (Figs 1a and 2).Over time, the presence of cheaters generally leads to a higher
heterogeneity of both the remaining primary substrate and theaccumulating microbial products (Fig. 2).
Social interactions increase N and C accumulation. Thepresence of microbial cheaters considerably improves C and Nuse efficiency of the microbial community, especially at low Navailability. Without cheaters, community carbon use efficiency(CCUE) tends to decrease with increasing N limitation, that is,with increasing litter C:N ratio (Fig. 1b). This is due to theoverflow mechanism implemented in our stoichiometric model atthe microbial physiology level: N limitation leads to a greaterproportion of C being respired, as it cannot be used for biomass
Communitydistribution
Substrate distributionPlant carbon
With
out c
heat
ers
Enzymeproducers
Enzymeproducers
Enzymeproducers
Cheaters
Fast-growingcheaters
With
che
ater
s
Microbial necromasscarbon
High
Low
Figure 2 | Spatial distributions of microbes and substrate in litter
decomposition. Distributions with and without microbial cheaters.
‘Community distribution’: each blue or green pixel depicts a model
microsite occupied by microbes of a certain functional group, while black
pixels depict empty microsites. ‘Substrate distribution’: spatial distributions
of the two complex substrates considered in the model (remaining plant
material and microbial necromass); the colours of pixels indicate relative
substrate concentrations according to the colour bar on the right.
Snapshots of these distributions are shown for model runs in three different
scenarios. (a) In the first scenario, without cheaters, all microbes produce
extracellular enzymes at the same rate (here the microbes depicted in blue
and green have identical functional traits; the community distribution is
functionally homogeneous and the shown pattern just illustrates colony
growth of initially randomly distributed microbes depicted in blue and
green). (b) The second scenario considers a mixed community of enzyme
producers (blue, with an enzyme production rate of 0.12) and cheaters
(green, with an enzyme production rate of 0), only differing in their enzyme
production rates. (c) In the third scenario, cheaters additionally have a
faster maximum growth rate and a higher N demand compared with
enzyme producers. All model runs start with microbes being randomly
distributed across the grid. Each panel shows the model grid of 100� 100
microsites at the time when 60% of the initial C is decomposed, that is,
respired (a: 287 days, b: 556 days, c: 5,625 days). Consequently, the total
amount of C stored across the two shown compound substrate pools, ‘plant
carbon’ and ‘microbial necromass carbon’, is the same for all three
scenarios at the time these snapshots are taken; only spatial distributions
and relative allocations to these substrate pools differ. The presence of
cheaters generally leads to a higher heterogeneity of substrate and to a
higher relative allocation of C to the microbial necromass pool, which in
turn leads to a higher proportion of N kept in the system (see main text).
Fast-growing cheaters strongly constrain the dispersal of enzyme producer
patches, leading to a different spatiotemporal dynamics of microbes and
substrate.
NATURE COMMUNICATIONS | DOI: 10.1038/ncomms9960 ARTICLE
NATURE COMMUNICATIONS | 6:8960 | DOI: 10.1038/ncomms9960 | www.nature.com/naturecommunications 3
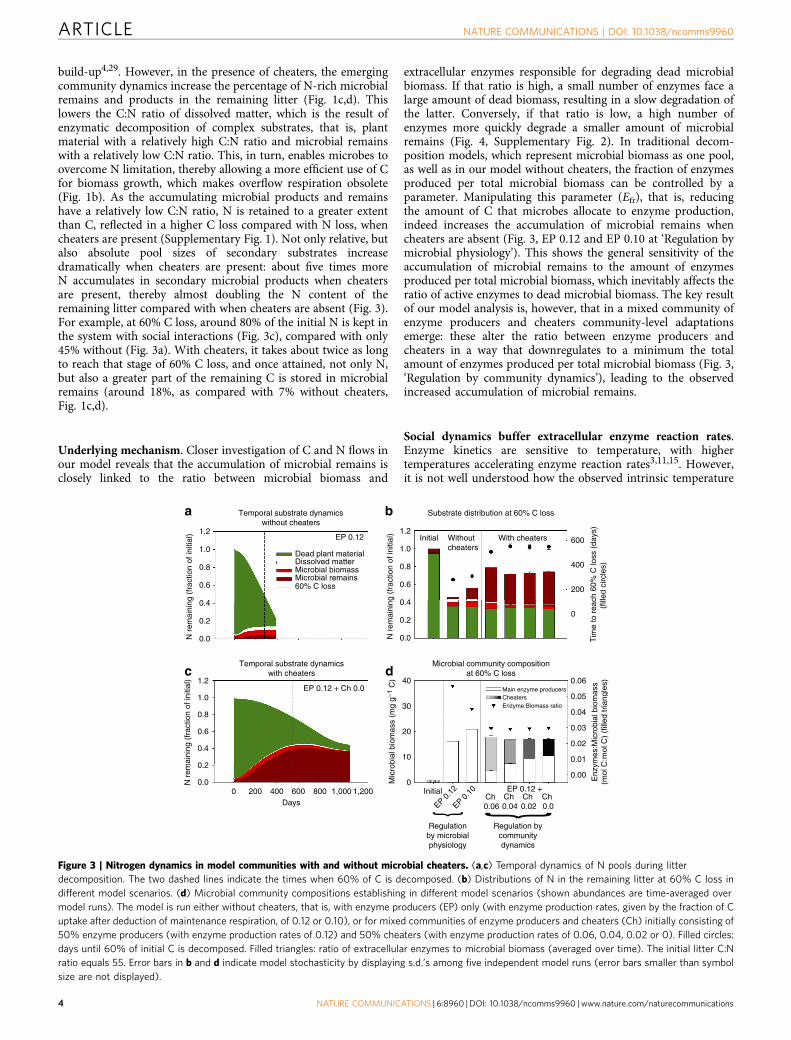
build-up4,29. However, in the presence of cheaters, the emergingcommunity dynamics increase the percentage of N-rich microbialremains and products in the remaining litter (Fig. 1c,d). Thislowers the C:N ratio of dissolved matter, which is the result ofenzymatic decomposition of complex substrates, that is, plantmaterial with a relatively high C:N ratio and microbial remainswith a relatively low C:N ratio. This, in turn, enables microbes toovercome N limitation, thereby allowing a more efficient use of Cfor biomass growth, which makes overflow respiration obsolete(Fig. 1b). As the accumulating microbial products and remainshave a relatively low C:N ratio, N is retained to a greater extentthan C, reflected in a higher C loss compared with N loss, whencheaters are present (Supplementary Fig. 1). Not only relative, butalso absolute pool sizes of secondary substrates increasedramatically when cheaters are present: about five times moreN accumulates in secondary microbial products when cheatersare present, thereby almost doubling the N content of theremaining litter compared with when cheaters are absent (Fig. 3).For example, at 60% C loss, around 80% of the initial N is kept inthe system with social interactions (Fig. 3c), compared with only45% without (Fig. 3a). With cheaters, it takes about twice as longto reach that stage of 60% C loss, and once attained, not only N,but also a greater part of the remaining C is stored in microbialremains (around 18%, as compared with 7% without cheaters,Fig. 1c,d).
Underlying mechanism. Closer investigation of C and N flows inour model reveals that the accumulation of microbial remains isclosely linked to the ratio between microbial biomass and
extracellular enzymes responsible for degrading dead microbialbiomass. If that ratio is high, a small number of enzymes face alarge amount of dead biomass, resulting in a slow degradation ofthe latter. Conversely, if that ratio is low, a high number ofenzymes more quickly degrade a smaller amount of microbialremains (Fig. 4, Supplementary Fig. 2). In traditional decom-position models, which represent microbial biomass as one pool,as well as in our model without cheaters, the fraction of enzymesproduced per total microbial biomass can be controlled by aparameter. Manipulating this parameter (Efr), that is, reducingthe amount of C that microbes allocate to enzyme production,indeed increases the accumulation of microbial remains whencheaters are absent (Fig. 3, EP 0.12 and EP 0.10 at ‘Regulation bymicrobial physiology’). This shows the general sensitivity of theaccumulation of microbial remains to the amount of enzymesproduced per total microbial biomass, which inevitably affects theratio of active enzymes to dead microbial biomass. The key resultof our model analysis is, however, that in a mixed community ofenzyme producers and cheaters community-level adaptationsemerge: these alter the ratio between enzyme producers andcheaters in a way that downregulates to a minimum the totalamount of enzymes produced per total microbial biomass (Fig. 3,‘Regulation by community dynamics’), leading to the observedincreased accumulation of microbial remains.
Social dynamics buffer extracellular enzyme reaction rates.Enzyme kinetics are sensitive to temperature, with highertemperatures accelerating enzyme reaction rates3,11,15. However,it is not well understood how the observed intrinsic temperature
Tim
e to
rea
ch 6
0% C
loss
(da
ys)
(fill
ed c
ircle
s)
Initial
EP 0.1
2
EP 0.1
0 EP 0.12 +Ch 0.06
Ch 0.04
Ch 0.02
Ch 0.0
Temporal substrate dynamicswith cheaters
0 200 400 600 800 1,000 1,200Days
EP 0.12 + Ch 0.0
Microbial community compositionat 60% C loss
Temporal substrate dynamicswithout cheaters
Substrate distribution at 60% C loss
Initial Withoutcheaters
With cheaters 600
400
200
0
0.06
0.05
0.04
0.03
0.02
0.01
0.00
Regulationby microbialphysiology
Regulation bycommunitydynamics
EP 0.12
Dead plant materialDissolved matterMicrobial biomassMicrobial remains60% C loss
1.2
1.0
0.8
0.6
0.4
0.2
0.0N r
emai
ning
(fr
actio
n of
initi
al) 1.2
1.0
0.8
0.6
0.4
0.2
0.0N r
emai
ning
(fr
actio
n of
initi
al)
1.2
1.0
0.8
0.6
0.4
0.2
0.0
40
30
20
10
0Mic
robi
al b
iom
ass
(mg
g–1
C)
N r
emai
ning
(fr
actio
n of
initi
al)
Main enzyme producers CheatersEnzyme:Biomass ratio
Enz
ymes
:Mic
robi
al b
iom
ass
(mol
C:m
ol C
) (f
illed
tria
ngle
s)
Figure 3 | Nitrogen dynamics in model communities with and without microbial cheaters. (a,c) Temporal dynamics of N pools during litter
decomposition. The two dashed lines indicate the times when 60% of C is decomposed. (b) Distributions of N in the remaining litter at 60% C loss in
different model scenarios. (d) Microbial community compositions establishing in different model scenarios (shown abundances are time-averaged over
model runs). The model is run either without cheaters, that is, with enzyme producers (EP) only (with enzyme production rates, given by the fraction of C
uptake after deduction of maintenance respiration, of 0.12 or 0.10), or for mixed communities of enzyme producers and cheaters (Ch) initially consisting of
50% enzyme producers (with enzyme production rates of 0.12) and 50% cheaters (with enzyme production rates of 0.06, 0.04, 0.02 or 0). Filled circles:
days until 60% of initial C is decomposed. Filled triangles: ratio of extracellular enzymes to microbial biomass (averaged over time). The initial litter C:N
ratio equals 55. Error bars in b and d indicate model stochasticity by displaying s.d.’s among five independent model runs (error bars smaller than symbol
size are not displayed).
ARTICLE NATURE COMMUNICATIONS | DOI: 10.1038/ncomms9960
4 NATURE COMMUNICATIONS | 6:8960 | DOI: 10.1038/ncomms9960 | www.nature.com/naturecommunications
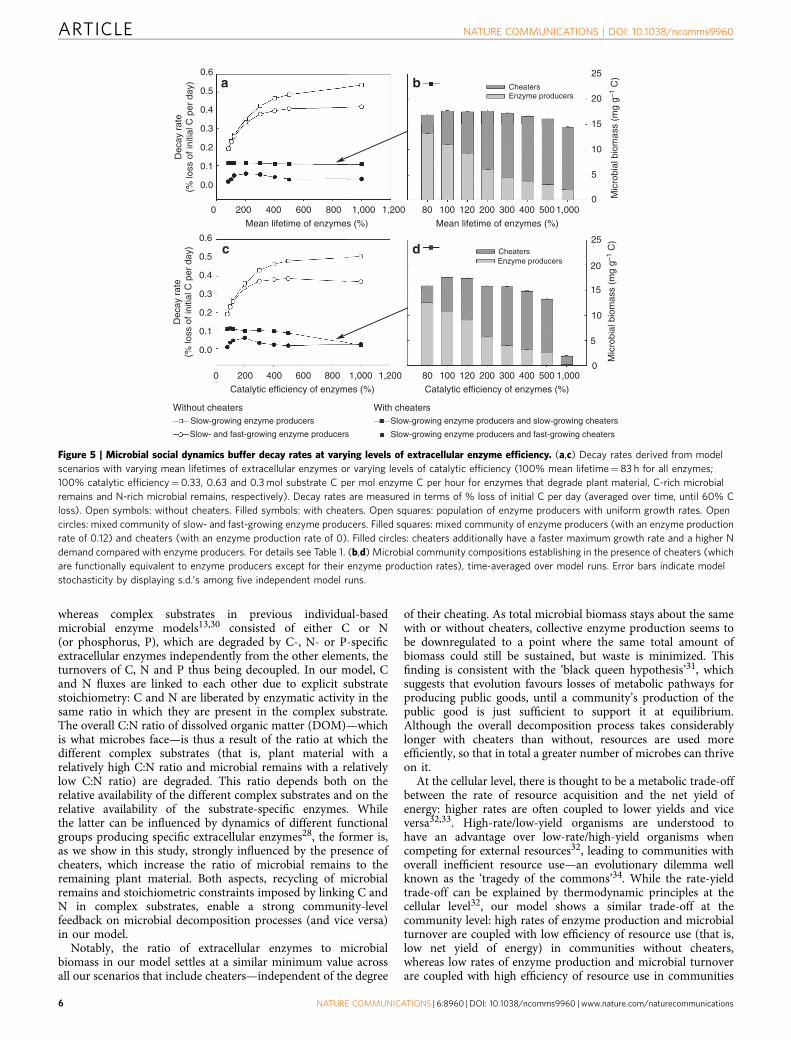
sensitivity of enzyme kinetics translates into a measurably lower‘apparent’ temperature sensitivity of microbial decompositionof soil organic matter3,15. To evaluate the interaction of socialcommunity dynamics with changing enzyme reaction rates, wevary two model parameters that control the catalytic efficiency ofenzymes: the catalytic rate constant kcat of enzymes (the higherthis parameter, the more units of substrate can be decomposedper enzyme and time, which is analogous to Vmax divided by theamount of enzymes) and the mean lifetime 1/kenz of enzymes (thehigher this parameter, the more substrate can be decomposed perunit of enzyme). Without cheaters, decay rates in our modelincrease, as expected, with increasing enzyme reaction rates, untilsaturation is reached (Fig. 5). At the same time, CCUE decreasesdue to increased overflow respiration (Supplementary Fig. 3).With cheaters, no increase in decay rates with increasing enzymereaction rates and no decrease in CCUE are observed in ourmodel. Our results thus show that the presence of microbialcheaters effectively buffers even extreme increases in enzymereaction rates (Fig. 5). This response is caused by a positivefeedback of enzyme efficiency on cheaters abundance: the moresubstrate each unit of extracellular enzyme degrades, the greater isthe proportion of cheaters that can be sustained in the microbialcommunity. This in turn reduces the absolute amount ofextracellular enzymes in the system. This community-inherentmechanism leads to the surprising outcome that the overallrate of enzyme activity at the community level is essentiallyindependent of the biochemical efficiency of individualextracellular enzymes (Fig. 5).
DiscussionOur results demonstrate that the microbial decomposer systemhas a high capacity for self-regulation. Social interactions betweenenzyme producers and cheaters create a powerful communityfeedback, which facilitates the build-up of C and N in N-richmicrobial residues and buffers decomposition rates against
variations in extracellular enzyme efficiencies. The interestingconclusion from this is that the ubiquitous presence ofopportunistic, seemingly ‘useless’ soil microbes, which exploitthe decomposer system, may be key for some importantecosystem services, such as soil C sequestration, N retentionand the acclimation of decomposition rates to changingenvironmental conditions.
Previous model-based studies have already shown that thepresence of cheating microbes constrains enzyme-catalyseddecomposition13,28,30. Our results reinforce and extend thisfinding by showing that social dynamics between enzyme-producing and cheating microbes can firmly downregulatethe total amount of enzymes produced at the communitylevel, which, as a consequence, maximizes the accumulation ofmicrobial remains during the decomposition of plant litter. Ourmodel differs from other individual-based microbial enzymemodels that also addressed the question of social dynamicsbetween microbial producers of extracellular enzymes andcheaters13,30 in two important ways.
First, our model includes complete recycling of C and N fromdead microbial biomass and microbial products such asextracellular enzymes. In the first, seminal, modeling studytargeting social dynamics within microbial decomposer commu-nities dead microbial biomass and extracellular enzymes wereremoved from the community without being re-metabolized bynew microbes13. Microbial processes in this model were thusmainly responding to external C and N input, which wasprovided at a constant rate. In our model, by contrast, an initialpool of dead plant material is degraded over time by microbialactivity. Part of the primary substrate is incorporated intomicrobial biomass and transformed into microbial remains oncell death, which in turn serve themselves as substrate formicrobes (Fig. 3, ref. 28). Consequently, microbial processes inour model are strongly regulated by internal recycling of C and N.
The second important difference is that complex substratesin our model contain both C and N (at a certain ratio),
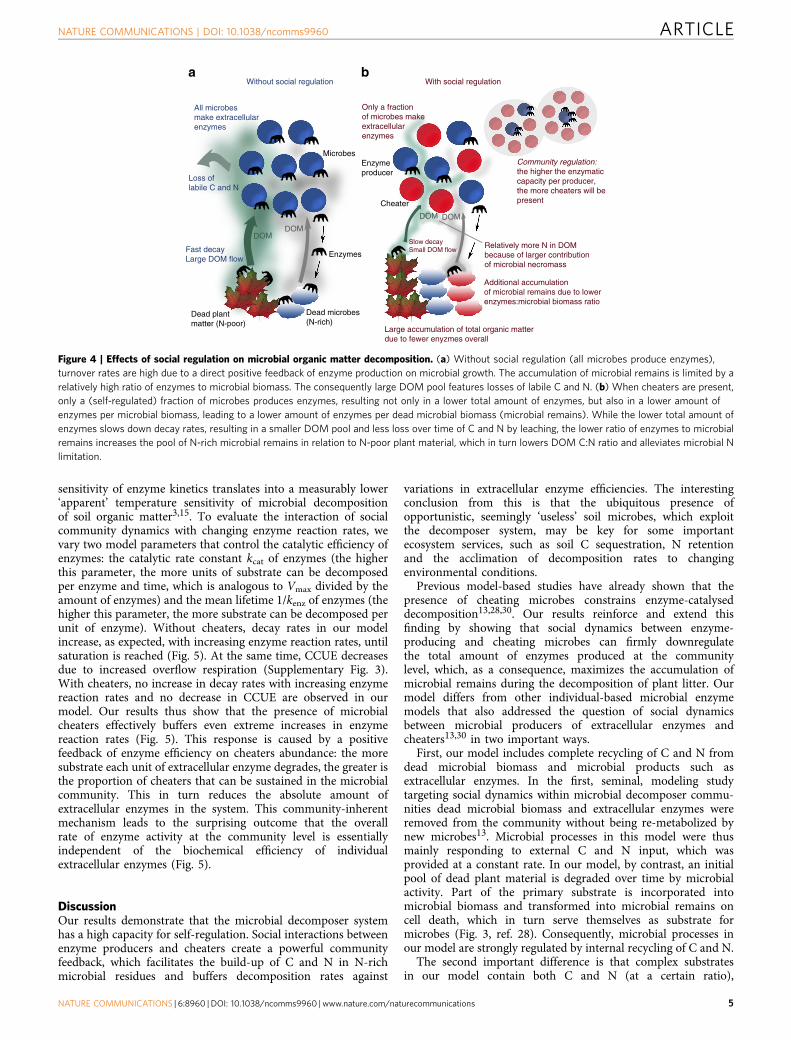
Community regulation: the higher the enzymatic capacity per producer, the more cheaters will bepresent
Relatively more N in DOMbecause of larger contributionof microbial necromass
Slow decaySmall DOM flow
Additional accumulationof microbial remains due to lowerenzymes:microbial biomass ratio
Large accumulation of total organic matterdue to fewer enyzmes overall
DOM
DOM
DOMDOM
All microbesmake extracellularenzymes
Without social regulation With social regulation
Only a fractionof microbes makeextracellularenzymes
Loss oflabile C and N
Fast decayLarge DOM flow
Dead plantmatter (N-poor)
Dead microbes(N-rich)
Enzymes
Cheater
Enzymeproducer
Microbes
Figure 4 | Effects of social regulation on microbial organic matter decomposition. (a) Without social regulation (all microbes produce enzymes),
turnover rates are high due to a direct positive feedback of enzyme production on microbial growth. The accumulation of microbial remains is limited by a
relatively high ratio of enzymes to microbial biomass. The consequently large DOM pool features losses of labile C and N. (b) When cheaters are present,
only a (self-regulated) fraction of microbes produces enzymes, resulting not only in a lower total amount of enzymes, but also in a lower amount of
enzymes per microbial biomass, leading to a lower amount of enzymes per dead microbial biomass (microbial remains). While the lower total amount of
enzymes slows down decay rates, resulting in a smaller DOM pool and less loss over time of C and N by leaching, the lower ratio of enzymes to microbial
remains increases the pool of N-rich microbial remains in relation to N-poor plant material, which in turn lowers DOM C:N ratio and alleviates microbial N
limitation.
NATURE COMMUNICATIONS | DOI: 10.1038/ncomms9960 ARTICLE
NATURE COMMUNICATIONS | 6:8960 | DOI: 10.1038/ncomms9960 | www.nature.com/naturecommunications 5
whereas complex substrates in previous individual-basedmicrobial enzyme models13,30 consisted of either C or N(or phosphorus, P), which are degraded by C-, N- or P-specificextracellular enzymes independently from the other elements, theturnovers of C, N and P thus being decoupled. In our model, Cand N fluxes are linked to each other due to explicit substratestoichiometry: C and N are liberated by enzymatic activity in thesame ratio in which they are present in the complex substrate.The overall C:N ratio of dissolved organic matter (DOM)—whichis what microbes face—is thus a result of the ratio at which thedifferent complex substrates (that is, plant material with arelatively high C:N ratio and microbial remains with a relativelylow C:N ratio) are degraded. This ratio depends both on therelative availability of the different complex substrates and on therelative availability of the substrate-specific enzymes. Whilethe latter can be influenced by dynamics of different functionalgroups producing specific extracellular enzymes28, the former is,as we show in this study, strongly influenced by the presence ofcheaters, which increase the ratio of microbial remains to theremaining plant material. Both aspects, recycling of microbialremains and stoichiometric constraints imposed by linking C andN in complex substrates, enable a strong community-levelfeedback on microbial decomposition processes (and vice versa)in our model.
Notably, the ratio of extracellular enzymes to microbialbiomass in our model settles at a similar minimum value acrossall our scenarios that include cheaters—independent of the degree
of their cheating. As total microbial biomass stays about the samewith or without cheaters, collective enzyme production seems tobe downregulated to a point where the same total amount ofbiomass could still be sustained, but waste is minimized. Thisfinding is consistent with the ‘black queen hypothesis’31, whichsuggests that evolution favours losses of metabolic pathways forproducing public goods, until a community’s production of thepublic good is just sufficient to support it at equilibrium.Although the overall decomposition process takes considerablylonger with cheaters than without, resources are used moreefficiently, so that in total a greater number of microbes can thriveon it.
At the cellular level, there is thought to be a metabolic trade-offbetween the rate of resource acquisition and the net yield ofenergy: higher rates are often coupled to lower yields and viceversa32,33. High-rate/low-yield organisms are understood tohave an advantage over low-rate/high-yield organisms whencompeting for external resources32, leading to communities withoverall inefficient resource use—an evolutionary dilemma wellknown as the ‘tragedy of the commons’34. While the rate-yieldtrade-off can be explained by thermodynamic principles at thecellular level32, our model shows a similar trade-off at thecommunity level: high rates of enzyme production and microbialturnover are coupled with low efficiency of resource use (that is,low net yield of energy) in communities without cheaters,whereas low rates of enzyme production and microbial turnoverare coupled with high efficiency of resource use in communities
Dec
ay r
ate
(% lo
ss o
f ini
tial C
per
day
)D
ecay
rat
e(%
loss
of i
nitia
l C p
er d
ay)
Mean lifetime of enzymes (%)
With cheaters Slow-growing enzyme producers and slow-growing cheaters
Slow-growing enzyme producers and fast-growing cheaters
Without cheatersSlow-growing enzyme producers
Slow- and fast-growing enzyme producers
0.6
0.5
0.4
0.3
0.2
0.1
0.0
0.6
0.5
0.4
0.3
0.2
0.1
0.0
0 200 400 600 800 1,000 1,200
Catalytic efficiency of enzymes (%) Catalytic efficiency of enzymes (%)
0 200 400 600 800 1,000 1,200 1,00080 100 120 200 300 400 500
Mic
robi
al b
iom
ass
(mg
g–1 C
)25
20
15
10
5
0
Mic
robi
al b
iom
ass
(mg
g–1 C
)25
20
15
10
5
0
Mean lifetime of enzymes (%)
CheatersEnzyme producers
CheatersEnzyme producers
1,00080 100 120 200 300 400 500
Figure 5 | Microbial social dynamics buffer decay rates at varying levels of extracellular enzyme efficiency. (a,c) Decay rates derived from model
scenarios with varying mean lifetimes of extracellular enzymes or varying levels of catalytic efficiency (100% mean lifetime¼83 h for all enzymes;
100% catalytic efficiency¼0.33, 0.63 and 0.3 mol substrate C per mol enzyme C per hour for enzymes that degrade plant material, C-rich microbial
remains and N-rich microbial remains, respectively). Decay rates are measured in terms of % loss of initial C per day (averaged over time, until 60% C
loss). Open symbols: without cheaters. Filled symbols: with cheaters. Open squares: population of enzyme producers with uniform growth rates. Open
circles: mixed community of slow- and fast-growing enzyme producers. Filled squares: mixed community of enzyme producers (with an enzyme production
rate of 0.12) and cheaters (with an enzyme production rate of 0). Filled circles: cheaters additionally have a faster maximum growth rate and a higher N
demand compared with enzyme producers. For details see Table 1. (b,d) Microbial community compositions establishing in the presence of cheaters (which
are functionally equivalent to enzyme producers except for their enzyme production rates), time-averaged over model runs. Error bars indicate model
stochasticity by displaying s.d.’s among five independent model runs.
ARTICLE NATURE COMMUNICATIONS | DOI: 10.1038/ncomms9960
6 NATURE COMMUNICATIONS | 6:8960 | DOI: 10.1038/ncomms9960 | www.nature.com/naturecommunications
with cheaters. Lower rates are linked to higher efficiencies in ourmodel because the cycle of matter is less leaky at slower turnoverrates, with more C and N being stored in complex compounds,rather than in labile compounds (where they are prone to losses),at any one time (Supplementary Fig. 2). The interestingadditional insights our findings offer relative to earlier studies isthat cheaters pull the whole decomposer system to the efficientside of the trade-off, such that, unlike in previous analyses, theselfish interest of individuals (cheaters) in a public good does notlead to a tragedy of the commons, but to its opposite—a moreefficient resource use for all.
Explicit space is known to facilitate the existence of cooperatorsor producers in the face of cheaters13,26,35 and was also aprerequisite for the stable coexistence of producers and cheatersin our model: increasing diffusion rates, as well as a well-mixedsystem, lead to a dominance of cheaters, which crash thecommunity (not shown) similar to previous results13,35. In ourmodel, cheaters predominately grow at the edge of decomposerpatches, which are hotspots of competition for resources andspace (Fig. 2, Supplementary Movie 1). Similar spatial dynamicsbetween cheaters and producers of public goods have beenobserved not only in model-based studies, but also in empiricalstudies13,30,36. In general, our model’s behaviour is consistentwith recent empirical work demonstrating that enzyme-producing yeast cells not only exhibit stable coexistence withinvading cheaters, but also that a relatively small fraction ofenzyme producers (10%) supports a majority of cheaters at theeco-evolutionary steady state37,38.
A central finding of our study is that the ratio of extracellularenzymes to microbial biomass may be a key control of theamount of microbial necromass accumulating during thedecomposition of plant litter. During the last decades, bothconceptual and empirical research has sought to identify possiblemicrobial mechanisms influencing C and N sequestration in soils.Microbial substrate use efficiency or CUE, with the lattermeasuring the fraction of C uptake invested into microbialbiomass build-up, has been recognized as a potential driver of thecapacity of soil to sequester C in the long run5,39–42. Recently,microbial turnover rates have additionally been implicated in soilC sequestration42. Here, we propose to extend these concepts bythe ratio of extracellular enzymes to microbial biomass. Thisratio, which appears to be dynamically regulated when microbialcheaters are present, controls, as we have shown here, thedegradation rate, and thus the possible accumulation, ofmicrobial remains. The fate of microbial remains, in turn, iskey for C and N cycling in soil43–45, because microbial residuesare thought to be the main precursor of stable soil organic matterformation2,39,43,44. Social microbial dynamics between enzymeproducers and cheaters may thus be important for the long-termaccumulation and storage of soil organic matter. In particular, thetrapping of N in complex microbial remains prevents its loss tothe environment—by leaching of N from DOM or dissolvedinorganic nitrogen (DIN)—thereby increasing N retention in thesystem. Interestingly, in our model the downregulation of theratio of extracellular enzymes to microbial biomass by socialdynamics feeds back on CCUE and stabilizes it at a relativelyhigh level.
We evaluated the self-regulation capacity of the decomposersystem with cheaters by varying the catalytic efficiency (kcat) andlongevity (1/kenz) of extracellular enzymes. Previous individual-based microbial enzyme models have revealed that higher enzymeproduction rates of decomposers increase cheater abundance andin turn lower decay rates10,13,30. This is because increased enzymeproduction is associated with increased costs for producers, whichlower their competitive ability. Here we went one step further andspecifically tested the effect of increased degradation ‘power’
of individual enzymes, but at unchanged costs for enzymeproducers. This analysis is based on the rationale that enzymekinetics are sensitive to temperature change3,15 and that kineticchanges are therefore sometimes incorporated into microbialenzyme models (at the bulk level) to predict responses to climaticchanges5,14.
Our results show that increased enzyme efficiencies areeffectively outbalanced by a community response, leading to areduction of total enzyme production at the community level.This feedback is not necessarily driven by lower competitivecapabilities of producers due to increased enzyme costs. Rather,cheaters always benefit from increased enzyme activities, becauseit makes more resources available to them. From an evolutionaryperspective, this raises the question whether the co-evolution withcheating microbes could have prevented evolution towards moreefficient soil enzymes, as more efficient enzymes would notincrease the fitness of their producers.
The self-regulating social dynamics in our model cause overalldecay rates to become completely independent of catalyticenzyme strengths (Fig. 5). This indicates that neither the catalyticpower of individual enzymes nor their mean lifetime may be asimportant for decay rates as often thought. For instance, apossible positive Arrhenius effect of temperature on enzymaticreaction rates in soils under global warming (that is, increasingcatalytic efficiencies of enzymes with warming) could beoutweighed by social dynamics within decomposer communities,and thus turn out to be less significant than previously thought3.This finding is consistent with the well-known observation thatthe apparent temperature sensitivity of decomposition is lowerthan the intrinsic temperature sensitivity expected from enzymekinetics and substrate chemistry3,15. The measured thermaladjustments of the microorganisms may thus not only reflectshifts in community composition towards taxa adapted towarmer temperatures, as has been proposed recently15, but mayalso include the feedback of cheaters counteracting temperature-induced increases in enzyme efficiencies.
We conclude that to understand and predict organic matterdecay it is necessary to go beyond microbial physiology andto implement community-level regulation in biogeochemicalmodels5,11,14,46. Without accounting for such regulation, bothextracellular enzyme kinetics and microbial CUE exert a strongcontrol on decay rates in most biogeochemical models,making model predictions highly sensitive to variations inthese parameters5,6,11,14. Our work shows, by contrast, thatextracellular enzyme kinetics and microbial CUE may both besubject to regulation at the community level, which can overrulephysiological responses from individual microbes or changes inbiochemical efficiencies of individual enzymes. Not accountingfor community-level regulations may thus lead to a vast over- orunderestimation of future C stocks.
Individual-based micro-scale models, as the one we have usedin this study, enable valuable insights into possible interactionsbetween microbial community dynamics and processes. Noveltechniques facilitating single-cell analysis of microbes withincomplex communities are now becoming available; these allowquantifying microbial processes at the scales at which theyoccur47–49. Applying these methods to well-designed experimentstargeting natural and manipulated decomposer communities willallow to test the hypotheses generated by this study and toadvance our understanding of the controls of microbialdecomposition of organic matter.
MethodsIndividual-based and spatially explicit model. We use a recently developedindividual-based, spatially and stoichiometrically explicit micro-scale model,calibrated with experimental data from a litter decomposition experiment28. The
NATURE COMMUNICATIONS | DOI: 10.1038/ncomms9960 ARTICLE
NATURE COMMUNICATIONS | 6:8960 | DOI: 10.1038/ncomms9960 | www.nature.com/naturecommunications 7
model is implemented as a process-based and object-oriented computer programin Java, which simulates C and N turnover during litter decomposition based onmicro-scale interactions among individual microbes. Macro-scale C and Nturnover rates and pool dynamics emerge from interactions among individualmicrobes at the micro-scale, rather than being calculated by stock and flow rateequations at the bulk soil level. A detailed description of model equationsand algorithms can be found in the Supplementary Material (SupplementaryTables 1 and 2 and Supplementary Methods).
Briefly, the model simulates a 1 mm2 piece of decomposing organic matter asa grid of 100� 100 ‘microsites’, each measuring 10 mm� 10 mm� 10mm andcontaining different types of complex organic compounds, bioavailable labilecompounds, microbes and extracellular enzymes.
Complex compounds. Complex organic compounds are either original plantmaterial (primary substrate) or dead microbial cells and products (secondarysubstrate). While the former becomes depleted over a model run (as there isno new input of resources), the latter can accumulate over time. Two types ofsecondary substrate are considered in the model: C-rich microbial remains(containing cell walls, lipids, carbohydrates and others, with an overall C:N ratio of150) and N-rich microbial remains and products (containing proteins, DNA, andRNA from dead microbial biomass, as well as denatured extracellular enzymes,with an overall C:N ratio of 5). The C:N ratio of the primary substrate (plantmaterial) depends on the considered model scenario (initial litter C:N ratio).
Extracellular enzyme activity. In each microsite, complex compoundsare degraded by extracellular enzymes residing in the microsite, followingMichaelis–Menten kinetics5,50,
dc ¼ kcatCenzCS
km þCS; ð1Þ
where dc is the amount in the microsite of C released by the enzyme-catalysedbreakdown of complex compounds per time step, kcat (catalytic constant) is thenumber of enzymatic reactions catalysed per time step per enzyme (mol ofsubstrate-C decomposed per mol of enzyme-C), CS and Cenz are the amounts in themicrosite of complex substrate and extracellular enzymes, respectively, and km isthe half-saturation constant for the enzymes on the substrate. Amounts of C and Nliberated by extracellular enzyme activity are added to the bioavailable DOM poolof the microsite. Extracellular enzymes are assumed to become inactive after sometime, which is controlled by a first-order rate constant (kenz), whose inverse (1/kenz)therefore measures the mean lifetime of extracellular enzymes in the model.
C and N uptake and processing by microbes. Microbes take up labile productsof enzymatic breakdown (DOM), as well as DIN, subject to cell-size-specificmaximum uptake rates and local availability (Supplementary Methods). From theresources taken up, maintenance respiration. calculated as a constant fraction ofbiomass C, is met first. A functional-group-specific fraction (Efr) of the remainingC and N uptake is invested into extracellular enzyme production, and any C and Nremainder after that is invested into growth. Consequently, the smaller Efr, themore C and N resources can be used for growth.
Waste metabolism. Stoichiometric imbalance between C:N in microbial uptakeand microbial demand for respiration, enzyme production and growth results ineither local N mineralization (excess N is released into the DIN pool of themicrosite) or overflow respiration (excess C is respired)4.
Diffusion. In every time step, 8/9 of the DOM and DIN in every microsite diffusesto its eight neighbouring microsites (each of which thus receives 1/9). The timestep’s length (3 h) was chosen so that the emerging diffusion coefficients matchempirical diffusion coefficients54. A fraction of all diffusing elements is lost byleaching. For details on the diffusion algorithm, see Supplementary Methods of thisstudy and in ref. 54.
Microbial dispersal and turnover. Microbial cells that grow beyond a certain leveldivide and colonize neighbouring microsites. Microbes die either by starving(if their biomass falls below a minimum level) or by catastrophic death, regulatedby a stochastic mortality rate. On cell death, the biomass C and N of the microbe isdistributed among different substrate pools (C- and N-rich microbial remains,respectively, and DOM) within the microsite according to their functional-group-dependent biomass composition (Table 1).
Initial values and model inputs. Complex substrates are initially homogenouslydistributed across the grid. Initial litter consists of 98.5% of plant material and 1.5%of microbial remains (Supplementary Table 1). There is no new input of organicmaterial during a model run. The model stops when the amount of availablesubstrate has become too low or too fragmented to support microbial activity,which usually occurs around 80% C loss (Supplementary Movie 1).
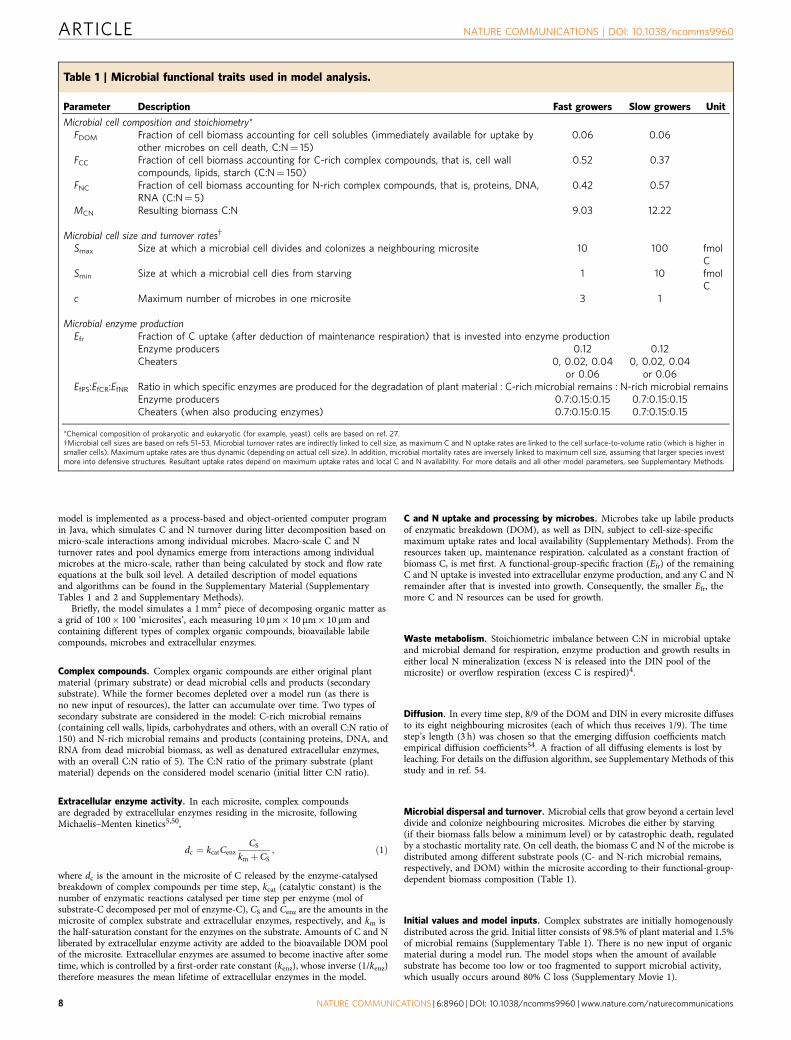
Table 1 | Microbial functional traits used in model analysis.
Parameter Description Fast growers Slow growers Unit
Microbial cell composition and stoichiometry*FDOM Fraction of cell biomass accounting for cell solubles (immediately available for uptake by
other microbes on cell death, C:N¼ 15)0.06 0.06
FCC Fraction of cell biomass accounting for C-rich complex compounds, that is, cell wallcompounds, lipids, starch (C:N¼ 150)
0.52 0.37
FNC Fraction of cell biomass accounting for N-rich complex compounds, that is, proteins, DNA,RNA (C:N¼ 5)
0.42 0.57
MCN Resulting biomass C:N 9.03 12.22
Microbial cell size and turnover ratesw
Smax Size at which a microbial cell divides and colonizes a neighbouring microsite 10 100 fmolC
Smin Size at which a microbial cell dies from starving 1 10 fmolC
c Maximum number of microbes in one microsite 3 1
Microbial enzyme productionEfr Fraction of C uptake (after deduction of maintenance respiration) that is invested into enzyme production
Enzyme producers 0.12 0.12Cheaters 0, 0.02, 0.04
or 0.060, 0.02, 0.04
or 0.06EfPS:EfCR:EfNR Ratio in which specific enzymes are produced for the degradation of plant material : C-rich microbial remains : N-rich microbial remains
Enzyme producers 0.7:0.15:0.15 0.7:0.15:0.15Cheaters (when also producing enzymes) 0.7:0.15:0.15 0.7:0.15:0.15
*Chemical composition of prokaryotic and eukaryotic (for example, yeast) cells are based on ref. 27.wMicrobial cell sizes are based on refs 51–53. Microbial turnover rates are indirectly linked to cell size, as maximum C and N uptake rates are linked to the cell surface-to-volume ratio (which is higher insmaller cells). Maximum uptake rates are thus dynamic (depending on actual cell size). In addition, microbial mortality rates are inversely linked to maximum cell size, assuming that larger species investmore into defensive structures. Resultant uptake rates depend on maximum uptake rates and local C and N availability. For more details and all other model parameters, see Supplementary Methods.
ARTICLE NATURE COMMUNICATIONS | DOI: 10.1038/ncomms9960
8 NATURE COMMUNICATIONS | 6:8960 | DOI: 10.1038/ncomms9960 | www.nature.com/naturecommunications
Community carbon use efficiency. In every time step, CCUE is calculated frombulk C fluxes aggregated across the grid29,
CCUE ¼ UDOC �R�Penzð Þ=UDOC; ð2Þ
where UDOC is the total amount of dissolved organic carbon taken up by allmicrobes on the grid, R is the total amount of C respired, and Penz is the totalamount of C released as extracellular enzymes. CCUE thus aggregates the CUEs ofall individual microbes on the grid based on the sum of their C fluxes. In turn, theCUE of individual microbes are the result of the various microbial processesoccurring in a model time step (Supplementary Methods), and therefore dependson the microbe’s local situation and a few basic parameters. Specifically, the CUE ofan individual microbe is a function of maintenance respiration (Rmaint, as a fractionof biomass), respiration-associated growth and enzyme production (Rge, as afraction of C used for growth and enzyme production), and most importantly,local availability of C and N. In particular, a high C:N ratio of DOM (implying Nlimitation) leads to C overflow respiration, as excess C needs to be taken up andrespired to gain N for growth, so CUE decreases. C limitation also decreases CUE:if not enough C is available for maximum growth, a relatively greater fraction of Cis needed for maintenance respiration, which microbes need to secure beforeinvesting into new biomass growth.
Model scenarios. We compare scenarios in which all microbes produceextracellular enzymes at the same rate (without cheaters, so no social dynamicsare possible) with scenarios featuring mixed communities of initially 50%enzyme-producing microbes and 50% cheaters (thus allowing social dynamics).All communities are initially randomly distributed across the grid with a total of16.7% of microsites being occupied. We define cheaters as microbes investing lessinto extracellular enzyme production than their competitors. We consider differentlevels of cheating, with cheaters producing enzymes at 1/2, 1/3 or 1/6 of the rate ofmain enzyme producers, or not producing any enzymes at all (full cheaters). Modeloutputs, such as decay rates and various pool sizes, are aggregated over the wholegrid, describing the macro-scale behaviour of the system28.
Besides differences in enzyme production rates, two functional types ofmicrobes are used in the model: fast growers and slow growers. Fast growers areassumed to have smaller cell sizes (resulting in higher turnover rates) and a lowerC:N ratio (resulting in a higher N demand). Conversely, slow growers have largercell sizes and a higher C:N ratio (Table 1). Most of our model scenarios are runwith enzyme producers and cheaters being both slow growers, that is, they do notdiffer from each other in any trait other than their rate of enzyme production(Fig. 1 and Supplementary Fig. 1, except dark-red triangles, Figs 3 and 5, squares,Supplementary Fig. 3). To account for the fact that cheaters are likely to have fastergrowth rates than enzyme producers, we additionally include model scenarios withslow-growing enzyme producers and fast-growing cheaters (dark-red trianglesin Fig.1 and Supplementary Fig. 1, filled circles in Fig. 5) or with slow- andfast-growing enzyme producers (open circles in Fig. 5).
References1. Schimel, J. P. & Schaeffer, S. M. Microbial control over carbon cycling in soil.
Front. Microbiol. 3, 348 (2012).2. Schmidt, M. W. I. et al. Persistence of soil organic matter as an ecosystem
property. Nature 478, 49–56 (2011).3. Davidson, E. A. & Janssens, I. A. Temperature sensitivity of soil carbon
decomposition and feedbacks to climate change. Nature 440, 165–173 (2006).4. Schimel, J. P. & Weintraub, M. N. The implications of exoenzyme activity on
microbial carbon and nitrogen limitation in soil: a theoretical model. Soil Biol.Biochem. 35, 549–563 (2003).
5. Allison, S. D., Wallenstein, M. D. & Bradford, M. A. Soil-carbon response towarming dependent on microbial physiology. Nat. Geosci. 3, 336–340 (2010).
6. Lawrence, C. R., Neff, J. C. & Schimel, J. P. Does adding microbial mechanismsof decomposition improve soil organic matter models? A comparison of fourmodels using data from a pulsed rewetting experiment. Soil Biol. Biochem. 41,1923–1934 (2009).
7. Wang, G. & Post, W. M. A theoretical reassessment of microbial maintenanceand implications for microbial ecology modeling. FEMS Microbiol. Ecol. 81,610–617 (2012).
8. Ingwersen, J., Poll, C., Streck, T. & Kandeler, E. Micro-scale modelling ofcarbon turnover driven by microbial succession at a biogeochemical interface.Soil Biol. Biochem. 40, 864–878 (2008).
9. Moorhead, D. L. & Sinsabaugh, R. L. A theoretical model of litter decay andmicrobial interaction. Ecol. Monogr. 76, 151–174 (2006).
10. Allison, S. D. A trait-based approach for modelling microbial litterdecomposition. Ecol. Lett. 15, 1058–1070 (2012).
11. Frey, S. D., Lee, J., Melillo, J. M. & Six, J. The temperature response of soilmicrobial efficiency and its feedback to climate. Nat. Clim. Chang. 3, 395–398(2013).
12. Wang, G., Post, W. M. & Mayes, M. A. Development of microbial-enzyme-mediated decomposition model parameters through steady-state and dynamicanalyses. Ecol. Appl. 23, 255–272 (2013).
13. Allison, S. D. Cheaters, diffusion and nutrients constrain decomposition bymicrobial enzymes in spatially structured environments. Ecol. Lett. 8, 626–635(2005).
14. Wieder, W. R., Bonan, G. B. & Allison, S. D. Global soil carbon projections areimproved by modelling microbial processes. Nat. Clim. Chang. 3, 909–912(2013).
15. Bradford, M. A. Thermal adaptation of decomposer communities in warmingsoils. Front. Microbiol. 4, 333 (2013).
16. Ferrer, J., Prats, C. & Lopez, D. Individual-based modelling: an essential tool formicrobiology. J. Biol. Phys. 34, 19–37 (2008).
17. Bellomo, N., Bianca, C. & Delitala, M. Complexity analysis and mathematicaltools towards the modelling of living systems. Phys. Life Rev. 6, 144–175 (2009).
18. Sole, R. V. & Bascompte, J. Self-Organization in Complex Ecosystems (PrincetonUniversity Press, 2006).
19. West, S. A., Diggle, S. P., Buckling, A., Gardner, A. & Griffin, A. S. The sociallives of microbes. Annu. Rev. Ecol. Evol. Syst. 38, 53–77 (2007).
20. Czaran, T. & Hoekstra, R. F. Microbial communication, cooperation andcheating: quorum sensing drives the evolution of cooperation in bacteria. PLoSOne 4, e6655 (2009).
21. Cornforth, D. M., Sumpter, D. J. T., Brown, S. P. & Brannstrom, Å. Synergy andgroup size in microbial cooperation. Am. Nat. 180, 296–305 (2012).
22. Johnson, D. R., Goldschmidt, F., Lilja, E. E. & Ackermann, M. Metabolicspecialization and the assembly of microbial communities. ISME J. 6,1985–1991 (2012).
23. Velicer, G. J., Kroos, L. & Lenski, R. E. Developmental cheating in the socialbacterium Myxococcus xanthus. Nature 404, 598–601 (2000).
24. Rainey, P. B. & Rainey, K. Evolution of cooperation and conflict inexperimental bacterial populations. Nature 425, 72–74 (2003).
25. Sandoz, K. M., Mitzimberg, S. M. & Schuster, M. Social cheating inPseudomonas aeruginosa quorum sensing. Proc. Natl Acad. Sci. USA 104,15876–15881 (2007).
26. Allison, S. D., Lu, L., Kent, A. G. & Martiny, A. C. Extracellular enzymeproduction and cheating in Pseudomonas fluorescens depend on diffusion rates.Front. Microbiol. 5, 169 (2014).
27. Kirchman, D. L. Processes in Microbial Ecology (Oxford University Press, 2012).28. Kaiser, C., Franklin, O., Dieckmann, U. & Richter, A. Microbial community
dynamics alleviate stoichiometric constraints during litter decay. Ecol. Lett. 17,680–690 (2014).
29. Manzoni, S., Taylor, P., Richter, A., Porporato, A. & Agren, G. I. Environmentaland stoichiometric controls on microbial carbon-use efficiency in soils. NewPhytol. 196, 79–91 (2012).
30. Folse, H. J. & Allison, S. D. Cooperation, competition, and coalitions inenzyme-producing microbes: social evolution and nutrient depolymerizationrates. Front. Microbiol. 3, 338 (2012).
31. Morris, J. J., Lenski, R. E., Zinser, E. R. & Loss, A. G. The Black QueenHypothesis: evolution of dependencies through adaptive gene loss. MBio. 3, 1–7(2012).
32. Pfeiffer, T., Schuster, S. & Bonhoeffer, S. Cooperation and competition in theevolution of ATP-producing pathways. Science 292, 504–507 (2001).
33. Frank, S. A. The trade-off between rate and yield in the design of microbialmetabolism. J. Evol. Biol. 23, 609–613 (2010).
34. Hardin, G. The tragedy of the commons. Science 162, 1243–1248 (1968).35. Wakano, J. Y., Nowak, M. A. & Hauert, C. Spatial dynamics of ecological public
goods. Proc. Natl Acad. Sci. USA 106, 7910–7914 (2009).36. Momeni, B., Brileya, K. A., Fields, M. W. & Shou, W. Strong inter-population
cooperation leads to partner intermixing in microbial communities. Elife 2,e00230 (2013).
37. Sanchez, A. & Gore, J. Feedback between population and evolutionarydynamics determines the fate of social microbial populations. PLoS Biol. 11,e1001547 (2013).
38. Gore, J., Youk, H. & van Oudenaarden, A. Snowdrift game dynamics andfacultative cheating in yeast. Nature 459, 253–256 (2009).
39. Cotrufo, M. F., Wallenstein, M. D., Boot, C. M., Denef, K. & Paul, E. TheMicrobial Efficiency-Matrix Stabilization (MEMS) framework integrates plantlitter decomposition with soil organic matter stabilization: Do labile plantinputs form stable soil organic matter? Glob. Chang. Biol. 19, 988–995 (2013).
40. Wieder, W. R., Grandy, A. S., Kallenbach, C. M. & Bonan, G. B. Integratingmicrobial physiology and physio-chemical principles in soils with theMIcrobial-MIneral Carbon Stabilization (MIMICS) model. Biogeosciences 11,3899–3917 (2014).
41. Wickings, K., Grandy, A. S., Reed, S. C. & Cleveland, C. C. The origin of litterchemical complexity during decomposition. Ecol. Lett. 15, 1180–1188 (2012).
42. Hagerty, S. B. et al. Accelerated microbial turnover but constant growthefficiency with warming in soil. Nat. Clim. Chang. 4, 3–6 (2014).
43. Gleixner, G. Soil organic matter dynamics: a biological perspective derived fromthe use of compound-specific isotopes studies. Ecol. Res. 28, 683–695 (2013).
44. Miltner, A., Bombach, P., Schmidt-Brucken, B. & Kastner, M. SOM genesis:microbial biomass as a significant source. Biogeochemistry 111, 41–55 (2012).
NATURE COMMUNICATIONS | DOI: 10.1038/ncomms9960 ARTICLE
NATURE COMMUNICATIONS | 6:8960 | DOI: 10.1038/ncomms9960 | www.nature.com/naturecommunications 9
45. Miltner, A., Kindler, R., Knicker, H., Richnow, H. H. & Kastner, M. Fate ofmicrobial biomass-derived amino acids in soil and their contribution to soilorganic matter. Org. Geochem. 40, 978–985 (2009).
46. Xu, X. et al. Substrate and environmental controls on microbial assimilationof soil organic carbon: a framework for Earth system models. Ecol. Lett. 17,547–555 (2014).
47. Berry, D. et al. Tracking heavy water (D2O) incorporation for identifyingand sorting active microbial cells. Proc. Natl Acad. Sci. USA 112, E194–E203(2015).
48. Eichorst, S. A. et al. Advancements in the application of NanoSIMS and Ramanmicrospectroscopy to investigate the activity of microbial cells in soils. FEMSMicrobiol. Ecol. 91, fiv106 (2015).
49. Vos, M., Wolf, A. B., Jennings, S. J. & Kowalchuk, G. A. Micro-scaledeterminants of bacterial diversity in soil. FEMS Microbiol. Rev. 37, 936–954(2013).
50. Wang, G., Post, W. M., Mayes, M. A., Frerichs, J. T. & Sindhu, J. Parameterestimation for models of ligninolytic and cellulolytic enzyme kinetics. Soil Biol.Biochem. 48, 28–38 (2012).
51. Bryan, A. K., Goranov, A., Amon, A. & Manalis, S. R. Measurement of mass,density, and volume during the cell cycle of yeast. Proc. Natl Acad. Sci. USA107, 999–1004 (2010).
52. Rutz, B. A. & Kieft, T. L. Phylogenetic characterization of dwarf archaea andbacteria from a semiarid soil. Soil Biol. Biochem. 36, 825–833 (2004).
53. Romanova, N. D. & Sazhin, A. F. Relationships between the cell volume and thecarbon content of bacteria. Oceanology 50, 522–530 (2010).
54. Evans, S. E., Dieckmann, U., Franklin, O. & Kaiser, C. Synergistic effects ofdiffusion and microbial physiology reproduce the Birch effect in a micro-scalemodel. Soil Biol. Biochem. in press (2015).
AcknowledgementsWe thank Sarah E. Evans for thoughtful comments on an earlier version of thismanuscript. Two anonymous reviewers provided valuable comments that helped toimprove the manuscript. C.K. was funded by a Postdoctoral Research Fellowship of theInternational Institute of Applied System Analysis (IIASA). The open-access publicationof this study was enabled by financial support (TECT I-106 G11) from the Austrian
Science Fund (to U.D.), through a grant for the research project The Adaptive Evolutionof Mutualistic Interactions as part of the multinational collaborative research projectMutualisms, Contracts, Space, and Dispersal (BIOCONTRACT) selected by theEuropean Science Foundation as part of the European Collaborative Research(EUROCORES) Programme The Evolution of Cooperation and Trading (TECT).U.D. gratefully acknowledges additional support by the European Commission, theEuropean Science Foundation, the Austrian Ministry of Science and Research, and theVienna Science and Technology Fund. O.F. acknowledges financial support from theEuropean Research Council Synergy grant ERC-2013-SyG-610028 IMBALANCE-P, TheSwedish University of Agricultural Sciences (TC4F), and The Swedish Research Councilfor Environment, Agricultural Sciences and Spatial Planning.
Author contributionsC.K. designed the study, developed the model and wrote the manuscript. O.F., A.R. andU.D. provided technical and intellectual input during the study and contributed to thewriting.
Additional informationSupplementary Information accompanies this paper at http://www.nature.com/naturecommunications
Competing financial interests: The authors declare no competing financial interests.
Reprints and permission information is available online at http://npg.nature.com/reprintsandpermissions/
How to cite this article: Kaiser, C. et al. Social dynamics within decomposercommunities lead to nitrogen retention and organic matter build-up in soils.Nat. Commun. 6:8960 doi: 10.1038/ncomms9960 (2015).
This work is licensed under a Creative Commons Attribution 4.0International License. The images or other third party material in this
article are included in the article’s Creative Commons license, unless indicated otherwisein the credit line; if the material is not included under the Creative Commons license,users will need to obtain permission from the license holder to reproduce the material.To view a copy of this license, visit http://creativecommons.org/licenses/by/4.0/
ARTICLE NATURE COMMUNICATIONS | DOI: 10.1038/ncomms9960
10 NATURE COMMUNICATIONS | 6:8960 | DOI: 10.1038/ncomms9960 | www.nature.com/naturecommunications