social dialogue and industrial relations issues in the oil …ed_dialogue/@sector... ·...
TRANSCRIPT

TMOGE/2009
INTERNATIONAL LABOUR ORGANIZATION
Sectoral Activities Programme
Social dialogue and industrial relations issues in the oil industry
Report for discussion at the Tripartite Meeting on Promoting Social Dialogue and Good Industrial Relations from Oil and Gas Exploration and Production to Oil and Gas Distribution
Geneva, 2009
INTERNATIONAL LABOUR OFFICE GENEVA
Copyright © International Labour Organization 2009 Publications of the International Labour Office enjoy copyright under Protocol 2 of the Universal CopyrightConvention. Nevertheless, short excerpts from them may be reproduced without authorization, on condition that the source is indicated. For rights of reproduction or translation, application should be made to ILO Publications(Rights and Permissions), International Labour Office, CH-1211 Geneva 22, Switzerland. The International Labour Office welcomes such applications. Libraries, institutions and other users registered in the United Kingdom with the Copyright Licensing Agency, 90Tottenham Court Road, London W1T 4LP [Fax: (+44) (0)20 7631 5500; email: [email protected]], in the UnitedStates with the Copyright Clearance Center, 222 Rosewood Drive, Danvers, MA 01923 [Fax: (+1) (978) 7504470; email: [email protected]] or in other countries with associated Reproduction Rights Organizations, maymake photocopies in accordance with the licences issued to them for this purpose.
ISBN: 978-92-2-121177-8 (print) 978-92-2-121178-5 (web pdf)
First edition 2009
Cover photographs: Tullow Oil Limited
The designations employed in ILO publications, which are in conformity with United Nations practice, and thepresentation of material therein do not imply the expression of any opinion whatsoever on the part of theInternational Labour Office concerning the legal status of any country, area or territory or of its authorities, orconcerning the delimitation of its frontiers. The responsibility for opinions expressed in signed articles, studies and other contributions rests solely with theirauthors, and publication does not constitute an endorsement by the International Labour Office of the opinionsexpressed in them. Reference to names of firms and commercial products and processes does not imply their endorsement by theInternational Labour Office, and any failure to mention a particular firm, commercial product or process is not asign of disapproval. ILO publications can be obtained through major booksellers or ILO local offices in many countries, or direct fromILO Publications, International Labour Office, CH-1211 Geneva 22, Switzerland. Catalogues or lists of new publications are available free of charge from the above address, or by email: [email protected]. Visit our web site: www.ilo.org/publns.
Printed by the International Labour Office, Geneva, Switzerland
TMOGE-R-[2008-12-0110-1]-En.doc/v3 iii
Contents
Page
Acknowledgements ........................................................................................................................... vii
Abbreviations .................................................................................................................................... ix
Introduction ....................................................................................................................................... 1
1. The oil industry in context ...................................................................................................... 3
1.1. Characteristics of the oil industry ................................................................................. 3
1.2. Evolution of the oil industry ......................................................................................... 4
1.2.1. International oil companies ............................................................................. 4 1.2.2. National oil companies ..................................................................................... 4
1.3. Major oil companies today ........................................................................................... 6
2. Employment trends ................................................................................................................. 9
2.1. Employment in oil and gas extraction .......................................................................... 9
2.2. Refinery employment ................................................................................................... 12
2.3. Core and non-core employees ....................................................................................... 14
2.4. Contract labour ............................................................................................................. 15
2.5. Shortage of skilled workers .......................................................................................... 16
2.6. Women workers ............................................................................................................ 18
3. Conditions of work .................................................................................................................. 21
3.1. Remuneration ................................................................................................................ 21 3.1.1. Pay equality ...................................................................................................... 30 3.1.2. Fringe benefits .................................................................................................. 30
3.2. Working time ................................................................................................................ 31
3.3. Annual leave ................................................................................................................. 33
3.4. Occupational safety and health ..................................................................................... 33 3.4.1. Fatalities in the oil and gas industry ................................................................. 34 3.4.2. Safety culture .................................................................................................... 38 3.4.3. Initiatives on HIV/AIDS ................................................................................... 42
3.5. Family-friendly initiatives ............................................................................................ 42
3.6. Working conditions in offshore work ........................................................................... 43 3.6.1. Shift-work arrangements and health effects ..................................................... 45 3.6.2. Offshore safety and dialogue ............................................................................ 46

iv TMOGE-R-[2008-12-0110-1]-En.doc/v3
4. Industrial relations ................................................................................................................... 48
4.1. Freedom of association ................................................................................................. 48 4.1.1. Civil liberties .................................................................................................... 49 4.1.2. The right to organize ......................................................................................... 51 4.1.3. The right to strike ............................................................................................. 51 4.1.4. State interference .............................................................................................. 56 4.1.5. Dismissal .......................................................................................................... 57
4.2. Employee–employer relations ...................................................................................... 59 4.2.1. Unionization ..................................................................................................... 59 4.2.2. Collective bargaining ........................................................................................ 59 4.2.3. Dispute resolution ............................................................................................. 61 4.2.4. Employment relations and contract labour ....................................................... 66 4.2.5. International framework agreements ................................................................ 69 4.2.6. Employee–employer relations .......................................................................... 71 4.2.7. High performance work practices ..................................................................... 75 4.2.8. Dialogue in times of change ............................................................................. 75
5. Human resources development ............................................................................................... 79
5.1. Recruitment trends ........................................................................................................ 79
5.2. Human resources development policies ........................................................................ 79
5.3. Investment in research and development ...................................................................... 80
5.4. Government initiatives to alleviate skills shortages ...................................................... 81
5.5. National skills development systems ............................................................................ 82
6. Corporate social responsibility and corporate governance ...................................................... 83
6.1. Corporate social responsibility in the oil industry ........................................................ 83
6.2. ILO MNE Declaration .................................................................................................. 84
6.3. OECD Guidelines for Multinational Enterprises .......................................................... 86
6.4. Global Reporting Initiative ........................................................................................... 86
6.5. Local content ................................................................................................................. 86
6.6. Corporate governance ................................................................................................... 87 6.6.1. Costs of poor governance ................................................................................. 87 6.6.2. Voluntary principles on security and human rights ......................................... 88 6.6.3. Extractive Industries Transparency Initiative ................................................... 88 6.6.4. Initiatives for combating corruption ................................................................. 89 6.6.5. Protection for whistle-blowers .......................................................................... 90
6.7. The role of social dialogue in CSR ............................................................................... 91 6.7.1. Protecting indigenous people ............................................................................ 91 6.7.2. Procurement ...................................................................................................... 92 6.7.3. Sovereign wealth funds .................................................................................... 92

TMOGE-R-[2008-12-0110-1]-En.doc/v3 v
7. Summary and points for discussion ........................................................................................ 94
7.1. Summary ....................................................................................................................... 94 7.1.1. The oil industry in context ................................................................................ 94 7.1.2. Employment trends ........................................................................................... 94 7.1.3. Conditions of work ........................................................................................... 94 7.1.4. Industrial relations ............................................................................................ 96 7.1.5. Human resources development ......................................................................... 97 7.1.6. Corporate social responsibility and corporate governance ............................... 97
7.2. Suggested points for discussion .................................................................................... 98
Appendices
I. Employment in petroleum refining in selected countries, 1990–2005 .................................... 99
II. Real wages per refining employee in US dollars and national currency, selected countries, non-adjusted, 1990–2005 .......................................................................... 102
III. Excerpt of the Right to Organise and Collective Bargaining Convention, 1949 (No. 98) ...... 113
IV. Except of the Freedom of Association and Protection of the Right to Organise Convention, 1948 (No. 87) ..................................................................................................... 114
V. Overview of provisions in international framework agreements and global framework agreements ................................................................................................. 116


TMOGE-R-[2008-12-0110-1]-En.doc/v3 vii
Acknowledgements
This report was prepared by Yasuhiko Kamakura, Oil, Gas and Chemicals Industry Specialist in the Sectoral Activities Branch of the Social Dialogue, Labour Law, Labour Administration and Sectoral Activities Department (DIALOGUE/SECTOR) of the ILO. Valuable comments were provided by the International Organisation of Employers (IOE), the International Trade Union Confederation (ITUC) and the International Federation of Chemical, Energy, Mine and General Workers’ Unions (ICEM). Several ILO colleagues also provided useful comments on the draft.


TMOGE-R-[2008-12-0110-1]-En.doc/v3 ix
Abbreviations
AEEU Amalgamated Engineering and Electrical Union
BCPEU Bangchak Petroleum Public Co. Ltd Employees’ Union
BP British Petroleum
CFA ILO Committee on Freedom of Association
CNOOC China National Offshore Oil Corporation
CNPC China National Petroleum Corporation
CSR corporate social responsibility
CTV Venezuelan Workers’ Confederation
ECCF Employee Communications and Consultation Forum
EITI Extractive Industries Transparency Initiative
ENI Ente Nazionale Idrocarburi (Italy)
ETUC European Trade Union Confederation
EWC European Works Council
FAR fatal accident rate
GDP gross domestic product
GFA global framework agreement
HPWP high performance work practice
ICEM International Federation of Chemical, Energy, Mine and General Workers’ Unions
IFA international framework agreement
INDSTAT Industrial Statistics Database
IOC international oil company
IOGCC Interstate Oil and Gas Compact Commission
IPIECA International Petroleum Industry Environmental Conservation Association
ISIC International Standard Industrial Classification of all Economic Activity
ITUC International Trade Union Confederation
JCC joint consultative committee
KOC Kuwait Oil Company
MNE Declaration Tripartite Declaration of Principles concerning Multinational Enterprises and Social Policy
NIOC National Iranian Oil Company
NNPC Nigerian National Petroleum Corporation
NOC national oil company
NUPENG National Union of Petroleum and Natural Gas Workers (Nigeria)
OECD Organisation for Economic Co-operation and Development

x TMOGE-R-[2008-12-0110-1]-En.doc/v3
OFS Norwegian Trade Union Federation of Oil Workers
OGP International Association of Oil and Gas Producers
OPEC Organization of Petroleum Exporting Countries
PDVSA Petróleos de Venezuela SA
PEMEX Petróleos Mexicanos
PENGASSAN Petroleum and Natural Gas Senior Staff Association of Nigeria
Petrobras Petróleo Brasileiro SA
PetroChina PetroChina Company Limited
PETROECUADOR Empresa Estatal Petróleos del Ecuador
Petronas Petroliam Nasional Berhad (Malaysia)
PRI principles for responsible investment
Saudi Aramco Saudi Arabian Oil Company
SIRV shared industrial relations vision
SWF sovereign wealth fund
UNIDO United Nations Industrial Development Organization
TMOGE-R-[2008-12-0110-1]-En.doc/v3 1
Introduction
1. At its 298th Session (March 2007), the Governing Body of the International Labour Office endorsed a proposal to hold a tripartite meeting on promoting social dialogue and good industrial relations from oil and gas exploration and production to oil and gas distribution. 1 It also adopted new directions for the Sectoral Activities Programme, which include the creation of advisory bodies to review the content and type of sectoral activities in order to assist the Office in its work with the Governing Body. 2 In accordance with this decision, the Advisory Body on Energy and Mining was set up. Its responsibilities include advising the tripartite meeting. At its meeting on 2 October 2007, the Advisory Body provided the Office with its recommendations to be submitted to the 300th Session of the Governing Body (November 2007), which included the recommendation that the Office’s report for discussion at the tripartite meeting (this report) should focus on exploration, production and refining in the oil industry.
2. At its 300th Session, the Governing Body further decided, in accordance with the recommendations of the Advisory Body on Energy and Mining, that the tripartite meeting should focus on recent developments, employment, industrial relations and social dialogue issues in the oil production and oil transportation sectors; that participants should identify the key elements that underpin good industrial relations, including core labour standards, collective labour agreements and voluntary initiatives to strengthen social dialogue; and that they should also identify benefits to the industry from improvements in working conditions and measures to render the industry more attractive to qualified workers, including training and career development. It was also decided that the meeting would discuss the implications of contract work in the sector; that the Office would prepare a report, which could be used as a basis for discussion; and that the meeting should adopt conclusions that include practical guidance for strengthening social dialogue and promoting good industrial relations, including proposals for action by governments, by employers’ and workers’ organizations at the international, regional and national levels, and by the ILO. 3 It was also decided that, after consultations with the respective groups, 12 Employer and 12 Worker participants would be invited to take part in the meeting and that the governments of all member States would be invited to nominate participants to attend the meeting. In addition, it was decided that a representative of the Governing Body would be appointed to chair the meeting. 4
3. The meeting is part of the ILO’s Sectoral Activities Programme, the purpose of which is to facilitate the exchange of information among constituents on labour and social developments related to particular economic sectors, complemented by practically oriented research on topical sectoral issues. This objective has traditionally been pursued by holding international tripartite sectoral meetings for the exchange of opinions and experience, with
1 ILO: Report of the Committee on Sectoral and Technical Meetings and Related Issues, Governing Body, 298th Session, Geneva, Mar. 2007, GB.298/12(Rev.), para. 51.
2 ibid., para. 40.
3 ILO: Purpose, duration and composition of the activities to be held in 2008 and new proposals for activities in 2008–09, including proposals resulting from the groupings of the sectors’ advisory bodies, Governing Body, 300th Session, Nov. 2007, GB.300/STM/1, para. 8.
4 ibid., para. 9; and ILO: Report of the Committee on Sectoral and Technical Meetings and Related Issues, Governing Body, 300th Session, Geneva, Nov. 2007, GB.300/16, para. 30.

2 TMOGE-R-[2008-12-0110-1]-En.doc/v3
a view to: fostering a broader understanding of sector-specific issues and problems; promoting an international tripartite consensus on sectoral concerns and providing guidance for national and international policies and measures to deal with the related issues and problems; promoting the harmonization of all ILO activities of a sectoral character and acting as the focal point between the Office and its constituents; and providing technical advice, practical assistance and concrete support to ILO constituents in facilitating the application of international labour standards.

TMOGE-R-[2008-12-0110-1]-En.doc/v3 3
1. The oil industry in context
1.1. Characteristics of the oil industry
4. Since the oil industry is highly capital intensive and it takes a long time for investments to start to show positive returns, new projects are undertaken only if they can reasonably expect to withstand changing market conditions; the price of crude oil is a key determinant. Figure 1.1 shows benchmark crude oil prices from 1990 to 2008 and highlights the volatility in oil prices. Between 1990 and 2001, the average price of crude oil was about US$19 per barrel. In early 2002, however, West Texas Intermediate crude oil futures started to rise, reaching US$147 per barrel in mid-July 2008. On 29 September 2008, crude oil futures fell to US$96.37 per barrel, part of a widespread sell-off that coincided with massive losses on Wall Street. 1 In late October 2008, the price of crude oil fell to below US$70 2 despite the decision of the Organization of Petroleum Exporting Countries (OPEC) to reduce the group’s official production quota. 3 In late November 2008, the New York crude oil futures fell to below US$50 per barrel. 4 Crude oil prices are likely to continue to be weak until the global economy shows signs of recovery.
Figure 1.1. Crude oil prices, 1990–2008
0
20
40
60
80
100
120
140
05-J
an-9
0
05-J
ul-9
0
05-J
an-9
1
05-J
ul-9
1
05-J
an-9
2
05-J
ul-9
2
05-J
an-9
3
05-J
ul-9
3
05-J
an-9
4
05-J
ul-9
4
05-J
an-9
5
05-J
ul-9
5
05-J
an-9
6
05-J
ul-9
6
05-J
an-9
7
05-J
ul-9
7
05-J
an-9
8
05-J
ul-9
8
05-J
an-9
9
05-J
ul-9
9
05-J
an-0
0
05-J
ul-0
0
05-J
an-0
1
05-J
ul-0
1
05-J
an-0
2
05-J
ul-0
2
05-J
an-0
3
05-J
ul-0
3
05-J
an-0
4
05-J
ul-0
4
05-J
an-0
5
05-J
ul-0
5
05-J
an-0
6
05-J
ul-0
6
05-J
an-0
7
05-J
ul-0
7
05-J
an-0
8
05-J
ul-0
8
Weekly All Countries Spot Price FOB Weighted by Estimated Export Volume
Weekly OPEC Countries Spot Price FOB Weighted by Estimated Export Volume
Weekly Non-OPEC Countries Spot Price FOB Weighted by Estimated Export Volume
US$/barrel
Source: United States (US) Department of Energy.
1 “Following equities, NYMEX crude plunges”, in Oilgram News, Vol. 86, No. 193, 30 Sep. 2008, p. 10.
2 “Oil prices retreat on economic worries”, in Oil & Gas Journal, 31 Oct. 2008.
3 “Prices fall as market ignores OPEC”, in Oil & Gas Journal, 29 Oct. 2008.
4 Oilgram News, Vol. 86, No. 231, 21 Nov. 2008, p. 12.

4 TMOGE-R-[2008-12-0110-1]-En.doc/v3
1.2. Evolution of the oil industry
1.2.1. International oil companies
5. Until the end of the 1970s, the oil industry was dominated by a few vertically integrated international oil companies (IOCs), known as the “Seven Sisters”. 5 However, most major oil companies lost their crude-producing affiliates as a result of nationalization by the oil-producing States. In addition, the low price of crude oil in the early 1970s forced major oil companies to rearrange their operations in order to remain profitable. Nationalization of crude oil production, low prices and consequent tight profit margins led to several waves of rationalization. A series of mergers in the 1980s occurred as companies sought to acquire access to proven oil reserves and refineries, rather than seek new reserves or build new facilities. In the 1990s, the major companies developed cost-reduction programmes and made changes in organizational structure and systems to increase efficiency, flexibility and responsiveness to change. As a result, both capacity and employment fell. Between 1980 and 1992, employment figures for eight major oil companies fell from 800,000 to 300,000. For six major oil companies, there was an overall reduction in headquarters staff from approximately 3,000 in 1988 to 800 in 1992.
6. The collapse in oil prices between November 1997 and February 1999 sped up merger and acquisition activity, including between the erstwhile petroleum “majors” in the West and East. These consolidations have enabled major oil companies to improve their financial performance.
1.2.2. National oil companies
7. The size and importance of national oil companies (NOCs) are undisputed. Collectively, NOCs control about 80 per cent of total world oil reserves. This is a reversal of the situation in the early 1970s when IOCs controlled 85 per cent of the world’s reserves. 6 The new “Seven Sisters” are Saudi Aramco, Gazprom (of the Russian Federation), the China National Petroleum Corporation (CNPC), the National Iranian Oil Company (NIOC), Petróleos de Venezuela SA (PDVSA), Petróleo Brasileiro SA (Petrobras) and Petroliam Nasional Berhad (Petronas) of Malaysia. 7
8. In addition to being under government control or government ownership, NOCs differ from IOCs in other respects. In contrast to IOCs, with their focus on maximizing return on capital to shareholders, many NOCs are used by their governments as an instrument to achieve wider socio-economic policy objectives. These non-commercial objectives include: oil wealth redistribution to society at large; foreign and strategic policy and
5 Standard Oil of New Jersey (Esso); Royal Dutch/Shell; Anglo-Persian Oil Company (APOC); Standard Oil Company of New York (Socony); Standard Oil of California (Socal); Gulf Oil; and Texaco.
6 S. McNulty: “Chevron prepares to harness the power of mighty Gorgon”, in Financial Times (London), 18 Jan. 2008.
7 C. Hoyos: “The new Seven Sisters: Oil and gas giants dwarf western rivals”, in Financial Times (London), 12 Mar. 2007.

TMOGE-R-[2008-12-0110-1]-En.doc/v3 5
alliance building; energy security; wealth creation for the nation; participation in national-level policies; and industrialization and economic development. 8
9. Following the crude oil price collapse in 1986, most oil-producing countries turned to their NOCs as sources of immediate revenue, and the companies consequently were starved of investment capital. Thus, rather like IOCs, NOCs are under pressure to deliver more revenue to their governments while generating funds for investment. Some solutions for the NOCs were diversification into overseas investment (a similar approach to that of the IOCs) or nationalizing the country’s natural resources.
10. Some NOCs have rapidly expanded internationally to become leading emerging market multinational companies, branching out into new, higher value added and more sustainable segments of the energy industry. For example, in 2003, Petronas announced plans to invest US$100 million per year to develop its oil and gas distribution operations in Indonesia. Diversification overseas had become urgent because of diminishing domestic crude oil reserves in Malaysia. In 2002–03, 75 per cent of Petronas’ revenues came from overseas business in 34 countries, with less than half of this from exports.
11. Similarly, Gazprom bought Belarus’ Beltransgaz in 2007 and Serbia’s oil and gas monopoly in 2008. Indian oil companies are active in Indonesia, Myanmar and Sudan. In 2005, the China National Offshore Oil Corporation (CNOOC) tried to take over the Union Oil Company of California (Unocal), but abandoned its bid in the face of political opposition. However, CNPC and CNOOC are active in many countries, including Angola, Canada, Ethiopia, Islamic Republic of Iran, Kazakhstan, Myanmar, Nigeria, Somalia and Sudan.
12. The nationalization of oil interests has brought NOCs gains similar to those obtained from investing in the overseas oil industry. And recent years have seen further nationalizations, for example in Bolivia, Russian Federation, Ukraine and the Bolivarian Republic of Venezuela, which have introduced greater state control and less favourable terms for foreign investment in the oil industry. For example, in 2001, the Bolivarian Republic of Venezuela converted existing operating agreements between IOCs and the state-owned company PDVSA into joint ventures. A new hydrocarbons law means that oil production is carried out only by companies that are majority-owned by the State. National oil interests have also been protected by merger and acquisition activity. For example, in 2006, Norway’s two largest oil companies – Statoil and NorskHydro – merged, with the Norwegian Government keeping a majority stake. Figure 1.2 shows the merger and acquisition activity in the oil and gas industry worldwide between 1993 and 2007 in value terms. It is clear that, during that period, about 60 per cent of the deals were corporate; furthermore, between 2003 and 2007, the deal count peaked in July 2006, and that year, North America accounted for 63 per cent of the total upstream deal value.
13. The rise of resource nationalism that accompanied the upswing in crude oil prices starting in 2002 has, in effect, reduced investment opportunities for IOCs, notwithstanding opportunities such as the re-entry of IOCs into the Libyan upstream sector. The trend has been to limit the access of IOCs to foreign oil and gas resources. In addition, NOCs are better funded thanks to higher revenues from existing production, and the oil services sector now provides a wide range of technology and resources, bypassing the need for the expertise of IOCs. Only a few NOCs, however, have been successful in developing their own expertise, notably Petronas and Petrobras.
8 “The changing role of national oil companies in international energy markets”, in Policy Report No. 35 (James A. Baker III Institute for Public Policy, Rice University, Houston, 2007).

6 TMOGE-R-[2008-12-0110-1]-En.doc/v3
14. There is a concern that, whether through design or lack of capacity, investments by NOCs in conventional hydrocarbons will not keep pace with demand growth, while restricted access to resources will prevent IOCs from making up the shortfall. Production at such IOCs as ExxonMobil, British Petroleum (BP), Royal Dutch/Shell and Chevron is declining or stagnating. Thus, IOCs and NOCs compete for resources, reserves and ultimately for customers, but there is also a good deal of collaboration among them. Many fields are co-owned by several companies, with one company acting as lead operator. 9
Figure 1.2. Merger and acquisition activity in the oil and gas industry, 1993–2007
0
20
40
60
80
100
120
140
160
180
200
1993 1994 1995 1996 1997 1998 1999 2000 2001 2002 2003 2004 2005 2006 2007
US$ billion
Source: David Wood & Associates.
1.3. Major oil companies today
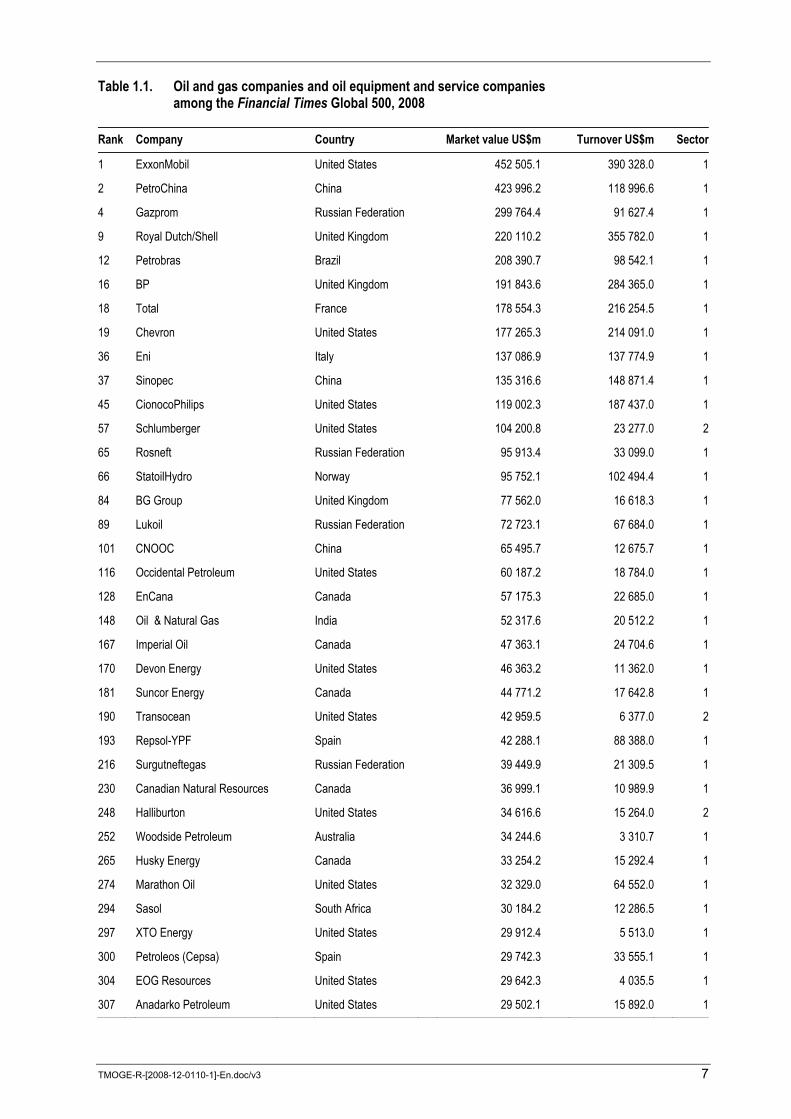
15. The Financial Times Global 500 list of companies in 2008 includes 48 oil and gas companies, of which five are oil services companies (table 1.1). Their total market value exceeded US$4.1 trillion and their total turnovers exceeded US$3.2 trillion. There are also many smaller or second tier energy companies, typically regional players with a more limited geographic spread of activities.
9 “Unconventional oil and gas no solution”, in Oxford Analytica, 12 Mar. 2007.
TMOGE-R-[2008-12-0110-1]-En.doc/v3 7
Table 1.1. Oil and gas companies and oil equipment and service companies among the Financial Times Global 500, 2008
Rank Company Country Market value US$m Turnover US$m Sector
1 ExxonMobil United States 452 505.1 390 328.0 1
2 PetroChina China 423 996.2 118 996.6 1
4 Gazprom Russian Federation 299 764.4 91 627.4 1
9 Royal Dutch/Shell United Kingdom 220 110.2 355 782.0 1
12 Petrobras Brazil 208 390.7 98 542.1 1
16 BP United Kingdom 191 843.6 284 365.0 1
18 Total France 178 554.3 216 254.5 1
19 Chevron United States 177 265.3 214 091.0 1
36 Eni Italy 137 086.9 137 774.9 1
37 Sinopec China 135 316.6 148 871.4 1
45 CionocoPhilips United States 119 002.3 187 437.0 1
57 Schlumberger United States 104 200.8 23 277.0 2
65 Rosneft Russian Federation 95 913.4 33 099.0 1
66 StatoilHydro Norway 95 752.1 102 494.4 1
84 BG Group United Kingdom 77 562.0 16 618.3 1
89 Lukoil Russian Federation 72 723.1 67 684.0 1
101 CNOOC China 65 495.7 12 675.7 1
116 Occidental Petroleum United States 60 187.2 18 784.0 1
128 EnCana Canada 57 175.3 22 685.0 1
148 Oil & Natural Gas India 52 317.6 20 512.2 1
167 Imperial Oil Canada 47 363.1 24 704.6 1
170 Devon Energy United States 46 363.2 11 362.0 1
181 Suncor Energy Canada 44 771.2 17 642.8 1
190 Transocean United States 42 959.5 6 377.0 2
193 Repsol-YPF Spain 42 288.1 88 388.0 1
216 Surgutneftegas Russian Federation 39 449.9 21 309.5 1
230 Canadian Natural Resources Canada 36 999.1 10 989.9 1
248 Halliburton United States 34 616.6 15 264.0 2
252 Woodside Petroleum Australia 34 244.6 3 310.7 1
265 Husky Energy Canada 33 254.2 15 292.4 1
274 Marathon Oil United States 32 329.0 64 552.0 1
294 Sasol South Africa 30 184.2 12 286.5 1
297 XTO Energy United States 29 912.4 5 513.0 1
300 Petroleos (Cepsa) Spain 29 742.3 33 555.1 1
304 EOG Resources United States 29 642.3 4 035.5 1
307 Anadarko Petroleum United States 29 502.1 15 892.0 1

8 TMOGE-R-[2008-12-0110-1]-En.doc/v3
Rank Company Country Market value US$m Turnover US$m Sector
320 PTT Thailand 28 284.8 47 123.8 1
321 Hess United States 28 270.5 31 647.0 1
346 Impex Holdings Japan 26 329.5 9 725.2 1
349 Velero Energy United States 26 256.8 95 327.0 1
368 Novateck Russian Federation 24 837.0 2 078.3 1
371 Weatherford International United States 24 583.6 7 832.1 2
377 Copec Chile 24 250.1 13964.1 1
390 Chesapeake Energy United States 23 721.6 7 800.0 1
436 Baker Hughes United States 21 193.8 10 428.2 2
441 Petro Canada Canada 21 076.4 21 394.4 1
449 TransCanada Canada 20 864.0 8 699.7 1
450 National Oilwell Varco United States 20 841.0 9 789.0 1
478 OMV Austria 19 898.6 29 983.3 1
Grand total 4 119 192.3 3 208 166.6
Notes: 1 = oil and gas producer; 2 = oil equipment and services.
Source: FT Weekend Magazine, 28/29 June 2008, pp. 35–41.

TMOGE-R-[2008-12-0110-1]-En.doc/v3 9
2. Employment trends
2.1. Employment in oil and gas extraction
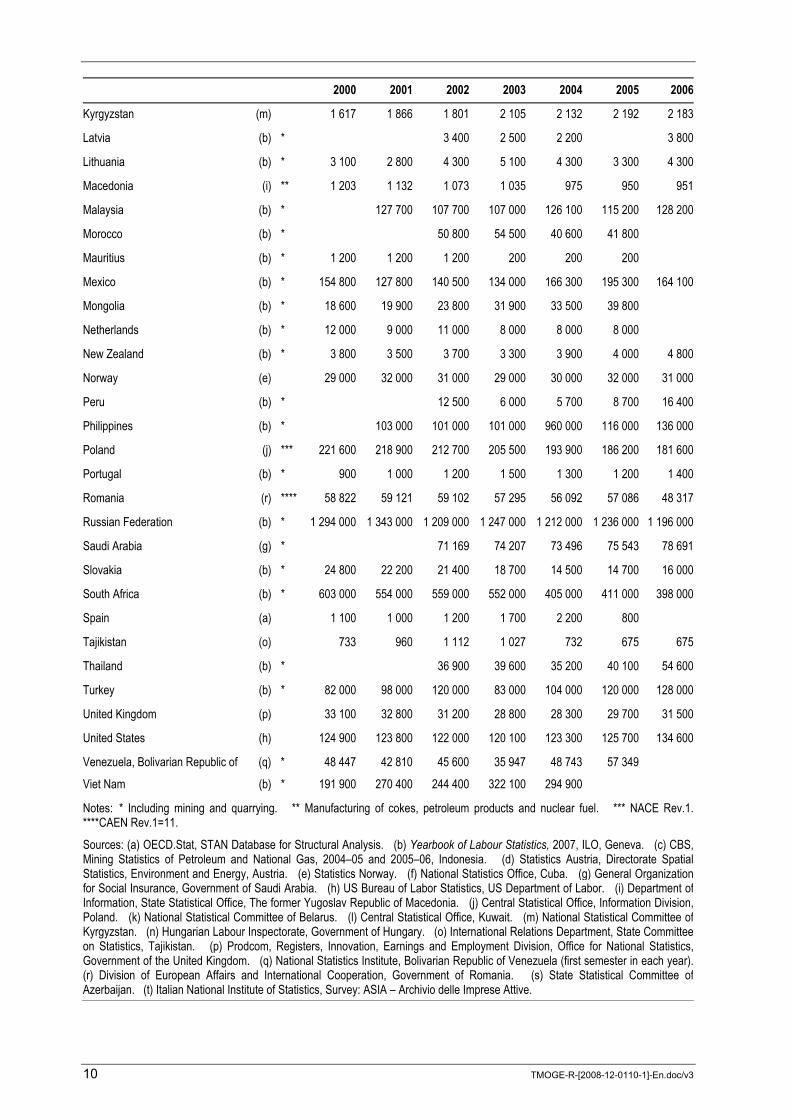
16. Global employment data for oil and gas exploration and production do not exist and even national employment data are difficult to obtain. An analysis of available national data, however, leads to an estimate of current global employment in the extraction of crude petroleum and natural gas of about 3 million people. Global employment increased from about 3 million in 2000 to a peak of over 4 million in 2004, then gradually declined between 2004 and 2006 (table 2.1).
Table 2.1. Employment in oil and gas extraction and related services, selected countries, 2000–06
2000 2001 2002 2003 2004 2005 2006
Albania (b) * 9 000 8 000 7 000 6 000 6 000 6 000 5 000
Algeria (b) * 119 500 82 900 135 100
Argentina (b) * 15 500 19 600 21 000 28 300 33 200 30 900 39 800
Australia (a) 19 972 17 115 20 267 25 810 27 918 37 090 40 646
Austria (d) 1 385 1 354 1 132 1 064 912 922 901
Azerbaijan (s) 31 425 33 679 32 782 36 376 36 816 37 639 37 426
Belarus (k) 1 840 1 892 1 931 1 940 1 606 615 1 085
Belgium (b) * 7 800 6 700 6 800 5 800 6 800 9 300 9 400
Brazil (b) * 254 500 313 000 325 400
Bulgaria (b) * 41 500 38 900 36 900 38 200
Canada (a) 93 517 106 882 103 260 113 006 118 892 128 853 147 120
Colombia (b) * 191 500 273 400 261 400 197 500 131 000 116 300
Croatia (b) * 7 200 9 100 9 000 10 400 8 900 9 100 7 300
Cuba (f) * 18 300 18 500 27 600 26 200 22 000
Czech Republic (a) 1 043 822 772 642 584 656 641
Denmark (b) * 26 000 26 000 45 000 57 000 43 000 56 000
Egypt (b) * 47 400 59 500 44 500 32 000 32 000 29 000
Estonia (b) * 72 000 58 000 57 000 57 000 8 000 59 000 52 000
Ethiopia (b) * 10 000 82 100 13 400
Georgia (b) * 800 600 600 700 400
Germany (a) 4 000 4 000 5 000 6 000 6 000 6 000
Greece (b) * 18 600 19 700 21 000 12 600 14 700 17 700 18 200
Hungary (n) 1 100 1 000 900 1 000 800 800 900
Indonesia (c) 29 974 34 822 35 449 32 393 39 156 38 232 39 527
Italy (t) 5 574 5 009 11 604 9 881 11 627 11 699 11 959
Kazakhstan (b) * 166 500 167 300 181 700 186 000
Kuwait (l) 6 529 6 558 6 554 6 580 6 718 7 572 7 710
10 TMOGE-R-[2008-12-0110-1]-En.doc/v3
2000 2001 2002 2003 2004 2005 2006
Kyrgyzstan (m) 1 617 1 866 1 801 2 105 2 132 2 192 2 183
Latvia (b) * 3 400 2 500 2 200 3 800
Lithuania (b) * 3 100 2 800 4 300 5 100 4 300 3 300 4 300
Macedonia (i) ** 1 203 1 132 1 073 1 035 975 950 951
Malaysia (b) * 127 700 107 700 107 000 126 100 115 200 128 200
Morocco (b) * 50 800 54 500 40 600 41 800
Mauritius (b) * 1 200 1 200 1 200 200 200 200
Mexico (b) * 154 800 127 800 140 500 134 000 166 300 195 300 164 100
Mongolia (b) * 18 600 19 900 23 800 31 900 33 500 39 800
Netherlands (b) * 12 000 9 000 11 000 8 000 8 000 8 000
New Zealand (b) * 3 800 3 500 3 700 3 300 3 900 4 000 4 800
Norway (e) 29 000 32 000 31 000 29 000 30 000 32 000 31 000
Peru (b) * 12 500 6 000 5 700 8 700 16 400
Philippines (b) * 103 000 101 000 101 000 960 000 116 000 136 000
Poland (j) *** 221 600 218 900 212 700 205 500 193 900 186 200 181 600
Portugal (b) * 900 1 000 1 200 1 500 1 300 1 200 1 400
Romania (r) **** 58 822 59 121 59 102 57 295 56 092 57 086 48 317
Russian Federation (b) * 1 294 000 1 343 000 1 209 000 1 247 000 1 212 000 1 236 000 1 196 000
Saudi Arabia (g) * 71 169 74 207 73 496 75 543 78 691
Slovakia (b) * 24 800 22 200 21 400 18 700 14 500 14 700 16 000
South Africa (b) * 603 000 554 000 559 000 552 000 405 000 411 000 398 000
Spain (a) 1 100 1 000 1 200 1 700 2 200 800
Tajikistan (o) 733 960 1 112 1 027 732 675 675
Thailand (b) * 36 900 39 600 35 200 40 100 54 600
Turkey (b) * 82 000 98 000 120 000 83 000 104 000 120 000 128 000
United Kingdom (p) 33 100 32 800 31 200 28 800 28 300 29 700 31 500
United States (h) 124 900 123 800 122 000 120 100 123 300 125 700 134 600
Venezuela, Bolivarian Republic of (q) * 48 447 42 810 45 600 35 947 48 743 57 349
Viet Nam (b) * 191 900 270 400 244 400 322 100 294 900
Notes: * Including mining and quarrying. ** Manufacturing of cokes, petroleum products and nuclear fuel. *** NACE Rev.1. ****CAEN Rev.1=11.
Sources: (a) OECD.Stat, STAN Database for Structural Analysis. (b) Yearbook of Labour Statistics, 2007, ILO, Geneva. (c) CBS, Mining Statistics of Petroleum and National Gas, 2004–05 and 2005–06, Indonesia. (d) Statistics Austria, Directorate Spatial Statistics, Environment and Energy, Austria. (e) Statistics Norway. (f) National Statistics Office, Cuba. (g) General Organization for Social Insurance, Government of Saudi Arabia. (h) US Bureau of Labor Statistics, US Department of Labor. (i) Department of Information, State Statistical Office, The former Yugoslav Republic of Macedonia. (j) Central Statistical Office, Information Division, Poland. (k) National Statistical Committee of Belarus. (l) Central Statistical Office, Kuwait. (m) National Statistical Committee of Kyrgyzstan. (n) Hungarian Labour Inspectorate, Government of Hungary. (o) International Relations Department, State Committee on Statistics, Tajikistan. (p) Prodcom, Registers, Innovation, Earnings and Employment Division, Office for National Statistics, Government of the United Kingdom. (q) National Statistics Institute, Bolivarian Republic of Venezuela (first semester in each year).(r) Division of European Affairs and International Cooperation, Government of Romania. (s) State Statistical Committee of Azerbaijan. (t) Italian National Institute of Statistics, Survey: ASIA – Archivio delle Imprese Attive.
TMOGE-R-[2008-12-0110-1]-En.doc/v3 11
17. Broadly, employment trends are related to the type of corporate entity – whether NOCs or publicly traded oil companies, including IOCs – and the features of the labour market. The following two cases illustrate the employment trends in NOCs and IOCs.
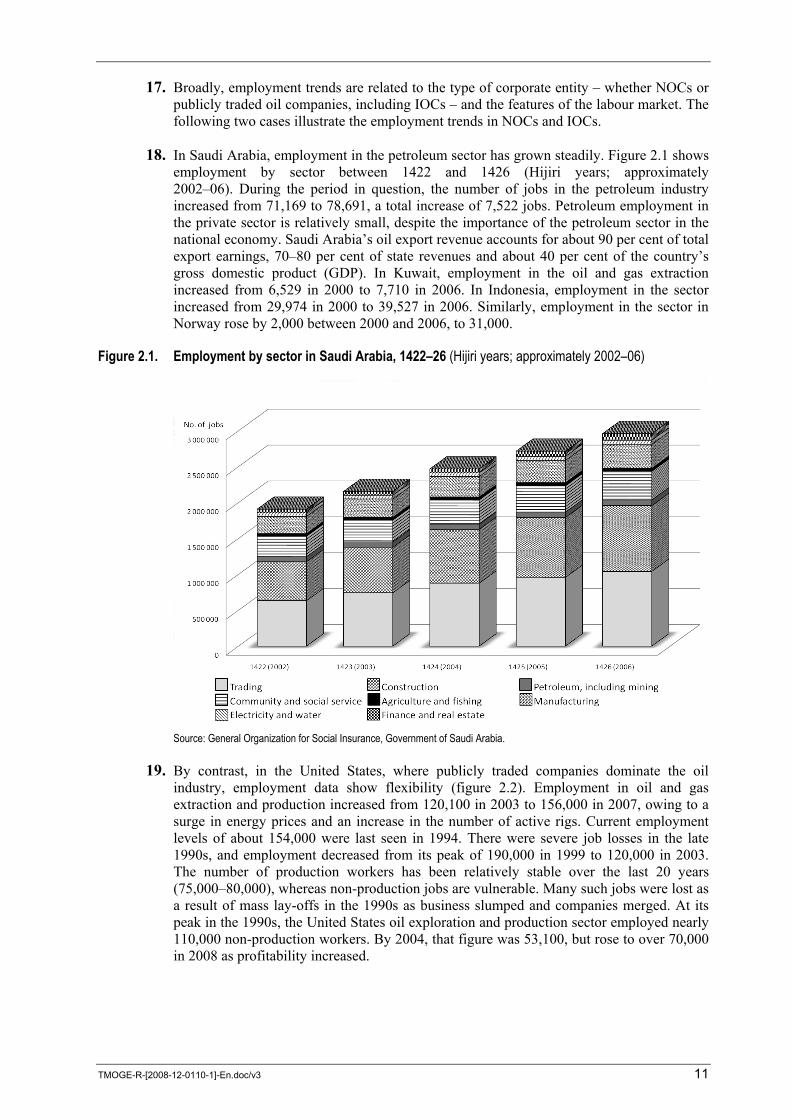
18. In Saudi Arabia, employment in the petroleum sector has grown steadily. Figure 2.1 shows employment by sector between 1422 and 1426 (Hijiri years; approximately 2002–06). During the period in question, the number of jobs in the petroleum industry increased from 71,169 to 78,691, a total increase of 7,522 jobs. Petroleum employment in the private sector is relatively small, despite the importance of the petroleum sector in the national economy. Saudi Arabia’s oil export revenue accounts for about 90 per cent of total export earnings, 70–80 per cent of state revenues and about 40 per cent of the country’s gross domestic product (GDP). In Kuwait, employment in the oil and gas extraction increased from 6,529 in 2000 to 7,710 in 2006. In Indonesia, employment in the sector increased from 29,974 in 2000 to 39,527 in 2006. Similarly, employment in the sector in Norway rose by 2,000 between 2000 and 2006, to 31,000.
Figure 2.1. Employment by sector in Saudi Arabia, 1422–26 (Hijiri years; approximately 2002–06)
Source: General Organization for Social Insurance, Government of Saudi Arabia.
19. By contrast, in the United States, where publicly traded companies dominate the oil industry, employment data show flexibility (figure 2.2). Employment in oil and gas extraction and production increased from 120,100 in 2003 to 156,000 in 2007, owing to a surge in energy prices and an increase in the number of active rigs. Current employment levels of about 154,000 were last seen in 1994. There were severe job losses in the late 1990s, and employment decreased from its peak of 190,000 in 1999 to 120,000 in 2003. The number of production workers has been relatively stable over the last 20 years (75,000–80,000), whereas non-production jobs are vulnerable. Many such jobs were lost as a result of mass lay-offs in the 1990s as business slumped and companies merged. At its peak in the 1990s, the United States oil exploration and production sector employed nearly 110,000 non-production workers. By 2004, that figure was 53,100, but rose to over 70,000 in 2008 as profitability increased.

12 TMOGE-R-[2008-12-0110-1]-En.doc/v3
Figure 2.2. Employment in oil and gas extraction in the United States, 1990–2008 (annual average)
Note: Data for 2008 are those of April 2008. Source: US Bureau of Labor Statistics, US Department of Labor.
2.2. Refinery employment
20. Nearly 1.5 million people are estimated to be employed in the global oil refining sector. Between 1980 and 2003, world refinery employment gradually increased to this level (table 2.2). Employment was relatively stable in Africa, the Middle East and Australasia. The effect of a huge increase in Asia was diluted by falls in Western Europe, Central and Eastern Europe and Central Asia.
Table 2.2. World refinery estimated employment, 1980–2003
1980 1985 1990 1995 2000 2003
Africa 40 000 44 000 53 000 45 000 40 000 42 000
Americas 199 000 168 000 152 000 150 000 130 000 140 000
Asia 241 000 388 000 609 000 830 000 950 000 950 000
Western Europe 138 000 127 000 113 000 120 000 110 000 100 000
Central and Eastern Europe and Central Asia 450 000 427 000 320 000 212 000 200 000 160 000
Middle East 50 000 34 000 33 000 35 000 40 000 40 000
Australasia 5 000 6 000 5 000 4 600 4 500 5 000
World total 1 123 000 1 194 000 1 285 000 1 396 600 1 474 500 1 437 000
Source: United Nations Industrial Development Organization (UNIDO) INDSTAT3 2005 ISIC Rev.2, INDSTAT4 2008 ISIC Rev.2 and Rev.3, and ILO estimates.
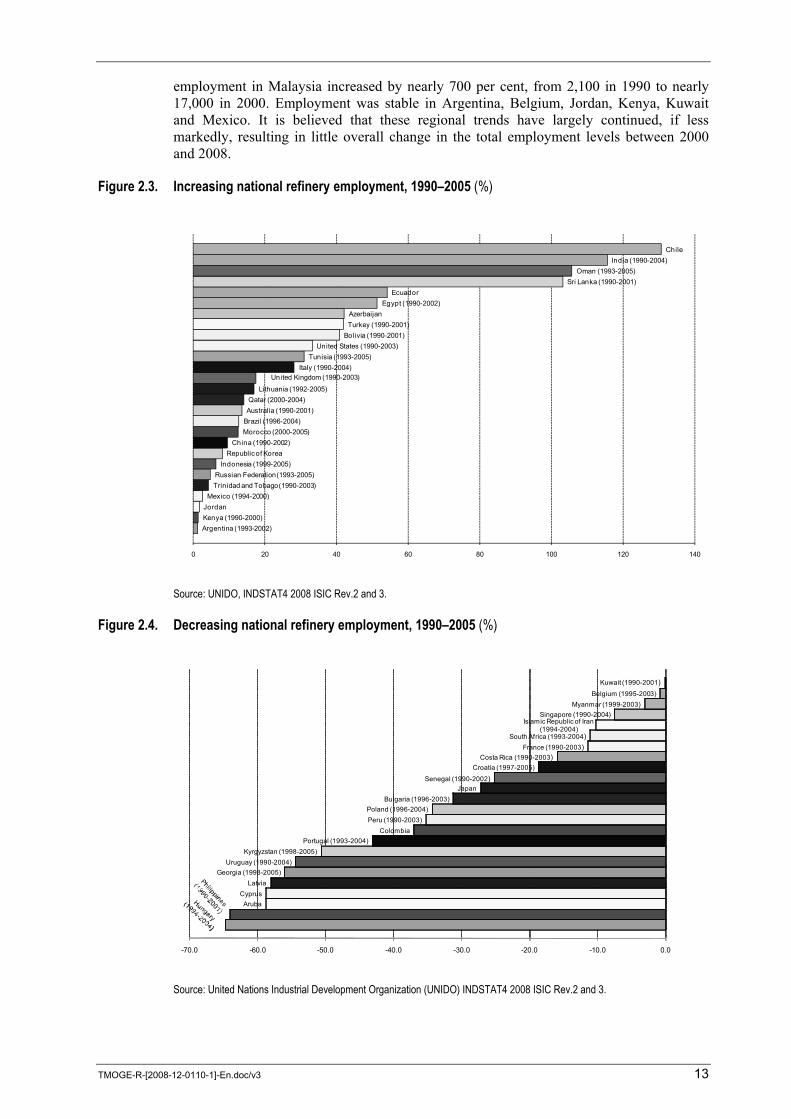
21. The regional trends depicted in table 2.2 become more complex when disaggregated to the national level. An examination of national employment trends in the refinery sector between 1990 and 2005 produces the picture shown in figures 2.3 and 2.4. In addition,
0
20
40
60
80
100
120
140
160
180
200
1990 1991 1992 1993 1994 1995 1996 1997 1998 1999 2000 2001 2002 2003 2004 2005 2006 2007 2008
Non -production workers
Production workers
Thousands of workers
TMOGE-R-[2008-12-0110-1]-En.doc/v3 13
employment in Malaysia increased by nearly 700 per cent, from 2,100 in 1990 to nearly 17,000 in 2000. Employment was stable in Argentina, Belgium, Jordan, Kenya, Kuwait and Mexico. It is believed that these regional trends have largely continued, if less markedly, resulting in little overall change in the total employment levels between 2000 and 2008.
Figure 2.3. Increasing national refinery employment, 1990–2005 (%)
Argentina (1993-2002)Kenya (1990-2000)JordanMexico (1994-2000)
Trinidad and Tobago (1990-2003)Russian Federation (1993-2005)
Indonesia (1999-2005)Republic of Korea
China (1990-2002)Morocco (2000-2005)Brazil (1996-2004)Australia (1990-2001)Qatar (2000-2004)
Lithuania (1992-2005)
United Kingdom (1990-2003)Italy (1990-2004)
Tunisia (1993-2005)United States (1990-2003)
Bolivia (1990-2001)Turkey (1990-2001)Azerbaijan
Egypt (1990-2002)Ecuador
Sri Lanka (1990-2001)Oman (1993-2005)
India (1990-2004)Chile
0 20 40 60 80 100 120 140
Source: UNIDO, INDSTAT4 2008 ISIC Rev.2 and 3.
Figure 2.4. Decreasing national refinery employment, 1990–2005 (%)
ArubaCyprus
LatviaGeorgia (1998-2005)
Uruguay (1990-2004)Kyrgyzstan (1998-2005)
Portugal (1993-2004)Colombia
Peru (1990-2003)Poland (1996-2004)
Bulgaria (1996-2003)Japan
Senegal (1990-2002)Croatia (1997-2005)
Costa Rica (1990-2003)France (1990-2003)
South Africa (1993-2004)
Islamic Republic of Iran (1994-2004)
Singapore (1990-2004)Myanmar (1999-2003)
Belgium (1995-2003)Kuwait (1990-2001)
-70.0 -60.0 -50.0 -40.0 -30.0 -20.0 -10.0 0.0
Source: United Nations Industrial Development Organization (UNIDO) INDSTAT4 2008 ISIC Rev.2 and 3.

14 TMOGE-R-[2008-12-0110-1]-En.doc/v3
Pemex Exploración y Producción
30%
Pemex Refinación34%
Pemex Gas y Petroquímica Básica
9%
Pemex Petroquímica13%
Pemex Corporative4%
Medical Services8%
Telecomunications2%
22. In Western Europe, the employment trend was downwards. In Asia, there were more countries with growing than with falling refinery employment. In India and Indonesia, the number of jobs doubled, while in Japan and Singapore the number of refinery workers fell markedly. In North America, refining employment was relatively balanced. In Latin America, employment declined. In the Middle East, the trend was upwards. In Central and Eastern Europe and Central Asia, most countries experienced falling employment, except the Russian Federation. In Africa, employment was stable.
23. Appendix I provides a breakdown of world refinery employment from 1990 to 2005.
2.3. Core and non-core employees
24. Generally speaking, NOCs provide a high level of job security. For example, in the Mexican state oil company PEMEX, the number of employees increased from 128,591 in 1996 to 137,722 in 2004, but the employment breakdown by business unit remained relatively stable. The core business unit of PEMEX, operated by its subsidiary, PEMEX Exploración y Producción, accounted for around 30 per cent of total employment in the PEMEX group 1 (figure 2.5). However, it seems that PEMEX’s actual workforce may be even larger. To the company’s published employment figures should be added about 55,000 former employees who, although retired, are still on the payroll. Under the company’s workers’ employment protection scheme, they continue to receive benefits during their lifetime as if they were active employees. Moreover, PEMEX sometimes re-employs its retired employees as “active workers”; these are defined as re-employed workers who were laid off or retired but have been subsequently re-employed by PEMEX for a fixed term.
Figure 2.5. Employment by business unit at PEMEX, 1996 and 2004
(a) 1996
1 PEMEX Statistical Yearbook 2005, p. 10.

TMOGE-R-[2008-12-0110-1]-En.doc/v3 15
(b) 2004
Pemex Exploración y Producción
35%
Pemex Refinación32%
Pemex Gas y Petroquímica Básica
9%
Pemex Petroquímica
10%
Pemex Corporative5%
Medical Services8%
Telecomunications1%
Source: PEMEX Statistical Yearbook 2005, p. 10.
2.4. Contract labour
25. Oil companies contract out or outsource many routine and one-off tasks. Outsourcing in the oil industry often involves highly specialized companies. Four of the largest service companies employ about 76,000 people worldwide. Outsourced technical services include construction, well logging, exploration drilling, shaft sinking and laboratory analysis. Other functions that are typically outsourced are maintenance, catering, transport and security services. The advantage for the services companies is that, unlike IOCs, they can operate freely in countries with dominant state-controlled NOCs. 2 In the extraction and refining sectors in the United Kingdom, temporary workers accounted for 13.3 per cent and 14.3 per cent of the workforce in 2003, considerably more than in the manufacturing sector (3.8 per cent) and in industry as a whole (5.5 per cent). 3
26. According to Nigerian oil workers’ unions (table 2.3), employment in the petroleum sector in Nigeria increased by 28 per cent between 1999 and 2003, to nearly 64,000 workers. The proportion of contract workers (32 per cent) remained stable over this period. Expatriate workers accounted for about 12 per cent of the overall workforce in the oil industry, mainly in positions requiring special skills and expertise. Expatriate contract workers, however, accounted for only 3 per cent of the contract workforce in 2003, although the number of expatriate workers in unskilled and semi-skilled jobs has increased in recent years. The presence of highly paid expatriate workers who perform the same work as Nigerian nationals sometimes causes a certain amount of friction, as there is considerable disparity in the terms and conditions of work of each group.
2 E. Crooks: “Oil services companies tap into rich seam”, in Financial Times (London), 13 Mar. 2007.
3 UK Labour Force Survey, autumn quarter, weighted data, 2003.

16 TMOGE-R-[2008-12-0110-1]-En.doc/v3
Table 2.3. Employment of regular and contract workers in the oil sector in Nigeria, 1999–2003
Type of employment
1999 2000 2001 2002 2003
Nigerian Non-Nigerian
Nigerian Non-Nigerian
Nigerian Non-Nigerian
Nigerian Non-Nigerian
Nigerian Non-Nigerian
Regular 28 375 5 578 29 835 5 865 32 175 6 325 33 930 6 670 36 270 7 130
Contract 10 914 485 11 475 510 12 375 550 13 050 580 13 950 620
Subcontract 4 365 – 4 590 – 4 950 – 5 220 – 5 580 –
Subtotal 43 654 6 063 45 900 6 375 49 500 6 875 52 200 7 250 55 800 7 750
Grand total 49 717 52 275 56 376 59 450 63 550
Sources: Petroleum and Natural Gas Senior Staff Association of Nigeria (PENGASSAN) and National Union of Petroleum and Natural Gas Workers of Nigeria (NUPENG).
2.5. Shortage of skilled workers 27. As in other capital-intensive industries, finding new, skilled workers to replace an ageing
workforce is a priority, particularly in the light of the need to maintain exploration, production and refining activity. As shown in figure 2.6, in 2005 around 50 per cent of professional extraction and production staff in the United Kingdom were aged 40–50 years old, while only around 15 per cent were in their early 20s to mid-30s. Within the next ten years, half the industry’s workforce will reach retirement age. Between 2002 and 2005, there was a reduction of about 10 per cent in the workforce of most IOCs. Most workers leaving the oil industry left for good. A shortfall of between 5,500 and 6,000 qualified technical workers is likely by 2010. 4
Figure 2.6. Age range of professional oil and gas exploration and production staff in the United Kingdom, 2005
0%
5%
10%
15%
20%
25%
30%
<25 years old
25-29 30-34 35-39 40-44 45-49 50-54 >55 years old
2%
5%8%
16%
27% 26%
11%
5%
Source: Booz Allen Hamilton: “Resourcing the challenges of maturity – An oil industry view”, 2005.
28. With the boom in the oil and gas industry, shortages of skilled workers are reported to have created a bottleneck in the expansion of the industry. Shortages affect jobs, not only for high-skilled workers such as petroleum geologists and engineers, but also for entry-level workers such as rig hands, affecting operators and service companies alike. One source
4 S. McNulty: “Desperate search for talent”, in Financial Times (London), 6 May 2008.

TMOGE-R-[2008-12-0110-1]-En.doc/v3 17
estimated that 30,000 or more new workers would be needed to operate the oil rigs currently under construction. 5
29. In part, the shortages are region-specific. Not surprisingly, shortages appear to be particularly acute in Alaska, Alberta and other regions where working and living conditions are harsh. But it is precisely in those regions, together with the Siberian tundra and ultra-deep water locations, that new oil and gas reserves are mostly to be found. 6
30. Labour shortages have been blamed on several factors, including the cyclical nature of the industry. In the 1990s, when oil prices were low, thousands of the industry’s workers were made redundant. This left it with both a staffing and an image problem. The sharp employment drop portrayed the industry as unstable and an unreliable employer; it curbed entry into the industry for nearly a generation. A structural problem may be the industry’s poor public image in some quarters. Many young people associate it with oil spills, explosions, air pollution and the neglect of human rights. In addition, jobs on the rig floor are often perceived as dirty, difficult and possibly dangerous. These issues and concerns are captured in box 2.1.
Box 2.1 Key findings of a survey conducted by the Energy Institute, Deloitte and Norman Broadbent
Companies Over 70 per cent of the energy companies surveyed believed that they would not have sufficient
leadership talent to meet the industry’s future challenges. The poaching of competitors’ employees was expected to be an issue, with most companies perceiving
themselves as potential victims, rather than perpetrators. Internal training and development programmes are delivering insufficient numbers of trained personnel to
develop into senior roles. Workers
Energy professionals have traditionally been very loyal to their employers, leading the industry to expect stability among its workers (90 per cent of workers under the age of 35 expect to stay in the energy industry for more than five years.) However, with the general trend towards greater mobility in working life, will the energy sector be able to adapt to increased staff turnover?
Two-thirds of those polled declared a high degree of job satisfaction and even more would recommend a career in the industry to a new graduate.
A fulfilling and challenging job with a good work-life balance has superseded salary as the overriding reason to choose a career in the energy industry.
The average age of the workforce in the sample was 45. Fifty per cent of respondents expected to leave the industry in the next decade, mostly through retirement.
Human resources departments
The main shortage was technical specialists, particularly engineers. The level of specialization required in many cases led to recruitment being mostly from within the industry.
They perceived a lack of interest in the industry as a bigger barrier than the lack of skills to recruiting outside the industry.
Competition from non-technical commercial sectors for the graduate pool was an issue – attracting even technical qualified people.
In order to find the right levels of skills, most companies still predominantly and actively seek more experienced workers.
Source: OPEC Bulletin, 6/08, p.17.
5 E. Crooks: “Labour shortages could hit oil supply”, in Financial Times (London), 31 Oct. 2007.
6 Oil and Gas UK: 2006 UK continental shelf workforce demographics report (London, 2007).
18 TMOGE-R-[2008-12-0110-1]-En.doc/v3
2.6. Women workers
31. There has been long-standing concern about the limited opportunities for women in the oil industry. In the United Kingdom, female workers accounted for about 5 per cent of the offshore workforce in 2003; one third of those workers performed administrative and secretarial roles – a much greater proportion than males in this sector. In oil-related jobs, 56 per cent of women performed administrative and secretarial roles, with a further 10 per cent in sales. In oil refining, while a quarter of all jobs were managerial positions, only 6 per cent of female workers occupied such positions. As in other sectors, female employment in the refining industry predominantly involves clerical and administrative roles (53 per cent of female workers in this sector occupy such roles). 7 Table 2.4 shows female employment in oil refineries in selected countries in the period 1990–2001.
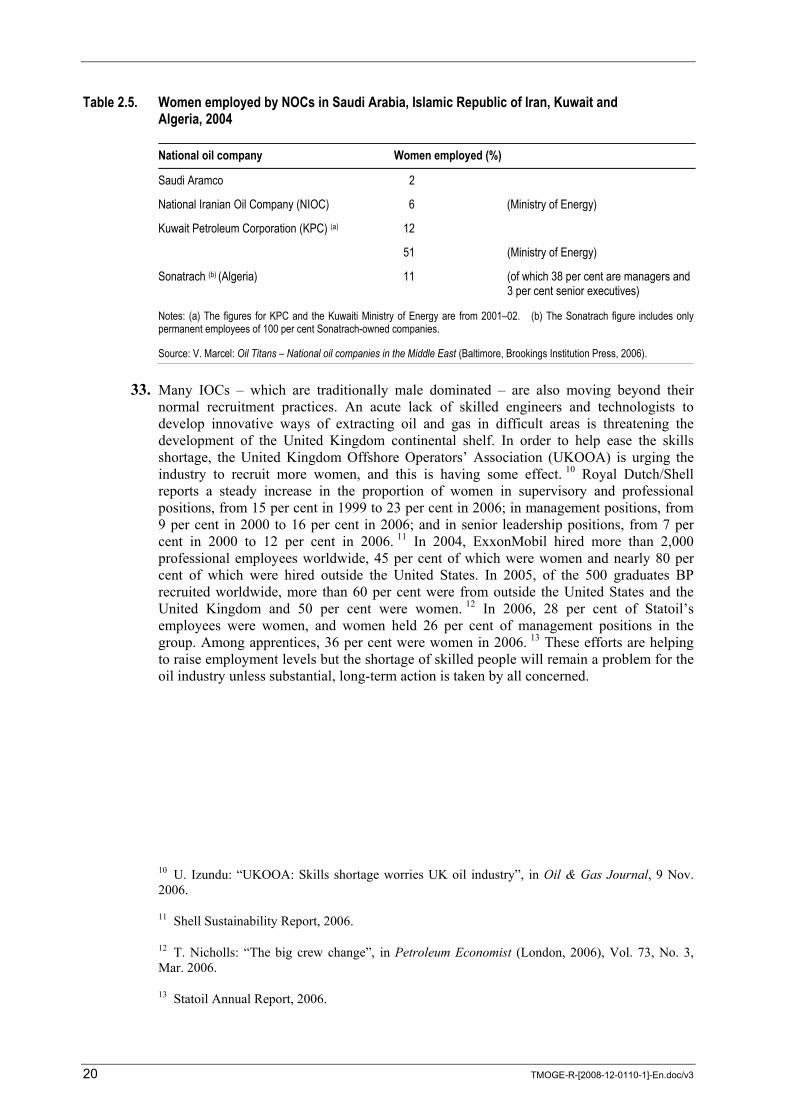
32. Women’s participation in the oil industry remains low, even in Western Europe. For example, in Norway in 2007, women accounted for 20 per cent of the workforce in the exploration and natural gas sectors. 8 Although women’s participation in the oil industry in the Middle East has been improving, it has been from a low base. Cultural mores are an important factor to be overcome, as Arab women, despite their relatively high levels of education and increasing opportunities to pursue career options, though limited, continue to give priority to motherhood. Table 2.5 shows the percentage of women working in certain NOCs in the Middle East. Although women have not found it easy to gain access to high-level management positions in Saudi Aramco, there are a few Saudi women professionals in the company. The company is, however, very sensitive to equality issues because its employees are often trained in western countries. Generally speaking, these NOCs are attractive to women workers because they can offer skilled positions to the large number of women graduating from engineering schools. They also tend to offer women a more attractive work environment than private companies do because employment is more secure and the hours of work are more family friendly. 9
7 UK Labour Force Survey, autumn quarter, weighted data, 2003.
8 Statistics Norway, 2007.
9 V. Marcel: Oil Titans: National oil companies in the Middle East (Baltimore, Brookings Institution Press, 2006), pp. 63–66.

TMOGE-R-[2008-12-0110-1]-En.doc/v3 19
Tabl
e 2.4.
Fe
male
empl
oyee
s in
petro
leum
refin
eries
, sele
cted
coun
tries
, 199
0–20
01
19
9019
9119
9219
9319
9419
9519
9619
9719
9819
9920
0020
01Al
bania
975
809
650
634
637
Chile
88
9494
8595
8361
8579
China
(Taiw
an P
rovin
ce)
1 256
1 290
1 286
1 334
1 327
1 307
1 273
1 738
1 681
1 751
1 736
1 715
Colom
bia
537
848
699
117
112
71Cô
te d’I
voire
14
214
113
814
214
4De
nmar
k 64
6879
119
Egyp
t 1 4
261 2
981 3
051 4
251 5
392 2
57El
Salv
ador
4
22
24
7Fij
i 41
39Hu
ngar
y 5 0
005 0
0010
711
612
713
410
7Ind
ia 11
612
713
410
7Ind
ones
ia 8
7710
230
Japa
n 2 0
002 0
002 0
002 0
00Jo
rdan
64
6867
7172
7067
75Ke
nya
1919
1919
2219
1716
19Ko
rea,
Repu
blic o
f 30
027
836
023
527
130
045
4Ma
laysia
10
010
010
010
030
030
020
040
030
0My
anma
r 60
860
860
8Ne
w Ze
aland
79
8471
Philip
pines
32
436
236
833
2Po
rtuga
l 86
175
571
969
868
4Pu
erto
Rico
21
019
019
013
018
016
013
016
0Sl
ovak
ia 1 4
711 4
18Sr
i Lan
ka
182
3446
4949
5728
228
235
834
233
766
2Ta
nzan
ia, U
nited
Rep
ublic
of
9813
210
110
110
010
210
611
2Th
ailan
d 58
03 4
391 0
69Un
ited K
ingdo
m 1 3
411 0
003 0
00Un
ited S
tates
48
000
47 00
046
000
46 00
0
20 TMOGE-R-[2008-12-0110-1]-En.doc/v3
Table 2.5. Women employed by NOCs in Saudi Arabia, Islamic Republic of Iran, Kuwait and Algeria, 2004
National oil company Women employed (%)
Saudi Aramco 2
National Iranian Oil Company (NIOC) 6 (Ministry of Energy)
Kuwait Petroleum Corporation (KPC) (a) 12
51 (Ministry of Energy)
Sonatrach (b) (Algeria) 11 (of which 38 per cent are managers and 3 per cent senior executives)
Notes: (a) The figures for KPC and the Kuwaiti Ministry of Energy are from 2001–02. (b) The Sonatrach figure includes only permanent employees of 100 per cent Sonatrach-owned companies.
Source: V. Marcel: Oil Titans – National oil companies in the Middle East (Baltimore, Brookings Institution Press, 2006).
33. Many IOCs – which are traditionally male dominated – are also moving beyond their normal recruitment practices. An acute lack of skilled engineers and technologists to develop innovative ways of extracting oil and gas in difficult areas is threatening the development of the United Kingdom continental shelf. In order to help ease the skills shortage, the United Kingdom Offshore Operators’ Association (UKOOA) is urging the industry to recruit more women, and this is having some effect. 10 Royal Dutch/Shell reports a steady increase in the proportion of women in supervisory and professional positions, from 15 per cent in 1999 to 23 per cent in 2006; in management positions, from 9 per cent in 2000 to 16 per cent in 2006; and in senior leadership positions, from 7 per cent in 2000 to 12 per cent in 2006. 11 In 2004, ExxonMobil hired more than 2,000 professional employees worldwide, 45 per cent of which were women and nearly 80 per cent of which were hired outside the United States. In 2005, of the 500 graduates BP recruited worldwide, more than 60 per cent were from outside the United States and the United Kingdom and 50 per cent were women. 12 In 2006, 28 per cent of Statoil’s employees were women, and women held 26 per cent of management positions in the group. Among apprentices, 36 per cent were women in 2006. 13 These efforts are helping to raise employment levels but the shortage of skilled people will remain a problem for the oil industry unless substantial, long-term action is taken by all concerned.
10 U. Izundu: “UKOOA: Skills shortage worries UK oil industry”, in Oil & Gas Journal, 9 Nov. 2006.
11 Shell Sustainability Report, 2006.
12 T. Nicholls: “The big crew change”, in Petroleum Economist (London, 2006), Vol. 73, No. 3, Mar. 2006.
13 Statoil Annual Report, 2006.
TMOGE-R-[2008-12-0110-1]-En.doc/v3 21
3. Conditions of work
3.1. Remuneration
34. Jobs in oil and gas extraction and production are generally relatively well paid compared with other economic sectors, although pay systems vary from country to country. Table 3.1 shows average monthly earnings for the full-time employees in the oil and gas extraction and other industries in Norway between 2003 and 2007. Most occupations, including managers, in the oil industry had higher monthly pay than the average for the mining and quarrying, basic chemicals and manufacturing sectors, and for all industries combined.
35. Table 3.2 shows average working time and hourly and weekly earnings of production workers in the oil and gas industry and other industries in the United States between 1997 and 2007. Overall, hourly wages for the oil industry are higher than those for the goods-producing sector and for all industries combined.
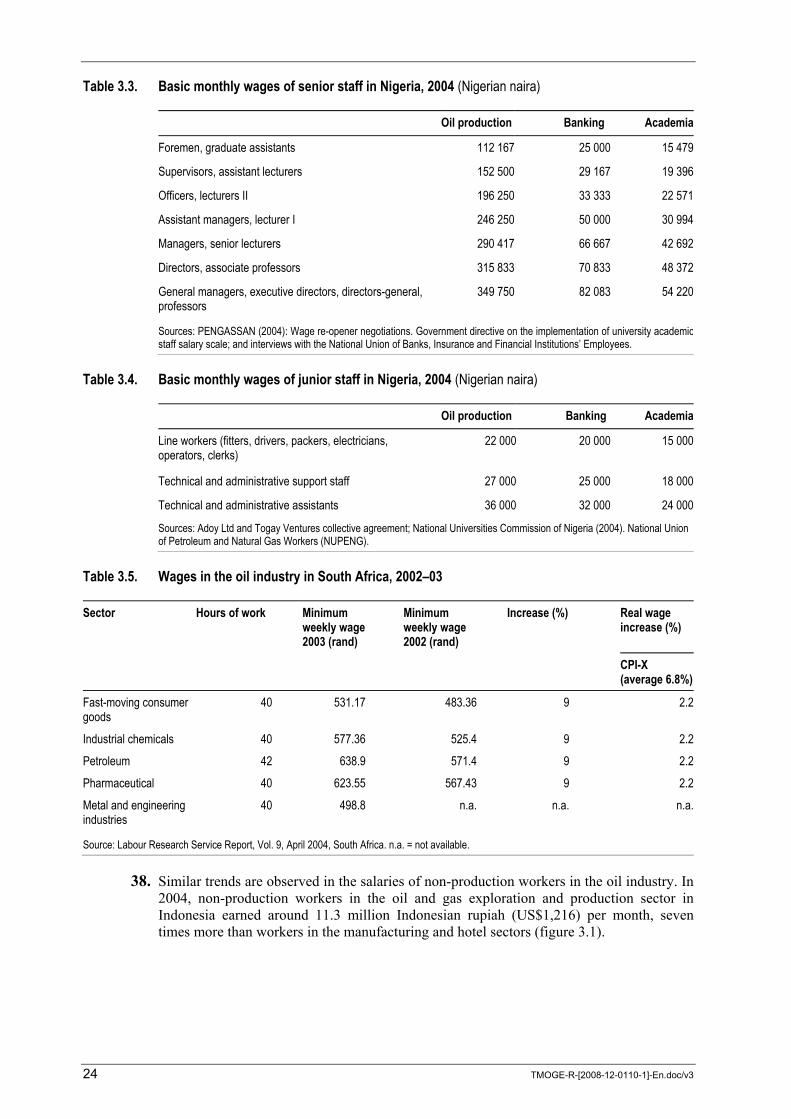
36. In Nigeria, basic wages in 2004 were generally higher in the oil sector than in other sectors (tables 3.3 and 3.4). Basic wages in the upstream sector were higher than in the downstream sector, partly because of monetary compensation for occupational hazards. In Nigeria, as in some other countries, large oil companies and outsourcing and contracting companies pay higher wages than other sectors to attract better qualified employees.
37. Although South African oil workers as a group earned nearly the highest income levels in the country, weekly working hours were two hours longer than in other industries (table 3.5). One large oil company states that the maximum monthly salary earned in the bargaining unit was 16,890 South African rand and the average salary 8,147 rand.

22 TMOGE-R-[2008-12-0110-1]-En.doc/v3
Tabl
e 3.1.
Av
erag
e mon
thly
earn
ings
for f
ull-t
ime e
mpl
oyee
s in
oil a
nd g
as ex
tract
ion
and
othe
r sec
tors
in N
orwa
y, 20
03–0
7 (No
rweg
ian kr
oner
)
20
03
20
04
Oil a
nd g
as
extra
ctio
n Mi
ning
and
quar
ryin
g Ba
sic
chem
icals
Manu
fact
urin
gAl
l priv
ate
sect
or
Oi
l and
gas
ex
tract
ion
Mini
ng an
d qu
arry
ing
Basic
ch
emica
ls Ma
nufa
ctur
ing
All p
rivat
e se
ctor
Senio
r offic
ials a
nd m
anag
ers
65 58
2 62
436
53 29
7 45
870
42 53
6
67 38
3 64
561
53 88
7 46
453
43 82
1
Profe
ssion
als
48 75
6 48
655
40 81
4 38
141
38 02
2
49 97
4 49
901
41 83
5 38
924
39 03
3
Tech
nician
s and
asso
ciate
profe
ssion
als
43 11
4 42
791
34 39
4 31
231
31 26
7
43 49
0 43
320
35 26
5 32
215
32 03
0
Cler
ks
29 66
1 29
139
26 43
7 24
537
23 44
2
30 81
3 30
487
27 08
4 25
051
24 42
1
Craft
wor
kers
35 52
3 33
269
26 26
6 24
117
24 53
4
35 89
2 33
857
27 03
2 24
900
25 45
8
Oper
ators
and d
river
s 37
444
34 84
8 26
566
23 20
5 23
753
38
125
35 96
9 27
814
23 87
824
393
20
05
20
06
Oil a
nd g
as
extra
ctio
n Mi
ning
and
quar
ryin
g Ba
sic
chem
icals
Manu
fact
urin
gAl
l priv
ate
sect
or
Oi
l and
gas
ex
tract
ion
Mini
ng an
d qu
arry
ing
Basic
ch
emica
ls Ma
nufa
ctur
ing
All p
rivat
e se
ctor
Senio
r offic
ials a
nd m
anag
ers
67 50
5 65
539
58 22
2 47
846
45 16
475
039
72 80
2 63
114
49 82
347
620
Profe
ssion
als
50 59
5 50
531
43 79
1 40
231
40 35
453
179
53 10
7 45
684
41 64
642
003
Tech
nician
s and
asso
ciate
profe
ssion
als
44 31
4 44
073
36 30
2 33
646
33 41
248
100
47 90
6 39
459
35 41
334
999
Cler
ks
31 99
9 31
694
28 02
6 25
948
25 35
434
705
34 11
1 29
362
26 95
526
419
Craft
wor
kers
36 09
6 34
378
27 08
9 25
859
26 36
939
471
37 24
9 27
694
26 77
827
193
Oper
ators
and d
river
s 39
958
37 79
1 27
747
24 48
025
207
42 00
0 39
557
29 58
2 25
552
26 60
3

TMOGE-R-[2008-12-0110-1]-En.doc/v3 23
20
07
Oil a
nd g
as ex
tract
ion
Mini
ng an
d qu
arry
ing
Basic
chem
icals
Manu
fact
urin
gAl
l priv
ate s
ecto
r
Senio
r offic
ials a
nd m
anag
ers
78 05
075
665
63 60
252
484
50 78
0
Profe
ssion
als
––
46 21
644
130
44 69
0
Tech
nician
s and
asso
ciate
profe
ssion
als
––
41 95
537
877
37 49
0
Cler
ks
36 97
336
198
31 04
428
628
27 46
5
Craft
wor
kers
40 94
339
185
29 71
428
380
29 00
2
Oper
ators
and d
river
s 44
067
41 55
430
812
27 02
727
958
Note:
Mon
thly e
arnin
gs in
clude
basic
salar
ies, v
ariab
le ad
dition
al all
owan
ces a
nd bo
nuse
s, ex
cludin
g ove
rtime p
ay.
Sour
ce: S
tatist
ics N
orwa
y, Go
vern
ment
of No
rway
.
Tabl
e 3.2.
Av
erag
e hou
rs an
d ea
rnin
gs o
f pro
duct
ion
work
ers i
n th
e oil a
nd g
as p
rodu
ctio
n se
ctor
in th
e Uni
ted
Stat
es, 1
997–
2007
(US$
)
Oi
l and
gas
(inc
ludi
ng m
inin
g)
Go
ods-
prod
ucin
g
Tota
l priv
ate
Wee
kly h
ours
Ho
urly
earn
ings
W
eekly
earn
ings
W
eekly
hou
rs
Hour
ly ea
rnin
gs
Wee
kly ea
rnin
gs
Wee
kly h
ours
Ho
urly
earn
ings
W
eekly
earn
ings
1997
46
.2 15
.6 72
0.141
.1 13
.8 56
8.434
.5 12
.5 43
1.919
98
44.9
16.2
727.3
40.8
14.2
581.0
34.5
13.0
448.6
1999
44
.2 16
.3 72
1.740
.8 14
.7 60
0.034
.3 13
.5 46
3.220
00
44.4
16.6
734.9
40.7
15.3
621.9
34.3
14.0
481.0
2001
44
.6 17
.0 75
7.939
.9 15
.8 63
0.034
.0 14
.5 49
3.820
02
43.2
17.2
742.0
39.9
16.3
651.6
33.9
15.0
506.8
2003
43
.6 17
.6 76
5.939
.8 16
.8 66
9.133
.7 15
.4 51
8.120
04
44.5
18.1
803.8
40.0
17.2
688.1
33.7
15.7
529.1
2005
45
.6 18
.7 85
3.740
.1 17
.6 70
5.333
.8 16
.1 54
4.320
06
45.6
19.9
908.0
40.5
18.0
730.2
33.9
16.8
567.9
2007
45
.9 21
.0 96
1.840
.6 18
.7 75
7.133
.8 17
.4 58
9.7
Sour
ce: U
S De
partm
ent o
f Lab
or, B
urea
u of L
abor
Stat
istics
.
24 TMOGE-R-[2008-12-0110-1]-En.doc/v3
Table 3.3. Basic monthly wages of senior staff in Nigeria, 2004 (Nigerian naira)
Oil production Banking Academia
Foremen, graduate assistants 112 167 25 000 15 479
Supervisors, assistant lecturers 152 500 29 167 19 396
Officers, lecturers II 196 250 33 333 22 571
Assistant managers, lecturer I 246 250 50 000 30 994
Managers, senior lecturers 290 417 66 667 42 692
Directors, associate professors 315 833 70 833 48 372
General managers, executive directors, directors-general, professors
349 750 82 083 54 220
Sources: PENGASSAN (2004): Wage re-opener negotiations. Government directive on the implementation of university academic staff salary scale; and interviews with the National Union of Banks, Insurance and Financial Institutions’ Employees.
Table 3.4. Basic monthly wages of junior staff in Nigeria, 2004 (Nigerian naira)
Oil production Banking Academia
Line workers (fitters, drivers, packers, electricians, operators, clerks)
22 000 20 000 15 000
Technical and administrative support staff 27 000 25 000 18 000
Technical and administrative assistants 36 000 32 000 24 000
Sources: Adoy Ltd and Togay Ventures collective agreement; National Universities Commission of Nigeria (2004). National Union of Petroleum and Natural Gas Workers (NUPENG).
Table 3.5. Wages in the oil industry in South Africa, 2002–03
Sector Hours of work Minimum weekly wage 2003 (rand)
Minimum weekly wage 2002 (rand)
Increase (%) Real wage increase (%)
CPI-X (average 6.8%)
Fast-moving consumer goods
40 531.17 483.36 9 2.2
Industrial chemicals 40 577.36 525.4 9 2.2
Petroleum 42 638.9 571.4 9 2.2
Pharmaceutical 40 623.55 567.43 9 2.2
Metal and engineering industries
40 498.8 n.a. n.a. n.a.
Source: Labour Research Service Report, Vol. 9, April 2004, South Africa. n.a. = not available.
38. Similar trends are observed in the salaries of non-production workers in the oil industry. In 2004, non-production workers in the oil and gas exploration and production sector in Indonesia earned around 11.3 million Indonesian rupiah (US$1,216) per month, seven times more than workers in the manufacturing and hotel sectors (figure 3.1).

TMOGE-R-[2008-12-0110-1]-En.doc/v3 25
Figure 3.1. Average monthly salary of non-production workers by selected sector in Indonesia, 2003–04
Source: BPS Statistics Indonesia (national statistics office), Wage structure statistics 2004–05 and mining statistics of petroleum and natural gas, 2004–05 edition.
39. Pay levels in the oil and gas extraction and production sector in the United Kingdom increased by 6.4 per cent between 2001 and 2003, slightly above inflation, although there are large differences between occupations. For those in managerial positions, average hourly pay increased by 12.5 per cent. There were small increases for those in professional occupations, such as engineering and information and communication technology professionals. In contrast, the average hourly pay for those in associate professional occupations, where the largest proportion of oil extraction workers are to be found, fell by 12.8 per cent to £11.40 per hour. 1
40. A similar picture is observed in Mexico. Figure 3.2 shows the evolution of annual wages by major economic sectors between 1994 and 2005. The wages of petroleum and coal products manufacturing workers increased less than those in the manufacturing sector. Oil workers’ wages have risen relatively quickly over the past years compared with those in other economic sectors. But in 2004 and 2005, oil workers’ wage increases slowed as a result of wage restraint policies in the industry to protect its future financial situation. 2
1 UK Labour Force Survey, autumn quarter, weighted data, 2003.
2 www.banxico.org.mx
0
2,000
4,000
6,000
8,000
10,000
12,000
Manufacturing Hotels Mining Oil and gas exploration and production
Refining
1,000 Indonesian rupiah
2003 2004

26 TMOGE-R-[2008-12-0110-1]-En.doc/v3
Figure 3.2. Annual wages by economic sector in Mexico, 1994–2005 (2004 = 100)
41. The earnings of skilled workers, however, have increased significantly in recent years, partly due to a skills shortage. In Indonesia, between 2003 and 2004, the liberalization of downstream activities encouraged the industry to recruit well-qualified workers, who were in short supply, which pushed up wages. 3 A survey by the Society of Petroleum Engineers in the United States showed that the average annual base salary in 2007 was US$122,458, 4.8 per cent higher than in 2006. Additional compensation, such as bonuses, housing, allowances and retirement contributions, raised total average compensation for 2007 to US$167,712. 4 According to an executive search agency specializing in clean technology, senior managers who report to the board can earn up to US$300,000 a year in basic salary, while in London they generally receive £120,000–£150,000, although they reached around £180,000 in 2008. 5
42. Figure 3.3 shows indices of the evolution of oil refinery wages (in US$; index of 100 in 1990) in selected countries between 1990 and 2005. Two distinctive trends emerge: overall oil refinery wages increased, but there are regional differences. Wages increased in countries in Central and Eastern Europe, the Americas, Asia, Australasia and the Middle East, but they remained static or decreased in some Western European and African countries. In particular, since the mid-1990s, refinery wages in Central and Eastern Europe show a significant increase. Wages in most countries in the Americas, except Canada, increased. Wage increases are also observed in Australasia, Asia and the Middle East. Refinery wages in Western Europe remained relatively stable with a mix of slight increases or decreases. In several African countries, wage levels decreased.
3 R. Pratiwi Anwar and M. Ssenyonga: Promoting good industrial relations in the oil and gas industries in Indonesia (Geneva, ILO, Sectoral Activities Programme Working Paper No. 254, 2007).
4 S. McNulty: “Desperate search for talent”, in Financial Times (London), 6 May 2008.
5 F. Harvey: “A wealth of job openings”, idem.
0
20
40
60
80
100
120
1994 1995 1996 1997 1998 1999 2000 2001 2002 2003 2004 2005
Petroleum and coal products
Apparel
Chemicals Non -metallic mineral products Primary metals Machinery Computers and electronic products Electrical equipment, appliances and components
Transportation equipment
Source: Banco de México. Note: As at 1 January of every year.

TMOGE-R-[2008-12-0110-1]-En.doc/v3 27
Figure 3.3.
(a) Oil refineries wages in Central and Eastern Europe, selected countries, 1990–2005 (1990 = 100, in US$)
0
100
200
300
400
500
600
700
800
1990 1991 1992 1993 1994 1995 1996 1997 1998 1999 2000 2001 2002 2003 2004 2005
Azerbaijan
Hungary
Romania
Russian Federation
Serbia and MontenegroSlovakia
Slovenia
Ukraine
Source: UNIDO INDSTAT3 2005 ISIC Rev.2 and INDSTAT4 2008 ISIC Rev.3.
(b) Oil refineries wages in Central and South America, selected countries, 1990–2005 (1990 = 100, in US$)
0
100
200
300
400
500
600
1990 1991 1992 1993 1994 1995 1996 1997 1998 1999 2000 2001 2002 2003 2004 2005
Argentina
Bolivia
Colombia
Costa Rica
Ecuador
El Salvador
Guatemala
Panama
Puerto Rico
Trinidad and Tobago
Uruguay
Source: UNIDO INDSTAT3 2005 ISIC Rev.2 and INDSTAT4 2008 ISIC Rev.3.

28 TMOGE-R-[2008-12-0110-1]-En.doc/v3
(c) Oil refineries wages in North America, selected countries, 1990–2005 (1990 = 100, in US$)
60
70
80
90
100
110
120
130
140
150
160
1990 1991 1992 1993 1994 1995 1996 1997 1998 1999 2000 2001 2002 2003 2004
Canada
Mexico
United States of America
Source: UNIDO INDSTAT3 2005 ISIC Rev.2 and INDSTAT4 2008 ISIC Rev.3.
(d) Oil refineries wages in Asia, Australasia and Middle East, selected countries, 1990–2005 (1990 = 100, in US$)
0
50
100
150
200
250
300
350
1990 1991 1992 1993 1994 1995 1996 1997 1998 1999 2000 2001 2002 2003 2004 2005
Australia
India
Indonesia
Japan
Korea, Republic of
Malaysia
Philippines
Singapore
Sri Lanka
Jordan
Kuwait
Qatar
Source: UNIDO INDSTAT3 2005 ISIC Rev.2 and INDSTAT4 2008 ISIC Rev.3.

TMOGE-R-[2008-12-0110-1]-En.doc/v3 29
(e) Oil refineries wages in Western Europe, selected countries, 1990–2005 (1990 = 100, in US$)
50
60
70
80
90
100
110
120
130
140
150
160
170
180
190
200
210
220
1990 1991 1992 1993 1994 1995 1996 1997 1998 1999 2000 2001 2002 2003 2004 2005
Cyprus
Denmark
France
Greece
Ireland
Italy
Netherlands
Norway
Portugal
Spain
Sweden
Turkey
United Kingdom
Source: UNIDO INDSTAT3 2005 ISIC Rev.2 and INDSTAT4 2008 ISIC Rev.3.
(f) Oil refineries wages in Africa, selected countries, 1990–2005 (1990 = 100, in US$)
0
50
100
150
200
250
1990 1991 1992 1993 1994 1995 1996 1997 1998 1999 2000 2001 2002 2003 2004
Cameroon
Kenya
Mozambique
Senegal
South Africa
Tunisia
Source: UNIDO INDSTAT3 2005 ISIC Rev.2 and INDSTAT4 2008 ISIC Rev.3.
43. A complete table showing the evolution of real wages per refining employee in US dollars and national currency between 1990 and 2005 is in Appendix II.

30 TMOGE-R-[2008-12-0110-1]-En.doc/v3
3.1.1. Pay equality
44. Notwithstanding the widespread recognition of the principles of equal treatment in recruitment, promotion and training, and of equal pay for work of equal value, 6 there is still a pay gap between women and men. This is due to a complex combination of factors, including: age; family situation and number of children; results obtained at school and the level of studies achieved; career interruptions; employment security; type of contract; length of working time; employment in the public or private sector; type of job; company size; and the gender composition of the company’s workforce. In order to enhance equal pay at its European facilities, the French oil company Total and three European-level trade union organizations agreed in 2005 that the question of equal pay should be followed up at the European level and reported on each year. A working group, mainly comprising members of Total’s European Works Council’s (EWC) “liaison bureau”, was set up. Its role is to examine, on the basis of data provided by group management, developments in terms of women’s and men’s recruitment; career development; mobility; work–life balance; pay and occupations; and actions taken during the year in order to reduce any differences in treatment between women and men and the results achieved. In this connection, Total’s management made a commitment to take action aimed at guaranteeing a coherent development of equal remuneration for women and men. Performance, competencies, professional experience and qualifications are the key criteria in this process. The company undertook, as far as possible, to identify gender pay gaps by division and by country. In addition, the company will ensure that maternity-related absence will not harm employees’ pay or development, and that its effects are neutralized. Individual pay increases for employees absent on maternity leave will be at least equal to their average individual pay increase over the three previous years. 7
3.1.2. Fringe benefits
45. In addition to relatively high wages, oil companies generally provide their workers with a range of cash or in-kind allowances as fringe benefits. Many NOCs have developed comprehensive employee welfare packages. For example, in the Russian Federation, Gazprom operates the natural gas fields at Midday in Novy Urengoy, the largest city in the Nadym-Pur-Taz region of north-west Siberia. While the average Russian worker earns US$250 a month, gas field technicians in Siberia can take home up to US$3,000 a month. In addition to high pay, workers live with their families in apartment blocks. Gazprom covers 97 per cent of the cost of running 14 kindergartens, charging employees only 100 Russian roubles (about US$4), a month for childcare. The company also provides interest-free housing loans, free medical care, and heavily subsidized overseas vacations. 8
46. In Mexico, all PEMEX workers are entitled to receive a monthly cash allowance to reflect adjustments in the consumer price index. Each worker thus received 1,047 Mexican pesos per month in 2003 and 1,277 pesos the following year. In 2004, PEMEX also paid out about 4,200 million pesos to its employees as support for building their houses. Furthermore, PEMEX helps promote workers’ social activities – for example, it provided 200 million pesos to support their sports activities in 2004. PEMEX employees and their family members also enjoy generous welfare benefits. For example, employees’ widows
6 ILO Equal Remuneration Convention, 1951 (No. 100).
7 “Europe-wide equality agreement signed at Total”, in European Works Councils Bulletin, Issue 61, Jan./Feb. 2006, pp. 12–15.
8 J. Bush and A. Bianco: “Why Russians love Gazprom – No matter what the world thinks”, in Business Week, 31 July 2006, pp. 36–39.

TMOGE-R-[2008-12-0110-1]-En.doc/v3 31
receive medical care throughout their lifetime. In addition, in 2004 PEMEX invested 2,826 million pesos in medical services alone. The company offers a private pension system to its employees, hospital care for employees’ family members and siblings and gives preference to workers’ children when filling posts at PEMEX. It also provides benefits to its retired workers, such as special care and an annual adjustment of their pension. 9
47. In August 2004, Royal Dutch/Shell revised its company-wide bonus scheme in order to create incentives for staff to look beyond their specific section of the business and focus on improving the performance of the entire company. Before the change, staff were rewarded for both their individual performance and the success of their division. From 2005, however, the divisional element would be dropped and a bonus added that was based on the company’s performance. The revised scheme was designed to encourage staff to think “enterprise first” rather than “self first.” 10
3.2. Working time
48. Setting a limit on normal working hours is essential for protecting workers’ health and safety and for ensuring they have sufficient time to devote to their families and other responsibilities and interests. The ILO recently examined working time laws in 109 member States and found that the primary method for limiting working hours is by statute. Almost all countries have limits on weekly working hours, either 40 hours or 48 hours, with the former limit dominant. More than 40 per cent of countries had an upper limit of 40 hours or less. Among the others, about equal numbers had 42- to 45-hour limits or a 48-hour week. 11 Data suggest that most oil workers belong to a group with longer working hours.
49. In Nigeria, oil workers work a 40-hour week with two days off. However, many oil workers in the rest of the world work longer hours. Table 3.6 shows working hours in different sectors in the United Kingdom in 2003. The top half of the table compares basic normal weekly hours without overtime and shows the relatively long basic working hours of those in the oil industry. In the oil extraction industry, average basic working time was over 50 hours per week.
9 C. Reynoso Castillo: Industrial relations in the oil industry in Mexico (Geneva, ILO, Sectoral Activities Programme Working Paper No. 239, 2005).
10 J. Moules: “Royal Dutch/Shell to revise staff bonus scheme”, in Financial Times (London), 30 Apr. 2004.
11 ILO: Working conditions laws 2006–07: A global review (Geneva, 2008).
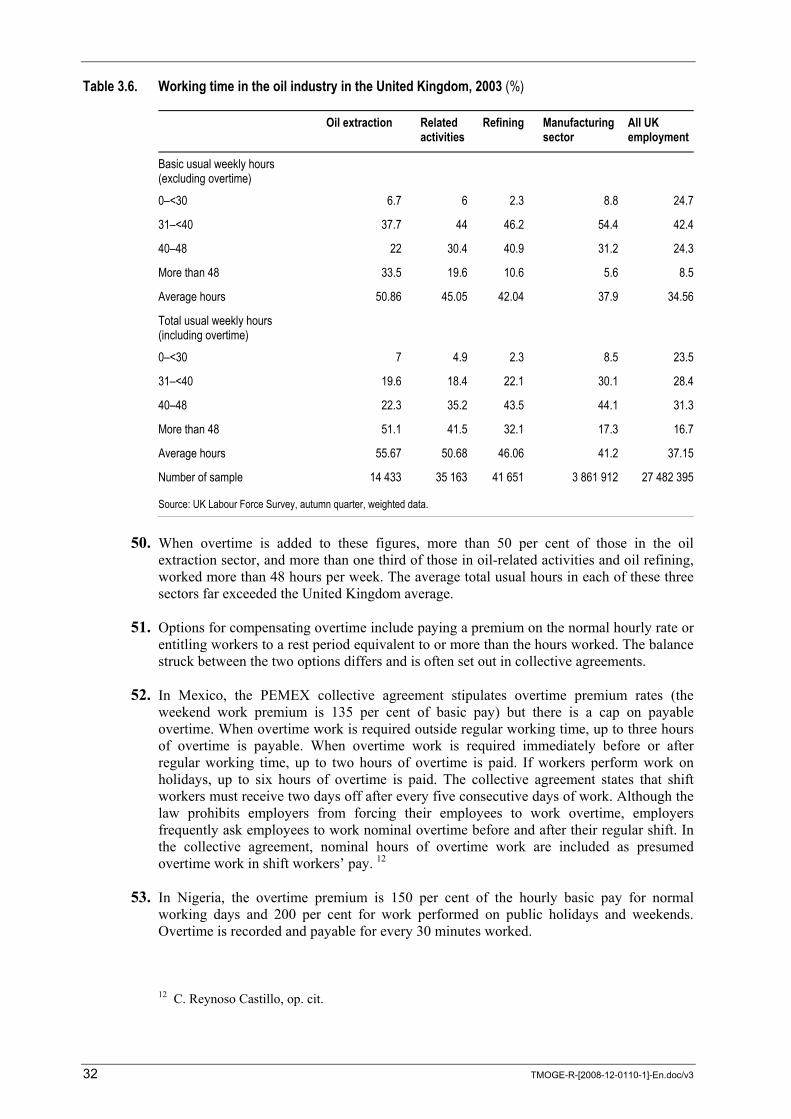
32 TMOGE-R-[2008-12-0110-1]-En.doc/v3
Table 3.6. Working time in the oil industry in the United Kingdom, 2003 (%)
Oil extraction Related activities
Refining Manufacturing sector
All UK employment
Basic usual weekly hours (excluding overtime)
0–<30 6.7 6 2.3 8.8 24.7
31–<40 37.7 44 46.2 54.4 42.4
40–48 22 30.4 40.9 31.2 24.3
More than 48 33.5 19.6 10.6 5.6 8.5
Average hours 50.86 45.05 42.04 37.9 34.56
Total usual weekly hours (including overtime)
0–<30 7 4.9 2.3 8.5 23.5
31–<40 19.6 18.4 22.1 30.1 28.4
40–48 22.3 35.2 43.5 44.1 31.3
More than 48 51.1 41.5 32.1 17.3 16.7
Average hours 55.67 50.68 46.06 41.2 37.15
Number of sample 14 433 35 163 41 651 3 861 912 27 482 395
Source: UK Labour Force Survey, autumn quarter, weighted data.
50. When overtime is added to these figures, more than 50 per cent of those in the oil extraction sector, and more than one third of those in oil-related activities and oil refining, worked more than 48 hours per week. The average total usual hours in each of these three sectors far exceeded the United Kingdom average.
51. Options for compensating overtime include paying a premium on the normal hourly rate or entitling workers to a rest period equivalent to or more than the hours worked. The balance struck between the two options differs and is often set out in collective agreements.
52. In Mexico, the PEMEX collective agreement stipulates overtime premium rates (the weekend work premium is 135 per cent of basic pay) but there is a cap on payable overtime. When overtime work is required outside regular working time, up to three hours of overtime is payable. When overtime work is required immediately before or after regular working time, up to two hours of overtime is paid. If workers perform work on holidays, up to six hours of overtime is paid. The collective agreement states that shift workers must receive two days off after every five consecutive days of work. Although the law prohibits employers from forcing their employees to work overtime, employers frequently ask employees to work nominal overtime before and after their regular shift. In the collective agreement, nominal hours of overtime work are included as presumed overtime work in shift workers’ pay. 12
53. In Nigeria, the overtime premium is 150 per cent of the hourly basic pay for normal working days and 200 per cent for work performed on public holidays and weekends. Overtime is recorded and payable for every 30 minutes worked.
12 C. Reynoso Castillo, op. cit.

TMOGE-R-[2008-12-0110-1]-En.doc/v3 33
54. As in other 24-hour a day industries, a complex and varied system of shifts and hours is required to ensure continuous operation. Where limits on normal working hours are strictest, more people will need to be employed in order to adhere to them and meet the enterprise’s needs. Where there is more flexibility, longer blocks of work are possible, compensated by a longer period of time off, within a limit averaged over a month or more. Such roster systems should be designed to address the risks of fatigue, particularly for night-shift workers, and have in place a suitable risk management system.
3.3. Annual leave
55. The ILO Holidays with Pay Convention (Revised), 1970 (No. 132), requires that workers be entitled to an annual paid holiday of not less than three working weeks. During the holiday, they must receive at least their ordinary wage, which must be paid prior to their absence. The annual vacation can be divided into more than one period, one of which must consist of at least two uninterrupted working weeks. The timing of the holiday must be determined after consultation with the employee or his or her representatives, taking into account both work requirements and the rest and relaxation opportunities available to the worker.
56. Table 3.7 shows that the average number of days paid leave per year for oil workers in the United Kingdom in 2003 was close to the national average. However, about 10 per cent of oil workers (possibly contract or temporary workers) in the oil extraction and related activities sectors received no paid leave. A higher proportion of workers in these sectors work on public holidays, reflecting the 24-hour a day operation of the industry.
Table 3.7. Paid leave entitlement and worked bank holiday payment in the oil industry in the United Kingdom, 2003
Oil extraction
Related activities
Refining Manufacturing sector
All UK employment
Average number of days of paid leave per year 33.5 34.2 32.2 29.9 33.5
Employees with 0 days paid leave (%) 10.9 10.0 3.2 1.9 4.2
Employees that worked on a bank holiday in 2003 (%) 63.3 57.1 34.3 23.6 29.0
Source: UK Labour Force Survey, autumn quarter, weighted data.
3.4. Occupational safety and health
57. In addition to common industrial risks, oil and gas workers confront potential risks to their health at work because of the flammable or poisonous nature of products which they produce. One hazardous chemical is benzene, a human carcinogen. The occupational exposure limits for benzene have been made more stringent over time. The American Conference of Governmental Industrial Hygienists’ recommended threshold limit value-time weighted average for benzene was reduced to 0.5 parts per million (ppm) (1.6 mg/m3) in 1997. The short-term exposure limit is 2.5 ppm (8mg/m3). In most countries, the permissible exposure limit for benzene is 1 ppm or less.
58. Occupational exposure to benzene and total hydrocarbons was studied in the following categories of downstream operation: refinery, pipeline, marine, rail, bulk terminals and trucks, service stations, underground storage tank, tank cleaning and site remediation. The results showed that the majority of the values were well within the acceptable limits. However, although relatively few workers are exposed, their level of exposure to benzene

34 TMOGE-R-[2008-12-0110-1]-En.doc/v3
and total hydrocarbons sometimes exceeds the respective exposure limits, particularly in marine operations, where levels reached 1,400ppm. 13
3.4.1. Fatalities in the oil and gas industry
59. The International Association of Oil and Gas Producers (OGP) assesses the safety performance of the exploration and production sector based on data from around 40 IOCs and NOCs operating in over 80 countries. The fatal accident rate (FAR) 14 in oil exploration and production (table 3.8) improved between 1997 and 2007 (except in 1998 when air accidents claimed a large number of lives). There is a big difference between company workers and contract workers as far as the rate of fatal accidents is concerned. Although the gap has been narrowing, the FAR for contract workers was still nearly more than twice that of company workers in 2007.
Table 3.8. Fatal accident rate in the oil and gas industry, 1997–2007 (per 100 million hours worked)
Year Company Contractor Overall
1997 3.30 10.90 8.40
1998 4.70 16.60 12.60
1999 4.80 8.10 7.00
2000 4.70 8.70 7.30
2001 2.40 6.40 5.10
2002 2.04 6.00 4.81
2003 2.26 6.06 4.94
2004 2.82 6.18 5.24
2005 1.25 4.36 3.53
2006 2.04 4.54 3.92
2007 1.70 3.40 3.00
Source: OGP: “Safety performance indicators – 2006 data”, Report No. 391, June 2007 and “Safety performance indicators –2007 data”, Report No. 409, May 2008.
60. Figure 3.4 shows fatalities in the oil exploration and production sector by cause between 2001 and 2007. Vehicle incidents caused the highest number of fatalities, accounting for nearly one quarter of fatalities, followed by “struck by objects at work” (21 per cent).
13 K. Dave et al.: “Benzene and total hydrocarbons exposures in the downstream petroleum industries”, in American Industrial Hygiene Association Journal, 62:176–194, 2001.
14 Fatal accident rate is the number of fatalities divided by the number of hours worked and expressed per 100 million.

TMOGE-R-[2008-12-0110-1]-En.doc/v3 35
Figure 3.4. Fatalities by cause in oil exploration and production, 2001–07
Air transport5%
Caught between objects7%
Drowning6%
Electrical6%
Explosion/burns6%
Fall9%
Other12%
Struck by objects21%
Vehicle incidents25%
Unknown3%
Source: OGP: “Safety performance indicators – 2006 data”, Report No. 391, June 2007 and “Safety performance indicators – 2007 data”, Report No. 409, May 2008.
61. Table 3.9 shows the number of onshore and offshore helicopter accidents between 2002 and 2006. As production moves further offshore, air transportation is more frequently used to transport workers. When air accidents in remote locations occur, the severity is often high because of the difficulty in providing injured workers with adequate medical care. In order to reduce the risks to oil and gas industry workers transported by air, in June 2008 the OGP published a set of recommended practices for contracted air operations, which is based on safety management systems. 15
Table 3.9. Worldwide helicopter accidents in oil exploration and production, 2002–06
No. of accidents Injury classification
Injuries Severity
Accidents Fatalities Engine related
Passengers Crew Injured Fatal
Offshore (2006) 14 4 4 14 7 10 11
Seismic (2006) 3 2 0 3 2 3 2
Pipeline (2006) 4 1 0 4 2 1 5
Other (2006) 6 2 3 7 4 7 4
2006 total 27 9 7 28 15 21 22
2005 total 27 7 7 39 18 37 20
15 “Air transportation – Recommended practices for contracted air operations”, in International Association of Oil and Gas Producers, Report No. 410, June 2008.

36 TMOGE-R-[2008-12-0110-1]-En.doc/v3
No. of accidents Injury classification
Injuries Severity
Accidents Fatalities Engine related
Passengers Crew Injured Fatal
2004 total 20 7 4 34 15 23 26
2003 total 35 13 6 70 23 41 52
2002 total 25 6 9 16 13 10 19
Source: OGP: "Safety performance of helicopter operations in the oil and gas industry – 2006 data", Report No. 402, Nov. 2007.
62. Figure 3.5 shows the three-year rolling average FAR by function between 1999 and 2007. While there has been an overall improvement, exploration and drilling each have a higher FAR than production does. Exploration is the worst performing function with a three-year rolling average FAR for 2007 of 3.77, whereas the rate for drilling was 3.66 and the rate for production was 2.22.
Figure 3.5. Fatal accident rate (FAR) by function in the oil and gas industry, 1999–2007 (three-year rolling average)
0
1
2
3
4
5
6
7
8
1999 2000 2001 2002 2003 2004 2005 2006 2007
Exploration Drilling Production
Source: OGP: “Safety performance indicators – 2007 data”, Report No. 409, May 2008, p. 62.
63. Figure 3.6 shows that workers aged between 21 and 35 years old are more frequently affected by fatal accidents than any other age group in the exploration and production sector; this may be related to their occupations. For example, a study of offshore injuries in the North Sea revealed that the risk of injury for roughnecks and roustabouts was four to five times higher than that for any other occupation and that workers under 30 years of age had a higher injury frequency rate than other age groups. 16 In May 2008, OGP reported that 159 fatalities had occurred between 2005 and 2007; of the 80 for which the gender was specified, all were male. 17
16 “The statistics of offshore safety”, in International Gas Engineering and Management, Jan./Feb. 2002, p. 8.
17 OGP: Safety performance indicators – 2007 data, Report No. 409, May 2008, p. 9.
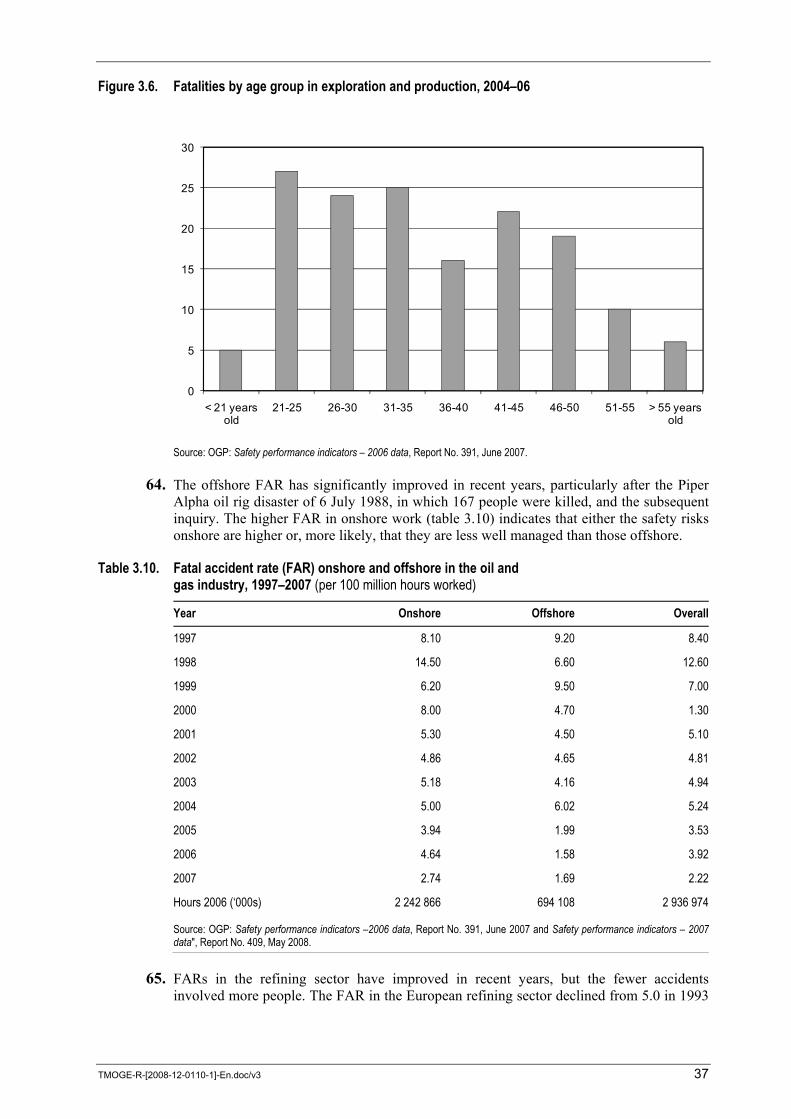
TMOGE-R-[2008-12-0110-1]-En.doc/v3 37
Figure 3.6. Fatalities by age group in exploration and production, 2004–06
0
5
10
15
20
25
30
< 21 years old
21-25 26-30 31-35 36-40 41-45 46-50 51-55 > 55 years old
Source: OGP: Safety performance indicators – 2006 data, Report No. 391, June 2007.
64. The offshore FAR has significantly improved in recent years, particularly after the Piper Alpha oil rig disaster of 6 July 1988, in which 167 people were killed, and the subsequent inquiry. The higher FAR in onshore work (table 3.10) indicates that either the safety risks onshore are higher or, more likely, that they are less well managed than those offshore.
Table 3.10. Fatal accident rate (FAR) onshore and offshore in the oil and gas industry, 1997–2007 (per 100 million hours worked)
Year Onshore Offshore Overall
1997 8.10 9.20 8.40
1998 14.50 6.60 12.60
1999 6.20 9.50 7.00
2000 8.00 4.70 1.30
2001 5.30 4.50 5.10
2002 4.86 4.65 4.81
2003 5.18 4.16 4.94
2004 5.00 6.02 5.24
2005 3.94 1.99 3.53
2006 4.64 1.58 3.92
2007 2.74 1.69 2.22
Hours 2006 (‘000s) 2 242 866 694 108 2 936 974
Source: OGP: Safety performance indicators –2006 data, Report No. 391, June 2007 and Safety performance indicators – 2007 data", Report No. 409, May 2008.
65. FARs in the refining sector have improved in recent years, but the fewer accidents involved more people. The FAR in the European refining sector declined from 5.0 in 1993

38 TMOGE-R-[2008-12-0110-1]-En.doc/v3
to 2.8 in 2001 (table 3.11). However, the lost workday injury severity (LWIS) 18 rate remained high and relatively stable.
Table 3.11. European downstream oil industry safety performance, 1993–2006
Year Fatalities Fatal accident rate (FAR)
All injury frequency (AIF)
Lost workday injury frequency (LWIF)
Lost workday injury severity (LWIS)
Road accident rate (RAR)
1993 18 5.0 7.9 4.7 27 3.8
1994 19 5.4 7.4 4.0 25 3.1
1995 13 3.5 11.2 4.6 24 2.6
1996 14 3.3 10.7 4.7 19 2.0
1997 15 3.4 11.4 4.6 23 1.9
1998 12 2.6 9.9 4.5 22 1.5
1999 8 1.8 9.4 4.3 21 0.9
2000 13 2.7 8.8 4.3 25 0.9
2001 14 2.8 9.5 4.3 24 0.8
2002 16 3.3 6.9 3.9 23 1.1
2003 22 4.1 6.3 3.2 30 1.0
2004 12 2.3 6.3 3.2 33 1.0
2005 11 1.9 4.5 2.6 35 0.9
2006 7 1.5 4.6 2.5 30 1.6
Average 14 3.0 8.0 3.9 25 1.3
Source: Oil Companies’ European Association for Environment, Health and Safety in Refining and Distribution (CONCAWE): European downstream oil industry safety performance: Statistical summary of reported incidents – 2006, March 2008, p. 8.
3.4.2. Safety culture
66. In the oil industry, particularly in the offshore oil and gas exploration and production sector, the concept of safety culture has received increased attention, triggered by the findings of the inquiry into the Piper Alpha oil rig disaster. Lord Cullen, who chaired the inquiry, stressed that: “It is essential to create a corporate atmosphere or culture in which safety is understood to be, and accepted as, the number one priority.” 19 To achieve a sound safety culture, executive leadership and senior management commitment are important. Moreover, workforce involvement is an important indicator of senior management’s competence in developing and implementing a positive safety culture. Some recent cases, however, indicate that safety culture is not ubiquitous in the oil industry.
18 Lost workday injury frequency is calculated from the number of lost workday injuries divided by the number of hours worked, expressed in millions.
19 K. Mearns et al.: “Measuring safety climate on offshore installations”, in Work and Stress, Vol. 12, No. 3, 1998, p. 238.

TMOGE-R-[2008-12-0110-1]-En.doc/v3 39
67. In Kuwait, in 2000, two major accidents at the Mina al-Ahmadi and Shuaiba refineries, as well as a number of smaller accidents, raised concerns about safety management at the Kuwait Oil Company. These intensified following an explosion in January 2002 at an oil-gathering centre in the Raudhatain oilfield in northern Kuwait. Four people were killed and 20 injured in the explosion and the most technically advanced and expensive parts of the gathering centre were damaged. There were competing explanations for the accidents, including deterioration in production infrastructure and the need for technical upgrading. However, the problem was considered more likely to lie with personnel than machinery, with some arguing that the accident was the responsibility of the managers in charge of safety. 20 In October 2008, about 3,000 unionized workers of the Kuwait National Petroleum Company went on strike demanding higher wages and safer working conditions. According to the trade union, between July and September 2008, there were at least five serious accidents at the refineries, resulting in the deaths of two contractors and injuring 14 people. 21
68. There have been several accidents at the BP Texas City refinery over the past two decades, most recently in 2005 when 15 people were killed and over 170 were injured. The refinery had an output of 430,000 barrels a day with a company workforce of 2,100 and 5,000 contractors on site each day. Prior to 2005, following the implementation of a number of initiatives, the accident rate in BP globally had been steadily declining (figure 3.7).
Figure 3.7. Safety performance at BP, 1987–2004
Source: K. Lucas: “BP’s journey following the Texas City incident”, New South Wales Minerals Council Health and Safety Conference, Leura, New South Wales, Australia, 11–14 May 2008.
20 “Kuwait: Oilfield accidents exacerbate doubts”, in Oxford Analytica, 22 Mar. 2002.
21 “Strike expected to cripple Kuwait refineries”, in Oilgram News, Vol. 86, Number 2005, 16 Oct. 2008, p. 1.
40 TMOGE-R-[2008-12-0110-1]-En.doc/v3
69. BP’s internal investigation into the Texas City disaster, published in December 2005, found a number of underlying causes. Over the years, the working environment had eroded to one characterized by resistance to change and lacking in trust, motivation and a sense of purpose. Coupled with unclear expectations around supervisory and management behaviours, this meant that rules were not consistently followed, rigour was lacking and individuals felt disempowered from suggesting or initiating improvements. Process safety operations and systemic risk reduction priorities had not been set and consistently reinforced by management. Many changes in a complex organization had led to a lack of clear accountabilities and poor communication, which together resulted in confusion in the workforce over roles and responsibilities. A poor level of hazard awareness and understanding of process safety resulted in people accepting levels of risk that were consistently higher than in comparable installations. Given the poor vertical communication and performance management process, there was neither an adequate early warning system of problems, nor any independent means of understanding the deteriorating standards in the plant. 22
70. Some criticisms of BP centred on the management’s philosophy of focusing intensively on containing costs and pursuing profits while giving occupational safety and health a lower profile within the company operations. 23 There were three external reviews of the accident. The Independent Safety Review Panel headed by James Baker published its findings in 2007 24 and made recommendations in a number of key areas, which included process safety leadership; the process safety management system; safety knowledge and expertise; and safety culture. Some of the recommendations in these categories are reproduced in box 3.1.
22 www.bp.com/genericarticle.do?categoryId=9005029&contentId=7015905.
23 S. Reed: “BP feels the heat”, in Business Week, 22 Jan. 2007, pp. 52–53.
24 Report of the BP US Refineries Independent Safety Review Panel, Jan. 2007, www.bp.com/ bakerpanelreport.

TMOGE-R-[2008-12-0110-1]-En.doc/v3 41
Box 3.1 Recommendations by BP US Refineries Independent Safety Review Panel (Baker Panel)
Leadership – Setting direction and making visible commitment
Leaders must set the direction of and make a visible commitment to leadership; set the process safety “tone at the top”; and establish appropriate process safety goals matched by action.
Clearly define expectations and strengthen accountability for process safety performance at all levels in executive management and in the refining managerial and supervisory reporting line, e.g. align pay, performance and promotion practices with process safety outcomes.
Similar to BP’s approach to climate change, aim to transform the company into a recognized industry leader in process safety management.
Manage process safety as an integrated and comprehensive system
Establish a system that systematically and continuously identifies, reduces and manages process safety risks at its US refineries.
Develop and periodically update a set of leading and lagging indicators for the more effective monitoring of the process safety performance of the US refineries; work with key internal and external stakeholders to develop consensus indicators for refining and chemical processing industries.
Establish and implement an effective system to audit process safety performance at its US refineries, e.g. audits should include a periodic review independent of BP.
The board should oversee implementation of recommendations and performance of US refinery process safety; engage an independent third party to report progress annually in respect of recommendations to the board. The board should report performance and progress publicly.
People – Process safety knowledge and expertise
Develop and implement a system to ensure appropriate levels of process safety knowledge and expertise at all levels, e.g.: identify levels of knowledge required and ensure capabilities as needed with input from key stakeholders.
Provide more effective and better coordinated process safety support for US refinery line organization.
People – Process safety culture
Involve the relevant stakeholders in the development of a positive, trusting and open process safety culture at each refinery, e.g. promote two-way communication; create a climate where tough questions are welcomed.
Source: http://bp.com/genericarticle.do?categoryId=2012968&contentId=7027577.
71. The Panel recognized that the task ahead of BP was considerable and would take a concerted and sustained effort. It believed, however, that the BP workforce was ready, willing and able to participate in a sustained, corporate-wide effort to move BP towards excellence in process safety performance. BP made a commitment to implement the Panel’s recommendations, many of which were consistent with BP’s internal reviews. As far as the recommendations on people are concerned, BP focused immediately on leadership, culture change and communications. By early 2008, BP had totally revamped the training programme with 30 new instructors and had implemented nearly 300,000 hours of leadership and other training, More than 400 new people had been hired. By the end of 2007, BP had achieved 18.8 million hours worked under its entirely revamped safety system, three times that of the average US refinery. 25
25 K. Lucas: “BP’s journey following the Texas City incident”, New South Wales Minerals Council Health and Safety Conference, Leura, New South Wales, Australia, 11–14 May 2008.

42 TMOGE-R-[2008-12-0110-1]-En.doc/v3
3.4.3. Initiatives on HIV/AIDS
72. The HIV/AIDS epidemic presents a formidable challenge to development and social progress. The ILO has estimated that the global workforce lost 28 million economically active people by 2005 due to HIV/AIDS. If action is not taken, 48 million workers will be lost by 2010 and 74 million by 2015. Moreover, it is the most productive segment of the labour force that is affected by HIV/AIDS. 26 The OGP has developed a set of guidelines to assist in the development and application of measures to control HIV, hepatitis B and hepatitis C in the industry. They are also intended to serve as guidelines for the management of personnel who have been exposed and may subsequently develop the disease and a reference document for employees who wish to know about the safeguards that are put in place. OGP members participated in the preparatory work to ensure that their collective experience is used and that the guidelines have wide acceptance. 27 The International Petroleum Industry Environmental Conservation Association (IPIECA) also promotes HIV/AIDS preventive activities in the oil and gas industry. 28
73. The policy and strategic objectives of the OGP guidelines reflect the key principles of the ILO code of practice on HIV/AIDS and the world of work. The ILO code of practice complements the guidelines and could be used by OGP members as additional resource material for education and training purposes. The ILO code makes it clear that HIV/AIDS screening should never be required of workers or job applicants and should not be a condition for contract renewal. On the other hand, voluntary counselling and testing is a key element in HIV prevention and is encouraged by many workplace programmes. 29
3.5. Family-friendly initiatives
74. It is said that offshore oil and gas workers have three ways of life – their life at work, the life of their partner and the rest of their family at home and their family life together. 30 This is one of the reasons why the oil industry has promoted family-friendly initiatives which are predominately targeted at core workers.
75. Family-friendly initiatives in the oil industry today are more than symbolic; they are a precursor to a deeper, more systematic move away from an ad hoc approach to addressing the problems relating to work in the oil industry. Family-friendly initiatives are construed as a new form of company perk, giving one employer an advantage over another in areas of recruitment and the retention of highly qualified workers. A study of the 18 major oil companies showed that: one had its own workplace nursery; two others were reviewing
26 ILO: HIV/AIDS and employment (Geneva, ILO/AIDS brief, Sep. 2005, p. 1).
27 OGP: Guidelines for the control of HIV, Hepatitis B and C in the workplace, OGP Report No. 6.55/321, Nov. 2001.
28 IPIECA: Knowledge, policy and action – HIV/AIDS management in the oil and gas industry, 2005.
29 Tripartite Interregional Meeting on Best Practices in HIV/AIDS Workplace Policies and Programmes, 15–17 December 2003 (Geneva, ILO).
30 J.S. James: “Social and economic impacts of OCS activities on individual and families, Part I: Offshore employment as lifestyle and culture – Work and family in New Iberia”, Manuscript, Bureau of Applied Research in Anthropology, University of Arizona, 2000, cited in A. Mikkelsen et al.: “Working time arrangements and safety for offshore workers in the North Sea”, in Safety Science, Vol. 42, issue 3 (Mar. 2004), p. 172.
TMOGE-R-[2008-12-0110-1]-En.doc/v3 43
childcare policies with a view to introducing nursery vouchers or other direct childcare benefits; several provided spouse employment support or advice; and a number had introduced flexitime and enhanced maternity, dependant and parental leave and career breaks. One company offered women employees substantial “returners” bonuses after childbirth. Part-time or reduced working hours were described as gaining acceptance and job-sharing at the managerial level had been initiated in one company; another was introducing a nine-day fortnight. 31
76. The case of PanCanadian Petroleum shows that two-way engagements are required for a successful implementation of family-friendly initiatives. The key elements of the company’s family support programme are: employee-centred initiatives with dialogue; a commitment to trusting and valuing employees; and bottom-up and top-down participation. First, the company demonstrated that employees are a valuable resource which can have a positive impact on the bottom line of its balance sheet. Second, since the work–life balance and initiatives to promote well-being were designed to encourage participation and innovation at all levels, the company benefits from the momentum generated by bottom-up and top-down involvement. Senior managers regularly participate in committees, attend events to promote well-being, and provide financial support to the initiatives, while employees take responsibility for implementing internal initiatives that support their own work–life balance priorities. In addition, the company realized that any good initiative needed monitoring and evaluation if it was going to continue to improve. Therefore, the company found better ways to track the usage of and satisfaction with its balance strategies and aims to incorporate that feedback into efforts to constantly improve its programmes. 32
3.6. Working conditions in offshore work
77. Offshore oil workers spend extended periods, often one or more weeks, at their workplace, for instance on a production platform or a drilling rig. They then go home for a non-work period, also of one or more weeks. Offshore accommodation, recreational facilities and food are provided by the employer as is transportation between the workplace and an onshore pick-up point, which is normally a heliport. Transportation arrangements can have two major effects on workers and their families. First, as figure 3.4. and table 3.9 show, fatal accidents during vehicle and air travel remain high. Safety concerns about helicopter travel are a major cause of stress in harsh and deep-water environments, with implications for both the workers and their families. Transportation schedules can be inconvenient from worker and family perspectives and disruptions can delay the worker’s return home and departure to the workplace, creating stress for all family members. Offshore workers are also at risk from other threats such as insurgent attacks targeting energy infrastructure to achieve political and economic aims, uncontrolled gang and criminal activity, organized criminal activity, actions by domestic extremist groups and international terrorism. Tribal action and banditry remain a problem in many countries, while the kidnapping of personnel for political and economic gain continues unabated in many countries. For example, in October 2008, nine Chinese oil workers employed by the China National Petroleum Corporation (CNPC) were kidnapped near Sudan’s disputed central oil district
31 L. McKee et al.: “‘Family friendly’ policies and practices in the oil and gas industry: Employers’ perspectives”, in Work, Employment and Society, Vol. 14, No. 3, 2000, pp. 557–571.
32 Work–life balance in Canadian workplaces: PanCanadian Petroleum, Human Resources and Skills Development Canada, 2009, www.hrsdc.gc.ca/eng/lp/spila/wlb/ell/12pancanadian_petroleum.shtml.
44 TMOGE-R-[2008-12-0110-1]-En.doc/v3
of Abyei. 33 It is reported that the kidnappers wanted the CNPC to leave the area in return for the hostages’ release. 34
78. Offshore work has implications with regard to a variety of working conditions issues; for example, factors such as the location, size and type of rig or platform have an impact on the psychological well-being of offshore workers. Generally speaking, newer platforms have improved design standards, recreational facilities, accommodation, emergency response systems and escape equipment and tend to attract more highly motivated and adaptable workers.
79. Offshore workers are also exposed to physical stressors such as heat, cold, noise, vibration, poor lighting and ventilation, confined living and working spaces and adverse weather conditions. There is a correlation between ratings of noise and other environmental stressors and measures of psychological well-being, although this may be complicated by the perceived workload. In Siberia, the air temperature at ground level can reach minus 60°C and more than 11,000 people are hospitalized for hypothermia or frostbite each year. 35 The physical and social environment of the accommodation is an important factor in the quality of life and stress levels of offshore workers. To address these harsh work environments, the OGP has published recommendations and studies on cold, 36 heat, 37 substance abuse 38 and strategic health management. 39 A set of guidelines for the development and application of health, safety and environmental management systems has also been published. 40
80. Offshore work challenges workers and their families in various ways and leads some to experience psychosocial problems. Offshore work removes people from their communities, affecting their ability to participate in and contribute to formal and informal social events and networks. It also poses particular challenges for those responsible for or involved with providing services in this regard, but many workers and family members have to deal with the problems themselves.
81. The home-life problems of many long-distance commuting workers are in reality work problems, and domestic problems can be manifested in the workplace. Workers often bring
33 “Chinese oil workers kidnapped in Sudan”, in Oilgram News, Vol. 86, No. 208, 21 Oct. 2008, p. 2.
34 “Sudan rebels demand China companies’ exit”, in Oilgram News, Vol. 86, No. 212, 27 Oct. 2008, p. 5.
35 V. Chaschi: “Work in the cold: A review of Russian experience in the North”, in Barents, Vol. 1, No. 3, 1998, pp. 80–82.
36 Exploration and Production (E&P) Forum: Health aspects of work in extreme climates within the E&P industry: The cold; Report No. 6.65/270, Jan. 1998.
37 E&P Forum: Health aspects of work in extreme climates within the E&P industry: The heat; Report No. 6.70/279, Sep. 1998.
38 OGP: Substance abuse: Guidelines for management, Report No. 6.87/306, June 2000.
39 OGP: Strategic health management: Principles and guidelines for the oil and gas industry, Report No. 6.88/307, June 2000.
40 E&P Forum: Guidelines for the development and application of health, safety and environment management systems, Report No. 6.36/201.

TMOGE-R-[2008-12-0110-1]-En.doc/v3 45
home work-related concerns and stress, and the commuting system generates its own tensions in domestic and personal life. These tensions are, in turn, brought back to the workplace, where they may affect productivity, safety, morale and retention.
82. New forms of work organization raise concerns because they have sometimes affected the credibility of workers’ safety functions (workers’ safety committees) on offshore oil platforms. A study of the correlation between workload and safety on offshore platforms, following the introduction of multiskilling and new forms of work organization, showed that there was a change in the composition of personnel and the work during the four years under review, with workers having to perform a broader range of work tasks than before. The study found that, as well as potential areas for improvements in offshore safety, workers’ stress factors have to be taken into account. These include: the extent to which they have the opportunity to influence the decisions made by supervisors; the extent to which they are consulted before decisions are made; and the extent to which they are informed about what takes place on the platforms. 41
83. Some other challenges which offshore oil workers encounter on a daily basis are discussed below.
3.6.1. Shift-work arrangements and health effects
84. Twelve-hour shifts, whether fixed or rotating, are well established on offshore oil rigs. However, there is a wide variety of shift and rest combinations, some of which, if not properly designed, carry inherent risks of fatigue. In Indonesia, many workers on offshore platforms work a shift comprising a rotating 8-hour shift for 14 days offshore, followed by 14 days rest onshore. In addition, there are some irregular shift work arrangements. Some oil companies have a “three week on, two week off”, or “one week on, one week off” rotation. Workers are likely to stay at remote sites for longer periods, up to six weeks in a few cases, followed by several weeks off. In 2005, PT Caltex Pacific Indonesia changed the working time arrangements for oilfield workers from ten days on duty and five days off, working a 12-hour shift, to five days and two days respectively, also with a 12-hour shift. 42
85. Many studies on the health effects of various shift arrangements offshore found that the adverse health effects were in the “less serious” category, although it is known that prolonged shift work can have cumulative adverse effects on sleep patterns and health. 43 Concerning the health effects on alertness of moving from eight to 12-hour shifts, studies have not found serious adverse health effects to offshore oil workers. 44 But there are health and social risks that need to be recognized and addressed when determining shift patterns and, more importantly, managed if normal hours are exceeded. An early study followed seven employees working 12-hour shifts on a North Sea offshore installation on a 14-day rotation. While physiological tests showed initial fatigue (adjusting to offshore
41 T. Rundmo et al.: “Organisational factors, safety attitudes and workload among offshore oil personnel”, in Safety Science, Vol. No. 29 (1998), pp. 75–87.
42 R. Pratiwi Anwar and M. Ssenyonga, op. cit.
43 M. Moore Ede et al. (ed.): The practical guide to managing 24-hour operations (Boston, Circadian Information, 1999), pp. 36–39.
44 M.D. Johnson and J. Sharit: “Impact of a change from an 8-hour to a 12-hour shift schedule on workers and occupational injury rates”, in International Journal of Industrial Ergonomics, Vol. 27, No. 5 (2001), pp. 303–319.

46 TMOGE-R-[2008-12-0110-1]-En.doc/v3
nightshifts), the workers adjusted quickly to the new working conditions in terms of sleep and alertness. The study noted, however, that the workers experienced increased drowsiness immediately after they finished their work shift. This was directly related to the complications of going off work from a night shift and adjusting to the standard rhythms of daily life. 45 A more recent study found that the number of accidents remained unchanged following a change in working-time arrangements for offshore workers from asymmetric shift work schedules with two weeks of offshore work followed by three weeks at home, then two weeks of offshore work followed by four weeks at home, to a new, symmetrical rotation of two weeks of offshore work and four weeks off. However, the study noted an increase in the number of incidents requiring first-aid treatment during the whole working period. 46
3.6.2. Offshore safety and dialogue
86. In July 2008, on the 20th anniversary of the Piper Alpha disaster, the Government of the United Kingdom asked the Health and Safety Executive to review progress made in health and safety in the offshore oil industry in the country. 47 The outcome is awaited with interest throughout the industry. Offshore safety and health matters are frequently discussed in the context of the Norwegian and the United Kingdom oil industries’ approaches. In the United Kingdom, oil companies have set up consultative committees to address employer–employee relations matters without involving trade unions. 48 By contrast, in Norway, trade unions have long played an important role in offshore safety. Workers’ participation in safety management was enshrined in Norway’s amendments to offshore oil and gas regulations in 1998 (box 3.2). In the offshore working environment regulations, the purpose of joint local working environment committees on each installation is not only to ensure coordination of the protection and environment efforts within the individual enterprises, but also to provide all employees, irrespective of their employment conditions, with a real opportunity to take part in and exercise influence on the protection and environment efforts at their own workplace. 49 This takes account of the complexity of employment relations issues where multiple employers and contractors are involved.
45 B. Bjorvatn et al.: “Rapid adaptation to night work at an oil platform, but slow re-adaptation following return home”, in Journal of Occupational and Environmental Medicine, 60, 1998, pp. 601–608.
46 A. Mikkelsen et al.: “Working time arrangements and safety for offshore workers in the North Sea”, in Safety Science, Vol. 42 (2004), pp. 167–184.
47 ITUC Online, July 2008.
48 C. Wright and M. Spaven: “Who represents whom? The consequences of the exclusion of unions from the safety representation system in the UK offshore oil and gas industry”, in Employee Relations, Vol. 21, No. 1, 1999, pp. 45–62.
49 Information provided by the Norwegian Petroleum Directorate.

TMOGE-R-[2008-12-0110-1]-En.doc/v3 47
Box 3.2 Worker involvement in safety and health – The Norwegian working environment legislation
In Norway, the requirements for worker involvement in health and safety are enshrined in the Working Environment Act, 1977 (WEA), and related regulations for safety delegates and working environment committees. The WEA lists three objectives:
(1) To secure a working environment which affords employees full protection against harmful, physical and mental influences and which has safety, occupational health and welfare standards that are concurrent with the technological and social development of society at any time.
(2) To secure sound employment conditions and a meaningful work situation for the individual employee.
(3) To provide a basis whereby the enterprises themselves can solve their working environment problems in cooperation with the organizations of employers and employees and with control and guidance from public authorities.
According to the WEA, any organization with more than ten employees must have safety delegates for each department and shift, with a senior safety delegate to coordinate their activities. A safety delegate’s rights include: consultation over the planning and implementation of safety programmes; having information at all times; attendance at labour inspections; and the power to stop dangerous work without any liability for losses suffered as a result. This power to stop production in the high cost context of oil and gas production injects real meaning into the concept of worker involvement.
The WEA also requires that workplaces with over 50 employees establish working environment committees with equal employer and employee representation and the inclusion of (non-voting) safety and health representatives. Those with between 20 and 50 employees must have a committee if either of the parties requests one, and any senior safety delegates must sit on it. According to WEA regulations, the committee has decision-making powers as well as being advisory, and it “… [shall] participate in preparing programmes for safety and environment work ... inspect the enterprise to chart and evaluate the need for safety and environment measures … give advice concerning the priority ranking of the enterprise’s plans … and may propose new measures.”
It also has the power to force the employer’s compliance with the WEA and the right to access to any labour inspection and police inquiry documents.
Source: S.M. Hart: “Norwegian workforce involvement in safety offshore: Regulatory framework and participants’ perspectives” in Employee Relations, Vol. 24, Issue 5, 2002, pp. 486–499.
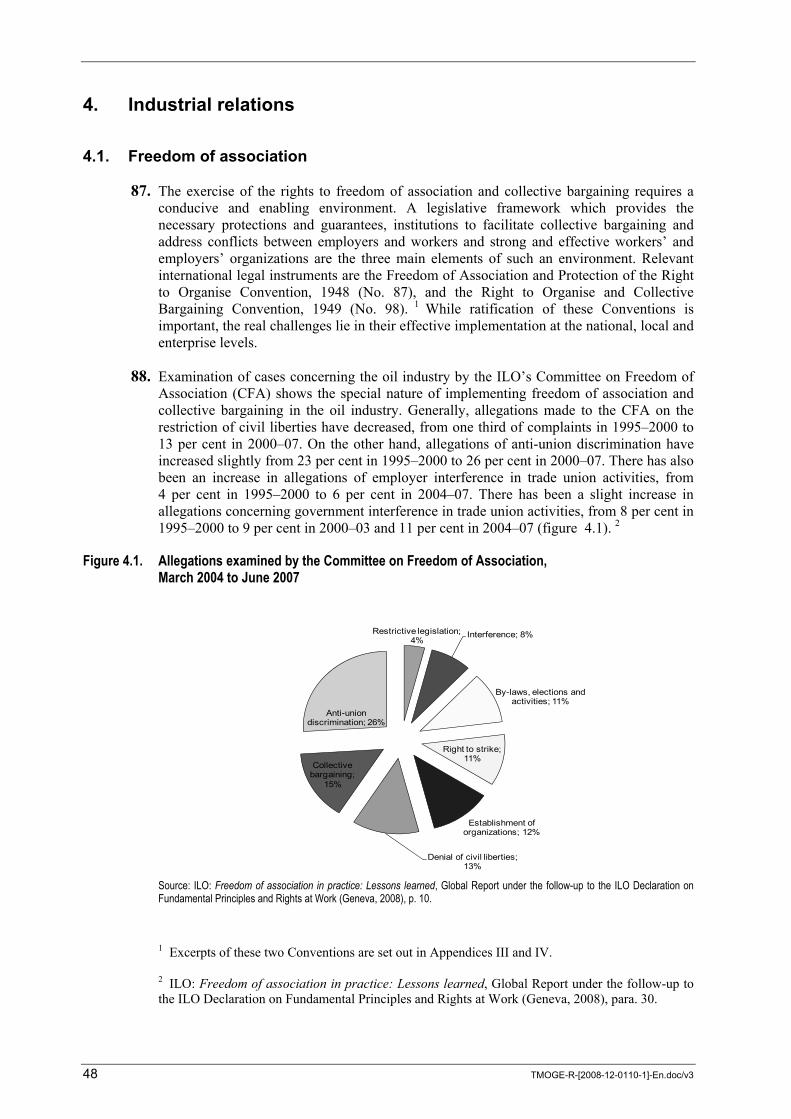
48 TMOGE-R-[2008-12-0110-1]-En.doc/v3
4. Industrial relations
4.1. Freedom of association
87. The exercise of the rights to freedom of association and collective bargaining requires a conducive and enabling environment. A legislative framework which provides the necessary protections and guarantees, institutions to facilitate collective bargaining and address conflicts between employers and workers and strong and effective workers’ and employers’ organizations are the three main elements of such an environment. Relevant international legal instruments are the Freedom of Association and Protection of the Right to Organise Convention, 1948 (No. 87), and the Right to Organise and Collective Bargaining Convention, 1949 (No. 98). 1 While ratification of these Conventions is important, the real challenges lie in their effective implementation at the national, local and enterprise levels.
88. Examination of cases concerning the oil industry by the ILO’s Committee on Freedom of Association (CFA) shows the special nature of implementing freedom of association and collective bargaining in the oil industry. Generally, allegations made to the CFA on the restriction of civil liberties have decreased, from one third of complaints in 1995–2000 to 13 per cent in 2000–07. On the other hand, allegations of anti-union discrimination have increased slightly from 23 per cent in 1995–2000 to 26 per cent in 2000–07. There has also been an increase in allegations of employer interference in trade union activities, from 4 per cent in 1995–2000 to 6 per cent in 2004–07. There has been a slight increase in allegations concerning government interference in trade union activities, from 8 per cent in 1995–2000 to 9 per cent in 2000–03 and 11 per cent in 2004–07 (figure 4.1). 2
Figure 4.1. Allegations examined by the Committee on Freedom of Association, March 2004 to June 2007
Restrictive legislation; 4%
Interference; 8%
By-laws, elections and activities; 11%
Right to strike; 11%
Establishment of organizations; 12%
Denial of civil liberties; 13%
Collective bargaining;
15%
Anti-union discrimination; 26%
Source: ILO: Freedom of association in practice: Lessons learned, Global Report under the follow-up to the ILO Declaration on Fundamental Principles and Rights at Work (Geneva, 2008), p. 10.
1 Excerpts of these two Conventions are set out in Appendices III and IV.
2 ILO: Freedom of association in practice: Lessons learned, Global Report under the follow-up to the ILO Declaration on Fundamental Principles and Rights at Work (Geneva, 2008), para. 30.

TMOGE-R-[2008-12-0110-1]-En.doc/v3 49
89. The 48 cases concerning the oil industry that were discussed in the CFA in 1950–2005 provide a different picture. There were cases involving: the denial of civil liberties; undue restrictions on the right to strike; interference by governments in the functioning of workers’ organizations; and restrictive legislation. Allegations concerning the restriction of civil liberties, the right to strike, interference and restrictive legislation accounted for two-thirds of the allegations concerning the oil industry (figure 4.2). Allegations concerning the right to strike were mostly based on the argument that, as these services are essential, there are grounds for prohibiting or restricting strikes and for placing restrictions on the principles of free and voluntary collective bargaining.
Figure 4.2. Allegations concerning the oil industry examined by the Committee on Freedom of Association, 1950–2005
Source: ILO database of international labour standards (ILOLEX).
4.1.1. Civil liberties
90. The ILO’s supervisory bodies 3 have recognized a critical relationship between the associational rights of workers’ and employers’ organizations and civil liberties. If they are to function properly, such organizations must be able to carry out their activities in a broad climate of freedom and security. Freedom of association can only be exercised in conditions in which fundamental rights, and in particular those relating to human life and personal safety, are fully respected and guaranteed. 4 The CFA has addressed allegations of violations of civil liberties in the oil industry in Argentina, China, Colombia, Ghana, Greece, Peru, Sri Lanka and the Bolivarian Republic of Venezuela. Some cases involved allegations of murder, abductions, disappearances, threats, arrests and detentions of trade union leaders and members, as well as other acts of anti-union harassment and intimidation, violation of freedom of assembly and of freedom of expression. Delays in the administration of justice were often closely linked with such violations.
3 Notably, the Committee of Experts on the Application of Conventions and Recommendations, and the Committee on Freedom of Association.
4 Digest of decisions and principles of the Freedom of Association Committee (Digest), fifth edition (Geneva, ILO, 2006), para. 43.
By-laws, elections and activities
6%
Anti -union discrimination
6%Establishment of
organizations8%
Collective bargaining
10%
Restrictive legislation 13%Interference
13%
Right to strike15%
Denial of civil liberties29%

50 TMOGE-R-[2008-12-0110-1]-En.doc/v3
91. Workers’ organizations continually express their special concerns about the situation in many oil-producing countries including Colombia. In its 2007 Annual Survey of Violations of Trade Union Rights, the International Trade Union Confederation (ITUC) reported that Colombian trade unionists have been experiencing a fully fledged humanitarian crisis. ITUC states that these trade unionists are the victims of selective, systematic and persistent violence and that the perpetrators enjoy impunity, which itself becomes an incentive for the attacks. According to ITUC, there has been little progress regarding the impunity surrounding these violent acts. Indeed, the vast majority of the violations go unpunished and many murders have not been investigated. 5
92. It is reported that 36 trade unionists were murdered in Colombia in 2007. 6 ITUC recently reported that 26 trade unionists were murdered in the first half of 2008, a 71 per cent increase over the same period in 2007. No one has been prosecuted for these murders, or for 97 per cent of the more than 2,500 murders of Colombian trade unionists since 1986. 7 It has been reported to the CFA that, like in many other industries in the country, many Colombian oil workers have lost their lives in the course of their trade union activities. 8
93. With respect to the investigations and the situation of impunity, the CFA, in general, has deplored that impunity instils a climate of fear which prevents the free exercise of trade union rights. The CFA has stressed that the rights of workers’ and employers’ organizations can only be exercised in a climate that is free from violence, pressure or threats of any kind against the leaders and members of these organizations, and it is for governments to ensure that this principle is respected. 9
94. With respect to the arrest and detention of trade unionists, the CFA has stated that arresting trade unionists may create an atmosphere of intimidation and fear that is prejudicial to the normal development of trade union activities, and that the detention of trade union leaders or members for reasons connected with their activities in defence of the interests of workers constitutes a serious interference with civil liberties in general and with trade union rights in particular. 10
95. In China, it is alleged that, in March 2002, the Government intervened in a sit-in demonstration at PetroChina’s Petroleum Administration Bureau (PAB) headquarters, in Daqing. Several representatives of the independent PAB Retrenched Workers’ Provisional Union Committee and another 60 workers involved in the protest were reportedly detained, some for up to two weeks. They were released on the condition that they would no longer participate in demonstrations. There were similar incidents in Sichuan Province. Each incident concerned workers’ claims for financial compensation, re-employment and the investigation of management corruption pursuant to a factory’s bankruptcy or restructuring. 11 The CFA noted that these incidents were followed by police interventions,
5 ITUC: 2007 Annual Survey of Violations of Trade Union Rights (Brussels, 2007).
6 ITUC: 2008 Annual Survey of Violations of Trade Union Rights (Brussels, 2008), p. 101.
7 ITUC: “ILO: Colombia appears before Conference Standards Committee”, in ITUC OnLine, Vol. 106, 3 June 2008.
8 ILO: Reports of the Committee on Freedom of Association, Nos 329 and 330, Case No. 1787.
9 ILO: Report of the Committee on Freedom of Association, No. 337, Case No. 1787, para. 535.
10 ibid., para. 484.
11 ILO: Report of the Committee on Freedom of Association, No. 330, Case No. 2189, para. 458.

TMOGE-R-[2008-12-0110-1]-En.doc/v3 51
arrests, detentions and sometimes long prison sentences for those who had participated in the protests. Nine workers were arrested and imprisoned or subjected to administrative detention and “re-education through labour”. The supervisory bodies have indicated that the inviolability of trade union premises is a civil liberty which is essential to the exercise of trade union rights and that the occupation of trade union premises by the security forces, without a court warrant authorizing such occupation, is a serious interference by the authorities in trade union activities. 12
4.1.2. The right to organize
96. The supervisory bodies consider that the freedom to establish organizations is foremost among trade union rights; it is the prerequisite without which the other guarantees in Conventions Nos 87 and 98 would remain a dead letter. Freedom of association implies the right of workers and employers to elect their representatives in full freedom and to organize their administration and activities without any interference by the public authorities. The fundamental idea of Article 3 of Convention No. 87 is that workers and employers may decide for themselves the rules which should govern the administration of their organizations and the elections which are held therein. 13
97. A frequent question concerns the government’s control of and restrictions on the use of trade union funds. The CFA has stated that provisions which give the authorities the right to restrict the freedom of a trade union to administer and utilize its funds as it wishes for normal and lawful trade union purposes are incompatible with the principles of freedom of association. 14 When examining allegations of the sealing off of the headquarters of the National Union of Petroleum and Natural Gas Workers (NUPENG) and the Petroleum and Natural Gas Senior Staff Association of Nigeria (PENGASSAN), surrounding them with police, freezing union bank accounts and suspending check-off facilities, the CFA stated that measures of administrative control over the management, such as financial audits and investigations, should be applied only in exceptional cases, when justified by grave circumstances (for instance, presumed irregularities in the annual statement or irregularities reported by members of the organization), in order to avoid any discrimination between one trade union and another and to preclude the danger of excessive intervention by the authorities which might hamper a union’s exercise of the right to avoid harmful and unjustified publicity or the disclosure of information which might be confidential. 15
4.1.3. The right to strike
98. The supervisory bodies have maintained over the years that the right to strike is one of the essential means through which workers and their organizations may promote and defend their economic and social interests. These interests not only concern better working conditions or collective claims of an occupational nature, but also the seeking of solutions
12 2006 Digest, paras 178 and 179.
13 ibid., paras 454 and 455.
14 ibid., para. 485.
15 ILO: Report of the Committee on Freedom of Association; No. 295, Case No. 1793, para. 611.

52 TMOGE-R-[2008-12-0110-1]-En.doc/v3
to economic and social policy questions and problems facing the undertaking which are of direct concern to workers. 16
99. Furthermore, the supervisory bodies have reiterated the basic position that the right to strike is an intrinsic corollary of the right to organize, as protected by Convention No. 87, which states in its Article 3 that workers’ organizations shall have the right to organize their activities and to formulate their programmes and that the public authorities shall refrain from any interference which would restrict their right or impede the lawful exercise thereof. In principle, employers and workers, and their organizations, should be left alone in resolving their disputes; the methods they decide upon are part of the organization of their activities and programmes.
100. However, the supervisory bodies have also emphasized that the right to strike cannot be considered an absolute right. In other words, it may also be governed by provisions which set conditions for, or restrict the exercise of this fundamental right. 17 According to the CFA, a strike is one of the essential means through which workers and their organizations should be able to promote and defend their economic and social claims and the suspension or prohibition of the right to strike is only acceptable if the interruption of work due to a strike would endanger the life, personal safety or health of the whole or part of the population. 18
4.1.3.1. Objectives of strike action
101. The CFA has laid down the basic principles with respect to the permissible objective of a strike, stating that strikes of a purely political nature and strikes decided systematically long before negotiations take place do not fall within the scope of the principles of freedom of association, and that while purely political strikes do not fall within the scope of the principles of freedom of association, trade unions should be able to have recourse to protest strikes, in particular where aimed at criticizing a government’s economic and social policies. 19
102. Case No. 1793 against the Government of Nigeria highlighted the distinction between the political, economic and social aspects of a strike. In this case, the two major unions in the Nigerian oil industry, NUPENG and PENGASSAN, went on strike at the beginning of July 1994 for reasons that were partly political (reinstatement of the democratically elected Chief M.K.O. Abiola to the presidency following the Nigerian national elections of June 1993), and partly economic and social in nature (calls for the withdrawal of a circular empowering employers to terminate the employment of Nigerian oil workers and replace them with expatriates, and for the redressing of various types of harassment of union members and leaders by the Government and the armed forces).
103. The Government considered the strike illegal in the light of the legislation related to the provision of essential services. It argued that the strike had been called over political matters and was calculated to sabotage a vital and essential sector of the economy. The Government maintained that the strikes were in protest against the situation in the oil
16 2006 Digest, paras 522 and 526.
17 ILO: Freedom of Association and Collective Bargaining, Report III (Part 4B), International Labour Conference, 81st Session, Geneva, 1994, para. 151.
18 ILO: Report of the Committee on Freedom of Association, No. 265, Case No. 1417, para. 300.
19 2006 Digest, paras 528 and 529.

TMOGE-R-[2008-12-0110-1]-En.doc/v3 53
industry and the results of the June 1993 national elections. The CFA concluded that a substantial part of the claims of NUPENG and PENGASSAN appeared to be of a social and economic nature, in particular with regard to the situation in the oil industry. 20
4.1.3.2. Declaring a strike illegal
104. The responsibility for declaring a strike illegal should not lie with the Government, but with an independent body which has the confidence of the parties involved. 21 In Colombia for example, the day after ECOPETROL employees affiliated to the Petroleum Industry Workers’ Trade Union (USO) went on strike in 2004, the Ministry of Social Protection, which under the law was competent to declare a collective work stoppage illegal, did so. In this case, the CFA noted the Government’s statements to the effect that it acted within the terms of national law and requested the Government to take steps to amend the relevant law and give this responsibility to an independent body. 22
4.1.3.3. Essential services
General principles
105. The right to strike may be restricted or prohibited: (a) in essential services in the strict sense of the term (that is, services the interruption of which would endanger the life, personal safety or health of whole or part of the population); 23 (b) in the public service only for public servants exercising authority in the name of the State; 24 or (c) in an acute national emergency. 25 The “essential services” argument as justification for prohibiting or restricting strikes has a special significance for the oil and gas industry.
106. As to the determination of essential services, the supervisory bodies have decided that essential services can include: the hospital sector; electricity services; water supply services; the telephone service; the police and the armed forces; the fire-fighting services; public or private prison services; the provision of food to pupils of school age and the cleaning of schools; and air traffic control. 26 The supervisory bodies have also decided that many sectors or occupations do not constitute essential services in the strict sense of
20 ILO: Report of the Committee on Freedom of Association, No. 295, Case No. 1793, paras 567–614.
21 2006 Digest, para. 628.
22 ILO: Report of the Committee on Freedom of Association, No. 337, Case No. 2355, paras 603 and 631.
23 2006 Digest, para. 583.
24 With respect to the restriction of right to strike in the public service, the Committee on Freedom of Association has acknowledged that the right to strike can be restricted or even prohibited in the public service in so far as a strike in that service could cause serious hardship to the national community and provided that the limitations are accompanied by certain compensatory guarantees.
25 The Committee on Freedom of Association has stated that a general prohibition of strikes can only be justified in the event of an acute national emergency and for a limited period of time, and restrictions on the right to strike and on freedom of expression imposed against the backdrop of an attempted coup d’état against the constitutional government, giving rise to a state of emergency called in accordance with the national constitution, do not violate freedom of association since such restrictions are justified in the event of an acute national emergency.
26 2006 Digest, para. 585.

54 TMOGE-R-[2008-12-0110-1]-En.doc/v3
the term. These include: the petroleum and gas sectors; 27 ports; the metal and mining sectors; transport generally; airline pilots; production, transport and distribution of fuel; railway services; and metropolitan transport. 28
107. These principles are illustrated in the complaint against the Government of Bahrain presented by the General Federation of Bahrain Trade Unions concerning Law No. 49 of 2006 amending certain provisions of the Trade Union Law. As amended, this law prohibited strikes in essential services which may disturb national security or disrupt the daily life of citizens. On 20 November 2006, the Prime Minister issued Decision No. 62 of 2006, which listed the essential services, including oil and gas installations, where strike action was prohibited. The CFA stated that the definition set out in Section 21(d) of the Trade Union Law was broader than the definition of essential services in the strict sense of the term. 29 The CFA also stated that what is meant by essential services in the strict sense of the term depends to a large extent on the particular circumstances prevailing in a country. Moreover, this concept is not absolute, in the sense that a non-essential service may become essential if a strike lasts beyond a certain time or extends beyond a certain scope, thus endangering the life, personal safety or health of the whole or part of the population. 30
108. Serious economic, financial and taxation losses may not constitute a defence that enables the government to prohibit strikes in the oil and gas industry as an essential sector. In the case of Norway, presented by the Norwegian Trade Union Federation of Oil Workers (OFS), the Government listed the consequences of the strike and provided an evaluation of the situation as a reason for making a strike illegal. The three-day strike by about 3,900 OFS members in mid-1990 led to the closure of all fields on the Norwegian continental shelf and the cessation of all Norwegian oil and gas production. The Government argued that, firstly, there were economic consequences since the oil sector played a crucial role for Norwegian society and it was the State rather than the oil companies that had to bear most of the loss of income. The OFS strike was estimated to incur a loss in gross production value of about 1,500 million Norwegian kroner per week, with the State suffering a loss of about 800 million kroner per week in taxes and royalties, and about 300 million kroner from its direct involvement in the petroleum industry. Secondly, the export income from the oil industry was nearly one-third of Norway’s total export income, and the State’s gross income from the petroleum sector amounted to about one-half of its expenditure on the purchase of goods and services. Since the high level of Norwegian social benefits had largely been made possible by oil revenues, a long-lasting conflict of this magnitude might undermine the basis of the welfare state. The Government also referred to the difficult employment situation as an additional factor. In setting aside the Government’s arguments, the CFA concluded that such socio-economic consequences for the population could not alone prevail over a clear and imminent threat to the life, personal safety or health of the whole or part of the population. 31
27 ILO: Report of the Committee on Freedom of Association, No. 320, Case No. 1865, para. 513; and Report No. 211, Case No. 965, para. 199.
28 2006 Digest, para. 587.
29 ILO: Report of the Committee on Freedom of Association, No. 349, Case No. 2552.
30 2006 Digest, para. 582.
31 ILO: Report of the Committee on Freedom of Association, No. 279, Case No. 1576, paras 102, 103 and 114.

TMOGE-R-[2008-12-0110-1]-En.doc/v3 55
109. Democracy and social dialogue should have a place in determining which sectors constitute essential services. In the case of Bahrain, the CFA noted that the Prime Minister had the overall authority to add to the list of essential services at any time and without any obligation to consult the social partners concerned. The CFA requested the Government to ensure that any determination of new essential services be made in full consultation with the representative workers’ and employers’ organizations and in accordance with the principles of freedom of association. 32
Compensatory guarantees
110. As regards the nature of appropriate guarantees where restrictions are placed on the right to strike in essential services and the public service, such restrictions should be accompanied by adequate, impartial and speedy conciliation and arbitration proceedings in which the parties concerned can take part at every stage and in which the awards, once made, are fully and promptly implemented. 33 Employees deprived of the right to strike because they perform essential services must have appropriate guarantees to safeguard their interests, including a corresponding denial of the right of lockout, provision of joint conciliation procedures and where, and only where, conciliation fails, the provision of joint arbitration machinery. Referring to its recommendation that restrictions on the right to strike would be acceptable if accompanied by conciliation and arbitration procedures, the CFA has made it clear that this recommendation does not refer to the absolute prohibition of the right to strike, but to the restriction of that right in essential services or in the public service, in relation to which adequate guarantees should be provided to safeguard the workers’ interests. 34
Requirement for minimum services
111. According to the CFA, minimum levels of service in the case of strike action should be established only: when the interruption of the services would endanger the life, personal safety or health of whole or part of the population (essential services in the strict sense of the term); when services which are not essential in the strict sense of the term but where the extent and duration of a strike might be such as to result in an acute national crisis endangering the normal living conditions of the population are affected; and when public services of fundamental importance are affected. 35 Such a minimum service should be confined to operations that are strictly necessary to avoid endangering the life or normal living conditions of the whole or part of the population. 36
112. The determination of minimum services and the minimum number of workers providing them should involve not only the public authorities, but also the relevant employers’ and workers’ organizations. This not only allows a careful exchange of viewpoints on what in a given situation can be considered to be the minimum services that are strictly necessary, but also contributes to guaranteeing that the scope of the minimum service does not result in the strike becoming ineffective in practice because of its limited impact, and to
32 ibid., Report No. 349, Case No. 2552, para. 423.
33 Digest, para. 596.
34 2006 Digest, paras 600 and 601.
35 ibid., para. 606.
36 ILO: Report of the Committee on Freedom of Association, No. 327, Case No. 1865, para. 488; and Report No. 337, Case No. 2355, para. 630.

56 TMOGE-R-[2008-12-0110-1]-En.doc/v3
dissipating possible impressions in the trade union organizations that a strike has come to nothing because of over-generous and unilaterally fixed minimum services. 37
Compulsory arbitration
113. Compulsory arbitration to end a collective labour dispute and a strike is acceptable if it is at the request of both parties involved in a dispute, or if the strike in question may be restricted, even banned, i.e. in the case of disputes in essential services in the strict sense of the term. 38 In the abovementioned case of Norway (Case No. 1576), one of the issues was whether the Government’s intervention in collective bargaining was imposed by compulsory arbitration during the strike or through government intervention 36 hours after the beginning of the work stoppage. Noting that it had dealt with many cases concerning compulsory arbitration in Norway and recognizing that there was a familiar pattern in the way which the Government imposed compulsory arbitration, the CFA expressed doubts as to the compelling need to have had recourse to compulsory arbitration. Additionally, the CFA requested the Government and the social partners give priority to collective bargaining as the means of determining employment conditions. 39
4.1.4. State interference
114. Cases before the supervisory bodies have concerned a variety of types of governmental interference in the full exercise of freedom of association, including: the dissolution and suspension of organizations; interference in the establishment of federations; limitations on international affiliation; inference in the drawing up of organization constitutions and rules; interference in the free election of trade union leaders; and the failure to protect against acts of interference.
115. In the oil industry, some of the most disputed areas are the dissolution and suspension of trade union organizations and dismissals of trade union officials and trade union members. In a case presented against the Government of Argentina by the Federation of the United Petroleum Trade Unions of the State, with respect to the dissolution and suspension of trade union organizations, the CFA stated that the right guaranteed to workers’ organizations by Article 3 of Convention No. 87, and the obligation imposed thereby upon the public authorities to refrain from any interference that would restrict that right or impede the lawful exercise thereof, did not mean that trade union leaders should be exempt from any supervision aimed at ensuring that their actions complied with the existing legislation or with the union’s statutes; nevertheless, it was of the greatest importance that, in order to guarantee an impartial and objective procedure, such control should be exercised by the relevant judicial authority. 40 Measures of dissolution by administrative authorities constitute serious infringements of the principles of freedom of association. The cancellation of an organization by the registrar of trade unions is tantamount to the dissolution by administrative authority. Deregistration measures, even when justified, should not exclude the possibility of a union application for registration to be entertained once a normal situation has been re-established. Legislation which accords the minister complete discretionary power to order the cancellation of the registration of a trade union,
37 2006 Digest, para. 612.
38 2006 Digest, para. 564.
39 ILO: Report of the Committee on Freedom of Association, No. 279, Case No. 1576, paras 111–118.
40 ILO: Report of the Committee on Freedom of Association, No. 128, Case No. 651, para. 57.

TMOGE-R-[2008-12-0110-1]-En.doc/v3 57
without any right of appeal to the courts, is contrary to the principles of freedom of association. 41
116. The case of Argentina is a leading and settled case which is an example of the state interference in the oil industry. In the case, the Government allegedly intervened in trade union administration when it took over the offices of the Federation and its branches in Buenos Aires and Ensenada, on the grounds that there were serious irregularities in the administration of these organizations and repeated infringements of the laws and regulations. Prior to the takeover, the Government had ordered an inquiry into the bank accounts of the Federation and of its Buenos Aires branch. The Federation was not notified of the results of this inquiry, nor was it called upon to present defend any charges that might have been made against it. Once the Federation had been taken over, the Government appointed a controller to manage the union. Between October and December 1970, all the funds of the Federation were frozen and it was unable to meet its financial commitments. The controller did not comply with the terms of reference given to him when the takeover of the Federation had been ordered – he should have convened the Central Executive Board of the Federation to decide on appropriate measures to restore the situation, but he did not, and closed the headquarters of the Federation. Military officials had exerted pressure on various members of the Central Executive Board in an attempt to persuade them to appoint a certain person as General Secretary of the union. Subsequently, the controller convened a group of 11 members of the Central Executive Board and, invoking an earlier agreement between the leaders of the Federation, appointed a National Secretariat to run the Federation until April 1972. 42
117. A mere change in the name of the company, from a state-owned to a private company for example, may not justify the dissolution of a trade union organization. Case No. 2181 against the Government of Thailand concerned the situation following a purported change of status of a state-owned oil company to a private one and the subsequent dissolution of the complainant organization (Bangchak Petroleum Public Co. Ltd Employees’ Union – BCPEU). 43 The CFA noted at the outset that the intended change of status was not all that clear, since two government bodies (the Ministry of Finance on 28 January 2001, and the Parliamentary Committee on Labour and Social Welfare on 10 April 2002) had stated that the change in shareholders did not have an impact on the status of Bangchak Petroleum Public Co. Ltd. as a state enterprise, and that there should be no change in BCPEU status as a state enterprise union. Secondly, the President of Bangchak Petroleum stated publicly more than seven months after the purported change that the company was state-owned. The CFA concluded that the principles of freedom of association were violated in the particular circumstances, notably as regards the administrative dissolution of BCPEU and the automatic revocation of its registration and legal personality. 44
4.1.5. Dismissal
118. The principles of freedom of association require the State to protect workers against anti-union discrimination in their employment. In the abovementioned case against the Government of Argentina, the CFA stated that, under Article 1 of Convention No. 98, it was a fundamental principle of freedom of association that workers should enjoy adequate
41 2006 Digest, paras 683, 685 and 687–689.
42 ILO: Report of the Committee on Freedom of Association, No. 128, Case No. 651, para. 50.
43 ILO: Report of the Committee on Freedom of Association, No. 329, Case No. 2181.
44 ibid., paras 744, 758 and 761.

58 TMOGE-R-[2008-12-0110-1]-En.doc/v3
protection against acts of anti-union discrimination in respect of their employment – dismissal, transfer or other prejudicial measures – and that such protection was particularly desirable in the case of trade union officials because, in order to carry out their trade union functions in full independence, they must have the assurance that they will not be victimized by virtue of their office. 45
119. Practices involving the blacklisting of trade union officials or members constitute a serious threat to the free exercise of trade union rights and, in general, governments should take stringent measures to combat such practices. 46 The use of extremely serious measures, such as the dismissal of workers for having participated in a strike and a refusal subsequently to re-employ them, implies a serious risk of abuse and constitutes a violation of freedom of association. 47 In a case against the Government of Ecuador, the Latin American Central of Workers alleged that PETROECUADOR had dismissed a high-ranking union officer and some rank-and-file members in the course of their trade union activities. 48 According to the CFA, the Government is responsible for preventing all acts of anti-union discrimination and must ensure that complaints of anti-union discrimination are examined in the framework of national procedures which should be prompt, impartial and considered as such by the parties concerned. 49 A case in the Bolivarian Republic of Venezuela involved a general strike and the mass dismissals of oil workers. The incident began with the Government’s refusal to recognize the leadership of the Workers’ Confederation of Venezuela (CTV). On 19 February 2003, a detention order was issued against the president of CTV who was persecuted for days by state security guards. These incidents led to a national civil work stoppage on 2 December 2002 and 1.5 million people, including oil workers, took part in demonstrations. The National Union of Oil, Gas, Petrochemical and Refinery Workers (UNAPETROL) had 495 workers at the state-owned oil company PDVSA. On 3 July 2002, UNAPETROL sent the relevant documentation to the Ministry of Labour, which subsequently asked PDVSA for a description of the duties performed in the company by the members of UNAPETROL. The Ministry of Labour then issued administrative Decree No. 2002-036, stating that registration of the UNAPETROL trade union had been refused on the grounds that a trade union which claimed to represent the interests of both workers and employers, and was composed of workers who constituted the senior and middle management of the enterprise, may not be established. In addition, since the start of a national civic work stoppage in December 2002, the state-owned oil company PDVSA and its subsidiaries had dismissed more than 23,000 workers, including workers affiliated to UNAPETROL, on the grounds of “lack of integrity” or “immoral conduct at work”. Furthermore, PDVSA requested its subsidiaries in writing not to hire the dismissed workers who were also members of UNAPETROL. The CFA was concerned that the delay of the courts in resolving the vast majority of the 23,000 dismissals was tantamount to a denial of justice and did not exclude the possibility that the 6,048 cases were dropped were withdrawn by the workers precisely because of the excessive delay. 50
45 ILO: Report of the Committee on Freedom of Association, No. 128, Case No. 651, para. 58.
46 2006 Digest, para. 803.
47 ibid., para. 666.
48 ILO: Report of the Committee on Freedom of Association, No. 308, Case No. 1911.
49 2006 Digest, para. 817.
50 ILO: Report of the Committee on Freedom of Association, No. 337, Case No. 2249, paras 1478 and 1499; and Report No. 333, Case No. 2249, paras 1044–1050.

TMOGE-R-[2008-12-0110-1]-En.doc/v3 59
4.2. Employee–employer relations
4.2.1. Unionization
120. The oil industry is not characterized by a preponderance of workers’ organizations. Trade unions are more frequent in NOCs, especially in South America and Africa, than in IOCs. In Mexico, in 2005, the oil industry had the highest unionization rate (more that 75 per cent) of any industrial sector. Temporary workers in the Mexican oil industry are also unionized, whereas in most private sector enterprises they are not part of the unionized workforce. 51 In Nigeria, the unionization rate in the oil industry in 2003 was about 60 per cent. 52 In the United Kingdom, in 2003 the unionization rate in the oil extraction sector was 18.1 per cent, lower than in industry as a whole (26.5 per cent). However, the unionization rate has traditionally been higher in the refinery sector (21.7 per cent), 53 than offshore. In the United States, the unionization rate in the extraction sector was 11.4 per cent in 2004. 54 Declining rates of unionization seem to be widespread. In Canada, for example, the unionization rate in oil well work, including mining, has dropped by about 4 per cent over a decade, from 32.5 per cent in 1980 to 28.4 per cent in 1990. 55
121. The level of unionization among women workers in the oil industry is very low. In the United Kingdom, almost no women workers are unionized in the extraction and related activities sectors. In the oil refinery sector, union density of women was only 5.5 per cent compared with 27.8 per cent for all women in employment. 56 In Nigeria in 2003, about 20 per cent of women workers in the oil industry were unionized. 57
4.2.2. Collective bargaining
122. Union recognition for collective bargaining is of paramount importance for unions and their members and often for non-union members. Employers often resist bargaining with workers’ organizations, especially if it is not a legal requirement. This is particularly true at the enterprise level, where such resistance from management can more easily be exercised and “individual workplace agreements” entered into, sometimes on a “take it or leave it” basis rather than through legitimate bargaining. In the Canadian petroleum
51 C. Reynoso Castillo: Industrial relations in the oil industry in Mexico (Geneva, ILO, Sectoral Activities Programme Working Paper No. 239, 2005), p. 28.
52 S. Fajana: Industrial relations in the oil industry in Nigeria; (Geneva, ILO, Sectoral Activities Programme Working Paper No. 237, 2005), p. 6.
53 C. Forde et al.: Good industrial relations in the oil industry in the United Kingdom (Geneva, ILO, Sectoral Activities Programme Working Paper No. 230, 2005), p. 8.
54 G. Chaison: Unions in America (London, Saga Publications, 2006), p. 51.
55 N. Meltz and A. Verma: “Developments in industrial relations and human resource practices in Canada: An update from the 1980s”, in R. Locke, T. Kocharn and M. Piore (eds): Employment Relations in a Changing World Economy (Massachusetts, MIT Press, 1995), p. 103.
56 C. Forde et al., op. cit.
57 S. Fajana, op. cit.

60 TMOGE-R-[2008-12-0110-1]-En.doc/v3
industry, managerial objectives – in particular, a tendency towards imitative behaviour and a strategy of union avoidance – affect wage determination. 58
123. Expectations of workers and management are often divergent. Management can legitimately expect that workers will be available at a price which permits a reasonable return on investment. Workers can expect, with equal legitimacy, that real wage levels will not only be maintained, but steadily increased. Management can claim a legitimate interest in obtaining the most qualified worker available for each job, and workers can claim a legitimate interest in obtaining a job for each worker who is unemployed. Collective bargaining can be an effective way to reconcile such conflicting expectations. Collective bargaining can make it easier to determine the “rules of the game” in industrial relations, which are then implemented by the parties themselves at all levels of their interaction. One principal interest of management in entering into collective bargaining with trade unions is to achieve an agreement for the maintenance of industrial peace. For workers, the principal interest is generally the creation and maintenance of decent working conditions and employment.
124. In Mexico, collective bargaining is at the centre of employee–employer relations at PEMEX. The company’s Department of Labour Relations aims to achieve good employer–employee relations with the dual objectives of maintaining the interests of the company as well as benefiting employees. In 2005, PEMEX executed nearly 9,000 clauses of collective agreements, covering issues such as the rationalization of workplaces, retirement, housing, the relocation of unionized employees and modifications of conditions of work. In addition, the Federal Labour Law states that collective agreements are mandatory and that parties are obliged to respect them. PEMEX’s collective agreements cover almost all matters concerning working conditions and terms of employment, such as terms and conditions of work (work schedules, wage levels), employees’ rights and obligations, holidays, safety and health, training, scholarships, promotions, retirement, medical services, and even allowances for trade union officials. 59 Collective bargaining is also an effective means of protecting rights of vulnerable workers. For example, collective bargaining at the Argentine Federation of Trade Unions for Workers in Private Oil and Gas companies (FASPYGP) includes all contract workers. 60 According to the collective agreement between a Trinidad and Tobago oilfield workers’ trade union and a Trinidad petroleum company, the company will ensure that the contractor provides employees with health and safety clothing and equipment necessary for the operations of a similar or equivalent standard to that provided for workers of the company, and adequate workers’ compensation insurance coverage. 61
4.2.2.1. Collective agreements as a promoter of equality
125. The three-year collective agreement between the oil and gas company Repsol YPF and union federations FIA-UGT and FITEQA-CCOO in Spain from January 2006 places emphasis on improving work-life balance and a range of social provisions. The agreement provides for the examination and promotion of measures by the company to improve equality between women and men. Furthermore, all job advertisements will be written in a
58 D. Gottlieb Taras: “Managerial intentions and wage determination in the Canadian petroleum industry”, in Industrial Relations, Vol. 36, No. 2, 1997, pp. 178–205.
59 C. Reynoso Castillo, op. cit., pp. 25–26.
60 ICEM: Guide on contract and agency labour (Geneva, ICEM, 2008), p. 83.
61 ibid., p. 85.

TMOGE-R-[2008-12-0110-1]-En.doc/v3 61
gender-neutral way and the principle of equality of opportunity will be applied to internal promotions. The agreement contains a range of provisions aimed at improving the work and family-life balance, including allowing female employees with a child under nine months to reduce their working day by one hour. All employees with children under the age of eight, or with caring responsibilities for a person with disabilities, have the right to reduce their working hours, with a proportionate reduction in pay. The agreement also provides for ten days of paternity leave and for all employees to have the right to take leave of absence for up to three years to care for a child, or up to one year to care for another family member. 62
126. This case illustrates that creative and context-sensitive collective agreements can assist in promoting equality. Although collective bargaining could do many things to promote equality, it will not advance equal rights if certain issues have not been raised or accorded sufficient priority during bargaining. Because the effectiveness of collective bargaining is affected by national and international legal regulatory frameworks, and by labour market power, some of the most vulnerable unionized workers may not have sufficient bargaining power to advance equality objectives through the collective bargain processes. If the law already recognizes equality principles in the workplace, then negotiations can focus on how to achieve equality at work. 63
4.2.3. Dispute resolution
127. Conflict resolution is an essential part of the industrial relations system. The framework to deal with disputes is a crucial component of any country’s industrial relations system. The options available to the social partners and to governments are numerous, ranging from informal negotiations to formal litigation. They may even include government intervention to resolve certain labour disputes in the public interest. Generally speaking, employment disputes are divided into two categories: individual and collective disputes. Collective disputes can be divided into two sub-categories: rights disputes and interests disputes. A rights dispute arises where there is disagreement over the implementation or interpretation of statutory rights, or the rights set out in an existing collective agreement. An interest dispute concerns cases where there is disagreement over the determination of rights and obligations, or the modification of those already in existence. Interest disputes typically arise in the context of collective bargaining where a collective agreement does not exist or is being renegotiated. 64
4.2.3.1. Relevant ILO instruments
128. The main ILO instrument dealing with dispute prevention and settlement is the Voluntary Conciliation and Arbitration Recommendation, 1951 (No. 92). It recommends that voluntary conciliation machinery should be made available to assist in the prevention and settlement of industrial disputes between employers and workers. It further recommends that such machinery should include equal representation of employers and workers and should be free of charge and expeditious, and that provisions should be made to allow the parties to enter into conciliation voluntarily or on the initiative of the conciliation
62 “Energy firms reach agreements”, in European Employment Review, Mar. 2007, pp. 27–29.
63 A. Blackett and C. Sheppard: “Collective bargaining and equality: Making connections”, in International Labour Review, Vol. 142, No. 4 (Geneva, ILO, 2003), pp. 419–457.
64 G. Casale: The Settlement of Labour Disputes in Central and Eastern Europe (Geneva, ILO, Central and Eastern European Team Working Paper No. 22, 1997).

62 TMOGE-R-[2008-12-0110-1]-En.doc/v3
authority. It also recommends that parties should abstain from strikes or lockouts while conciliation or arbitration procedures are in progress, without limiting the right to strike.
129. Dispute resolution is further addressed in the Collective Bargaining Convention, 1981 (No. 154), which provides that bodies and procedures for the settlement of labour disputes should be designed to contribute to the promotion of collective bargaining. While Convention No. 154 focuses on collective bargaining, it does not rule out the use of conciliation or arbitration as part of the bargaining process where such processes are voluntary. Also, the Examination of Grievances Recommendation, 1967 (No. 130) addresses dispute resolution at the enterprise level, including with regard to rights disputes over alleged violations of collective agreements. 65 The instrument contains a number of recommendations on the development and implementation of workplace dispute mechanisms and emphasizes the importance of preventative measures, such as sound personnel policy and the cooperation between the social partners on decisions that affect workers. It further recommends that, where all efforts to resolve the dispute have failed, there should be a possibility for final settlement either through the procedures provided for by a collective agreement, through conciliation or arbitration by the competent public authorities, through recourse to a labour court or other judicial authority, or through any other procedure which may be appropriate under national conditions.
4.2.3.2. Industrial action
130. As noted above, the supervisory bodies of the ILO have, by and large, addressed collective dispute prevention and resolution in the context of the right to strike. The CFA has stated that: “strikes are recognized as a legitimate weapon of trade unions in furtherance of their members’ interests.” 66 Furthermore, the Committee of Experts on the Application of Conventions and Recommendations has reiterated its position that the right to strike is an intrinsic corollary of the right to organize, as protected by Convention No. 87. 67 In short, the ILO maintains that an effective system of dispute settlement must be combined with respect for freedom of association, the lack of which can lead to situations where workers are not adequately represented when a dispute arises, leading potentially to unsatisfactory settlements and continued labour unrest. Where freedom of association is weak, the legitimacy of tripartite and bipartite resolution bodies is also in question since there may be doubt as to the independence and impartiality of dispute resolution procedures.
4.2.3.3. Recent industrial action
131. There are no official global statistical data on the extent of industrial action or the examination of disputed issues in the oil industry. Furthermore, strike action in the oil industry is often reported in a broader group of sectors, typically oil, gas, mining and quarrying. Nevertheless, major trends in industrial disputes in the oil industry can be traced through various publications.
132. While the extent of industrial action varies from one country to other, overall it seems to be decreasing. In Norway, the number of working days lost in all stoppages in the oil and gas extraction and mining industries decreased from 41,979 days in 2004 to 2,958 days in
65 Recommendation No. 130 does not apply to collective claims aimed at modifying the terms and conditions of employment.
66 ILO: Freedom of association and collective bargaining, Report III (Part 4B), International Labour Conference, 81st Session, Geneva, 1994, para. 146.
67 ibid., para. 151.

TMOGE-R-[2008-12-0110-1]-En.doc/v3 63
2006. 68 In South Africa, the last national strike of petroleum workers took place in 1998, which resulted in 8,774 working days lost. However, in 2000 the number dropped to 4,749 and, no major industrial action has been reported since 2001. However, this does not necessarily mean that there are no disputes in the oil industry. 69
133. Major industrial action in the past decade in the oil industry can be grouped into four major categories: wages, fringe benefits, lump sum allowances and non-implementation of the terms and conditions in collective agreements; job security and changes to pay and working conditions following corporate restructuring and merger and acquisition activities; workers’ participation in the company’s decision-making process (as a means of industrial democracy); and the stabilization of the employment status of contract labour.
134. An example of industrial action over workers’ pay and conditions of work occurred in Kuwait in 1993 when 2,000 foreign refinery workers staged a one-day walkout over deficient living conditions, poor food and inadequate holidays. 70 In the United Kingdom, shore-based engineers and designers organized a one-day walkout in 1999 after a 10 per cent pay cut was imposed on some engineers as a result of falling oil prices. 71 In the Nigerian oil industry, strikes have frequently occurred because of the wage determination system. Claims by unions for general increases in wages have been justified by reference to increases in the cost of living and by the inadequacy of minimum wages to support a worker with dependants. Consumer price inflation has for many years been brisk to rapid, and real wages have fallen. Despite strikes being incomplete and short-lived, they have sometimes achieved their objectives. 72
135. Industrial action is sometimes used as leverage in the course of negotiation, or to get management to the negotiating table. In 2001 in Brazil, unions at Petrobras went on strike, demanding improvements in offshore safety. In 2006 in Spain, nearly 40,000 petrol station workers who were members of the sectoral trade unions affiliated to the General Union of Workers (UGT) and the Trade Union Confederation of Workers’ Commissions (CCOO) called for a strike to put pressure on oil companies during bargaining over a new sectoral agreement. 73 In July 2008, unions at Petrobras threatened to strike over payment travelling time to and from offshore oil rigs. 74
136. Because of the volatility of crude oil prices, the oil industry has probably undergone corporate structural change more frequently than any other industry. This is has often led to disputes. In 2000, oil workers went on strike over the transfer of safety and environment units of the Department of Petroleum Resources in Nigeria to a new division in the Federal
68 Statistics Norway, available at: http://statbank.ssb.no/statistikkbanken/.
69 S. Miller and T. van Meelis: Industrial relations in the oil industry in South Africa (Geneva, ILO, Sectoral Activities Programme Working Paper No. 138, 2005), p. 45.
70 The PRS Group/Political Risk Services, 1 Sep. 2001.
71 “Oil workers in dispute over wages”, BBC News Online, 27 May 1999, available at: http://news.bbc.co.uk/1/hi/uk/354216.stm.
72 S. Fajana, op. cit., pp. 20–21.
73 “Strikes hit petrol stations and docks”, in European Industrial Relations Review, Dec. 2006, p. 12.
74 J. Rumsey: “Petrobrás faces strike action over travel day pay”, in Financial Times (London), 11 July 2008.

64 TMOGE-R-[2008-12-0110-1]-En.doc/v3
Ministry of Environment because of threatened job losses. In 2002, workers at the Nigerian National Petroleum Corporation went on strike over the proposed privatization of its downstream divisions. 75
137. Industrial action has been used to give workers a say in corporate decision-making when their interests are affected. In 2000, at Elf Oil in Nigeria, workers called for the sacking of a managing director because of a plan to remove Africans from senior management posts. 76 In 2007, in Indonesia, around 400 PT Pertamina (Persero) workers went on strike demanding the replacement of Pertamina’s directors and a comprehensive audit of business processes and the company’s culture. 77
138. The threat of industrial action can also be effective in the light of the economic impact should a strike take place. In Nigeria, in June 2008, PENGASSAN set a deadline for Chevron to meet the demands of its Nigerian employees or face industrial action. Workers sought the removal of the managing director of Chevron Nigeria whom they blamed for perpetuating the crisis in the company. According to Chevron, a strike could disrupt more than 300,000 barrels a day of crude oil production as well as the planned start of a new deepwater oilfield a few weeks later. 78 In July 2008, Chevron Nigeria agreed to trim the number of foreign workers it employs over the next three years as part of a deal agreed with PENGASSAN to end a dispute. 79
139. While “bread-and-butter issues” are the prime reason for oil workers’ industrial action, the increase in the use of contract workers has entered the industrial relations arena. Box 4.1 illustrates workers’ concerns about the proposed liberalization of Algeria’s national energy policies involving the use of contract labour.
75 S. Fajana, op. cit., pp. 20–21.
76 idem.
77 R. Pratiwi Anwar and M. Ssenyonga: Promoting good industrial relations in the oil and gas industries in Indonesia (Geneva, ILO, Sectoral Activities Programme Working Paper No. 254, 2007).
78 “Nigerian union sets new deadline over Chevron strike”, in Oilgram News, Vol. 86, No. 117, 16 June 2008, p. 5.
79 “Chevron Nigeria agrees to reduce foreign workers”, in Oilgram News, Vol. 86, No. 144, 23 July 2008, p. 5.

TMOGE-R-[2008-12-0110-1]-En.doc/v3 65
Box 4.1 Workers’ concerns about liberalization at Sonatrach
In March 2001, Sonatrach’s workers went on a 24-hour strike triggered by concerns over the company’s restructuring. A new hydrocarbon law brought about several changes: Sonatrach would lose its crucial monopoly position and the company would no longer be both the negotiator and the mandatory partner for international oil companies operating in Algeria. In the past, this dual function had given Sonatrach the power to forge advantageous alliances, but also to frustrate the ambitions of foreign firms. All negotiations on future exploration, production and development contracts are to be conducted by a new national agency. Sonatrach’s control over all energy data has ended. Contract procedures have been simplified and made more rapid and transparent. The energy sector is supervised by a new regulatory agency reporting to the Energy Minister. By forcing it to compete on an equal footing for new acreage in transparent tendering processes, the measures have deprived Sonatrach of much of its advantage over its international competitors. The fields where Sonatrach had been the sole operator were to be opened to such tendering. The Government maintained that nothing in the new hydrocarbon law relates directly to the privatization or restructuring of the various branches which operate under the Sonatrach umbrella. In addition to the core activities of oil and gas exploration and production, the company’s interests include transport and distribution, refineries, petrochemicals and oil services. Of about 120,000 workers employed by Sonatrach, only about 40,000 were engaged in core oil and gas activities. The Sonatrach road transport company was the largest in Algeria. Sonatrach also provided catering services at oil sites, as well as housing facilities, and other services. Many of these activities provided compelling arguments for outsourcing. Despite government assurances, workers were concerned that the new legislation would only be the first stage of a wider restructuring programme, and with this in mind, most workers in the energy sector joined a 24-hour strike on 20 March 2001.
Source: “Sonatrach strike adds to reform woes”; Oxford Analytica, 28 Mar. 2001.
140. Industrial action can now more often affect multiple sites in several countries. In 2005, at the Fawley oil refinery in the United Kingdom, ESSO announced it would recruit foreign labour for contract maintenance. This announcement led to a solidarity strike by French oil workers. In Belgium, the company announced cuts of 550 jobs at the ExxonMobil Chemical Films plant in Virton. 80 French workers of ExxonMobil waged strike action and demonstrated against the company’s decision to close worksites and make redundant thousands of workers. 81 The ESSO rationalization plan also provoked a strike in Thailand, 82 and workers’ solidarity actions took place in Australia. These workers’ internationally consolidated actions were coordinated by ICEM’s ExxonMobil Workers’ Network. 83 84
80 ICEM: “Job cuts, outsourcing for ExxonMobil in Europe” in ICEM InBrief, 17 Oct. 2005.
81 ICEM: “French unions strike to stop ExxonMobil retrenchments” in ICEM InBrief, 16 May 2005.
82 “Esso union supports listing”, in The Nation (Thailand), 20 Oct. 2005.
83 ICEM: Secretariat Report, Fourth ICEM World Congress, Bangkok, Thailand, 22–24 November 2007 (Brussels, ICEM, 2007), pp. 27–28.
84 In November 2008, the Repsol Workers’ Network was created as a collective body to represent the trade unions in the countries where both Repsol and its subsidiary YPF operate, in order to discuss labour issues and question involving global corporate policies in Spain and Latin America. See: “Repsol management formally recognizes workers’ energy network of Spain, Latin America/Caribbean”, in ICEM Newsletter, 17 Nov. 2008.

66 TMOGE-R-[2008-12-0110-1]-En.doc/v3
4.2.4. Employment relations and contract labour
141. Contract labour has become a global phenomenon as more companies either outsource many aspects of their business or hire temporary workers from employment agencies as a way to cut costs and to increase flexibility. Employers can find workers with specific skills, when and as needed, without recruitment costs. This has led in some situations to a two-tier workforce with fewer directly employed workers, and increasing numbers employed under a range of employment contracts; up to 70 per cent of some workforces are contract or service workers. 85
142. In general, agency workers tend to be less satisfied with their jobs and working conditions than permanent staff. They also tend to have less control over their work, receive less training, have higher accident rates and work longer hours. Mostly they get lower wages for similar work and are often excluded from company bonus and benefit systems. They also have less job security. 86 A study in Canada published in 2008 found that there is a significant link between certain characteristics of the employment relationship and workers’ health. The study found that uncertainty in work schedules (rosters) is associated with poorer health. Uncertainty about continued employment and the stress of constant performance evaluations are also associated with poorer health outcomes. 87
143. The main concern about contract work is a lack of labour protection when the legal scope of the employment relationship does not reflect the reality of the working relationship. Contract workers in the oil industry are often not covered by collective agreements, nor do they belong to trade unions. Oil companies in Nigeria tend to fire contract workers just before the expiration of their three, six or 12 month contracts, when they are about to become permanent workers. It is reported that Shell and ExxonMobil in Nigeria employ many workers in that manner, some of whom have been temporary workers for over ten years. In fact, unionizing contract workers is not an easy task for trade unions, particularly at an oil and gas offshore consortium involving multinational companies. Nonetheless, some contract workers are being unionized. For example, in December 2005, about 1,600 workers employed at the offshore Bos Shelf site, a French-Azeri construction project partially owned by Bouygues, were unionized by the Oil and Gas Industry Workers’ Trade Union of Azerbaijan (OGWU). Previously, in November 2005, some 2,000 contract workers at McDermott, BP and Azerbaijan’s state-run SOCAR’s largest contractor had been unionized by the OGWU. 88 This was one of results of the of the ICEM’s Caspian Sea Energy Network in Baku, Azerbaijan, which aims to monitor the labour practices of multinational oil companies operating in the Caspian Sea region. 89
144. The extent and nature of contract labour depends largely on labour legislation and employers’ strategies of labour use. In Germany, companies largely use contract workers
85 ICEM: Report of the ICEM World Conference for the Energy Industries, 27–29 November 2006, Port-of-Spain, Trinidad and Tobago (Brussels, ICEM, 2006), p. 23.
86 www.icem.org/en/73-Contract-and-Agency-Labour/2707-ICEM-Contract-and-Agency-Labour-Newsletter.
87 W. Lewchuk, M. Clarke and A. de Wolff, “Working without commitments: Precarious employment and health”, in Work, employment and society, Vol. 22(3) (Los Angeles, BSP Publication, 2008), pp. 387–406.
88 ICEM: “Contract workers organising in Caspian oil/gas fields”, in ICEM InBrief, 9 Jan. 2006.
89 ICEM: Secretariat Report, Fourth ICEM World Congress, Bangkok, Thailand, 22–24 November 2007 (Brussels, ICEM, 2007), p. 27.

TMOGE-R-[2008-12-0110-1]-En.doc/v3 67
to increase their numerical flexibility, whereas in the United States, companies use agency work as a means to increase their functional flexibility. Cost is another reason why many companies opt for agency working, particularly in the United States. In Germany, however, equal pay regulations mean that cost is not the main focus of the decision to use agency workers. Companies in the United States also regard labour hire agencies as long-term strategic partners, whereas German firms tend not to regard temporary agency work as an important part of their human resources strategy, using it more as a short-term option. 90
145. The increased use of contract labour has become a major issue for Japanese energy and chemical workers. Of serious concern are “disguised contracts”, which take the form of subcontracts but, in reality, the workers concerned are treated as agency labour. This gives the parent company the advantage of reduced labour costs and of not having to give further employment security thereby avoiding the legal obligation to employ a worker directly after a certain period of time of employment as a contract worker. 91
146. Atypical forms of employment can influence collective bargaining. The term “atypical employment” is regarded as all forms of employment other than the contract of employment full-time and for an indefinite period. Its goal is to grant flexibility in the management of the labour force within a company. There are many industrial relations issues that stem from the growing use of atypical forms of employment; one of which is the “dualization” of the workforce into core and peripheral workers. Enterprises often have a small core of permanent staff, plus many more peripheral workers who deliver specific services as part of teams, evolving their own networks, possibly across boundaries and regions. These contractual relationships need to be considered in the context of multiple-employers’ employment relationships which can take several forms. The best known is the use of contractors and private employment agencies. In a traditional employment relationship, there is no doubt about the identity of the employer – the one who hires the worker or who performs the normal functions of an employer: assigning tasks; providing the means to perform them; giving instructions and supervising their performance; paying wages; assuming risks; making profits; and terminating the employment relationship.
147. In a given workplace in an oil company, there may be more than four kinds of workers, namely those who: are directly hired by the parent oil company; are indirectly hired by the parent oil company through employment agencies or staffing consultants; are from the service company, although these workers have employment contracts with the principal oil company; and are hired temporarily by service companies and dispatched to work at the parent oil company. Figure 4.3 illustrates the flow of contract workers to a parent oil company.
90 L.W. Mitlacher: “The role of temporary agency work in different industrial relations systems – A comparison between Germany and the USA”, in British Journal of Industrial Relations, 45:3, Sep. 2007, pp. 581–606.
91 ICEM: Report of the ICEM World Conference for the Energy Industries, 27–29 November 2006, Port-of-Spain, Trinidad and Tobago (Brussels, ICEM, 2006), p. 23.

68 TMOGE-R-[2008-12-0110-1]-En.doc/v3
Figure 4.3. Model of the flow of contract labour into an oil company
Contractor
Contractor
Contractor
Employment Agency
Service Company
Service Company
Service Company
Workers Parent Oil Company
Workers
Source: ILO.
148. Determining the identity of the employer, the workers’ rights and the persons responsible for ensuring respect for those rights can raise difficult issues. But the major challenge is to ensure that contract workers enjoy the same level of protection normally provided by the law for employees in a bilateral employment relationship, without impeding legitimate business initiatives. Possible solutions for the problems of employment relations involving contract labour are provided in the Employment Relationship Recommendation, 2006 (No. 198). It requests governments to formulate and apply a national policy for workers in an employment relationship, as well as consider of how to determine the existence of an employment relationship. The Recommendation indicates that: “the determination of the existence of such a relationship should be guided primarily by the facts relating to the performance of work and the remuneration of the worker, notwithstanding how the relationship is characterized in any contrary arrangement, contractual or otherwise, that may have been agreed between the parties.”
149. Some Latin American governments have recently adopted legislation on contract labour. In Argentina, the Argentine Federation of Trade Unions for Workers in Private Oil and Gas Companies (FASPYGP) use the legislation in force to negotiate that all contract workers are covered by the collective agreement. In Peru in June 2008, the President signed a new outsourcing law that will affect 400,000 contract workers. A key provision outlaws “front companies”, which some companies (not necessarily in the oil industry) had used to avoid their responsibilities to workers. Companies are now responsible for social security and other benefit payments for one year after the expiry of outsourcing contracts. The law sets stricter restrictions for registering outsourcing companies and increases provisions for monitoring and inspection. 92
150. In June 2008, the Employment and Social Affairs Council of the European Union agreed on a draft Directive on Temporary Agency Workers. The draft proposes minimum European-wide standards that create a level playing field whereby temporary agency workers must not be treated less favourably than permanent workers doing comparable
92 www.icem.org/en/73-Contract-and-Agency-Labour/2707-ICEM-Contract-and-Agency-Labour-Newsletter.

TMOGE-R-[2008-12-0110-1]-En.doc/v3 69
work as far as basic working conditions are concerned. Exemptions to this principle would be permitted where the social partners come to an agreement at the national level, for example over the time lag before equal treatment occurs. 93
151. Contract labour issues in the oil industry also need to be considered in the context of global supply chains. Workers’ and public concern about compliance with labour standards in global supply chains has led multinational oil and other companies to introduce corporate codes of conduct and to audit working conditions in their establishments, as well as among their overseas suppliers. These developments have brought improvements in some areas, but have also shown some limitations, including difficulties in having auditing processes that reach subcontractors and the more vulnerable casual workers. 94
152. Oil workers’ trade unions have addressed contract labour contract issues in several ways. For example, in Norway, drilling and catering workers and their employer shared a concern about abuses in the use of contract labour. They have agreed to work together to make the industry attractive and serious and to ensure that agency employees and subcontractors’ employees enjoy orderly conditions of pay and work. The collective bargaining agreement requests the company to discuss with the union (including shop stewards) the matters of the leasing of labour between manufacturing enterprises and the hiring of labour from temporary employment agencies. 95
153. At the international level, some international framework agreements (IFAs) or global framework agreements (GFAs) have attempted to resolve problems in global supply chains in the oil industry, including those of contract labour. In 2006, affiliates of the ICEM in the energy sector discussed a new approach to GFAs which enables workers clearly to address issues regarding suppliers’ and subcontractors’ obligations, including the development of a new model GFA with clear and enforceable criteria. 96 In line with an existing GFA, in December 2007, temporary work agencies Rhodia and Adecco signed a charter of commitment in favour of socially responsible collaboration, which provides a framework for the companies’ conditions with regard to the employment of temporary staff. It sets out commitments in ten different areas, covering such issues as health and safety, basic workers’ rights and conditions of employment. 97 Appendix V provides an overview of the substantive and procedural provisions in IFAS and GFAs and of the agreements that exist between multinational corporations and trade unions.
4.2.5. International framework agreements
154. In 1999, at its World Congress in Durban, South Africa, ICEM made it a priority to reach negotiated IFAs or GFAs with multinational companies. IFAs establish a set of principles
93 idem.
94 “Development and decent work: New directions for multinational enterprises in shaping a fair globalization”, Note for presentation by the Executive Director of the ILO Employment Sector at the OECD–ILO Conference on Corporate Social Responsibility, Paris, 23–24 June 2008 (Geneva, ILO, 2008), p. 11.
95 Norwegian Oil and Petro-chemical Workers’ Union: Collective agreement for employees on mobile offshore units and drilling and catering on permanently placed facilities on the Norwegian continental shelf, 2004.
96 ICEM: Report of the ICEM World Conference for the Energy Industries, 27–29 November 2006, Port-of-Spain, Trinidad and Tobago (Brussels, ICEM, 2006), pp. 25–26.
97 ICEM: Guide on contract and agency labour (Geneva, ICEM, 2008), p. 67.

70 TMOGE-R-[2008-12-0110-1]-En.doc/v3
to be applied in all operations of a multinational company, regardless of whether or not those standards exist in an individual country’s legal statutes. The IFAs do not supplant collective bargaining at a particular worksite, but rather assure that high standards are consistently met regarding human rights, trade union rights and health, safety and environmental practices wherever a company has operations. 98
155. IFAs have now been signed by more than 60 multinational companies, including four in the oil and gas industry, namely Italian-based ENI, French-based Total, Russian Federation-based Lukoil and Norwegian-based StatoilHydro, although the agreement with Total is limited in the scope of its application to the company’s European operations. 99 The IFAs concluded in the oil industry have some significant features with regard to exercising social dialogue in the industry. For example, an agreement on transnational industrial relations and corporate social responsibility entered into by ENI, ICEM and three Italian oil and chemical workers’ trade unions (FILCEA-Cgil, FEMCA-Cisl and UILCEM-Uil) in November 2002 underscores the importance of bipartite dialogue by providing for annual meetings between management, ICEM and the unions. The accord creates a new international management–union structure. Although many IFAs have a similar structure, the formal role of such structures or meetings is sometimes solely to discuss implementation of the agreement. ENI has joined a much shorter list of companies where the new structure also discusses a range of business and employment issues, similar to those dealt with by European Works Councils (EWCs).
156. The GFA with ENI states the importance of developing, at all levels, industrial relations that take into account the different socio-economic contexts in which the group operates and provides that ENI and its subsidiaries are to establish a constructive relationship with union organizations and workers’ representatives appointed on a democratic basis and recognized by international trade unions. 100
157. At the transnational level, in order to promote a system of information, consultation and dialogue between ENI and the signatory trade unions, an annual meeting is held each May involving ENI management, the national secretariats of the three Italian unions and ICEM representatives. At this meeting, complete information will be provided on:
– economic and financial topics relating to the ongoing development of ENI at the global level;
– the current performance and future prospects of ENI’s main operating activities, focusing on the most significant geographical areas and on employment figures;
– the development of the group’s industrial relations in the various countries and areas where it operates, with particular attention to “potentially critical situations,” including any problems identified in the monitoring procedures for the agreement’s implementation; and
– corporate social responsibility actions and programmes undertaken by ENI and initiatives on health and safety at work.
158. The annual meetings, however, do not replace or impede local industrial relations practices, and the parties recognize the principle that problems that arise between workers
98 http://icem.org/en/69-Global-Framework-Agreements. 99 “European Agreement on a Platform for Employee Relations at Total,” 23 Nov. 2004, Total press release. 100 Agreement on Transnational Industrial Relations and Corporate Social Responsibility of 29 November 2002, entered into between Eni SpA and FILCEA-Cgil, FEMCA-Cisl, UILCEM-Uil and ICEM.
TMOGE-R-[2008-12-0110-1]-En.doc/v3 71
and their companies must be resolved at the level closest to the workplace. The normal costs of these annual meetings are met by ENI. As regards the agreement itself, the parties may agree in advance to any modifications or additions to be made to its contents. 101 The global aspect of employee representation and involvement is of increasing relevance in the oil and gas sector.
4.2.6. Employee–employer relations
4.2.6.1. At industry level
159. The social function of maintaining industrial peace is represented primarily through the legal function of contractibility. A collective agreement is an agreement of fixed duration between the social partners designed to bind the parties into a functioning relationship. 102 Collective bargaining at the sectoral and enterprise levels serves this end. In the United States for example, the National Labor Relations Act forms the basis of an industrial relations system in which collective bargaining is the key institutional mechanism to resolve labour-management conflict. The centrality of the collective bargaining process is strengthened by the exclusive managerial prerogative at the strategic level of the company. As a result, management has the sole right to decide the strategic direction of the company, while a union has to negotiate the impact of these policies through the collective bargaining process. These distinctive features of the United States’ industrial relations system have produced particular patterns in company-level governance. At a work unit where a union is represented, industrial democracy is limited to industrial jurisprudence. Through collective bargaining, unions and employers negotiate the complex set of rules governing terms of employment, including the deployment of labour, promotions and lay-offs. Therefore, trade unions, as bargaining units, play an important role in determining the industrial relations in the US oil industry.
160. In the United Kingdom, partnership agreements normally include three major sets of provisions, reflecting the main interests of each party: for workers, a commitment to some form of employment security; for the employer, union acceptance of various forms of flexibility; and for the union, an undertaking from the employer that it will be able to exert significantly more influence over corporate business decisions. Such partnerships have been associated with single union agreements and with broad programmes of organizational change, as well as with stakeholders. They can also include participation in employee involvement programmes. Others define workplace partnership in terms of commitment to a set of principles that do not include recognition of autonomous worker representation. The distinctive character of these partnerships arises from the particular contextual factors that have motivated the parties to cooperate more fully and formally since the mid-1990s. A number of key factors have been observed. First, the adoption in the mid-1990s of a new political agenda by the incoming Government – which placed emphasis on stakeholding, consensual relationships and partnership – provided a favourable climate for widespread interest in partnership relations at the workplace level; second, the Involvement and Participation Association and the Trades Union Congress have both played a major role in stimulating interest in partnership; and third, employers’ organizations have not opposed partnerships. 103
101 “Transnational industrial relations agreement signed at Eni”, in European Works Council Bulletin, Issue 44, Mar./Apr. 2003, pp. 7–9.
102 G. Casale, op. cit., pp. 15–16.
103 P. Haynes et al.: “Workplace union–management partnership: prospects for diffusion of contemporary British approaches in New Zealand”, in P. Holland, J. Teicher and R. Gough (eds):

72 TMOGE-R-[2008-12-0110-1]-En.doc/v3
161. Since 1999, a number of partnership agreements have been concluded between employers in the United Kingdom offshore oil industry, where trade unions have had only a limited presence. Some employers in the oil industry have made pre-emptive partnership deals with unions before workers pursue statutory recognition. These deals have allowed employers to exert more control over the unions that are recognized in the workplace 104 and, in some cases, have had the stated aim of preventing the independent Offshore Industry Liaison Committee union from increasing its influence in the offshore oil industry. 105
162. In May 2000, the Amalgamated Engineering and Electrical Union (AEEU) and the GMB general trade union signed a voluntary recognition agreement with the Offshore Contractors’ Association. In addition to making the AEEU and the GMB the sole agents for bargaining over pay and conditions, the agreement included arrangements for consultation procedures and regular meetings. With the agreement encompassing the majority of non-oil company personnel working on platforms, around half of the offshore workforce was covered. Workers not covered include contract catering staff and those directly employed by oil companies (e.g. management, office workers). According to the AEEU, this has given the union the power to negotiate collectively over pay and has led to improved information exchange. 106 Further, a voluntary recognition agreement between the AEEU and the United Kingdom Drilling Contractors’ Association (UKDCA) granted the union collective bargaining rights over wages, hours and holidays and gave the union offshore facilities to aid recruitment activities. 107
163. When asked to consider the extent to which partnership agreements in the oil industry meet accepted notions of good partnership, some experts argue that such voluntary agreements can help to improve organizational performance and competitiveness through improved cooperation between employers and unions. But workers have generally not gained much from partnership agreements. The outcomes examined in numerous research projects comprised standard industrial relations variables, namely wages, hours of work, employment levels, profit rates and union density, and they were measured over a two- to three-year period prior to the signing of a partnership agreement and for a number of years afterwards. Overall, there were no significant differences between partnership and non-partnership firms in employee wage rises, hours of work, paid holidays, union density changes or rate of profits. 108 Nevertheless, the partnership agreement between the AEEU and the UKDCA has gone some way to enhancing trust, with both parties working jointly to provide shop-steward training and lifelong learning initiatives. However, the trade union
Employment Relations in the Asia-Pacific Region: Reflections and new directions (Routledge, 2007), pp. 104–108.
104 C. Woolfson and M. Beck: “Union recognition in Britain’s offshore oil and gas industry: Implications of the Employment Relations Act 1999”, in Industrial Relations Journal, Vol. 35, 2004, pp. 344–358.
105 G. Martin et al.: “The uncertain road to partnership: An action reach perspective on ‘new industrial relations’ in the UK offshore oil industry”, in Employee Relations, Vol. 25, No. 6, 2003, pp. 594–612.
106 A. Cumbers: “Genuine renewal or pyrrhic victory? The scale of politics of trade union recognition in the UK”, in Antipode (Blackwell Publishing, 2005), Vol. 37, No. 1, pp. 116–138.
107 G. Martin et. al.: op. cit.
108 J. Kelly: “Industrial relations approaches to employment relations”, in The Employment Relationship – Examining psychological and contextual perspectives, 2004, p. 60.

TMOGE-R-[2008-12-0110-1]-En.doc/v3 73
has found that recruiting new members has been difficult, because of a fear of discrimination among employees in the offshore sector. 109
164. Some also argue that unions and employees gain little compared with employers, and that trade unions would be more fruitfully employed engaging in strike action to generate benefits for their members. An examination of the 2003–04 version of the agreement between the AEEU and GMB unions with the Offshore Contractors’ Association leads to the conclusion that the agreement falls short of meeting recognized definitions of genuine partnership, such as those put forward by the Involvement and Participation Association. The agreement contains no explicit commitment to job security, aside from an agreement to improve performance through a focus on terms and conditions of employment, which would recognize loyalty, skills and experience within the industry’s overall economic position. While a commitment to job security might be found through other company policies, the absence of one of the key building blocks of genuine partnership in this agreement undermines arguments that a partnership can form the basis of good industrial relations. 110
165. Others argue that pre-emptive agreements constitute a no-strike clause. 111 Partnership agreements with employers represent a pyrrhic victory for unions, having delivered few meaningful improvements to oil workers’ working conditions, and do not signal an extension of the role of unions in the oil industry. In fact, partnership agreements may limit a resurgence of organized labour, and may not offer genuine “partnership” between management and unions in practice in the oil industry. The Employment Relations Act, by offering no recourse to alternative representation through other unions if workers are dissatisfied with current recognition arrangements, effectively limits the rights of workers. 112
4.2.6.2. At company level
166. Good employer–employee relations are critical to the stable production and supply of crude oil. Industrial action in any part of the supply chain can have quick, severe and far-reaching effects. Established companies have an identity and a specific culture that affect the way employees operate and think about their business.
167. At the NOCs in the Middle East, for example, industrial relations are governed by the inherited national culture of dialogue. At some NOCs, external factors such as the influence of the IOCs have affected the corporate culture. By contrast, national economic development policies contribute to defining the function of dialogue in industrial relations at the NOCs. Regardless of the industrial relations system, trust and confidence must be in place and fostered by tripartite or bipartite collaboration. Each Middle Eastern NOC has a specific culture that informs its management and decision-making procedures. Kuwait Petroleum Company (KPC) has a distinctive informal and formal dialogue mechanism inside and outside the company. A feature of the Kuwaiti culture of dialogue which influences KPC is the holding of diwaniyyas – social gatherings hosted by leading Kuwaiti families and sometimes by an industry group, including KPC. Diwaniyyas are the channel through which wasta (influence through connections) is exercised and special favours are granted. For example, wasta can help KPC by enabling its professionals to appeal to
109 G. Martin et al., op. cit.
110 A. Cumbers, op. cit.
111 C. Woolfson and M. Beck, op. cit.
112 A. Cumbers, op. cit.

74 TMOGE-R-[2008-12-0110-1]-En.doc/v3
members of parliament through these informal networks and to counter pressure from others. The diwaniyya practice enables informal relationships within a formal hierarchy. Diwaniyya is also a means to raise awareness of problems, to debate issues and to promote a better understanding of the needs of the oil industry. On the other hand, there is always the possibility that favours won through the diwaniyya-wasta channel, bypassing regular management processes, could be unfavourable to the NOC. 113
168. In contrast, although Saudi Aramco operates in a tightly controlled political and social system, to a large extent it applies its own rules. It is, for practical purposes, exempt from a number of Saudi rules and laws, such as those relating to hiring women, to women driving cars, to men and women mingling, and other social matters. Saudi Aramco’s culture is therefore less formal and hierarchical than that of Saudi society at large and it is in the exceptional situation of being a NOC operating in an isolated compound, like a foreign company. Saudi Aramco’s unique corporate culture is shaped by its long-standing and close relationship with its foreign partners.
169. In Mexico, the industrial relations system relies on its strong tradition of social dialogue. Since 1987, a series of socio-economic pacts has brought together all the parties to tripartite social dialogue. The objective was first to control inflation and later to regulate growth and related issues, including employment creation, industrial relations and working culture. This culture of people’s dialogue is also the backbone of PEMEX’s industrial relations. The task of promoting social dialogue lies with the company’s Department of Labour Relations, which aims to achieve good employee–employer relations in the interests of developing the company, as well as benefiting employees. PEMEX’s cooperation with the union places great strategic importance on corporate decision-making conducted through negotiations with the Union of Oil Workers of the Mexican Republic. This is evidenced by the company’s numerous bipartite committees.
170. In Nigeria, the oil industry has developed a framework of dialogue that is influenced by the traditions of IOCs. The most popular dialogue-promoting mechanism in the oil sector is “joint consultation” – a two-way dialogue to address issues of mutual interest between employers and employees, which also functions as a labour dispute resolution mechanism. While it enables managers to seek employees’ opinions on business plans and reinforces cooperation, it is not a substitute for collective bargaining.
171. In large oil companies, joint consultative committees (JCCs) are usually organized at each worksite, whereas in small and medium-sized oil firms there is normally one enterprise-level committee. JCCs aim to give employees an opportunity to improve management policies by participating in consultations in which they can put forward their expertise, ideas and knowledge; provide labour and management with a forum to exchange opinions and views about all issues of joint interests at the workplace prior to any decision-making in order to improve industrial harmony; discuss the transfer of workers to other offices or sites; assist in fostering cooperation between management and workers to resolve problems based on trust and confidence; and improve industrial relations and business decisions based on mutual knowledge and experience. In the absence of JCCs, many issues, such as the transfer of workers are usually determined unilaterally by the employer.
172. Singapore’s experience shows that social dialogue offers an effective instrument to address various industrial relations issues in a climate of change, including when there are uncertainties caused by restructuring and downsizing. An example of bipartite social dialogue is found in Shell Singapore’s Shared Industrial Relations Vision (SIRV). To improve already good labour-management relations, Shell in Singapore and Singapore Shell Employees’ Union launched the SIRV in 1994. The vision was all but shattered in
113 V. Marcel, op. cit., pp. 54–75.
TMOGE-R-[2008-12-0110-1]-En.doc/v3 75
1995 when the parties could not agree on how to deal with some industrial relations issues. It was revived in 1999 only after both sides recognized the value of working together. The reaffirmation of their commitment to the SIRV heralded a new era in their industrial relations. A SIRV steering committee, comprising senior management and union leaders, was commissioned to realize the objectives agreed under the shared vision. In 2002, in order to implement the SIRV, an Industrial Relations Operating Model (IROM) was launched to monitor progress and facilitate dialogue and discussion on the company’s performance, transformation and human resources policies and practices, as well as on the issues of job security and employability. The IROM is comprised of three integrated tripartite bodies, namely, the SIRV Council, the SIRV Business Steering Committee and the SIRV Forum. A series of SIRV-IROM results-oriented workshops have been launched to equip frontline supervisors and union delegates with essential knowledge and skills to apply and spread the SIRV spirit of industrial relations at both the individual and the collective levels. The Shell experience has shown that a common vision alone is not sufficient. Leaders in management and the unions have constantly to nurture bilateral relations in order to make them work for mutual benefit. 114 These cases suggest that when there is trust and confidence between the parties concerned, good industrial relations will be realized with the help of dialogue.
4.2.7. High performance work practices
173. Over the past two decades, there has been a growing trend towards high performance work practices (HPWPs) which has increased the significance of industrial relations. It is not that easy to define what HPWPs actually are. Most include practices such as: empowering the employee with higher task autonomy; reducing job titles and layers of management; implementing various extensive training programmes and high employee selectivity; encouraging information-sharing programmes; using performance-based pay; and implementing profit-sharing programmes. A study of the relationships between HPWPs and unionization at multinational enterprises in Taiwan, China, found that HPWPs had a positive and statistically significant impact on unionization at the company level, provided there was a close and harmonious relationship between employers and unions. 115 A recent study found higher productivity in workplaces where unions coexist with employee share-ownership schemes. 116 Another recent study found that an organizational culture characterized by high adaptability and a human resources management system characterized by HPWPs had a significant and direct effect on employee commitment. 117
4.2.8. Dialogue in times of change
174. Exchange of information is the most basic process of social dialogue but it implies no real discussion or action on the issues concerned. Rather, it is an essential starting point towards more substantive social dialogue. Consultation is a means by which the social
114 Information provided by Singapore’s National Trades Union Congress.
115 S. Chen: “Human resource strategy and unionization: Evidence from Taiwan”; in The International Journal of Human Resource Management (Routledge, 2007), Vol. 18, No. 6, June 2007, pp. 1116–1131.
116 S. Sengupta: “The impact of employee-share-ownership schemes on performance in unionized and non-unionized workplaces”, in Industrial Relations Journal (Blackwell, 2008), Vol. 39, No. 3, pp. 170–190.
117 S. Taylor et al.: “Employee commitment in MNCs: Impacts of organizational culture, HRM and top management orientations”, in The International Journal of Human Resource Management (Routledge, 2008), Vol. 19, No. 4, Apr. 2008, pp. 501–527.
76 TMOGE-R-[2008-12-0110-1]-En.doc/v3
partners share information and engage in more in-depth dialogue about the issues raised. Because consultation itself does not carry with it any decision-making power, collective bargaining becomes important for initiating dialogue between the parties concerned before or during corporate restructuring, takeovers and mergers and acquisitions. At PEMEX, when the company underwent a modernization programme in its energy and power departments during 1990–94, it initiated negotiations with trade unions in accordance with a provision of the collective agreement. The parties negotiated general and specific conditions of affected workers regarding the issues included in the collective agreement. The company disclosed technical, industrial and commercial information about itself and about the rationalization, but confidential information was not included.
175. A question that arises is how oil workers are consulted and who is involved in times of corporate restructuring. One case illustrates how an oil firm consulted with its non-unionized workforce by forming employer–employee dialogue mechanisms. BP Exploration set up Employee Communications and Consultation Forums (ECCFs) in each business unit, as well as a division-wide UK ECCF. These mechanisms had different tasks with regard to promoting dialogue with a wide range of the company’s employees. After the merger between BP and Amoco in 1998, communication and consultation processes from both companies were brought together to build on best practices for managing change in the future. The ECCFs provided a regular opportunity for formal communication and consultation on issues of significance, supplemented normal line-management methods of communication and enhanced the two-way flow of information on matters of interest or concern to BP Amoco staff.
176. Initially, ECCFs covered some 13 different business units, as well as BP Exploration’s international development staff. Some were developed from existing communications and consultation arrangements, while others were set up from scratch. A division-wide UK ECCF consisted of employee representatives from ECCFs at the business unit level and also had links with the existing BP Upstream European Communications Forum. The business unit and UK ECCFs were intended to deal with different topics, although there is scope for business unit ECCFs to refer matters upwards to the UK-level forum, and major issues such as the implications of restructuring are dealt with at both levels. 118
177. Box 4.2 identifies a range of factors that can contribute to preventing or limiting the negative social impact of restructuring, as described in a joint text drawn up by European employers’ and workers’ organizations. The text drew on case studies of the restructuring experience in ten companies, including Norsk Hydro. With regard to dialogue, it emphasizes first of all the importance of continuous, quality communication between employers and workers or their representatives; secondly, it emphasizes that information should be disseminated speedily to workers; and thirdly, it emphasizes that companies can find it useful to establish monitoring mechanisms to evaluate the effects of the restructuring process and to check the medium- and long-term efficiency of the measures introduced. 119
118 Involvement and Participation Association: IPA Case Study, Series 4, No. 5, Mar. 2004.
119 “EU social partners issue joint text on restructuring”, in European Works Councils Bulletin, Issue 49, Jan./Feb. 2004, pp. 13–15.
TMOGE-R-[2008-12-0110-1]-En.doc/v3 77
Box 4.2 Orientations for reference in managing change and its social
consequences – Excerpts from the joint text on restructuring by social partners in the European Union (EU)
Explaining and giving the reasons for change It is essential to explain and give the reasons for change in good time to workers or their representatives
in the company concerned by setting out the company’s overall strategy. An open discussion on the intentions of the management, in some cases based on documents explaining
the reasons for the decisions and their possible consequences, allows workers or their representatives to make their views known.
An understanding of this strategy is essential to create a positive climate for discussion and a climate of confidence. Involvement of managers is also a factor for success.
The obligations arising from the legislative and contractual framework on worker information and consultation as well as confidentially must be met.
Good information and consultation of the workers or their representatives throughout the process of change may involve a different relevant level depending on the time and subject under consultation. Existing European bodies are the appropriate level when changes concern the strategy of a group and affect sites in several EU countries.
Beyond these obligations, several tools are used: Some companies produce a specific annual report on their developments. Others use documentation prepared for shareholders. Yet others have drawn on suggestions from workers as to how to improve the organization of work and
production. Over and beyond formal procedures, all the case studies underlined the importance of continuous quality
communication with workers and/or their representatives. Managing restructuring
Social consequences are managed locally. In the case of “social plans”, the negotiation takes account of factors such as the company’s constraints, the tax regime, national legislation, collective agreements and the needs and choices of workers.
All the case studies stressed a concern to explore all possible alternatives to dismissals such as, for example:
Reassignment; Training; Re-conversion; Support for business creation; An agreement to diversity forms of work and employment and/or suspend or adapt some benefits on a
temporary basis; Personalized worker support; Natural departure, notably through retirement or, as a last resort, early retirement.
Management of the social consequences of a restructuring operation is a complex process. Several levels of information, consultation or negotiation and several types of workers’ representation may coexist in the companies and countries concerned. Source: European Works Councils Bulletin, Issue 50, March/April 2004, pp. 16-17.
178. At the EU level, European Works Councils (EWCs) have become an important part of industrial relations. They are forums for employee representatives in companies which operate in the European Union and which have 1,000 or more employees, including at least 150 employees in each of two different EU member States. They provide a mechanism for social dialogue through which employees are involved in, and can make a positive contribution to, the decision-making process on transnational issues concerning the company’s future business. The European Trade Union Confederation (ETUC) estimated that, as from 2005, 36 per cent of companies covered by the EWC Directive (94/45/EC)
78 TMOGE-R-[2008-12-0110-1]-En.doc/v3
(640 out of 1,800) had an operational EWC. 120 However, EWCs are not substitutes for the contractual relationship between the company and its workers and their trade unions concerning wages and terms and conditions of work. The EWC Directive provides little guidance on procedures surrounding mergers and acquisitions when EWCs already exist in the merging companies. The following example shows that EWCs are a useful mechanism for coping with the process of restructuring when communication from the company to unions is timely and adequate.
179. In November 2004, an agreement on a “platform for employee relations” (plateforme sociale) was signed between Total and four European-level trade union organizations. Total’s EWC was set up by the March 2001 agreement which replaced former EWC agreements at Elf Aquitaine and TotalFina following the firms’ merger. The new platform for employee relations states that its signatories want to maintain and develop dialogue within the EWC. It also states that management has a commitment to reinforce information and consultation with the EWC on European development projects, consulting it as early as possible while at the same time respecting the provisions of relevant national legislation where applicable.
180. The new platform added to the provisions of the 2001 EWC agreement a statement that, in the event of exceptional circumstances bringing about significant change in the group’s progress or structure, a meeting of the EWC’s liaison committee (an employee-side body) is to be held within the eight days following the relevant meeting of the company’s board. Information useful for examining the situation will be provided to the committee by management. After the liaison committee has considered the matter, an extraordinary meeting of the full EWC may be called either by the committee or by a majority of EWC members. However, this may not occur before the beginning of national-level consultations on the restructuring in question, and may not interfere with such consultations provided that the EWC is brought to the attention of the workers’ representatives involved in national-level consultations.
181. Where there are developments in the Total group that could affect employment, working conditions or the social protection of employees, the management guarantees that the information communicated to employee representatives will allow them, as far as possible, to intervene in advance, in line with the relevant national legislation. Where operations are closed down, the agreements will take into account negotiated commitments on the consequences for employees. Where businesses are affected by restructuring, group management will encourage them to take measures that seek to tackle the employment consequences and promote internal or external re-employment. Group management will assess and take into account the impact of restructuring or closures on companies’ industrial environment and provide technical support in examining or implementing specific actions to assist in creating jobs in the surrounding areas, such as help in setting up companies. The implementation of the agreement in group businesses will be discussed twice a year at meetings of the EWC’s liaison committee. Actions taken in all the areas covered by the accord will be assessed and discussed. The assessment will be provided in a brief annual report, which will also be sent to the various group businesses. If the parties identify difficulties in implementing the agreement in any group business, they may request a specific meeting on the issue, to be organized by agreement with group management. 121
120 ETUC: European Works Councils, 24 Jan. 2005.
121 “European ‘employee relations platform’ agreed at Total”, in European Works Councils Bulletin, Issue 55, Jan./Feb. 2005, pp. 4–5.
TMOGE-R-[2008-12-0110-1]-En.doc/v3 79
5. Human resources development
5.1. Recruitment trends
182. The widespread shortage of qualified professional workers that is emerging could well affect economic development in some countries. A shortage of skilled workers has already affected the oil industry and is predicted to remain of grave concern, at least in the medium term.
183. As a means of attracting young talented workers to join the increasingly diversified oil industry, IOCs promote the wide range of careers available and offer workers the possibility of switching between them. One of the largest oilfield services providers, Schlumberger, is involved in several projects in order to encourage graduates to enter the oil industry. The company has set up a programme to target secondary-school science education in developing countries. The Schlumberger Foundation targets needy students, teachers and university faculty members. The BP Educational Service produces and distributes educational resources about BP and the oil industry, aimed at students of all ages.
184. Worldwide recruitment is common throughout the oil industry, with some important variations. Saudi Aramco has a robust base of Saudi nationals who make up about 86 per cent of its total workforce, alongside specialized international employees from almost 60 countries. Many are recruited through campaigns to attract the best worldwide talent, or through a referral programme whereby expatriates recommend professional acquaintances. 1 Although Shell still recruits worldwide, the company is increasingly focusing on the areas where its large projects are located. Similarly at BP, more than 90 per cent of the people who run its Greater Plutonio project are Angolans. Locally recruited student technicians receive extensive training– including English-language tuition, general education and experience of working abroad – well before the start of production. ExxonMobil is maximizing the number of local employment opportunities to avoid taking employees from the NOCs and other firms. These programmes also meet the needs of host governments for job creation and local economic development in the oil industry. 2
5.2. Human resources development policies
185. In NOCs in the Middle East, workers commonly receive a bonus regardless of performance. This is attributed to patronage networks and the use of wasta (influence through connections) in a society with social norms that place emphasis on charity, generosity and strong family networks. Rather than dismiss poorly performing workers, most NOCs in the Middle East isolate them so that they do not harm the business, or treat them poorly in the hope that they will leave the company of their own free will. But these traditions have become untenable as the NOCs seek to succeed commercially at home and abroad.
1 “Saudi Aramco: The human resource: Essential to the industry’s future”, in OPEC Bulletin (OPEC, Nov. 2007), Vol. 38, No. 8, Nov., p. 27.
2 T. Nicholls: “The big crew change”, in Petroleum Economist (London, 2006), Vol. 73, No. 3, Mar. 2006.

80 TMOGE-R-[2008-12-0110-1]-En.doc/v3
186. Sonatrach is adapting a number of its information technology, human resources and health, safety and environmental systems to international standards. The company highlights its innovative employment exchange, which identifies workers’ competences and capitalizes on their skills by encouraging intra-company mobility. 3
187. PetroChina is also modernizing its human resources management systems, focusing on four main areas: leadership and strategic planning; process management and continuous improvement; human resources management for quality; and employee involvement and participative management. PetroChina considers that a profit-driven, modern corporation with quality values is the basis for business decisions at all levels of the organization. By setting high expectations for all employees, the company hopes to integrate these values into daily leadership and management in order to enable the company to respond to change quickly. For decades in PetroChina, human resources management meant providing free housing, childcare, healthcare, schools and other services for workers and their families. The company no longer provides these services, partly because of the accounting rules required for publicly traded companies. PetroChina is now trying to develop a loyal workforce through other mechanisms, such as higher pay, rewards for excellence, continual education and vocational training. Annual bonuses are related to the company’s performance. In addition, on-the-job training is now mandatory for all workers and 20 per cent of all PetroChina employees are required to have some new training every year. There are quarterly examinations of work proficiency; failure to pass may result in dismissal, or the loss of a yearly employment contract. 4
5.3. Investment in research and development
188. Multinational companies are increasingly moving research and development investment offshore. A combination of economic and social pressures may push more advanced research out of Europe, Japan and the United States, and into those growing economies that have the human capital to support science and technology research. A UK Department of Trade and Industry report notes that six countries account for 86 per cent of global research and development – the United States, Japan, Germany, France, the United Kingdom and Switzerland, with the United States and Japan accounting for 60 per cent of the total. On a per capita basis, innovation-rich economies like Finland and Sweden lead the field. The 2005 World Investment Report of the United Nations Conference on Trade and Development (UNCTAD) records an upswing in research and development investment by multinational companies from 2004, although much of this went to developing countries, which saw a 40 per cent increase, compared with a small decline in research and development investment in developed countries. 5
189. IOCs are increasing investments in research and development in order to increase their technological advantage, thereby partially resolving the shortage of skilled petroleum workers. According to a study entitled The R&D Scoreboard released by the UK Department of Trade and Industry in 2006, the world’s top 1,250 companies increased spending on research and development by 7 per cent in 2005–06. The oil and gas sector invested US$17.6 billion in research and development in 2005-6 (11.8 per cent of the
3 V. Marcel: Oil Titans: National oil companies in the Middle East (Baltimore, Brookings Institution Press, 2006), pp. 54–75.
4 S. Gao and T. Li: “PetroChina’s strategic planning focused on quality”, in Quality Progress, Nov. 2004, pp. 35–40.
5 “R&D moves to developing countries”, in Oxford Analytica, 22 Sep. 2006.

TMOGE-R-[2008-12-0110-1]-En.doc/v3 81
total), ranking it 13th among all industries. In addition, the oil equipment, services and distribution sector invested US$1.3 billion. 6 A survey by the Financial Times in 2007 showed that research and development spending by the IOCs had increased. Royal Dutch/Shell increased its technology and research and development budget by 50 per cent in 2003-06 to US$1.2 billion. Chevron’s research and development more than doubled over five years to US$468 million in 2006. ConocoPhilips budgeted US$400 million for 2007, a 50 per cent increase. 7
5.4. Government initiatives to alleviate skills shortages
190. A shortage of skilled petroleum professionals will not be resolved by the oil industry alone; governments need to take a leading role. A study by the Interstate Oil and Gas Compact Commission (IOGCC) in the United States found that joint initiatives by the Government and the oil industry can increase the number of skilled petroleum workers in the industry. In 2001, the Blue Ribbon Task Force investigated the shrinking numbers of petroleum geologists, geophysicists and engineers in the workforce in the United States and recommended collaboration between federal and state governments, colleges and universities, the oil and gas industry and other groups to increase the number of skilled workers. In 2001, the task force noted that enrolments in petroleum-related majors at US colleges and universities had decreased for many years. However, a report released in 2007 found that the number of bachelor’s degrees in petroleum engineering rose by nearly 20per cent in 2000-05, although the number of geology degrees fell slightly. The task force concluded that federal government initiatives are extremely important, especially with regard to creating internships within federal departments for geosciences graduates and undergraduates and working with other federal departments and the IOGCC. In addition, state governments have played a critical role in involving their employment services, regulatory agencies and education entities in oil and gas training and education. State governments have also created partnerships with the industry, provided internships and continuing education for teachers, worked with career counsellors and funded research. The oil industry has provided summer jobs, reached out to high school and college students and developed scholarships and grant programmes to enable employees to extend their education. 8
191. These initiatives have been mutually beneficial to students and oil companies. Internships not only help fund college expenses, they also provide students with valuable training in various aspects of their chosen field. They also enable the companies to recruit qualified people who are familiar with their culture and operations.
6 C. Cookson: “Global competition sparks spending spree”, in Financial Times (London), 30 Oct. 2006.
7 S. McNulty: “Oil groups put faith in R&D as states lock up reserves”, in Financial Times (London), 21 Aug. 2007.
8 Petroleum Professionals: Blue Ribbon Task Force: A follow-up report, IOGCC, Jan. 2007, http://iogcc.publishpath.com/websites/iogcc/pdfs/2007-Blue-Ribbon-Task-Force-Update.pdf.

82 TMOGE-R-[2008-12-0110-1]-En.doc/v3
5.5. National skills development systems
192. National education systems play a significant role in improving the stable supply of skilled workers, including for the oil industry. A study by the Lisbon Council (a Brussels-based think tank) in 2006 noted that France, the United Kingdom and Italy did not produce more university graduates as a percentage of the population than in the 1960s, while in Germany, the proportion had actually decreased. Finland and the Republic of Korea were held up as examples of good outcomes from investments in education. It also noted that the European strategy of focusing on hi-tech industries to maintain a competitive advantage with the rest of the world would suffer from the fact that countries in Asia were producing a highly skilled and cost-effective workforce. 9
193. These findings led the European Union to review the region’s higher education system. The European Commission launched the Lisbon Strategy in 2000, which aimed to ensure that the European Union was the most competitive knowledge-based economy by 2010. In 2006, the Commission highlighted four “priority action areas” for action at the national and the EU levels. In the areas of higher education and research, the European Commission called for investment in higher education to increase from just under 1.3 per cent of GDP to 2 per cent by 2010, and for improved mathematics and foreign language teaching in schools. It also called on Member States to set clear targets for overall research and development spending for 2010; for research and development to account for greater proportion of state aid and structural funds; and for the establishment of a European Institute for Technology. 10
9 “Western Europe: Skills levels caught up by Asia”, in Oxford Analytica, 14 Mar. 2006.
10 “Lisbon strategy relaunched”, in European Industrial Relations Review, May 2005, pp. 23–26.

TMOGE-R-[2008-12-0110-1]-En.doc/v3 83
6. Corporate social responsibility and corporate governance
6.1. Corporate social responsibility in the oil industry
194. It is generally agreed that corporate social responsibility (CSR) is a voluntary initiative and refers to activities that are considered to exceed mere compliance with the law. Experience in the oil industry indicates that CSR includes good governance, respect for human rights and community involvement. But CSR is not just an external relations matter, it also affects the oil companies’ internal corporate behaviour, including industrial relations. There is a very strong business case for CSR to be a central part of good corporate governance.
195. There is considerable debate on CSR and on the role of enterprises in society. Some are concerned that the expectations of enterprise CSR initiatives extend well beyond what might be considered as the legitimate role of an enterprise in society: CSR cannot substitute for the role of government. While others might agree with the primacy given to the law and its implementation, they note that CSR should not be confused with what society considers as the social responsibilities of enterprises: CSR is a voluntary concept involving responsibilities unilaterally identified by enterprise management. 1
196. In recent years, the attention surrounding the CSR of oil companies has been focused on the fundamental issues of accountability and justice, in other words, on how the accountability of multinational oil companies towards workers, communities and consumers can be ensured within a political, economic and legal framework that is geared towards the protection of economic interests. Governments and business and workers’ organizations alike are increasingly expected to do more than merely abide by national law; they are expected to take into account local practices and respect human rights and labour standards. One high profile case highlights the importance of CSR, or the lack of it, in the oil industry.
197. Ken Saro-Wiwa was a writer and activist who openly criticized the operations of IOCs in Nigeria. In 1993, following a series of protests, he was arrested along with other activists. In November 1995, after what was widely regarded as a show trial, Saro-Wiwa and eight others were executed. This incident provoked international outrage, particularly over the failure of Shell to intercede with the Government to try to get the death sentences commuted. Shell’s position was that it was not the role of companies to interfere in the domestic politics of host countries. Subsequently, the strength of public feeling over Shell’s failure to intervene led it to publish in 1997 a revised statement of General Business Principles, amended, in Shell’s words, to reflect public interest in human rights issues. 2
198. Today, most IOCs appear to have accepted that compliance with human rights obligations is an important part of being socially responsible. A study of the world’s largest 500 companies in 2006 showed that 91 per cent of multinational companies said that they
1 ILO: InFocus Intiative on Corporate Social Responsibility (CSR), Governing Body, 295th Session, Geneva, Mar. 2006, GB.295/MNE/2/1.
2 D. Litvin: Empires of profit: Commerce, conquest and corporate responsibility (New York, Texere LLC, 2003), pp. 249–273.

84 TMOGE-R-[2008-12-0110-1]-En.doc/v3
had management practices in place regarding the human rights implications of their operations. Two-thirds of companies in the extractives sector reported to have experienced human rights problems, the highest sector-specific score. 3 Box 6.1 illustrates typical CSR principles adopted by the oil industry.
Box 6.1 Guiding principles of corporate social responsibility at Statoil
Statoil will observe and promote basic standards for human rights, labour rights and the environment, as expressed in the UN Global Compact and the Global Sullivan Principles of Social Responsibility;
Statoil will show respect for local cultures and traditions and will cooperate with people affected by its operations;
Statoil will contribute to value creation, expertise development and transfer of experience in the countries where it operates;
Statoil gives weight to supporting organizations and projects which contribute to sustainable development and strengthen civil society;
Statoil will be an open and active contributor to the debate on industry’s role and responsibility;
Statoil will develop tools to strengthen, measure and report its operations in accordance with the triple bottom-line principle – finance, environment and society.
Source: European Works Council Bulletin, Issue 32, Mar./Apr. 2001, p. 10.
6.2. ILO MNE Declaration
199. At the ILO, CSR is seen as a way for enterprises to give consideration to the impact of their operations on society and affirm their principles and values, both in their own internal methods and processes and in their interaction with others. One point of reference for the ILO’s work on CSR is the Tripartite Declaration of Principles concerning Multinational Enterprises and Social Policy (MNE Declaration). 4 5 Although it is a voluntary instrument, the MNE Declaration refers to national legal frameworks and practices, relevant international labour standards, the international covenants adopted in the United Nations and the Declaration on Fundamental Principles and Rights at Work and its Follow-up, 1998 (ILO). The MNE Declaration, as a universal instrument, stresses the critical role that host country governments play in fostering an enabling environment that encourages multinational and other enterprises to undertake actions to promote decent work; governments in developing countries are increasingly acting in this regard. For instance, Petrobras is developing its strategy on combating child labour in the biofuel agricultural sector with ILO support and is considering funding additional initiatives in the sector. 6
3 H. Williamson: “Global companies ‘keener to avoid rights scandals’”, in Financial Times, (London), 1 Sep. 2006.
4 www.ilo.org/public/english/employment/skills/hrdr/instr/tri_dec.htm.
5 The principles in the MNE Declaration “are intended to guide the governments, the employers’ and workers’ organizations and the multinational enterprises in taking such measures and actions and adopting such social policies, including those based on the principles laid down in the Constitution and the relevant Conventions and Recommendations of the ILO, as would further social progress” (para. 5 of the MNE Declaration).
6 ILO briefing note on the ILO’s support to company initiatives aimed at improving working conditions in the supply chains, 3 July 2007.

TMOGE-R-[2008-12-0110-1]-En.doc/v3 85
200. The MNE Declaration encourages the governments of home countries to promote good social practice in accordance with its principles, having regard to social and labour law and regulations and practices in host countries, as well as to relevant international standards. Both host and home country governments are invited to be prepared to have consultations with each other, whenever the need arises, on the initiative of either. The MNE Declaration has sections covering five areas: general policies; employment; training; conditions of work and life; and industrial relations. Each section includes guidance to both governments and enterprises, and suggests ways in which they can work together to maximize the contribution of multinational and other enterprises to economic and social development. Guidance for companies under each area is summarized in table 6.1.
Table 6.1. Overview of the ILO Tripartite Declaration of Principles concerning Multinational Enterprises and Social Policy (MNE Declaration)
Areas covered
Enterprises are encouraged to:
Gene
ral
polic
ies Obey national laws and respect international standards.
Contribute to the realization of the fundamental principles and rights at work. Consult with the government and with employers’ and workers’ organizations to ensure that
operations are consistent with national development priorities.
Emplo
ymen
t
Endeavour to increase employment opportunities and standards, taking the employment policies and objectives of governments into account.
Give priority to the employment, occupational development, promotion and advancement of nationals of the host country.
Use technologies which generate employment, both directly and indirectly. Build linkages with local enterprises by sourcing local inputs, promoting the local processing of
raw materials and local manufacturing of parts and equipment. Extend equality of opportunity and treatment in employment. Assume a leading role in promoting security of employment, providing reasonable notice of
intended changes in operations and avoiding arbitrary dismissal.
Train
ing Provide training for all levels of employees to meet the needs of the enterprise as well as the
development policies of the country. Participate in programmes to encourage skill formation and development. Afford opportunities within the enterprise to broaden the experience of local management.
Cond
itions
of w
ork a
nd lif
e
Provide wages, benefits and conditions of work not less favourable than those offered by comparable employers in the country concerned.
Provide the best possible wages, benefits and conditions of work, within the framework of government policies, to meet the basic needs of employees and their families.
Respect the minimum age for admission to employment. Maintain the highest standards of safety and health at work. Examine the causes of industrial safety and health hazards, provide information on good practice
observed in other countries, and effect necessary improvements.
Indus
trial re
lation
s
Observe industrial relations no less favourable than those observed by comparable employers. Respect freedom of association and the right to collective bargaining, providing the facilities and
information required for meaningful negotiations. Support representative employers’ organizations. Provide for regular consultation on matters of mutual concern. Examine the grievances of workers, pursuant to an appropriate procedure.

86 TMOGE-R-[2008-12-0110-1]-En.doc/v3
6.3. OECD Guidelines for Multinational Enterprises
201. Similar to the ILO MNE Declaration, the Guidelines for Multinational Enterprises of the Organisation for Economic Co-operation and Development (OECD) set out principles and standards for responsible businesses on a range of issues, including: employment and industrial relations; disclosure of information; competition; combating bribery; and protecting consumer interests and the environment. The Guidelines act as an international reference point and instrument for promoting CSR among multinational enterprises, in line with the principles of the ILO MNE Declaration. The Guidelines are promoted through national contact points (NCPs) in OECD member States and adhering countries.
202. A recent report documents 134 cases dealt with by NCPs up to September 2007; a majority of which (94) concerned employment and industrial relations. As for the oil and gas industry, one case was submitted to NCPs in France and the United Kingdom by Azerbaijan, Georgia and Turkey concerning alleged non-observance of the Guidelines in the areas of environment, contracts and respect for human rights by a consortium of three French companies participating in the construction and operation of an oil pipeline. In the United Kingdom, the same complaint was filed against BP on grounds including the exemptions from regulations, consultation and disclosure, environmental management and information on environmental safety and health. 7
6.4. Global Reporting Initiative
203. The Global Reporting Initiative is a multi-stakeholder network aimed at improving the comparability and credibility of company reporting. It has developed a reporting framework with the participation of companies, including accounting firms, governmental institutions, trade unions and civil society, aimed at developing widely accepted standards similar to those used for financial reporting. In a related area, the United Nations in 2005 convened leaders from the international investment community to develop a set of “best practice” Principles for Responsible Investment. The voluntary and aspirational Principles aim to encourage long-term investment objectives, as the short-term outlook of investors is often cited as a significant obstacle to incorporating environmental, social and governance (ESG) principles into investment analysis and decisions. Asset owners, investment managers and professional service partners as signatories to the Principles will be called upon voluntarily to make the following commitments: incorporate ESG issues into their investment analysis and decision-making; develop an active ownership policy that engages with their portfolio companies on key ESG issues; standardize and integrate ESG reporting with annual financial reporting. In addition, signatories will promote the widespread acceptance and effective implementation of the Principles and will report on their progress in that regard. This implies that signatories will be transparent about their ESG expectations and about emerging issues requiring attention. 8
6.5. Local content
204. Oil-producing countries generally have local content frameworks, policies and institutions in place in order to increase workers’ participation in the decision-making process and, at
7 OECD: OECD Guidelines for Multinational Enterprises: Specific instances considered by national contact points (Investment Division, Directorate for Financial and Enterprise Affairs), Paris, 14 Sep. 2007.
8 “UN plan could boost ethical investing”, in Oxford Analytica, 8 May 2006.

TMOGE-R-[2008-12-0110-1]-En.doc/v3 87
the same time, increase job opportunities. The Government of Nigeria has focused on resolving the unrest in the Niger Delta region (caused primarily by low levels of local participation and the neglect of local oil workers’ welfare) by adopting a local content policy and increasing workers’ involvement in the oil industry. The local content policy is aimed at promoting a framework that: ensures active local participation without compromising standards; promotes value added in Nigeria though the utilization of local raw materials and human resources; promotes the steady, measurable and sustainable growth of Nigerian content; and significantly increases the contribution of expenditures in the upstream sector to GDP over a defined period of time.
205. In Indonesia, several government policies in the oil and gas industry are focused on boosting the employment of local people and improving the competitiveness of local industries. This includes local staff being placed on overseas assignments with international oil companies to help develop expertise. In Saudi Arabia, the Government’s local content policy has produced a host of local companies, such as pipe plants, heat exchanger manufacturing facilities and valve producing plants that supply the oil industry. 9
6.6. Corporate governance
206. Corporate governance and CSR are two separate concepts. Corporate governance generally refers to issues relating to the ownership and control of companies and covers topics such as decision-making, reporting and transparency. CSR is concerned with a wider set of relationships with workers, suppliers, communities, consumers and civil society. Corporate governance is about the relationship between three sets of actors – shareholders, management, and workers. Nonetheless, a wider group of stakeholders, including local communities has an interest in the governance of a company.
6.6.1. Costs of poor governance
207. It is unfortunate that an abundance of natural resources is often associated with corruption. Development funds are often misused, as was the case in a World Bank-supported programme to build an oil pipeline in Chad. 10 In the Niger Delta, oil companies have bought off militants (such as the Movement for the Emancipation of the Niger Delta – MEND) threatening attacks on their facilities. 11 MEND and other militant groups in the Delta argue that they are fighting on behalf of the Ijaw, the Delta’s majority tribe. Nigerian police, seconded to the oil companies who pay their salaries and give them training, have been complaining about their conditions and lack motivation to fend off militant attacks. Furthermore, oil companies have been criticized for spending large amounts on security and saying they do not have enough to increase community development projects. 12
9 “Local content: The platform for economic and social development”, in OPEC Bulletin (OPEC, Sep./Oct. 2007), Vol. 38, No. 7, pp. 40–43.
10 L. Polgreen and C. W. Dugger: “Chad’s oil riches, meant for poor, are diverted”, in The New York Times, 18 Feb. 2006.
11 D. Mahtani and D. Balint-Kurti: “Shell gave work to groups with links to Nigerian rebels”, in Financial Times (London), 27 Apr. 2006.
12 D. Mahtani: “Delta militants cause oil jitters”, in Financial Times (London), 16 May 2006.
88 TMOGE-R-[2008-12-0110-1]-En.doc/v3
6.6.2. Voluntary principles on security and human rights
208. The Governments of the United States, the United Kingdom, the Netherlands and Norway, companies in the extractive and energy sectors and non-governmental organizations have engaged in a dialogue on security and human rights. The participants recognize the importance of the promotion and protection of human rights throughout the world and the constructive role business and civil society can play in advancing these goals. The participants have developed a set of voluntary principles to guide companies in maintaining the safety and security of their operations within an operating framework that ensures respect for human rights and fundamental freedoms. Mindful of these goals, the participants agree on the importance of continuing this dialogue and keeping the principles under review. 13 14
6.6.3. Extractive Industries Transparency Initiative
209. The Extractive Industries Transparency Initiative (EITI) is designed to improve international transparency in relation to payments by certain oil and gas and mining companies to foreign governments. The EITI seeks to achieve transparency by requiring that government revenues from extraction industries and company payments for those resources be published in independently verified reports. Primarily an anti-corruption measure, the EITI also seeks to empower citizens and institutions to hold governments to account for the use of these resources. The parties with primary responsibility for implementation are resource-rich host states. Energy companies also have an important supporting role in developing and testing methods of payment and revenue disclosure and publication in the extractive industries in countries heavily dependent on natural resources. Under EITI criteria, companies and governments are required separately to disclose details of various kinds of payments made to government authorities, including royalties, taxes, dividends and signature bonuses, and these payments must be reconciled by a credible, independent administrator, applying international auditing standards. The exact mode of implementation of the EITI is left to host State parties to determine, which means that, although participation by companies in the overarching initiative is voluntary, their reporting obligations may still be regulated at the domestic level. 15 16 It is debatable whether this initiative is effective, given the lack of solid information. Despite being a member of EITI, the BG Group refused to disclose how much it paid Equatorial Guinea for 3.4 million tonnes of liquefied natural gas in a 17-year purchasing agreement. Nigeria is the only sub-Saharan African country to have published an audited and reconciled EITI
13 Supporting oil and gas companies include: Hess Corporation, BG Group, BHP Billiton, BP, Chevron, ConocoPhillips, ExxonMobil, Hydro, Marathon Oil, Occidental Petroleum Corporation, Dutch/Shell, StatoilHydro and Talisman Energy.
14 www.voluntaryprinciples.org.
15 M.V.J. Senn and R. Frankel, “Firms can avoid EITI, FCPA pitfalls”, Oil & Gas Journal, 21 July 2008, pp. 20–24.
16 Supporting oil and gas companies include: BG Group, BHP Billiton*, BP, Burren Energy, Chevron Corporation, ConocoPhilips, Eni, ExxonMobil, Hess Corporation, Norsk Hydro, Marathon, PEMEX, Petrobras, Repsol YPF, Dutch/Shell, StatoilHydro, Talisman Energy, Total and Woodside. (*Supporting company through membership of the International Council on Mining and Metals.)

TMOGE-R-[2008-12-0110-1]-En.doc/v3 89
report. Many other African countries have not yet appointed an EITI leader, established a stakeholder committee or drafted and approved a workplan. 17
6.6.4. Initiatives for combating corruption
210. Recognizing that the oil industry is exposed to the risks of corruption in some areas of its activities, the OGP established the Anti-Corruption Task Force in 2001. The OGP believes that a sound due diligence process is the cornerstone of any anti-corruption compliance programme and stresses that such a process can help identify specific liability risks. Some of these risks may be general, such as prior knowledge of widespread corruption or a history of violations occurring in the country in question. As part of the approval process for any project for the oil industry, due diligence findings are to be noted and documented in a manner that can be used to furnish decisive evidence or information to those responsible for giving the go-ahead for any contract or commercial arrangement. Properly conducted, due diligence helps assess any risk and potential benefits or consequences of a prospective relationship. This will also help oil companies avoid exposure to significant liabilities and damage to corporate reputation. 18 Norway has a policy to help countries benefit from their oil wealth and has helped or plans to assist 16 oil- and gas-producing countries. Norway is discussing a cooperation programme in Bolivia that focuses on oil law, the design and implementation of oil contracts and establishing a pricing regime for gas exports to the region. There are, however, concerns about conflicts of interest because Norway advises oil-rich governments on licensing rounds in which Norwegian companies are bidding. 19
211. The OECD plays a lead role at the interface between governments, businesses and the development community. The OECD Convention on Combating Bribery of Foreign Public Officials in International Business Transactions, in force since 1999, is a binding treaty which all 30 OECD countries and six non-OECD countries (Argentina, Brazil, Bulgaria, Chile, Estonia and Slovenia) have signed; all 36 have laws against corruption. By translating the Convention’s principles into law, they outlaw bribes to officials in foreign countries by companies under their jurisdiction. Under the Convention, regular in-depth reviews monitor what individual countries are doing to live up to their commitments. Only five OECD countries – Canada, Hungary, Poland, the United Kingdom and the United States – have legislation requiring lobbyists to provide information on their contacts with members of parliament and government officials in connection with lobbying activities. 20
212. Bribing foreign government officials in return for access to crude oil can cause enormous damage to oil companies. For example, the US Alien Tort Claims Act confers jurisdiction on the US District Court in respect of any civil action by an alien committed in violation of the law of nations or a treaty of the United States. A number of cases have been launched against oil companies under the Act alleging violations of human rights. For example, the Doe v. Unocal case, 21 concerned a claim for damages by security forces in Myanmar in connection with the construction of a gas transportation pipeline. According to the
17 “Sub-Saharan Africa – Key issues to 2012”, in Oxford Analytica, 22 Jan. 2007, p. 57.
18 OGP: Combating corruption: OGP progress report, Report No. 1.21/334, Dec. 2002.
19 C. Hoyos: “Norway’s mission to save poorer nations from ‘oil curse’ fails to win wide praise”, in Financial Times (London), 12 May 2006.
20 J. A. Gurría: “Rich must set the example of bribery”, in Financial Times (London), 13 Sep. 2006.
21 963 F. Supp. 880 (CD Cal 1997).

90 TMOGE-R-[2008-12-0110-1]-En.doc/v3
plaintiffs, Unocal and Total were party to the abuses, having used the services of the police and military and having subsidized their activities in the region, with the knowledge that human rights abuses, including forced labour, were being committed in connection with the project. Wiwa v. Royal Dutch Petroleum Ltd 22 was an action brought by members of the family of the Nigerian environmental activist, Ken Saro-Wiwa (see Chapter 6.1), in which Nigerian subsidiaries of the Royal Dutch/Shell group were alleged to have used local security forces to suppress opposition to their oil operations in Nigeria and, subsequently, to have instigated the imprisonment, torture and killing of the plaintiffs and their relatives. Recently, a group of Nigerians who were injured in 1998 during protests on an oil platform off the Nigerian coast owned by Chevron filed a lawsuit in the US Federal Court, alleging that Chevron, in conjunction with the Nigerian military, engaged in torture and assaults and was responsible for the killing of two people protesting about Chevron’s environmental record and its failure to hire locals in the Delta Region near its oil drilling operations under the US Alien Tort Claims Act. 23 The trial was scheduled to take place in late 2008. 24
213. Under the US Foreign Corrupt Practices Act of 1977, bribing foreign officials is illegal and the US Department of Justice and the Securities and Exchange Commission have stepped up enforcement against firms that do business in the United States. 25 In 2004, Norway imposed US$3 million fine on Statoil without compelling the group to admit to bribery charges. In 2006 in the United States, the company admitted to paying an Iranian official US$5 million in exchange for lucrative oil and gas rights, and under an agreement with the US Department of Justice, agreed to pay a US$21 million penalty. It also appointed an independent compliance consultant to vet its performance periodically over the term of the three year agreement with the US Department of Justice. 26 Under the same Act, early in 2007, the Chief Executive Officer and directors of Total were summoned to hearings by an investigating judge into directors’ alleged involvement in suspicious deals in the Islamic Republic of Iran, Iraq and Cameroon. 27
6.6.5. Protection for whistle-blowers
214. Whistle-blower legislation can bring corporate misconduct cases into the public domain by enabling employees to report malpractice or abuse by their employers while protecting them from victimization at work or dismissal as a result of their disclosure. For example, the United Kingdom’s Public Interest Disclosure Act 1998, amending the Employment Rights Act 1996, ensures that employees can raise genuine concerns about issues such as possible criminal offences, failures to comply with legal obligations, or possible dangers to health and safety or the environment, and protects them from unfair dismissal as result of
22 226 F.3d 88 (2nd Cir. 2000).
23 Bowoto v. Chevron, No. C99-2506SI (N.D. Calif.).
24 E. Watkins: “Chevron on trial in San Francisco for rights abuses”, in Oil & Gas Journal, 27 Oct. 2008.
25 B. Masters and D. Strauss: “DoJ to question Total chief over deals in Iran and Iraq”, in Financial Times (London), 4 Apr. 2007.
26 S. Kirchgaessner: “Statoil admits bribe for Iran oil rights”, in Financial Times (London), 14–15 Oct. 2006.
27 C. Hoyos and P. Hollinger: “Total chief questioned about Iran gas project”, in Financial Times (London), 22 Mar. 2007.
TMOGE-R-[2008-12-0110-1]-En.doc/v3 91
whistle-blowing. Although the Act does not provide protection to employees working outside the territory of the United Kingdom, the Act applies regardless of the geographical location of the relevant breaches.
6.7. The role of social dialogue in CSR
215. A prerequisite for the achievement of sustainable development in the oil industry is broad public participation in decision-making. New forms of participation have emerged in recent years, which recognize the need of individuals, groups and workers’ organizations to participate in decisions, particularly those that potentially affect the communities in which they live and work, and to have access to information relevant to the activities of oil companies. By whatever name – public participation, citizen involvement, indigenous peoples’ rights, local community consultation, or other variants – the concept that the governed should engage in their own governance is gaining ground and, more importantly, rapidly expanding in practice. Social dialogue can define and redefine major economic development projects, particularly in the energy sector.
6.7.1. Protecting indigenous people
216. Oil companies have long worked to improve the living conditions of indigenous people in areas where they operate. A project funded by the OPEC Fund for International Development in rural Nicaragua targeted the indigenous people living in the resource-rich Autonomous North Atlantic Region. The project, implemented between 2003 and 2007, had two components, namely agricultural production and organizational development. The project’s aim was to help the indigenous people become self-sufficient in basic foodstuff production. A strong emphasis on getting all the local people involved in decision-making, planning and problem-solving, especially women, who were formerly discouraged from taking an active part in community affairs, contributed markedly to the project’s success. 28
217. The rights to exploit minerals frequently involve the rights of indigenous people and there have been many conflicts between central governments and regional authorities over exploration rights in the oil and gas producing countries. Global framework agreements take into account the rights of the indigenous people. For example, an agreement between LUKOIL and ICEM states that the company respects and supports the traditions of national tolerance and appreciation, and respects the need to protect national and cultural traditions, art and crafts in the regions of the LUKOIL Group’s business activity. It also states that LUKOIL respects the religious beliefs and habits of the workers and the local population. 29 Public participation is thus injecting the human dimension into resource planning, financing, licensing and operating activities in the oil and gas industry. Until recently, the development of major exploration projects was typically controlled by the project developer, financier, landowner and the central government. But recent public participation laws are introducing additional players, such as environmental and human rights organizations, local communities, indigenous peoples and their advocates and citizens’ advisory boards. An oil company that does not pay heed to them will encounter difficulties. Public participation is moving from being merely a voluntary public relations tool to becoming a growing body of legal requirements. The ILO’s Indigenous and Tribal
28 “Strengthening the Mayangnas: A sustainable future for an indigenous minority”, in OPEC Bulletin (OPEC, Feb. 2008), Vol. 39, No. 2, pp. 34–37.
29 Text of the Global Framework Agreement between LUKOIL and ICEM, paras 2.2.1 and 2.2.2.

92 TMOGE-R-[2008-12-0110-1]-En.doc/v3
Peoples Convention, 1989 (No. 169) 30 requires governments to consult with the people concerned to ensure they can participate in developments that affect them. In Peru in 2008, in line with the Convention, an organization grouping 18 local Ashaninka communities in the Río Ene region and the state-owned oil company Pluspetrol Peru organized consultations before geological studies were carried out in Peru’s Amazon rainforest. 31
6.7.2. Procurement
218. Oil companies spend large amounts on goods and services and their purchasing power can be used in a variety of ways to advance social justice. The OECD has estimated that the global public procurement market accounts for about 20 per cent of many developed countries’ GDP. In many countries, procurement is growing as a result of the contracting out of public service functions and the growth of public–private partnerships. In Mexico, the Trade Union of Oil Workers of the Republic of Mexico (STPRM) participates in the company’s procurement process. Before placing procurement orders, PEMEX must obtain prior consent from the trade union for public bidding, and companies participating in the bid must be unionized. 32
6.7.3. Sovereign wealth funds
219. The accumulation of large oil revenues has provided oil exporting countries with the world’s largest sources of capital. Most of these assets are invested in government-owned and government-managed oil funds, which constitute a large component of broader sovereign wealth funds (SWFs). These funds include, inter alia, (year of creation): Kuwait’s Future Generations Fund 33 (1976), the United Arab Emirate’s Abu Dhabi Investment Authority (1976), Norway’s Government Pension Fund 34 (1990), Algeria’s Revenue Regulation Fund (2000), the Islamic Republic of Iran’s Oil Stabilization Fund (2000), Kazakhstan’s National Oil Fund (2000), the Russian Federation’s Stabilization Fund (2004), Libya’s Oil Reserve Fund (2005), the Qatar Investment Authority (2005),
30 The following 19 countries have ratified the Convention: Argentina, Bolivia, Brazil, Colombia, Costa Rica, Denmark, Dominica, Ecuador, Fiji, Guatemala, Honduras, Mexico, Nepal, Netherlands, Norway, Paraguay, Peru, Spain and Bolivarian Republic of Venezuela.
31 M. Salazar: “The Ashaninka people will not allow these abuses”, in IPS news, 3 Sep. 2008.
32 C. Reynoso Castillo: Industrial relations in the oil industry in Mexico (Geneva, ILO, Sectoral Activities Programme Working Paper No. 239, 2005), p. 30.
33 Kuwait was one of the first countries to set up an oil fund. In 1953, Kuwait founded an Investment Board Fund in London to invest its surplus oil revenue. Shortly after oil discovery, the role of the State, as the provider of basic services such as education and health care, considerably expanded to meet the needs of a rapidly growing population. In 1960, the General Reserve Fund was established as the main treasurer for the government. This fund received all revenues, including oil revenues, from which all the State’s budgetary expenditures were paid. In 1976, the Future Generation Fund was established. Article 2 of the relevant legislation states: “A special account hall be opened for creating a reserve which would be a substitute to the oil wealth. An amount of 50 per cent of the State’s available general fund is to be added to this account.” Article 1 states: “An amount of 10 per cent shall be allocated from the State’s general revenues every year.”
34 In 1990, the Government of Norway created the State Petroleum Fund, which was activated in 1995 following the achievement of overall budget surplus. In 2005, the Fund was renamed the Government Pension Fund. It was set up to manage Norway’s petroleum wealth in a sustainable manner and to meet many of its rising pension and health expenditures. In 2008, the Fund is valued at more than US$350 billion.

TMOGE-R-[2008-12-0110-1]-En.doc/v3 93
and the Bolivarian Republic of Venezuela’s National Development Fund (2005). Saudi Arabia has not established an oil fund, but its portfolio of foreign assets is held by the central bank and the Saudi Arabian Monetary Authority. In 2007, Ghana sought to establish an oil revenue commission to ensure that oil revenues were managed in a transparent and accountable manner and sought advice from Norway on how to ensure that its wealth is used in the country’s best long-term interests. 35
220. By 2015, the financial assets of oil funds and other SWFs will be about US$6 trillion each. At the end of 2006, oil exporters collectively owned nearly US$4 trillion in foreign financial assets, almost half of which were owned by the Gulf Cooperation Council’s member States. 36 The total is predicted to grow by about US$400 billion annually over the next few years. It is also estimated that Gulf funds earned about US$180 billion from their SWF investments in 2007 – more than half of the US$315 billion they collected in oil and gas revenues. 37 The importance of emerging SWFs has received much attention. At the World Economic Forum Annual Meeting in 2008, concerns were expressed about the potential political influence of SWFs. The World Economic Forum has acknowledged that the funds should be welcomed by global policy-makers, mainly because they represent a valuable pool of stable, long-term capital and have reduced capital market volatility. 38
221. When the source of international investment is a foreign government-owned fund, there can be concerns that investments might be driven more by political and strategic interests than by commercial prospects, particularly if there are low levels of transparency and accountability. Norway’s Government Pension Fund differs from those of most other countries in its emphasis on transparency and ethics. In November 2004, the Government appointed a Council of Ethics, which established ethical guidelines for the then State Petroleum Fund. Comprehensive accounts and data on the Fund’s operations are readily available. 39 Most other SWFs are less transparent and do not reveal their investment objectives and strategies or their activities and performance. The most important determinant of the level of transparency of an SWF may be the fund’s obligations to the shareholders and the public, including workers. Global tripartite social dialogue could play a role in this context.
35 “Oil compounds NPP party politics”, in Oxford Analytica, 19 Dec. 2007.
36 G. Bahgat: “Oil funds: Threat or opportunity?”, in Oil & Gas Journal, 21 Apr. 2008, pp. 18–24.
37 E. Thornton and S. Reed: “Who’s afraid of MidEast money?”, in Businessweek, 21 Jan. 2008, p. 44.
38 World Economic Forum: The power of collaborative innovation, World Economic Forum Annual Meeting 2008, Davos, Switzerland, 23–27 Jan. 2008, p. 13.
39 G. Bahgat, op. cit.

94 TMOGE-R-[2008-12-0110-1]-En.doc/v3
7. Summary and points for discussion
7.1. Summary
7.1.1. The oil industry in context
222. High crude oil prices are relatively recent phenomenon. For over two decades, up until 2001, low crude oil prices affected both international oil companies (IOCs) and national oil companies (NOCs). IOCs consolidated through mergers and acquisitions and drastically reduced their workforce in order to remain profitable. NOCs needed to maintain financial returns to their governments and many confined their activities nationally. In recent years, combinations of IOC expertise and NOC resources and capital have led to new forms of collaboration, especially concerning those oilfields which are difficult to exploit.
7.1.2. Employment trends
223. Employment in NOCs has remained fairly stable, as has the mix of core and non-core workers. Employment in IOCs has been volatile. In the oil and gas exploration sector, it is estimated that employment peaked at about 4 million jobs in 2004, the gradually declined to the current level of about 3 million. Many jobs in oil and gas exploration and production in the United States were lost between 1991 and 2003, particularly those of non-production workers, as business slumped and companies merged. World oil refining employment is estimated to be more than 1.5 million, with increases in the Asian region offsetting decreases elsewhere.
224. Employment volatility led to and has sustained an increase in contract labour, which has become the norm in the oil industry but not without problems. Issues between expatriate contract workers and national workers, owing to perceived or real unequal treatment, have caused industrial relations problems, as have issues between “own” employees and contract workers at the national level. Of huge significance is the shortage of skilled workers. By 2010, there will be a deficit of more than 6,000 skilled workers in the oil industry. This problem has its roots in the job cuts and lack of recruitment during the 1990s and in the industry’s generally poor image among young people.
225. Employment opportunities for women in the oil industry are increasing, but from a very low base. Not surprisingly, more women work in the refining sector than in exploration and production. In the former, women are more likely to have a managerial role, whereas in the latter, they tend to occupy non-production positions, such as in information technology and administration. The acute shortage of skilled workers has led oil companies actively to seek more women workers and, in some IOCs, women exceed 20 per cent of the workforce. In one oil company, 36 per cent of the women who were recently hired filled management positions.
7.1.3. Conditions of work
226. Oil workers, especially those in exploration and production, are generally well paid compared with those in other industries. But there are wage gaps, depending on occupation, skills and gender. Some workers, mainly in developing countries, do not earn enough to maintain a decent livelihood. Many others, especially those in NOCs, enjoy a comprehensive package of benefits, offered partly as a means to retain them in the long term. Earnings in IOCs tend to be closely linked to corporate performance, although skills shortages and 24-hour a day operations put upward pressure on wages; recent years have

TMOGE-R-[2008-12-0110-1]-En.doc/v3 95
seen higher wage increases than in the past, because of skills shortages. Salaries for non-production workers, including managerial workers and skilled service workers, have increased at higher rates than those of production workers. Wage increases for oil production workers have not matched those of chemical workers and primary metal workers in a number of countries.
227. Many oil workers work more than 40 hours a week and some work over 50 hours a week, especially in oil production. Premiums for overtime and holiday work are generally higher than in other industries. One adverse effect of this has been to encourage low-skilled workers in some locations to work more overtime in order to earn more. With respect to annual holidays, non-unionized workers (often contract workers) tend to have less paid leave than those which are unionized.
228. Increasing amounts of work take place round the clock in difficult, remote areas. The scheduling of shifts can pose difficulties, particularly offshore when rotation patterns are constrained by transport schedules and limits on accommodation. More attention needs to be given to improving work–family life balance if skilled workers are to be attracted to and, more importantly, retained in the oil industry.
229. Occupational safety and health performance can affect industrial relations and heighten perceptions by some that the oil industry is a dangerous sector in which to work. Contract workers are twice as likely to be involved in a fatal accident as regular company employees and all workers aged between 21 and 35 years old are more prone to accidents than any other age group. Paradoxically, despite the image of offshore work as dangerous, the fatal accident rate onshore is almost twice as high as that offshore. Following increased and sustained action to address the occupational safety and health hazards and risks of offshore operations, the major risk to offshore workers’ safety probably occurs during their travel to and from production and exploration areas (often by helicopter). Now that most safety and health risks have been eliminated or are controlled, thanks to the redesign of both equipment and tasks, occupational safety and health culture, or the lack of it, is the key to sustained improvements in performance in this regard. Some recent disasters brought this into stark focus. Strong, committed leadership by top management is essential, with no “disconnect” between different levels of management, supervision and operation, if occupational safety and health processes and systems are to developed and implemented. Ensuring such outcomes requires the wholehearted involvement and commitment of all levels of an organization, underpinned by effective social dialogue and sound industrial relations.
230. Family-friendly policies benefit both oil companies and workers, although their introduction and implementation has not been consistent. Successful family-friendly initiatives depend on two-way communication – top management to employees and vice versa – together with a full understanding of the needs of all parties.
231. Working offshore is characterized by being away from one’s family for extended periods, long working hours, harsh weather, close proximity to work colleagues, reliance on helicopter travel and basic accommodation. The offshore environment can be stressful because workers live and work at a location with many restrictions for significant periods. Life offshore has been described as dangerous, arduous and socially isolating; the environment is characterized by constant noise and activity, with crowded living conditions. Multi-skilling and other forms of work organization are additional challenges for workers. The design of shift rosters is important, both for production needs and workers’ well-being. Certain rosters can be inherently more risky as far as fatigue is concerned. Overtime, whether planned or not, markedly increases this risk. Documented risk assessment and risk management procedures that can be audited should be developed and implemented to deal with fatigue, with the involvement of all concerned. Fortunately, many jurisdictions have an effective legal framework which promotes workers’

96 TMOGE-R-[2008-12-0110-1]-En.doc/v3
participation on safety and health matters, but “softer” issues, such as occupational safety and health culture and fatigue require particular attention.
7.1.4. Industrial relations
232. Cases discussed by the ILO’s Committee on Freedom of Association (CFA) show that some of the principles of freedom of association have not been respected in the oil industry. Almost one-third of cases involving the oil industry concerned civil liberties. The other cases concerned the right to strike, state interference, restrictive legislation, the infringement of free and voluntary collective bargaining, barriers to establishing organizations and the dismissal of trade union leaders and trade union members in decreasing order of occurrence.
233. Violations of civil liberties in the oil industry have included murder, abductions, disappearances, threats, arrests and the detention of trade union leaders and members, as well as other acts of anti-union harassment and intimidation. In most of the cases, due process was lacking and the resulting impunity often led to further infringements. The second most common complaint concerned restrictions on the right to strike, based on the argument that the oil industry is an essential service. According to the CFA, this concept is only partly true. First, the right to strike is one of the essential means for workers and their organizations to promote and defend their economic and social interests. This right may be restricted or prohibited in essential services in the strict sense of the term, in other words in services the interruption of which would endanger the life, personal safety or health of whole or part of population. Second, the right to strike cannot be considered an absolute right, and workers deprived of the right to strike because they perform essential services must have appropriate guarantees to safeguard their interests. In other words, restrictions on the right to strike should be accompanied by adequate, impartial and speedy conciliation and arbitration proceedings. The CFA has consistently stated that it does not regard the oil and gas industry as an essential service and therefore the right to strike should not be prohibited.
234. Unionization levels are low and falling throughout the oil industry, although union membership is more widespread in the refining sector than in exploration and production. It is extremely low on offshore facilities and among women workers. Low levels of unionization have implications for industrial relations. Well-developed workers’ and employers’ organizations have often been able to negotiate durable collective agreements and achieve longer periods of industrial harmony. When disputes do occur, capable, representative organizations can generally speed up dispute resolution and achieve a more equitable and lasting outcome. Where strong social partners are present, social dialogue and collective bargaining are key instruments that can enable management and workers’ organizations to agree on terms of employment, working conditions and a body of rules which they can use to resolve their differences.
235. Problems with multiple-employers’ employment relationships are frequently observed in the oil industry, most often involving contractors and subcontractors. There are two major concerns, namely that there will be a “dualization” of the workforce into core and peripheral workers, and that complex employment practices can make it difficult to determine the identity of the employer and other parties and their rights and responsibilities. Effective collective bargaining and subsequent collective agreements can protect contract workers’ rights. International framework agreements (IFAs) or global framework agreements (GFAs) have been negotiated in order to address the problems of contract labour in the context of the global supply chains in the oil industry. Furthermore, the importance of laws and regulations should not be underestimated. National legislation should clearly stipulate the employer’s responsibilities and obligations when using contract labour, and the rights of contract workers.

TMOGE-R-[2008-12-0110-1]-En.doc/v3 97
236. IFAs or GFAs have been signed by more than 60 multinational companies, including by four in the oil and gas industry. These have some significant features that advance transnational industrial relations, corporate social responsibility (CSR) and the discussion of a wide range of issues arising between multinational enterprises and workers and their organizations. The global dimension of workers’ representation is clearly of increasing relevance in the oil and gas sector and IFAs and GFAs are an important means to address global issues within enterprises.
237. Partnership agreements have been introduced as a means to achieve peaceful industrial relations in the absence of trade unions. Although the results are not decisive, partnership agreements appear to have had a limited impact on working conditions. They do not necessarily reflect genuine partnership and the outcomes have often been rather one-sided.
238. Corporate culture can also affect employee–employer relations. In NOCs in the Middle East, employee–employer relations are affected by the national culture of dialogue, both formal and informal, which can enhance internal transparency. Closer relations with IOCs have also influenced corporate culture in some NOCs. Regardless of the origins of oil companies and their traditions, dialogue should be at the centre of employee–employer relations if trust and confidence between the parties concerned are to be fostered. This is particularly important in times of change, such as before and during merger and acquisition activity.
7.1.5. Human resources development
239. The shortage of skilled workers is a global phenomenon. Oil companies have diversified their recruitment processes in order to meet current and future business needs, including through significant investments in education and training. Some oil companies have established in-house academies to upgrade their workers’ skills and competence and increase their motivation. But the oil industry alone is unable sufficiently to increase the pool of skilled workers; governments have a key role to play. Joint government-oil industry initiatives have provided students with jobs and career prospects once they enter the oil industry. Government skills development programmes and employment services can play a more effective strategic role than can the industry. Countries of the European Union have recognized the need to transform their education systems to feed the needs of a competitive knowledge-based economy. Opportunities for greater dialogue between governments and the oil industry, including workers’ representatives, should be created so that the larger pool of skilled entrants to the workforce is well equipped for oil industry work.
7.1.6. Corporate social responsibility and corporate governance
240. CSR is built on the notion of corporate engagement with society and is part of an integrated strategy for effective corporate engagement. Corporate governance is more than the way a company is run; it encompasses the way and the extent to which a company complies with the law, transparency and accountability requirements, ethical norms and environmental and social codes of conduct. As far as the oil industry is concerned, CSR is more than a voluntary initiative; best business practice models show that it is a de facto requirement for oil companies to be just and fair in all dimension of their business.
241. Without good corporate governance, no other form of corporate engagement is credible. A key part of good corporate governance is the development and implementation of programmes to promote ethics, moral standards and socially acceptable practices. These should include respect for human rights, basic workers’ rights and adherence to the core

98 TMOGE-R-[2008-12-0110-1]-En.doc/v3
international labour standards, as well as in-house efforts to prevent bribery and corruption. These will not be achieved, implemented and sustained without dialogue and consultation at all levels of the organization.
242. The costs of poor CSR and poor corporate governance are high and long-lasting. The oil industry has therefore developed due diligence practices in order to increase compliance with good governance principles and international and national laws. Increased transparency, engagement with and contribution to local communities, for example, through community employment creation, are important aspects of CSR. Concerns about corruption associated with the development of natural resources led to the Extractive Industries Transparency Initiative. Given the lack of effectiveness of some of voluntary initiative schemes, there is also a need for a legal framework, such as the OECD’s anti-bribery convention.
243. Exploring for and producing oil and gas often involve the rights of indigenous people. Social dialogue can contribute to improving the living conditions of indigenous people and their rights through a participatory approach. In a similar context, dialogue between indigenous people who are affected by the development of natural resources and the oil industry is important to ensure they can participate in the whole process. In another context, social dialogue can also bring together the industry and trade unions to protect workers’ rights in the massive oil industry procurement market.
244. Social dialogue can increase democracy and transparency in the management of sovereign wealth funds (SWFs); by 2010 they may exceed US$12 trillion. A lack of transparency is making it difficult for some recipient countries to accept capital inflows from SWFs. Norway, however, has shown that the successful management of a SWF requires transparency and ethics based on dialogue and has taken measures in this regard.
7.2. Suggested points for discussion
245. In the light of the foregoing treatment of the issues, the following points are offered as a basis for discussions at the meeting:
1. How can decent employment creation, increased efficiency and competitiveness in the oil industry be better combined? Which social measures should accompany changing employment practices?
2. What are the key elements that underpin good industrial relations in the oil industry? What measures could be taken by governments and the social partners to promote and ensure good industrial relations?
3. What challenges and opportunities are presented by contract labour in the oil industry? What measures could be taken in order to address the implications of a contract workforce on workers’ rights and their safety and health?
4. What skills and qualifications are conducive to the sustainable development of employment in the oil industry? How could the industry be made more attractive to young workers and provide better opportunities for training and career development, particularly for women?
5. How can social dialogue, good governance practices and voluntary initiatives promote sustainable enterprises and contribute to decent work in the oil industry?
6. What measures should the ILO take to contribute to promoting social dialogue and good industrial relations in the oil industry?

TMOGE-R-[2008-12-0110-1]-En.doc/v3 99
App
endi
x I
Empl
oym
ent i
n pe
trol
eum
refin
ing
in s
elec
ted
co
untr
ies,
199
0–20
05
Coun
try
19
9019
9119
9219
9319
9419
9519
9619
9719
9819
9920
0020
0120
0220
0320
0420
05Ar
genti
na
7 0
715 0
884 8
664 8
847 3
537 1
626 8
456 8
027 0
657 1
62
Arub
a
750
750
670
580
580
550
590
480
330
280
250
260
280
280
290
310
Austr
alia
4 0
004 0
004 0
003 9
344 0
533 6
493 5
833 6
653 5
074 0
503 8
114 5
47
Au
stria
3 6
633 7
533 5
213 3
083 5
52–
––
––
––
––
–
Azer
baija
n
4 732
4 666
4 872
5 672
6 202
11 34
69 0
777 7
547 0
186 6
596 6
786 1
886 3
106 4
306 7
486 7
24Be
lgium
4 128
4 260
4 216
3 968
––
–4 0
054 0
97
Bo
livia
60
261
21 0
751 0
681 0
8495
886
992
982
190
493
084
8
Br
azil
23 97
423
621
21 66
720
965
22 16
423
505
25 38
725
536
27 04
3
Bulga
ria
11 71
013
072
12 80
011
710
10 38
710
334
9 177
8 054
––
Came
roon
535
542
567
560
563
566
620
601
––
–
Cana
da
15
277
13 84
413
066
12 99
712
417
11 14
611
183
11 75
210
388
10 36
38 2
147 9
277 7
74
Chile
1 242
1 284
1 315
1 319
1 324
1 306
1 273
1 224
1 192
1 482
1 478
2 821
2 829
2 864
China
510 0
0057
0 000
590 0
0046
0 000
710 0
0072
0 000
760 0
0077
6 000
780 0
0071
6 000
637 0
0059
2 000
559 0
00
China
(Hon
g Kon
g SAR
)
010
010
010
010
010
010
010
010
010
0–
––
100
China
(Taiw
an P
rovin
ce)
16
924
16 15
916
159
16 18
815
874
Colom
bia
5 4
004 7
896 3
036 6
236 3
016 0
905 9
526 1
245 6
153 2
134 5
683 9
983 8
293 6
503 6
113 4
00Co
sta R
ica
2 1
152 7
602 3
182 3
892 5
162 3
401 3
7949
753
72 0
4970
12 0
682 1
271 7
79
Cr
oatia
4 965
4 413
4 453
4 446
4 530
4 291
4 265
3 961
4 039
Cypr
us
14
314
115
715
215
314
314
414
314
714
214
614
314
314
074
59De
nmar
k
621
630
674
989
928
268
239
211
––
––
–
Ecua
dor
1 6
651 4
101 4
102 6
322 2
772 6
182 5
702 7
262 6
812 6
172 5
772 5
732 8
842 7
052 6
822 5
66Eg
ypt
17
200
18 40
017
500
17 70
018
301
17 50
2
18 96
143
092
26
048
Es
tonia
–
––
––
––
––
–1 0
001 0
001 0
00Fr
ance
23 89
422
387
22 76
222
805
21 64
9–
19 40
218
450
18 60
117
711
17 15
517
810
17 61
621
163
Geor
gia
743
121
144
8587
131
199
44Ge
rman
y
39 54
032
874
29 79
727
907
23 15
521
246
19 89
6–
––
––
––
Gr
eece
4 633
4 111
4 108
4 182
4 261
4 118
3 711
3 596
3 531
Hu
ngar
y
––
17 41
116
736
15 70
214
469
––
–10
547
8 794
7 297
6 144

100 TMOGE-R-[2008-12-0110-1]-En.doc/v3
Coun
try
19
9019
9119
9219
9319
9419
9519
9619
9719
9819
9920
0020
0120
0220
0320
0420
05Ind
ia
22 19
321
498
24 39
527
448
30 47
231
055
30 69
432
835
43 78
643
698
41 32
444
319
46 88
748
171
47 82
4
Indon
esia
12 46
013
476
13 24
911
797
12 97
313
261
13 26
1Isl
amic
Repu
blic o
f Iran
18
113
15 37
616
079
16 62
517
114
16 51
516
566
17 01
417
402
16 27
116
256
Ita
ly
13 06
015
376
22 32
320
493
24 48
924
429
23 85
323
245
25 86
525
185
24 59
623
713
16 86
717
388
16 74
1
Japa
n
21 00
021
000
21 00
022
000
23 67
023
319
22 68
321
824
20 93
018
744
17 24
116
156
15 32
515
422
14 67
915
295
Jord
an
3 3
743 4
043 5
443 8
443 9
473 8
633 5
853 5
333 4
593 5
203 4
18–
–3 4
933 5
713 4
31Ke
nya
26
426
426
426
426
426
623
023
023
0–
268
––
––
Ku
wait
4 8
563 7
584 1
334 7
535 0
655 2
775 3
105 1
435 2
075 1
034 8
904 8
49
Ky
rgyz
stan
0
00
00
00
516
482
381
366
428
370
238
255
Latvi
a
133
123
120
396
8688
107
–13
211
941
3949
4739
42Lit
huan
ia
2 953
3 089
3 200
–3 2
113 5
033 4
023 5
043 7
983 5
163 5
753 5
853 5
313 4
54Ma
laysia
1 100
1 200
1 200
1 300
2 700
2 700
2 600
3 700
3 800
8 209
5 347
5 595
4 644
4 353
Me
xico
4 897
4 029
4 615
4 718
4 891
5 166
5 028
Mo
rocc
o
2 3
062 6
202 3
462 2
472 1
122 5
97Mo
zamb
ique
45
546
074
545
846
9
My
anma
r
––
––
––
––
–4 8
084 3
384 3
024 6
384 6
59
Ne
pal
–
8 259
8 384
6 720
5 256
––
––
–
Norw
ay
1 1
921 4
061 3
151 5
741 7
361 6
36–
––
––
––
––
Om
an
58
450
949
350
753
954
958
598
71 0
221 1
781 1
781 1
571 2
01Pa
nama
429
434
434
460
457
465
407
454
–
Peru
3 782
3 780
2 989
2 553
2 1
792 8
91
2 219
2 478
2 450
––
Philip
pines
2 500
2 400
2 500
2 600
2 700
2 600
2 200
2 100
1 900
900
900
900
Polan
d
––
––
14 62
515
996
14 58
814
002
14 41
312
388
11 82
610
938
9 605
Po
rtuga
l
––
–3 7
273 5
533 4
513 3
823 1
452 7
932 6
45–
2 543
2 335
2 136
2 121
Qa
tar
1 583
1 632
1 708
1 556
1 806
Re
publi
c of K
orea
8 511
9 066
9 067
9 258
9 839
11 66
111
413
11 73
011
446
10 79
010
963
11 07
59 5
509 2
029 0
049 2
02Ro
mania
––
––
––
––
––
––
–9 3
388 6
717 3
41Ru
ssian
Fed
erati
on
10
7 800
111 5
0011
6 800
132 3
0013
0 300
119 6
0013
7 413
154 0
9815
1 172
113 3
0210
6 763
124 8
8711
3 026
Sene
gal
32
6–
245
299
228
228
247
251
227
236
235
237
244
Si
ngap
ore
3 2
913 5
503 6
403 7
133 7
523 7
003 5
313 4
443 3
063 1
522 8
552 8
502 9
483 1
223 0
45
Slov
akia
8 5
498 0
237 5
106 4
68–
––
––
––
––
–
South
Afric
a
18 72
218
691
17 67
516
731
15 36
614
760
13 38
712
841
12 64
112
571
30 72
716
640
Sp
ain
7 2
297 0
827 0
517 9
477 3
95–
––
––
––
––
–
Sri L
anka
1 352
978
1 061
1 207
1 204
1 230
1 506
1 506
1 775
1 501
1 514
2 746

TMOGE-R-[2008-12-0110-1]-En.doc/v3 101
Coun
try
19
9019
9119
9219
9319
9419
9519
9619
9719
9819
9920
0020
0120
0220
0320
0420
05Sw
eden
1 806
1 861
1 755
1 804
1 777
––
––
––
––
–
Ta
nzan
ia, U
nited
Rep
ublic
of
35
948
5
368
369
365
372
387
409
Th
ailan
d
–2 4
3013
745
5 623
6 7
88
7 560
7 096
Tr
inida
d and
Tob
ago
2 4
662 4
662 6
082 6
082 9
423 1
05
2 2
492 5
382 2
872 2
472 1
422 5
69
Tu
nisia
48
448
448
476
775
175
372
368
665
462
463
763
363
4Tu
rkey
5 0
214 9
214 9
425 0
785 1
075 1
975 4
324 9
416 9
266 7
846 4
017 1
27
Uk
raine
15 00
015
000
16 00
017
000
17 00
017
000
17 00
017
000
18 00
019
000
Un
ited K
ingdo
m
9 000
8 000
8 000
21 41
413
000
14 54
313
621
12 51
2–
–12
197
10 13
3–
10 57
2–
Un
ited S
tates
of A
meric
a
72 00
074
000
75 00
073
000
72 00
070
000
80
324
80 01
977
387
75 71
076
322
74 59
795
869
Urug
uay
2 0
611 8
131 4
8661
510
097
695
01 0
541 5
871 2
871 2
7695
689
084
094
0
Vene
zuela
, Boli
varia
n Rep
ublic
of
7 1
007 8
007 7
006 5
926 4
76
So
urce
: Unit
ed N
ation
s Ind
ustria
l Dev
elopm
ent O
rgan
izatio
n (UN
IDO)
INDS
TAT4
2008
ISIC
Rev
.2 an
d 3.

102 TMOGE-R-[2008-12-0110-1]-En.doc/v3
App
endi
x II
Rea
l wag
es p
er re
finin
g em
ploy
ee in
US
dolla
rs a
nd n
atio
nal c
urre
ncy,
se
lect
ed c
ount
ries,
non
-adj
uste
d, 1
990–
2005
1990
1991
1992
19
9319
9419
9519
9619
9719
98
1999
2000
2001
2002
2003
2004
2005
Azer
baija
n
US
dolla
rs Am
ount
87
2.69
1 210
.811 2
29.25
1 133
.791 1
16.50
1 208
.991 5
03.64
1 998
.58
Index
100.0
0 13
8.74
140.8
612
9.92
127.9
413
8.54
172.3
022
9.01
Natio
nal
curre
ncy
Amou
nt
4 739
160
6 644
000
7 345
600
6 534
000
6 849
000
7 635
000
9 971
000
12 70
5 000
Index
100.0
0 14
0.19
155.0
013
7.87
144.5
216
1.10
210.4
026
8.09
Alba
nia
US
dolla
rs Am
ount
405.3
067
3.03
825.9
782
1.14
569.7
8
Index
10
0.00
166.0
620
3.79
202.6
014
0.58
Natio
nal
curre
ncy
Amou
nt
41
365.8
263
683.8
876
565.3
785
807.8
884
859.3
1
Index
10
0.00
153.9
518
5.09
207.4
420
5.14
Arge
ntin
a
US
dolla
rs Am
ount
16 83
1.90
34 04
6.49
33 32
1.96
35 70
5.79
30 21
3.30
21 85
2.35
44 00
4.13
48 08
8.32
47 95
1.06
49 70
6.38
18 46
0.22
Index
10
0.00
202.2
719
7.97
212.1
317
9.50
129.8
326
1.43
285.7
028
4.88
295.3
110
9.67
Natio
nal
curre
ncy
Amou
nt 8 2
07.05
34 01
0.61
33 28
8.90
35 69
6.86
30 20
3.09
21 84
1.43
43 98
2.13
48 06
4.28
47 92
7.08
49 68
1.53
56 54
8.45
Index
10
0.00
414.4
140
5.61
434.9
536
8.01
266.1
353
5.91
585.6
558
3.97
605.3
568
9.02
Aust
ralia
US
dolla
rs Am
ount
40 18
1.57
41 28
4.98
43 51
3.38
39 92
9.59
44 19
5.98
48 55
1.48
46 08
4.23
50 62
6.27
48 18
5.88
43 17
1.44
37 61
3.98
47 57
1.27
Index
10
0.00
102.7
510
8.29
99.37
109.9
912
0.83
114.6
912
5.99
119.9
2 10
7.44
93.61
118.3
9
Natio
nal
curre
ncy
Amou
nt 51
475.0
053
000.0
059
250.0
0 58
718.8
660
449.0
565
497.4
058
889.2
068
212.8
276
703.7
4 66
913.5
864
877.7
291
976.2
0
Index
10
0.00
102.9
611
5.10
114.0
711
7.43
127.2
411
4.40
132.5
214
9.01
129.9
912
6.04
178.6
8
Boliv
ia
US
dolla
rs Am
ount
5 905
.966 4
14.82
6 587
.08
5 145
.227 8
97.55
7 619
.488 7
15.06
9 985
.0312
027.4
5 11
647.4
311
149.7
713
192.1
1
Index
10
0.00
108.6
211
1.53
87.12
133.7
212
9.01
147.5
616
9.07
203.6
5 19
7.21
188.7
922
3.37
Natio
nal
curre
ncy
Amou
nt 18
737.5
422
968.9
525
693.0
2 21
944.7
636
490.7
736
576.1
244
225.5
552
463.9
466
272.8
4 67
699.6
568
945.0
387
159.2
0
Index
10
0.00
122.5
813
7.12
117.1
219
4.75
195.2
023
6.03
279.9
935
3.69
361.3
036
7.95
465.1
6

TMOGE-R-[2008-12-0110-1]-En.doc/v3 103
1990
1991
1992
19
9319
9419
9519
9619
9719
98
1999
2000
2001
2002
2003
2004
2005
Cam
eroo
n
US
dolla
rs Am
ount
29 52
2.03
26 32
7.67
28 83
2.67
25 10
5.17
14 13
5.90
17 36
8.88
17 83
3.10
15 03
5.27
14 26
5.79
14 20
9.46
Index
10
0.00
89.18
97.66
85
.0447
.8858
.8360
.4150
.9348
.32
48.13
Natio
nal
curre
ncy
Amou
nt 8 0
37 81
5.13
7 427
221.1
77 6
31 77
5.70
7 108
856.0
97 8
48 32
4.51
8 669
642.8
69 1
22 55
7.73
8 775
618.3
78 4
16 12
9.03
8 748
752.0
8
Index
10
0.00
92.40
94.95
88
.4497
.6410
7.86
113.5
010
9.18
104.7
1 10
8.84
Cana
da
US
dolla
rs Am
ount
43 76
7.55
44 94
9.90
45 29
5.85
42 99
1.11
42 10
4.80
42 68
5.54
42 68
7.73
48 17
0.62
44 81
4.46
46 26
7.30
46 57
4.02
44 60
8.99
47 04
2.05
Index
10
0.00
102.7
010
3.49
98.23
96.20
97.53
97.53
110.0
610
2.39
105.7
110
6.41
101.9
210
7.48
Natio
nal
curre
ncy
Amou
nt 51
066.6
751
500.0
054
750.0
0 55
461.5
457
500.0
058
583.3
558
203.4
366
698.0
166
480.4
6 68
740.7
169
167.5
469
088.6
273
824.0
3
Index
10
0.00
100.8
510
7.21
108.6
111
2.60
114.7
211
3.98
130.6
113
0.18
134.6
113
5.45
135.2
914
4.56
Colo
mbi
a
US
dolla
rs Am
ount
5 613
.905 2
24.87
6 596
.24
7 434
.959 1
53.10
9 208
.209 9
28.14
9 355
.7410
488.6
5 10
168.5
67 5
74.55
9 389
.929 1
39.80
8 196
.308 7
99.34
9 442
.39
Index
10
0.00
93.07
117.5
0 13
2.44
163.0
416
4.03
176.8
516
6.65
186.8
3 18
1.13
134.9
216
7.26
162.8
114
6.00
156.7
416
8.20
Natio
nal
curre
ncy
Amou
nt 2 8
19 62
9.63
3 307
579.8
75 0
08 40
8.69
6 416
844.3
37 7
32 86
4.62
8 405
481.1
210
292 4
04.23
10 67
4 528
.0914
957 2
34.19
17
858 3
28.66
15 81
4 894
.7021
593 3
35.92
22 88
8 244
.9723
586 0
82.74
23 13
0 045
.1421
914 1
83.24
Index
10
0.00
117.3
117
7.63
227.5
827
4.25
298.1
136
5.03
378.5
853
0.47
633.3
656
0.89
765.8
281
1.75
836.5
082
0.32
777.2
0
Cost
a Rica
US
dolla
rs Am
ount
5 166
.126 2
13.60
7 035
.39
7 868
.449 0
60.29
9 341
.6411
655.4
25 7
12.42
10 85
7.36
11 23
6.72
11 72
6.90
11 75
1.37
13 57
7.75
Index
10
0.00
120.2
813
6.18
152.3
117
5.38
180.8
322
5.61
110.5
721
0.16
217.5
122
7.00
227.4
726
2.82
Natio
nal
curre
ncy
Amou
nt 47
3 109
.6976
0 743
.4894
6 301
.98
1 118
672.2
51 4
23 07
3.13
1 678
964.1
02 4
20 70
1.96
1 328
692.1
52 7
92 82
6.82
3 210
161.0
53 6
14 07
7.03
3 864
683.7
54 8
85 50
5.41
Index
10
0.00
160.8
020
0.02
236.4
530
0.79
354.8
851
1.66
280.8
459
0.31
678.5
276
3.90
816.8
71 0
32.64
Croa
tia
US
dolla
rs Am
ount
9 756
.856 1
36.47
1 927
.55
2 173
.613 4
46.24
5 258
.935 5
96.09
Index
10
0.00
62.89
19.76
22
.2835
.3253
.9057
.36
Natio
nal
curre
ncy
Amou
nt 10
9.28
147.2
850
8.87
7 775
.9220
664.0
727
504.0
230
408.0
5
Index
10
0.00
134.7
746
5.67
7 115
.8118
909.8
625
169.1
527
826.6
5
Cypr
us
US
dolla
rs Am
ount
26 85
2.73
29 38
1.06
31 28
4.01
34 57
4.18
33 99
4.99
55 98
4.86
48 34
0.42
44 61
9.97
39 26
6.73
40 11
7.45
37 11
8.26
36 63
3.78
40 06
8.99
50 90
9.67
52 05
2.61
26 18
6.83
Index
10
0.00
109.4
211
6.50
128.7
512
6.60
208.4
918
0.02
166.1
714
6.23
149.4
013
8.23
136.4
214
9.22
189.5
919
3.84
97.52
Natio
nal
curre
ncy
Amou
nt 12
300.7
013
645.3
914
063.6
9 17
197.3
716
732.0
325
328.6
722
541.6
722
930.0
720
333.3
3 21
781.6
923
102.7
423
559.4
424
468.5
345
009.4
441
676.0
320
763.8
5
Index
10
0.00
110.9
311
4.33
139.8
113
6.02
205.9
118
3.26
186.4
116
5.30
177.0
818
7.82
191.5
319
8.92
365.9
133
8.81
168.8
0

104 TMOGE-R-[2008-12-0110-1]-En.doc/v3
1990
1991
1992
19
9319
9419
9519
9619
9719
98
1999
2000
2001
2002
2003
2004
2005
Denm
ark
US
dolla
rs Am
ount
44 75
5.58
45 41
2.02
48 42
2.56
43 99
1.56
45 54
0.44
54 50
5.32
56 49
3.34
54 06
2.74
53 46
6.17
Index
10
0.00
101.4
710
8.19
98.29
101.7
512
1.78
126.2
312
0.80
119.4
6
Natio
nal
curre
ncy
Amou
nt 27
6 972
.6229
0 476
.1929
2 284
.87
285 2
38.62
289 6
62.23
305 3
58.95
327 5
86.21
357 0
55.21
358 2
67.72
Index
10
0.00
104.8
810
5.53
102.9
810
4.58
110.2
511
8.27
128.9
112
9.35
Ecua
dor
US
dolla
rs Am
ount
4 913
.549 1
60.04
8 945
.93
11 63
5.95
8 192
.806 1
04.83
9 510
.028 8
09.39
8 788
.78
3 573
.814 1
29.61
5 506
.416 3
61.30
7 024
.0315
042.8
819
893.6
1
Index
10
0.00
186.4
218
2.07
236.8
116
6.74
124.2
519
3.55
179.2
917
8.87
72.73
84.05
112.0
712
9.46
142.9
530
6.15
404.8
7
Natio
nal
curre
ncy
Amou
nt 4 9
13.54
9 160
.048 9
45.93
11
635.9
58 1
92.80
6 104
.839 5
10.02
8 809
.398 7
88.78
3 5
73.81
4 129
.615 5
06.41
6 361
.307 0
24.03
15 04
2.88
19 89
3.61
Index
10
0.00
186.4
218
2.07
236.8
116
6.74
124.2
519
3.55
179.2
917
8.87
72.73
84.05
112.0
712
9.46
142.9
530
6.15
404.8
7
Egyp
t
US
dolla
rs Am
ount
4 927
.333 0
18.96
3 765
.48
4 252
.624 8
55.40
6 074
.326 3
41.63
7 8
36.53
Index
10
0.00
61.27
76.42
86
.3198
.5412
3.28
128.7
0
159.0
4
Natio
nal
curre
ncy
Amou
nt 9 8
54.65
10 05
9.78
12 57
1.43
14 33
8.98
16 46
4.67
20 59
1.93
21 48
5.44
35
261.7
9
Index
10
0.00
102.0
812
7.57
145.5
016
7.08
208.9
621
8.02
35
7.82
El S
alvad
or
US
dolla
rs Am
ount
19 08
2.14
23 55
4.03
25 27
2.07
25 27
0.86
21 46
1.75
27 39
8.27
Index
10
0.00
123.4
313
2.44
132.4
311
2.47
143.5
8
Natio
nal
curre
ncy
Amou
nt
16
6 062
.5020
5 597
.2222
1 246
.3822
1 246
.3818
7 924
.5323
9 871
.79
Index
10
0.00
123.8
113
3.23
133.2
311
3.16
144.4
5
Fran
ce
US
dolla
rs Am
ount
59 28
4.58
56 05
6.97
36 92
1.27
56 04
7.69
50 60
8.28
52 14
7.63
50 61
3.40
46 86
8.01
47 42
6.09
58 11
9.18
61 61
0.32
56 01
1.61
Index
10
0.00
94.56
62.28
94
.5485
.3687
.96
85.37
79.06
80.00
98.03
103.9
294
.48
Natio
nal
curre
ncy
Amou
nt 49
213.6
848
216.6
229
796.8
7 43
709.1
345
031.1
546
900.3
3 47
507.2
550
870.5
452
999.1
361
757.4
454
586.7
445
111.7
5
Index
10
0.00
97.97
60.55
88
.8291
.5095
.30
96.53
103.3
710
7.69
125.4
911
0.92
91.67
Gree
ce
US
dolla
rs Am
ount
18 28
8.54
19 84
1.18
22 06
1.53
19 59
1.48
22 94
1.66
29 70
0.63
34 07
7.21
30 23
8.41
29 79
5.90
Index
10
0.00
108.4
912
0.63
107.1
212
5.44
162.4
018
6.33
165.3
416
2.92
Natio
nal
curre
ncy
Amou
nt 8 5
07.66
10 61
2.99
12 34
1.77
13 18
0.77
16 33
3.72
20 19
2.33
24 07
2.76
24 23
1.37
25 84
1.69
Index
10
0.00
124.7
514
5.07
154.9
319
1.99
237.3
428
2.95
284.8
230
3.75

TMOGE-R-[2008-12-0110-1]-En.doc/v3 105
1990
1991
1992
19
9319
9419
9519
9619
9719
98
1999
2000
2001
2002
2003
2004
2005
Guat
emala
US
dolla
rs Am
ount
1 144
.461 1
06.90
1 0
15.63
1 008
.121 5
43.64
3 216
.824 1
15.74
Index
10
0.00
96.72
88
.7488
.0913
4.88
281.0
835
9.62
Natio
nal
curre
ncy
Amou
nt 5 7
55.32
5 723
.40
5 723
.405 7
97.87
8 969
.0719
510.8
726
318.6
8
Index
10
0.00
99.45
99
.4510
0.74
155.8
433
9.01
457.2
9
Hung
ary
US
dolla
rs Am
ount
4 472
.165 5
06.09
5 833
.42
6 388
.886 9
50.53
5 219
.445 2
16.01
5 096
.25
12 48
3.04
17 88
0.17
23 53
7.16
33 19
3.13
Index
10
0.00
123.1
213
0.44
142.8
615
5.42
116.7
111
6.63
113.9
6
279.1
339
9.81
526.3
074
2.22
Natio
nal
curre
ncy
Amou
nt 28
2 666
.6741
1 500
.0046
0 772
.73
587 3
50.00
730 9
17.24
655 9
84.92
796 2
08.53
951 9
23.08
3 5
76 26
6.14
4 611
063.0
05 2
79 54
9.81
6 729
775.0
7
Index
10
0.00
145.5
816
3.01
207.7
925
8.58
232.0
728
1.68
336.7
7
1 265
.191 6
31.27
1 867
.772 3
80.82
Indi
a
US
dolla
rs Am
ount
3 235
.892 9
98.47
2 791
.52
2 385
.962 8
54.54
4 569
.903 4
71.91
3 748
.913 5
23.22
3 6
32.33
5 585
.394 7
01.49
4 383
.574 8
23.61
5 414
.78
Index
10
0.00
92.66
86.27
73
.7388
.2214
1.23
107.2
911
5.85
108.8
8 11
2.25
172.6
114
5.29
135.4
714
9.07
167.3
3
Natio
nal
curre
ncy
Amou
nt 56
639.4
868
192.3
972
350.8
9 72
755.7
689
557.6
314
8 188
.7012
3 020
.7913
6 135
.2214
5 366
.10
156 3
91.60
251 0
16.36
221 8
46.16
213 0
86.78
224 6
99.51
245 3
78.89
Index
10
0.00
120.4
012
7.74
128.4
515
8.12
261.6
321
7.20
240.3
525
6.65
276.1
244
3.18
391.6
837
6.22
396.7
243
3.23
Indo
nesia
US
dolla
rs Am
ount
3 205
.594 2
58.90
3 708
.7074
2.33
1 322
.501 6
50.82
783.0
582
4.19
1 932
.16
Index
10
0.00
132.8
611
5.69
23.16
41
.2651
.5024
.4325
.7160
.27
Natio
nal
curre
ncy
Amou
nt
6 9
26 47
0.59
9 576
592.0
88 6
86 88
2.93
7 433
419.8
4 10
388 4
63.66
13 90
2 813
.308 0
34 68
9.00
7 674
140.5
116
572 3
99.64
Index
10
0.00
138.2
612
5.42
107.3
2 14
9.98
200.7
211
6.00
110.7
923
9.26
Irelan
d
US
dolla
rs Am
ount
33 08
0.71
32 99
5.98
35 63
0.62
31 51
1.89
32 57
4.90
32 82
6.12
33 56
7.98
31 88
7.94
31 26
5.71
30 52
7.96
Index
10
0.00
99.74
107.7
1 95
.2698
.4799
.2310
1.47
96.39
94.51
92
.28
Natio
nal
curre
ncy
Amou
nt 25
395.0
026
030.0
026
589.4
2 27
097.9
927
655.5
025
997.5
726
640.2
926
708.5
127
879.6
3 28
654.4
6
Index
10
0.00
102.5
010
4.70
106.7
110
8.90
102.3
710
4.90
105.1
710
9.78
112.8
4
Italy
US
dolla
rs Am
ount
53 93
9.46
54 20
5.24
55 32
7.80
44 09
1.99
47 13
2.94
34 59
2.39
38 83
5.94
35 81
1.18
35 58
4.35
31 61
2.86
30 68
3.58
37 25
4.07
39 95
2.57
46 94
7.31
Index
10
0.00
100.4
910
2.57
81.74
87.38
64.13
72.00
66.39
65
.9758
.6156
.8969
.0774
.0787
.04
Natio
nal
curre
ncy
Amou
nt 33
375.9
634
730.4
935
215.4
3 35
835.0
239
250.2
329
101.6
134
159.2
332
111.1
0 33
400.5
334
312.6
034
289.2
139
586.1
735
397.9
837
811.3
6
Index
10
0.00
104.0
610
5.51
107.3
711
7.60
87.19
102.3
596
.21
100.0
710
2.81
102.7
411
8.61
106.0
611
3.29

106 TMOGE-R-[2008-12-0110-1]-En.doc/v3
1990
1991
1992
19
9319
9419
9519
9619
9719
98
1999
2000
2001
2002
2003
2004
2005
Japa
n
US
dolla
rs Am
ount
47 35
8.58
54 08
5.64
59 40
5.84
67 44
7.26
68 20
2.58
75 55
3.86
66 24
1.69
60 90
3.44
55 66
3.44
63 51
2.12
65 72
1.50
62 38
9.53
55 16
3.19
59 84
6.12
66 11
4.04
Index
10
0.00
114.2
012
5.44
142.4
214
4.01
159.5
413
9.87
128.6
011
7.54
134.1
113
8.77
131.7
411
6.48
126.3
713
9.60
Natio
nal
curre
ncy
Amou
nt 6 8
57 14
2.86
7 285
714.2
97 5
23 80
9.52
7 500
000.0
06 9
70 84
9.18
7 106
565.4
67 2
05 70
4.71
7 368
768.3
37 2
86 62
2.07
7 234
475.0
37 0
82 47
7.81
7 582
136.6
76 9
16 80
2.61
6 938
140.3
27 1
53 07
5.82
Index
10
0.00
106.2
510
9.72
109.3
810
1.66
103.6
410
5.08
107.4
610
6.26
105.5
010
3.29
110.5
710
0.87
101.1
810
4.32
Jord
an
US
dolla
rs Am
ount
4 733
.934 7
59.96
5 109
.84
4 959
.235 0
10.11
5 563
.746 2
55.89
6 561
.957 1
02.75
6 6
89.96
7 242
.428 1
03.65
8 060
.948 4
44.12
Index
10
0.00
100.5
510
7.94
104.7
610
5.83
117.5
313
2.15
138.6
215
0.04
141.3
215
2.99
171.1
817
0.28
178.3
7
Natio
nal
curre
ncy
Amou
nt 3 1
41.97
3 240
.893 4
73.76
3 4
36.00
3 500
.893 8
96.71
4 435
.434 6
52.42
5 035
.85
4 743
.185 1
34.87
5 745
.495 7
15.21
5 986
.88
Index
10
0.00
103.1
511
0.56
109.3
611
1.42
124.0
214
1.17
148.0
716
0.28
150.9
616
3.43
182.8
618
1.90
190.5
5
Keny
a
US
dolla
rs Am
ount
6 953
.876 5
92.30
6 373
.17
3 774
.035 4
33.87
8 935
.132 3
63.39
2 754
.302 9
68.56
2 3
89.51
2 709
.162 8
85.78
3 220
.87
Index
10
0.00
94.80
91.65
54
.2778
.1412
8.49
33.99
39.61
42.69
34
.3638
.9641
.5046
.32
Natio
nal
curre
ncy
Amou
nt 7 9
67.05
9 067
.0510
265.9
1 10
945.0
815
228.4
122
976.6
96 7
49.13
8 088
.268 9
60.00
8 4
02.21
10 31
8.66
11 33
5.91
12 68
2.17
Index
10
0.00
113.8
112
8.85
137.3
819
1.14
288.4
084
.7110
1.52
112.4
6 10
5.46
129.5
214
2.28
159.1
8
Kore
a, Re
publ
ic of
US
dolla
rs Am
ount
20 95
4.71
19 04
1.10
19 59
3.68
21 35
6.43
25 71
8.16
28 67
1.02
32 78
9.21
30 01
0.43
20 14
2.35
25 57
7.97
29 60
0.00
27 98
0.00
34 32
6.09
40 76
5.35
45 76
9.87
63 45
5.33
Index
10
0.00
90.87
93.50
10
1.92
122.7
313
6.82
156.4
814
3.22
96.12
12
2.06
141.2
613
3.53
163.8
119
4.54
218.4
230
2.82
Natio
nal
curre
ncy
Amou
nt 14
830 9
85.92
13 96
3 848
.8015
295 8
27.90
17
142 1
90.26
20 66
3 150
.2422
113 1
84.83
26 37
7 376
.6828
548 5
93.35
28 22
8 289
.36
30 40
7 599
.6333
476 4
20.69
36 12
1 896
.1642
945 0
26.18
48 57
6 396
.4452
421 1
46.16
64 98
5 872
.64
Index
10
0.00
94.15
103.1
3 11
5.58
139.3
214
9.10
177.8
519
2.49
190.3
3 20
5.03
225.7
224
3.56
289.5
632
7.53
353.4
643
8.18
Kuwa
it
US
dolla
rs Am
ount
36 45
5.80
36 99
3.01
46 85
5.71
44 13
0.91
44 11
6.09
43 63
7.41
40 88
4.06
41 13
6.48
45 46
5.76
45 82
3.12
3888
0.89
47 69
2.12
Index
10
0.00
101.4
712
8.53
121.0
512
1.01
119.7
011
2.15
112.8
412
4.71
125.7
010
6.65
130.8
2
Natio
nal
curre
ncy
Amou
nt 10
515.8
610
515.9
713
739.1
7 13
320.4
313
096.7
413
023.5
012
241.0
512
478.7
113
855.9
6 13
949.2
511
926.7
914
626.3
1
Index
10
0.00
100.0
013
0.65
126.6
712
4.54
123.8
511
6.41
118.6
713
1.76
132.6
511
3.42
139.0
9
Lith
uani
a
US
dolla
rs Am
ount
73
1.00
1 345
.252 4
13.42
5 116
.015 9
53.61
7 015
.87
6 860
.878 3
39.96
7 875
.6494
90.64
12 18
2.39
13 77
3.52
15 17
5.50
Index
100.0
0 18
4.03
330.1
569
9.87
814.4
595
9.77
938.5
61 1
40.90
1 077
.381 2
98.31
1 666
.541 8
84.21
2 075
.99
Natio
nal
curre
ncy
Amou
nt
1 295
.88
5 843
.869 6
00.00
20 46
4.03
23 81
4.44
28 06
3.49
27 44
3.49
3335
9.85
31 50
2.56
34 89
6.70
37 28
8.70
38 29
8.50
42 09
7.28
Index
100.0
0 45
0.96
740.8
11 5
79.16
1 837
.712 1
65.60
2 1
17.75
2 574
.312 4
30.98
2 692
.902 8
77.49
2 955
.413 2
48.55

TMOGE-R-[2008-12-0110-1]-En.doc/v3 107
1990
1991
1992
19
9319
9419
9519
9619
9719
98
1999
2000
2001
2002
2003
2004
2005
Malay
sia
US
dolla
rs Am
ount
14 04
8.73
14 18
1.46
16 45
4.82
15 98
7.73
15 46
8.21
17 89
4.43
17 90
1.25
14 71
8.31
12
624.6
59 2
96.47
12 15
6.84
16 03
8.76
18 64
3.18
19 16
4.04
Index
10
0.00
100.9
411
7.13
113.8
011
0.10
127.3
712
7.42
104.7
7
89.86
66.17
86.53
114.1
713
2.70
136.4
1
Natio
nal
curre
ncy
Amou
nt 38
000.0
039
000.0
041
916.6
7 41
153.8
540
592.5
944
814.8
145
038.4
641
405.4
1
47 97
3.68
35 32
6.59
46 19
6.00
60 94
7.27
70 84
4.10
72 82
3.34
Index
10
0.00
102.6
311
0.31
108.3
010
6.82
117.9
311
8.52
108.9
6
126.2
592
.9612
1.57
160.3
918
6.43
191.6
4
Mexic
o
US
dolla
rs Am
ount
10 08
3.22
6 425
.927 4
49.87
8 927
.639 6
43.39
10
853.4
411
472.5
8
Index
10
0.00
63.73
73.88
88.54
95.64
10
7.64
113.7
8
Natio
nal
curre
ncy
Amou
nt
34
032.0
641
250.6
856
614.9
570
693.0
988
102.4
3 10
3 763
.2610
8 479
.71
Index
10
0.00
121.2
116
6.36
207.7
225
8.88
304.9
031
8.76
Moza
mbi
que
US
dolla
rs Am
ount
1 135
.201 6
47.60
1 434
.90
1 310
.781 9
82.77
985.2
11 3
97.09
Index
10
0.00
145.1
412
6.40
115.4
717
4.66
86.79
123.0
7
Natio
nal
curre
ncy
Amou
nt 1 0
54 70
4.60
2 363
436.1
23 6
10 98
9.01
5 078
260.8
711
973 1
54.36
8 890
829.6
915
778 2
51.60
Index
10
0.00
224.0
934
2.37
481.4
91 1
35.21
842.9
714
95.99
Neth
erlan
ds
US
dolla
rs Am
ount
48 11
5.39
49 82
3.84
56 75
0.37
54 28
0.56
56 07
4.10
63 37
7.47
60 73
0.40
53 35
0.39
50 68
3.99
56 69
9.04
50 23
2.15
Index
10
0.00
103.5
511
7.95
112.8
111
6.54
131.7
212
6.22
110.8
810
5.34
117.8
410
4.40
Natio
nal
curre
ncy
Amou
nt 39
758.0
842
271.4
945
284.4
7 45
748.2
546
310.4
846
178.4
746
460.4
547
239.0
045
624.5
7 53
219.4
254
521.9
7
Index
10
0.00
106.3
211
3.90
115.0
711
6.48
116.1
511
6.86
118.8
211
4.76
133.8
613
7.13
Norw
ay
US
dolla
rs Am
ount
44 76
2.46
51 72
4.89
62 74
4.11
46 56
1.84
43 50
3.25
51 52
2.91
52 45
2.47
51 51
9.98
51 38
7.10
53 76
1.91
47 26
7.13
Index
10
0.00
115.5
514
0.17
104.0
297
.1911
5.10
117.1
811
5.10
114.8
0 12
0.10
105.6
0
Natio
nal
curre
ncy
Amou
nt 28
0 201
.3433
5 329
.3438
9 923
.27
330 3
15.76
307 0
27.65
326 4
05.87
338 3
08.46
364 4
21.42
387 7
20.77
41
9 298
.2541
6 037
.74
Index
10
0.00
119.6
713
9.16
117.8
910
9.57
116.4
912
0.74
130.0
613
8.37
149.6
414
8.48
Pana
ma
US
dolla
rs Am
ount
28
067.6
0 36
140.5
537
321.1
832
128.8
240
417.7
529
526.8
8 33
941.0
330
982.3
8
Index
100.0
0 12
8.76
132.9
711
4.47
144.0
010
5.20
120.9
311
0.38
Natio
nal
curre
ncy
Amou
nt
28 06
7.60
36 14
0.55
37 32
1.18
32 12
8.82
40 41
7.75
29 52
6.88
33 94
1.03
30 98
2.38
Index
100.0
0 12
8.76
132.9
711
4.47
144.0
010
5.20
120.9
311
0.38

108 TMOGE-R-[2008-12-0110-1]-En.doc/v3
1990
1991
1992
19
9319
9419
9519
9619
9719
98
1999
2000
2001
2002
2003
2004
2005
Peru
US
dolla
rs Am
ount
24 46
7.85
12 34
7.73
9 401
.45
14 93
9.23
23 27
0.85
15 50
2.69
Index
10
0.00
50.47
38.42
61
.0695
.1163
.36
Natio
nal
curre
ncy
Amou
nt 4 5
97.17
9 538
.6211
712.6
1 32
791.6
252
436.9
038
033.2
1
Index
10
0.00
207.4
925
4.78
713.3
01 1
40.64
827.3
2
Philip
pine
s
US
dolla
rs Am
ount
11 53
4.11
12 58
5.55
14 25
1.84
14 24
8.74
19 62
9.47
18 45
2.62
19 39
1.52
18 43
3.63
12 81
1.35
15 17
9.04
16 61
6.79
15 24
5.07
Index
10
0.00
109.1
212
3.56
123.5
417
0.19
159.9
816
8.12
159.8
211
1.07
131.6
014
4.07
132.1
7
Natio
nal
curre
ncy
Amou
nt 28
0 400
.0034
5 833
.3336
3 600
.00
386 4
23.08
518 5
55.56
474 5
00.00
508 3
70.02
543 2
52.10
523 8
94.74
59
3 333
.3384
7 333
.3382
6 333
.33
Index
10
0.00
123.3
412
9.67
137.8
118
4.93
169.2
218
1.30
193.7
418
6.84
211.6
030
2.19
294.7
0
Portu
gal
US
dolla
rs Am
ount
29 50
2.35
28 56
4.10
31 29
6.79
35 18
6.71
31 50
3.74
30 32
7.51
33 93
0.73
44 80
8.46
53 27
0.79
Index
10
0.00
96.82
106.0
8 11
9.27
106.7
810
2.80
115.0
115
1.88
180.5
6
Natio
nal
curre
ncy
Amou
nt
22
698.1
124
977.9
628
115.6
3 33
027.3
034
194.1
633
891.2
936
054.8
039
700.3
042
904.2
9
Index
10
0.00
110.0
412
3.87
145.5
115
0.65
149.3
115
8.84
174.9
118
9.02
Puer
to R
ico
US
dolla
rs Am
ount
36 25
0.00
40 40
8.16
41 52
1.74
38 65
1.69
39 33
3.33
48 96
1.04
54 85
2.94
49 42
0.29
42 77
7.78
61 25
0.00
39 65
1.16
Index
10
0.00
111.4
711
4.54
106.6
310
8.51
135.0
615
1.32
136.3
311
8.01
168.9
710
9.38
Natio
nal
curre
ncy
Amou
nt 36
250.0
040
408.1
641
521.7
4 38
651.6
939
333.3
348
961.0
454
852.9
449
420.2
942
777.7
8 61
250.0
039
651.1
6
Index
10
0.00
111.4
711
4.54
106.6
310
8.51
135.0
615
1.32
136.3
311
8.01
168.9
710
9.38
Qata
r
US
dolla
rs Am
ount
27 10
0.61
35 12
2.64
35 86
5.36
35 54
6.24
36 70
4.38
34
162.0
832
424.4
833
267.3
337
931.3
336
731.0
4
Index
10
0.00
129.6
013
2.34
131.1
613
5.44
12
6.06
119.6
412
2.75
139.9
613
5.54
Natio
nal
curre
ncy
Amou
nt 98
646.2
012
7 846
.4113
0 549
.91
129 3
88.30
133 6
03.94
12
4 349
.9711
8 025
.1212
1 093
.0913
8 070
.0513
3 701
.00
Index
10
0.00
129.6
013
2.34
131.1
613
5.44
12
6.06
119.6
412
2.75
139.9
613
5.54
Rom
ania
US
dolla
rs Am
ount
2 038
.071 5
71.71
1 175
.26
1 325
.821 6
53.61
6 9
83.36
8 145
.1110
851.3
2
Index
10
0.00
77.12
57.67
65
.0581
.14
342.6
539
9.65
532.4
3
Natio
nal
curre
ncy
Amou
nt 45
718.1
512
0 058
.8236
1 924
.90
1 007
692.3
12 7
36 87
3.24
23
184.8
426
582.8
631
616.9
5
Index
10
0.00
262.6
179
1.64
2 204
.145 9
86.40
50
.7158
.1569
.16

TMOGE-R-[2008-12-0110-1]-En.doc/v3 109
1990
1991
1992
19
9319
9419
9519
9619
9719
98
1999
2000
2001
2002
2003
2004
2005
Russ
ian F
eder
atio
n
US
dolla
rs Am
ount
1 4
50.87
2 5
02.16
2 852
.914 0
09.04
4 283
.002 7
49.90
3 1
57.93
3 777
.4137
77.41
4 745
.345 7
91.41
8 720
.71
Index
100.0
0 17
2.46
196.6
427
6.32
295.2
018
9.54
21
7.66
260.3
626
0.36
327.0
739
9.17
601.0
7
Natio
nal
curre
ncy
Amou
nt
1 438
.78
5 481
.6113
006.8
520
529.6
024
776.4
026
688.0
0
92 11
2.03
118 4
16.00
118 4
16.00
145 6
44.00
166 8
72.00
246 6
60.00
Index
100.0
0 38
0.99
904.0
21 4
26.88
1 722
.051 8
54.91
6 4
02.11
8 230
.338 2
30.33
10 12
2.77
11 59
8.20
17 14
3.74
Sene
gal
US
dolla
rs Am
ount
13 15
9.32
13 86
3.65
16 37
6.37
11 90
5.64
9 029
.3810
359.7
69 8
53.32
9 071
.61
8 841
.2910
925.2
3
Index
10
0.00
105.3
512
4.45
90.47
68.62
78.73
74.88
68.94
67
.1983
.02
Natio
nal
curre
ncy
Amou
nt 3 5
82 82
2.09
3 911
032.0
34 3
34 69
3.88
3 371
237.4
65 0
13 15
7.89
5 171
052.6
35 0
40 48
5.83
5 294
820.7
2
6 481
012.6
67 6
14 75
4.10
Index
10
0.00
109.1
612
0.99
94.09
139.9
214
4.33
140.6
814
7.78
18
0.89
212.5
4
Serb
ia an
d Mo
nten
egro
US
dolla
rs Am
ount
2 562
.581 7
72.15
3 551
.614 0
54.46
3 088
.912 4
69.95
55
80.03
1 823
.62
Index
10
0.00
69.15
138.6
015
8.22
120.5
496
.39
217.7
571
.16
Natio
nal
curre
ncy
Amou
nt
3 9
72.00
8 400
.0017
616.0
023
191.4
928
510.6
427
021.2
8 89
782.6
112
3 404
.26
Index
10
0.00
211.4
844
3.50
583.8
771
7.79
680.2
9 2 2
60.39
3 106
.85
Sing
apor
e
US
dolla
rs Am
ount
34 19
9.29
37 53
6.03
40 73
4.19
45 75
8.48
47 45
6.94
52 85
5.22
60 62
4.83
59 39
5.91
58 17
4.69
54 86
8.18
59 57
4.48
61 78
8.52
69 24
8.83
68 66
8.71
66 72
9.29
Index
10
0.00
109.7
611
9.11
133.8
013
8.77
154.5
517
7.27
173.6
817
0.10
160.4
417
4.20
180.6
720
2.49
200.7
919
5.12
Natio
nal
curre
ncy
Amou
nt 61
987.2
464
845.3
766
354.7
8 73
936.0
972
487.6
374
915.4
185
483.4
388
191.6
497
361.1
6 92
999.3
710
2 704
.0311
0 707
.7212
3 996
.27
119 6
33.25
112 7
87.85
Index
10
0.00
104.6
110
7.05
119.2
811
6.94
120.8
613
7.90
142.2
715
7.07
150.0
316
5.69
178.6
020
0.04
193.0
018
1.95
Slov
akia
US
dolla
rs Am
ount
2 111
.122 6
81.13
2 9
81.66
3 835
.665 0
81.53
5 293
.21
Index
10
0.00
127.0
0 14
1.24
181.6
924
0.70
250.7
3
Natio
nal
curre
ncy
Amou
nt 62
229.5
075
782.1
3 91
744.3
412
2 912
.8017
0 821
.7918
6 497
.72
Index
10
0.00
121.7
8 14
7.43
197.5
227
4.50
299.6
9
Slov
enia
US
dolla
rs Am
ount
12 89
9.81
13 10
8.78
11 01
6.80
10 11
6.81
9 854
.2713
607.0
113
253.7
716
672.5
412
567.4
4 10
446.8
49 5
89.04
9 632
.5010
587.5
8
Index
10
0.00
101.6
285
.40
78.43
76.39
105.4
810
2.74
129.2
597
.42
80.98
74.33
74.67
82.08
Natio
nal
curre
ncy
Amou
nt 14
6 000
.0036
1 424
.8589
5 522
.39
1 145
648.3
11 2
69 31
8.18
1 612
676.0
61 7
94 08
2.84
2 662
404.0
92 0
87 87
8.79
1 898
911.3
52 1
35 05
7.47
2 338
278.9
32 5
43 64
4.72
Index
10
0.00
247.5
561
3.37
784.6
986
9.40
1 104
.571 2
28.82
1 823
.561 4
30.05
1 3
00.62
1 462
.371 6
01.56
1 742
.22

110 TMOGE-R-[2008-12-0110-1]-En.doc/v3
1990
1991
1992
19
9319
9419
9519
9619
9719
98
1999
2000
2001
2002
2003
2004
2005
Sout
h Af
rica
US
dolla
rs Am
ount
12 08
8.87
13 45
9.80
15 50
5.63
21 01
2.40
23 58
6.95
24 52
9.11
23 67
7.42
23 51
6.23
22 86
1.14
21 37
1.56
17 14
1.60
12 64
0.36
8 695
.203 0
74.49
7 843
.88
Index
10
0.00
111.3
412
8.26
173.8
219
5.11
202.9
119
5.86
194.5
318
9.11
176.7
914
1.80
104.5
671
.9325
.4364
.89
Natio
nal
curre
ncy
Amou
nt 31
277.7
837
166.6
744
222.2
2 68
663.0
783
752.5
588
969.0
510
1 797
.5010
8 361
.8412
6 382
.79
130 5
69.13
118 9
59.82
108 8
23.12
91 65
3.49
23 25
7.75
50 66
9.05
Index
10
0.00
118.8
314
1.39
219.5
326
7.77
284.4
532
5.46
346.4
540
4.07
417.4
538
0.33
347.9
229
3.03
74.36
162.0
0
Spain
US
dolla
rs Am
ount
34 36
0.97
36 19
4.98
49 17
7.48
40 20
0.41
39 72
7.61
45 07
5.92
47 10
6.89
41 74
0.12
41
693.0
837
207.4
5
Index
10
0.00
105.3
414
3.12
116.9
911
5.62
131.1
813
7.09
121.4
8
121.3
410
8.28
Natio
nal
curre
ncy
Amou
nt 21
050.7
722
604.6
330
259.4
0 30
747.2
031
984.8
533
779.7
235
860.3
136
729.8
9
39 13
4.37
40 38
4.97
Index
10
0.00
107.3
814
3.74
146.0
615
1.94
160.4
717
0.35
174.4
8
185.9
019
1.85
Sri L
anka
US
dolla
rs Am
ount
1 864
.671 8
94.33
1 522
.61
1 640
.641 8
60.85
2 051
.462 0
40.78
1 988
.701 9
75.93
2 5
60.57
2 720
.85
Index
10
0.00
101.5
981
.66
87.99
99.80
110.0
210
9.44
106.6
510
5.97
137.3
214
5.92
Natio
nal
curre
ncy
Amou
nt 74
704.1
478
371.1
766
735.1
6 79
279.2
091
954.3
210
5 140
.6511
2 796
.8111
7 322
.7112
7 348
.73
180 8
66.76
209 5
19.15
Index
10
0.00
104.9
189
.33
106.1
212
3.09
140.7
415
0.99
157.0
517
0.47
242.1
128
0.47
Swed
en
US
dolla
rs Am
ount
29 77
8.05
36 42
6.06
38 79
2.35
31 95
4.18
32 22
9.58
35 67
2.64
38 16
5.34
33 81
9.09
32 56
4.24
31 37
7.66
28 35
8.84
Index
10
0.00
122.3
313
0.27
107.3
110
8.23
119.8
012
8.17
113.5
710
9.36
105.3
795
.23
Natio
nal
curre
ncy
Amou
nt 17
6 250
.0022
0 285
.5122
5 920
.07
248 7
13.10
248 6
82.49
254 4
62.56
255 9
35.24
258 2
05.00
258 8
81.46
25
9 255
.7225
9 830
.53
Index
10
0.00
124.9
812
8.18
141.1
114
1.10
144.3
814
5.21
146.5
014
6.88
147.1
014
7.42
Taiw
an, C
hina
US
dolla
rs Am
ount
23 29
0.08
24 08
0.11
29 65
9.04
28 88
1.49
32 15
0.14
34 21
2.64
33 86
7.28
27 04
8.34
Index
10
0.00
103.3
912
7.35
124.0
113
8.04
146.9
014
5.42
116.1
4
Natio
nal
curre
ncy
Amou
nt 62
6 339
.9964
5 708
.0474
6 339
.96
762 0
95.90
850 5
96.36
906 1
56.06
929 9
27.75
776 3
68.47
Index
10
0.00
103.0
911
9.16
121.6
713
5.80
144.6
714
8.47
123.9
5
Trin
idad
and
Toba
go
US
dolla
rs Am
ount
24 29
2.44
30 43
7.98
34 53
7.23
37 03
4.01
37 61
7.66
35 35
0.98
Index
10
0.00
125.3
014
2.17
152.4
515
4.85
145.5
2
Natio
nal
curre
ncy
Amou
nt
15
3 001
.33
191 7
25.77
217 5
77.61
230 8
41.12
235 0
60.69
222 5
37.95
Index
10
0.00
125.3
114
2.21
150.8
815
3.63
145.4
5

TMOGE-R-[2008-12-0110-1]-En.doc/v3 111
1990
1991
1992
19
9319
9419
9519
9619
9719
98
1999
2000
2001
2002
2003
2004
2005
Tuni
sia
US
dolla
rs Am
ount
71 40
6.49
102 3
05.97
13 54
4.72
8 706
.097 9
46.65
8 163
.68
8 744
.967 9
76.29
7 970
.95
Index
10
0.00
143.2
718
.9712
.1911
.1311
.43
12.25
11.17
11.16
Natio
nal
curre
ncy
Amou
nt
71
673.5
510
3 487
.6012
809.9
28 4
74.58
8 788
.289 2
96.15
10
373.4
410
932.9
411
467.8
9
Index
10
0.00
144.3
917
.8711
.8212
.2612
.97
14.47
15.25
16.00
Turk
ey
US
dolla
rs Am
ount
14 20
0.66
20 36
0.92
21 84
6.98
27 53
6.85
18 14
0.14
17 01
1.04
12 13
2.75
19 35
3.25
15 53
8.05
18 08
3.08
20 81
4.97
20 17
4.58
Index
10
0.00
143.3
815
3.84
193.9
112
7.74
119.7
985
.4413
6.28
109.4
2 12
7.34
146.5
814
2.07
Natio
nal
curre
ncy
Amou
nt 37
044 4
13.46
84 94
2 084
.9415
0 141
643.0
6 30
2 481
291.8
553
7 105
933.0
377
9 873
003.6
698
7 665
684.8
32 9
39 08
1 157
.664 0
51 14
2 073
.35
7 572
886 2
02.83
13 01
3 891
367.9
0
Index
10
0.00
229.3
040
5.30
816.5
41 4
49.90
2 105
.242 6
66.17
7 933
.9410
935.9
1 20
442.7
235
130.5
1
Ukra
ine
US
dolla
rs Am
ount
2 5
49.94
49
5.02
654.2
31 4
24.70
2 233
.262 1
82.55
1 889
.55
1 345
.261 1
66.60
1 556
.812 0
00.95
2 261
.592 7
60.95
3 566
.24
Index
100.0
0 19
.4125
.6655
.8787
.5885
.5974
.10
52.76
45.75
61.05
78.47
88.69
108.2
813
9.86
Natio
nal
curre
ncy
Amou
nt
1.40
22.44
214.2
72 0
98.68
4 085
.694 0
63.16
4 628
.53
5 556
.516 3
46.55
8 363
.4110
658.3
012
060.3
414
685.9
718
276.0
1
Index
100.0
0 10
0.00
954.9
89 3
53.66
18 20
9.60
18 10
9.19
20 62
9.00
24 76
4.95
28 28
6.10
37 27
5.06
47 50
3.24
53 75
2.00
65 45
4.27
81 45
4.80
Unite
d Ki
ngdo
m
US
dolla
rs Am
ount
36 69
6.57
44 97
2.36
48 04
5.37
35 78
0.87
37 43
5.76
41 88
0.70
30 76
9.91
37 06
8.64
49 62
0.80
52 59
1.60
48 85
2.53
58 41
2.64
Index
10
0.00
122.5
513
0.93
97.50
102.0
111
4.13
83.85
101.0
113
5.22
143.3
113
3.13
159.1
8
Natio
nal
curre
ncy
Amou
nt 20
666.6
725
500.0
027
375.0
0 23
857.1
424
461.5
426
538.4
619
722.2
222
642.8
629
962.2
3 32
504.6
033
935.6
635
776.1
1
Index
10
0.00
123.3
913
2.46
115.4
411
8.36
128.4
195
.4310
9.56
144.9
8 15
7.28
164.2
017
3.11
Unite
d St
ates
US
dolla
rs Am
ount
44 44
4.44
46 62
1.62
48 48
0.00
51 15
0.68
52 66
6.67
54 22
8.57
55 85
2.72
57 26
5.64
58 75
0.16
60 61
6.14
63 05
6.34
67 28
1.53
69 35
9.36
70 26
2.55
Index
10
0.00
104.9
010
9.08
115.0
911
8.50
122.0
112
5.67
128.8
5 13
2.19
136.3
914
1.88
151.3
815
6.06
158.0
9
Urug
uay
US
dolla
rs Am
ount
5 050
.416 6
27.09
8 526
.39
10 14
2.05
15 29
5.64
14 52
2.59
14 93
0.73
21 24
4.74
25 78
9.49
18 81
2.12
17 85
3.51
20 43
7.82
11 11
0.47
11 62
6.94
13 38
2.07
Index
10
0.00
131.2
216
8.83
200.8
230
2.86
287.5
529
5.63
420.6
551
0.64
372.4
935
3.51
404.6
821
9.99
230.2
226
4.97
Natio
nal
curre
ncy
Amou
nt 5 9
06.36
13 37
1.21
25 79
0.71
39 97
0.73
77 15
0.00
92 20
3.89
119 0
25.26
200 5
89.18
270 0
64.94
21
3 316
.2421
6 020
.3827
2 213
.3923
6 175
.2832
7 980
.9538
4 114
.89
Index
10
0.00
226.3
943
6.66
676.7
41 3
06.22
1 561
.102 0
15.21
3 396
.164 5
72.45
3 6
11.64
3 657
.424 6
08.82
3 998
.665 5
53.02
6 503
.42

112 TMOGE-R-[2008-12-0110-1]-En.doc/v3
1990
1991
1992
19
9319
9419
9519
9619
9719
98
1999
2000
2001
2002
2003
2004
2005
Boliv
arian
Rep
ublic
of V
enez
uela
US
dolla
rs Am
ount
8 594
.7616
607.7
914
653.4
4 16
740.5
711
614.7
87 0
07.16
4 460
.976 2
08.52
Index
10
0.00
193.2
317
0.49
194.7
813
5.14
81.53
51.90
72.24
Natio
nal
curre
ncy
Amou
nt 40
3 098
.5994
3 589
.741 0
01 94
8.05
1 520
479.3
71 7
24 83
0.14
1 239
160.8
61 8
61 70
6.84
3 033
698.1
6
Index
10
0.00
234.0
824
8.56
377.2
042
7.89
307.4
146
1.85
752.5
9
Sour
ce: U
nited
Nati
ons I
ndus
trial D
evelo
pmen
t Org
aniza
tion (
UNID
O) IN
DSTA
T3 20
05 IS
IC R
ev.2.
and I
NDST
AT4 2
008 I
SIC
Rev.3
.

TMOGE-R-[2008-12-0110-1]-En.doc/v3 113
Appendix III
Excerpt of the Right to Organise and Collective Bargaining Convention, 1949 (No. 98)
...
Article 1
1. Workers shall enjoy adequate protection against acts of anti-union discrimination in respect of their employment.
2. Such protection shall apply more particularly in respect of acts calculated to:
(a) make the employment of a worker subject to the condition that he shall not join a union or shall relinquish trade union membership; and
(b) cause the dismissal of or otherwise prejudice a worker by reason of union membership or because of participation in union activities outside working hours or, with the consent of the employer, within working hours.
Article 2
1. Workers’ and employers’ organisations shall enjoy adequate protection against any acts of interference by each other or each other’s agents or members in their establishment, functioning or administration.
2. In particular, acts which are designed to promote the establishment of workers’ organisations under the domination of employers or employers’ organisations, or to support workers’ organisations by financial or other means, with the object of placing such organisations under the control of employers or employers’ organisations, shall be deemed to constitute acts of interference within the meaning of this Article.
Article 3
Machinery appropriate to national conditions shall be established, where necessary, for the purpose of ensuring respect for the right to organise as defined in the preceding Articles.
Article 4
Measures appropriate to national conditions shall be taken, where necessary, to encourage and promote the full development and utilisation of machinery for voluntary negotiation between employers or employers’ organisations and workers’ organisations, with a view to the regulation of terms and conditions of employment by means of collective agreements.
Article 5
1. The extent to which the guarantees provided for in this Convention shall apply to the armed forces and the police shall be determined by national laws or regulations.
2. In accordance with the principle set forth in paragraph 8 of Article 19 of the Constitution of the International Labour Organisation the ratification of this Convention by any Member shall not be deemed to affect any existing law, award, custom or agreement in virtue of which members of the armed forces or the police enjoy any right guaranteed by this Convention.
Article 6
This Convention does not deal with the position of public servants engaged in the administration of the State, nor shall it be construed as prejudicing their rights or status in any way.
...
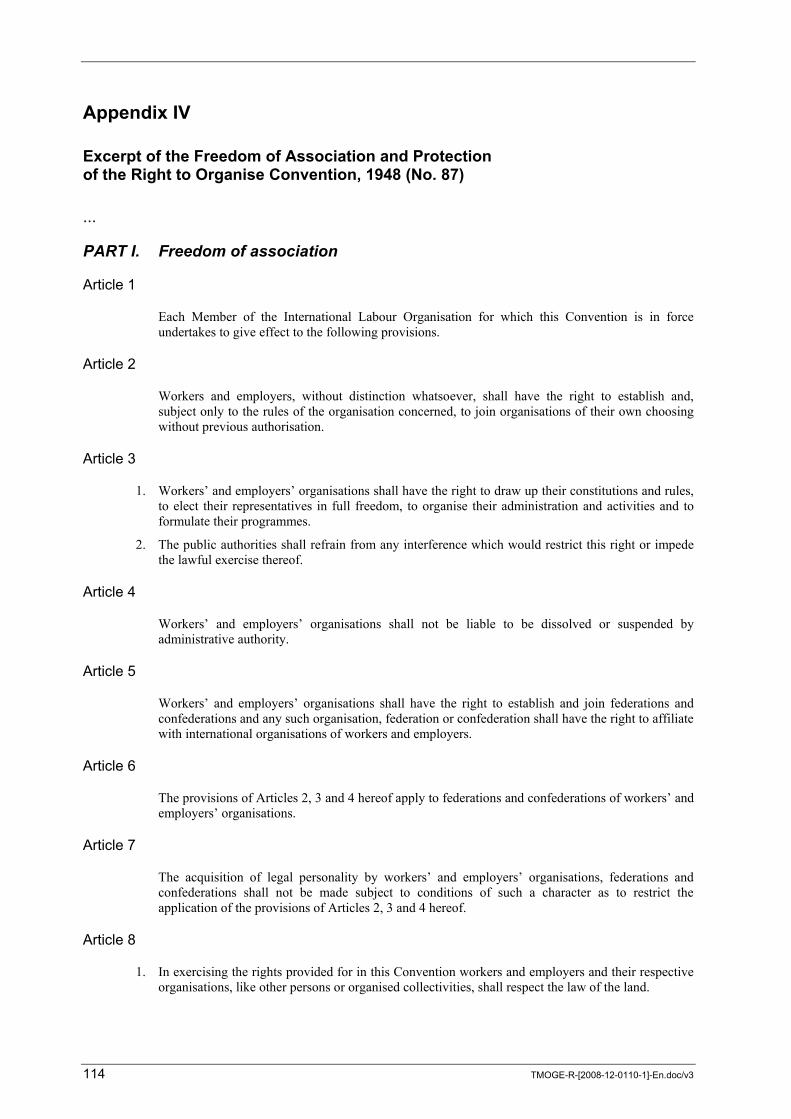
114 TMOGE-R-[2008-12-0110-1]-En.doc/v3
Appendix IV
Excerpt of the Freedom of Association and Protection of the Right to Organise Convention, 1948 (No. 87)
...
PART I. Freedom of association
Article 1
Each Member of the International Labour Organisation for which this Convention is in force undertakes to give effect to the following provisions.
Article 2
Workers and employers, without distinction whatsoever, shall have the right to establish and, subject only to the rules of the organisation concerned, to join organisations of their own choosing without previous authorisation.
Article 3
1. Workers’ and employers’ organisations shall have the right to draw up their constitutions and rules, to elect their representatives in full freedom, to organise their administration and activities and to formulate their programmes.
2. The public authorities shall refrain from any interference which would restrict this right or impede the lawful exercise thereof.
Article 4
Workers’ and employers’ organisations shall not be liable to be dissolved or suspended by administrative authority.
Article 5
Workers’ and employers’ organisations shall have the right to establish and join federations and confederations and any such organisation, federation or confederation shall have the right to affiliate with international organisations of workers and employers.
Article 6
The provisions of Articles 2, 3 and 4 hereof apply to federations and confederations of workers’ and employers’ organisations.
Article 7
The acquisition of legal personality by workers’ and employers’ organisations, federations and confederations shall not be made subject to conditions of such a character as to restrict the application of the provisions of Articles 2, 3 and 4 hereof.
Article 8
1. In exercising the rights provided for in this Convention workers and employers and their respective organisations, like other persons or organised collectivities, shall respect the law of the land.
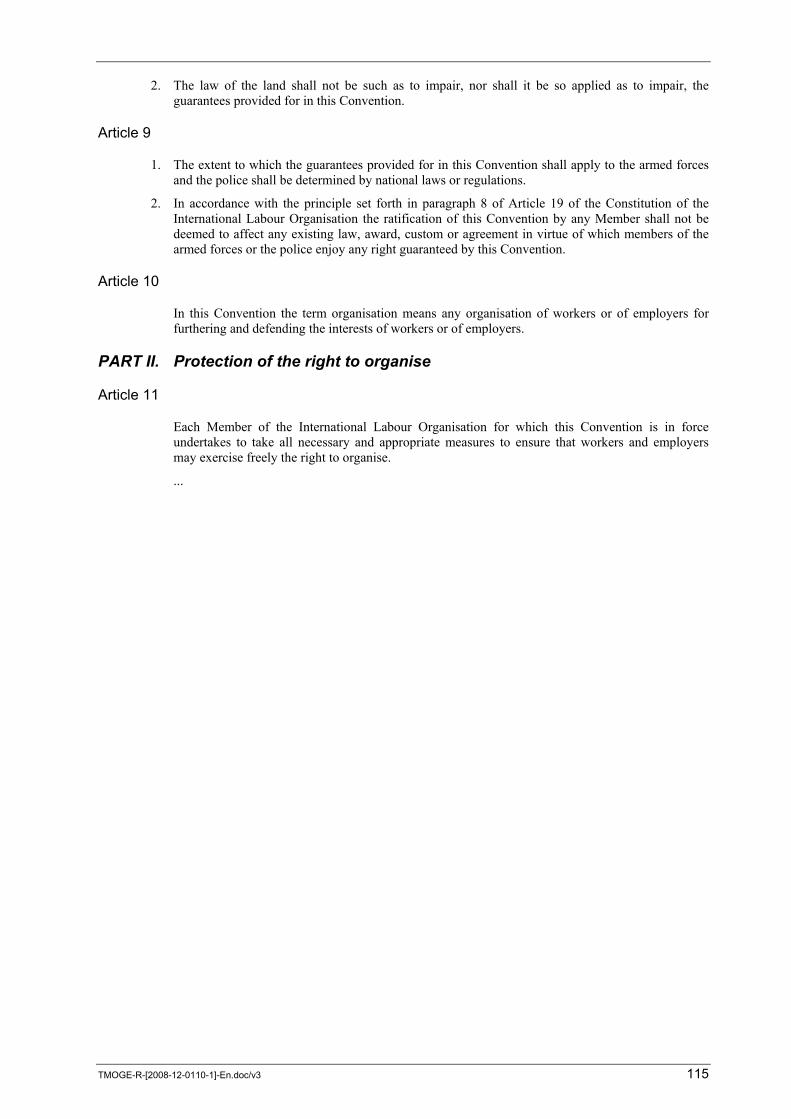
TMOGE-R-[2008-12-0110-1]-En.doc/v3 115
2. The law of the land shall not be such as to impair, nor shall it be so applied as to impair, the guarantees provided for in this Convention.
Article 9
1. The extent to which the guarantees provided for in this Convention shall apply to the armed forces and the police shall be determined by national laws or regulations.
2. In accordance with the principle set forth in paragraph 8 of Article 19 of the Constitution of the International Labour Organisation the ratification of this Convention by any Member shall not be deemed to affect any existing law, award, custom or agreement in virtue of which members of the armed forces or the police enjoy any right guaranteed by this Convention.
Article 10
In this Convention the term organisation means any organisation of workers or of employers for furthering and defending the interests of workers or of employers.
PART II. Protection of the right to organise
Article 11
Each Member of the International Labour Organisation for which this Convention is in force undertakes to take all necessary and appropriate measures to ensure that workers and employers may exercise freely the right to organise.
...
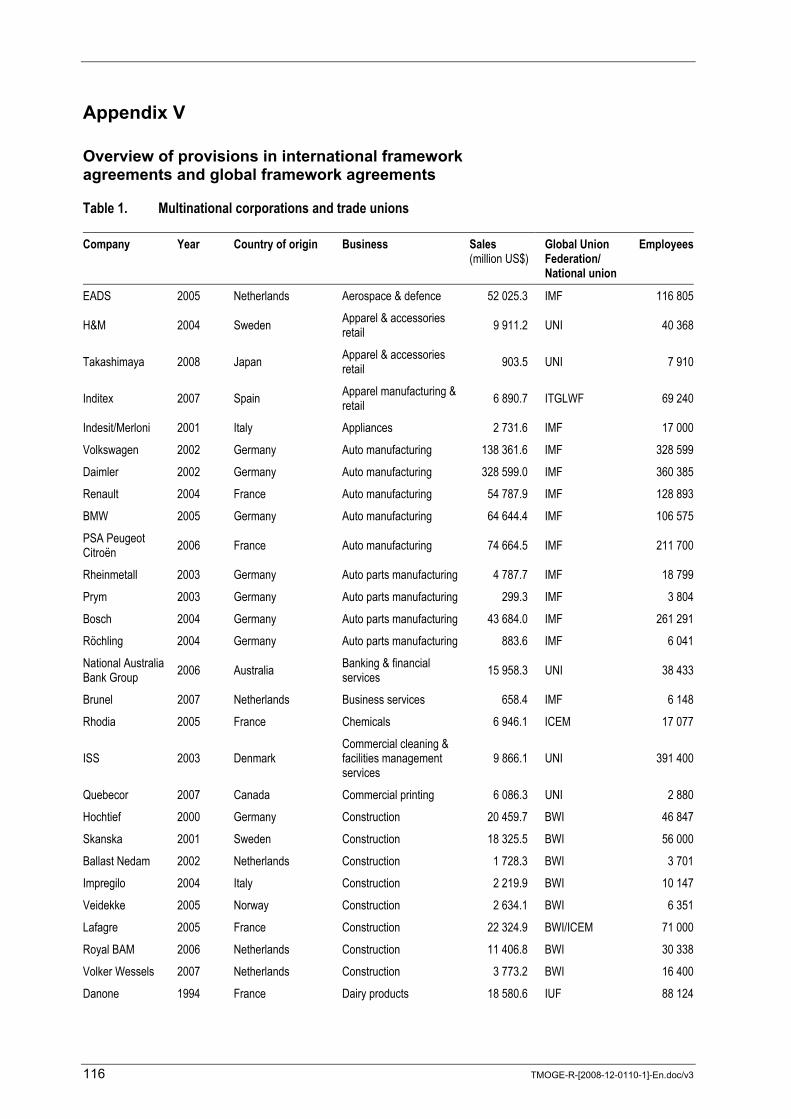
116 TMOGE-R-[2008-12-0110-1]-En.doc/v3
Appendix V
Overview of provisions in international framework agreements and global framework agreements
Table 1. Multinational corporations and trade unions
Company Year Country of origin Business Sales (million US$)
Global Union Federation/ National union
Employees
EADS 2005 Netherlands Aerospace & defence 52 025.3 IMF 116 805
H&M 2004 Sweden Apparel & accessories retail 9 911.2 UNI 40 368
Takashimaya 2008 Japan Apparel & accessories retail 903.5 UNI 7 910
Inditex 2007 Spain Apparel manufacturing & retail 6 890.7 ITGLWF 69 240
Indesit/Merloni 2001 Italy Appliances 2 731.6 IMF 17 000
Volkswagen 2002 Germany Auto manufacturing 138 361.6 IMF 328 599
Daimler 2002 Germany Auto manufacturing 328 599.0 IMF 360 385
Renault 2004 France Auto manufacturing 54 787.9 IMF 128 893
BMW 2005 Germany Auto manufacturing 64 644.4 IMF 106 575
PSA Peugeot Citroën 2006 France Auto manufacturing 74 664.5 IMF 211 700
Rheinmetall 2003 Germany Auto parts manufacturing 4 787.7 IMF 18 799
Prym 2003 Germany Auto parts manufacturing 299.3 IMF 3 804
Bosch 2004 Germany Auto parts manufacturing 43 684.0 IMF 261 291
Röchling 2004 Germany Auto parts manufacturing 883.6 IMF 6 041
National Australia Bank Group 2006 Australia Banking & financial
services 15 958.3 UNI 38 433
Brunel 2007 Netherlands Business services 658.4 IMF 6 148
Rhodia 2005 France Chemicals 6 946.1 ICEM 17 077
ISS 2003 Denmark Commercial cleaning & facilities management services
9 866.1 UNI 391 400
Quebecor 2007 Canada Commercial printing 6 086.3 UNI 2 880
Hochtief 2000 Germany Construction 20 459.7 BWI 46 847
Skanska 2001 Sweden Construction 18 325.5 BWI 56 000
Ballast Nedam 2002 Netherlands Construction 1 728.3 BWI 3 701
Impregilo 2004 Italy Construction 2 219.9 BWI 10 147
Veidekke 2005 Norway Construction 2 634.1 BWI 6 351
Lafagre 2005 France Construction 22 324.9 BWI/ICEM 71 000
Royal BAM 2006 Netherlands Construction 11 406.8 BWI 30 338
Volker Wessels 2007 Netherlands Construction 3 773.2 BWI 16 400
Danone 1994 France Dairy products 18 580.6 IUF 88 124
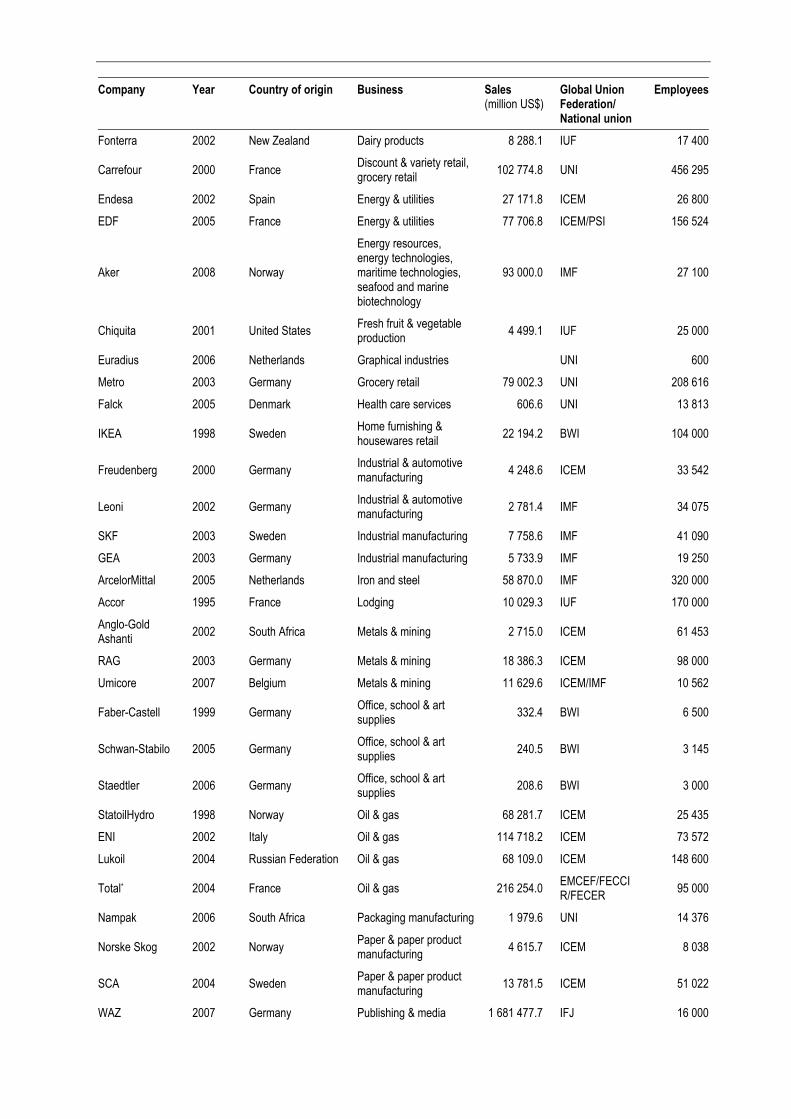
Company Year Country of origin Business Sales (million US$)
Global Union Federation/ National union
Employees
Fonterra 2002 New Zealand Dairy products 8 288.1 IUF 17 400
Carrefour 2000 France Discount & variety retail, grocery retail 102 774.8 UNI 456 295
Endesa 2002 Spain Energy & utilities 27 171.8 ICEM 26 800
EDF 2005 France Energy & utilities 77 706.8 ICEM/PSI 156 524
Aker 2008 Norway
Energy resources, energy technologies, maritime technologies, seafood and marine biotechnology
93 000.0 IMF 27 100
Chiquita 2001 United States Fresh fruit & vegetable production 4 499.1 IUF 25 000
Euradius 2006 Netherlands Graphical industries UNI 600
Metro 2003 Germany Grocery retail 79 002.3 UNI 208 616
Falck 2005 Denmark Health care services 606.6 UNI 13 813
IKEA 1998 Sweden Home furnishing & housewares retail 22 194.2 BWI 104 000
Freudenberg 2000 Germany Industrial & automotive manufacturing 4 248.6 ICEM 33 542
Leoni 2002 Germany Industrial & automotive manufacturing 2 781.4 IMF 34 075
SKF 2003 Sweden Industrial manufacturing 7 758.6 IMF 41 090
GEA 2003 Germany Industrial manufacturing 5 733.9 IMF 19 250
ArcelorMittal 2005 Netherlands Iron and steel 58 870.0 IMF 320 000
Accor 1995 France Lodging 10 029.3 IUF 170 000
Anglo-Gold Ashanti 2002 South Africa Metals & mining 2 715.0 ICEM 61 453
RAG 2003 Germany Metals & mining 18 386.3 ICEM 98 000
Umicore 2007 Belgium Metals & mining 11 629.6 ICEM/IMF 10 562
Faber-Castell 1999 Germany Office, school & art supplies 332.4 BWI 6 500
Schwan-Stabilo 2005 Germany Office, school & art supplies 240.5 BWI 3 145
Staedtler 2006 Germany Office, school & art supplies 208.6 BWI 3 000
StatoilHydro 1998 Norway Oil & gas 68 281.7 ICEM 25 435
ENI 2002 Italy Oil & gas 114 718.2 ICEM 73 572
Lukoil 2004 Russian Federation Oil & gas 68 109.0 ICEM 148 600
Total* 2004 France Oil & gas 216 254.0 EMCEF/FECCIR/FECER 95 000
Nampak 2006 South Africa Packaging manufacturing 1 979.6 UNI 14 376
Norske Skog 2002 Norway Paper & paper product manufacturing 4 615.7 ICEM 8 038
SCA 2004 Sweden Paper & paper product manufacturing 13 781.5 ICEM 51 022
WAZ 2007 Germany Publishing & media 1 681 477.7 IFJ 16 000

118 TMOGE-R-[2008-12-0110-1]-En.doc/v3
Company Year Country of origin Business Sales (million US$)
Global Union Federation/ National union
Employees
Securitas 2006 Sweden Security services 8 830.3 UNI 215 000
Telefónica 2001 Spain Telecommunications services 71 919.4 UNI 234 900
OTE 2001 Greece Telecommunications services 7 773.1 UNI 11 755
Portugal Telecom 2006 Portugal Telecommunications services 5 738.4 UNI 323 891
France Telecom 2007 France Telecommunications services 68 262.1 UNI 191 036
Club Med 2004 France Travel agencies & services, lodging 11 411.6 IUF 14 845
*The application of the agreement is limited to Total’s European businesses.
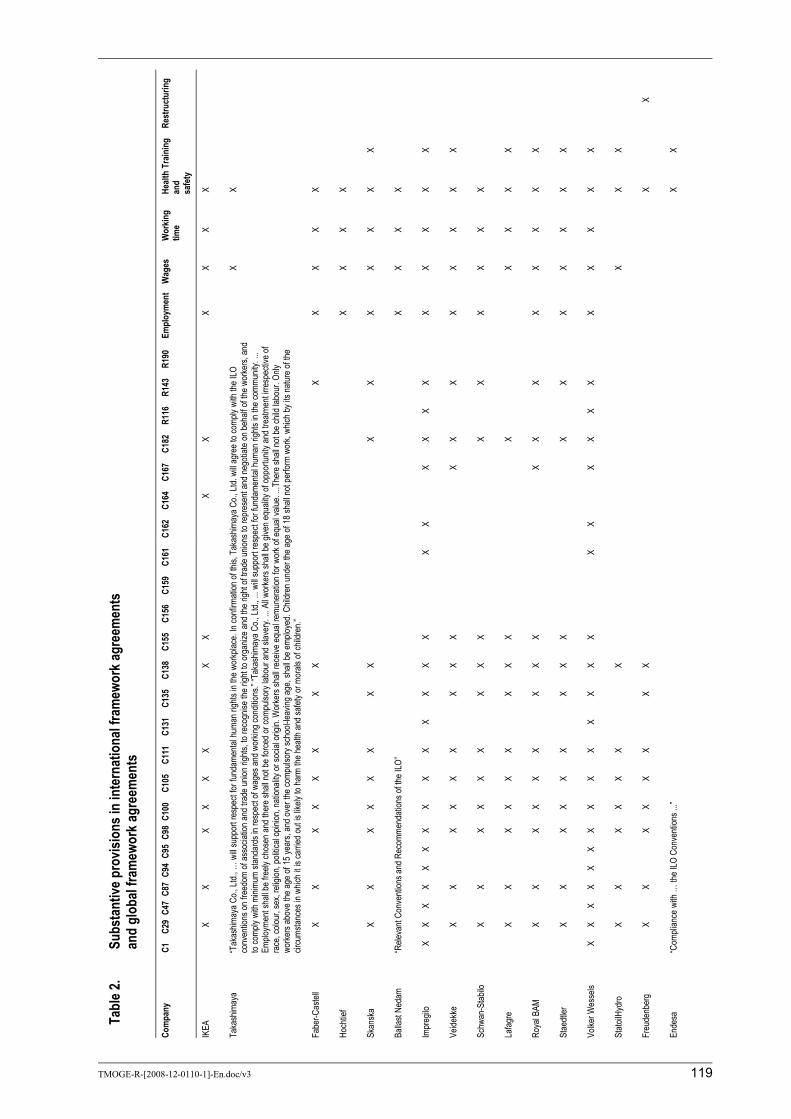
TMOGE-R-[2008-12-0110-1]-En.doc/v3 119
Tabl
e 2.
Subs
tant
ive p
rovis
ions
in in
tern
atio
nal f
ram
ewor
k agr
eem
ents
an
d gl
obal
fram
ewor
k agr
eem
ents
Com
pany
C1
C2
9 C4
7 C8
7 C9
4 C9
5 C9
8 C1
00
C105
C1
11
C131
C1
35
C138
C1
55
C156
C1
59
C161
C1
62
C164
C1
67
C182
R1
16
R143
R1
90
Empl
oym
ent
Wag
es
Wor
king
time
Healt
h an
d sa
fety
Train
ing
Rest
ruct
urin
g
IKEA
X
X
X
X X
X
X
X
X
X
X
X X
X
Taka
shim
aya
“Tak
ashim
aya C
o., Lt
d., …
will
supp
ort r
espe
ct for
fund
amen
tal hu
man r
ights
in the
wor
kplac
e. In
confi
rmati
on of
this,
Tak
ashim
aya C
o., Lt
d. wi
ll agr
ee to
comp
ly wi
th the
ILO
conv
entio
ns on
free
dom
of as
socia
tion a
nd tr
ade u
nion r
ights,
to re
cogn
ise th
e righ
t to or
ganiz
e and
the r
ight o
f trad
e unio
ns to
repr
esen
t and
nego
tiate
on be
half o
f the w
orke
rs, an
d to
comp
ly wi
th mi
nimum
stan
dard
s in r
espe
ct of
wage
s and
wor
king c
ondit
ions.”
“Tak
ashim
aya C
o., Lt
d., ...
will
supp
ort r
espe
ct for
fund
amen
tal hu
man r
ights
in the
comm
unity
. ...
Emplo
ymen
t sha
ll be f
reely
chos
en an
d the
re sh
all no
t be f
orce
d or c
ompu
lsory
labou
r and
slav
ery.
... Al
l wor
kers
shall
be gi
ven e
quali
ty of
oppo
rtunit
y and
trea
tmen
t irre
spec
tive o
f ra
ce, c
olour
, sex
, reli
gion,
politi
cal o
pinion
, nati
onali
ty or
socia
l orig
in. W
orke
rs sh
all re
ceive
equa
l remu
nera
tion f
or w
ork o
f equ
al va
lue. ..
.The
re sh
all no
t be c
hild l
abou
r. On
ly wo
rkers
abov
e the
age o
f 15 y
ears,
and o
ver t
he co
mpuls
ory s
choo
l-leav
ing ag
e, sh
all be
emplo
yed.
Child
ren u
nder
the a
ge of
18 sh
all no
t per
form
work,
whic
h by i
ts na
ture o
f the
circu
mstan
ces i
n whic
h it is
carri
ed ou
t is lik
ely to
harm
the h
ealth
and s
afety
or m
orals
of ch
ildre
n.”
X
X
Fabe
r-Cas
tell
X
X
X X
X X
X
X
X
X X
X X
Hoch
tief
X X
X X
Skan
ska
X
X
X X
X X
X
X
X
X
X X
X X
X
Balla
st Ne
dam
“Rele
vant
Conv
entio
ns an
d Rec
omme
ndati
ons o
f the I
LO”
X X
X X
Impr
egilo
X
X X
X X
X X
X X
X X
X X
X
X
X
X X
X X
X
X X
X X
Veide
kke
X
X
X X
X X
X
X X
X
X
X
X X
X X
X
Schw
an-S
tabilo
X
X
X
X X
X
X X
X
X
X
X
X X
X
Lafag
re
X
X
X X
X X
X
X X
X
X
X X
X
Roya
l BAM
X
X
X
X X
X
X X
X
X X
X
X
X X
X X
Stae
dtler
X
X
X
X X
X
X X
X
X
X
X
X X
X X
Volke
r Wes
sels
X X
X X
X X
X X
X X
X X
X X
X X
X
X X
X
X X
X X
X
Stato
ilHyd
ro
X
X
X X
X X
X
X
X
X
Freu
denb
erg
X
X
X X
X X
X
X
X
X
Ende
sa
“Com
plian
ce w
ith …
the I
LO C
onve
ntion
s ...”
X X

120 TMOGE-R-[2008-12-0110-1]-En.doc/v3
Com
pany
C1
C2
9 C4
7 C8
7 C9
4 C9
5 C9
8 C1
00
C105
C1
11
C131
C1
35
C138
C1
55
C156
C1
59
C161
C1
62
C164
C1
67
C182
R1
16
R143
R1
90
Empl
oym
ent
Wag
es
Wor
king
time
Healt
h an
d sa
fety
Train
ing
Rest
ruct
urin
g
Norsk
e Sko
g
X
X
X
X X
X
X X
X
X
X
X
X X
Anglo
-Gold
Ash
anti
X
X
X X
X X
X
X
X
ENI
X
X
X X
X X
X
X
X
X
X
RAG
“The
socia
l righ
ts an
d prin
ciples
… or
iented
acco
rding
to th
e rele
vant
treati
es an
d Con
venti
ons o
f the I
LO”
X
X X
SCA
“… pr
incipl
es de
rived
from
the I
LO D
eclar
ation
… (c
ore C
onve
ntion
s) …
” X
X
X X
X
Luko
il
X
X
X
X X
X
X
X
X
X
X X
X
EDF
X
X
X X
X X
X
X
X
X
X
X X
Rhod
ia
X
X
X
X X
X
X
X
X
X
X X
X
Umico
re
X
X
X X
X X
X
X
X
X
X
X X
X
Total
(1
) Exp
ansio
n of e
mploy
ee di
alogu
e thr
ough
prov
ision
of m
ore i
nform
ation
and c
onsu
ltatio
n with
emplo
yee r
epre
senta
tives
on T
otal’s
plan
for c
hang
e in i
ts Eu
rope
an bu
sines
ses.
(2
) Sup
port
for lo
ng-te
rm ca
reer
man
agem
ent a
nd a
cultu
re of
lifelo
ng le
arnin
g in p
rofes
siona
l life.
(3) I
denti
ficati
on an
d app
licati
on of
appr
opria
te so
lution
s rela
tive t
o emp
loyme
nt,
worki
ng co
nditio
ns an
d a so
cial s
afety
net in
the e
vent
of ch
ange
s in t
he va
rious
parts
of th
e com
pany
.
X X
X X
X X
WAZ
X
X
X
Indes
it/Mer
loni
X
X
X X
X X
X
X
X
Volks
wage
n “T
ake t
he IL
O Co
nven
tions
conc
erne
d into
cons
idera
tion”
X X
X
Daim
ler
“Prin
ciples
orien
ted at
the C
onve
ntion
s of th
e ILO
”
X X
X X
Leon
i
X
X
X X
X X
SKF
X
X
X X
X
GEA
X
X
X X
X X
X
X
X X
X X
X
Rhein
metal
l
X
X
X
X X
X
X
X X
X X
Prym
X
X
X
X X
X
X
X
X X
X
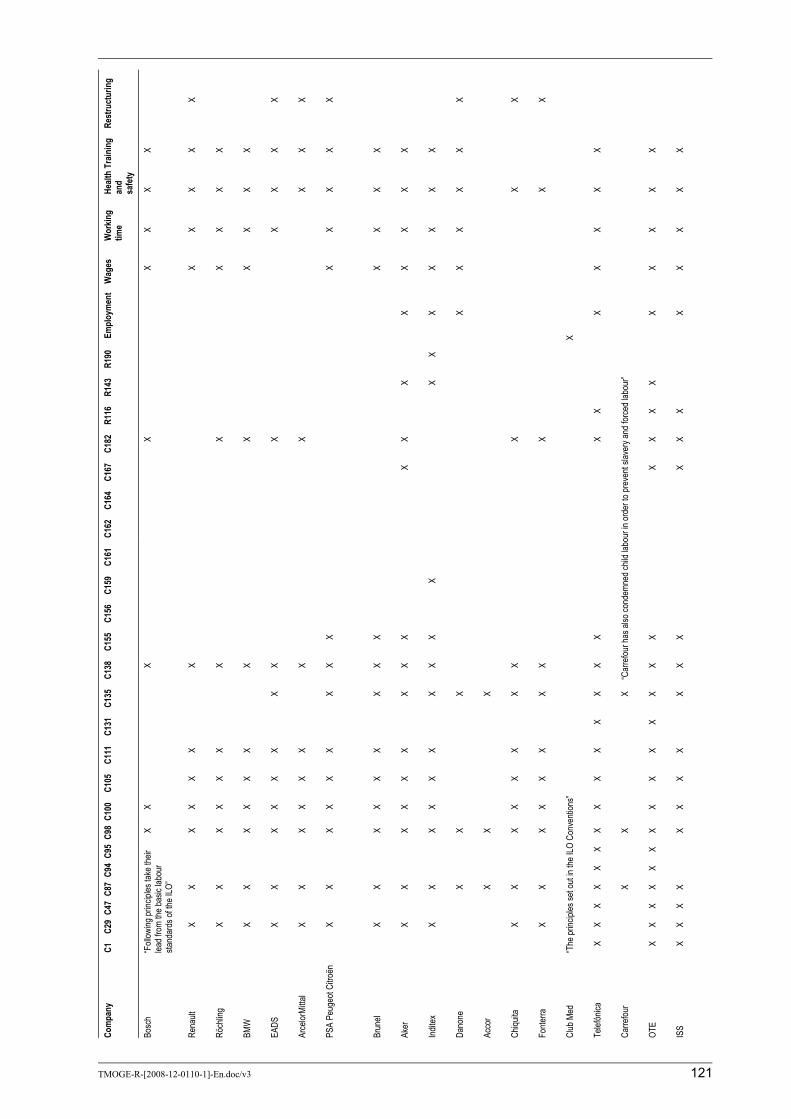
TMOGE-R-[2008-12-0110-1]-En.doc/v3 121
Com
pany
C1
C2
9 C4
7 C8
7 C9
4 C9
5 C9
8 C1
00
C105
C1
11
C131
C1
35
C138
C1
55
C156
C1
59
C161
C1
62
C164
C1
67
C182
R1
16
R143
R1
90
Empl
oym
ent
Wag
es
Wor
king
time
Healt
h an
d sa
fety
Train
ing
Rest
ruct
urin
g
Bosc
h “F
ollow
ing pr
incipl
es ta
ke th
eir
lead f
rom
the ba
sic la
bour
sta
ndar
ds of
the I
LO”
X X
X
X
X
X X
X
Rena
ult
X
X
X X
X X
X
X
X X
X X
Röch
ling
X
X
X X
X X
X
X
X
X X
X
BMW
X
X
X
X X
X
X
X
X X
X X
EADS
X
X
X
X X
X
X X
X
X
X X
X
Arce
lorMi
ttal
X
X
X X
X X
X
X
X
X X
PSA
Peug
eot C
itroën
X
X
X
X X
X
X X
X
X X
X X
X
Brun
el
X
X
X
X X
X
X X
X
X X
X X
Aker
X
X
X
X X
X
X X
X
X X
X
X
X X
X X
Indite
x
X
X
X
X X
X
X X
X
X
X
X X
X X
X X
Dano
ne
X
X
X
X X
X X
X X
Acco
r
X
X
X
Chiqu
ita
X
X
X X
X X
X
X
X
X
X
Fonte
rra
X
X
X X
X X
X
X
X
X
X
Club
Med
“T
he pr
incipl
es se
t out
in the
ILO
Conv
entio
ns”
X
Telef
ónica
X
X X
X X
X X
X X
X X
X X
X
X
X
X
X X
X X
Carre
four
X
X
X
“Car
refou
r has
also
cond
emne
d chil
d lab
our in
orde
r to p
reve
nt sla
very
and f
orce
d lab
our”
OTE
X X
X X
X X
X X
X X
X X
X X
X
X X
X
X X
X X
X
ISS
X X
X X
X X
X X
X
X X
X
X X
X X
X X
X

122 TMOGE-R-[2008-12-0110-1]-En.doc/v3
Com
pany
C1
C2
9 C4
7 C8
7 C9
4 C9
5 C9
8 C1
00
C105
C1
11
C131
C1
35
C138
C1
55
C156
C1
59
C161
C1
62
C164
C1
67
C182
R1
16
R143
R1
90
Empl
oym
ent
Wag
es
Wor
king
time
Healt
h an
d sa
fety
Train
ing
Rest
ruct
urin
g
Metro
“R
espe
ct the
right
to co
llecti
ve ba
rgain
ing an
d emp
loyee
s’ fre
edom
of as
socia
tion w
ithin
the sc
ope o
f nati
onal
rights
and l
aws.
Metro
Gro
up en
sure
s tha
t emp
loyee
s, wh
o hav
e de
cided
to be
come
mem
bers
of a u
nion,
are n
ot dis
miss
ed or
in an
y othe
r way
disa
dvan
taged
as a
resu
lt of th
eir un
ion m
embe
rship.
”
H&M
X
X
X X
X X
X
X
X
Falck
X
Eura
dius
X X
X X
X X
X X
X X
X X
X X
X X
X
X X
X X
X
Namp
ak
X
X X
X
X
X
X
X
X
X X
X
Portu
gal T
eleco
m X
X X
X X
X X
X X
X X
X X
X
X X
X X
X
X X
X X
Secu
ritas
“Dra
ws on
the I
LO’s
funda
menta
l prin
ciples
on rig
hts at
wor
k”
X X
X
Natio
nal A
ustra
lia B
ank
Grou
p “W
orke
rs’ rig
hts m
ust b
e rec
ognis
ed un
der t
he In
terna
tiona
l Lab
our O
rgan
izatio
n Con
venti
ons…
.”
Fran
ce T
eleco
m
X
X
X
X X
X
X
X
X
X X
X
Queb
ecor
X
X
X X
X
X X
X
X
List
of c
ited
ILO
stan
dard
s
1 –
Hou
rs of
Wor
k (Ind
ustry
) Con
venti
on, 1
919
29 –
For
ced L
abou
r Con
venti
on, 1
930
47 –
For
ty-Ho
ur W
eek C
onve
ntion
, 193
5 8
7 – F
reed
om of
Ass
ociat
ion an
d Pro
tectio
n of th
e Righ
t to O
rgan
ise C
onve
ntion
, 194
8 9
4 – La
bour
Clau
ses (
Publi
c Con
tracts
) Con
venti
on, 1
949
95 –
Pro
tectio
n of W
ages
Con
venti
on, 1
949
98 –
Righ
t to O
rgan
ise an
d Coll
ectiv
e Bar
gaini
ng C
onve
ntion
, 194
9 10
0 – E
qual
Remu
nera
tion C
onve
ntion
, 195
1 10
5 – A
boliti
on of
For
ced L
abou
r Con
venti
on, 1
957
111 –
Disc
rimina
tion (
Emplo
ymen
t and
Occ
upati
on) C
onve
ntion
, 195
8 13
1 – M
inimu
m W
age F
ixing
Con
venti
on, 1
970
135 –
Wor
kers’
Rep
rese
ntativ
es C
onve
ntion
, 197
1
138
– Mi
nimum
Age
Con
venti
on, 1
973
155
– Oc
cupa
tiona
l Safe
ty an
d Hea
lth C
onve
ntion
, 198
1 P
rotoc
ol of
2002
to th
e Occ
upati
onal
Safet
y and
Hea
lth C
onve
ntion
, 198
1 1
56 –
Wor
kers
with
Fami
ly Re
spon
sibilit
ies C
onve
ntion
, 198
1 1
59 –
Voca
tiona
l Reh
abilit
ation
and E
mploy
ment
(Disa
bled P
erso
ns) C
onve
ntion
, 198
3 1
61 –
Occu
patio
nal H
ealth
Ser
vices
Con
venti
on, 1
985
162
– As
besto
s Con
venti
on, 1
986
167
– Sa
fety a
nd H
ealth
in C
onstr
uctio
n Con
venti
on, 1
988
182
– W
orst
Form
s of C
hild L
abou
r Con
venti
on, 1
999
R11
6 – R
educ
tion o
f Hou
rs of
Wor
k Rec
omme
ndati
on, 1
962
R14
3 – W
orke
rs’ R
epre
senta
tives
Rec
omme
ndati
on, 1
971
R19
0 – W
orst
Form
s of C
hild L
abou
r Rec
omme
ndati
on, 1
999

TMOGE-R-[2008-12-0110-1]-En.doc/v3 123
Table 3. Procedural provisions in international framework agreements
Company Duration Supplier relations Implementation Frequency of meetings
Trade union involvement (other than GUF)
Mediation/arbitration
IKEA Reneg. 2001; Open
Mandatory Implementation via "IKEA Way On Purchasing Home Furnishing Products"; established compliance organization
twice a year
Takashimaya Open Mandatory "Takashimaya Co., Ltd., Takashimaya Labour Union and UNI Global Union shall be responsible for the administration and implementation of this agreement. To that end they willengage in ongoing dialogue."
Takashimaya Labour Union
Joint (IFA) among Takashimaya Co., Ltd., Takashimaya Labour Union and UNI Global Union
Faber-Castell Open Joint monitoring committee Biennial IG Metall Hochtief Open Mandatory Report to executive board;
officer appointed for applicationIG BAU Joint (IFA)
Skanska Open Information/ influence
Joint application group dealing with compliance; joint site inspections at least every year
European Works Council (EWC)
Arbitration board to be determined jointly; decisions are binding.
Ballast Nedam 2 years Mandatory Report to executive board; officer appointed for application
Annual FNV Bouw, works council
Joint (IFA)
Impregilo Open Mandatory Consulting group Annual Feneal-UIL, Filca-CISL, Fillea-CGIL
Joint (IFA)
Veidekke 2 years Criterion/ consequence
Senior management responsible for implementation: local rep. Training for monitoring
Annual Fellesborbundet, Norsk Arbeidsmandsforbundet, Chief Shop Steward
Joint (IFA)
Schwan-Stabilo Open Criterion/ consequence
Joint monitoring committee, monitoring conducted very two years at productions and sales subsidiary locations
Annual IG Metall, works council
Lafarge Open Criterion/ consequence
Joint reference group to follow up and monitor
Annual Joint (IFA)
Royal BAM Open Mandatory Joint reference group to follow up and monitor
Annual FNV Bouw, Houten Bouwbound CNV
Joint (IFA)
Staedtler Open Mandatory Joint monitoring team to evaluate and supervise implementation
Biennial IG Metall, works council, local trade unions or employee reps.
Joint (IFA)
VolkerWessels Open Mandatory Joint monitoring group to evaluate and review implementation
Annual Joint (IFA)
StatoilHydro Renewed 2001, 2003, 2005 and 2008
Information/ influence
Joint annual meetings to review implementation; training to facilitate implementation
Annual NOPEF
Freudenberg Dec.2001 (renewed 2002)
Joint annual meeting to monitor the agreement
Annual IG BCE
Endesa Dec.2003 Six-monthly international consultation meetings
twice a year FM-CC.OO, FIA-UGT
Norske Skog 2 years (renewed 2007)
Information/ influence
Joint annual review meeting; Senior management responsible for implementation
Annual Fellesbforbundet, Chief Shop Steward
Joint (IFA)
Anglo-Gold Open Subcommittee to deal with cases
Annual NUM
ENI 2 years Criterion/ consequence
Annual FILCEA-Cgil, FEMCA-Cisl, UILCEM-Uil
RAG 1 year Regular consultation and information about implementation
IG BCE, works council
SCA 2 years (updated 2007)
Information/ influence
Annual joint meetings Annual Pappers, EWC
Lukoil 1 year Information/ influence
Annual joint meetings Annual ROGWU

124 TMOGE-R-[2008-12-0110-1]-En.doc/v3
Company Duration Supplier relations Implementation Frequency of meetings
Trade union involvement (other than GUF)
Mediation/arbitration
EDF 3 years Criterion/consequence
Joint implementation; Consultation Committee on EDF Group Corporate Social Responsibility (CCSR)
Annual FNME-CGT, FCE-CFDT, FNEM-FO, CFE/CGC, CFTC, Unison, Prospect, Amicus, GMB, VDSZSZ, Solidarnosc, SOZE, Luz y Fuerza, SUTERM, SINTERGIA, SENGE, Employee reps of Asia–Pacific Branch
CCSR (IFA)
Rhodia 3 years Mandatory Joint review of application of theagreement
Annual
Umicore 4 years Information/ influence
Joint committee responsible for monitoring the implementation; report from external auditor
Annual EWC Chair
WAZ Open Subcommittee to consider structure and content of group forum discussions; group forum includes union reps from national units and local management.
Annual EFJ, national union reps.
Indesit/Merloni Open Criterion/consequence
Monitoring by National Joint Commission; report on implementation at annual EWC and National Information Meeting, or directly to worker reps/unions.
Annual EWC, national information meetings, (FIM, FIOM, UILM as co-signatories), Group Global Works Council
Volkswagen Open Criterion/consequence
Implementation is discussed within the framework of the Group Global Works Council
Group Global Works Council
Daimler Open Criterion/consequence
Senior management responsible for compliance; Cooperate Audit also to examine and take action.
Corporate management to regularly report to and consult with international employee reps.
Leoni Open Criterion/consequence
Internal Auditing Dept. will monitor compliance; report and discussion at annual EWC meetings
Annual EWC
SKF Open Information/ influence
Regular joint supervision World Works Council
GEA Open Criterion/consequence
Information on observation of agreement will take place in the EWC and EWC presiding committee
Annual EWC
Rheinmetall Open Criterion/consequence
Senior management and workers’ reps. Responsible for implementation; information exchange in EWC
Annual EWC
Prym Open Criterion/ consequence
EWC is informed and consulted about implementation
Annual EWC
Bosch Open Mandatory Part of Management System Manual; senior management responsible for implementation; implementation discussed with its European Committee
EWC
Aker Open Applicable to all companies that are part of Aker
Effective local monitoring must involve the local management, the workers and their representatives, health and safety representatives and local trade unions.
Annual Fellesforbundet Joint (IFA)