social capital impact study - crescent city farmers … capital impact study prepared by market...
TRANSCRIPT
Social Capital Impact Study
Prepared by Market Umbrella for
The Crescent City Farmers Market October 11, 2012
This study was created using the Neighborhood Exchange Evaluation Device (NEED), a methodology developed by Market Umbrella.

© Market Umbrella | NEED Study | Crescent City Farmers Market | 2012
2
Market Umbrella is a 501(c)(3) nonprofit devoted to cultivating the field of public markets for public good. For more information about Market Umbrella, please visit
www.marketumbrella.org.

© Market Umbrella | NEED Study | Crescent City Farmers Market | 2012
3
What Is Social Capital?
Social capital encompasses the relationships and networks that create the trust that
undergirds civil society. Social scientists identify two kinds of cohesion-building
activities, or activities that increase social capital: Those that “bond” homogeneous
community members to each other and those that create “bridges” across different
groups. For example, transactions between buyers and sellers at a market with a narrow
demographic build bonding cohesion, while farmers markets that increase positive
interactions among diverse individuals and groups build “bridging” cohesion. The latter
help bring together groups that otherwise would have little reason or opportunity to
interact: urban with rural, immigrant with native, old with young, black with white.
According to the World Health Organization, “the social determinants of health are the
conditions in which people are born, grow, live, work and age, including the health
system.” According to Yellow Wood Associates, who specialize in the economic
development of rural areas, investments in bridging across groups can lead to shared
experiences and connections between otherwise unconnected individuals and groups.
Investments in bonding social capital strengthen relationships within groups. Further,
Investments in social capital can lead to improved education and health outcomes.
Farmers markets have the opportunity to improve social capital in the communities they
serve and thus positively change the social determinants of health.
© Market Umbrella | NEED Study | Crescent City Farmers Market | 2012
4
What Is NEED?
Influenced by the public health thinking concerned with the social determinants of
health, Market Umbrella developed the Neighborhood Exchange Evaluation Device
(NEED) to analyze social transactions in farmers markets. Such transactions are key
indicators of the ability of markets to promote trust. The more connections and
associations a person has, and the more varied those connections are, the stronger the
sense of cohesion, or trust, he or she has with the community.
Farmers markets provide numerous opportunities for individuals to interact with
others. Whereas the modern grocery store experience is designed to minimize social
contact, farmers markets’ appeal hinges upon it: There are no self-check-out lines in
farmers markets. Market Umbrella hypothesized that the many transactions occurring in
public markets help bridge social groups and create bonds within groups.
NEED Methodology
Using the NEED methodology, Market Umbrella evaluates how often and with whom
farmers markets facilitate social trust: among and between shoppers, vendors, and
neighbors. Trained research teams conduct intercept surveys with a representative
sample of shoppers on one or more representative market days and compile quantitative
and qualitative questions about their experiences at the market.
Measuring Social Capital at the Crescent City Farmers Market
NEED measures the social ties that broaden social networks, improve access to valuable
information, and create a sense of belonging. These are building blocks for healthy
communities.
Market vendors who trust the market staff to operate fairly and with integrity can
grow their businesses in the safety of the market. Similarly, shoppers who trust the
market to prevent price collusion among vendors or who trust vendors to provide safe,
healthful, and good-tasting produce may invest more time and money as loyal shoppers.
How successful is the Crescent City Farmers Market in promoting social ties within
its community of vendors, shoppers, and neighbors?

© Market Umbrella | NEED Study | Crescent City Farmers Market | 2012
5
Summary: NEED Study of the Crescent City Farmers Market Survey Findings: Survey respondents (shoppers, vendors, neighborhood residents)
were asked the following questions. Aggregated responses for all markets are below.
Shopper Survey Data Set: In March 2012, the NEED research team, including
pollsters from the Policy and Research Group in New Orleans, interviewed adult
shoppers at the Crescent City Farmers Market’s three locations:
• 142 adult shoppers at the Tuesday, Uptown market on Broadway Avenue
• 130 adult shoppers at the Thursday, Mid-City market on Orleans Avenue
• 155 adult shoppers at the Saturday, Downtown market on Magazine Street
TOTAL: 427 surveyed shoppers
Shopper Survey Responses
1. How long did you stay at the market today (in minutes)?
Response Number Percent
1–29 minutes 351 82.2%
30–59 minutes 64 15%
60–89 minutes 10 2.3%
90–120 minutes 2 0.5%
427 100%
2. Do you live or work in this neighborhood?
Response Number Percent
Yes 242 56.7%
No 185 43.3%
427 100% 3. What else do you like about the market besides shopping?
Response Number Percent
Support locals 250 58.6%
Atmosphere 61 14.3%
Meeting people 38 8.9%
Eating 34 8.0%
Nothing 4 0.9%
Other 40 9.4%
427 100%
© Market Umbrella | NEED Study | Crescent City Farmers Market | 2012
6
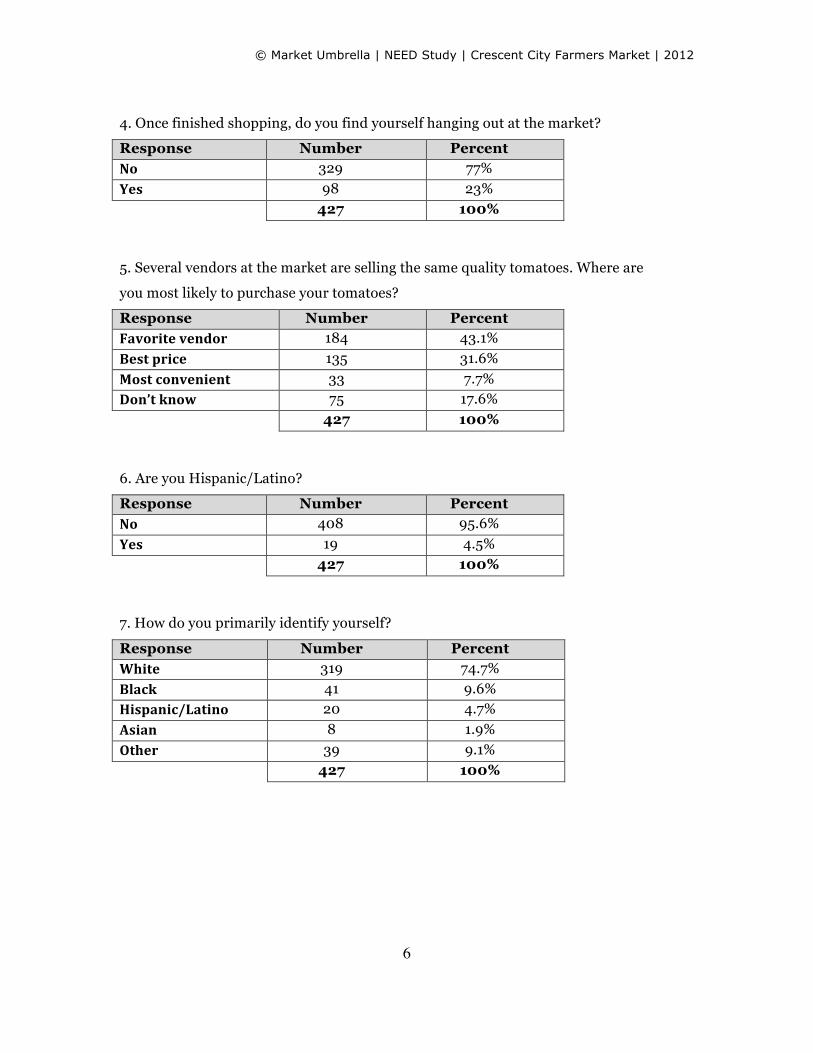
4. Once finished shopping, do you find yourself hanging out at the market?
Response Number Percent
No 329 77%
Yes 98 23%
427 100%
5. Several vendors at the market are selling the same quality tomatoes. Where are
you most likely to purchase your tomatoes?
Response Number Percent
Favorite vendor 184 43.1%
Best price 135 31.6%
Most convenient 33 7.7%
Don’t know 75 17.6%
427 100%
6. Are you Hispanic/Latino?
Response Number Percent
No 408 95.6%
Yes 19 4.5%
427 100%
7. How do you primarily identify yourself?
Response Number Percent
White 319 74.7%
Black 41 9.6%
Hispanic/Latino 20 4.7%
Asian 8 1.9%
Other 39 9.1%
427 100%

© Market Umbrella | NEED Study | Crescent City Farmers Market | 2012
7
Vendor Survey Data Set: In March 2012, the NEED research team, including
pollsters from the Policy and Research Group in New Orleans, interviewed vendors at the
Crescent City Farmers Market’s three locations:
• 28 vendors at the Tuesday, Uptown market on Broadway Avenue
• 11 vendors at the Thursday, Mid-City market on Orleans Avenue
• 24 vendors at the Saturday, Downtown market on Magazine Street
TOTAL: 63 surveyed vendors
Vendor Survey Responses
1. What is it about this market you like?
Response Number Percent I like the people 39 61.9%
Make more money 17 27%
This market needs support 4 6.4%
Don’t know 3 4.8%
63 100%
2. What kinds of benefits besides sales do you get from this market?
Response Number Percent
Meeting new people 30 47.6%
New business opportunities 22 34.9%
Support the market 4 6.4%
Support the Neighborhood 3 4.8%
Don’t know 4 6.4%
63 100%
3. On a scale of 1 to 5, to what degree do you feel a sense of community when you
come to the market?
Response Number Percent
Strong sense 44 69.8%
Solid sense 12 19.1%
Some sense 7 11.1%
Weak sense 0 0%
No sense 0 0%
63 100%

© Market Umbrella | NEED Study | Crescent City Farmers Market | 2012
8
4. Do you let any customers purchase on credit?
Response Number Percent
Yes 35 55.6%
No 28 44.4%
63 100%
5. Gender
Response Number Percent
Female 34 54%
Male 29 46%
63 100%
6. Are you Hispanic/Latino?
Response Number Percent
No 59 93.7%
Yes 4 6.4%
63 100%
7. How do you primarily identify yourself?
Response Number Percent
White 53 84.1%
Hispanic/Latino 4 6.4%
Black 3 4.8%
Other 3 4.8%
63 100%

© Market Umbrella | NEED Study | Crescent City Farmers Market | 2012
9
Neighborhood Resident Survey Data Set: In March 2012, the NEED research
team, including pollsters from the Policy and Research Group in New Orleans,
interviewed residents of the neighborhoods around the Crescent City Farmers Market’s
three locations:
• 35 residents at the Tuesday, Uptown market on Broadway Avenue
• 42 residents at the Thursday, Mid-City market on Orleans Avenue
• 63 residents at the Saturday, Downtown market on Magazine Street
TOTAL: 140 surveyed shoppers
Resident Survey Responses
1. Would you consider yourself a resident, a worker, the owner of a local business,
or a visitor at this particular address?
Response Number Percent
Resident 64 45.7%
Worker 49 35.0%
Visitor 21 15.0%
Owner 6 4.3%
140 100%
2. Do you know about the local farmers market1?
Response Number Percent
Yes 116 82.9%
No 24 17.1%
140 100%
3. Do you shop at the market?
Response Number Percent
Yes 78 67.2%
No 38 32.8%
116 100%
1 Tabulation for questions 3–7 include only respondents who answered “Yes” to question 2 (Do you know about the local farmers market?).

© Market Umbrella | NEED Study | Crescent City Farmers Market | 2012
10
4. Has the market benefitted this neighborhood?
Response Number Percent
Yes 109 94%
No 7 6%
116 100%
5. Gender
Response Number Percent
Female 67 57.8%
Male 49 42.2%
116 100% 6. Are you Hispanic/Latino?
Response Number Percent
No 108 93.9%
Yes 7 6.1%
115 100%
7. How do you primarily identify yourself?
Response Number Percent
White 84 73%
Black 18 15.7%
Hispanic/Latino 7 6.1%
Asian 4 3.5%
Other 2 1.7%
115 100%

© Market Umbrella | NEED Study | Crescent City Farmers Market | 2012
11
Interpreting the Survey Findings These survey results tell us a great deal about the market and its ability to create and
enhance social capital.
Shoppers: While the market’s primary, advertised purpose is to facilitate trade, 91.1%
of respondents said they like the Crescent City Farmers Market for reasons beyond
shopping, such as supporting locals (58.6%), meeting people (8.9%) and soaking up
atmosphere (14.3%). And 23%, almost a quarter of respondents, report “hanging out” at
the market even after they have finished shopping. Also, 43.1% report a preference for
shopping with “favorite vendors.”
We interpret these figures as indicating that the market is an important institution
for facilitating both social transactions and market transactions with social components.
Vendors: Among Crescent City Farmers Market vendors, almost half (47.6%) of
respondents said they benefited from meeting new people at the market. Over a third,
34.9%, reported benefiting from new business opportunities generated at the market.
Also, 6.4% report benefits from supporting the market, and another 6.4% report
benefiting from supporting the neighborhood.
Perhaps even more importantly, 69.8% report that they feel a “strong sense” of
community. A further 19.1% report feeling a “solid” sense of community, and 11.1%
report “some” sense of community. No vendors reported a “weak” sense or “no sense” of
community.
A surprising 55.6% of respondents allow customers to purchase on credit,
demonstrating a high level of trust between vendors and shoppers.
Neighbors: Among Crescent City Farmers Market neighbors, 82.9% of residents say
they know about the market, and 67.2%—a large proportion—say they shop at the
market. Interestingly, 94% of residents say they believe the market has a positive impact
on the neighborhood (despite the occasional inconveniences of increased traffic, parking
issues, and trash left in the area). This means that even residents who do not shop at the
market still value the market’s presence in their neighborhood.

© Market Umbrella | NEED Study | Crescent City Farmers Market | 2012
12
Bonding and Bridging: The high level of trust between vendors and shoppers, the
reported sense of community among vendors, and the neighborhoods’ positive attitude
about the market all point to a market institution that is creating bonding and bridging
opportunities for its participants and neighbors.
NEED studies of the Crescent City Farmers Market in 2007 indicated that the
overwhelming majority of shoppers identified themselves as white (85%). After three-
years of inventive community outreach programs to new audiences—seniors, WIC
recipients, SNAP recipients, and children—a 2010 NEED study showed a marked
increase in shopper ethnic diversity (from 15% non-white in 2007 to 24% non-white in
2010). In 2012, this percentage went up again, slightly, to 25.3%.
However, approximately 27% of surveyed neighborhood residents are non-white, as
compared to the vendor base (15.9%) and the shopper base (25.3%). These figures speak
to the ongoing challenge of improving bridging opportunities between market
participants and the surrounding neighborhood.
Another figure, though, points to effective bridging: The number of shoppers who
come from outside the neighborhood. About 43% of shoppers neither work nor live in
the neighborhood where they attend the market. This means that while the market is
obviously doing a good job of integrating the market into its neighborhoods, it is also
creating bridging opportunities between market participants and residents from other
parts of the city.

© Market Umbrella | NEED Study | Crescent City Farmers Market | 2012
13
Conclusions
The Neighborhood Exchange Evaluation Device (NEED) studies conducted in March
2012 demonstrate that the Crescent City Farmers Market in New Orleans increases
social capital, primarily by
• creating a shopping environment with multiple opportunities for transactions
that include a social component
• creating an environment in which vendors feel a sense of community among
themselves and feel a strong sense of trust with their patrons
• creating a positive relationship between the market and its host neighborhoods
NEED thus underscores the value of the farmers market as a platform for improving
trust and social cohesion, in ways that conventional grocery stores and big box stores,
which are designed to minimize social activities, cannot. Farmers markets are places
where consumers interact with each other and with food producers and form the kinds of
ties that help build trust and that support civil society. The Crescent City Farmers Market
thus influences the social determinants of health and positively impacts human capital in
its community.
© Market Umbrella | NEED Study | Crescent City Farmers Market | 2012
14
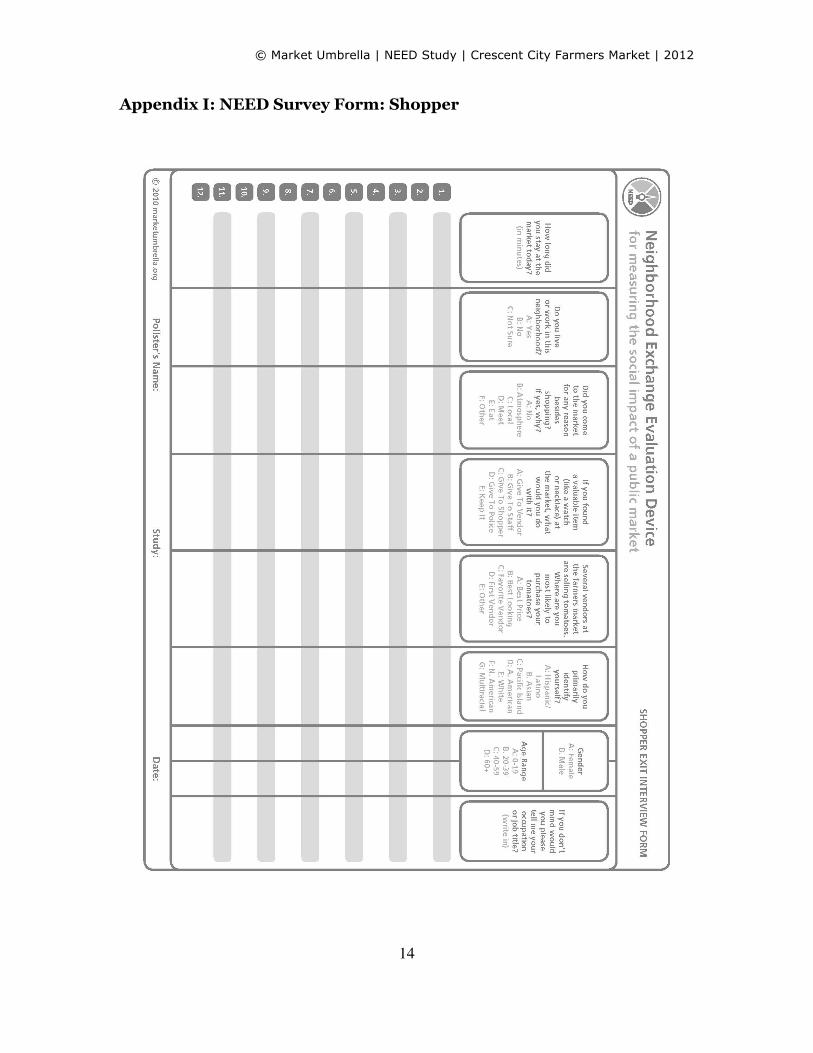
Appendix I: NEED Survey Form: Shopper

© Market Umbrella | NEED Study | Crescent City Farmers Market | 2012
15
Appendix II: NEED Survey Form: Vendor

© Market Umbrella | NEED Study | Crescent City Farmers Market | 2012
16
Appendix III: NEED Survey Form: Resident