social background of mps...
TRANSCRIPT

www.Parliament.uk/commons-library | intranet.Parliament.uk/commons-library | [email protected] | @commonslibrary
BRIEFING PAPER
Number CBP 7483, 28 September 2017
Social background of MPs 1979-2017
By Cassie Barton, Lukas Audickas
Inside: 1. Gender 2. Age 3. Ethnicity 4. Parliamentary Experience 5. Education 6. Occupation

Number CBP 7483, 28 September 2017 2
Contents Summary 3
1. Gender 4
2. Age 5
3. Ethnicity 6
4. Parliamentary Experience 8
5. Education 10 5.1 Sutton Trust estimates 10 5.2 British General Election of 2015 and previous years 10 5.3 Trends 11
6. Occupation 12
Contributing Authors: Elise Uberoi, Vyara Apostolova, Lukas Audickas, Lydia Jackson
Cover page image attributed to: Catherine Bebbington / Parliamentary Copyright

3 Social background of MPs 1979-2017
Summary This briefing paper provides data on the gender, age, ethnicity and educational backgrounds of Members of Parliament elected at the 2017 General Election and how this has changed since 1979. Data on occupational background is currently available up to 2015; a further update will be provided when 2017 data becomes available.
• There were 208 female MPs elected at the 2017 General Election (32% of all MPs). This is the highest ever number and proportion. In 1979 there were 19 women MPs, 3% of the total.
• 52% (339) of MPs elected in 2017 were aged over 50. Following the election, the proportion of MPs aged 70 and over increased to 4% (28). 14 MPs aged under 30 were elected (2% of the total).
• 52 MPs were from non-white backgrounds, 8% of the total.
Around 14% of the whole UK population are from a non-white background.
• The Sutton Trust estimates that 29% of MPs elected at the 2017
General Election attended private schools and 23% attended Oxford or Cambridge.
• 87 MPs elected in 2017 had no previous Parliamentary
experience (13%). 551 (65%) had been MPs in the previous Parliament and 12 were re-elected having served in a previous Parliament.
Data on UK elections prior to 1979 is available in the UK Election Statistics: 1918-2012 12/43 research paper.
Number CBP 7483, 28 September 2017 4
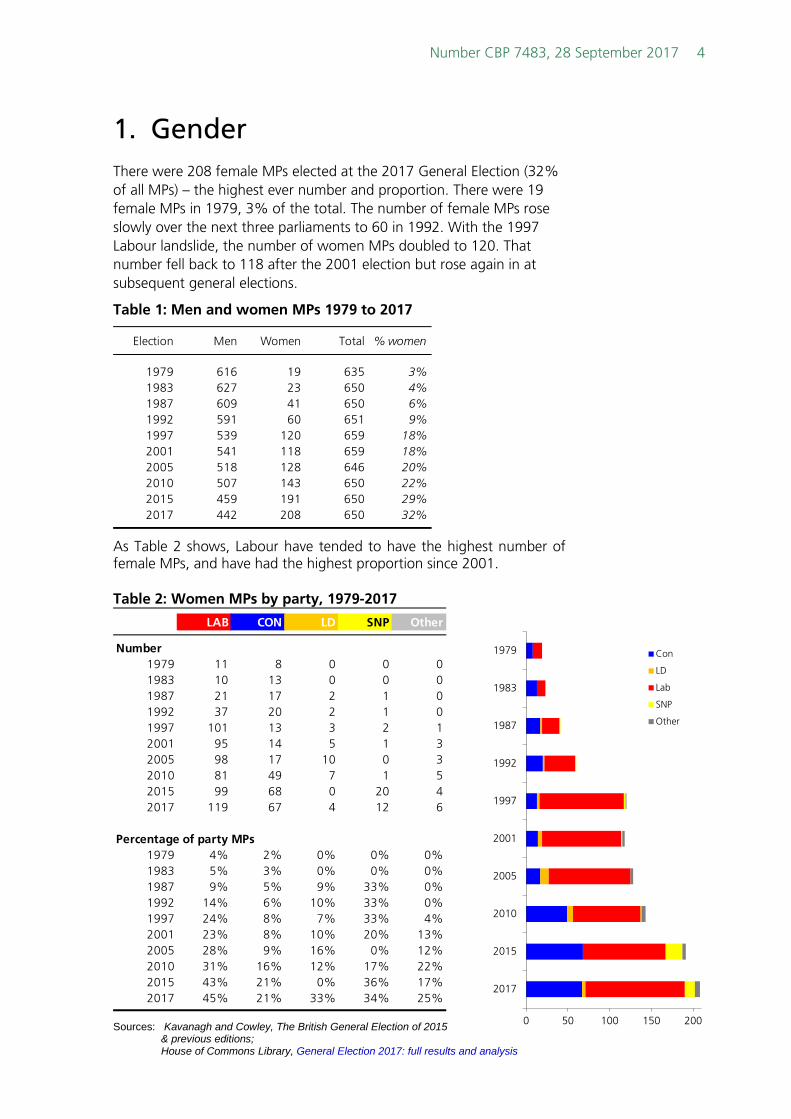
1. Gender There were 208 female MPs elected at the 2017 General Election (32% of all MPs) – the highest ever number and proportion. There were 19 female MPs in 1979, 3% of the total. The number of female MPs rose slowly over the next three parliaments to 60 in 1992. With the 1997 Labour landslide, the number of women MPs doubled to 120. That number fell back to 118 after the 2001 election but rose again in at subsequent general elections.
Table 1: Men and women MPs 1979 to 2017
As Table 2 shows, Labour have tended to have the highest number of female MPs, and have had the highest proportion since 2001. Table 2: Women MPs by party, 1979-2017
Sources: Kavanagh and Cowley, The British General Election of 2015
& previous editions; House of Commons Library, General Election 2017: full results and analysis
Election Men Women Total % women
1979 616 19 635 3%1983 627 23 650 4%1987 609 41 650 6%1992 591 60 651 9%1997 539 120 659 18%2001 541 118 659 18%2005 518 128 646 20%2010 507 143 650 22%2015 459 191 650 29%2017 442 208 650 32%
LAB CON LD SNP Other
Number1979 11 8 0 0 01983 10 13 0 0 01987 21 17 2 1 01992 37 20 2 1 01997 101 13 3 2 12001 95 14 5 1 32005 98 17 10 0 32010 81 49 7 1 52015 99 68 0 20 42017 119 67 4 12 6
Percentage of party MPs1979 4% 2% 0% 0% 0%1983 5% 3% 0% 0% 0%1987 9% 5% 9% 33% 0%1992 14% 6% 10% 33% 0%1997 24% 8% 7% 33% 4%2001 23% 8% 10% 20% 13%2005 28% 9% 16% 0% 12%2010 31% 16% 12% 17% 22%2015 43% 21% 0% 36% 17%2017 45% 21% 33% 34% 25%
0 50 100 150 200
1979
1983
1987
1992
1997
2001
2005
2010
2015
2017
Con
LD
Lab
SNP
Other

5 Social background of MPs 1979-2017
0 50 100 150
85+80-8475-7970-7465-6960-6455-5950-5445-4940-4435-3930-3425-2920-24
MPs by age group, 2017
2. Age In the period from 1979 to 2017, the average age of MPs at elections has been consistently around 50 years. From 1997 to 2005 the average age of MPs elected rose, from 49.3 years in 1997 to 51.2 years in 2005, before falling to 50.5 in 2017.
In 2017, 52.2% (339) of those elected were aged over 50. This is lower than in 2005 (56.2%), and very similar to in 2015 (52.8%). The proportion of MPs aged 70 and over increased from 2.5% (16) in 2010 to 4.3% (28) in 2017 – the highest share since 1979. In the current Parliament, the number of MPs aged under 30 increased to 14 (2.2%), the highest proportion ever other than 15 in 2010 (2.3%). Table 3: Age of MPs at General Elections 1979 to 2017
Notes: Age given at the date of the general election. Publicly-available data sources were used where dates of birth were not available from the House of Commons Members’ Names Information Service. In some cases, ages are approximate (e.g. based on a birth year or month rather than a specific day). Source: House of Commons Library, Members’ Names Information Service; Library research. The Labour party tends to have a higher proportion of MPs over the age of 60. 27% of Labour MPs are aged over 60 compared to 19% of Conservatives, 17% of Liberal Democrats and 9% of Scottish National Party MPs. The average age for SNP MPs is 46, the lowest average for any of the four largest parties (those with 8 or more MPs). Table 4: Age of MPs elected at the 2017 General Election by party
Notes: See Table 3, above. Data was not available for four Labour MPs and one Conservative MP. Source: House of Commons Library, Members’ Names Information Service; Library research.
Election
Average Age at election
(Years) 18-29 30-39 40-49 50-59 60-69 70+Not
specified Total
1979 49.6 6 120 205 203 87 14 6351983 48.8 10 120 223 201 86 9 6491987 49.0 4 112 252 197 79 6 6501992 50.0 1 82 259 211 95 3 6511997 49.3 10 92 255 225 69 8 6592001 50.3 4 79 236 247 83 10 6592005 51.2 3 89 191 249 100 14 6462010 49.9 15 108 196 216 99 16 6502015 50.6 13 89 205 212 107 24 6502017 50.5 14 102 190 197 114 28 5 650
Average ageNumber (years) Under 40 40-59 60+ Unknown
LAB 262 51.6 20% 52% 27% 2%CON 317 49.9 14% 67% 19% 0%LD 12 53.5 17% 67% 17% 0%SNP 35 46.0 31% 60% 9% 0%Other 24 51.2 21% 50% 29% 0%
All 650 18% 60% 22% 1%

Number CBP 7483, 28 September 2017 6
3. Ethnicity As an individual’s ethnicity is self-defined, it is hard to obtain complete records of MPs’ ethnicity, particularly historically. It is generally stated that the first non-white MPs since World War II were elected in 1987, when four Labour MPs were from a non-white background.
52 non-white MPs were elected at the 2017 General Election, according to analysis from British Future. This represents 8% of all MPs and is the highest number and proportion of ethnic minority MPs returned at a general election to date.
Around 13.6% of people in the UK were from an ethnic minority group at the time of the 2016 Annual Population Survey.1
Table 5: Ethnicity of MPs elected at General Elections 1987 to 2017 by party
Source: House of Commons Library, General Election 2017: results and analysis; British
Future, 52 minority MPs to sit in ‘most diverse UK parliament ever’, 9 June 2017
The gender split of ethnic minority MPs elected at the 2017 General Election is exactly even: 26 are male and 26 are female. 19 (59%) of Labour ethnic minority MPs are female, compared to 13 (32%) of Conservative ethnic minority MPs.
1 Annual Population Survey, Q1 2016 – Q4 2016 dataset
LAB CON LD SNP Other Total
Non-white1987 4 0 0 0 0 41992 5 1 0 0 0 61997 9 0 0 0 0 92001 12 0 0 0 0 122005 13 2 0 0 0 152010 16 11 0 0 0 272015 23 17 0 1 0 412017 32 19 1 0 0 52
White1987 225 376 22 3 20 6461992 266 335 20 3 21 6451997 409 165 46 6 24 6502001 400 166 52 5 24 6472005 342 196 62 6 25 6312010 242 295 57 6 23 6232015 209 313 8 55 24 6092017 230 298 11 35 24 598
Total1987 229 376 22 3 20 6501992 271 336 20 3 21 6511997 418 165 46 6 24 6592001 412 166 52 5 24 6592005 355 198 62 6 25 6462010 258 306 57 6 23 6502015 232 330 8 56 24 6502017 262 317 12 35 24 650
0 10 20 30 40 50
SNP
LD
CON
LAB
Total
Ethnic minority MPs by gender and Party,
2017
Male
Female
0 10 20 30 40 50
SNP
LD
CON
LAB
Total
Ethnic minority MPs by gender and Party,
2015
Male
Female

7 Social background of MPs 1979-2017
The Liberal Democrats gained one female ethnic minority MP, Layla Moran. She is the first non-white Liberal Democrat to be elected at a general election (Parmjit Singh Gill was elected for the Liberal Democrats at a 2004 by-election, but did not retain the seat in the 2005 General Election). The first ethnic minority SNP MP, Tasmina Ahmed-Sheikh, was elected in 2015. She did not retain her seat in 2017.

Number CBP 7483, 28 September 2017 8
4. Parliamentary Experience Of MPs elected in 2017, 87 (13%) had no previous Parliamentary experience. 551 (85%) had been MPs in the 2015-17 Parliament, while 12 were re-elected having served in a previous Parliament.
Table 6: Current MPs by first general election date and party
In the current Parliament, Kenneth Clarke and Dennis Skinner share the longest length of service (46.1 years excluding dissolution periods). Both have been MPs continuously since the 1970 General Election. However, Kenneth Clarke is the current Father of the House.2 They are followed by Sir Peter Bottomley (41.2 years of service) and Geoffrey Robinson (40.5 years of service).
2 In the situation when several MPs share the longest continuous service the Father of
the House is considered to be the MP who took their Oath first.
CON LAB SNP LD Other Total
Number of MPs elected by general election (includes by-elections before next gener
1970 1 1 0 0 0 21974 (Oct) 1 2 0 0 0 31979 0 4 0 0 0 41983 12 6 0 0 0 181987 4 5 0 0 0 91992 13 11 0 0 0 241997 19 41 0 3 2 652001 14 13 1 2 5 352005 46 23 2 2 2 752010 112 56 0 1 6 1752015 65 54 31 0 3 1532017 30 46 1 4 6 87
Total: 317 262 35 12 24 650
% of MPs elected by general election (includes by-elections before next general elec
1970 0% 0% 0% 0% 0% 0%1974 (Oct) 0% 1% 0% 0% 0% 0%1979 0% 2% 0% 0% 0% 1%1983 4% 2% 0% 0% 0% 3%1987 1% 2% 0% 0% 0% 1%1992 4% 4% 0% 0% 0% 4%1997 6% 16% 0% 25% 8% 10%2001 4% 5% 3% 17% 21% 5%2005 15% 9% 6% 17% 8% 12%2010 35% 21% 0% 8% 25% 27%2015 21% 21% 89% 0% 13% 24%2017 9% 18% 3% 33% 25% 13%
Total: 100% 100% 100% 100% 100% 100%
Note: MPs elected at by-elections are categorised by the first general election at which they were elected.
Sources: House of Commons Library, Members Names Information Service
9 Social background of MPs 1979-2017
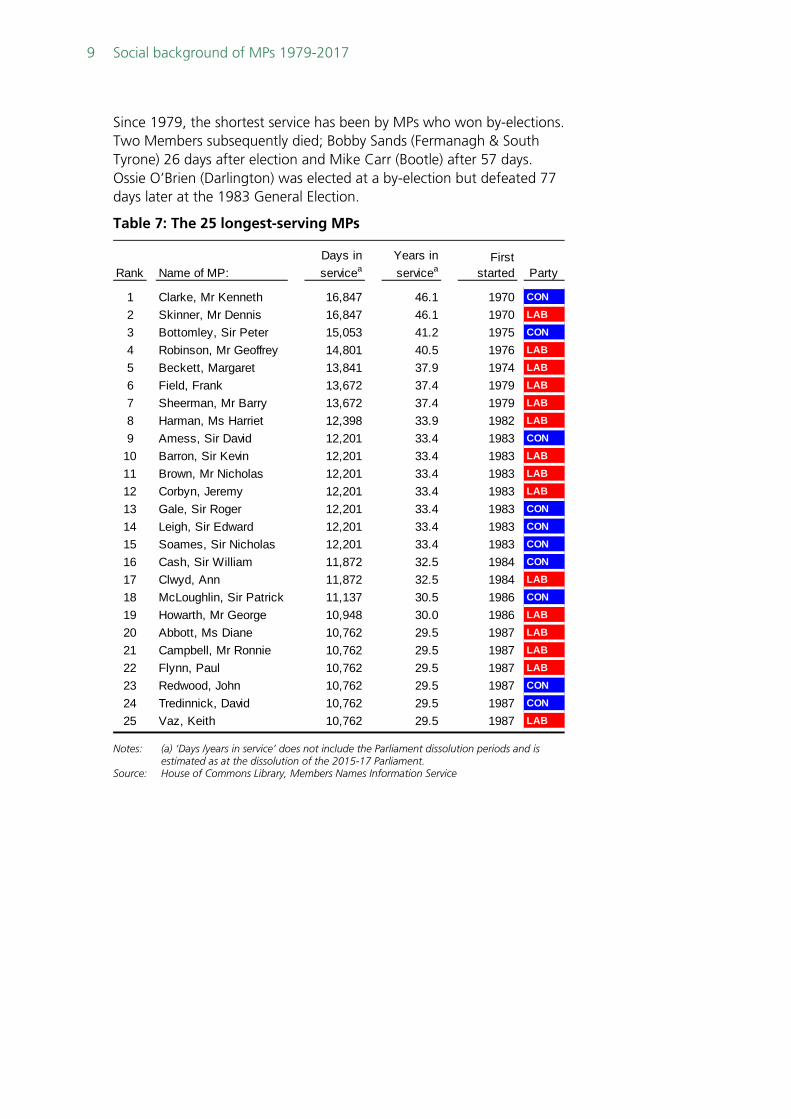
Since 1979, the shortest service has been by MPs who won by-elections. Two Members subsequently died; Bobby Sands (Fermanagh & South Tyrone) 26 days after election and Mike Carr (Bootle) after 57 days. Ossie O’Brien (Darlington) was elected at a by-election but defeated 77 days later at the 1983 General Election.
Table 7: The 25 longest-serving MPs
Notes: (a) ‘Days /years in service’ does not include the Parliament dissolution periods and is
estimated as at the dissolution of the 2015-17 Parliament. Source: House of Commons Library, Members Names Information Service
Rank Name of MP: Days in servicea
Years in servicea
First started Party
1 Clarke, Mr Kenneth 16,847 46.1 1970 CON
2 Skinner, Mr Dennis 16,847 46.1 1970 LAB
3 Bottomley, Sir Peter 15,053 41.2 1975 CON
4 Robinson, Mr Geoffrey 14,801 40.5 1976 LAB
5 Beckett, Margaret 13,841 37.9 1974 LAB
6 Field, Frank 13,672 37.4 1979 LAB
7 Sheerman, Mr Barry 13,672 37.4 1979 LAB
8 Harman, Ms Harriet 12,398 33.9 1982 LAB
9 Amess, Sir David 12,201 33.4 1983 CON
10 Barron, Sir Kevin 12,201 33.4 1983 LAB
11 Brown, Mr Nicholas 12,201 33.4 1983 LAB
12 Corbyn, Jeremy 12,201 33.4 1983 LAB
13 Gale, Sir Roger 12,201 33.4 1983 CON
14 Leigh, Sir Edward 12,201 33.4 1983 CON
15 Soames, Sir Nicholas 12,201 33.4 1983 CON
16 Cash, Sir William 11,872 32.5 1984 CON
17 Clwyd, Ann 11,872 32.5 1984 LAB
18 McLoughlin, Sir Patrick 11,137 30.5 1986 CON
19 Howarth, Mr George 10,948 30.0 1986 LAB
20 Abbott, Ms Diane 10,762 29.5 1987 LAB
21 Campbell, Mr Ronnie 10,762 29.5 1987 LAB
22 Flynn, Paul 10,762 29.5 1987 LAB
23 Redwood, John 10,762 29.5 1987 CON
24 Tredinnick, David 10,762 29.5 1987 CON
25 Vaz, Keith 10,762 29.5 1987 LAB
Number CBP 7483, 28 September 2017 10
5. Education There are two main sources of data on the educational background of MPs: the Sutton Trust and the British General Election of… series of books.3 The Sutton Trust have released their data for 2017, while The British General Election of 2017 has not yet been published.
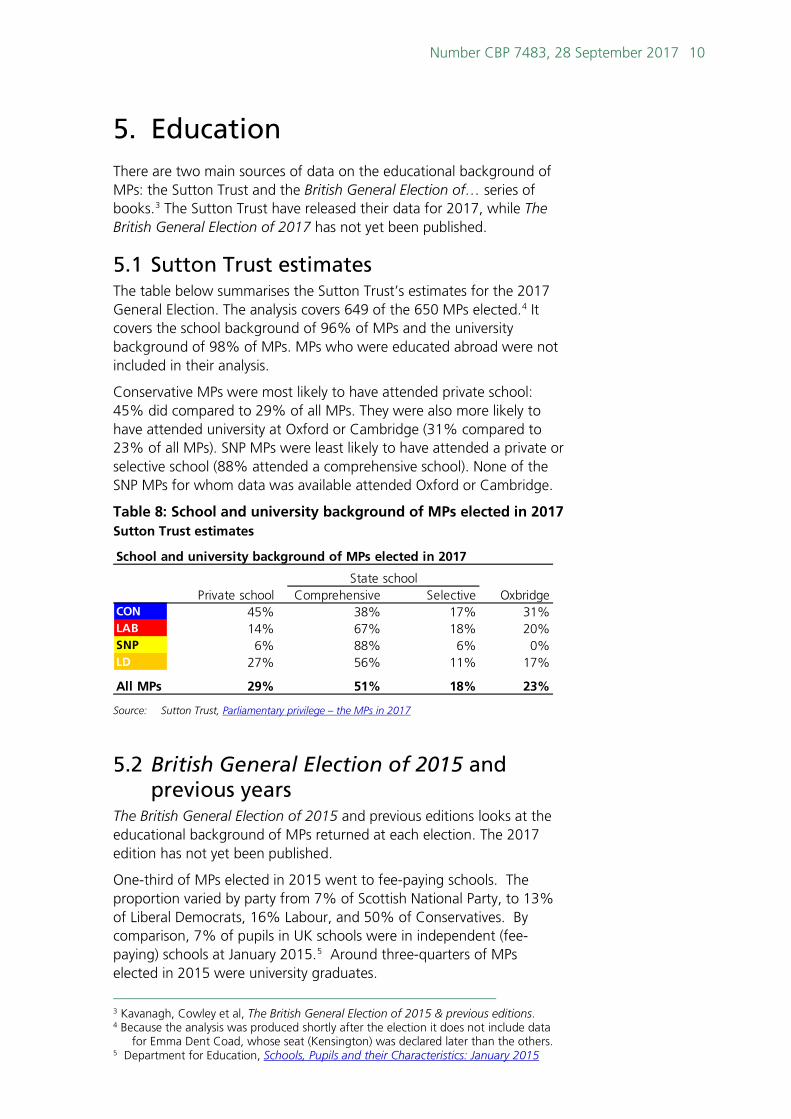
5.1 Sutton Trust estimates The table below summarises the Sutton Trust’s estimates for the 2017 General Election. The analysis covers 649 of the 650 MPs elected.4 It covers the school background of 96% of MPs and the university background of 98% of MPs. MPs who were educated abroad were not included in their analysis.
Conservative MPs were most likely to have attended private school: 45% did compared to 29% of all MPs. They were also more likely to have attended university at Oxford or Cambridge (31% compared to 23% of all MPs). SNP MPs were least likely to have attended a private or selective school (88% attended a comprehensive school). None of the SNP MPs for whom data was available attended Oxford or Cambridge.
Table 8: School and university background of MPs elected in 2017 Sutton Trust estimates
Source: Sutton Trust, Parliamentary privilege – the MPs in 2017
5.2 British General Election of 2015 and previous years
The British General Election of 2015 and previous editions looks at the educational background of MPs returned at each election. The 2017 edition has not yet been published.
One-third of MPs elected in 2015 went to fee-paying schools. The proportion varied by party from 7% of Scottish National Party, to 13% of Liberal Democrats, 16% Labour, and 50% of Conservatives. By comparison, 7% of pupils in UK schools were in independent (fee-paying) schools at January 2015.5 Around three-quarters of MPs elected in 2015 were university graduates.
3 Kavanagh, Cowley et al, The British General Election of 2015 & previous editions. 4 Because the analysis was produced shortly after the election it does not include data
for Emma Dent Coad, whose seat (Kensington) was declared later than the others. 5 Department for Education, Schools, Pupils and their Characteristics: January 2015
School and university background of MPs elected in 2017
Comprehensive SelectiveCON 45% 38% 17% 31%LAB 14% 67% 18% 20%SNP 6% 88% 6% 0%LD 27% 56% 11% 17%
All MPs 29% 51% 18% 23%
State schoolPrivate school Oxbridge

11 Social background of MPs 1979-2017
Table 9: Education of MPs elected in General Elections 1979 to 2015
5.3 Trends Since 1979, the main change in terms of educational background of MPs has been the rising proportion who have been to non-Oxbridge universities. In 1979, 225 MPs elected from the 3 main parties had been to Oxford or Cambridge, 36% of these parties’ MPs. Around 23% of MPs elected at the 2017 election came from an Oxbridge background.
% attending educational institution
1979 1983 1987 1992 1997 2001 2005 2010 2015
Fee-paying school 73% 70% 68% 62% 66% 64% 60% 54% 50%University 68% 71% 70% 73% 81% 83% 81% 80% 81%Oxford / Cambridge 49% 48% 44% 45% 51% 48% 43% 34% 30%
Fee-paying school 18% 14% 14% 15% 16% 17% 18% 14% 16%University 59% 53% 56% 61% 66% 67% 64% 72% 77%Oxford / Cambridge 21% 15% 15% 16% 15% 16% 16% 17% 21%
Fee-paying school 55% 52% 45% 50% 41% 35% 39% 39% 13%University 45% 65% 73% 75% 70% 69% 79% 81% 100%Oxford /Cambridge 27% 30% 27% 30% 33% 27% 31% 28% 13%
Fee-paying school 7%University 75%Oxford / Cambridge 0%
Source: Kavanagh, Cowley et al The British General Election of 2015 & previous editions
LAB
CON
LD
SNP

Number CBP 7483, 28 September 2017 12
1979 1983 1987 1992 1997 2001 2005 2010 2015 1
Number
Professions 278 278 262 258 272 270 242 218 194 Barrister 67 69 57 53 36 33 34 38 38 Solicitor 29 35 31 30 28 35 38 48 51 Doctor 8 5 5 6 9 8 6 9 10 Civil service/local govt 30 27 22 26 37 35 28 18 16 Teachers: University/college 28 32 36 45 61 53 44 25 16 Teacher: school 49 43 48 57 65 64 47 24 16Business 138 162 161 152 113 107 118 156 192Miscellaneous 106 115 133 154 188 200 217 222 221 White Collar 9 21 27 46 72 76 78 84 71 Politician/Political organiser 21 20 34 46 60 66 87 90 107 Publisher/Journalist 46 45 42 44 47 50 43 38 34 Farmer 23 21 19 12 7 6 8 10 7Manual Workers 98 74 73 63 56 53 38 25 19 Miner 21 20 17 13 13 12 11 7 [72]Total 619 629 629 627 629 630 615 621 626
Percentage
Professions 44.9% 44.2% 41.7% 41.1% 43.2% 42.9% 39.3% 35.1% 31.0% Barrister 10.8% 11.0% 9.1% 8.5% 5.7% 5.2% 5.5% 6.1% 6.1% Solicitor 4.7% 5.6% 4.9% 4.8% 4.5% 5.6% 6.2% 7.7% 8.1% Doctor 1.3% 0.8% 0.8% 1.0% 1.4% 1.3% 1.0% 1.4% 1.6% Civil service/local govt 4.8% 4.3% 3.5% 4.1% 5.9% 5.6% 4.6% 2.9% 2.6% Teachers: University/college 4.5% 5.1% 5.7% 7.2% 9.7% 8.4% 7.2% 4.0% 2.6% Teacher: school 7.9% 6.8% 7.6% 9.1% 10.3% 10.2% 7.6% 3.9% 2.6%Business 22.3% 25.8% 25.6% 24.2% 18.0% 17.0% 19.2% 25.1% 30.7%Miscellaneous 17.1% 18.3% 21.1% 24.6% 29.9% 31.7% 35.3% 35.7% 35.3% White Collar 3 1.5% 3.3% 4.3% 7.3% 11.4% 12.1% 12.7% 13.5% 11.3% Politician/Political organiser 3.4% 3.2% 5.4% 7.3% 9.5% 10.5% 14.1% 14.5% 17.1% Publisher/Journalist 7.4% 7.2% 6.7% 7.0% 7.5% 7.9% 7.0% 6.1% 5.4% Farmer 3.7% 3.3% 3.0% 1.9% 1.1% 1.0% 1.3% 1.6% 1.1%Manual Workers 15.8% 11.8% 11.6% 10.0% 8.9% 8.4% 6.2% 4.0% 3.0% Miner 3.4% 3.2% 2.7% 2.1% 2.1% 1.9% 1.8% 1.1% [1.1%]
6. Occupation The British General Election of… series of books provide analyses of occupations of candidates and MPs at each election. 6 The 2017 edition has not yet been published.
The historic data is restricted to Conservative, Labour and Liberal Democrat parties, but gives a reasonably consistent guide to the occupational background of MPs over the period from 1979-2010.7 The 2015 dataset also includes Scottish National Party MPs. The following table summarises the main occupation groups of MPs elected up to 2015.
Table 10: MPs' former occupations 1979 to 2015
MPs (Conservative/Labour/Liberal Democrat/Scottish National1 )
The number of MPs who were former manual workers decreased from around 16% of all MPs in 1979 to 3% in 2015. The proportion of MPs 6 Kavanagh, Cowley et al, The British General Election of 2015 & previous editions. 7 In the period from 1951 to 2010 on average 97% of all elected MPs represented
Conservative, Labour and Liberal Democrat Parties (including predecessors).
Notes: 1. Scottish National Party data is only included from 2015; 2. The number of former miners is not recorded in the British General Election of 2015. The number for 2015 based on the House of Commons Library calculations. 3. From 2010, Nuffield study categories: 'White collar' includes: misc. white collar; union official; public relations; and charity/voluntary sector;
Sources: Kavanagh, Cowley et al The British General Election of 2015 & previous editions

13 Social background of MPs 1979-2017
with a background in one of the ‘traditional’ professions8 has also fallen, from 45% in 1979 to 31% in 2015. Within this category the proportion of former school teachers and former barristers has declined while the proportion of former solicitors has risen. The numbers of teachers from schools and teachers from universities and colleges were rising until 1997. In the period from 2001 to 2015 it fell below the 1979 level.
As the established professions have declined they have been replaced by MPs from other non-manual occupations. Particularly notable is the growth in the number of MPs who come to Westminster already with previous political experience. In 1979 3% of MPs from the main parties were previously politicians/political organisers, compared to 17% in 2015.
MPs with a background in business tend to be Conservative. The decline in their number was reversed in 2005 and they now form a quarter of the main parties’ MPs.
Table 11: Occupation of MPs elected at the 2015 General Election by party
Source: Kavanagh and Cowley, The British General Election of 2015
8 The ‘traditional’ professions category is listed in - Cowley and Kavanagh The British
General Election of 2015.
CON LAB LD SNP CON LAB LD SNP
Professions 107 64 6 17 32% 28% 75% 30% Solicitor 28 17 2 4 8% 7% 25% 7% Barrister 28 9 0 1 8% 4% 0% 2% Teachers: University/college 1 12 0 3 0% 5% 0% 5% Teacher: school 5 7 2 2 2% 3% 25% 4% Civil service/local govt 2 10 2 2 1% 4% 25% 4% Accountant 14 1 0 1 4% 0% 0% 2% Armed services 12 1 0 0 4% 0% 0% 0% Doctor/dentist/optician 8 0 0 2 2% 0% 0% 4%Business 145 26 2 19 44% 11% 25% 34%Miscellaneous 75 126 0 20 23% 54% 0% 36% Politician/Political organiser 40 59 0 8 12% 25% 0% 14% Publisher/Journalist 16 14 0 4 5% 6% 0% 7% Public relations 6 3 0 1 2% 1% 0% 2%Manual Workers 3 16 0 0 1% 7% 0% 0%
Total 330 232 8 56 100% 100% 100% 100%
Number Percentage

BRIEFING PAPER Number CBP 7483, 28 September 2017
About the Library The House of Commons Library research service provides MPs and their staff with the impartial briefing and evidence base they need to do their work in scrutinising Government, proposing legislation, and supporting constituents.
As well as providing MPs with a confidential service we publish open briefing papers, which are available on the Parliament website.
Every effort is made to ensure that the information contained in these publically available research briefings is correct at the time of publication. Readers should be aware however that briefings are not necessarily updated or otherwise amended to reflect subsequent changes.
If you have any comments on our briefings please email [email protected]. Authors are available to discuss the content of this briefing only with Members and their staff.
If you have any general questions about the work of the House of Commons you can email [email protected].
Disclaimer This information is provided to Members of Parliament in support of their Parliamentary duties. It is a general briefing only and should not be relied on as a substitute for specific advice. The House of Commons or the author(s) shall not be liable for any errors or omissions, or for any loss or damage of any kind arising from its use, and may remove, vary or amend any information at any time without prior notice.
The House of Commons accepts no responsibility for any references or links to, or the content of, information maintained by third parties. This information is provided subject to the conditions of the Open Parliament Licence.