snh commissioned report 941 - effectiveness of srdp in ... · estimate was 9000, –13,000...
TRANSCRIPT

Scottish Natural Heritage Commissioned Report No. 941
Effectiveness of SRDP in corn bunting conservation: assessing the impact of six years of targeted agri-environment schemes

C O M M I S S I O N E D R E P O R T
Commissioned Report No. 941
Effectiveness of SRDP in corn bunting
conservation: assessing the impact of six
years of targeted agri-environment schemes
For further information on this report please contact:
Dr Jessica Shaw Scottish Natural Heritage Battleby Redgorton PERTH PH1 3EW Telephone: 01738 458675 E-mail: [email protected]
This report should be quoted as: Perkins, A.J., Maggs, H., Stephan, Y., Corrigan, A. & Wilson, J.D. 2017. Effectiveness of SRDP in corn bunting conservation: assessing the impact of six years of targeted agri-environment schemes. Scottish Natural Heritage Commissioned Report No. 941.
This report, or any part of it, should not be reproduced without the permission of Scottish Natural Heritage. This permission will not be withheld unreasonably. The views expressed by the author(s) of this report should not be taken as the views and policies of Scottish Natural Heritage.
© Scottish Natural Heritage 2017.

i
Effectiveness of SRDP in corn bunting conservation: assessing the impact of six years of targeted agri-
environment schemes Commissioned Report No. 941 Project No: 15892 Contractor: RSPB Centre for Conservation Science Year of publication: 2017
Keywords
Corn bunting; agri-environment scheme; SRDP; farmland bird; monitoring; agriculture. Background
The corn bunting Emberiza calandra is a farmland bird of high conservation concern across much of Europe having undergone severe population declines and range contraction in recent decades. In Scotland, populations are now restricted to four core areas – Fife, Angus, the Western Isles and Aberdeenshire/Moray. Since the early 2000s, the species has been the focus of monitoring, research and advocacy by RSPB Scotland, supported by SNH and others. This work has shown that well-targeted agri-environment scheme (AES) measures tailored to the species’ needs were capable of halting and reversing corn bunting population declines in eastern Scotland. This led to the development of a package of AES options within the Scottish Rural Development Programme (SRDP) 2007–13. The lack of Breeding Bird Survey (BBS) trend data for corn bunting in Scotland (the species is too rare), lack of adequate monitoring of SRDP and RSPB monitoring limited to just a few key sites since 2008–09 meant that the success of this package in halting/reversing the decline in the species’ Scottish stronghold of Aberdeenshire/Moray was not known. In summer 2015 we undertook a re-survey of 48 farms in Aberdeenshire/Moray, most of which had not been surveyed since 2008–09. The main aims were to determine the population change of corn buntings since 2008–09 in relation to deployment of AES measures under SRDP 2007–13, and to provide a baseline for the new SRDP 2014–20, in which the main AES was not deployed until 2016. Main findings
There was no significant change in corn bunting population size across the 48 farms surveyed, with 246 territorial males in 2015 compared with 232 in 2008–09.
34 of the 48 farms surveyed in 2015 held at least one territorial male corn bunting, the same farm occupancy rate (71%) as in 2008–09, but still well below the 94% farm occupancy rate recorded in 2003.
Population stability contrasts sharply with the severe long-term decline across Scotland in the 1970s–2000s, and declines across the same set of farms during 2003–08.
The current national population size was estimated to be 750–900 territorial males, which is 34–41% of the 2,200 territorial males estimated in 1993.
COMMISSIONED REPORT
Summary

ii
In contrast to previous years, corn bunting population trends did not differ between farms that had participated in agri-environment schemes and farms not in schemes, or between farms deploying the Mown Grassland for Corn Buntings option that delays mowing to protect nests, and options that only provided a food resource (e.g. Wild Bird Seed Mix/Unharvested Crop). Potential reasons for the lack of a further clear population effect of agri-environment schemes include poor targeting of key management options in the Rural Priorities scheme, or positive effects of the management spilling over into the wider landscape and helping to halt declines on non-scheme farms.
Uptake of some corn bunting options was lower than in previous schemes, notably Wild Bird Seed Mix/Unharvested Crop, Grass Margins, and Mown Grassland for Corn Buntings, although in 2015–16 at least 35–40% of the mainland Scotland corn bunting population was covered by agri-environment schemes with one or more options from the corn bunting package.
There were no significant changes in land use on the study farms between 2008–09 and 2015, but removal of boundary features to make larger fields was recorded on two-thirds of the farms, indicative of continuing agricultural intensification in Aberdeenshire.
For further information on this project contact: Dr Jessica Shaw, Scottish Natural Heritage, Battleby, Redgorton, Perth, PH1 3EW.
Tel: 01738 444177 or [email protected] For further information on the SNH Research & Technical Support Programme contact:
Knowledge & Information Unit, Scottish Natural Heritage, Great Glen House, Inverness, IV3 8NW. Tel: 01463 725000 or [email protected]

iii
Table of Contents Page
1. INTRODUCTION 1 1.1 Corn bunting ecology 1 1.2 UK trends and conservation status 1 1.3 Distribution and trends in Scotland 1 1.4 Causes of population declines 3 1.5 Agri-environment schemes and corn buntings 4 1.6 SRDP 2007–2013 5 1.7 The 2015 survey 5
2. METHODS 7 2.1 Study sites 7 2.2 Surveys 7 2.3 Data analysis 8 2.3.1 Overall population change 8 2.3.2 Comparison of change on AES and non-AES farms 8 2.3.3 Changes in land use 9 2.3.4 Estimating the population size 9
3. RESULTS 10 3.1 Overall corn bunting population change 10 3.2 Rural Priorities uptake 12 3.3 Corn bunting trends in relation to AES 13 3.4 Changes in land use 15 3.5 Other species 16 3.6 Map of current core areas for corn buntings in mainland Scotland 18 3.6.1 Limitations of the maps 18 3.6.2 Aberdeenshire/Moray 18 3.6.3 Fife and Angus 24
4. DISCUSSION 27 4.1 Effectiveness of SRDP 2007–13 in corn bunting conservation 27 4.1.1 Recent corn bunting trends in Scotland 27 4.1.2 Estimate of the current corn bunting population size 29 4.1.3 Effects of AES on corn bunting trends 29 4.1.4 Evidence base for the Rural Priorities corn bunting ‘package’ 30 4.1.5 Option uptake in the Rural Priorities scheme 30 4.1.6 Effect of Mown Grassland for Corn Buntings 31 4.1.7 Effect of land use change 31 4.2 Estimating the level of AES uptake required to prevent further declines 32 4.2.1 Previous and current estimations 32 4.2.2 Implications of CAP ‘greening’ 32 4.3 Policy recommendations 34
5. CONCLUSIONS 35
6. REFERENCES 36
ANNEX 1: MANAGEMENT REQUIREMENTS OF RP CORN BUNTING OPTIONS 40
ANNEX 2: LIST OF BIRD SPECIES RECORDED DURING THE 2015 SURVEY 45
ANNEX 3: FARM DETAILS AND CORN BUNTING COUNTS 2003–15 46

iv
Acknowledgements
We thank Jessica Shaw for providing helpful comments on an earlier draft. The 2015 surveys and digital mapping were undertaken by Amanda Biggins, Chris Bingham and Bertrand Couillens, assisted by Paul Davidson, Derren Fox, Ed Grace, Hywel Maggs, Allan Perkins and Yvonne Stephan. Chris Smout provided maps of the Fife corn bunting population. We also thank all of the farmers and landowners for allowing the surveys and providing AES information.
1. INTRODUCTION
1.1 Corn bunting ecology
The corn bunting is a farmland bird that favours arable or mixed farming landscapes in open, unenclosed areas away from woodlands. It feeds mainly on seeds year round, favouring cereal grains and the seeds of grasses and arable weeds (Watson, 1992; Wilson et al., 1999). During the breeding season, insects such as caterpillars and beetles are also taken, mainly to feed chicks (Hartley & Quicke, 1994; Brickle & Harper, 1999). Nests are usually built on the ground within crops, favouring tall dense swards of grasses or cereals with a densely vegetated ground layer, and typically 10–40 m into the crop from the nearest field boundary (Setchfield et al., 2012; Perkins et al., 2015). The onset of nesting is later than for most farmland birds, typically starting in late May or early June, but the breeding season extends throughout the summer into August or sometimes early September (Yom-Tov, 1992; Brickle & Harper, 2002; Perkins et al., 2015). Where conditions allow, females will rear two broods. One unusual aspect is the species’ polygynous mating system, with males potentially pairing with several females (Hartley & Shepherd, 1995; Perkins et al., 2012).
1.2 UK trends and conservation status
In the UK, as elsewhere, the corn bunting has undergone severe declines in recent decades as part of a long-term context of decline and range contraction across Europe (PECBMS 2015). Between the first two national breeding bird atlases (Sharrock, 1976; Gibbons et al., 1993), the number of occupied 10-km squares across England and Scotland declined by 32%, from 1,358 in 1968–72 to 921 in 1988–91, one of the largest range contractions of any UK farmland bird. Most local extinctions in north and west Scotland, e.g. Shetland 1978, Coll 1984, Lewis & Harris 1992, Tiree and Orkney late 1990s, were associated with an end to widespread cereal growing in those areas (Robinson et al., 2001; Forrester et al., 2007). The third national atlas in 2008–11 recorded 596 occupied 10-km squares, a further 36% decrease since 1988–91, and an overall decline of 56% since 1968–72 (Balmer et al., 2013).
Trends in population size of widespread UK birds are typically assessed by annual monitoring schemes such as the Breeding Bird Survey (BBS), and its predecessor the Common Bird Census (CBC) (Robinson et al., 2015). Between 1967 and 2012, the size of the UK corn bunting population was estimated to have declined by 88%, and between 1995 and 2013 by 40% (Harris et al., 2015; Robinson et al., 2015). The most recent UK population estimate was 9,000–13,000 territories in 2006–10, most of which are in England (Musgrove et al., 2013). Due to the species’ severe long-term population decline and range contraction, corn bunting is on the Red list of Birds of Conservation Concern and is a priority species in the UK Biodiversity Action Plan (Eaton et al., 2015).
1.3 Distribution and trends in Scotland
In Scotland, the corn bunting is now restricted to four main areas – Aberdeenshire/Moray, Angus, Fife, and the Western Isles – with additional very small populations near to Inverness airport and Berwick-upon-Tweed (Fig. 1). The largest population is in Aberdeenshire and Moray, where birds were recorded in 280 2-km squares (within 50 10-km squares) by a local breeding bird atlas during summers 2002–06 (Fig. 2), and the population size was estimated to be 550–600 territories (Francis & Cook, 2011). Since the first national atlas in 1968–72, the number of occupied 10-km squares within the region had already declined by 34%, and the latest national atlas in 2008–11 indicates a further 32% decline to just 34 occupied 10-km squares (Balmer et al., 2013). In Fife, there has been a range contraction from 23 occupied 10-km squares in 1968–72 to 14 in 1988–91 and 11 in 2008–11, and in Angus from 13 occupied 10-km squares in 1988–91 to just four in 2008–11 (Gibbons et al., 1993; Elkins et al., 2003; Balmer et al., 2013). In the Western Isles, just seven 10-km squares
1

remained occupied in 2015, compared with 15 in 2008–11 and 18 in 1988–91. A UK corn bunting survey in 1993 estimated the Scottish population to be 2,200 territories, but following the declines and range contraction, a more recent estimate for the mid-2000s was 800–1,000 territories (Donald & Evans, 1995; Forrester et al., 2007).
Unfortunately, the species’ scarcity in Scotland means that it is currently not possible to assess corn bunting population change from standard bird monitoring schemes such as the BBS, which requires an average annual presence in at least 30 1-km survey squares (Harris et al., 2015). However, thanks to the endeavours of certain individuals with a particular interest in the species, notably Adam Watson and Chris Smout, alternative datasets exist that have allowed assessment of some regional population trends. Adam Watson surveyed corn buntings annually across 30 study areas (26 in Aberdeenshire and four in Angus) between 1989 and 2007, in which time the number of territorial males declined by 83%, with further declines since (Watson et al., 2009). In Fife, annual county-wide corn bunting surveys are organised by Chris Smout in collaboration with RSPB Scotland, who monitor populations on a small number of farms. Similarly, in Angus and the Western Isles almost the entire corn bunting population has been monitored annually in recent years. In Aberdeenshire and Moray, however, survey coverage has been limited to just a few key sites since 2009.
Figure 1. Corn bunting distribution in Scotland by 10-km square (yellow squares) occupied during summers 2008–11 (Balmer et al., 2013). The red square encapsulates the Aberdeenshire and Moray populations, as detailed in Figs. 2 and 13-17 (© Crown copyright and database right 2016. Ordnance Survey 100021787).
2

Figure 2. Corn bunting distribution in Aberdeenshire and Moray by 2-km square (pink squares), occupied during summers 2002–06 (Francis & Cook, 2011) (© Crown copyright and database right 2016. Ordnance Survey 100021787).
1.4 Causes of population declines
The main driver of farmland bird declines across Europe is agricultural intensification (Donald et al., 2001; 2006; Reidsma et al., 2006; Voříšek et al., 2010). Specific drivers of corn bunting declines include reduced availability of cereal grain and weed seeds during winter, associated with a switch from spring to autumn sowing of crops and the loss of over-winter stubbles (Donald & Evans, 1994; Brickle & Harper, 2000). In addition, increased use and efficacy of herbicides removes the food plants of insect prey, and earlier and more frequent mowing of forage grasses destroys nests (Donald & Aebischer, 1997; Brickle et al., 2000). In autumn-sown systems, earlier harvesting of cereals also reduces the availability of late-summer nesting habitat and opportunities for corn buntings to rear second broods (Brickle & Harper, 2002). In Scotland, the loss of cereals from many farming landscapes, particularly in the north and west, has also resulted in local extinctions (Robinson et al., 2001).
3
1.5 Agri-environment schemes and corn buntings
The main policy tools currently available for halting and reversing biodiversity loss on farmland throughout Europe are agri-environment schemes (AES), whereby farmers are paid ‘income foregone’ and costs incurred for undertaking management that is less intensive or provides bespoke habitats separate from crops. AES were first deployed in the UK in 1987, with the introduction of the Environmentally Sensitive Area (ESA) scheme, and by 2000, ESAs covered approximately 20% of Scottish farmland (Wilson et al., 2009). In 1992, the ‘MacSharry’ reforms of the EU Common Agricultural Policy (CAP) led to Scotland’s first devolved AES, the Countryside Premium Scheme (CPS), which unlike the ESA scheme, was not geographically restricted. However, the focus of CPS was still on semi-natural habitats and landscape features, and the scheme was not applicable to the more intensive arable farming systems that most corn buntings within the UK inhabit (Wilson et al., 2009). Further reforms of the CAP in 1999 (the ‘Agenda 2000’ reforms) led to increased funding for AES, which became compulsory for all EU countries. In Scotland, this led to the replacement of the CPS in 2001 with the Rural Stewardship Scheme (RSS), which for the first time included several arable management options (SEERAD, 2003).
Given that Scotland now had an AES that could potentially benefit corn buntings in arable or mixed farming landscapes, and the species’ perilous conservation status within the country, in 2001 RSPB Scotland began a programme of work focused on corn buntings and AES in the species’ eastern Scotland stronghold. This work, which is ongoing and has been supported throughout by SNH, has involved detailed research of corn bunting requirements and habitat associations, intervention and management trials via the RSPB’s Farmland Bird Lifeline (FBL) scheme, providing advice to farmers and supporting AES applications, and population monitoring on RSS, FBL and ‘control’ farms. The main aims of FBL were to target farms with important corn bunting populations and build relationships with farmers to implement AES options known to benefit the species, to adapt options where necessary and test new ones, and ultimately to encourage the farmers to join government-funded AES. FBL agreements were reviewed annually, whereas RSS contracts were for five years (the standard duration for most AES).
Research and annual monitoring of corn bunting response to targeted AES measures in FBL, together with adaptive improvement of these measures, has led to a clear understanding of the management needed by this species on farmland in eastern Scotland. First, in mixed farming systems typical of Aberdeenshire and Moray, delaying mowing of forage grass meadows to 1 August allows an eightfold increase in nest success of nearly half of early nests (May–June) by almost eliminating losses to mowing. This has a potential population-wide effect of raising overall annual breeding productivity by 20%, sufficient to halt and reverse population declines (Perkins et al., 2013). Second, winter surveys showed that a combination of cereal stubbles and the AES option Wild Bird Seed Mix/Unharvested Crop in its first year of establishment held almost all corn buntings (Perkins et al., 2008). As a result of these findings, amendments to management options were made in the new government-funded AES introduced in 2008 (see section 1.6). Detailed studies on the habitat associations of territorial males and nesting females, including data analysis from a 20-year study by Adam Watson, reaffirmed the importance of crop diversity, spring-sown crops, dense grassy swards, weed-rich cereals, and field boundary features such as grass margins, fences and overhead wires (Perkins et al., 2012; 2015).
Monitoring over a 7-year period (2002–09) across 71 farms from Fife to Inverness-shire showed that highly targeted AES management, as described above, halted and reversed corn bunting population declines on farms participating in FBL, compared with population stability on farms deploying non-targeted AES (farms in the RSS) and continued declines on ‘control’ farms outside AES (Perkins et al., 2011). Nationally, this study estimated that approximately three-quarters of the corn bunting population in mainland Scotland would need to benefit from FBL-style targeted AES management to halt the overall population decline, but in 2009, only one-quarter was targeted in this way. We estimated that with good
4

targeting, this scale of delivery could be achieved with management spread across just 500–600 hectares of land, at a cost of £120,000 per annum.
1.6 SRDP 2007–2013
In 2008, a new AES opened as part of the Scottish Rural Development Programme (SRDP) 2007–13. Called ‘Rural Priorities’ (RP), this scheme included ‘packages’ of management options relevant to particular priority species or habitats. One such package was for corn buntings, and included AES options that our earlier research had proven to be beneficial for the species, such as a new Mown Grassland for Corn Buntings option (delayed mowing of silage/hay to late July/early August) and a Wild Bird Seed Mix/Unharvested Crop option with management requirements to ensure the annual availability of cereal grain in corn bunting areas (Table 1; Annex 1). Farmers in corn bunting areas were encouraged to adopt options from this package (and avoid potentially damaging options such as Mown Grassland for Wildlife, with its earlier mowing date) when applying to join the RP scheme, which operated on a voluntary, competitive basis. In Grampian, the species’ Scottish stronghold, the total funding allocated to RP agreements had reached £104.5 million by April 2014 (Scottish Government, 2014), so the potential for corn buntings to have benefitted from AES management during this period was substantial.
Alongside the RP scheme, a voluntary but non-competitive Land Managers Option (LMO) scheme also began in 2008, in which farmers could claim a maximum payment allowance for AES options based on their area of land eligible for agricultural subsidies (Scottish Government, 2008). LMOs included some options with potential benefits to corn buntings that were also available in RP (see Table 1), along with Retention of Winter Stubbles, and Management of Conservation Headlands (Scottish Government, 2008).
1.7 The 2015 survey
Due to a combination of limited annual monitoring of corn buntings and a long-term lack of adequate monitoring of biodiversity responses built into SRDPs, it was not known how successful the RP scheme had been at halting or reversing the decline in the core area of Aberdeenshire/Moray. A repeat survey of farms that were last surveyed in 2008–09 was therefore needed. This would show whether targeted SRDP options had been implemented widely in corn bunting areas, and if so, whether they had been deployed effectively and were associated with population recovery. An added incentive for carrying out the survey in 2015 was that it could also collect baseline data on farmland bird populations for the new Agri Environment Climate Scheme (AECS) under the next SRDP (2014–20). The AECS application process did not open until 2015 (creating an AES funding gap between SRDPs, as was also the case in 2007–08), so management options under this scheme were not deployed on farms until 2016.
The 2015 survey therefore had two main objectives. The first was to resurvey at least 40 farms in Aberdeenshire/Moray surveyed during 2002–09 but not since, in order to determine the population change and relate this to deployment of AES measures under SRDP 2007–13. The second was to provide a baseline for the SRDP 2014–20. Data permitting, additionalobjectives were to assess the current gap in provision of AES for corn buntings, to estimate the size of the Scottish population, and to map core areas for effective targeting of AES at key corn bunting populations.
5
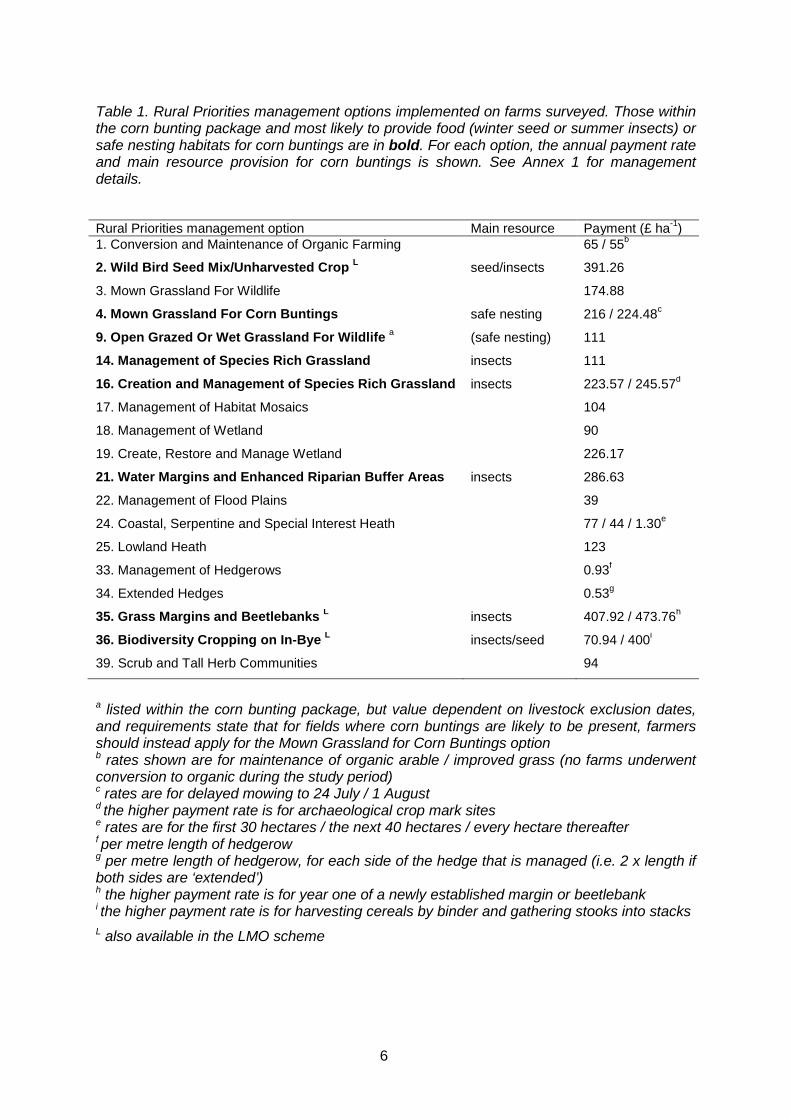
Table 1. Rural Priorities management options implemented on farms surveyed. Those within the corn bunting package and most likely to provide food (winter seed or summer insects) or safe nesting habitats for corn buntings are in bold. For each option, the annual payment rate and main resource provision for corn buntings is shown. See Annex 1 for management details.
Rural Priorities management option Main resource Payment (£ ha-1) 1. Conversion and Maintenance of Organic Farming 65 / 55b
2. Wild Bird Seed Mix/Unharvested Crop L seed/insects 391.26
3. Mown Grassland For Wildlife 174.88
4. Mown Grassland For Corn Buntings safe nesting 216 / 224.48c
9. Open Grazed Or Wet Grassland For Wildlife a (safe nesting) 111
14. Management of Species Rich Grassland insects 111
16. Creation and Management of Species Rich Grassland insects 223.57 / 245.57d
17. Management of Habitat Mosaics 104
18. Management of Wetland 90
19. Create, Restore and Manage Wetland 226.17
21. Water Margins and Enhanced Riparian Buffer Areas insects 286.63
22. Management of Flood Plains 39
24. Coastal, Serpentine and Special Interest Heath 77 / 44 / 1.30e
25. Lowland Heath 123
33. Management of Hedgerows 0.93f
34. Extended Hedges 0.53g
35. Grass Margins and Beetlebanks L insects 407.92 / 473.76h
36. Biodiversity Cropping on In-Bye L insects/seed 70.94 / 400i
39. Scrub and Tall Herb Communities 94
a listed within the corn bunting package, but value dependent on livestock exclusion dates, and requirements state that for fields where corn buntings are likely to be present, farmers should instead apply for the Mown Grassland for Corn Buntings option b rates shown are for maintenance of organic arable / improved grass (no farms underwent conversion to organic during the study period) c rates are for delayed mowing to 24 July / 1 August d the higher payment rate is for archaeological crop mark sites e rates are for the first 30 hectares / the next 40 hectares / every hectare thereafter f per metre length of hedgerow g per metre length of hedgerow, for each side of the hedge that is managed (i.e. 2 x length if both sides are ‘extended’) h the higher payment rate is for year one of a newly established margin or beetlebank i the higher payment rate is for harvesting cereals by binder and gathering stooks into stacks L also available in the LMO scheme
6

2. METHODS
2.1 Study sites
In summer 2015, surveys were carried out on 48 arable and mixed lowland farms covering 5,626 ha (46 in Aberdeenshire and two in Moray). All of these farms had been surveyed at least twice previously, in 2008 or 2009 and during the period 2003–06. For most farms, the 2015 survey was the fifth time they had been surveyed since 2003 (the other main survey years being 2004, 2006 and 2008), whilst five farms had been surveyed annually (or almost so) since 2003.
During 2002–09, 60 farms in Aberdeenshire/Moray were involved in corn bunting surveys undertaken by RSPB Scotland, of which 23 had been selected from a group of farms that joined the Rural Stewardship Scheme (RSS) in autumn 2002. At the same time, another 16 had been selected as ‘control’ farms with similar land use to the RSS farms, and within 10 km of them (seven of these farms joined RSS during 2003–05, whilst nine RSS farms ended their agreements in 2007–08 to become ‘controls’). The remaining 21 farms had been participants of RSPB’s Farmland Bird Lifeline (FBL) intervention project, where agri-environment management first implemented in 2002–03 (n = 14) and 2006–07 (n = 7) was targeted specifically at corn buntings, and supported by regular advisory input from RSPB staff. All 60 farms were within or adjacent to a 2-km square recently occupied at that time by corn buntings during the breeding season (Francis & Cook, 2011). However, up to 2009 we had never recorded a territorial corn bunting on six of these farms, so they were excluded from the 2015 survey, as were another six farms for various reasons (e.g. land ownership change, or land owners could not be contacted), leaving the 48 farms to be re-surveyed in 2015.
Land use (determined from digitised maps using MapInfo Professional version 6 or ArcMap version 10.3.1) across the 48 farms was mainly a combination of autumn- and spring-sown barley and oats, autumn-sown wheat and oilseed rape, potatoes, turnips, and grass mown for silage or grazed by cattle, sheep and horses.
2.2 Surveys
We followed the methods used for our previous surveys of these farms. These involved whole-farm surveys walking to within 250 m of all points on the farm, with three visits to each farm at approximately 4–5 week intervals during the corn bunting breeding season. All surveys were completed between 4 May and 3 August, on mornings with no or light rain and where possible with calm or light winds (although winds exceeded Beaufort force 4, 12–18 mph, during 13% of visits). We mapped the locations and recorded territorial activity (e.g. singing, alarm calls, nesting activity) of all corn buntings and 27 other farmland bird species, and made a ‘tick-list’ of all bird species recorded (Annex 2). As in previous surveys on these farms, we also mapped and counted brown hares Lepus europaeus. For all mapped species, locations on land surrounding the farm within 250 m of the farm boundary were also recorded.
For most species, including corn bunting, the number of territorial males was counted from clusters of map records (Marchant et al., 1990). Corn buntings sing frequently and conspicuously (Olinkiewicz & Osiejuk, 2003), so detection rates for this species are particularly high. For example, in previous studies our data from farms on which more intensive fieldwork was carried out (and therefore territory count was known with certainty) showed that almost all territorial males (94%) were detected by the survey method (n = 98 farm-years and 300 recorded territories) (Perkins et al., 2011; 2015).
7

Land use in each field was recorded, along with changes in field boundary locations since the previous survey in 2008–09. During survey visits, we also recorded any obvious AES management that could be identified, such as the presence and width of grass margins around arable fields, and recently planted hedgerows. Full details of AES options that had been deployed during 2009–14 were obtained from farmers at a later date.
2.3 Data analysis
We added the 2015 corn bunting counts to our dataset for 2003–09 across the same 48 farms. Data from a further four Aberdeenshire farms that were not surveyed in 2015 (due to access permissions not being secured) were included in analyses to maximise data available for abundance modelling for 2003-09. One farm at which we have never recorded a territorial corn bunting was excluded. Data analysis was therefore eventually based on 51 farms.
2.3.1 Overall population change
First, to test for between-year differences in corn bunting densities we modelled the density of territorial males on each farm (response variable = territory count; offset = farm area, including 250 m buffer) as a function of the year in which the territory count was made (eight-level categorical variable ‘year’: 2003, 2004, 2005, 2006, 2007, 2008, 2009, 2015), and the number of survey visits made to the farm in that year (two-level categorical variable ‘visits’: 2, 3). Most surveys involved three visits, but in 2004, 2008 and 2009, some farms were visited only twice (47%, 23% and 59%, respectively). Farm identity (n = 51 farms) was also fitted as a random effect in a generalized linear mixed model (GLMM) framework, specified by the SAS 9.4 GLIMMIX procedure with a log-link function, Poisson error distribution, and standard errors adjusted for over-dispersion using the ‘random residual’ option. Denominator degrees of freedom for tests of fixed effects were calculated using the Kenward-Roger method (Littell et al., 1996). To compare individual year means and standard errors, we used the LSMEANS option, specifying PDIFF to test for significant difference between least squares means.
Second, to model population trend across the study sites between 2003 and 2015, we repeated the model but fitted ‘year’ as a covariate (instead of fitting it as an eight-level categorical variable) and also fitted its quadratic effect (year*year) to assess temporal variation in population trend. Back-transformation of the ‘year’ and ‘year*year’ regression coefficients to the scale of the response variable gave an estimate of the inter-annual percentage rate of change in the density of territorial males throughout the period 2003–15.
2.3.2 Comparison of change on AES and non-AES farms
To assess population change in response to AES since 2008, we used only those counts from 2008–09 and 2015 and excluded eight farms whose corn bunting count was zero in both years. Models were therefore based on 40 farms. We used the same GLMM framework described above, but the fixed effects were ‘year’ fitted as a two-level categorical variable (2008/9, 2015), ‘farm type’ describing the farm’s RP status (two-level categorical variable: RP, non-RP), and the ‘farm type*year’ interaction term. Because some non-RP farms deployed AES options through the LMO scheme (n = 3) or the RSPB’s FBL scheme (n = 2), we also ran the model with an alternative ‘farm type’ variable that incorporated three of these farms (n = 1 LMO and 2 FBL) into the AES group (2-level categorical variable: AES, non-AES). Note that the other two farms had zero corn bunting counts in both years, so were already excluded from the models. Further analysis assessed variation in population change according to the types of measures implemented by replacing ‘farm type’ as a descriptor of
8

scheme identity with an alternative three-level fixed effect (‘option type’) that described the resources offered by these options. The three levels were food (at least one AES option from the corn bunting package, but excluding Mown Grassland for Corn Buntings), food plus safe nesting habitat (at least two AES options from the corn bunting package, one of which was Mown Grassland for Corn Buntings), and no AES options (control farms). AES options included those deployed on the three LMO/FBL farms, as well as the RP farms.
2.3.3 Changes in land use
Differences between AES and control farms other than AES management may have influenced population trends, so we tested (Kruskal-Wallis test) whether agricultural land use (proportions of each major crop) differed between the two groups in 2008/9 and 2015, and whether there was significant change in each farm group between these years. Further, for all 48 farms surveyed in 2015, cropping was recorded in both 2008/9 and 2015, so we tested for significant change in these proportions using a Wilcoxon signed rank test.
2.3.4 Estimating the population size
To make a very approximate estimate of the current corn bunting population size in Aberdeenshire/Moray, we overlaid a map of the 48 farms surveyed in 2015 with a map of the 245 2-km squares that were (a) occupied during the 2002–06 local bird atlas, and (b) also fell within 10-km squares that were still occupied in 2008–11. This gave 68 2-km squares that overlapped with our study farms and were effectively surveyed during 2015, equating to 28% of the 245 potentially still occupied. We made the assumption that densities across non-surveyed 2-km squares (n = 177) were similar to those across the surveyed 2-km squares (n = 68), and that there had been no range expansion since 2008–11. Multiplying the total corn bunting count across surveyed squares by a correction factor of 3.60 (i.e. 245 divided by 68) gave an overall estimate of population size for the whole region. However, one farm (Fisherbriggs – see Annex 3) had an exceptionally high density of corn buntings (75 territorial males) and there are probably no other farms like it within the region, so to account for this we subtracted (3.60-1.00)*75 from the total (i.e. the number of corn buntings that an additional 2.6 farms with Fisherbriggs-equivalent densities would have contributed to the total estimate). We then added the 2015 counts for Fife, Angus and the Western Isles to give an overall population estimate for Scotland.
9

3. RESULTS
3.1 Overall corn bunting population change
A total of 246 territorial male corn buntings were recorded across 34 of the 48 farms surveyed in Aberdeenshire/Moray during summer 2015. Single non-territorial birds were recorded on another two farms. In 2008–09, surveys of the same farms gave 232 territorial males across 34 farms – therefore a net increase in numbers of 6% by 2015, but no change in occupancy (71% of farms). However, during the entire study period 2003–15, the occupancy rate across 47 farms on which territorial male corn buntings have been recorded in at least one year declined from 94% in 2003 to 72% by 2008/09, but remaining stable at that level to 2015 (Fig. 3).
Figure 3. Corn bunting occupancy rates of 47 study farms during each year of full surveys during 2003–15 (note that in 2006, n = 44 farms).
The number of territorial male corn buntings increased between 2008–09 and 2015 on 16 farms, decreased on 16, and showed no change on 16 (including eight farms with zero counts in both years). Decrease was to extinction on five farms, and increase was in effect ‘colonisation’ on six farms (i.e. zero in 2008–09, although all of these farms had been occupied in previous years). The biggest net losses were of seven or eight territorial males at two farms, and the largest net gains were of 29 and three, at one farm each (Fig. 4).
Figure 4. Frequency distribution of net gains and losses of territorial male corn buntings between 2008–09 and 2015 across 28 AES farms including RP, LMO or FBL management (red bars) and 12 non-AES farms (blue bars). Note that the x-axis is non-linear, and the bar representing zero change excludes eight farms with zero counts in both years.
10

Overall, based on abundance modelling of data from 51 farms (including four not surveyed in 2015) the mean predicted density of territorial male corn buntings on a typical study farm was 5% higher in 2015 than in 2008–09, and 9% higher than in 2006, but was still 12% lower than in 2003 (Fig. 5). However, the only significant difference in overall density was between 2003 and 2006 (t = 2.10, df = 230.1, P = 0.04). Figure 6 shows the modelled population trend across the study sites, indicating an initial decline during 2003–09 slowing from a rate of 4% per annum in 2003 to 1% p.a. by 2009, followed by population growth at an average rate of 1% p.a. to 2015. This trend was almost but not quite statistically significant (‘year’ parameter estimate: -0.053 ± 0.029 se, F = 3.36, df = 236.7, P = 0.07; ‘year*year’ parameter estimate: 0.003 ± 0.002 se, F = 2.90, df = 236.5, P = 0.09).
Figure 5. Mean density (± 1 SE) of territorial male corn buntings across 51 farms in Aberdeenshire/Moray in each survey year during 2003–15. The number of farms (n) surveyed in each year is shown along the x-axis. Pale bars = <20 farms surveyed.
Figure 6. Modelled corn bunting population trend across 51 farms in Aberdeenshire/Moray from 2003 to 2015, expressed as the density of territorial males in each year relative to the first survey year, 2003. The black dashed line indicates the trend during the period in which the RP scheme was active.
11

3.2 Rural Priorities uptake
Of the 48 farms surveyed, 30 had participated in the RP scheme, of which 28 included at least one of the seven main management options within the corn bunting package. Eight deployed management designed to reduce nest losses to mowing in silage or hay fields (Mown Grassland for Corn Buntings), 16 deployed the main option that provides winter seed food (Wild Bird Seed Mix/Unharvested Crop), and 27 deployed at least one of the options whose main resource provision is summer insect food (Grass Margins and Beetlebanks, Water Margins and Enhanced Riparian Buffer Areas, Creation/Management of Species Rich Grassland, and Biodiversity Cropping on In-Bye) (Table 1, Fig. 7). Five farms (including the very high density farm, Fisherbriggs) deployed corn bunting measures as LMOs or FBL management agreements, so were classified alongside those in the RP scheme as AES farms. Two RP farms also included land managed organically, which may enhance food resources (insects and weed seeds) for corn buntings (Hole et al., 2005). Details of the management requirements for each RP option within the corn bunting package are given in Annex 1. Other popular options with fewer likely benefits to corn buntings were Open Grazed or Wet Grassland for Wildlife (14 farms), Management of Hedgerows (21 farms), Extended Hedges (eight farms) and Creation/Management of Wetland (nine farms).
Comparing option uptake in the RP scheme with its predecessor the RSS, and the RSPB’s FBL scheme, a smaller proportion of farms deployed options important for corn buntings such as Wild Bird Seed Mix/Unharvested Crop, Grass Margins, and Species Rich Grass (Fig. 7). As in RSS, uptake of Biodiversity Cropping was again very low, whereas this was one of the main options deployed on FBL farms during 2003–09. For some options, the mean area deployed per farm was also lower in RP than in RSS or FBL, notably for Wild Bird Seed Mix/Unharvested Crop (Fig. 8).
Figure 7. Frequency of uptake of AES options across 30 RP farms in 2009–15 (red bars) compared with 30 RSS farms (blue bars) and 35 FBL farms (yellow bars) in 2002–09. The six options on the left side of the graph were in the RP corn bunting package.
UC = Wild Bird Seed Mix/Unharvested Crop, MAR = Grass Margins and Beetlebanks, WMAR = Water Margins and Enhanced Riparian Buffer Areas, SRG = Creation/Management of Species Rich Grassland, MGCB = Mown Grassland for Corn Buntings, BIO = Biodiversity Cropping on In-Bye, OGG = Open Grazed or Wet Grassland for Wildlife, MGW = Mown Grassland for Wildlife, WET = Creation/Management of Wetland, HED = Management of Hedgerows, EHED = Extended Hedges, SCR = Scrub and Tall Herb Communities
12

Figure 8. Mean area (± 1 SE) deployed per farm of key corn bunting options across 30 RP farms in 2009–15 (red bars), compared with 30 RSS farms (blue bars) and 35 FBL farms (yellow bars) in 2002–09. See Fig. 7 for option codes legend.
3.3 Corn bunting trends in relation to AES
Figure 4 showed that net gains and losses of corn buntings were distributed fairly evenly across both AES and non-AES farms (e.g. 69% of farms with a net loss were AES farms, as were 56% of farms with a net gain). The biggest gains (three and 29 territorial males) were both on AES farms, but the biggest loss (eight) was also on an AES farm.
There were no significant differences in densities between years on either RP or non-RP farms (a net decrease of 10% on RP farms, t = 0.81, df = 76, P = 0.42, and a net increase of 28% on non-RP farms, t = 1.81, df = 76, P = 0.07) (Fig. 9). Densities on RP and non-RP farms were not significantly different from each other in either 2008–09 (t = 0.29, df = 40.02, P = 0.77) or 2015 (t = 0.53, df = 39.37, P = 0.60).
Figure 9. Mean density (± 1 SE) of territorial male corn buntings in 2008–09 and 2015 per farm on RP and non-RP farms, with the number of farms (n) in each group.
13

When farms that had deployed corn bunting options through LMOs or FBL were considered alongside RP farms in the AES group, once again no significant difference in densities occurred between years on either AES or non-AES farms (a net increase of 7% on AES farms, t = 0.71, df = 76, P = 0.48, and 0% change on non-AES farms, t = 0.00, df = 76, P = 1.00) (Fig. 10). Densities on AES and non-AES farms were not significantly different from each other in either 2008–09 (t = 0.41, df = 41.91, P = 0.68) or 2015 (t = 0.57, df = 41.76, P = 0.57).
Figure 10. Mean density (± 1 SE) of territorial male corn buntings in 2008–09 and 2015 per farm on AES and non-AES farms, with the number of farms (n) in each group. AES farms include those that deployed corn bunting management via the LMO or FBL schemes.
When the AES farms were subdivided into two groups – those where the only corn bunting options deployed provided food resources, and those where food options were deployed alongside the Mown Grassland for Corn Buntings option that provides safe nesting habitat – there was no significant difference in the density of territorial males between years in either of these two AES groups (a net increase of 24% on AES food-only farms, t = 1.66, df = 74, P = 0.10, and a net decrease of 16% on AES food plus Mown Grassland for Corn Buntings farms, t = 1.02, df = 74, P = 0.31) (Fig. 11). Densities on both AES groups were not significantly different from each another in 2008–09 (t = 1.38, df = 35.79, P = 0.18), or in 2015 (t = 0.65, df = 35.99, P = 0.52).
Figure 11. Mean density (± 1 SE) of territorial male corn buntings in 2008–09 and 2015 per farm on non-AES farms (blue bars), AES farms that deployed options providing only food resources from the corn bunting package (red bars), and AES farms that deployed food options plus Mown Grassland for Corn Buntings that provides safe nesting habitat (yellow bars), with the number of farms (n) in each group.
14

3.4 Changes in land use
Land use was similar on AES and non-AES farms, with no significant differences between the two groups for any of the main arable crop or grassland types in either 2008–09 or 2015, and no significant changes in land use between these years (Table 2). Furthermore, a pair-wise comparison across each of the 48 farms also showed no significant land use changes between the two surveys.
Table 2. Land use composition (%, mean ± 1 SD) per farm across 35 AES farms (total area = 4271 ha) and 13 non-AES farms (total area = 1353 ha) in 2008–09 and 2015. Note that the percentages do not sum to 100 as non-cropped land and other minor habitat categories are not presented.
Farm type Year SC AC LEG VEG OSR GRA ROU
AES 2008/9 37 ± 22 15 ± 17 0 ± 1 3 ± 5 5 ± 11 30 ± 20 3 ± 3
AES 2015 40 ± 23 12 ± 17 0 ± 0 3 ± 6 3 ± 8 32 ± 28 3 ± 4
P 0.62 0.25 0.32 0.63 0.57 0.96 0.75
Non-AES 2008/9 40 ± 26 15 ± 21 0 ± 1 2 ± 3 1 ± 4 33 ± 23 5 ± 13
Non-AES 2015 37 ± 28 16 ± 26 0 ± 0 2 ± 5 2 ± 6 37 ± 35 2 ± 2
P 0.56 0.96 0.32 0.93 0.96 0.92 0.57
P-values are for Kruskal-Wallis tests for differences in proportions of each crop type within each treatment group between 2008–09 and 2015. SC = spring cereals; AC = autumn cereals; LEG = legumes (peas, beans) or legume/barley mixture mown for arable silage; VEG = root vegetables; OSR = oilseed rape; GRA = grazed pasture, grass mown for silage or hay, or newly sown; ROU = rough grass or fallow.
One aspect of agricultural intensification apparent during surveys was the removal of field boundary features such as fences and gorse hedges to make larger fields. On 32 of the 48 farms surveyed, we recorded at least one such case of fields having been amalgamated since 2008–09. Comparison of the 2015 survey maps, updated to reflect the new positions of field boundaries, with those from 2008–09 showed that the mean size of arable fields had increased by 10%, from 8.04 ha in 2008–09 to 8.86 ha in 2015 (Fig. 12). To a lesser degree, grass fields had also increased in size, and on average were 5% larger in 2015 (5.09 ha) than in 2008–09 (5.33 ha). Within the arable group, fields used for both autumn- and spring-sown crops had increased in size, suggesting a general trend across all farm types, regardless of whether farms specialised in autumn or spring cropping.
15

Figure 12. Mean field size (± 1 SE) for each main crop type across 48 farms surveyed in 2008/9 (red bars) and 2015 (blue bars), with the number of fields (n) in 2008/9 and 2015. ARABLE = cereals, vegetables and oilseed rape; GRASS = grazed pasture, grass mown for silage or hay, or newly sown grass; AC = autumn-sown cereals; SC = spring-sown cereals; OSR = oilseed rape (predominantly autumn-sown); VEG = vegetables (predominantly spring-sown).
3.5 Other species
An additional 27 bird species were systematically counted during the surveys, of which at least 15 species were sufficiently numerous and widespread to enable future assessment of the effectiveness of the new AECS and ‘greening’ measures in SRDP 2014–20 (Table 3). Most of these species were also counted in previous surveys, and preliminary indications from the raw data in Table 3 suggest population increases since 2008–09 in yellowhammer Emberiza citrinella and tree sparrow Passer montanus, declines in skylark Alauda arvensis, reed bunting E. schoeniclus, lapwing Vanellus vanellus, oystercatcher Haematopus ostralegus and curlew Numenius arquata, and stability in grey partridge Perdix perdix and linnet Linaria cannabina.
16

Table 3. Frequency of occurrence, total counts and average density for 28 bird species and brown hare across the 48 farms surveyed in 2008–09 and 2015. Except where stated, territory counts include birds within a 250 m buffer of the farm boundary, and density values are the mean of two calculations (including/excluding 250 m buffer). Note that in 2008–09, except for corn bunting, totals are across 45 farms or fewer (see footnote).
Frequency
(no. of farms)
Total number of territories or pairs
Mean density across farms
(territories or pairs per 1km2)
Species 2008/9 2015 2008/9 2015 2008/9 2015
Buzzardmax 33a 47a 118a 129a 1.20g 1.06g Corn bunting 35 36 232 246 2.59 2.73 Curlew 20 21 30 20 0.28 0.19 Grasshopper warbler nc 4 nc 4 nc 0.04 Grey partridgeexcl 20 27 24 27 0.32 0.38 House sparrowmax 44 47 1000b 1692b 9.26g 13.57g Kestrelmax 10c 18c 17c 24c 0.17g 0.19g Lapwing 26 22 121 60 1.08 0.63 Lesser redpollmax 8 20 12 50 0.10g 0.39g Linnet 45 47 320 389 3.83 4.62 Meadow pipit nc 44 nc 273 nc 3.24 Oystercatcher 38 36 84 61 0.78 0.69 Quail 9 13 10 15 0.08g 0.12g Red-legged partridge 7d 13d nc 21 nc 0.27 Redshank 1 1 3 1 0.02g <0.01g Reed bunting 36 37 269 217 2.81 2.43 Sedge warbler nc 43 nc 372 nc 4.35 Skylarkexcl 45 48 936 727 14.61 11.29 Snipe 1 3 1 1 0.01 0.01 Spotted flycatcher nc 1 nc 1 nc 0.01 Starlingmax nc 48 nc 4926 nc 39.51g Stock dovemax 9e 7e 15e 12e 0.16g 0.09g Stonechat nc 4 nc 4 nc 0.04 Tree sparrow 39 46 172 433 1.98 4.80 Wheatear nc 10 nc 1 nc 0.01 Whinchat nc 1 nc 0 nc 0 Whitethroat nc 43 nc 220 nc 2.66 Yellowhammer 44 48 799 1050 9.03 11.66 Brown haremax 25f 37f 119f 134f 1.29g 1.10g nc = not routinely counted in that year max total number and density relates to individuals rather than pairs or territories, and is based on the maximum count during any one visit to a farm excl counts for grey partridge and skylark exclude birds on neighbouring land a 2008/9 count was across 36 farms (equivalent 2015 count was 102 on 35 farms) b 2008/9 count was across 41 farms (2015 count across the same farms was 1420) c 2008/9 count was across 36 farms (the equivalent 2015 count was 18 on 14 farms) d 2008/9 presence was out of 34 farms (present on 10 of these farms in 2015) e 2008/9 count was across 34 farms (the equivalent 2015 count was 9 on 5 farms) f 2008/9 count was across 34 farms (the equivalent 2015 count was 105 on 26 farms) g density value includes the 250 m buffer
17

3.6 Map of current core areas for corn buntings in mainland Scotland
Figures 13-20 show the broad distribution of corn buntings by 10-km square in eastern Scotland from Fife to Moray, as determined from the national atlas survey in 2008–11 (Balmer et al., 2013), finer scale distribution and densities within these from a local atlas in 2002–06 (Francis & Cook, 2011), and corn bunting surveys carried out in 2015.
3.6.1 Limitations of the maps
Please note that for Aberdeenshire/Moray especially, these maps should be used as a general guide only, and not treated as a definitive map of the current distribution. In Figures 13-17, the densities mapped by 1-km square relate only to the 48 farms surveyed in 2015, and give no indication of locations of core, high density areas elsewhere within the region. Also, some of the 10-km squares occupied in 2008–11 may well no longer be occupied (e.g. in south Aberdeenshire, see Fig. 17), and conversely some of the adjacent squares in which no corn buntings were recorded during the atlas may have been colonised since (or birds simply missed previously). In particular, the 2-km squares mapped are based on corn bunting occupancy 10–14 years ago, and across the 68 2-km squares covered by our study farms, 20 were unoccupied in 2015. Therefore, assuming that our study farms are representative of the entire corn bunting range within the region (i.e. areas occupied in 2002–06), up to 29% (71) of the mapped 2-km squares may no longer be occupied.
3.6.2 Aberdeenshire/Moray
In the most recent bird atlas survey (summers 2008–11), corn buntings were recorded in 34 10-km squares in Aberdeenshire/Moray, and within these, 245 2-km squares had been occupied during a local atlas survey in 2002–06 (Fig. 13). The main areas occupied are in the northern half of Aberdeenshire, north east of a line from Newburgh to Cullen, and within a 10 km wide strip along the Moray coast from Buckie westwards to Burghead. Other areas still occupied in recent years include Fisherford/Badenscoth (c.15 km east of Huntly), Kinmuck/Kintore, and Barras (c.10 km south of Stonehaven). As explained in the previous section (3.6.1), the density map only relates to farms surveyed in 2015 (mapped as blue shapes in Figs. 13-17, but note that they are partly hidden beneath the red squares denoting corn bunting density), so in areas away from these farms, we do not know what the densities are. The maps cannot, therefore, be used to determine across the entire region which areas have high densities and which ones do not. It does, however, highlight which of our 48 survey farms have high densities and which ones do not.
18

Figure 13. Corn bunting distribution in Aberdeenshire/Moray by 10-km square during 2008–11 (yellow squares), by 2-km square during 2002–06 (grey squares), and number of territorial males recorded within 1-km squares (red squares) during the 2015 surveys across 48 study farms (blue shapes). Note that 35 2-km squares occupied during 2002–06 but which fell within 10-km squares recorded as unoccupied in 2008–11 are excluded. Sources: Francis & Cook, 2011; Balmer et al., 2013; RSPB unpublished data (© Crown copyright and database right 2016. Ordnance Survey 100021787).
19

The larger scale map covering north-east Aberdeenshire (Fig. 14) includes Fisherbriggs (Rosehearty), which had an exceptionally high density of corn buntings in 2015, with two squares exceeding 20 territorial males per 1-km2. Other important corn bunting farms in this area include Corsekelly (St Combs) and Mains of Rattray (Crimond), with densities of eight to eleven territorial males per 1-km square, and Easter Cardno (Fraserburgh) and Ironhill (Rosehearty) with five territorial males per 1-km square. Further south, Mains of Slains (Collieston) and Blackpots/Mains of Fortrie (Auchnagatt) all had densities of up to four territorial males per 1-km square.
Figure 14. Corn bunting distribution in north-east Aberdeenshire, and densities on our survey farms in 2015 (see Fig. 13 for details) (© Crown copyright and database right 2016. Ordnance Survey 100021787).
20

In north-west Aberdeenshire (Fig. 15), the highest densities we recorded in 2015 were on farms to the west and south west of Banff, at Todhills and Dallachy (up to eight and five territorial males per 1-km square, respectively). In previous years, nearby Upper Blairmaud had similarly high densities, but numbers were low in 2015. To the northeast of Turriff, the farms Cauldwells, Waulkmill and Cairnhill had up to four territorial males per 1-km square, as did Little Mains of Hatton to the south west.
Figure 15. Corn bunting distribution in north-west Aberdeenshire, and densities on our survey farms in 2015 (see Fig. 13 for details) (© Crown copyright and database right 2016. Ordnance Survey 100021787).
21

In Moray (Fig. 16), we only surveyed two farms, one either side of the mouth of the River Spey. The eastern farm is Cunninghaugh, where the corn bunting population had declined substantially since 2008, but still had three territorial males per 1-km square in 2015.
Figure 16. Corn bunting distribution in Moray, and densities on our survey farms in 2015 (see Fig. 13 for details) (© Crown copyright and database right 2016. Ordnance Survey
100021787).
22

In southern Aberdeenshire, we surveyed three farms in 2015 at Barras, south of Stonehaven (Fig. 17). No corn buntings were found, and with none recorded in this area since 2012 the population is probably now extinct. In 1990, Adam Watson recorded 134 territories at Barras, with densities reaching 15 per 1-km square.
Figure 17. Corn bunting distribution in south Aberdeenshire, and densities on our survey farms in 2015 (see Fig. 13 for details). Note that in the two southern 10-km squares, the species was last recorded in 2012 and this population is probably now extinct (© Crown copyright and database right 2016. Ordnance Survey 100021787).
23

3.6.3 Fife and Angus
At present, the entire corn bunting populations in Fife and Angus are monitored annually, by surveys organised by Chris Smout and RSPB Scotland. The distribution and density maps for these regions (Figs. 18-20) can therefore be considered reasonably accurate, with the caveat that only the 2015 data are shown, such that some 1-km squares occupied in recent years are excluded.
Figure 18. Corn bunting distribution in Fife and Angus by 10-km square during 2008–11 (yellow squares), and distribution and density by 1-km square in 2015. Sources: Balmer et al., 2013; C. Smout unpublished data; RSPB unpublished data (© Crown copyright and database right 2016. Ordnance Survey 100021787).
24

The core areas in Fife are along a 20 km coastal strip (c.5 km wide) from Elie northwards to Fife Ness, with densities of up to 10 territorial males per 1-km square around St Monans, and also inland from Largo Bay, and at Boarhills, c.6 km east of St Andrews (Fig. 19). Although not recorded in 2015, small numbers may persist in the other mapped 10-km squares, especially those immediately north and west of St Andrews. In 2015, one bird was recorded just west of Cupar, in a 10-km square not recorded as being occupied during the 2008–11 national bird atlas.
Figure 19. Corn bunting distribution and density in Fife, 2015 (see Fig. 18 for details) (© Crown copyright and database right 2016. Ordnance Survey 100021787).
25

The core area in Angus lies between Auchmithie and Inverkeilor, 4–8 km north of Arbroath, with densities reaching seven territorial males per 1-km square (Fig. 20). It is possible that other small populations may persist in the two northernmost 10-km squares (Fig. 18), as these are less well monitored than the core area.
Figure 20. Corn bunting distribution and density in Angus, 2015 (see Fig. 18 for details) (© Crown copyright and database right 2016. Ordnance Survey 100021787).
26

4. DISCUSSION
4.1 Effectiveness of SRDP 2007–13 in corn bunting conservation
4.1.1 Recent corn bunting trends in Scotland
The summer 2015 survey showed that the corn bunting population across 48 study farms in Aberdeenshire/Moray had, at worst, remained stable since 2008–09. The number of territorial males was actually slightly higher in 2015, and the modelled trend suggests that the population may be showing signs of slow recovery following declines during 2003–09 (Fig. 6). This is likely to be representative of the regional population as a whole, given that our study sites covered almost one-third of the species’ range as estimated from 2-km and 10-km squares occupied in recent local and national bird atlases. However, a caveat to this is that one of our study farms (Fisherbriggs) held an exceptional 75 territorial males in 2015, and had increased by 29 territories since 2009. This farm is unusual in that most of the spring barley fields have a history of extensive management and tend to be very weedy. The same fields are also small (mean = 3.2 ha) relative to other farms (c.8–9 ha, see Fig. 12). In some years, whole fields have remained unharvested throughout the winter, attracting large flocks of corn buntings and other farmland birds. This farm may well be unique in Scotland in terms of the corn bunting densities found there, which are probably amongst the highest recorded anywhere in the UK. Whilst it is unrealistic to expect other farmers to replicate Fisherbriggs by managing all of their cereal fields extensively, it does provide a good example of how high corn bunting population densities can reach, given the right conditions. If every farm had just one small cereal field that was managed extensively and allowed to become weedy (as per the Biodiversity Cropping option in RP), it could make a huge contribution to the conservation of not just corn buntings, but to a wide range of species, not least the arable plants themselves.
Encouragingly, six farms were ‘colonised’ since 2008–09, although all of them had been occupied in at least one year during 2003–06. Counter to this, decreases to zero on five farms meant that the occupancy rate of our study farms was unchanged since 2008–09 at 71%, and still well below the 94% recorded in 2003 (Fig. 3). Two of the farms with declines to ‘extinction’ were at Barras in southern Aberdeenshire (see Fig. 17). These two farms are within one of Adam Watson’s former study areas, where across 36 km2 of mixed farmland corn buntings declined from 134 territories in 1990 to just nine in 2008 (Perkins et al., 2012). With birds last recorded here in 2012, this entire study population is now considered to be extinct, leaving a large unoccupied gap of 60–70 km between the remaining Aberdeenshire and Angus populations. Also of concern were large declines on two study farms that both held more than 10 territorial males throughout 2003–09 (Upper Blairmaud, north-west Aberdeenshire, and Cunninghaugh, Moray; Figs. 15-16 and Annex 3).
In future years, consideration should be given to extending the survey to a larger set of farms so that greater coverage across the region is achieved. For example, doubling the survey area from 68 to 136 2-km squares (i.e. 48 to 96 farms) would increase coverage to 56% of the potential corn bunting range within the region (as defined by 2-km squares occupied in 2002–06 that were also inside 10-km squares occupied in 2008–11), but would cost twice as much as the 2015 survey.
In the other two main populations in eastern Scotland (Fife and Angus), numbers have also remained stable since 2009, but the Western Isles population is in steep decline (Figs 21-23). As far as we are aware, only two other populations remain in Scotland, with 10–15 territorial males near to Inverness airport, and just two to three territories at Lamberton, Berwick-upon-Tweed.
27

Figure 21. Corn bunting population trend in Fife, 2009–15.
Figure 22. Corn bunting population trend in Angus, 2009–15.
Figure 23. Corn bunting population trend in the Western Isles, 2009–15.
28

4.1.2 Estimate of the current corn bunting population size
Based on our count of 246 territorial males across 68 2-km squares covered by the survey farms, and, with the exception of Fisherbriggs, assuming similar densities across the remaining 72% of potentially occupied 2-km squares, we estimate the Aberdeenshire/Moray population to be approximately 690 territorial males. Added to 2015 counts of 118 in Fife and 42 in Angus, plus the two small populations near to Inverness and Berwick, this gives a mainland Scotland estimate of approximately 865 territorial males. Combined with the Western Isles (37 territories in 2015), this gives an overall population estimate for Scotland in the order of 900 territorial males. However, this estimate should be treated with caution due to the uncertainty surrounding the size of the Aberdeenshire/Moray population. Using the more conservative figure of 550–600 territories estimated in the 2002–06 local atlas (Francis & Cook, 2011) would give a national estimate in the order of 750–800 territorial males. Combining the two estimates gives 750–900 territorial males. This equates to just 34–41% of the estimated population size in Scotland in 1993 (Donald & Evans, 1995).
4.1.3 Effects of AES on corn bunting trends
Comparing farms that participated in the RP scheme with those that did not, we found no change in corn bunting densities on RP farms or on non-RP farms, although a net increase of 28% on the non-RP farms approached statistical significance. However, the non-RP farms included our high density farm (Fisherbriggs) and two others that had deployed AES measures through other schemes (LMO and FBL). Comparing the full set of AES farms (i.e. the RP farms plus these three additional LMO/FBL farms) with non-AES farms, we still found no significant change in densities across either group, but the net change was now marginally more positive on the AES farms (7% increase in density between 2008–09 and 2015, compared with a 0% change on non-AES farms). Subdividing the AES farms into two groups, we found no significant change either on those farms that had deployed AES measures known to provide food resources for corn buntings (Wild Bird Seed Mix/Unharvested Crop, Grass Margins, and Biodiversity Cropping), or on AES farms that also deployed the Mown Grassland for Corn Buntings option, which is designed to protect nesting attempts in silage or hay fields by delaying mowing until after broods are likely to have fledged.
These results differ from our previous study of corn bunting trends in response to AES during 2003–09 (Perkins et al., 2011). In that study, we found significant declines on non-AES farms, no change on farms participating in the RSS (the main AES at that time), and significant increases on farms in the RSPB’s FBL scheme, in which the management options were targeted specifically at corn buntings and farmers received annual advisory support. In Aberdeenshire, where the mixed farming landscape encourages many corn buntings to nest in grass silage fields, but with poor success unless mowing is delayed until late July (Perkins et al., 2013), population trends were significantly more positive on farms that deployed the Mown Grassland for Corn Buntings option in fields known to be used for nesting.
A potential reason for the difference in population response to Mown Grassland for Corn Buntings between the two study periods is discussed in section 4.1.6., whilst three potential explanations for the halting of declines on non-AES farms are given here. First, corn buntings holding territories during the breeding season on non-AES farms may be using nearby AES farms at other times of the year, notably in winter when flocks form and may roam across the landscape in search of seed-rich habitats such as cereal stubbles and Wild Bird Seed Mix/Unharvested Crops. From colour-ringing in previous years, we have recorded movements of up to 15–20 km between breeding and wintering sites in Aberdeenshire. Similarly, we have also recorded birds ringed as chicks on AES farms breeding in
29

subsequent years on non-AES farms, demonstrating that successful breeding on AES farms can help to populate nearby non-AES farms. However, this would also have been the case in 2003–09 when populations on non-AES farms were in rapid decline, unless the overall level of AES deployment in corn bunting areas has increased over time. Without access to wider SRDP data away from our study farms, we have no means of assessing this. Second, on some non-AES farms there could be legacy effects from their previous participation in RSS or FBL. For example, insect-rich rough grassland habitats created through measures that involved erecting new fences, such as Water Margins, are likely to have been retained. Finally, it could be the case that the drivers of decline in previous years have to some extent receded, or that management changes other than AES may have been beneficial to corn buntings in the wider farming landscape. However, evidence of further intensification across a large proportion of farms does not support this view (see section 4.1.7).
4.1.4 Evidence base for the Rural Priorities corn bunting ‘package’
The RP corn bunting package consists of management options that are known to benefit the species, and other farmland birds, by providing food resources and/or safe nesting habitat. Our previous research relating to the RSS and FBL schemes in eastern Scotland showed that in three winters of surveys across 53 farms, more than 10,000 birds of 10 species used the Wild Bird Seed Mix/Unharvested Crop option (Perkins et al., 2008). This was over a quarter of the birds recorded, despite crop patches occupying less than 5% of the area surveyed, and corn bunting was one of nine species that showed preferential selection of the management above other seed-rich habitat types. Cereal stubbles held most of the other corn buntings recorded, along with the majority of skylarks, yellowhammers and grey partridges, and many other studies have shown the importance of stubbles for farmland birds in winter (e.g. Donald & Evans, 1994; Wilson et al., 1996; Gillings et al., 2005). Retention of Winter Stubbles was an option in the LMO scheme, although in Aberdeenshire and Moray where most crops are spring-sown, many stubble fields not in agri-environment schemes remain unploughed until late winter.
Our research on nesting habitat selection and breeding success of corn buntings in Aberdeenshire has shown that grass silage fields attract a high proportion of nesting attempts early in the season when spring-sown cereals are too short and sparse to provide sufficient cover, but that rates of nest loss are high when the fields are mown in June and July (Perkins et al., 2013; 2015). However, trials in our FBL scheme of the Mown Grassland for Corn Buntings option, whereby farmers were paid to delay mowing until late July or early August in fields known to be used by nesting corn buntings, resulted in an eightfold increase in nest success rates by almost eliminating losses to mowing. Because most cereals are spring-sown and not harvested until late August or September, protecting these early-season nests in grass silage fields allows some females to nest again in cereal fields and rear a second brood. This has a potential population-wide effect of increasing overall annual breeding productivity by 20%, sufficient to halt and reverse population declines.
Our studies, and those of others, have also shown the importance of weed-rich and insect-rich foraging and nesting habitats for corn buntings during the breeding season, including habitats provided by RP options such as Grass Margins, Biodiversity Cropping, Water Margins, and Creation/Management of Species Rich Grassland (Brickle et al., 2000; Perkins et al., 2011; 2015; Setchfield et al., 2012; Burgess et al., 2014). The RP corn bunting package of management options therefore has a strong evidence base, and when deployed correctly and on a sufficient scale in fields that corn buntings use, should deliver positive population effects via increased breeding productivity and/or annual survival rates.
30

4.1.5 Option uptake in the Rural Priorities scheme
The lack of a population increase on RP farms in this study was probably due, at least partly, to farmers not always choosing the best options for corn buntings. This was to be expected, as most farmers and their agents tend to base decisions on which options to include in AES plans, and whereabouts on the farm, according to what best suits the farmer rather than what will achieve the best biodiversity outcomes. Option selection is also heavily influenced by the application assessment process, with AES plans scored according to how many points they accumulate. Options with the most points available are therefore the ones most likely to be selected, to increase the likelihood of a plan being successful. This may discourage the submission of plans with a single-species focus, such as those that include the full corn bunting package of options. This is in contrast to the FBL scheme, where management plans agreed between the farmer and RSPB adviser are much more strongly targeted at corn buntings, including the optimum location of options within the farm. Whilst half of the AES farms included Wild Bird Seed Mix/Unharvested Crops plus at least one option that provides insect-rich foraging habitat for corn buntings, several farms only selected one option from the corn bunting package. Just one RP farm deployed the Biodiversity Cropping option, with Fisherbriggs the only other farm undertaking this management (funded as an AES option in some fields/years via FBL).
Popular RP options with limited benefits to corn buntings and whose uptake was higher in RP than RSS included Open Grazed or Wet Grassland for Wildlife, and Management of Hedgerows. Although Open Grazed or Wet Grassland for Wildlife is included in the corn bunting package, it only offers significant benefits to corn buntings under certain circumstances, such as when the 6-week livestock exclusion window allows a dense sward attractive to nesting corn buntings to develop during May–June, and the reintroduction of livestock does not cause nests to fail. Management of Hedgerows, which includes the planting of new ones, is likely to benefit species such as yellowhammer and linnet which nest in hedges, but not crop-nesting species such as the corn bunting.
4.1.6 Effect of Mown Grassland for Corn Buntings
In contrast to our findings in previous years, we found no positive effect of the Mown Grassland for Corn Buntings option in the RP scheme. Probable reasons include deployment of the option in poor locations or at too small a scale to attract nesting corn buntings away from silage fields with conventional mowing dates. Only three of the eight farms that deployed the option did so at the whole-field scale in one or more fields (covering approximately 44, 12 and 7 ha), and these three farms had all been involved in trials of the option in FBL since 2006 (Perkins et al., 2013). At the other five farms, two deployed just 1 ha or less on grassland not normally cut for silage or hay, and the other three deployed only 3-4 ha. Furthermore, at least two patches were in locations unlikely to be used by nesting corn buntings (too close to tree plantations). Compared with FBL, far fewer farms deployed the option (40% of farms in FBL cf. 27% in RP), and poor uptake at the whole-field scale was probably due to a combination of farmers being unwilling or unable to tolerate the loss of quality (as livestock feed) of the grass, and the payment rate being insufficient to cover the added cost of buying in replacement animal feed. In the FBL, the payment rate was £260 per hectare, whereas in RP it was 14–17% lower at £224.48 or £216 per hectare, dependent on the permissible mowing date (1 August or 24 July).
4.1.7 Effect of land use change
Although there were no significant land use changes overall in either of the farm groups, cropping changes on some individual farms may have influenced local population trends. For example, on one farm, a decline from 11 to four territorial males coincided with a 35%
31

decline (a loss of 36 ha) in the area of cereals grown on that farm, with crops less favourable to corn buntings (oilseed rape and vegetables) grown in those fields instead. Conversely, on another farm not involved in AES, an increase from four to six territorial male corn buntings was associated with an 80% increase in the area of cereals (by 79 ha), replacing oilseed rape, vegetables and grass.
Further intensification was apparent at some sites, most visibly in the form of the removal of field boundary features such as fences and gorse hedges to make bigger fields. In the case of gorse hedges, this appears to have been done either in breach of the cross compliance ‘retention of landscape features’ rule within Good Agricultural and Environmental Conditions (GAEC 7), or after the farmers had obtained written permission to remove them (Scottish Government, 2016a). From a farming perspective, this increases the area of land available for growing crops, reduces weed encroachment at field edges (by reducing the length of field edge), and increases the efficiency of within-field machinery operations such as ploughing, spraying and harvesting. However, from a corn bunting perspective, even just the removal of a fence removes song-posts and insect-rich rough grassy foraging habitat that is essential during the chick-rearing period. Other potential management changes that could have influenced trends, such as herbicide use, silage mowing dates, or the retention of overwinter stubbles, were not routinely recorded as they were beyond the scope of this study.
4.2 Estimating the level of AES uptake required to prevent further declines
4.2.1 Previous and current estimations
Previously, from analysis of corn bunting population trend data during 2003–09, we predicted that AES management targeted at the species would need to reach 72% of the population to halt the national decline, based on an observed rate of decline on farmland outside AES management of 14.5% per annum (Perkins et al., 2011). Across our 48 survey farms in Aberdeenshire/Moray, approximately 50% of corn buntings in 2015 were on farms that had participated in the RP scheme during SRDP 2007–13, with a further 30% on farms that deployed AES measures through LMOs or FBL (but note that Fisherbriggs accounted for most of this additional 30%). If these figures are representative of the region as a whole, this is very encouraging.
However, we do not have information on RP uptake away from our study farms, nor do we know the precise locations of other key corn bunting populations. It is, therefore, difficult to say whether the target of 72% of the population covered by corn bunting-focused AES has been achieved. What we can say is that the 2015 survey in Aberdeenshire/Moray found no overall decline since 2008–09, and assuming that AES did contribute to halting the population declines reported previously, suggests that a similar level of AES deployment to that achieved during SRDP 2007–13 would be sufficient to maintain the current population, and perhaps support recovery towards the population size and distribution previously recorded in 2003. Also, in Fife and Angus, thanks to ongoing and newly established partnerships (secured by RSPB Scotland’s Corn Bunting project officer), as of 2016, 80% of corn bunting territories in Angus and almost 60% of those in Fife will be within 1 km of a Wild Bird Seed Mix/Unharvested Crop. It should be noted that much of this management is being paid for outwith the SRDP, via partnerships with both the Angus and Fife Environment Trusts that have secured funding from the ENTRUST Landfill Communities Fund to cover the cost of the seed mixes. Combined with the Aberdeenshire/Moray figures, and assuming similar levels of AES uptake there during SRDP 2014–20, this gives a minimum of 35–40% of the mainland Scotland population covered by AES management that includes at least one option from the corn bunting package.
32

4.2.2 Implications of CAP ‘greening’
‘Greening’ measures introduced in the new EU Common Agricultural Policy 2014–20, and deployed in Scotland from 2015, require that all farmers manage at least 5% of their arable land as Ecological Focus Areas (EFAs) (Scottish Government, 2016b). Management options with potential benefits for corn buntings include areas left fallow, buffer strips next to watercourses, grass margins sown around arable fields, and catch crops (cereals under-sown with grass). Farmers are also permitted to sow wildflower mixes or wild bird seed crops on EFA land to maximise their biodiversity benefits, but currently there is no incentive to do so – either in financial terms, or differential weightings for ‘basic’ and ‘upgraded’ EFA management. In Fife and Angus, through innovative partnerships (see section 4.2.1.), funding external to SRDP has been secured to cover the capital seed costs of deploying the Wild Bird Seed Mix/Unharvested Crop option on EFA land. However, whilst the concept of ensuring that AES options are deployed across all arable farms is welcome, and has brought some farmers into AES-type management for the first time, this requirement may also have unintended consequences for corn bunting conservation. Because farmers are now required to take 5% of their arable land out of production in order to be eligible for the Basic Payment Scheme, this may deter participation in the new Agri Environment Climate Scheme (AECS). At several of our study sites, farmers have said that they will not apply to join AECS now that they have to comply with the EFA rule. If this view is widespread amongst the farming community, reduced uptake of AECS seems likely, meaning less deployment of key corn bunting options such as Wild Bird Seed Mix/Unharvested Crop and Mown Grassland for Corn Buntings.
This places an even greater emphasis on the importance of getting the management right on those AECS applications that are made, both in terms of ensuring that AECS plans receive proper scrutiny at the assessment stage and that the management options are deployed effectively for the full five years of the agreement. One option in particular that requires annual management for it to work effectively is Wild Bird Seed Mix/Unharvested Crop, and farmers must ensure that plots are re-established each year by sowing a cereal-rich seed mixture. In the FBL scheme, regular contact between the RSPB advisor and farmer (at least one farm visit per year) facilitated an adaptive management approach, whereby issues such as poor implementation were identified and resolved quickly, and it is widely recognised that follow-up visits to provide advice and ‘aftercare’ can greatly improve the effectiveness of AES. Another option requiring good targeting at the field scale is Mown Grassland for Corn Buntings (see section 4.1.6), which should only be considered for fields that are mown annually for silage or hay, and are likely to attract nesting corn buntings (ideally, backed by expert opinion, or evidence of nesting within the field in previous years). Supporting guidance for all AECS options is available on the ‘Rural Payments and Services’ website, and all farmers and agents should make good use of this to achieve the best results from their scheme (Scottish Government, 2016c).
33

4.3 Policy recommendations
The challenge for the new SRDP 2014–20 is to ensure that the momentum gained during SRDP 2007–13 is not lost, and corn bunting populations in eastern Scotland do not begin to decline once more. To achieve this, we make seven policy recommendations:
1. Strong advocacy to encourage farmers in core corn bunting areas to apply for entry into the Agri-Environment Climate Scheme, and to deploy the key options Wild Bird Seed Mix/Unharvested Crop, Unharvested Conservation Headlands, Grass Margins, and Mown Grassland for Corn Buntings. In recent conversations, several farmers who participated in the RP scheme expressed a loss of enthusiasm for AES following the introduction of CAP ‘greening’ regulations, which may lead to reduced uptake of AECS and key corn bunting management options. The current scoring criteria for assessing AECS applications also encourages the selection of options with multiple environmental objectives, and discourages highly focused plans such as the full corn bunting package of options.
2. Better targeting of key corn bunting options at the field scale, as well as the farm scale, to deliver the maximum possible benefits and provide value for money. This applies especially to Mown Grassland for Corn Buntings, where the whole point of the option is to reduce nest losses in silage or hay fields by delaying mowing, so it should only be permitted in fields that are normally cut for silage or hay, and in fields that are likely to attract nesting corn buntings.
3. Provision of ‘aftercare’ follow-up visits by experienced case officers to ensure AES options are deployed correctly. Experience from FBL (and other species recovery projects elsewhere) shows that AES are more effective where regular ‘aftercare’ advice is provided, by improving the implementation of options.
4. Ensure payment rates of key corn bunting options are sufficiently attractive to farmers. Poor uptake in the RP scheme of the Mown Grassland for Corn Buntings and Biodiversity Cropping options was probably due, at least partly, to the payment rates being too low to fully compensate for losses in yield and other associated costs.
5. Reinstate a Biodiversity Cropping option for low-input cereals. In AECS, the only option available for low-input cereals is Unharvested Conservation Headlands for Wildlife, where the crop must also remain unharvested. Whilst this new option will benefit corn buntings, there should also be a basic extensively managed cereals option available with no requirement to leave the crop unharvested.
6. Provide incentives for farmers to upgrade their EFA management to include the sowing of wildflower or wild bird seed mixes. Although farmers can deploy the Wild Bird Seed Mix/Unharvested Crop option on land designated as EFA as part of their ‘greening’ requirements, there is currently no incentive within the SRDP for them to do so. Financial incentives or greater weighting for EFAs upgraded from the ‘basic’ management to add biodiversity value should be considered in future SRDPs.
7. Better enforcement of GAEC 7 ‘retention of landscape features’ rule. Removal of field boundary features to make bigger fields included the destruction of gorse hedges on some farms, which would appear to constitute either a breach of GAEC 7, or permissions being sought and granted. Gorse provides valuable nesting habitat for birds such as yellowhammer and linnet.
34

5. CONCLUSIONS
Results from the 2015 survey in Aberdeenshire/Moray, showing that the corn bunting population across the study farms as a whole had remained stable since the last survey in 2008–09, were very encouraging. Even more so was the lack of an overall decline on non-AES farms, in contrast to earlier years when corn bunting populations were in steep decline. There were signs that the population may even have started to recover from earlier declines, although the occupancy rate of farms remained unchanged since 2008–09 and was still well short of that in 2003 when the farms were first surveyed. Furthermore, as shown by declines to extinction in the former stronghold of Barras, and large losses on two other farms, corn bunting populations are vulnerable to rapid declines, so there is no room for complacency. However, set within the context of long-term population declines, range contraction and local extinctions across Scotland since the 1970s (and earlier), these results are very positive indeed. With corn bunting populations in Fife and Angus also showing stability since 2009, the considerable conservation effort devoted to this species in eastern Scotland in recent years appears to have been vindicated.
This success is due in no small part to those farmers who have chosen to participate in AES, and deploy targeted management options for corn buntings. Almost two-thirds of our study farms participated in the RP scheme, and these farms held 50% of the corn buntings recorded during the survey. However, uptake of some corn bunting options was low, especially Biodiversity Cropping and Mown Grassland for Corn Buntings. Deployment of the Mown Grassland for Corn Buntings option was also poor in some cases, both in terms of the scale of deployment (plots too small) and its location (areas of rough grass not normally cut for silage). We found no significant change in land use or cropping systems since 2008–09, but did find evidence of intensification on two-thirds of farms in the form of increased field sizes associated with the removal of field boundary features.
Although in this study we found no clear difference in population change between AES and non-AES farms, previous studies have demonstrated that well-targeted AES deploying the key corn bunting options are effective, and remain the best tool available for preventing further declines. With recent increases in the number of farms deploying key AES management in core corn bunting areas in Fife and Angus (albeit much of it funded outwith SRDP), we estimate that at least 35–40% of the mainland Scotland population was covered by AES management in 2015–16. However, strong advisory support will greatly increase the likelihood of success, and alongside funded management options, should form an integral part of any project focused on restoring corn bunting populations in Scotland, which is listed as a priority action in ‘Big Step 4’ of the Scottish Government’s 5-year plan to deliver the ‘2020 Challenge for Scotland’s Biodiversity’ (Scottish Government, 2015).
As with our previous corn bunting surveys, we also counted several other farmland bird species in 2015, and the survey showed increases in yellowhammer and tree sparrow since 2008–09, but in common with most of Scotland, steep declines in farmland waders (lapwing, oystercatcher and curlew). These data are currently being analysed to determine whether population changes are associated with AES, and will also provide a baseline for the SRDP 2014–20. However, to provide a thorough assessment of the effectiveness of SRDPs for Scotland’s farmland bird populations, studies such as the one presented here should be repeated for other Scottish regions. Better access to SRDP data would also help tremendously in such studies, and could support further analysis of the corn bunting dataset to test for ‘spill-over’ effects of AES onto surrounding land, which may explain why declines have abated on non-AES farms.
35

6. REFERENCES
Balmer, D.E., Gillings, S., Caffrey, B.J., Swann, R.L., Downie, I.S. & Fuller, R.J. 2013. Bird Atlas 2007–11: the breeding and wintering birds of Britain and Ireland. British Trust for Orithology Books, Thetford.
Brickle, N.W. & Harper, D.G.C. 1999. Diet of nestling Corn Buntings Miliaria calandra in southern England examined by compositional analysis of faeces. Bird Study, 46, 319–329.
Brickle, N.W. & Harper, D.G.C. 2000. Habitat use by Corn Buntings Miliaria calandra in winter and summer. In: Aebischer, N.J., Evans, A.D., Grice, P.V. & Vickery, J.A. (eds) Ecology and Conservation of Lowland Farmland Birds. pp. 156–164. British Ornithologists’ Union, Tring.
Brickle, N.W. & Harper, D.G.C. 2002. Agricultural intensification and the timing of breeding of Corn Buntings Miliaria calandra. Bird Study, 49, 219–228.
Brickle, N.W., Harper, D.G.C., Aebischer, N.J. & Cockayne, S.H. 2000. Effects of agricultural intensification on the breeding success of corn buntings Miliaria calandra. Journal of Applied Ecology, 37, 742–755.
Burgess, M.D., Bright, J.A., Morris, A.J., Field, R.H., Grice, P.V., Cooke, A.I. & Peach, W. 2014. Influence of agri-environment scheme options on territory settlement by Yellowhammer (Emberiza citronella) and Corn Bunting (Emberiza calandra). Journal for Ornithology, 156, 153–163.
Donald, P.F. & Evans, A.D. 1994. Habitat selection by Corn Buntings Miliaria calandra in winter. Bird Study, 41, 199–210.
Donald, P.F. & Evans, A.D. 1995. Habitat selection and population size of corn buntings Miliaria calandra breeding in Britain in 1993. Bird Study, 42, 190–204.
Donald, P.F. & Aebischer, N.J. (eds) 1997. The ecology and conservation of corn buntings Miliaria calandra. Joint Nature Conservation Committee, Peterborough.
Donald, P.F., Green, R.E. & Heath, M.F. 2001. Agricultural intensification and the collapse of Europe’s farmland bird populations. Proceedings of the Royal Society London B, 268, 25–29.
Donald, P.F., Sanderson, F.J., Burfield, I.J. & van Bommel, F.P.J. 2006. Further evidence of continent-wide impacts of agricultural intensification on European farmland birds, 1990–2000. Agriculture, Ecosystems and Environment, 116, 189–196.
Eaton, M.A., Aebischer, N.J., Brown, A.F., Hearn, R.D., Lock, L., Musgrove, A.J., Noble, D.G., Stroud, D.A. & Gregory, R.D. 2015. Birds of Conservation Concern 4: the population status of birds in the United Kingdom, Channel Islands and Isle of Man. British Birds, 108, 708–746.
Elkins, N., Reid, J.B., Brown, A.W., Robertson, D.G. & Smout, A.M. 2003. The Fife Bird Atlas. Fife Ornithological Atlas Group, Dunfermline. Forrester, R.W., Andrews, I.J., McInerny, C.J., Murray, R.D., McGowan, R.Y., Zonfrillo, B., Betts, M.W., Jardine, D.C. & Grundy, D.S. (eds) 2007. The Birds of Scotland. The Scottish Ornithologists’ Club, Aberlady.
Francis, I. & Cook, M. 2011. North-East Scotland Breeding Bird Atlas 2002–2006. The Scottish Ornithologists’ Club, Aberlady.
Gibbons, D.W., Reid, J.B. & Chapman, R.A. 1993. The New Atlas of Breeding Birds in Britain and Ireland: 1988–1991. Poyser, London.
36

Gillings, S., Newson, S.E., Noble, D.G. & Vickery, J.A. 2005. Winter availability of cereal stubbles attracts declining farmland birds and positively influences breeding population trends. Proceedings of the Royal Society of London B, 272, 733–739.
Harris, S.J., Massimino, D., Newson, S.E., Eaton, M.A., Balmer, D.E., Noble, D.G., Musgrove, A.J., Gillings, S., Procter, D. & Pearce-Higgins, J.W. 2015. The Breeding Bird Survey 2014. BTO Research Report 673. British Trust for Ornithology, Thetford.
Hartley, I.R. & Quicke, D.L.J. 1994. The diet of nestling Corn Buntings on North Uist – insects not grain. Scottish Birds, 17, 169–170.
Hartley, I.R. & Shepherd, M. 1995. A random female settlement model can explain polygyny in the Corn Bunting. Animal Behaviour, 49, 1111–1118.
Hole, D.G., Perkins, A.J., Wilson, J.D., Alexander, I.H., Grice, P.V. & Evans, A.D. 2005. Does organic farming benefit biodiversity? Biological Conservation, 122, 113-130.
Littell, R.C., Milliken, G.A., Stroup, W.W. & Wolfinger, R.D. 1996. SAS System for Mixed Models. SAS Institute Inc., Cary.
Marchant, J.H., Hudson, R., Carter, S.P. & Whittington, P. 1990. Population Trends in British Breeding Birds. British Trust for Ornithology, Tring.
Musgrove, A., Aebischer, N., Eaton, M., Hearn, R., Newson, S., Noble, D., Parsons, M., Risely, K. & Stroud, D. 2013. Population estimates of birds in Great Britain and the United Kingdom. British Birds, 106, 64–100. Olinkiewicz, A. & Osiejuk, T.S. 2003. Effect of time of season and neighbours on singing activity in the Corn Bunting Miliaria calandra. Acta Ornithologica, 38, 117–122.
PECBMS 2015. Trends of common birds in Europe, 2015 update. Prague: CSO/RSPB. http://www.ebcc.info/pecbm.html. Accessed 3 February 2016. Perkins, A.J., Maggs, H.E. & Wilson, J.D. 2008. Winter bird use of seed-rich habitats in agri-environment schemes. Agriculture, Ecosystems and Environment, 126, 189–194.
Perkins, A.J., Maggs, H.E., Watson, A. & Wilson, J.D. 2011. Adaptive management and targeting of agri-environment schemes does benefit biodiversity: a case study of the corn bunting Emberiza calandra. Journal of Applied Ecology, 48, 514–522.
Perkins, A.J., Watson, A., Maggs, H.E. & Wilson, J.D. 2012. Conservation insights from changing associations between habitat, territory distribution and mating system of Corn Buntings Emberiza calandra over a 20-year population decline. Ibis, 154, 601–615.
Perkins, A.J., Maggs, H.E., Wilson, J.D. & Watson, A. 2013. Delayed mowing increases corn bunting Emberiza calandra nest success in an agri-environment scheme trial. Agriculture, Ecosystems and Environment, 181, 80–89.
Perkins, A.J., Maggs, H.E. & Wilson, J.D. 2015. Crop sward structure explains seasonal variation in nest site selection and informs agri-environment scheme design for a species of high conservation concern: the Corn Bunting Emberiza calandra. Bird Study, 62, 474–485. Reidsma, P., Tekelenburg, T., van den Berg, M. & Alkemade, R. 2006. Impacts of land use change on biodiversity: an assessment of agricultural biodiversity in the European Union. Agriculture, Ecosystems and Environment, 114, 86–102.
Robinson R.A., Wilson J.D. & Crick H.Q.P. 2001. The importance of arable habitat for farmland birds in grassland landscapes. Journal of Applied Ecology, 38, 1059–1069.
Robinson, R.A., Marchant, J.H., Leech, D.I., Massimino, D., Sullivan, M.J.P., Eglington, S.M., Barimore, C., Dadam, D., Downie, I.S., Hammond, M.J., Harris, S.J., Noble, D.G., Walker, R.H. & Baillie, S.R. 2015. BirdTrends 2015: trends in numbers, breeding success and survival for UK breeding birds. BTO Research Report 678. Thetford: British Trust for Ornithology. http://www.bto.org/birdtrends. Accessed 3 February 2016.
37
SEERAD 2003. The Rural Stewardship Scheme. Scottish Executive, Edinburgh.
Scottish Government 2008. Rural Development Contracts: Land Managers Options – Notes for Guidance. Scottish Government, Edinburgh. http://www.gov.scot/Resource/Doc/217663/0058305.pdf. Accessed 13 May 2016.
Scottish Government 2014. Rural Priorities Statistics – Financial Totals by Region. http://www.gov.scot/Topics/farmingrural/SRDP/RuralPriorities/RuralPrioritiesStats/FinancialTotalsRegion. Accessed 13 May 2016.
Scottish Government 2015. Scotland’s Biodiversity – a route map to 2020. http://www.gov.scot/Publications/2015/06/8630/4. Accessed 27 May 2016.
Scottish Government 2016a. Good Agricultural and Environmental Conditions (GAECs) 2016 – Retention of landscape features (GAEC 7). Scottish Government, Edinburgh.
https://www.ruralpayments.org/publicsite/futures/topics/inspections/all-inspections/cross-compliance/detailed-guidance/good-agricultural-and-environmental-conditions/retention-of-landscape-features--gaec-7-/. Accessed 13 May 2016.
Scottish Government 2016b. Greening guidance (2016) – Ecological Focus Areas. Scottish Government, Edinburgh.
https://www.ruralpayments.org/publicsite/futures/topics/all-schemes/basic-payment-scheme/greening-guidance/greening-ecological-focus-areas/. Accessed 13 May 2016.
Scottish Government 2016c. Agri-Environment Climate Scheme. Scottish Government, Edinburgh.
https://www.ruralpayments.org/publicsite/futures/topics/all-schemes/agri-environment-climate-scheme. Accessed 13 May 2016.
Setchfield, R,P., Mucklow, C., Davey, A., Bradter, U. & Anderson, G.Q.A. 2012. An agri-environment option boosts productivity of Corn Buntings Emberiza calandra in the UK. Ibis, 154, 235–247.
Sharrock, J.T.R. 1976. The Atlas of Breeding Birds in Britain and Ireland. British Trust for Ornithology, Tring.
Voříšek, P., Jiguet, F., van Strien, A., Škorpilová, J., Klvaňová, A. & Gregory, R.D. 2010. Trends in abundance and biomass of widespread European farmland birds: how much have we lost? BOU Proceedings – Lowland Farmland Birds III http://www.bou.org.uk/bouproc-net/lfb3/vorisek-etal.pdf. Accessed 13 May 2016.
Watson, A. 1992. Unripe grain, a major food for young finch-like birds. Scottish Birds, 16, 287.
Watson, A., Perkins, A.J., Maggs, H.E. & Wilson, J.D. 2009. Decline of Corn Buntings Emberiza calandra on east Scottish study areas in 1989–2007. Bird Study, 56, 213–220.
Wilson, J.D., Taylor, R. & Muirhead, L.B. 1996. Field use by farmland birds in winter: an analysis of field type preferences using resampling methods. Bird Study, 43, 320–332.
Wilson, J.D., Morris, A.J., Arroyo, B.E., Clark, S.C. & Bradbury, R.B. 1999. A review of the abundance and diversity of invertebrate and plant foods of granivorous birds in northern Europe in relation to agricultural change. Agriculture, Ecosystems and Environment, 75, 13–30.
Wilson, J.D., Evans, A.D. & Grice P.V. 2009. Bird Conservation and Agriculture. Cambridge University Press, New York.
Yom-Tov, Y. 1992. Clutch size and laying dates of three species of buntings Emberiza in England. Bird Study, 39, 111–114.
38

ANNEX 1: MANAGEMENT REQUIREMENTS OF RP CORN BUNTING OPTIONS
Wild Bird Seed Mix/Unharvested Crop Aims: Provide support for sowing plots of seed-bearing crops and leaving them unharvested over the winter to provide seed food and cover for farmland birds.
Requirements: Spring sow either (a) a mixture of annual crops including at least one cereal, or (b) at least two crops, one of which must seed in the first year and one in the second (e.g. kale). Do not plough in until after 15 March in (a) the following year or (b) the second year. Pesticides cannot be applied post-establishment, except for spot treatment of scheduled weeds or non-native invasive species (with written agreement). Plots must be no larger than 2 hectares. In corn bunting areas (East Scotland, Uists, Borders), one-year cereal based mixes should be sown, or where two-year mixes are sown, at least two plots must be established in alternate years (to ensure cereal grain is available in each winter). Plots must be located on arable or improved grassland, and in corn bunting areas next to a hedge, isolated bush/tree or overhead wires but not dense woodland.
http://www.gov.scot/Topics/farmingrural/SRDP/RuralPriorities/Options/WildBirdSeedMix
Mown Grassland For Corn Buntings Aims: To protect corn buntings nesting within hay or silage fields from within-field farming operations such as mowing.
Requirements: The field must not be rolled, harrowed or grazed from 1 May until after the field has been mown. The field must be mown, but not until after 24 July (option 1) or 1 August (option 2, higher payment rate). Mowing must be done in a wildlife-friendly manner (i.e. from the centre of the field outwards, to allow animals to escape into neighbouring fields without breaking cover and avoid trapping them in an ever decreasing uncut patch in the centre). An uncut 2m strip must be left around the field boundary. Eligible only in fields used for hay or silage.
http://www.gov.scot/Topics/farmingrural/SRDP/RuralPriorities/Options/GrasslandCornBuntings
Open Grazed Or Wet Grassland For Wildlife Aims: Support management of grazing land that protects ground-nesting birds and other wildlife.
Requirements: Agree a grazing plan that takes into account individual target species, or exclude livestock for six consecutive weeks between 15 March and 15 June inclusive, or restrict livestock to a maximum of 1 LU per hectare during the whole three month period. No harrowing or rolling from 1 April to 31 July inclusive, and no topping until after 31 July. No artificial fertiliser to be applied before 15 May, or farmyard manure/slurry from 1 March to 15 May inclusive. Pesticides cannot be applied, except for spot treatment of scheduled weeds or non-native invasive species (with written agreement). If corn buntings or corncrakes are likely to be present, the management options for these species should be applied for instead. Where farmland waders are targeted (e.g. lapwing, curlew), the area managed must be at least 3 hectares in size, and be at least 30 metres from groups/lines of trees and hedges. Management fields can be rotated around the farm between years.
http://www.gov.scot/Topics/farmingrural/SRDP/RuralPriorities/Options/Managementforwildlife
39

Management of Species Rich Grassland Aims: Encourage the growth and spread of flowering plants and other species in unimproved grassland, which act as a food supply for insects, and a seed source to ensure continuation of the plant species.
Requirements: Manage grazing levels to create a diversity of sward heights including short grassland and dense tussocks. Ensure that the sward is longest in summer and shorter in spring and autumn. Sward heights should be maintained throughout the year at 2–15 cm (calcareous grasslands) or 5–20 cm (neutral and acid grasslands) by grazing during June–March, or cutting once between mid-July and mid-August to a height of 5–10 cm, and once again in the autumn or following spring. The cuttings must be turned in the field to allow seed to drop, and then be removed to avoid smothering the underlying vegetation. In areas with breeding corn buntings, the site must not be grazed or mown from 16 April until 15 August inclusive, and the guidance on sward heights during summer does not apply to these sites. Application must be accompanied by a grazing plan, reflecting the specific biodiversity requirements of the site and the intended conservation outcomes. No fertilisers, slurry, farmyard manure or lime can be applied to the site, nor can it be used for supplementary feeding. Pesticides cannot be applied, except for spot treatment of scheduled weeds or non-native invasive species (with written agreement).
http://www.gov.scot/Topics/farmingrural/SRDP/RuralPriorities/Options/SpeciesRichGrassland
Creation and Management of Species Rich Grassland Aims: To convert arable land or restore improved or semi-improved grassland, to increase the diversity of flowering plants and provide habitat and feeding areas for a variety of invertebrates (particularly bees, butterflies and moths), birds and mammals.
Requirements: Either (a) create a new grassland sward from arable or improved grassland by destroying any existing grassland cover, and where necessary, take measures to reduce soil fertility and weed problems. Sow with a low productivity grass/herb mix to create a new sward. On archaeological crop mark sites, maximum ploughing/cultivation depth is 150 mm.
Or (b) restore an existing semi-improved grassland sward by cutting or grazing to create a short sward, and then raking, harrowing or scarifying to create small patches of bare ground that add up to 50% of the area. Sow the bare patches with a low productivity grass/herb mix. These sites should still have some diversity of grasses and flowers, including at least three indicator species from a list of 12 key plants.
The application must be accompanied by a grazing plan, reflecting the specific biodiversity requirements of the site and the intended conservation outcomes. No fertilisers, slurry or farmyard manure can be applied to the site, nor can it be used for supplementary feeding. Pesticides cannot be applied, except for spot treatment of scheduled weeds or non-native invasive species (with written agreement). Where targeted at wildlife in general, ensure that the sward is longest in summer and shorter in spring and autumn when most grassland species germinate. The seed mix to be sown must consist of native grasses and wildflowers, and have (by weight) at least 15% herbs and no more than 85% non-aggressive fine-leaved grasses.
Where targeted at bees, butterflies and moths, grazing levels during June–August must be light, to create a diversity of sward heights between 5 and 25 cm with plenty of flowering heads. At least 15% of the field must be left uncut to allow a taller sward and grass tussocks to develop for overwintering invertebrates, nesting bees and feeding caterpillars. The area left uncut should be rotated around the field each year to prevent the development of rank grassland. The sward must not be cut before 15 August, or in areas where great yellow bumblebee is a priority, 1 September. The seed mix to be sown must consist of native
40

grasses and wildflowers, and have (by weight) at least 2% red clover, 15% herbs and no more than 85% non-aggressive fine-leaved grasses. At least half of the herb seed (by weight) must consist of seven key species (red clover, tufted vetch, bird’s foot trefoil, yellow rattle, meadow vetchling, selfheal, and common knapweed).
http://www.gov.scot/Topics/farmingrural/SRDP/RuralPriorities/Options/CreationSpcsRichGrassland
Water Margins and Enhanced Riparian Buffer Areas Aims: To protect water margins from erosion and diffuse pollution (agro-chemicals, livestock faeces, and soil), thereby improving water quality and flood control, and also encourage the development of waterside vegetation that stabilises the bank and enhances biodiversity.
Requirements: The buffer width should be 12–24 m on land bordering still water, 3–12 m along either side of a watercourse where the bed width is <1.2 m, and 6–12 m along either side of a watercourse where the bed width is 1.2 m or greater. On steep ground or existing semi-natural vegetation, buffer widths of up to 20 m are permitted. A management plan will outline the existing vegetation, the management objectives, and how they will be achieved.
Either (a) to enhance biodiversity interest on sites with existing semi-natural vegetation, very occasional light grazing will maintain a diversity of sward heights. To control rank tussocky growth, sites should be grazed in late summer/early autumn to reduce the sward height to 10–15 cm. Sites with woodland or fen habitats may require zero or no grazing. In all cases, avoid poaching the ground to reduce soil erosion and damage to banks.
Or (b) to reduce diffuse pollution, ensure that the soil surface within the buffer area is covered with dense plant cover in the winter months. Control rank or tussocky growth and maintain a close even sward using either light grazing as in (a), or mowing to reduce the sward height to 10–15 cm in late summer/early autumn. Any cuttings must be removed.
In all cases, no fertilisers, slurry, farmyard manure or lime can be applied to the site, nor can it be used for supplementary feeding. Pesticides cannot be applied, except for spot treatment of scheduled weeds or non-native invasive species (with written agreement). No cultivation is permitted, nor the clearing or cutting of existing or new drains, or modification/reinforcement of the bank. Small trees may be planted to enhance the habitat, but these must be native species of local origin, and avoid excess shading of the water.
http://www.gov.scot/Topics/farmingrural/SRDP/RuralPriorities/Options/WaterMarginsandBufferArea
Grass Margins and Beetlebanks Aims: To support the creation and management of grass strips along the boundary of/across arable fields, providing habitat for over-wintering insects, rare arable plants, birds and small mammals, and reducing soil erosion/nutrient run-off.
Requirements: Manage a grass margin strip 1.5–6 m wide in an arable field (the arable area adjacent to the strip must be at least 30 m wide, and must be an arable crop). Where the management is to benefit hen harrier, corn bunting, barn owl or kestrel, the minimum strip width is 3 m. Either (a) where no strip currently exists, establish a new strip by sowing a suitable grass seed mix, including at least one species of nectar-feeding plant such as red clover, into a sterile seedbed. Or (b) manage a strip established under a previous agri-environment scheme, and, if not already present in the sward, sow at least one species of nectar-feeding plant such as red clover.
In all cases, no fertilisers, slurry or farmyard manure can be applied. Pesticides cannot be applied, except for spot treatment of scheduled weeds or non-native invasive species (with
41

written agreement). Scrub control is not permitted, except with prior written agreement, but grazing is permitted so long as the average vegetation height is not taken below 100 mm. On mixed arable/grass farms where the field may rotate from arable crops to grass between years, the strip can be transferred to another arable field once during the 5-year agreement.
http://www.gov.scot/Topics/farmingrural/SRDP/RuralPriorities/Options/Gmarginsandbeetlebanks
Biodiversity Cropping on In-Bye Aims: To encourage traditional crop rotations and low-input spring cropping, thereby increasing the conservation value of arable land by supporting wildflowers, insects and birds.
Requirements: Sow plots of up to 2 hectares of spring cereals, fodder root crops or fodder rape, with a maximum combined area of no more than 4 hectares. Arable silage is not eligible. Cultivations and fertiliser applications are only permitted between 1 March and 15 May inclusive (except for fodder rape or root crops, where cultivations can be after 15 May). Any bird nests found must be marked and avoided. Pesticides cannot be applied, except for spot treatment of scheduled weeds or non-native invasive species (with written agreement). After cropping, the plot must not be ploughed or cultivated before 1 March of the following year. Any grazing of fodder crops or stubbles must be controlled such that the management still provides winter feeding areas and cover for birds. A payment supplement is available where a cereal crop is harvested by a binder and the stooks gathered into stacks.
http://www.gov.scot/Topics/farmingrural/SRDP/RuralPriorities/Options/Biodiversitycroppinginbye
Web links to other RP options deployed across the survey farms: Conversion and Maintenance of Organic Farming
http://www.gov.scot/Topics/farmingrural/SRDP/RuralPriorities/Options/conandmainoforganicfarmin
Mown Grassland For Wildlife
http://www.gov.scot/Topics/farmingrural/SRDP/RuralPriorities/Options/ManagementOfMownGrassland
Management of Habitat Mosaics
http://www.gov.scot/Topics/farmingrural/SRDP/RuralPriorities/Options/ManagementHabitatMosaics
Management of Wetland
http://www.gov.scot/Topics/farmingrural/SRDP/RuralPriorities/Options/ManagementofWetland
Create, Restore and Manage Wetland
http://www.gov.scot/Topics/farmingrural/SRDP/RuralPriorities/Options/CreateRestoreWetland
Management of Flood Plains
http://www.gov.scot/Topics/farmingrural/SRDP/RuralPriorities/Options/ManagementofFloodPlain
42

Coastal, Serpentine and Special Interest Heath
http://www.gov.scot/Topics/farmingrural/SRDP/RuralPriorities/Options/Coastalserpentineheath
Lowland Heath
http://www.gov.scot/Topics/farmingrural/SRDP/RuralPriorities/Options/LowlandHeath
Management of Hedgerows
http://www.gov.scot/Topics/farmingrural/SRDP/RuralPriorities/Options/Hedgerows
Extended Hedges
http://www.gov.scot/Topics/farmingrural/SRDP/RuralPriorities/Options/Extendedhedges
Scrub and Tall Herb Communities
http://www.gov.scot/Topics/farmingrural/SRDP/RuralPriorities/Options/Scrubandtallherbcommuniti
43

ANNEX 2: LIST OF BIRD SPECIES RECORDED DURING THE 2015 SURVEY
Total = 103 species. The number of farms each species was recorded on is also shown.
Arctic tern (1) Blackbird (45) Blackcap (18) Black guillemot (1) Black-headed gull (23) Blue tit (36) Bullfinch (6) Buzzard (47) Carrion crow (48) Chaffinch (43) Chiffchaff (14) Coal tit (18) Collared dove (23) Common crossbill (5) Common gull (6) Coot (5) Cormorant (3) Corn bunting (36) Curlew (21) Dipper (1) Dunnock (42) Eider (3) Feral pigeon (41) Fulmar (2) Gannet (2) Goldcrest (26) Golden plover (2) Goldfinch (43) Goosander (1) Grasshopper warbler (4) Great black-backed gull (9) Great spotted woodpecker (9) Great tit (38) Greenfinch (27) Green sandpiper (1) Grey heron (13)
Grey partridge (27) Grey wagtail (3) Greylag goose (2) Guillemot (1) Herring gull (42) Honey buzzard (1) House martin (39) House sparrow (47) Jackdaw (44) Jay (1) Kestrel (18) Kittiwake (1) Lapwing (22) Lesser black-backed gull (13) Lesser redpoll (20) Linnet (47) Little grebe (1) Long-tailed tit (2) Magpie (34) Mallard (29) Meadow pipit (44) Mistle thrush (2) Moorhen (4) Mute swan (4) Osprey (3) Oystercatcher (36) Peregrine (3) Pheasant (45) Pied wagtail (45) Quail (13) Raven (2) Razorbill (1) Red-legged partridge (13) Redshank (1) Reed bunting (37) Robin (38)
Rock pipit (2) Rook (42) Sand martin (26) Sandwich tern (2) Sedge warbler (43) Shag (2) Shelduck (1) Short-eared owl (1) Siskin (15) Skylark (48) Snipe (3) Song thrush (35) Sparrowhawk (13) Spotted flycatcher (1) Starling (48) Stock dove (7) Stonechat (4) Swallow (48) Swift (22) Tawny owl (1) Teal (3) Tree sparrow (46) Treecreeper (1) Tufted duck (3) Wheatear (10) Whinchat (1) Whitethroat (43) Willow warbler (36) Woodpigeon (48) Wren (44) Yellowhammer (48)
44

ANNEX 3: FARM DETAILS AND CORN BUNTING COUNTS 2003–15
Farm areas include all land within a 250 m buffer of the farm boundary. Status refers to participation in AES, where AES = participant of schemes throughout the period 2003–15; control = has never participated in schemes during this period; both = participant of schemes in some but not all years. nc = no count, not surveyed that year. Note that some farms were surveyed in additional years, but these counts are excluded for brevity.
Corn bunting count (territorial males)
Farm name Grid ref.
Area (ha)
Status
2003
2004
2006
2008
2009
2015
Mains of Kindrought NJ9853 209 both 9 5 2 1 0 0 Little Mains of Hatton NJ6842 166 control 6 6 3 2 3 4 Todhills NJ6460 136 both 3 6 9 8 9 9 Blackpots NJ9541 206 both 10 10 6 7 7 9 Cairnlob NK0255 225 control 1 1 0 0 nc 2 Cannonhills NJ9564 131 AES 8 4 8 7 nc 6 Corsekelly NK0561 287 AES 33 30 28 29 25 26 Corskie NJ3264 383 AES 6 1 2 3 nc 2 Cunninghaugh NJ3564 282 both 12 10 13 11 nc 4 Dipplebrae NK0756 172 AES 6 4 3 4 3 3 Dallachy NJ6465 342 both 10 10 12 11 9 11 Ironhill NJ9165 128 both 4 1 4 7 nc 5 Ewebrae NJ7846 162 both 0 0 3 0 nc 0 Auchtydonald/Keplahill NK0048 396 AES 1 0 0 0 nc 1 Burnside of Idoch NJ7749 486 AES 1 0 0 0 nc 2 Cairnhill NJ7851 321 AES 7 6 8 7 5 5 Easter Cardno NJ9764 321 AES 8 10 7 9 10 11 Mains of Dudwick NJ9737 326 both 3 2 0 0 nc 0 Ednie NK0850 403 AES 3 3 2 1 nc 0 Bruxie Hill NK0851 215 AES 0 0 0 0 nc 0 Fisherbriggs/Lochbuy NJ9265 313 both 31 33 33 41 46 75 Mains of Fortrie NJ9539 400 control 5 5 1 2 4 6 Middle Hythie NK0151 289 AES 3 3 5 1 nc 0 Minnonie NJ7760 274 both 1 1 1 0 nc 1 North Pitburn NK0653 173 AES 2 0 1 0 nc 0 Overside NK0654 267 AES 0 1 0 0 nc 1 Paddocklaw NJ6661 175 both 3 3 4 5 8 5
(Cont./)
45

(Cont.)
Corn bunting count (territorial males)
Farm name Grid ref.
Area (ha)
Status
2003
2004
2006
2008
2009
2015
Wellheads NJ5962 158 both 3 4 6 4 3 3 Ordens & Baley NJ6161 499 both 4 4 2 4 4 1 Savoch NK0458 238 control 5 5 5 8 7 9 St John's Wells NJ7936 357 both 1 0 0 0 nc 0 Tillyeve NJ8922 252 control 0 0 0 1 nc 0 Upper Blairmaud NJ6159 375 both 16 12 17 13 10 2 Waulkmill NJ8151 136 both 1 0 1 1 nc 4 Cauldwells NJ7855 253 AES 7 6 6 5 7 7 Mains of Rattray NK0857 272 AES nc nc 5 14 15 12 Middleton of Rattray NK0956 269 AES 2 6 4 4 5 2 Blackhill Slains NK0431 242 both nc nc 6 5 3 2 Mains of Slains NK0430 175 AES nc nc 2 7 7 7 Mitton of Barras NO8379 341 AES 10 5 3 2 0 0 Cotbank of Barras NO8278 293 both 6 4 2 2 1 0 Brigstanes NO8578 118 both 11 6 5 3 2 0 Mains of Collieston NK0329 196 both nc nc 0 0 0 1 Bloodymire NJ7263 388 AES 3 5 nc nc 4 4 Slackadale NJ7454 217 both 1 1 nc nc 0 0 Newton of Mountblairy NJ6855 328 both 2 3 nc nc 1 3 Braco NK0638 216 AES 1 1 nc nc 1 0 Culbirnie NJ6260 196 AES 1 1 nc nc 1 1
46

www.snh.gov.uk© Scottish Natural Heritage 2017 ISBN: 978-1-78391-414-2
Policy and Advice Directorate, Great Glen House,Leachkin Road, Inverness IV3 8NWT: 01463 725000
You can download a copy of this publication from the SNH website.