snap interactive, inc. (otcqb: stvi) fy 2015 earnings · pdf filesnap interactive, inc....
TRANSCRIPT

Snap Interactive, Inc. (OTCQB: STVI) FY 2015 Earnings Call & Business Update
March 14, 2016
Safe Harbor
2
This presentation is for discussion purposes only. The material is based upon information that we consider reliable, but we do not represent that it is accurate or complete, and it should not be relied upon as such. Certain statements in this presentation constitute “forward-looking statements” relating to Snap Interactive, Inc. (“SNAP,” “Snap Interactive” or the “Company”) made under the safe harbor provisions of the Private Securities Litigation Reform Act of 1995 that are based on current expectations, estimates, forecasts and assumptions and are subject to risks and uncertainties. In some cases, you can identify these statements by words such as “may”, “might”, “will”, “should”, “expect”, “plan”, “anticipate”, “believe”, “estimate”, “predict”, “optimistic”, “potential”, “future” or “continue,” and variations of such words and other comparable terminology. All forward-looking statements speak only as of the date on which they are made. Readers are specifically directed to the Company’s filings with the Securities and Exchange Commission for a description of certain risks, uncertainties and assumptions and to the discussion under “Risk Factors” in the Company’s most recently filed Annual Report on Form 10-K, Quarterly Reports on Form 10-Q and other Securities and Exchange Commission filings. These risks and uncertainties, as well as other risks and uncertainties of which the Company is not aware of or which the Company does not currently believe to be material, may cause actual future results to be materially different than those expressed by these forward-looking statements. In addition, there can be no assurance that actual results will meet expectations. Actual results could differ materially because of a number of factors, including, without limitation, factors such as:
• The Company’s ability to generate and sustain increased revenue levels and achieve profitability in the future; • The Company’s ability to meet its current and future debt service obligations; • The Company’s ability to release new applications or improve upon existing applications and derive revenue therefrom; • The Company’s future growth and growth strategy; • The Company’s use of proceeds from a debt or equity financing; • The Company’s ability to anticipate and respond to changing trends and preferences; • The Company’s heavy reliance on a limited number of third party platforms to run the Company’s applications; • The intense competition in the online dating marketplace; • The Company’s reliance on its executive officers; and • The success of new applications and application features on user engagement, user conversion and our results of operations.
The Company’s actual results, performance and achievements may differ materially from any future results, performance, or achievements expressed or implied by such forward-looking statements. All forward-looking statements speak only as of the date on which they are made. We do not assume responsibility for the accuracy or completeness of any forward-looking statement and you should not rely on forward-looking statements as predictions of future events. We do not undertake any obligation to update any forward-looking statement, whether written or oral, relating to the matters discussed herein, except to the extent required by applicable securities laws.

Agenda
3
ü Industry Outlook
ü SNAP Fiscal Year 2015 & Q4 Highlights
ü SNAP Growth Strategy
ü Industry Commentary by Mark Brooks of Courtland Brooks
ü Q&A Session

FY 2015 & Q4 HIGHLIGHTS
4

2015: Year of Reinvention
• New CEO • New Board of Directors • New Strategy: Portfolio with User Database as Catalyst • New Brand for Core Product • New launch of Mobile Apps
5
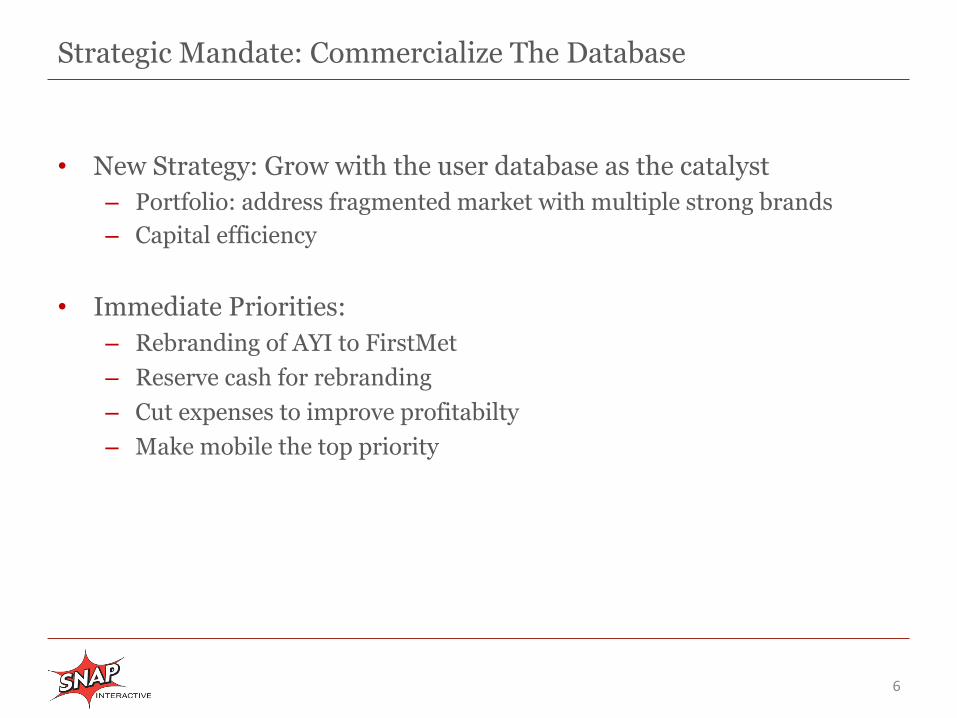
Strategic Mandate: Commercialize The Database
• New Strategy: Grow with the user database as the catalyst – Portfolio: address fragmented market with multiple strong brands – Capital efficiency
• Immediate Priorities: – Rebranding of AYI to FirstMet – Reserve cash for rebranding – Cut expenses to improve profitabilty – Make mobile the top priority
6

Rebranding AYI to FirstMet
7
• Rebrand completed March 3, 2016
• Why Rebrand? – Build a stronger brand
foundation
– Reduce cost of acquisition for new users
– Reactivate inactive users

Immediate Benefits of Rebranding: Reactivation
• In the first week since the FirstMet rebrand, a larger spike in reactivated users
• Have not yet commenced win-back campaign
8
5,000
7,500
10,000
12,500
15,000
17,500
20,000
10/10
10/17
10/24
10/31
11/7
11/14
11/21
11/28
12/5
12/12
12/19
12/26
1/2
1/9
1/16
1/23
1/30
2/6
2/13
2/20
2/27
3/5
Number of 30-‐Day-‐Inac3ve Users Reac3vated via Unpaid Channels
Reac2vated daily 7-‐day moving average
Date of Rebrand
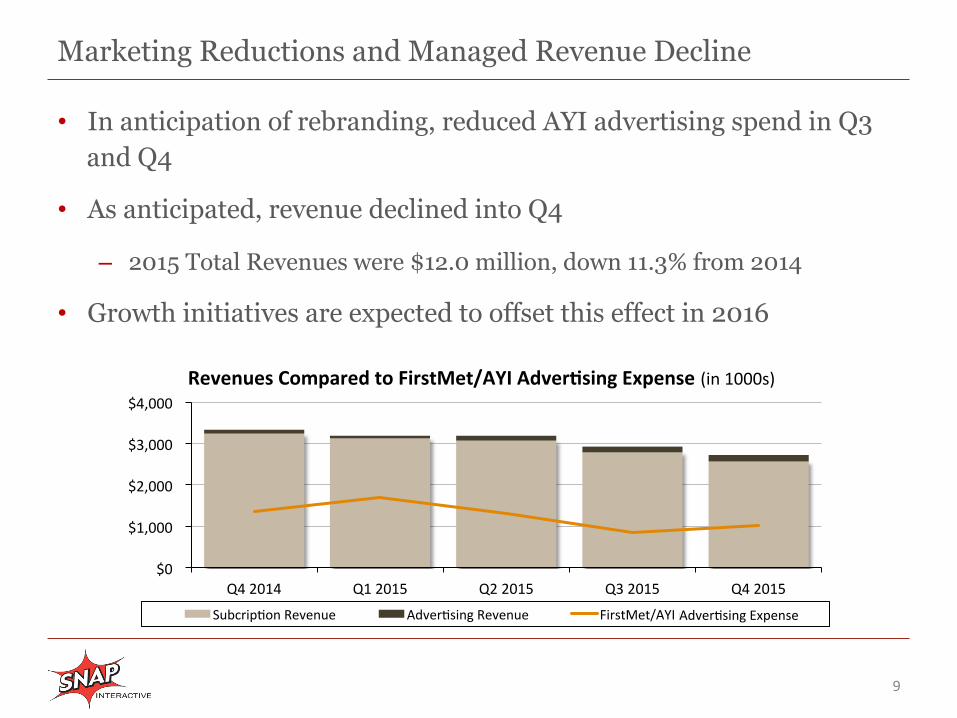
Marketing Reductions and Managed Revenue Decline
9
• In anticipation of rebranding, reduced AYI advertising spend in Q3 and Q4
• As anticipated, revenue declined into Q4
– 2015 Total Revenues were $12.0 million, down 11.3% from 2014
• Growth initiatives are expected to offset this effect in 2016
$0
$1,000
$2,000
$3,000
$4,000
Q4 2014 Q1 2015 Q2 2015 Q3 2015 Q4 2015
Revenues Compared to FirstMet/AYI Adver3sing Expense (in 1000s)
Subcrip2on Revenue Adver2sing Revenue FirstMet/AYI marke2ng expense Adver2sing Expense

Recent Turnaround in Bookings
• January represented the second consecutive month of growth in bookings
• Preliminary February figures indicate a potential third growth month
10
$774 $823 $851
$600
$700
$800
$900
Nov-‐15 Dec-‐15 Jan-‐16 Feb-‐16
Subscrip3on Bookings (in 1000s)

Q4 2015 Gains in Advertising Revenue
• 61% improvement as compared to Q4 2014
• 10% improvement as compared to Q3 2015 • Gains came from additional ad placements and onboarding more
advertisers
11
$93 $57
$113 $135 $148
$0
$40
$80
$120
$160
Q4 2014 Q1 2015 Q2 2015 Q3 2015 Q4 2015
Adver3sing Revenue (in 1000s)

Manage Expenses to Improve Profitability
12
• 2015 Adjusted EBDITA nearly breakeven, up $456 thousand over 2014 • Total expenses down 12.5% for the full year, down 17.5% quarterly year
over year
$(522)
$(66)
$(600)
$(400)
$(200)
$-‐ Adjusted EBITDA (in 1000s)
2014 2015
$1
$91
$-‐
$40
$80
$120 Adjusted EBITDA (in 1000s)
Q4 2014 Q4 2015
$15,303 $13,421
$-‐
$5,000
$10,000
$15,000
$20,000 Total Expenses (in 1000s)
2014 2015
$3,634 $3,001
$-‐
$1,000
$2,000
$3,000
$4,000 Total Expenses (in 1000s)
Q4 2014 Q4 2015
FY 2015 vs.
FY 2014
Q4 2015 vs.
Q4 2014

Cash Flow and Balances for Q4 2015
13
• Cash flow from operating activities approximately breakeven
• Cash and cash equivalents approximately level with Q3 at $2.1 million
$221
($1,053)
($394)
$260
($26)
($1,200)
($800)
($400)
$0
$400
Q4 2014 Q1 2015 Q2 2015 Q3 2015 Q4 2015
Net Cash Provided by (Used In) Opera3ng Ac3vi3es (in 1000s)
$1,138
$2,328
$1,915 $2,151 $2,131
$0
$500
$1,000
$1,500
$2,000
$2,500
Q4 2014 Q1 2015 Q2 2015 Q3 2015 Q4 2015
Cash and Cash Equivalents (in 1000s)

Launch of New FirstMet Mobile Apps
14
• New apps launched in March 2016
• Intensive focus on mobile going forward
• All new technology makes improvements much easier

SNAP’s Mobile First Product, The Grade
15
• Q4 was strongest ever in user activity
• Approximately 53 million cumulative swipes as of March 2016
• Resources shifted to FirstMet

GROWTH STRATEGY
16

SNAP Growth Strategy
17
Rebrand = Reactivation
• Aggressive win-back campaigns
Rebrand = Differentiation
• Cultivate 35+ market segment
• Potential for lower cost of acquisition
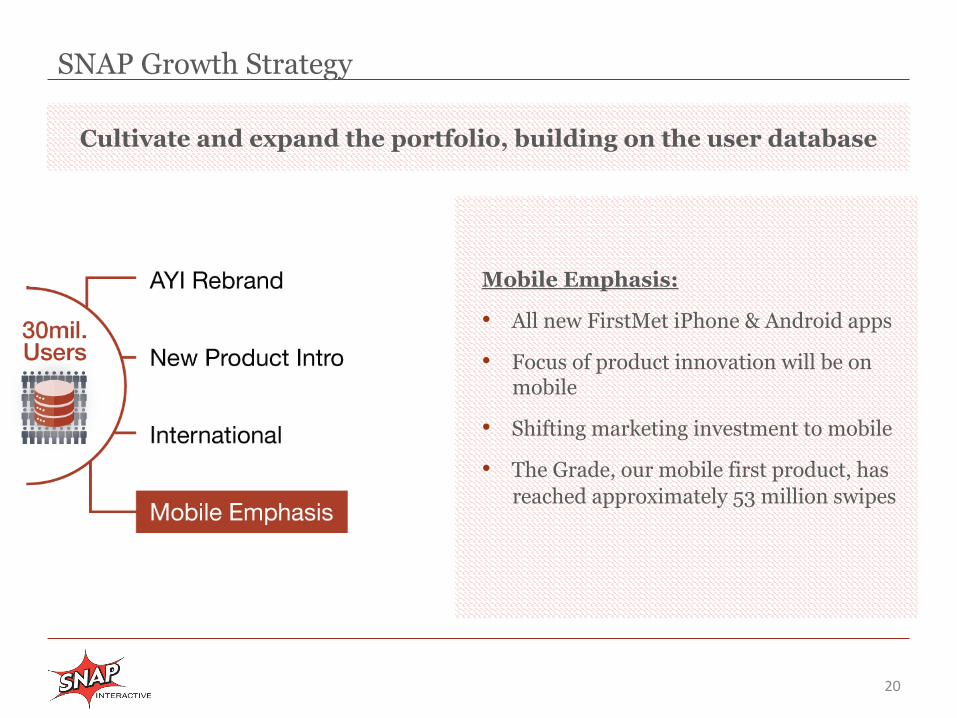
Cultivate and expand the portfolio, building on the user database

SNAP Growth Strategy
18
Proposed New Product Introduction:
• Built on existing product platform
• Cross-sell from user database
• Expected launch Q3 2016
Cultivate and expand the portfolio, building on the user database

SNAP Growth Strategy
19
Cultivate and expand the portfolio, building on the user database
International:
• All three FirstMet mobile platforms support translation
• Live in Spanish
• Evaluating Portuguese language translation in 2016
SNAP Growth Strategy
20
Cultivate and expand the portfolio, building on the user database
Mobile Emphasis:
• All new FirstMet iPhone & Android apps
• Focus of product innovation will be on mobile
• Shifting marketing investment to mobile
• The Grade, our mobile first product, has reached approximately 53 million swipes

INDUSTRY OUTLOOK
21

Industry Outlook: Dating Enters the Mainstream
22
• Entered the mainstream
– Match Group IPO / venture investment / exits
– Pew Attitudes
• Market penetration is up 36% since 20131
• Millennials up 170%
• 55-64 up 100%
• 15% US market penetration1 could grow by multiples
1. Source: Pew Research Center

Industry Outlook: Disruption + Fragmentation = Consolidation
23
• Tinder’s popularity:
– Introduced the Millennial generation to online dating
– Has taken market share in the 25-35 segment
• Threat to traditional pay models overblown
– Free services progress to paid over time
– Popular free services PoF and OkCupid launched >10 years ago
• Fragmentation + disruption = consolidation

Non-GAAP Reconciliation: ADJUSTED EBITDA
24
Non-GAAP Financial Measures Adjusted EBITDA is defined as net loss adjusted to exclude interest income (expense), net, depreciation and amortization expense, gain (loss) on change in fair value of derivative liabilities, loss on disposal of fixed assets and stock-based compensation expense. The Company presents Adjusted EBITDA because it is a key measure used by the Company’s management and its Board of Directors to understand and evaluate the Company’s core operating performance and trends, to develop short- and long-term operational plans, and to allocate resources to expand the Company’s business. In particular, the exclusion of certain expenses in calculating Adjusted EBITDA can provide a useful measure for period-to-period comparisons of the cash operating income generated by the Company’s business. The Company believes that Adjusted EBITDA is useful to investors and others to understand and evaluate the Company’s operating results and it allows for a more meaningful comparison between the Company’s performance and that of competitors. Management uses these non-GAAP financial measures internally in analyzing the Company's financial results to assess operational performance and to determine the Company's future capital requirements. The presentation of this financial information is not intended to be considered in isolation or as a substitute for the financial information prepared in accordance with GAAP. Some limitations of Adjusted EBITDA as a financial measure include that: • Adjusted EBITDA does not (i) reflect cash capital expenditure requirements for assets underlying depreciation and amortization expense that may need to be
replaced or for new capital expenditures; (ii) reflect the Company's working capital requirements; (iii) consider the potentially dilutive impact of stock-based compensation; (iv) reflect interest expense or interest payments on our outstanding indebtedness; and (v) reflect the change in fair value of warrants; and
• Other companies, including companies in our industry, may calculate Adjusted EBITDA differently or choose not to calculate Adjusted EBITDA at all, which reduces its usefulness as a comparative measure.
Because of these limitations, you should consider this non-GAAP financial information along with other financial performance measures reported in our filings with the Securities and Exchange Commission, including total revenues, subscription revenue, deferred revenue, net income (loss), cash and cash equivalents, restricted cash, net cash used in operating activities and our financial results presented in accordance with GAAP. The following unaudited table presents a reconciliation of net loss, the most directly comparable financial measure calculated and presented in accordance with GAAP, to Adjusted EBITDA for the three months ended December 31, 2015 and 2014 and the twelve months ended December 31, 2015:

Non-GAAP Reconciliation: BOOKINGS
25
Non-GAAP Financial Measures Bookings is a financial measure representing the aggregate dollar value of subscription fees and micro-transactions received during the period but is not a financial measure that is calculated and presented in accordance with GAAP. We calculate bookings as subscription revenue recognized during the period plus the change in deferred subscription revenue recognized during the period. We record subscription revenue from subscription fees and micro-transactions as deferred subscription revenue and then recognize that revenue ratably over the length of the subscription term. Our management uses bookings internally in analyzing our financial results to assess operational performance and to assess the effectiveness of, and plan future, user acquisition campaigns. We believe that this non-GAAP financial measure is useful in evaluating our business because we believe, as compared to subscription revenue, it is a better indicator of the subscription activity in a given period. We believe that both management and investors benefit from referring to bookings in assessing our performance and when planning, forecasting and analyzing future periods. Some limitations of bookings as a financial measure include that: • bookings does not reflect that we recognize subscription revenue from subscription fees and micro-transactions over the length of the
subscription term or a two-month period, respectively; and • other companies, including companies in our industry, may calculate bookings differently or choose not to calculate bookings at all, which
reduces its usefulness as a comparative measure. While the factors that affect bookings and subscription revenue are generally the same, certain factors may affect subscription revenue more or less than such factors affect bookings in any period. While we believe that bookings is useful in evaluating our business, it should be considered as supplemental in nature and it is not meant to be a substitute for subscription revenue recognized in accordance with GAAP. The following unaudited table presents a reconciliation of subscription revenue to bookings for the three months ended December 31, 2015 and 2014, the twelve months ended December 31, 2015 and 2014, and the month ended November, December and January 2015:

Snap Interactive, Inc. (OTCQB: STVI) FY 2015 Earnings Call & Business Update
March 14, 2016

27
Mark Brooks:Commentary on the Interactive Dating Industry#

0%#
20%#
40%#
60%#
80%#
100%#
2009# 2010# 2011# 2012# 2013# 2014# 2015# 2016#
Desktop Mobile
StatCounter, Jan 2016
Worldwide
Mobile vs Desktop Traffic#
28

StatCounter, Jan 2016
0%#
20%#
40%#
60%#
80%#
100%#
2009# 2010# 2011# 2012# 2013# 2014# 2015# 2016#
Desktop Mobile India
Mobile vs Desktop Traffic#
29
StatCounter, Jan 2016
0%#
20%#
40%#
60%#
80%#
100%#
2009# 2010# 2011# 2012# 2013# 2014# 2015# 2016#
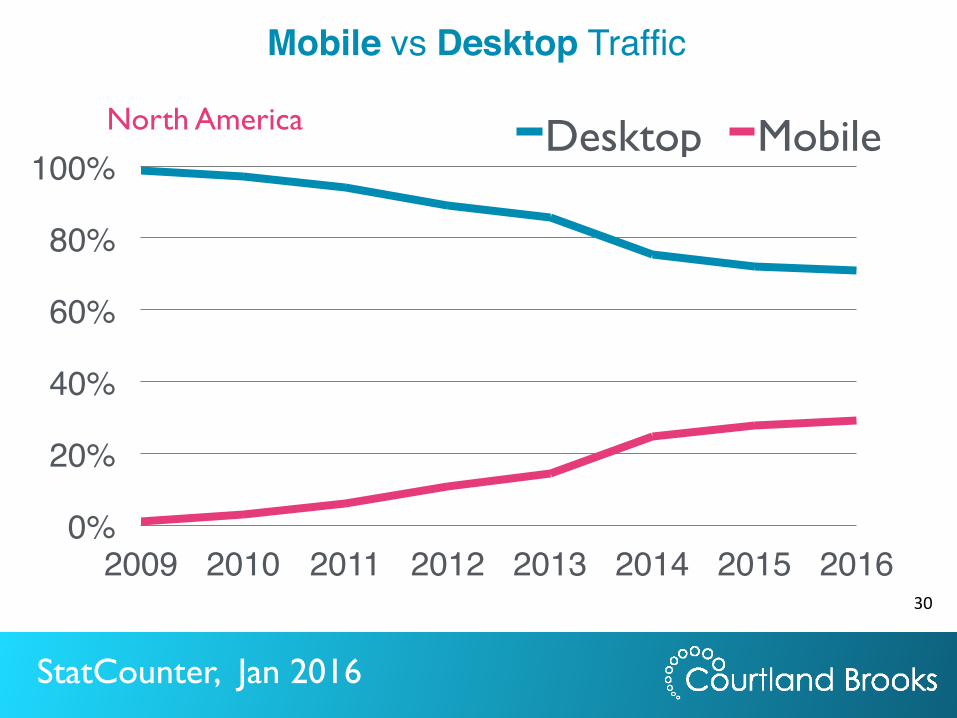
Desktop Mobile North America
Mobile vs Desktop Traffic#
30

comScore, Nov 2015
65%#59%#
50%#
40%#44%#
33%#27%#35%#
41%#
50%#
60%#56%#
67%#73%#
Jul 2013# Nov 2013#
Feb 2014#
Jul 2014# Nov 2014#
Jul 2015# Nov 2015#
Desktop Mobile
Dating Visitors By Access Method (US, %)#
31

“We match people based on who they tell us they are, and on what they say they want. ������But they often fib, and don’t really know what they want. ������We have to observe behavior to know who they really are, and what they really want.”
Mark Brooks!Courtland Brooks
32

33
Mark Brooks:Commentary on the Interactive Dating Industry#

QUESTIONS & ANSWERS
34