snacks market – india · pdf filesnacks market in india 2014.ppt 2 ... rural : urban : 6...
TRANSCRIPT
Snacks Market – India
March 2014
2 SNACKS MARKET IN INDIA 2014.PPT
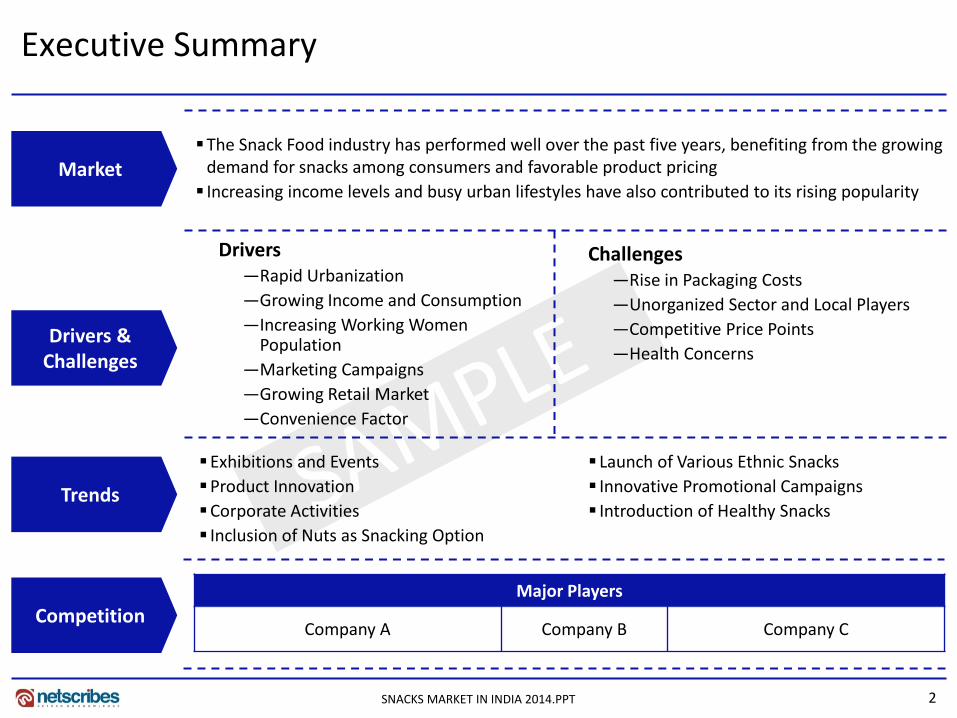
Executive Summary
Market The Snack Food industry has performed well over the past five years, benefiting from the growing
demand for snacks among consumers and favorable product pricing Increasing income levels and busy urban lifestyles have also contributed to its rising popularity
Drivers & Challenges
Competition
Drivers —Rapid Urbanization —Growing Income and Consumption —Increasing Working Women
Population —Marketing Campaigns —Growing Retail Market —Convenience Factor
Challenges —Rise in Packaging Costs —Unorganized Sector and Local Players —Competitive Price Points —Health Concerns
Major Players
Company A Company B Company C
Exhibitions and Events Product Innovation Corporate Activities Inclusion of Nuts as Snacking Option
Trends
Launch of Various Ethnic Snacks Innovative Promotional Campaigns Introduction of Healthy Snacks

3
•Macro-Economic Indicators •Introduction •Market Overview •Value Chain •Market Segmentation •Consumer Insights •Import & Export •Drivers & Challenges •Government Rules & Policies •Government Participation •Trends •Competitive Landscape •Strategic Recommendations •Appendix
SNACKS MARKET IN INDIA 2014.PPT
4
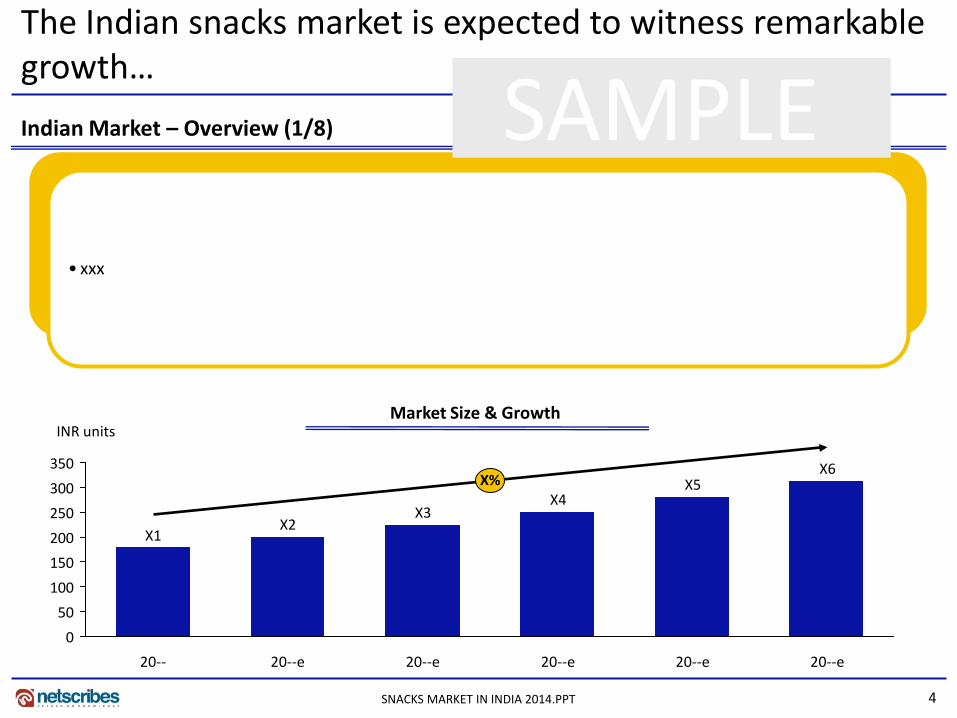
Indian Market – Overview (1/8)
The Indian snacks market is expected to witness remarkable growth…
• xxx
Market Size & Growth
0
50
100
150
200
250
300
350
INR units
X%
20--e
X6
20--e
X5
20--e
X4
20--e
X3
20--e
X2
20--
X1
SNACKS MARKET IN INDIA 2014.PPT
SAMPLE
5
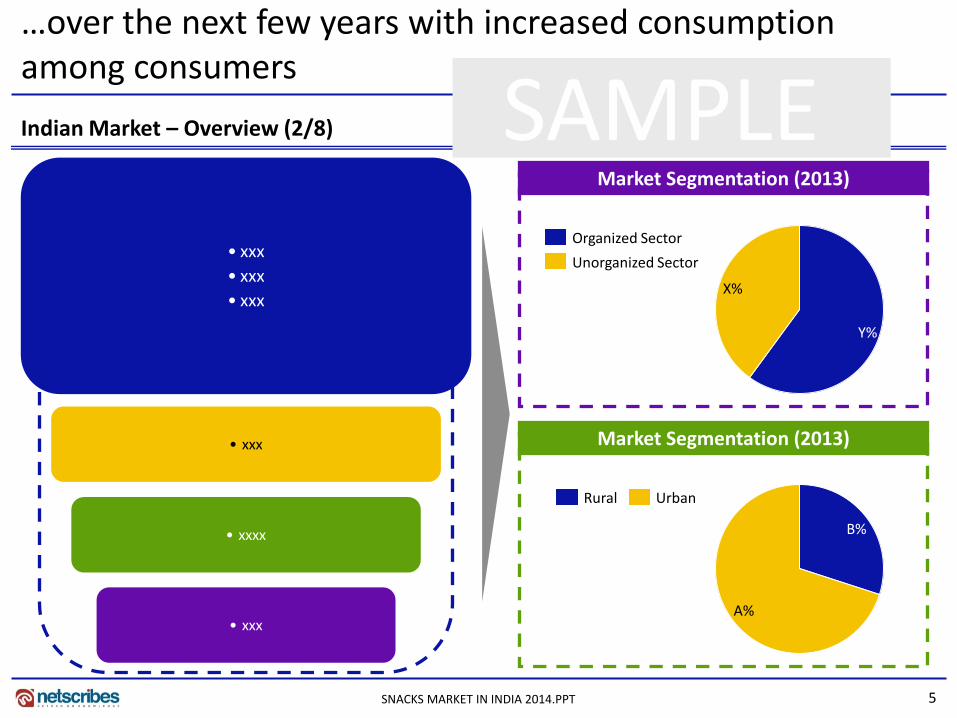
Indian Market – Overview (2/8)
…over the next few years with increased consumption among consumers
Market Segmentation (2013)
X%
Y%
Unorganized Sector
Organized Sector • xxx • xxx • xxx
• xxx
• xxxx
• xxx
SNACKS MARKET IN INDIA 2014.PPT
Market Segmentation (2013)
A%
B%
SAMPLE
Urban Rural
6
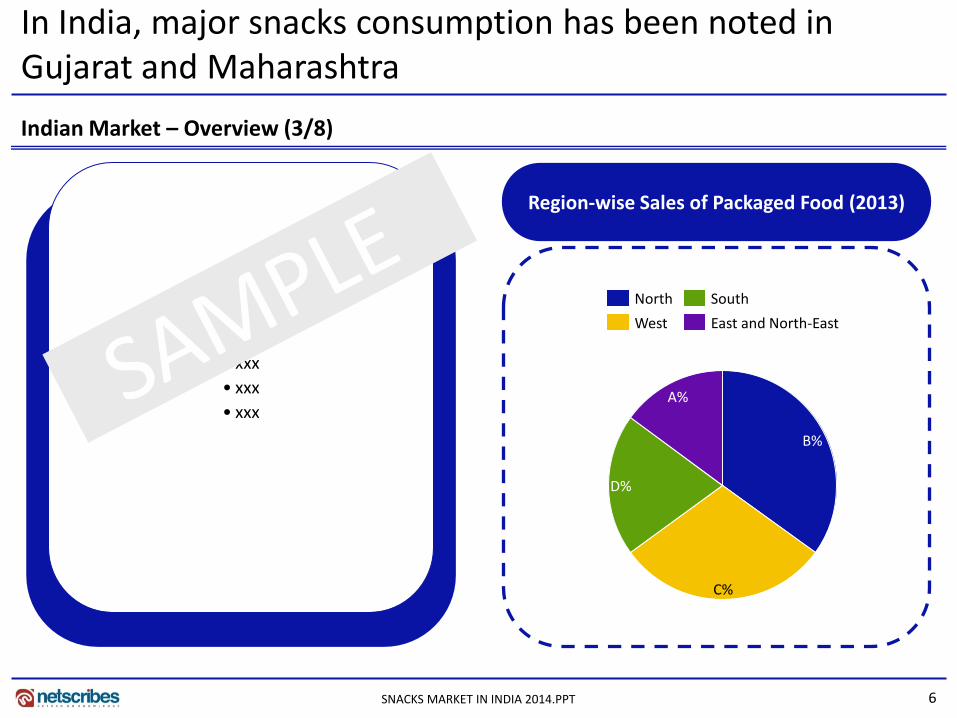
Indian Market – Overview (3/8)
In India, major snacks consumption has been noted in Gujarat and Maharashtra
SNACKS MARKET IN INDIA 2014.PPT
Region-wise Sales of Packaged Food (2013)
C%
B%
D%
A%
East and North-East
South North
West
• xxx • xxx • xxx

7
SAMPLE Market Segmentation (1/3)
Snacks are broadly classified into two segments
xxx
Snacks - Classification
Western Traditional
Y%
X%
Traditional
Western
Segmental Share (2013)
SNACKS MARKET IN INDIA 2014.PPT

8
SAMPLE Consumer Insights on Snacks (2/11)
Consumption Share of Snacks
Options 1) Yes 2) No
Q: Do you consume snacks?
Y%
X%
Share of Potential Future Consumers
Options 1) Yes 2) No
Q: If you don’t consume snacks at present, would you like to try it in future
X% Y%
No Yes No Yes
SNACKS MARKET IN INDIA 2014.PPT

9
SAMPLE Import of Major Types of Snacks (2/2)
Potato Chips
Other Preparations of Potato
0 0
‘000 unit INR mn Value Volume X6%
x5&%
X4% X3%
X2%
X1%
f
e
d
c
b
a
Y6% Y5%
Y4%
Y3%
Y2%
Y1%
l
k
j
i
h
g
0 0
‘000 unit INR mn Volume Value
Major Importing Nations – Value Wise (2013)
Major Importing Nations – Value Wise (2013)
SNACKS MARKET IN INDIA 2014.PPT

10
Adoption of extensive marketing campaigns to create product awareness is fostering market growth
Marketing Campaigns
• xxx
• xxx
• xxx xxx
• xxx
Impact
SNACKS MARKET IN INDIA 2014.PPT
Television Print Outdoor Overall Industry Digital Radio
2013
2014e
Indian advertising Industry
SAMPLE

11
Share of healthy snacks in the overall snacks market
Snack manufacturers are launching healthy snacks to…
Introduction of Healthy Snacks (1/2)
• xxx • xxx
xxx
0
INR bn
y
2015e
y1
2011
x1
xxx
y
x
Healthy Snacks
Others
Health & Wellness Food Market
xxx
SNACKS MARKET IN INDIA 2014.PPT
SAMPLE

12
SAMPLE Porter’s Five Forces Analysis
Competitive Rivalry
• xxx • xxx • xxx
Bargaining Power of Suppliers
• xxx • xxx
Bargaining Power of Buyers
• xxx • xxx
Threat of Substitutes
• xxx • xxx
Threat of New Entrants • xxx • xxx
Impact Medium
Impact Medium to
High
Impact Medium
Impact Medium to
High
Impact Medium to
High
*Note: BEP (Break-even point)
SNACKS MARKET IN INDIA 2014.PPT
13
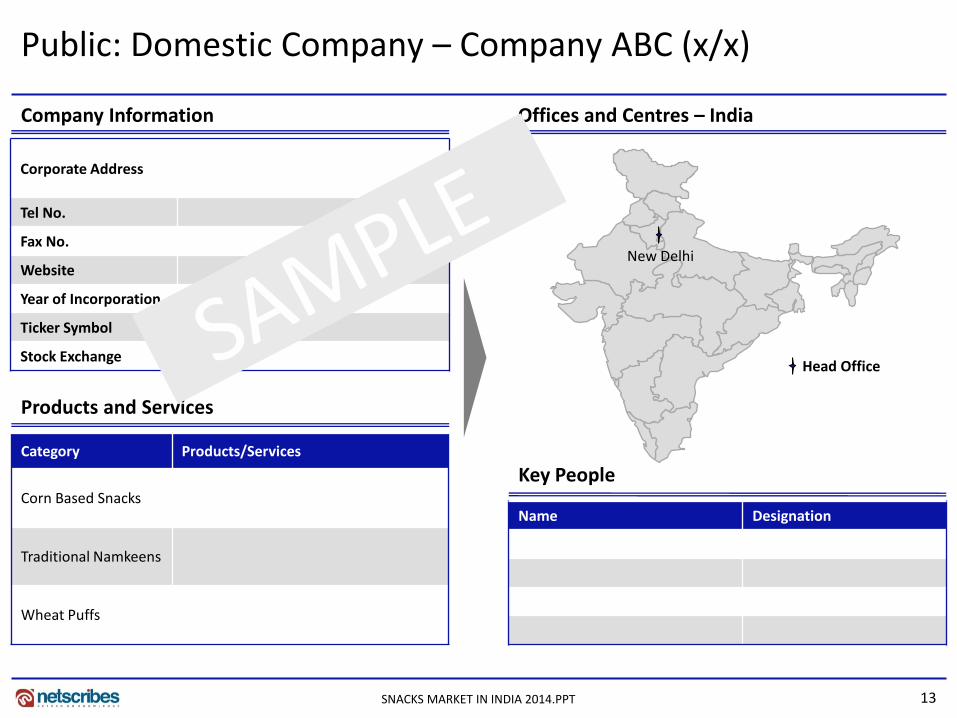
Public: Domestic Company – Company ABC (x/x)
Key People
Products and Services
Company Information Offices and Centres – India
Corporate Address
Tel No.
Fax No.
Website
Year of Incorporation
Ticker Symbol
Stock Exchange
Category Products/Services
Corn Based Snacks
Traditional Namkeens
Wheat Puffs
Name Designation
Head Office
New Delhi
SNACKS MARKET IN INDIA 2014.PPT

14
SAMPLE Financial Snapshot Key Ratios
Financial Summary • The company earned a net profit of INR x mn in FY 2013, as compared to
net profit of INR y mn in FY 2012
• The company reported total income of INR a mn in FY 2013, registering an increase of b% over FY 2012
• The company earned an operating margin of c% in FY 2013, a decrease of percentage d% points over FY 2012
• The company reported debt to equity ratio of e in FY 2013, a decrease of f% over FY 2012
Key Financial Performance Indicators
Indicators Value (19/02/2014) Market Capitalization (INR mn)
Total Enterprise Value (INR mn)
EPS (INR)
PE Ratio (Abs)
Particulars y-o-y change
(2013-12) 2013 2012 2011 2010
Profitability Ratios Operating Margin Net Margin Profit Before Tax Margin Return on Equity Return on Capital Employed Return on Working Capital Return on Assets Return on Fixed Assets
Cost Ratios Operating costs (% of Sales) Administration costs (% of
Sales) Interest costs (% of Sales)
Liquidity Ratios Current Ratio Cash Ratio
Leverage Ratios Debt to Equity Ratio Debt to Capital Ratio Interest Coverage Ratio
Efficiency Ratios Fixed Asset Turnover Asset Turnover Current Asset Turnover Working Capital Turnover Capital Employed Turnover
Improved Decline
Net Profit/Loss Total Income
0
50
100
150
0
INR mn INR mn
2012 2013 2011 2010
Public: Domestic Company – Company ABC (x/x)
SNACKS MARKET IN INDIA 2014.PPT
15
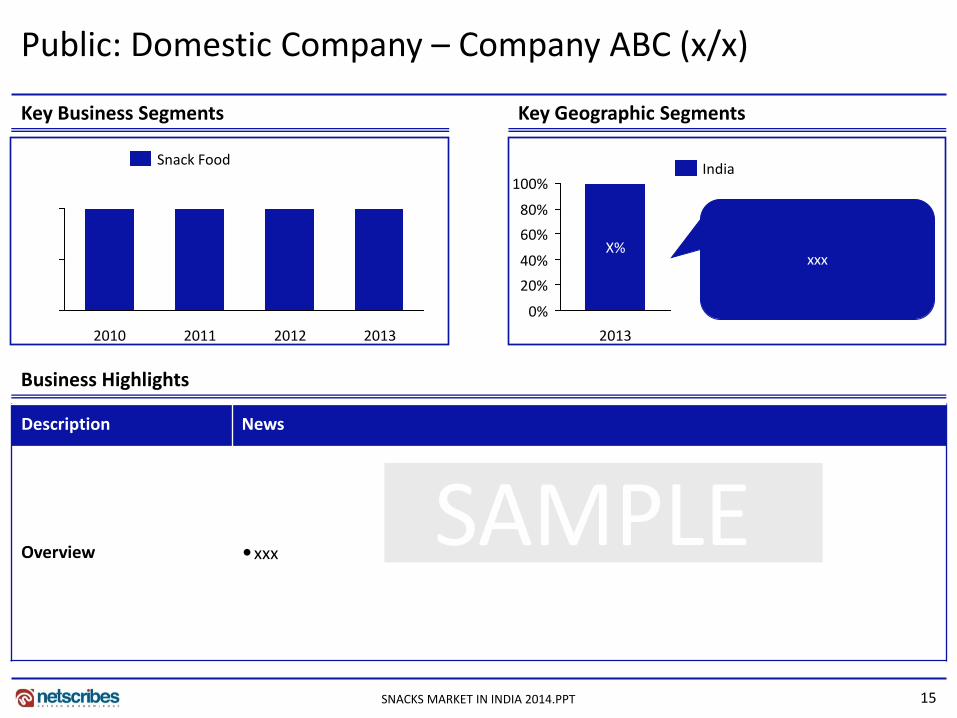
Public: Domestic Company – Company ABC (x/x)
Key Business Segments Key Geographic Segments
2013 2010 2011 2012
100%
40%
60%
80%
0%
20%
X%
2013
India
Business Highlights
Description News
Overview •xxx
Snack Food
xxx
SNACKS MARKET IN INDIA 2014.PPT
SAMPLE

16
Description News
Manufacturing Plants • xxx
Distribution Network • xxx
Regional Presence • xxx
Key Developments • xxx
Public: Domestic Company – Company ABC (x/x)
Business Highlights
SNACKS MARKET IN INDIA 2014.PPT

17
Public: Domestic Company – Company ABC – SWOT Analysis (x/x)
• xxx • xxx
• xxx • xxx
T O
W S
SNACKS MARKET IN INDIA 2014.PPT
SAMPLE

18
Private: Domestic Company – Company ABC (x/x)
Key People
Products and Services
Company Information Offices and Centres – India
Name Designation
Corporate Address
Tel No.
Fax No.
Website
Year of Incorporation Head Office
Category Products/Services
Wafers
Namkeens
Rajkot
SNACKS MARKET IN INDIA 2014.PPT

19
Private: Domestic Company – Company ABC– Shareholding Pattern (x/x)
Name No. of Shares held
A
B
C
D
E
F
G
Total
SNACKS MARKET IN INDIA 2014.PPT
Ownership Structure
2011 2013 2012
Directors or relatives of directors
Ownership structure corresponds to Date of AGM:30/09/2011, 29/09/2012 and 30/09/2013
Shareholders of the Company as on 30/09/2013

20
SAMPLE Financial Snapshot Key Ratios
Particulars y-o-y change
(2013-12) 2013 2012 2011 2010
Profitability Ratios Operating Margin Net Margin Profit Before Tax Margin Return on Equity Return on Capital Employed Return on Working Capital Return on Assets Return on Fixed Assets
Cost Ratios Operating costs (% of Sales) Administration costs (% of
Sales) Interest costs (% of Sales)
Liquidity Ratios Current Ratio Cash Ratio
Leverage Ratios Debt to Equity Ratio Debt to Capital Ratio Interest Coverage Ratio
Efficiency Ratios Fixed Asset Turnover Asset Turnover Current Asset Turnover Working Capital Turnover Capital Employed Turnover
Private: Domestic Company – Company ABC (x/x)
Improved Decline
Financial Summary
• The company incurred a net profit of INR x mn in FY 2013, as compared to net profit of INR y mn in FY 2012
• The company reported total income of INR a mn in FY 2013, registering an increase of b% over FY 2012
• The company earned an operating margin of c% in FY 2013, a decrease of d percentage points over FY 2012
• The company reported debt to equity ratio of e in FY 2013, an increase of f% over FY 2012
Net Profit/Loss Total Income
0
1,500
1,000
500
0
-500
2013 2012 2011 2010
INR mn INR mn
SNACKS MARKET IN INDIA 2014.PPT
21
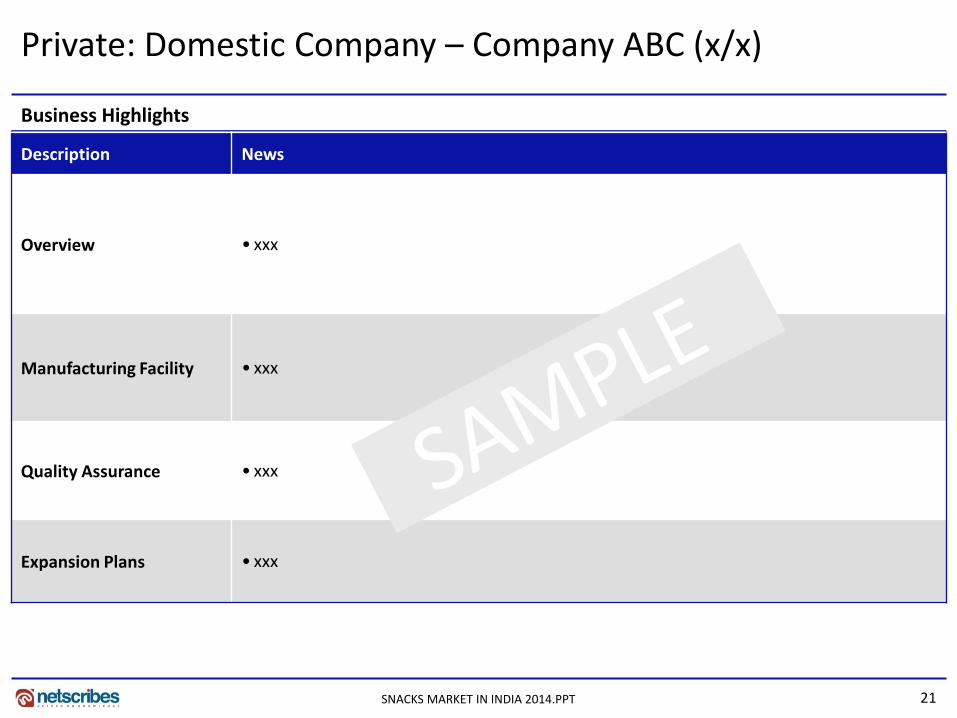
Business Highlights
Private: Domestic Company – Company ABC (x/x)
Description News
Overview • xxx
Manufacturing Facility • xxx
Quality Assurance • xxx
Expansion Plans • xxx
SNACKS MARKET IN INDIA 2014.PPT
22
Private: Domestic Company –Company ABC – SWOT Analysis (x/x)
• xxx • xxx
• xxx • xxx
T O
W S
SNACKS MARKET IN INDIA 2014.PPT
SAMPLE

23
Thank you for the attention
About Netscribes Netscribes is a knowledge-consulting and solutions firm with clientele across the globe. The company’s expertise spans areas of investment & business research, business & corporate intelligence, content-management services, and knowledge-software services. At its core lies a true value proposition that draws upon a vast knowledge base. Netscribes is a one-stop shop designed to fulfil clients’ profitability and growth objectives.
Snacks Market – India report is part of Research on India’s Food & Beverage Industry Series. For more detailed information or customized research requirements please contact:
Disclaimer: This report is published for general information only. Although high standards have been used in the preparation, “Netscribes” is not responsible for any loss or damage arising from use of this document. This document is the sole property of Netscribes and prior permission is required for guidelines on reproduction.
Follow us on:
Phone: +91 33 4027 6214/6215 E-Mail: [email protected]
SNACKS MARKET IN INDIA 2014.PPT